Roadshow Presentation - Continental USA...2017/12/12 · 2015: 17.5 2016: 17.8 2017E: 17.2 North...
71
http://www.continental-ir.com Ticker: CON ADR-Ticker: CTTAY Twitter: @Continental_IR December 2017 Roadshow Presentation Dr. Elmar Degenhart – CEO
Transcript of Roadshow Presentation - Continental USA...2017/12/12 · 2015: 17.5 2016: 17.8 2017E: 17.2 North...

http://www.continental-ir.com
Ticker: CONADR-Ticker: CTTAYTwitter: @Continental_IR
December 2017Roadshow Presentation
Dr. Elmar Degenhart – CEO

Roadshow PresentationDecember 2017EDMR – Equity and Debt Markets Relations 2
AGENDA
Corporation Highlights 9M & Outlook 20171 3IAA Highlights – Interior2 11IAA Highlights – Powertrain3 17IAA Highlights – Chassis & Safety4 22Medium Term Outlook5 26Back-up 34

Roadshow PresentationDecember 2017EDMR – Equity and Debt Markets Relations
1) Corporation Highlights 9M & Outlook 2017Most Important KPIs for 9M 2017
3
1 Before amortization of intangibles from PPA, consolidation and special effects2 Amortization of intangibles from PPA3 Attributable to the shareholders of the parent4 Trailing ROCE is calculated as reported EBIT for the last twelve months (LTM) divided by average operating assets for the LTM
› Sales up by 9% to €33 bn; organic sales growth at 8%; FX negative at €65 mn
› Adj. EBIT1 up by 13% to €3.4 bn; €400 mn burden from higher costs of raw materials in the RubberGroup; adj. EBIT1 margin at 10.6%; (PPA2 -€128 mn and special effects -€3 mn)
› NIAT3 amounted to €2.2 bn, up by 10%
› Free cash flow totaled to €472 mn; free cash flow before acquisitions amounted to €745 mn
› Gearing ratio at 21%; equity ratio at 42%
› Value creation: trailing ROCE4 at 21%
Other topics:› Order intake in the Automotive Group increased to more than €30 bn› Hornschuch contributed €282 mn to ContiTech sales and -€2.2 mn to EBIT including PPA €13 mn,
step-up effects of €23 mn (implying normalized operating margin of ~12%)› IFRS 15 – revenue from contracts with customers with immaterial effects only› Continental acquires cyber security specialist Argus; Argus will be integrated in Elektrobit

Roadshow PresentationDecember 2017EDMR – Equity and Debt Markets Relations
1) Corporation Highlights 9M & Outlook 2017Sales and Adjusted EBIT1 by Quarter
4
FY Sales €39,232 mn
1 Before amortization of intangibles from PPA, consolidation and special effects
9M Sales €32,726 mnAdj. EBIT1 €3,418 mn
1
FY Sales €40,549 mn

Roadshow PresentationDecember 2017EDMR – Equity and Debt Markets Relations
1) Corporation Highlights 9M & Outlook 2017Automotive Group and Rubber Group by Quarter
5
1 Before amortization of intangibles from PPA, consolidation and special effects
1 1
Automotive Group Rubber Group

Roadshow PresentationDecember 2017EDMR – Equity and Debt Markets Relations
1) Corporation Highlights 9M & Outlook 2017Growth Profile of the Corporation 9M 2017
6
Conti
Market
1 According to IMF definition (WEO Update October 2017)
1
Conti
Market
Conti
Market
Conti
Market

Roadshow PresentationDecember 2017EDMR – Equity and Debt Markets Relations
11%
7%
9%
6%
0%
2%
1%
Q1/17 Q2/17 Q3/17 Q4/17E
Automotive Group PC & LT prod. growth ww
7
1) Corporation Highlights 9M & Outlook 2017Organic Growth vs. Global Car Production Growth
Organic Sales Growth vs.PC & LT1 Production Growth
Organic Sales Growthby Division
Chassis& Safety
Powertrain Interior
1 Passenger car and light truck
Q1/
17Q
2/17
Q3/
17Q
4/17
Q1/
17Q
2/17
Q3/
17Q
4/17
Q1/
17Q
2/17
Q3/
17Q
4/17

Roadshow PresentationDecember 2017EDMR – Equity and Debt Markets Relations
5.97
15.
708
4.83
07.
170
6.39
36.
059
6.30
28.
309
6.85
16.
088
6.37
88.
190
7%
2%
-7%
15%
7% 6%
30%
16%
7%
0% 1%-1%
Q1/
15Q
2/15
Q3/
15Q
4/15
Q1/
16Q
2/16
Q3/
16Q
4/16
Q1/
17Q
2/17
Q3/
17E
Q4/
17E
China chg YOY
4.26
74.
521
4.35
04.
363
4.45
64.
601
4.40
94.
360
4.52
74.
457
3.99
44.
190
1% 2% 4% 3% 4%2% 1% 0% 2%
-3%
-9%
-4%
Q1/
15Q
2/15
Q3/
15Q
4/15
Q1/
16Q
2/16
Q3/
16Q
4/16
Q1/
17Q
2/17
Q3/
17E
Q4/
17E
North America chg YOY
5.38
25.
408
4.77
55.
172
5.50
95.
879
4.71
9 5.33
65.
816
5.67
34.
950 5.61
0
4% 3%6% 5%
2%
9%
-1%3%
6%
-4%
5% 5%
Q1/
15Q
2/15
Q3/
15Q
4/15
Q1/
16Q
2/16
Q3/
16Q
4/16
Q1/
17Q
2/17
Q3/
17E
Q4/
17E
Europe chg YOY
8
1) Corporation Highlights 9M & Outlook 2017PC & LT Production by Quarter in Major Regions1
1Source: IHS and own estimates, Europe excluding Kazakhstan and Uzbekistan
2015:20.7
2016:21.4
2017E:22.0
Europe (mn units)
2015:17.5
2016:17.8
2017E:17.2
North America (mn units)2015:23.7
2016:27.1
2017E:27.5
China (mn units)

Roadshow PresentationDecember 2017EDMR – Equity and Debt Markets Relations
635 47185
1,888
680490
88
1,945
Europe NorthAmerica
SouthAmerica
Asia
2016 2017E
340285
66
431346
285
70
450
Europe NorthAmerica
SouthAmerica
Asia
2016 2017E
21.4 17.8
2.7
50.0
22.017.2
3.2
51.4
Europe NorthAmerica
SouthAmerica
Asia
2016 2017E
9
1) Corporation Highlights 9M & Outlook 2017Market Outlook for Major Regions
Commercial Vehicle2 Prod. (k units)
CV Repl.4 Tire Market (mn units)
IHS and own estimates
LMC and own estimates
IHS and own estimates
PC & LT1 Production (mn units)
LMC and own estimates
PC & LT Repl.3 Tire Market (mn units)
1 Passenger car and light truck <6t2 Heavy vehicles >6t3 Passenger car & light truck replacement4 Commercial vehicle replacement (radial and biased)
0%

Roadshow PresentationDecember 2017EDMR – Equity and Debt Markets Relations
1) Corporation Highlights 9M & Outlook 2017Continental Corporation
1 Before amortization of intangibles from PPA, consolidation and special effects
Consolidated salesadj. EBIT1 margin
€40.5 bn€4.3 bn
Automotive Groupadj. EBIT1
€24.5 bn€1.6 bn
Rubber Groupadj. EBIT1
€16.1 bn€2.8 bn
Raw materials costimpact
Relief of about€150 mn
2016
Special effects -€70 mn
Net interest resultTax rate
-€117 mn28%
CapexPPA
€2.6 bn€144 mn
Free cash flow beforeacquisitions €2.3 bn
To increase to >€44 bn at constant FX rates;~€44 bn at current FX rates;>10.5% adj. EBIT1 marginTo increase to ~€26.5 bn~8.5% adj. EBIT1 margin
To increase to >€17 bn>15% adj. EBIT1 margin
Raw materials to burden Rubber Groupwith about €450 mn
2017E
Below -€100 mn
~-€200 mn at constant FX rates<30%
Capex at around 6.5% of salesPPA amortization: below €200 mn
~€2 bn
10

Roadshow PresentationDecember 2017EDMR – Equity and Debt Markets Relations
2) IAA Highlights – InteriorOur Building Blocks of Holistic Connectivity
11
Holistic Human-Machine Interface
CloudConnectivity
MobilityServices

Roadshow PresentationDecember 2017EDMR – Equity and Debt Markets Relations
2) IAA Highlights – InteriorHolistic Human-Machine Interface (HMI)
12
3D Display Surface/TouchGesturesAcella Hylite Speakerless Audio
Easier processing of information enables quicker and more intuitive driver response
› Intuitive operation reducesdriver distraction andincreases safety
› Adaptation of surface color inevent of fatigue or dangeroustraffic situation
› Excellent acoustics atconsiderably lower systemweight and with less boxvolume

Roadshow PresentationDecember 2017EDMR – Equity and Debt Markets Relations
2) IAA Highlights – InteriorHolistic HMI – Our Cockpit of Tomorrow
13
Dynamic Situational AdaptionVision: Cockpit of the Future Constant Dialogue with the Car– Wordlessly
We create a completely flexible, all-encompassing cockpit
› Retractable steering wheel› Displays replace mirrors› Augmented reality HUD› Morphing interfaces to
reveal or hide displays
› Integrated Interior Platform (IIP)› IIP ECU
› controls all input/outputdevices & mobile devices
› links to other road users,infrastructure and the cloud
› Merging separate domains› Allows the driver to position
information anywhere anddynamically
› Enables personalized cockpit

Roadshow PresentationDecember 2017EDMR – Equity and Debt Markets Relations
2) IAA Highlights – InteriorCloud Connectivity
14
Cloud TerminalOver-the-Air (OTA) Updates
Essential requirements for holistically connected vehicles and smart mobility
› Applications that used to be integrated directlyinto the head unit have now moved over to thecloud, where they are processed
› Two-way data service with intelligent antennamodules and gateways as base for theconnected vehicle

Roadshow PresentationDecember 2017EDMR – Equity and Debt Markets Relations
2) IAA Highlights – InteriorMobility Services
15
eHorizon Powered by ADASCar Rental of the Future:Remote Cloud Key
Holistic Connectivity Car:eHorizon.weather
Mobility services make driving safer, more efficient and more user-friendly
› Swarm intelligence to seearound corners by supplyingthe digital map in the backendwith up-to-date information
› Highly scalable, secure cloud-managed remote keylessaccess service for cars
› Enhanced safety due to earlywarning of rain, storms or icyroads; weather-dependentroute planning

Roadshow PresentationDecember 2017EDMR – Equity and Debt Markets Relations
2) IAA Highlights – InteriorHolistic Connectivity Car
16
>30 million1
connected vehicles by
2017: >50%of produced vehicles are
connected
2020: >250 millionof the vehicles on the road will be
connected
1 Since 1996

Roadshow PresentationDecember 2017EDMR – Equity and Debt Markets Relations
3) IAA Highlights – PowertrainICE1 Expected to Grow at Least Until 2025
17
0
20
40
60
80
100
120
1%
10%
18%
30%
38%
1% 4%4%
73%
110110
12%
23%
28%
3%14%
49%
5%10%
2020
102
26%
1% 2% 14%
3%
20252025
2% 2%
2016
93
20%
7%
All Gasoline
EVPHEV
FHEV
All Diesel
MHEV 48VCNG/LPG
Pure DieselPure MPIPure GDI
Light-Vehicle Production Powertrain Split Continental EV Scenario
[mn vehicles]
1 Internal Combustion Engine

Roadshow PresentationDecember 2017EDMR – Equity and Debt Markets Relations
3) IAA Highlights – PowertrainOI1 Already Shows Shift to Electronics and Electrification
18
0%
10%
20%
30%
40%
50%
60%
70%
80%
90%
100%
2014 2016 Sales 2016
Order Intake
Mechanics and hydraulics Electronics Electrification
Ʃ €7.3 bnƩ €11.5 bn
1 Order Intake as Lifetime Sales

Roadshow PresentationDecember 2017EDMR – Equity and Debt Markets Relations 19
HEV-relatedbusiness includingextended offering
Gasoline-relatedbusiness
Diesel-relatedbusiness
› Engine managementsystems for diesel piezocommon-rail injection(injector, ECUs,pressure pumps)
› Exhaust aftertreatment
› Sensors and actuators
› Engine managementsystems for solenoiddirect injection (injector,ECU, pressure pumps)
› Exhaust aftertreatment
› Sensors and actuators
› Turbochargers
› Engine managementsystems (gasoline/diesel)
› Exhaust aftertreatment
› Sensors and actuators
› Turbochargersand
› 48V solutions(12kW/ 15kW/ 25kW)or
› Plug-in hybrid solutions(incl. thermal components &charging systems)
BEV-relatedbusiness includingextended offering
› High-voltage axle drive
› Power electronics
› Onboard chargingsystems
› Battery managementsystems
› DC/DC converter
› Thermal managementcomponents
100%1 160% 160-360% 400%
1 Value of displayed gasoline content per car is indexed at 100%; all other values read relative to the gasoline content
3) IAA Highlights – PowertrainRelative Value of Continental’s Content in Powertrains1
Well positioned in all key technologies!

Roadshow PresentationDecember 2017EDMR – Equity and Debt Markets Relations
3) IAA Highlights – Powertrain48V Technology Enables Intelligent Hybrid Strategies
20
Mild Hybrid High Voltage
48V “cost-optimized” (10-12kW)
48V “CO2-optimized” (15kW)
48V “inner city driving” (25kW)
No clear trend visible, i.e. still highproliferation of unique technical
solutions
€1 billion order intake for 48V already received

Roadshow PresentationDecember 2017EDMR – Equity and Debt Markets Relations
3) IAA Highlights – PowertrainSolutions for Charging
21
Inductive Charging(Improved Convenience)
Conductive Charging(Basic Charging)
AllCharge®(Bi-directional Charging)
Battery performance and convenient charging are crucial for the success of electric mobility
› High-voltage battery charging› 11kW power transfer› Including all safety features
On-board charger (3.6 - 11kW)› Re-charge high-voltage batteryfrom power grid
› Unique electronic topologyworldwide charging
‘Universal charger’ for all typesof cable-based chargingstations:› Up to 800V/350kW› Up to 12-times faster chargingat urban AC charging stations
10 min
6h3%
Target=100% fulfilment

Roadshow PresentationDecember 2017EDMR – Equity and Debt Markets Relations 22
Driving Intelligence› Situation analysis› Decision-making› Low-level vehicle control› ADCU (mid-term)
Seat MaterialTailored seat surfaces› Resilient› Easy to clean› Comfortable
LocalizationRobust localization in urban areas› Radar› Wireless infrastructure
beacons
Radar SensingShort range sensor› Object detection› Barrier detection› 4 sensors for 360° view
Camera Sensing› Object detection› Barrier detection› Front sensor cover drive path
Drive Module› One axle drive from
Continental (2018)
4) IAA Highlights – Chassis & SafetySelf Driving Car Project CUbE – Continental Urban Mobility Experience
Tires› ContiEcoContact™ 5
We will become a full system supplier!
Lidar SensingSolid state flash lidar (mid-term)› Object detection› Barrier detection› 4 sensors for 360° view

Roadshow PresentationDecember 2017EDMR – Equity and Debt Markets Relations 23
› Autonomous EmergencyBraking (incl. intersections)
› Lane Keeping Assist› Lane Change Assist› Adaptive Cruise Control
(Anticipatory and Cooperative ACC)
› Traffic Jam Assist› Back-up Assist› Parking Assist
L2Additionally to L2:
› Cruising Chauffeur
› Traffic Jam Chauffeur
› Remote Parking
L3Conditional Automation
Additionally to L3:
› Urban Chauffeur
› Cruising Chauffeur (Enhanced)
› Traffic Jam Chauffeur (Enhanced)
› Automated Parking(e.g. Trained Parking, Valet Parking)
L4/5High/Full AutomationPartially Automation
3x Camera6x Short-range Radar3x Long-range Radar4x Flash Lidar1x Surround View System
(4 cameras; 1x ECU optional)
1x Rear View System2x Mirror View System3x ADCU
1x Camera4x Short-range Radar1x Long-range Radar
1x Surround View System(4 cameras + 1 ECU)
1x Rear View System (option)
1x ADCU (option)
3x Camera6x Short-range Radar3x Long-range Radar1x Flash Lidar1x Surround View System
(4 cameras; 1x ECU optional)
1x Rear View System
2x ADCU
1 Depending on customers and future regulatory requirements.
4) IAA Highlights – Chassis & SafetyAutomated Driving: Function and Sensor Scenarios1

Roadshow PresentationDecember 2017EDMR – Equity and Debt Markets Relations 24
1 Source: Continental estimates.
4) IAA Highlights – Chassis & SafetyMarket for Automated Driving: Three-Layer Model
Components Sensors
SystemElectronicsSoftwareIntegration
Environmental Model SoftwareElectronics
Market for Automated Driving ~€17 bn1 by 2020Recent additions tostrengthen PF
ASC (solid-state flashlidar), Continental ADCU,
Digilens
Elektrobit, Easymile,Argus Cyber Security
Quantum Innovation,Baidu, NTT Docomo,BMW/Intel platform
China Unicom

Roadshow PresentationDecember 2017EDMR – Equity and Debt Markets Relations 25
4) IAA Highlights – Chassis & SafetyLeading Position in ADAS
>1,2
00
>1,0
00
816
667
249
240
225
ContiADAS
BoschADAS
DensoADAS
AutolivASP
Mobileye Hella DelphiDriverAssist
ValeoCDA
ZF
2016 2020
1 Continental ADAS = Radar, Lidar, Camera and ADCUs2 Bosch PR May 4th, 2017; Bosch has not communicated any future ADAS sales target; Bosch includes ultrasonic in ADAS sensors; Bosch target is a 2019 target3 Denso reports ADAS sales as part of “Information and safety systems”; Denso’s ADAS target 03/2021 looks for JPY 200 bn; sales are annualized4 Autoliv active safety products: radar systems, vision and night systems, active seatbelts and brake systems, dynamic spot light and system integration; 2020 target5 Mobileye 2016 sales; company has the target to achieve 1.1 bn USD sales by 20196 Hella: according to Jeffries Research7 Delphi 2016 sales represent company communication from Q2 2016 and target to achieve 1 bn USD sales by 20198 Valeo reports sales for comfort and driving assist only. It includes rain, lighting and ultrasonic sensors in DA sales; it has no official target for future ADAS sales communicated9 ZF has not provided any sales data on its ADAS business
System Manufacturers Component Suppliers
OI2016:
>€3 bn
OI2016:
€3.5 bn
Sales (€ mn)In
cl.E
lekt
robi
t, H
MI a
ndH
uD
n/a n/a
>>2,
000
OI2016:
€0.4 bn
OI2016:
€1.3 bn

Roadshow PresentationDecember 2017EDMR – Equity and Debt Markets Relations
13,837
26,047
40,550
>50,000
19%
12%
20% >20%
2005 2010 2016 2020E
Sales (mn €) ROCE
26
1Passenger car and light truck
2005–2010:CAGR 3%
2010–2015:CAGR 4%
2015–2020E:CAGR 1-2%
GlobalPC & LT 1
Production
RubberGroup
AutomotiveGroup
5) Medium Term OutlookMore than €50bn in Sales and >20% in ROCE

Roadshow PresentationDecember 2017EDMR – Equity and Debt Markets Relations 27
Thank you!

Roadshow PresentationDecember 2017EDMR – Equity and Debt Markets Relations 28
Disclaimer
› This presentation has been prepared by Continental Aktiengesellschaft solely in connection with the release of the9M 2017 results on November 9, 2017, in Hanover and the subsequent road shows in Europe, North America andAsia. It has not been independently verified. It does not constitute an offer, invitation or recommendation to purchaseor subscribe for any shares or other securities issued by Continental AG or any subsidiary and neither shall any partof it form the basis of, or be relied upon in connection with, any contract or commitment concerning the purchase orsale of such shares or other securities whatsoever.
› Neither Continental Aktiengesellschaft nor any of its affiliates, advisors or representatives shall have any liabilitywhatsoever (in negligence or otherwise) for any loss that may arise from any use of this presentation or its contentsor otherwise arising in connection with this presentation.
› This presentation includes assumptions, estimates, forecasts and other forward-looking statements, includingstatements about our beliefs and expectations regarding future developments as well as their effect on the results ofContinental. These statements are based on plans, estimates and projections as they are currently available to themanagement of Continental. Therefore, these statements speak only as of the date they are made, and weundertake no obligation to update publicly any of them in light of new information or future events. Furthermore,although the management is of the opinion that these statements, and their underlying beliefs and expectations, arerealistic or of the date they are made, no guarantee can be given that the expected developments and effects willactually occur. Many factors may cause the actual development to be materially different from the expectationsexpressed here. Such factors include, for example and without limitation, changes in general economic and businessconditions, fluctuations in currency exchange rates or interest rates, the introduction of competing products, the lackof acceptance for new products or services and changes in business strategy.
› All statements with regard to markets or market position(s) of Continental or any of its competitors are estimates ofContinental based on data available to Continental. Such data are neither comprehensive nor independently verified.Consequently, the data used are not adequate for and the statements based on such data are not meant to be anaccurate or proper definition of regional and/or product markets or market shares of Continental and any of theparticipants in any market.
› Unless otherwise stated, all amounts are shown in millions of euro. Please note that differences may arise as a resultof the use of rounded amounts and percentages.

Roadshow PresentationDecember 2017EDMR – Equity and Debt Markets Relations 29
ContactEquity and Debt Markets Relations
Vahrenwalder Str. 930165 HanoverGermanyE-mail: [email protected]: +49 511 938 1080www.continental-ir.com
Rolf WollerHead of IRPhone: +49 511 938 1068E-mail: [email protected]
Jana CrossAssistant to the Head of IRRoadshow and Conference OrganizationPhone: +49 511 938 1163E-mail: [email protected]
Michael SaemannAnalysts, Institutional Investors and Sustainability InvestorsPhone: +49 511 938 1307E-mail: [email protected]
Klaus PaeslerAnalysts, Institutional Investors, ADR and Private InvestorsPhone: +49 511 938 1316E-mail: [email protected]
Christopher MackeAnalysts, Institutional InvestorsPhone: +49 511 938 1062E-mail: [email protected]
Sabine ReeseSustainability, ASM, CMD Organization, IR Website,Capital Market Disclosure RequirementsPhone: +49 511 938 1027E-mail: [email protected]
Marvin KalberlahSocial MediaPhone: +49 511 938 14034E-mail: [email protected]

Roadshow PresentationDecember 2017EDMR – Equity and Debt Markets Relations 30
ContinentalFinancial Calendar2017Preliminary figures for fiscal 2016 January 9, 2017
Annual Financial Press Conference March 2, 2017
Annual Shareholders’ Meeting (incl. key data for Q1 2017) April 28, 2017
Q1 Financial Report May 9, 2017
Half-Year Financial Report August 3, 2017
Nine-Month Financial Report November 9, 2017
2018Preliminary figures for fiscal 2017 January 9, 2018
Annual Financial Press Conference March 8, 2018
Annual Shareholders’ Meeting (incl. key data for Q1 2018) April 27, 2018
Q1 Financial Report May 8, 2018
Half-Year Financial Report August 2, 2018
Nine-Month Financial Report November 8, 2018

Roadshow PresentationDecember 2017EDMR – Equity and Debt Markets Relations 31
ContinentalShare Data/ADR DataShare DataType of share No-par value share
Bloomberg Ticker CON
Reuters Ticker CONG
German Securities Code Number (WKN) 543 900
ISIN DE0005439004
Shares outstanding as at September 30, 2017 200,005,983
ADR DataRatio (ordinary share: ADR) 1:5
Bloomberg Ticker CTTAY
Reuters Ticker CTTAY.PK
ISIN US2107712000
ADR Level Level 1
Trading OTC
Sponsor Deutsche Bank Trust Company Americas

Roadshow PresentationDecember 2017EDMR – Equity and Debt Markets Relations 32
ContinentalBond Data
1 Guaranteed by Continental AG2 Non-contracted rating at date of issuance3 Fitch since October 24, 2016; S&P since May 11, 2016; Moodyʼs since June 30, 20154 Non-contracted rating since February 1, 2014
Issuer Continental AG Continental Rubber ofAmerica, Corp.1 Continental AG Continental AG
Issue Senior Notes Senior Notes Senior Notes Senior Notes
Principal amount €750 mn €500 mn €600 mn €750 mn
Offering price 98.950% 99.739% 99.410% 99.228%
Rating at issuancedate
Ba2 (Moody’s4)BB (S&P)BB (Fitch2)
BBB (S&P)BBB (Fitch)
BBB+ (S&P)BBB+ (Fitch)
Ba1 (Moody’s4)BB (S&P)BBB (Fitch2)
Currentcorporation andbond ratings3
BBB+ (Fitch), BBB+ (S&P), Baa1 (Moody’s4)
Coupon 3.0% p.a. 0.5% p.a. 0.0% p.a 3.125% p.a.
Issue date July 16, 2013 November 19, 2015 December 5, 2016 September 9, 2013
Maturity July 16, 2018 February 19, 2019 February 5, 2020 September 9, 2020
Interest payment Semi annualJanuary 16/July 16
AnnualFebruary 19,commencingon February 20, 2017
Not applicable AnnualSeptember 9
WKN A1X24V A1Z7C3 A2DARM A1X3B7
ISIN XS0953199634 DE000A1Z7C39 XS1529561182 XS0969344083
Denomination €1,000 with min.tradable amount €1,000
€1,000 with min.tradable amount €1,000
€1,000 with min.tradable amount €1,000
€1,000 with min.tradable amount €1,000

Roadshow PresentationDecember 2017EDMR – Equity and Debt Markets Relations
Back-up
33

Roadshow PresentationDecember 2017EDMR – Equity and Debt Markets Relations
1) Corporation HighlightsDivisional Highlights for 9M 2017
34
Aut
omot
ive
Gro
upR
ubbe
r Gro
up
› Tires: adj. EBIT1 margin down by 310 bps to 18.4% as raw mat burden totaled €355 mn after 9M;volume growth amounted to 2% (Q3/17: 3%); FX contributed 0% (Q3/17: -2%); price/mix improved to +2%(Q3/17: +3%); organic sales up by 4% (Q3/17: +5%)Tire markets: PC & LT tire replacement demand in Europe up by 2% (Q3/17: +1%) and down by 1%(Q3/17: -3%) in North America after 9M 2017
› ContiTech: adj. EBIT1 margin reduced to 8.7% (PY: 9.9%); organic sales up by 7.5% (Q3/17: +9.5%)mainly driven by the Conveyor Belt Group and Compounding Technology; sales boosted by €282 mn byHornschuch consolidation
› Rubber Group: Organic sales up by 5.5% and adj. EBIT1 margin down to 15.1% (PY: 17.6%); raw materialshad a negative impact of €400 mn in 9M 2017
› Chassis & Safety: 9.2% adj. EBIT1 margin (PY: 4.9%); organic sales up by 10%;ADAS continuing strong growth momentum from H1 with unit sales up 41% after nine month
› Powertrain: 5.8% adj. EBIT1 margin (PY: 5.0%); organic sales up by 6% driven by growth in engine ECUs,injector business, pumps and turbochargers
› Interior: 9.0% adj. EBIT1 margin (PY: 6.7%); organic sales increased by 11% on growth in the businessunits Body & Security and Instrumentation & Driver HMI
› Automotive Group: Organic sales increased by 9%, exceeding worldwide car production by more than 600bps; adj. EBIT1 margin increased by 260 bps to 8.2%;Order intake in the Automotive Group increased to more than €30 bn
1 Before amortization of intangibles from PPA, consolidation and special effects2 Amortization of intangibles from PPA

Roadshow PresentationDecember 2017EDMR – Equity and Debt Markets Relations
1) Corporation HighlightsSelected Press Clippings Released Until Recently
35
Continental Presents two New Tire Technology Conceptsfor Greater Safety and Comfort
ContiAdapt: Adjusts tire pressure and rimwidth to adapt contact patch to roadconditions.ContiSense: Uses tire sensors to measuretread depth and temperature and alertsdrivers to tire damage – data transmission viaelectrically conductive rubber.
Continental Acquired South African Tech Company toFurther Develop its Services for the Conveyor Industry
Go to press release
Continental Implements Fully Automated Valet ParkingContinental presents its new fully automatedValet Parking function in a demo vehicle.The Valet Parking function provides drivers witha real plus in terms of convenience and time.It is also a concrete step towards modernmobility based on fully automated driving.
In the comparative test recently published byAutoBild sportscars (issue 11/17) the WinterContactTS 850 P from Continental finished in first place.After comparing the tire with its competitors over 13criteria, the experts praised its “performance at thehighest level across the board, dynamic handlingproperties, precision steering response and shortbraking distances in all weathers.”
Continental Winter Tire Wins AutoBild Sportscars Test
Unicom Continental Intelligent TransportationTechnology (Shanghai) Co., Ltd. aims toprovide world class Intelligent TransportationSystems (ITS) solutions to satisfy the increasingmarket demands in China.
Continental and China Unicom Smart ConnectionCelebrate the Official Opening of its Joint Venture
Continental has recently acquired AdvancedImaging Technologies (PTY) Ltd., which isknown for its fundamental work for x-ray andmagnetic imaging-based systems used forearly detecting damages in fabric and steelcord conveyor belts. Go to press release
Go to press release
Go to press release
Go to press release
Only secure mobility is intelligent mobility:Israeli start-up Argus Cyber Security willbecome part of Continental’s subsidiaryElektrobit (EB). EB and Argus Cyber Securityto offer multilayered, end-to-end automotivecyber security solutions and services aswell as secure over the air software updatesfor customers around the globe.
Continental Acquires Argus Cyber Security
Go to press release

Roadshow PresentationDecember 2017EDMR – Equity and Debt Markets Relations
1) Corporation HighlightsSustainable Value Creation
36
1 Trailing operating assets are calculated as assets for the last twelve months (LTM)2 Trailing ROCE is calculated as reported EBIT for the last twelve months (LTM) divided by trailing operating assets
1 2

Roadshow PresentationDecember 2017EDMR – Equity and Debt Markets Relations
1) Corporation HighlightsMaturities for Bonds and Syndicated Loan1(mn €)
37
As at September 30, 2017(mn €) FY 16 9M 17
Gross indebtedness 4,952 4,961
Cash 2,107 1,531
Net indebtedness 2,798 3,298
Available credit lines 3,888 3,633
Total liquidity 5,995 5,164
1 All amounts shown are nominal values2 Any utilization under the Revolving Credit Facility (RCF) has to be shown as short term debt acc. to IFRS although the RCF matures in 2021. It has a total volume of €3,000 mn
Syndicated loanBonds 2

Roadshow PresentationDecember 2017EDMR – Equity and Debt Markets Relations
Reported change in sales› Chassis & Safety: 9.3%› Powertrain: 6.1%› Interior: 11.6%› Automotive Group: 9.0%
38
2) Automotive GroupSales and Adj. EBIT1 by Division
Automotive Group Sales (mn €) 9M 2017 Automotive Group Adj. EBIT1 (mn €) 9M 2017
-
1
1 Before amortization of intangibles from PPA, consolidation and special effects
› Reported EBITDA: €2,429 mn (12.3% of sales)› Reported EBIT: €1,531 mn (7.7% of sales)› R&D: €2,036 mn (10.3% of sales)› Capex: €1,080 mn (5.5% of sales)

Roadshow PresentationDecember 2017EDMR – Equity and Debt Markets Relations
› Sales increased by €387 mn; organic sales growth in Q3 2017 at 9%› Adj. EBIT1 increased by €453 mn as prior year was burdened by €450 mn expenditure for warranties
and pending antitrust proceedings as well as R&D overrun and supply shortages; operating leverage2
including these amounts of the prior year amounted to 1%› Adj. EBIT1 margin at 7.8% (PY: 0.6%)
39
2) Automotive GroupQ3 2017: Strong Organic Sales Growth Continued
Automotive Group Sales (mn €) Adj. EBIT1 (mn €) and Adj. EBIT1 Margin
+387 +453
1 Before amortization of intangibles from PPA, consolidation and special effects2 Operating leverage is defined as delta adj. EBIT1 divided by delta adjusted sales

Roadshow PresentationDecember 2017EDMR – Equity and Debt Markets Relations 40
2) Automotive GroupPowertrain Growth to Reaccelerate in Q4 2017
1 Passenger car and light truck
Organic Sales Growth vs.PC & LT1 Production Growth
Powertrain under- / outperformanceof global PC & LT1 production
-8%-6%-4%-2%0%2%4%6%8%
10%
Q1
Q2
Q3
Q4
Q1
Q2
Q3
Q4
Q1
Q2
Q3
Q4
Q1
Q2
Q3
Q4E
2014 2015 2016 2017
PT organic growth PC & LT production ww
-8%-6%-4%-2%0%2%4%6%8%
10%
Q1
Q2
Q3
Q4
Q1
Q2
Q3
Q4
Q1
Q2
Q3
Q4
Q1
Q2
Q3
Q4E
2014 2015 2016 2017

Roadshow PresentationDecember 2017EDMR – Equity and Debt Markets Relations
Reported change in sales› ContiTech: 14.5%› Tires: 6.0%› Rubber Group: 9.0%
41
3) Rubber GroupSales and Adj. EBIT1 by Division
1 Before amortization of intangibles from PPA, consolidation and special effects
Rubber Group Sales (mn €) 9M 2017 Rubber Group Adj. EBIT1 (mn €) 9M 2017
-
1
› Reported EBITDA: €2,539 mn (19.5% of sales)› Reported EBIT: €1,869 mn (14.4% of sales)› R&D: €321 mn (2.5% of sales)› Capex: €713 mn (5.5% of sales)

Roadshow PresentationDecember 2017EDMR – Equity and Debt Markets Relations
› Sales growth supported by price increases implemented in Q2 2017 and by first time consolidation ofHornschuch (€119 mn); sales increased by €324 mn; organic sales growth at 7%
› Adj. EBIT1 decreased by €7 mn as cost of raw materials had a negative impact of more than €100 mn inthe quarter and tires suffered from ~€20 mn FX translation & transaction effect;adj. EBIT1 margin at 15.1% (PY: 15.9%)
42
3) Rubber GroupQ3 2017: Main Impact from Raw Materials Headwinds
Rubber Group Sales (mn €)
+324 -7
Adj. EBIT1 (mn €) and Adj. EBIT1 Margin
1 Before amortization of intangibles from PPA, consolidation and special effects

Roadshow PresentationDecember 2017EDMR – Equity and Debt Markets Relations
› Natural rubber price (TSR 20)expected to average U.S. $1.70 in2017 (down from prior forecast ofU.S. $1.90)
› Synthetic rubber price (butadienefeedstock) forecast maintainedand to average U.S. $1.60 in 2017
› Cost of carbon black are expectedto increase in 2017
› U.S. $50 mn gross burdenexpected for every U.S. $10 risein oil price; average was U.S. $44in 2016
› Headwind from rising cost of rawmaterials to amount to about€450 mn in 2017
43
3) Rubber GroupExpected Raw Materials Price Development in 2017
Raw Materials Price Development12012 - 2017E (U.S. cents/kg)
1 Source: Bloomberg and Continental estimates for 2017
Average (Y)TSR 20: 316
Butadiene: 244
Average (Y)TSR 20: 251
Butadiene: 148
Average (Y)TSR 20: 172
Butadiene: 132
Average (Y)TSR 20: 137
Butadiene: 90
Average (Y)TSR 20: 138
Butadiene: 113
Average (Y)TSR 20: 170
Butadiene: 160

Roadshow PresentationDecember 2017EDMR – Equity and Debt Markets Relations 44
4) Indebtedness and Cash FlowNet Indebtedness Bridge (mn €)
1 According to cash flow statement incl. intangible assets
€1.533 mn outflow fromchange in working capital
1
Gearingratio
19% 21%

Roadshow PresentationDecember 2017EDMR – Equity and Debt Markets Relations
4) Indebtedness and Cash FlowCash Flow Overview
45
Cash Flow in 9M 2016 and 9M 2017 (mn €)
-186
-395 -581

Roadshow PresentationDecember 2017EDMR – Equity and Debt Markets Relations
4,09
9
4,23
6
4,29
6
3,54
2
3,08
3
3,44
6
3,29
8
2,79
8
2,76
8
3,46
9
3,29
8
34% 34% 34%27% 23%
26% 24%19% 18%
23% 21%
Q1 H1 9M YE Q1 H1 9M YE Q1 H1 9M YE
2015 2016 2017
Net indebtedness (mn €)Gearing ratio
46
4) Indebtedness and Cash FlowNet Indebtedness and Gearing Ratio

Roadshow PresentationDecember 2017EDMR – Equity and Debt Markets Relations 47
5) Back-upCorporation Highlights 9M 2017
› Sales
› EBITDA
› EBIT
› NIAT3
› EPS3
› Capex
› R&D
› Cash flow
› Net debt
› PaSO
Increase of 9.0% to €32,725.6 mn (PY: €30,025.5 mn); organic sales up 7.6%
Increase of 13.4% to €4,873.1 mn (PY: €4,296.0 mn)
Increase of 14.5% to €3,304.9 mn (PY: €2,886.6 mn);Adj. EBIT1 increase to €3,417.7 mn (10.6% adj. EBIT1 margin);PPA2 effect -€128.0 mn; total special effects -€3.2 mn
Increase of 10.3% to €2,224.1 mn (PY: €2,017.3 mn)
EPS of €11.12 (PY: €10.09)EPS before PPA2 €11.58 (PY: €10.47 before PPA2)
Capex increased to €1,794.9 mn (PY: €1,599.8 mn); capex ratio 5.5% of sales;capex to depreciation coverage 1.1x (1.2x ex PPA2)
Expenses for research and development increased by 8.6% to €2,356.9 mn(PY: €2,171.0 mn); R&D ratio 7.2% of sales (PY: 7.2%)
Operating cash flow down by €395.1 mn to €2,569.7 mn; free cash flow at €472.0 mn
Net indebtedness up by €500.1 mn to €3,297.9 mn vs. FY 2016;Liquidity and undrawn credit lines amounted to €5,164.1 mn
Pensions and similar obligations amounted to €4,024.1 mn1 Before amortization of intangibles from PPA, consolidation and special effects2 Amortization of intangibles from PPA, tax rate of 28% applied for EPS calculation3 Attributable to the shareholders of the parent

Roadshow PresentationDecember 2017EDMR – Equity and Debt Markets Relations 48
5) Back-upOverview of Volume Development
Note: Following products have been replaced in the statistics in order to better reflect current market trends. The ABS (anti-locking brake systems) and ESC (electronicstability control) are included in an electronic brake system (EBS). The sequential decline in unit sales in early 2016 is largely attributable to the change over from MK60to MK100 brake system. Calipers have been replaced by electronic parking brake systems (EPB Systems) as the former cable puller handbrake is being replaced evermore often by an EPB. The EPB Systems integrate the caliper into the electronic parking brake. This causes a decline in classical caliper sales which is more thancompensated by the increase in EPB systems. We sold more than 14 mn EPB systems in 2016.
Units (YOY change) Q1/15 H1/15 9M/15 FY 15 Q1/16 H1/16 9M/16 FY 16 Q1/17 H1/17 9M/17
Market data for PC and LT productionEurope 4% 3% 4% 4% 2% 6% 3% 3% 6% 1% 2%North America 1% 2% 3% 3% 4% 3% 2% 2% 2% -1% -4%Europe and North America combined 3% 3% 4% 4% 3% 4% 3% 3% 4% 0% -1%Worldwide 2% 1% 2% 2% 2% 3% 3% 4% 6% 3% 3%ContinentalElectronic Brake Systems (EBS) 8% 6% 5% 5% 0% 4% 6% 6% 13% 10% 9%Boosters -1% -4% -8% -7% -3% -3% 4% 1% 3% 3% 4%EPB-Systems 59% 53% 47% 48% 38% 48% 51% 48% 47% 39% 35%Advanced driver assistance systems (ADAS) 46% 53% 59% 58% 51% 45% 38% 36% 40% 40% 41%Engine electronic control units (ECUs) -1% -3% -5% -5% -2% 3% 6% 8% 12% 9% 7%Injectors -8% -8% -11% -11% -5% -5% 2% 7% 19% 17% 15%Transmission control units (TCUs) 6% 2% 0% -1% -1% -1% 1% 1% -2% -3% -5%Turbochargers 59% 45% 50% 43% 23% 24% 18% 17% 45% 44% 50%
Market data tiresPC and LT replacement tires Europe -1% 2% 0% 0% 2% 2% 2% 2% 6% 2% 2%PC and LT replacement tires North America -6% 0% 1% 1% 5% 2% 2% 2% 2% 1% -1%
Commercial vehicle tires OE Europe 0% 4% 5% 5% 6% 5% 3% 3% 9% 6% 7%Commercial vehicle tires OE North America 21% 17% 12% 7% -12% -9% -16% -13% -8% -1% 10%Commercial vehicle replacement tires Europe -4% 2% -1% 0% 2% 3% 3% 3% 11% 6% 7%Commercial vehicle replacement tires North America 3% 5% 3% 3% 4% 3% 3% 2% 12% -1% 3%ContinentalPC and LT tires -1% 3% 2% 5% 9% 8% 6% 6% 5% 2% 2%
Commercial vehicle tires -3% 0% 3% 5% 7% 8% 4% 4% 15% 10% 8%ContiTech organic sales growth 2% 4% 4% 4% 3% 2% 2% 2% 8% 7% 8%

Roadshow PresentationDecember 2017EDMR – Equity and Debt Markets Relations
(mn €)1 2013 2014 2015 2016 LTMStatement of Cash FlowsAdjusted EBITDA2 5,094 5,318 6,094 6,125 6,655Reported EBITDA 5,095 5,134 6,001 6,057 6,635Net cash interest paid -534 -158 -174 -112 -112Tax paid -805 -775 -1,015 -1,047 -1,131Change in net working capital3 -4 -207 -107 -210 -870Other4 -30 175 210 250 21Cash flow arising from operating activities 3,722 4,168 4,916 4,938 4,543Cash flow arising from investing activities -1,904 -2,153 -3,472 -3,167 -3,484 - thereof aquisitions -154 -129 -1,257 -516 -647 - thereof capex in PPE and intangibles -2,024 -2,110 -2,265 -2,708 -2,913Cash flow before financing activities 1,818 2,015 1,444 1,771 1,059Cash flow before aquisitions 1,972 2,144 2,701 2,288 1,706Statement of Financial PositionCash and cash equivalents 2,045 3,244 1,622 2,107 1,531Derivative instruments and interest-bearing investments 303 364 81 48 132Total indebtedness 6,638 6,432 5,245 4,952 4,961Net indebtedness 4,289 2,824 3,542 2,798 3,298Credit RatiosNet indebtedness / adjusted EBITDA2 0.8x 0.5x 0.6x 0.5x 0.5xNet cash interest paid coverage (Ratio)5 9.5x 33.7x 35.1x 54.8x 59.5x
49
5) Back-upKey Historical Credit Metrics
1 Amounts shown may contain rounding differences2 Adjusted EBITDA as defined in syndicated loan3 Includes changes in inventories, trade accounts receivable, trade accounts payable and discounted notes4 Includes dividends received, income from equity accounted and other investments, including impairment and reversal of impairment losses, gains / losses from thedisposal of assets, companies and business operations, other non-cash items as well as changes in employee benefits and other provisions and in other assets and liabilities
5 Adjusted EBITDA to net cash interest paid

Roadshow PresentationDecember 2017EDMR – Equity and Debt Markets Relations 50
5) Back-upCapex, Depreciation and EPS Breakdown 9M 2017Capex, Depreciation and PPA1 (mn €) EPS ex PPA1,2 (€)
1 Amortization of intangibles from PPA2 Assuming corporate tax rate of 28%
1
1
1 2
1,2

Roadshow PresentationDecember 2017EDMR – Equity and Debt Markets Relations 51
5) Back-upComposition of Gross Indebtedness After 9M 2017 (mn €)
Total (€ mn): 4,961
24%
18%
5%
53%

Roadshow PresentationDecember 2017EDMR – Equity and Debt Markets Relations
› Sales increased by 10.0% beforeconsolidation and FX effects
› EBITDA increased by €363.7 mn to€964.1 mn (+60.6%)
› Adj. EBIT1 increased by €339.7 mn to€666.1 mn (adj. EBIT1 margin 9.2%)
› EBIT increased by €340.2 mn to€666.3 mn (EBIT margin 9.2%)
› PPA effect in 9M 2017: €0.0 mn
› Special effects in 9M 2017: +€0.2 mn
52
5) Back-upAutomotive Group Financials – Chassis & Safety
1 Before amortization of intangibles from PPA, consolidation and special effects. Refer to Fact Sheets for further details
Chassis & Safety 9M1
Roadshow PresentationDecember 2017EDMR – Equity and Debt Markets Relations 53
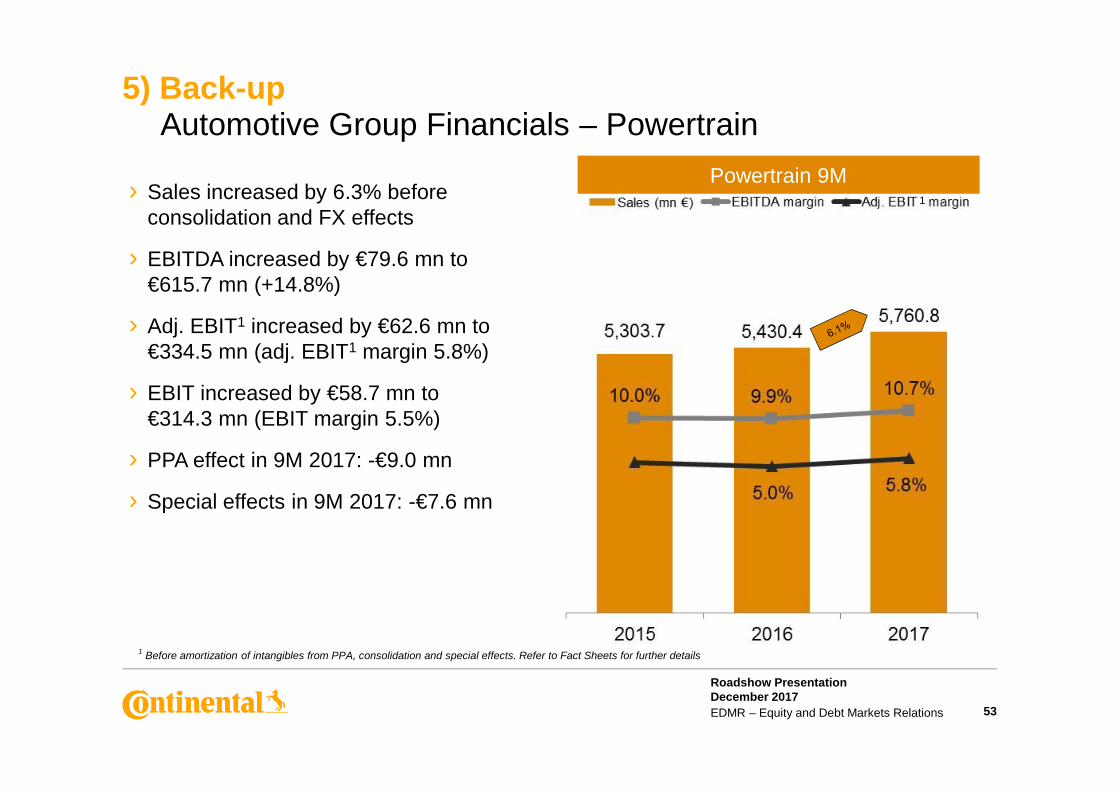
5) Back-upAutomotive Group Financials – Powertrain
Powertrain 9M1› Sales increased by 6.3% before
consolidation and FX effects
› EBITDA increased by €79.6 mn to€615.7 mn (+14.8%)
› Adj. EBIT1 increased by €62.6 mn to€334.5 mn (adj. EBIT1 margin 5.8%)
› EBIT increased by €58.7 mn to€314.3 mn (EBIT margin 5.5%)
› PPA effect in 9M 2017: -€9.0 mn
› Special effects in 9M 2017: -€7.6 mn
1 Before amortization of intangibles from PPA, consolidation and special effects. Refer to Fact Sheets for further details

Roadshow PresentationDecember 2017EDMR – Equity and Debt Markets Relations
› Sales increased by 10.7% beforeconsolidation and FX effects
› EBITDA increased by €226.6 mn to€848.7 mn (+36.4%)
› Adj. EBIT1 increased by €202.0 mn to€613.4 mn (adj. EBIT1 margin 9.0%)
› EBIT increased by €166.2 mn to€550.5 mn (EBIT margin 8.0%)
› PPA effect in 9M 2017: -€34.6 mn
› Special effects in 9M 2017: -€20.8 mn
54
5) Back-upAutomotive Group Financials – Interior
Interior 9M1
1 Before amortization of intangibles from PPA, consolidation and special effects. Refer to Fact Sheets for further details

Roadshow PresentationDecember 2017EDMR – Equity and Debt Markets Relations
› Sales increased by 4.3% beforeconsolidation and FX effects
› EBITDA decreased by €101.7 mn to€1,987.8 mn (-4.9%)
› Adj. EBIT1 decreased by €182.1 mn to€1,517.7 mn (adj. EBIT1 margin 18.4%)
› EBIT decreased by €150.7 mn to€1,547.0 mn (EBIT margin 18.4%)
› PPA effect in 9M 2017: -€14.2 mn
› Special effects in 9M 2017: +€24.4 mn
55
5) Back-upRubber Group Financials – Tires
Tires 9M1
1 Before amortization of intangibles from PPA, consolidation and special effects. Refer to Fact Sheets for further details

Roadshow PresentationDecember 2017EDMR – Equity and Debt Markets Relations 56
5) Back-upTires – Demand for Passenger and Light Truck Tires
Replacement Tire DemandDevelopment for PC & LT Europe
Replacement Tire DemandDevelopment for PC & LT North America
1 U.S. Department of Transportation
1

Roadshow PresentationDecember 2017EDMR – Equity and Debt Markets Relations 57
5) Back-upTires – Demand for Commercial Vehicle Tires
1 BAG = Bundesamt für Güterverkehr2 ATA = American Trucking Association (miles traveled)
Replacement Tire DemandDevelopment for Truck Tires Europe
Replacement Tire DemandDevelopment for Truck Tires North America
21

Roadshow PresentationDecember 2017EDMR – Equity and Debt Markets Relations
› Sales increased by 7.5% beforeconsolidation and FX effects
› EBITDA increased by €14.1 mn to€550.9 mn (+2.6%)
› Adj. EBIT1 decreased by €25.1 mn to€381.2 mn (adj. EBIT1 margin 8.7%)
› EBIT increased by €8.6 mn to€322.0 mn (EBIT margin 6.9%)
› PPA effect in 9M 2017: -€70.2 mn› Special effects in 9M 2017: +€0.2 mn
restructuring and +€0.4 mn divestment
58
5) Back-upRubber Group Financials – ContiTech
ContiTech 9M1
1 Before amortization of intangibles from PPA, consolidation and special effects.Refer to Fact Sheets for further details

Roadshow PresentationDecember 2017EDMR – Equity and Debt Markets Relations 59
Fact Sheets 2015 – 9M 2017

Roadshow PresentationDecember 2017EDMR – Equity and Debt Markets Relations 60
6) Fact SheetsSales by Quarter
Q1 Q2 Q3 Q4 Year Q1 Q2 Q3 Q4 Year Q1 Q2 Q3 Q4 Year
2,136.0 2,142.1 1,999.0 2,172.6 8,449.7 2,201.8 2,246.2 2,176.8 2,352.8 8,977.6 2,497.4 2,437.8 2,307.8
1,826.5 1,819.8 1,657.4 1,764.8 7,068.5 1,813.5 1,841.5 1,775.4 1,889.1 7,319.5 2,003.1 1,947.2 1,810.5
1,975.2 2,057.0 2,028.2 2,094.4 8,154.8 2,023.0 2,099.8 2,041.2 2,160.7 8,324.7 2,293.9 2,318.4 2,269.0
2,419.8 2,644.4 2,654.4 2,690.2 10,408.8 2,512.7 2,692.7 2,708.7 2,803.3 10,717.4 2,756.3 2,815.7 2,815.4
1,268.3 1,418.8 1,330.8 1,349.9 5,367.8 1,359.1 1,376.6 1,350.5 1,376.3 5,462.5 1,521.4 1,587.5 1,568.3
-56.9 -52.4 -52.2 -56.1 -217.6 -59.4 -65.8 -68.8 -58.2 -252.2 -72.2 -73.6 -78.3
9,568.9 10,029.7 9,617.6 10,015.8 39,232.0 9,850.7 10,191.0 9,983.8 10,524.0 40,549.5 10,999.9 11,033.0 10,692.7
Q1 Q2 Q3 Q4 Year Q1 Q2 Q3 Q4 Year
3.1 4.9 8.9 8.3 6.2 13.4 8.5 6.0
-0.7 1.2 7.1 7.0 3.6 10.5 5.7 2.0
2.4 2.1 0.6 3.2 2.1 13.4 10.4 11.2
3.8 1.8 2.0 4.2 3.0 9.7 4.6 3.9
7.2 -3.0 1.5 2.0 1.8 11.9 15.3 16.1
2.9 1.6 3.8 5.1 3.4 11.7 8.3 7.1
2015 2016 2017
2016 2017
Chassis & Safety
Powertrain
Interior
Tires
ContiTech
Other / Consolidation
Continental Corporation
Chassis & Safety
Powertrain
Interior
Tires
ContiTech
Continental Corporation
Sales (mn €)
Changes Y-o-Y in %

Roadshow PresentationDecember 2017EDMR – Equity and Debt Markets Relations 61
6) Fact SheetsEBITDA by Quarter
Chassis & Safety
Powertrain
Interior
Tires
ContiTech
Other / Consolidation
Continental Corporation
Chassis & Safety
Powertrain
Interior
Tires
ContiTech
Continental Corporation
Chassis & Safety
Powertrain
Interior
Tires
ContiTech
Continental Corporation
EBITDA (mn €)
EBITDA margin in %
Changes Y-o-Y in %
Q1 Q2 Q3 Q4 Year Q1 Q2 Q3 Q4 Year Q1 Q2 Q3 Q4 Year
297.3 293.4 268.3 301.3 1,160.3 302.8 312.0 -14.4 354.2 954.6 336.9 326.9 300.3
177.2 183.5 167.3 202.7 730.7 158.8 201.8 175.5 220.1 756.2 213.9 214.4 187.4
252.9 299.8 252.4 277.1 1,082.2 237.4 252.2 132.5 282.1 904.2 273.6 288.1 287.0
579.7 734.6 667.7 622.3 2,604.3 658.1 773.4 658.0 739.2 2,828.7 651.3 674.8 661.7
129.2 169.1 159.7 119.2 577.2 176.1 197.2 163.5 194.1 730.9 191.3 175.6 184.0
-33.1 -47.1 -23.7 -49.4 -153.3 -27.7 -23.5 -37.7 -28.3 -117.2 -28.5 -27.4 -38.2
1,403.2 1,633.3 1,491.7 1,473.2 6,001.4 1,505.5 1,713.1 1,077.4 1,761.4 6,057.4 1,638.5 1,652.4 1,582.2
Q1 Q2 Q3 Q4 Year Q1 Q2 Q3 Q4 Year Q1 Q2 Q3 Q4 Year
13.9 13.7 13.4 13.9 13.7 13.8 13.9 -0.7 15.1 10.6 13.5 13.4 13.0
9.7 10.1 10.1 11.5 10.3 8.8 11.0 9.9 11.7 10.3 10.7 11.0 10.4
12.8 14.6 12.4 13.2 13.3 11.7 12.0 6.5 13.1 10.9 11.9 12.4 12.6
24.0 27.8 25.2 23.1 25.0 26.2 28.7 24.3 26.4 26.4 23.6 24.0 23.5
10.2 11.9 12.0 8.8 10.8 13.0 14.3 12.1 14.1 13.4 12.6 11.1 11.7
14.7 16.3 15.5 14.7 15.3 15.3 16.8 10.8 16.7 14.9 14.9 15.0 14.8
Q1 Q2 Q3 Q4 Year Q1 Q2 Q3 Q4 Year
1.8 6.3 -105.4 17.6 -17.7 11.3 4.8 2,185.4
-10.4 10.0 4.9 8.6 3.5 34.7 6.2 6.8
-6.1 -15.9 -47.5 1.8 -16.4 15.2 14.2 116.6
13.5 5.3 -1.5 18.8 8.6 -1.0 -12.7 0.6
36.3 16.6 2.4 62.8 26.6 8.6 -11.0 12.5
7.3 4.9 -27.8 19.6 0.9 8.8 -3.5 46.9
2015 2016 2017
2015 2016 2017
2016 2017

Roadshow PresentationDecember 2017EDMR – Equity and Debt Markets Relations 62
6) Fact SheetsEBIT by Quarter
Chassis & Safety
Powertrain
Interior
Tires
ContiTech
Other / Consolidation
Continental Corporation
Chassis & Safety
Powertrain
Interior
Tires
ContiTech
Continental Corporation
Chassis & Safety
Powertrain
Interior
Tires
ContiTech
Continental Corporation
EBIT (mn €)
EBIT margin in %
Changes Y-o-Y in %
Q1 Q2 Q3 Q4 Year Q1 Q2 Q3 Q4 Year Q1 Q2 Q3 Q4 Year
214.9 209.3 181.5 208.6 814.3 213.2 220.3 -107.4 254.7 580.8 238.9 227.4 200.0
96.7 101.0 81.3 116.6 395.6 66.5 108.8 80.3 122.4 378.0 117.1 114.1 83.1
190.9 234.1 178.7 200.8 804.5 160.1 172.9 51.3 183.5 567.8 185.7 196.3 168.5
454.0 604.1 536.5 490.6 2,085.2 530.0 645.4 522.3 591.7 2,289.4 505.1 526.9 515.0
54.9 82.3 80.6 -47.2 170.6 98.7 126.7 88.0 85.8 399.2 117.1 95.4 109.5
-33.5 -47.5 -24.0 -49.6 -154.6 -27.8 -24.5 -38.2 -28.9 -119.4 -28.8 -27.8 -38.6
977.9 1,183.3 1,034.6 919.8 4,115.6 1,040.7 1,249.6 596.3 1,209.2 4,095.8 1,135.1 1,132.3 1,037.5
Q1 Q2 Q3 Q4 Year Q1 Q2 Q3 Q4 Year Q1 Q2 Q3 Q4 Year
10.1 9.8 9.1 9.6 9.6 9.7 9.8 -4.9 10.8 6.5 9.6 9.3 8.7
5.3 5.6 4.9 6.6 5.6 3.7 5.9 4.5 6.5 5.2 5.8 5.9 4.6
9.7 11.4 8.8 9.6 9.9 7.9 8.2 2.5 8.5 6.8 8.1 8.5 7.4
18.8 22.8 20.2 18.2 20.0 21.1 24.0 19.3 21.1 21.4 18.3 18.7 18.3
4.3 5.8 6.1 -3.5 3.2 7.3 9.2 6.5 6.2 7.3 7.7 6.0 7.0
10.2 11.8 10.8 9.2 10.5 10.6 12.3 6.0 11.5 10.1 10.3 10.3 9.7
Q1 Q2 Q3 Q4 Year Q1 Q2 Q3 Q4 Year
-0.8 5.3 -159.2 22.1 -28.7 12.1 3.2 286.2
-31.2 7.7 -1.2 5.0 -4.4 76.1 4.9 3.5
-16.1 -26.1 -71.3 -8.6 -29.4 16.0 13.5 228.5
16.7 6.8 -2.6 20.6 9.8 -4.7 -18.4 -1.4
79.8 53.9 9.2 281.8 134.0 18.6 -24.7 24.4
6.4 5.6 -42.4 31.5 -0.5 9.1 -9.4 74.0
2015 2016 2017
2015 2016 2017
2016 2017

Roadshow PresentationDecember 2017EDMR – Equity and Debt Markets Relations 63
6) Fact SheetsAdjusted EBIT1 by Quarter
1 Before amortization of intangibles from PPA, consolidation and special effects
Q1 Q2 Q3 Q4 Year Q1 Q2 Q3 Q4 Year
213.3 220.4 -107.3 238.9 227.4 199.8
72.1 114.7 85.1 124.7 118.5 91.3
169.1 182.0 60.3 202.9 210.3 200.2
531.9 647.3 520.6 486.2 513.8 517.7
131.0 152.3 123.0 141.6 120.3 119.3
-27.8 -24.5 -38.2 -28.8 -27.8 -38.6
1,089.6 1,292.2 643.5 1,165.5 1,162.5 1,089.7
Q1 Q2 Q3 Q4 Year Q1 Q2 Q3 Q4 Year
9.7 9.8 -4.9 9.6 9.3 8.7
4.0 6.2 4.8 6.3 6.1 5.0
8.4 8.7 3.0 8.9 9.2 8.9
21.2 24.0 19.2 17.9 18.6 18.6
9.6 11.1 9.1 9.6 8.2 8.2
11.1 12.7 6.4 10.7 10.7 10.4
Q1 Q2 Q3 Q4 Year
12.0 3.2 286.2
73.0 3.3 7.3
20.0 15.5 232.0
-8.6 -20.6 -0.6
8.1 -21.0 -3.0
7.0 -10.0 69.3
2016 2017
2016 2017
2017
Chassis & Safety
Powertrain
Interior
Tires
ContiTech
Other / Consolidation
Continental Corporation
Chassis & Safety
Powertrain
Interior
Tires
ContiTech
Continental Corporation
Chassis & Safety
Powertrain
Interior
Tires
ContiTech
Continental Corporation
Adj. EBIT ¹ (mn €)
Adj. EBIT ¹ margin in %
Changes Y-o-Y in %

Roadshow PresentationDecember 2017EDMR – Equity and Debt Markets Relations 64
6) Fact SheetsConsolidated Statement of Income
2017 2016 2015 2017 2016 20151 - 9 1 - 9 1 - 9 Q3 Q3 Q3
Sales 32,725.6 30,025.5 29,216.2 10,692.7 9,983.8 9,617.6
Cost of sales -24,286.6 -22,018.3 -21,608.2 -7,948.3 -7,409.1 -7,107.0
Gross margin on sales 8,439.0 8,007.2 7,608.0 2,744.4 2,574.7 2,510.6
Research and development expenses -2,356.9 -2,171.0 -1,897.7 -777.5 -728.1 -623.4
Selling and logistics expenses -1,797.2 -1,663.2 -1,612.3 -588.3 -554.0 -537.6
Administrative expenses -866.1 -763.2 -695.4 -269.7 -265.1 -236.1
Other expenses and income -164.5 -573.3 -247.7 -85.7 -444.4 -91.6
Income from at-equity accounted investees 50.2 49.7 40.5 14.1 13.1 12.7
Other income from investments 0.4 0.4 0.4 0.2 0.1
Earnings before interest and tax 3,304.9 2,886.6 3,195.8 1,037.5 596.3 1,034.6
Interest income 68.0 74.3 69.3 21.4 24.7 20.0
Interest expense -287.6 -147.9 -286.7 -77.2 -49.7 -138.4
Net interest result -219.6 -73.6 -217.4 -55.8 -25.0 -118.4
Earnings before tax 3,085.3 2,813.0 2,978.4 981.7 571.3 916.2
Income tax expense -817.7 -742.4 -839.9 -240.0 -175.3 -268.7
Net income 2,267.6 2,070.6 2,138.5 741.7 396.0 647.5
Non-controlling interests -43.5 -53.3 -54.2 -12.6 -17.5 -11.8
Net income attributable to the shareholders of the parent 2,224.1 2,017.3 2,084.3 729.1 378.5 635.7
Basic earnings per share (in €) 11.12 10.09 10.42 3.64 1.90 3.18
Diluted earnings per share (in €) 11.12 10.09 10.42 3.64 1.90 3.18
(mn €)

Roadshow PresentationDecember 2017EDMR – Equity and Debt Markets Relations 65
6) Fact SheetsConsolidated Statement of Financial Position – Assets
Assets in € millions Sept. 30, 2017 Dec. 31, 2016 Sept. 30, 2016
Goodwill 6,818.8 6,857.3 6,651.3
Other intangible assets 1,481.8 1,514.1 1,283.0
Property, plant and equipment 10,723.4 10,538.1 9,837.2
Investment property 10.7 10.3 10.4
Investments in equity-accounted investees 404.6 384.8 382.1
Other investments 47.3 43.1 39.8
Deferred tax assets 1,741.3 1,836.1 2,062.1
Defined benefit assets 36.1 24.3 34.0
Long-term derivative instruments and interest-bearing investments 84.4 19.7 38.0
Long-term other financial assets 64.5 66.4 55.1
Long-term other assets 26.9 26.8 22.9Non-current assets 21,439.8 21,321.0 20,415.9
Inventories 4,355.9 3,753.2 3,880.6
Trade accounts receivable 8,222.7 7,392.7 7,546.0
Short-term other financial assets 550.0 455.5 483.6
Short-term other assets 987.4 989.0 1,012.7
Income tax receivables 224.0 124.7 188.2
Short-term derivative instruments and interest-bearing investments 47.7 27.8 24.4
Cash and cash equivalents 1,530.9 2,107.0 1,439.9
Assets held for sale 2.9 4.0 3.6Current assets 15,921.5 14,853.9 14,579.0
Total assets 37,361.3 36,174.9 34,994.9

Roadshow PresentationDecember 2017EDMR – Equity and Debt Markets Relations 66
6) Fact SheetsConsolidated Statement of Financial Position – Total Equity and Liabilities
Equity and liabilities in € millions Sept. 30, 2017 Dec. 31, 2016 Sept. 30, 2016
Subscribed capital 512.0 512.0 512.0
Capital reserves 4,155.6 4,155.6 4,155.6
Retained earnings 12,908.8 11,534.7 10,749.5
Other comprehensive income -2,324.7 -1,932.3 -2,262.5Equity attributable to the shareholders of the parent 15,251.7 14,270.0 13,154.6
Non-controlling interests 446.9 464.8 440.7Total equity 15,698.6 14,734.8 13,595.3
Long-term employee benefits 4,288.1 4,392.3 4,711.5
Deferred tax liabilities 465.0 371.5 400.5
Long-term provisions for other risks and obligations 181.8 204.2 209.9
Long-term indebtedness 2,010.4 2,803.7 2,195.1
Long-term other financial liabilities 41.5 97.1 39.2
Long-term other liabilities 15.0 17.1 19.2Non-current liabilities 7,001.8 7,885.9 7,575.4
Short-term employee benefits 1,479.5 1,314.1 1,339.8
Trade accounts payable 6,369.8 6,248.0 5,997.1
Income tax payables 802.1 783.6 805.1
Short-term provisions for other risks and obligations 959.2 1,146.4 1,107.4
Short-term indebtedness 2,950.5 2,148.6 2,605.6
Short-term other financial liabilities 1,244.8 1,187.3 1,099.6
Short-term other liabilities 855.0 726.2 869.6
Liabilities held for sale — — —Current liabilities 14,660.9 13,554.2 13,824.2
Total equity and liabilities 37,361.3 36,174.9 34,994.9

Roadshow PresentationDecember 2017EDMR – Equity and Debt Markets Relations 67
6) Fact SheetsConsolidated Statement of Cash Flows
1
2017 2016 2017 2016Net income 2,267.6 2,070.6 741.7 396.0Income tax expense 817.7 742.4 240.0 175.3Net interest result 219.6 73.6 55.8 25.0EBIT 3,304.9 2,886.6 1,037.5 596.3Interest paid -116.7 -115.9 -55.4 -52.8Interest received 19.2 18.5 5.7 6.4Income tax paid -871.1 -787.0 -273.2 -243.0Dividends received 24.2 25.5 3.2 6.9Depreciation, amortization, impairment and reversal of impairment losses 1,568.2 1,409.4 544.7 481.1Income from equity-accounted investees and other investments, incl. impairment and reversal of impairment losses -50.6 -50.1 -14.3 -13.2Gains/losses from the disposal of assets, companies and business operations -26.7 -6.5 -3.2 -3.1Changes in
inventories -688.1 -533.3 -183.0 -75.8trade accounts receivable -1,119.6 -903.0 -416.5 -281.4trade accounts payable 274.7 562.9 -164.9 -48.4employee benefits and other provisions 80.6 427.8 174.2 512.1other assets and liabilities 170.7 29.9 210.1 97.8
Cash flow arising from operating activities 2,569.7 2,964.8 864.9 982.9
Cash flow from the disposal of property, plant and equipment, and intangible assets 30.6 29.4 6.9 15.8Capital expenditure on property, plant and equipment, and software -1,794.9 -1,599.8 -636.8 -679.9Capital expenditure on intangible assets from development projects and miscellaneous -81.0 -70.9 -21.1 -31.0Cash flow from the disposal of companies and business operations 20.8 2.7 0.6 -2.4Acquisition of companies and business operations -273.2 -142.2 -34.3 -60.4Cash flow arising from investing activities -2,097.7 -1,780.8 -684.7 -757.9
Cash flow before financing activities (free cash flow) 472.0 1,184.0 180.2 225.0Change in indebtedness -87.2 -436.8 -432.8 -413.9Successive purchases -0.7 -106.3 0.1 -83.9Dividends paid -850.0 -750.0 — —Dividends paid to and cash changes from equity transactions with non-controlling interests -29.6 -29.8 -2.7 -3.1Cash and cash equivalents arising from first-time consolidation of subsidiaries 0.7 0.6 0.1 —Cash flow arising from financing activities -966.8 -1,322.3 -435.3 -500.9
Change in cash and cash equivalents -494.8 -138.3 -255.1 -275.9Cash and cash equivalents at the beginning of the reporting period 2,107.0 1,621.5 1,806.4 1,720.1Effect of exchange-rate changes on cash and cash equivalents -81.3 -43.3 -20.4 -4.3Cash and cash equivalents at the end of the reporting period 1,530.9 1,439.9 1,530.9 1,439.9
January 1 to September 30 Third QuarterConsolidated Statement of Cash Flows in € millions

Roadshow PresentationDecember 2017EDMR – Equity and Debt Markets Relations 68
6) Fact Sheets9M 2017 Results Reported and Adjusted (mn €) – by Division
1 Before amortization of intangibles from PPA, consolidation and special effects
Chassis & Safety Powertrain Interior Tires ContiTech Cons. / Corr. Corporation
2016 2017 2016 2017 2016 2017 2016 2017 2016 2017 2016 2017 2016 2017
Sales 6,624.8 7,243.0 5,430.4 5,760.8 6,164.0 6,881.3 7,914.1 8,387.4 4,086.2 4,677.2 -194.0 -224.1 30,025.5 32,725.6
EBIT 326.1 666.3 255.6 314.3 384.3 550.5 1,697.7 1,547.0 313.4 322.0 -90.5 -95.2 2,886.6 3,304.9in % of sales 4.9% 9.2% 4.7% 5.5% 6.2% 8.0% 21.5% 18.4% 7.7% 6.9% 9.6% 10.1%
Amortization of intangible assets from PPA 0.3 0.0 8.5 9.0 27.0 34.6 5.9 14.2 62.7 70.2 104.4 128.0
Total special effects -0.2 7.8 7.6 0.1 20.8 -3.9 -24.4 30.2 -0.6 34.2 3.2
Total consolidation effects 3.6 7.5 0.1 -19.1 -10.4 0.1 -18.4
Total consolidation & special effects -0.2 7.8 11.2 0.1 28.3 -3.8 -43.5 30.2 -11.0 34.3 -15.2
Adjusted operating result (adj. EBIT) 1 326.4 666.1 271.9 334.5 411.4 613.4 1,699.8 1,517.7 406.3 381.2 -90.5 -95.2 3,025.3 3,417.7in % of adjusted sales 4.9% 9.2% 5.0% 5.8% 6.7% 9.0% 21.5% 18.4% 9.9% 8.7% 10.1% 10.6%

Roadshow PresentationDecember 2017EDMR – Equity and Debt Markets Relations 69
6) Fact Sheets9M 2017 Results Reported and Adjusted (mn €) – by Group
1 Before amortization of intangibles from PPA, consolidation and special effects
Automotive Rubber Cons. / Corr. Corporation Automotive Rubber Cons. / Corr. Corporation Automotive
2016 2017 2016 2017 2016 2017 2016 2017 2016 2017 2016 2017 2016 2017 2016 2017
Sales 5,957.8 6,344.3 4,037.6 4,361.1 -11.6 -12.7 9,983.8 10,692.7 18,126.3 19,759.7 11,933.9 13,003.3 -34.7 -37.4 30,025.5 32,725.6
EBIT 24.2 451.6 610.3 624.5 -38.2 -38.6 596.3 1,037.5 966.0 1,531.1 2,011.1 1,869.0 -90.5 -95.2 2,886.6 3,304.9
Amortization of intangible assets from PPA 12.1 14.6 23.4 27.9 35.5 42.5 35.8 43.6 68.6 84.4 104.4 128.0
Total special effects 1.8 25.8 9.8 -0.5 11.6 25.3 7.9 28.2 26.3 -25.0 34.2 3.2
Total consolidation effects -0.7 0.1 -14.9 0.1 -15.6 11.1 0.1 -29.5 0.1 -18.4
Total consolidation & special effects 1.8 25.1 9.9 -15.4 11.7 9.7 7.9 39.3 26.4 -54.5 34.3 -15.2
Adjusted operating result (adj. EBIT) 1 38.1 491.3 643.6 637.0 -38.2 -38.6 643.5 1,089.7 1,009.7 1,614.0 2,106.1 1,898.9 -90.5 -95.2 3,025.3 3,417.7in % of adjusted sales 0.6% 7.8% 15.9% 15.1% 6.4% 10.4% 5.6% 8.2% 17.6% 15.1% 10.1% 10.6%
Q3 2016/2017 YTD January - September 2016/2017

Roadshow PresentationDecember 2017EDMR – Equity and Debt Markets Relations 70
6) Fact SheetsContinental’s Credit Rating
1 Contracted rating since May 19, 20002 Non-contracted rating since February 1, 20143 Contracted rating since November 7, 2013
2000 2001 2002 2003 2004 2005 2006 2007 2008 2009 2010 2011 2012 2013 2014 2015 2016 2017
BBB+ / Baa1
BBB / Baa2
BBB- / Baa3
BB+ / Ba1
BB / Ba2
BB- / Ba3
B+ / B1
B / B2
S&P, Fitch / Moody’sStandard & Poor’s1 Moody’s2 Fitch3
BeforeSiemens
VDO
Non
-Inve
stm
ent
Gra
deIn
vest
men
tG
rade

Roadshow PresentationDecember 2017EDMR – Equity and Debt Markets Relations 71
ReferencesUseful LinksContinental Investor Relations website www.continental-ir.com
Annual and interim reports www.continental-corporation.com/en/investors/reports
2016 Fact Book www.continental-corporation.com/en/investors/reports
Investor Relationsevents and presentations
www.continental-corporation.com/en/investors/events/presentations
Sustainability at Continental(presentation and fact sheet forinvestors)
www.continental-corporation.com/en/investors/about-us/presentation-sustainability-at-continental-23118
Corporate Social Responsibility www.continental-sustainability.com
Corporate Governance Principles www.continental-corporation.com/en/company/corporate-governance/principles-and-declarations
Continental shares www.continental-corporation.com/en/investors/share
Continental bonds and rating www.continental-corporation.com/en/investors/debt-and-rating
Continental IR App for the iPad itunes.apple.com/app/continental-investor-relations/id922896658?mt=8
Continental IR on Twitter twitter.com/Continental_IR