Risk Management Council Meeting - MemberClicks
136
Risk Management Council Meeting Thursday, February 06, 2014 FCSRMC Mission Statement: FCSRMC delivers comprehensive and innovative enterprise-wide risk management services and solutions to support the educational mission of the Florida College System.
Transcript of Risk Management Council Meeting - MemberClicks

Risk Management Council Meeting Thursday, February 06, 2014
FCSRMC Mission Statement: FCSRMC delivers comprehensive and innovative enterprise-wide risk
management services and solutions to support the educational mission of the Florida College System.

Risk Management Council Meeting February 06, 2014
AGENDA Action Items:
1. Property/Casualty Program 2014-2015:
a. Review of 2014-2015 Proposed Property/Casualty Budget pg 01
b. Plan Document Changes pg 05
c. Risk Management Information System (RMIS) Technology Platform pg 07
2. Employee Benefit Plans 2014:
a. Employee Benefit Plans 2014 Budget Addendum pg 09
b. FBMC Agreement Post Facto pg 12 Information Items:
3. Property/Casualty Program 2014-2015:
a. Direct Service Organization/Foundation Coverage Conversation pg 18
b. Legal Panel Application pg 19
c. International Travel pg 25
d. 2014 Risk Summit pg 27 e. Shoes for Crews pg 29
4. Employee Benefit Plans 2014:
a. Self-Insured Health Plan Update pg 34
b. 2014 Employee Benefit Plans pg 36
c. Heath Care Reform pg 55
5. Financials - November 2013 :
a. Property/Casualty Financial Highlights pg 65
b. Employee Benefit Plans Financial Highlights pg 68
c. Investment Program – Fourth Quarter 2013 pg 71

6. Miscellaneous:
a. Property/Casualty & Admin Services 3 YR Performance/Projection pg 108
b. Employee Benefit Plans 3 YR Performance/Projection pg 111
c. Operations Committee Members as of 01/30/14 & 03/01/14 pg 113

Action Item 1.a.
Review of 2014-2015 Proposed Property/Casualty Budget

ACTION Council of Presidents - Risk Management Council Agenda Item: 1.a. February 6, 2014 Presentation of the 2014-2015 Property/Casualty Budget Presentation of the annual 2014-2015 Property/Casualty Budget including insurance premiums, funding for reserves and future claims, Consortium administrative budget and college allocation. Motion made by __________, second by _____________ to approve the annual 2014-2015 Property/Casualty Budget as submitted. Discussion: Tina Ingram, AFC to provide voting results.
SOhlson
Text Box
1

Fund
s Neede
d for P
rope
rty/Ca
sualty Program
s Prope
rty Casualty Insurance
$14,50
0,00
0$1
3,47
5,37
5 Boiler &
Machine
ry$1
92,895
$206
,560
Workers' Com
pensation
$598
,017
$574
,094
Schoo
l Leade
rs Errors &
Omissions
$824
,775
$1,000
,305
Liability ‐ Fede
ral and
Other States
$248
,250
$210
,000
Crim
e$7
0,38
7$6
7,08
8 State Taxes and
Assessm
ents
$393
,000
$328
,927
Total In
surance Co
sts
$16,82
7,32
4$1
5,86
2,34
9
Other Program
Costs
Workers' Com
pensation Au
dit A
ssessm
ent
$27,26
3$2
7,00
0 A
ddition
to Cyber Loss F
und *
$135
,000
$0 A
ddition
to Fun
d Ba
lance
$2,900
,000
Fund
Balan
ce Recovery
$2,000
,000
Adm
inistrativ
e Services (+
Legal, Claims, Aud
it, etc.)
$1,381
,740
$1,647
,648
Con
sortium Office Bud
get
$599
,593
$676
,528
To
tal O
ther Program
Costs
$5,043
,596
$4,351
,177
To
tal Fun
ds Neede
d for 2
014‐20
15$2
1,87
0,92
0$2
0,21
3,52
6
Add: Fun
ds Neede
d in Loss F
und
$54,72
7,00
0$5
6,65
4,00
0
Total Fun
ds Neede
d for P
rope
rty/Ca
sualty Program
s$7
6,59
7,92
0$7
6,86
7,52
6
Less Fun
ds Available to Pay Claim
s (as of 1
0/31
/13)
$58,01
2,12
6$5
5,80
7,09
520
14 W
C Co
llateral H
eld by
Insurer
‐$5,62
3,92
0‐$4,70
9,25
6Net Fun
ds Available
$52,38
8,20
6$5
1,09
7,83
9
Neede
d to Fun
d Prop
erty/Casualty
Program
$24,20
9,71
4$2
5,76
9,68
7Less: Expe
cted
Interest Earnings
‐$67
4,00
0‐$38
0,00
0
Total Fun
ds Neede
d for p
rogram
ope
ratio
n$2
3,53
5,71
4$2
5,38
9,68
7Less Adjustm
ents from
Prio
r Years (p
er actuaria
l review)
$0$0
Total Fun
ds to
be Assessed
to Colleges
$23,53
5,71
4$2
5,38
9,68
77.88
%
* Cybe
r Loss F
und will to
tal $1,00
0,00
0 after 2
014‐20
15 con
tribution.
2013
‐201
420
14‐201
5% Cha
nge
Rate Per FTE
Before Refun
ds$6
7.29
$77.55
15.24%
After R
efun
ds$6
7.29
$77.55
15.24%
Florida Co
llege
System Risk Man
agem
ent C
onsortium
Prop
erty/Casua
lty Program
s20
14‐201
5 Ca
lculation of In
stitu
tion Assessmen
ts
2013
‐201
420
14‐201
5
2014
-201
5 B
udge
t OP
S C
OM
M 2
.5.2
014
Pag
e 1
2/5/
2014
6
:35
PM
SOhlson
Text Box
SOhlson
Text Box
2

2014
‐201
510
0%Cred
it for
Add:
2014
‐201
5Work Co
mp
TIV Prop
.Prior Y
rs.
2014
‐201
520
13‐201
4%
Self Ins
Due
Due
2014
‐201
5Initial
Expe
rience
Allocatio
nRe
serve
Annu
alAn
nual
Increase/
Increase/
Est. An
n.To
tal
on/before
on/before
College
FTE
Assessmen
tRa
ting
Assessmen
tFund
ing
Assessmen
tAssessmen
tDe
crease
Decrease
Tax*
College Cost
3/1/20
147/1/20
14
BroC
3005
4$2
,330
,571
‐$24
,133
‐$30
5,73
7$0
$2,000
,701
$1,871
,072
$129
,629
6.93
%$1
8,90
3$2
,019
,604
$666
,900
$1,333
,801
CC16
02$1
24,229
‐$4,55
9$1
40,533
$0$2
60,204
$274
,988
‐$14
,784
‐5.38%
$1,851
$262
,055
$86,73
5$1
73,469
CCF
5976
$463
,416
‐$17
,169
$108
,206
$0$5
54,454
$561
,400
‐$6,94
6‐1.24%
$4,281
$558
,735
$184
,818
$369
,636
DSC
1244
9$9
65,372
‐$17
,196
$106
,314
$0$1
,054
,489
$1,046
,026
$8,463
0.81
%$1
0,18
4$1
,064
,673
$351
,496
$702
,993
EFSC
1201
8$9
31,949
$19,60
7$1
29,604
$0$1
,081
,160
$1,104
,330
‐$23
,170
‐2.10%
$11,51
7$1
,092
,677
$360
,387
$720
,773
ESC
1051
3$8
15,242
‐$28
,657
‐$3,53
5$0
$783
,050
$725
,534
$57,51
67.93
%$6
,201
$789
,251
$261
,017
$522
,034
FGC
2167
$168
,042
‐$2,55
8$6
9,68
6$0
$235
,171
$249
,431
‐$14
,260
‐5.72%
$2,231
$237
,402
$78,39
0$1
56,780
FKCC
837
$64,90
6‐$1,74
0$7
2,41
0$0
$135
,577
$121
,706
$13,87
111
.40%
$1,110
$136
,687
$45,19
2$9
0,38
4GCSC
4505
$349
,345
‐$6,04
3$1
60,181
$0$5
03,483
$442
,058
$61,42
513
.90%
$3,704
$507
,187
$167
,828
$335
,655
HCC
2047
2$1
,587
,524
‐$56
,125
‐$21
0,48
3$0
$1,320
,916
$1,286
,200
$34,71
62.70
%$1
1,98
6$1
,332
,902
$440
,305
$880
,610
IRSC
1342
9$1
,041
,367
‐$18
,456
$161
,223
$0$1
,184
,134
$1,112
,304
$71,83
06.46
%$1
1,27
4$1
,195
,408
$394
,711
$789
,423
LSSC
2966
$230
,002
$5,614
$85,11
7$0
$320
,733
$330
,753
‐$10
,020
‐3.03%
$3,174
$323
,907
$106
,911
$213
,822
MDC
5587
2$4
,332
,657
$368
,204
‐$47
4,49
0$0
$4,226
,372
$3,581
,396
$644
,976
18.01%
$39,17
3$4
,265
,545
$1,408
,791
$2,817
,581
NFCC
898
$69,63
6‐$1,54
8$3
8,67
3$0
$106
,761
$112
,348
‐$5,58
7‐4.97%
$1,018
$107
,779
$35,58
7$7
1,17
4NWFSC
5196
$402
,930
$1,565
$152
,114
$0$5
56,609
$542
,060
$14,54
92.68
%$4
,079
$560
,688
$185
,536
$371
,073
PBSC
2008
4$1
,557
,436
$28,91
5‐$23
1,15
2$0
$1,355
,199
$1,124
,607
$230
,592
20.50%
$12,74
1$1
,367
,940
$451
,733
$903
,466
PHCC
7041
$546
,002
$5,201
$116
,745
$0$6
67,949
$563
,447
$104
,502
18.55%
$5,987
$673
,936
$222
,650
$445
,299
PeSC
9297
$720
,946
‐$23
,478
$22,80
9$0
$720
,278
$733
,366
‐$13
,088
‐1.78%
$4,638
$724
,916
$240
,093
$480
,185
PoSC
7828
$607
,031
‐$22
,501
‐$15
,420
$0$5
69,109
$515
,886
$53,22
310
.32%
$4,209
$573
,318
$189
,703
$379
,406
SJRSC
4795
$371
,834
‐$9,24
6$2
8,22
9$0
$390
,817
$396
,577
‐$5,76
0‐1.45%
$3,121
$393
,938
$130
,272
$260
,544
SPC
2128
0$1
,650
,182
$66,64
1$2
8,73
6$0
$1,745
,559
$1,579
,992
$165
,567
10.48%
$15,68
7$1
,761
,246
$581
,853
$1,163
,706
SaFC
1193
5$9
25,513
$717
‐$68
,992
$0$8
57,238
$811
,973
$45,26
55.57
%$9
,206
$866
,444
$285
,746
$571
,492
SSC
1489
1$1
,154
,739
‐$40
,383
‐$94
,828
$0$1
,019
,528
$967
,272
$52,25
65.40
%$7
,984
$1,027
,512
$339
,843
$679
,685
SFSC
2280
$176
,805
‐$5,89
3$1
31,098
$0$3
02,010
$330
,119
‐$28
,109
‐8.51%
$3,095
$305
,105
$100
,670
$201
,340
SCFM
S80
08$6
20,989
‐$25
,601
$1,920
$0$5
97,308
$572
,365
$24,94
34.36
%$4
,328
$601
,636
$199
,103
$398
,205
TCC
1094
7$8
48,897
‐$39
,795
$183
,689
$0$9
92,791
$1,001
,655
‐$8,86
4‐0.88%
$7,602
$1,000
,393
$330
,930
$661
,861
VC30
074
$2,332
,122
‐$15
1,38
3‐$33
2,65
0$0
$1,848
,089
$1,576
,849
$271
,240
17.20%
$16,75
8$1
,864
,847
$616
,030
$1,232
,059
3274
14$2
5,38
9,68
7$0
$0$0
$25,38
9,68
7$2
3,53
5,71
4$1
,853
,973
7.88
%$2
26,042
$25,61
5,72
9$8
,463
,229
$16,92
6,45
8
* Self Insurance Tax will be billed on
a quarterly basis, se
parate from
the tw
o no
rmal prope
rty/casualty billings
FSCR
MC Ca
lculation of Prope
rty/Ca
sualty Assessm
ents ‐ 20
14‐201
5 Fiscal Year
2014
-201
5 B
udge
t OP
S C
OM
M 2
.5.2
014
Pag
e 2
2/5/
2014
6
:35
PM
SOhlson
Text Box
3
SOhlson
Text Box
SOhlson
Text Box

ADJUSTED
LOSS FUND
PROPO
SAL
AMOUNT
ORIGINAL
LOSS FUND
ADJUSTMEN
TSFO
RTO
BE
YEA
RLO
SS FUND
AS OF 10
/31/13
3/1/20
14FU
NDE
D
1987
‐198
83,80
0,00
03,15
0,00
03,15
0,00
03,
021,
000
129,00
019
88‐198
93,30
0,00
03,70
0,00
03,70
0,00
03,
828,
000
(128
,000
)19
89‐199
04,50
0,00
04,40
0,00
04,40
0,00
04,
465,
000
(65,00
0)19
90‐199
15,00
0,00
05,60
0,00
05,60
0,00
05,
785,
000
(185
,000
)19
91‐199
25,90
0,00
04,60
0,00
04,60
0,00
04,
369,
000
231,00
019
92‐199
35,80
0,00
04,80
0,00
04,80
0,00
04,
826,
000
(26,00
0)19
93‐199
47,90
0,00
06,00
0,00
06,00
0,00
05,
698,
000
302,00
019
94‐199
58,90
0,00
05,60
0,00
05,60
0,00
05,
162,
000
438,00
019
95‐199
69,90
0,00
07,20
0,00
07,20
0,00
06,
946,
000
254,00
019
96‐199
79,50
0,00
04,25
0,00
00
4,25
0,00
03,
702,
000
548,00
019
97‐199
88,90
0,00
06,00
0,00
06,00
0,00
05,
555,
000
445,00
019
98‐199
98,40
0,00
06,55
0,00
06,55
0,00
06,
443,
000
107,00
019
99‐200
07,75
0,00
07,65
0,00
00
7,65
0,00
06,
805,
000
845,00
020
00‐200
17,75
0,00
08,55
0,00
08,55
0,00
08,
325,
000
225,00
020
01‐200
28,25
0,00
07,95
0,00
00
7,95
0,00
06,
690,
000
1,26
0,00
020
02‐200
39,70
0,00
08,65
0,00
00
8,65
0,00
05,
200,
000
3,45
0,00
020
03‐200
49,60
0,00
08,55
0,00
00
8,55
0,00
05,
661,
000
2,88
9,00
020
04‐200
59,60
0,00
09,50
0,00
09,50
0,00
06,
935,
000
2,56
5,00
020
05‐200
68,80
0,00
08,80
0,00
08,80
0,00
04,
149,
000
4,65
1,00
020
06‐200
78,22
1,00
0
8,22
1,00
08,22
1,00
04,
710,
000
3,51
1,00
020
07‐200
88,43
7,00
0
8,43
7,00
08,43
7,00
05,
350,
000
3,08
7,00
020
08‐200
98,92
4,34
2
8,92
4,00
0
8,92
4,00
0
4,57
7,00
04,34
7,00
020
09‐201
08,50
0,00
0
8,50
0,00
0
8,50
0,00
0
5,21
2,00
03,28
8,00
020
10‐201
18,00
0,00
0
8,00
0,00
0
8,00
0,00
0
6,45
4,00
01,54
6,00
020
11‐201
28,00
0,00
0
8,00
0,00
0
8,00
0,00
0
5,11
7,00
02,88
3,00
020
12‐201
39,00
0,00
09,00
0,00
09,00
0,00
04,
938,
000
4,06
2,00
020
13‐201
49,30
0,00
09,30
0,00
09,30
0,00
03,
105,
000
6,19
5,00
0
211,63
2,34
218
9,88
2,00
00
189,88
2,00
014
3,02
8,00
046
,854
,000
2014
‐201
59,80
0,00
0
199,68
2,00
0
2014
‐201
5 To
tal
9,80
0,00
0
221,43
2,34
2
EXCL HURR
EST NET OF
SPEC
EXC
ESS PD
@
2/28
/13
31‐Oct‐201
3RE
QUIRED
RESER
VES
2014
-201
5 B
udge
t OP
S C
OM
M 1
27
2014
.xls
Pag
e 3
1/28
/201
4 1
:43
PM
SOhlson
Text Box
4
SOhlson
Text Box

Action Item 1.b. Plan Document Changes

ACTION Council of Presidents - Risk Management Council Agenda Item: 1.b. February 6, 2014
Plan Document Changes Adding or clarifying definitions for the following terms: Earthquake, Named Storm, Active Data Processing Software, Occurrence, Location, Flood, Windstorm or Hail, Biological and/or Chemical Terrorism, and Terrorism. These terms need to be added or modified to mirror the definitions and terms of the primary policy form from FCSRMC’s lead excess property carrier, Lexington. It is also recommended that current exclusions for: Mold and Biological and/or Chemical Terrorism be modified to mirror the definitions and terms of the primary policy form from FCSRMC’s lead excess property carrier, Lexington. In addition, the current exclusion for Inverse Condemnation be modified to encompass all forms of Eminent Domain damages, and that the exclusion be placed in both “Section 1 – Property Exclusions” and “Section II – Casualty Exclusions” of the Plan Document. Motion made by __________, second by __________ to approve the Plan Document Changes as submitted. Discussion: Tina Ingram, AFC to provide voting results.
SOhlson
Text Box
5

Recommended Plan Document Changes for 2014-2015
Background:
After consulting with FCSRMC Counsel Tom Gonzalez and our Business Partners at Arthur J.
Gallagher the following changes to the Plan Document are recommended:
Added or Clarified Definitions:
To ensure that every dollar paid by FCSRMC on a property loss counts toward the excess policy
deductible, it is recommended that definitions for the terms: Earthquake, Named Storm, Active
Data Processing Software, Occurrence, Location, Flood, Windstorm or Hail, Biological and/or
Chemical Terrorism, and Terrorism, be added or modified to mirror the definitions and terms of
the primary policy form from FCSRMC’s lead excess property carrier, Lexington.
Exclusions:
To ensure that every dollar paid by FCSRMC on a property loss counts toward the excess policy
deductible, it is recommended that exclusions for: Mold and Biological and/or Chemical
Terrorism be modified to mirror the exclusions of the primary policy form from FCSRMC’s lead
excess property carrier, Lexington.
Eminent Domain:
To keep with the original intent, and substance, of the exclusion for Inverse Condemnation, it is
recommended that the current exclusion for Inverse Condemnation be modified to encompass
all forms of Eminent Domain damages; and
To minimize confusion as to whether the exclusion applies to both Property and Liability claims,
as evident by the language of the original exclusion, “claims for loss, damage or any liability,” it
is recommended that the exclusion be placed in both “Section I – Property Exclusions” and
“Section II - Casualty Exclusions” of the Plan Document.
SOhlson
Text Box
6

Action Item 1.c. Risk Management Information System (RMIS)
Technology Platform

ACTION
Council of Presidents - Risk Management Council Agenda Item: 1.c. February 6, 2014
Risk Management Information System (RMIS) Technology Platform The system is an enterprise risk management interactive technology based system with click and drag capabilities, graphics and customizable reporting. Six companies responded to the bid. Funding has been included in the budget for $180,000, which is inclusive of implementation and an annual fee estimated at approximately $80,000. Motion made by __________, second by ____________ to approve the selection of the lowest most responsive bidder, as the Risk Management Information System (RMIS) Technology Platform vendor, effective on or before April 1, 2014, not to exceed $180,000 for first year and not to exceed $100,000 in subsequent renewal years, in accordance with Fiscal Agent guidelines and FCSRMC’s General Counsel review. In addition, to provide the Executive Director authority to enter into a contract with such named vendor without the need for further Committee approval. Contract duration shall be 3 years with optional 1 year renewals. Discussion: Tina Ingram, AFC to provide voting results.
SOhlson
Text Box
7

Risk Management Information System (RMIS) Bid Scheduled Outline:
Bid release on February 7, 2014
Bids due on February 28, 2014
Decision on March 10, 2014
Posting of decision on March 11, 2014
Go live date of May 1, 2014
Contract duration shall be 3 years with up to 7 one year renewals. First year of contract will not exceed $180,000 with the following annual contracts not exceeding $100,000.
SOhlson
Text Box
8
SOhlson
Text Box

Action Item 2.a. Employee Benefit Plans 2014
Budget Addendum

ACTION Council of Presidents - Risk Management Council Agenda Item: 2.a. February 6, 2014
Employee Benefit Plans 2014 Budget - Addendum Employee Benefit Plans 2014 Budget – Addendum update include:
Daytona State College new self-insured health plan enrollment (597 contracts) effective January 1, 2014 increase in total paid and incurred claims, plan administrator fees and stop loss premiums.
Daytona State College new fully insured HMO enrollment (367 contracts) premium. Adjustment to total 2014 paid and incurred claims to reflect the individual college health
benefit plan selections of 0%, 5%, and 8% premium rate changes. Introduction of the new business partners FBMC expense for enrollment, billing and
compliance services. Addition of a $5,000 contingency fund expense.
Motion made by _____________, second by ___________ to approve the Employee Benefit Plans 2014 Budget Addendum addressing: Daytona State College enrollment, the individual college selections of the 0%, 5%, and 8% plans, fully-insured products, and engagement of FBMC as the Employee Benefit Plans Benefit Administration and Billing Platform vendor. Discussion: Tina Ingram, AFC to provide voting results.
SOhlson
Text Box
9
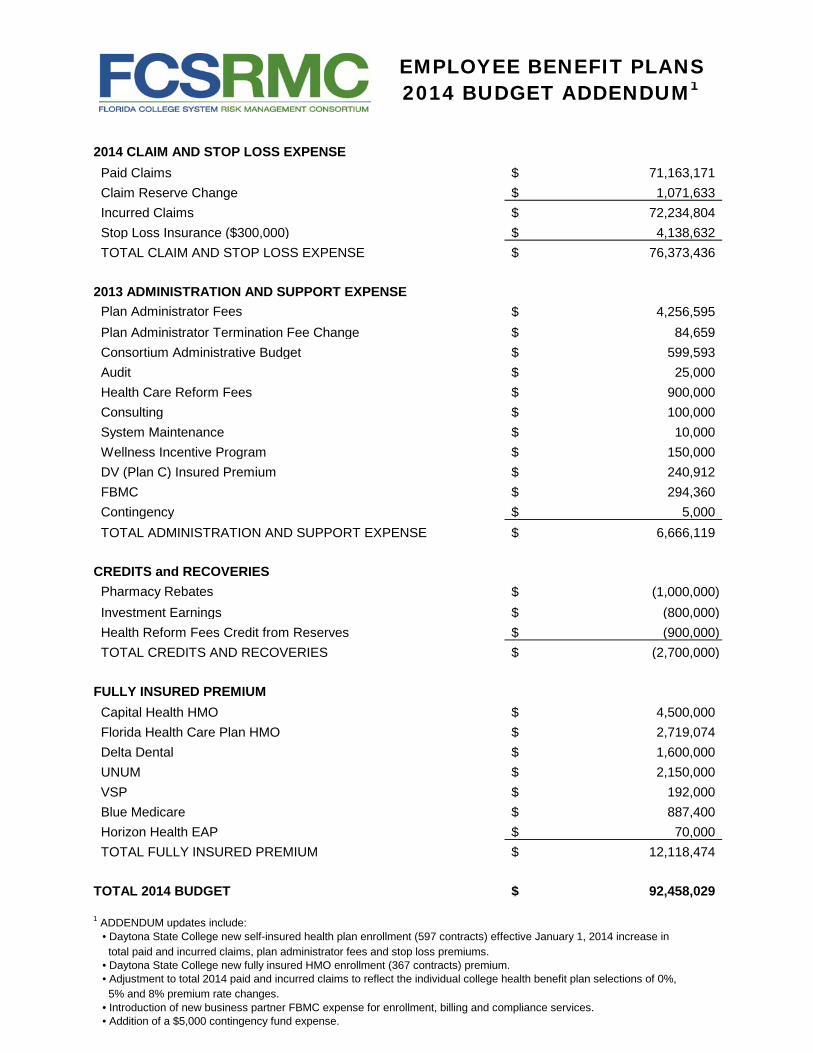
2014 CLAIM AND STOP LOSS EXPENSE Paid Claims 71,163,171$ Claim Reserve Change 1,071,633$ Incurred Claims 72,234,804$ Stop Loss Insurance ($300,000) 4,138,632$ TOTAL CLAIM AND STOP LOSS EXPENSE 76,373,436$
2013 ADMINISTRATION AND SUPPORT EXPENSE Plan Administrator Fees 4,256,595$ Plan Administrator Termination Fee Change 84,659$ Consortium Administrative Budget 599,593$ Audit 25,000$ Health Care Reform Fees 900,000$ Consulting 100,000$ System Maintenance 10,000$ Wellness Incentive Program 150,000$ DV (Plan C) Insured Premium 240,912$ FBMC 294,360$ Contingency 5,000$ TOTAL ADMINISTRATION AND SUPPORT EXPENSE 6,666,119$
CREDITS and RECOVERIES Pharmacy Rebates (1,000,000)$ Investment Earnings (800,000)$ Health Reform Fees Credit from Reserves (900,000)$ TOTAL CREDITS AND RECOVERIES (2,700,000)$
FULLY INSURED PREMIUM Capital Health HMO 4,500,000$ Florida Health Care Plan HMO 2,719,074$ Delta Dental 1,600,000$ UNUM 2,150,000$ VSP 192,000$ Blue Medicare 887,400$ Horizon Health EAP 70,000$ TOTAL FULLY INSURED PREMIUM 12,118,474$
TOTAL 2014 BUDGET 92,458,029$
1 ADDENDUM updates include:
5% and 8% premium rate changes.• Adjustment to total 2014 paid and incurred claims to reflect the individual college health benefit plan selections of 0%,
• Introduction of new business partner FBMC expense for enrollment, billing and compliance services.• Addition of a $5,000 contingency fund expense.
EMPLOYEE BENEFIT PLANS 2014 BUDGET ADDENDUM1
• Daytona State College new self-insured health plan enrollment (597 contracts) effective January 1, 2014 increase in
• Daytona State College new fully insured HMO enrollment (367 contracts) premium. total paid and incurred claims, plan administrator fees and stop loss premiums.
SOhlson
Text Box
10

2014 EXPECTED PAID CLAIMSBO 3562 Employee ( 5,514 x $440.96 ) x 12 29,177,441.28$ BO 3562 Dependent ( 1372 x $666.82 ) x 12 10,978,524.48$ BO 3359 (HRA)Employee ( 149 x $457.93 ) x 12 818,784.04$ BO 3359 (HRA)Dependent ( 76 x $712.81 ) x 12 650,084.01$ BO 3559 Employee ( 490 x $436.80 ) x 12 2,568,384.00$ BO 3559 Dependent ( 109 x $612.46 ) x 12 801,093.94$ BO 3769 Employee ( 516 x $416.00 ) x 12 2,575,872.00$ BO 3769 Dependent ( 409 x $583.29 ) x 12 2,862,799.65$ HMO 10 Employee ( 2094 x $415.88 ) x 12 10,450,232.64$ HMO 10 Dependent ( 378 x $757.54 ) x 12 3,436,201.44$ HMO 51 Employee ( 866 x $419.19 ) x 12 4,356,260.16$ HMO 51 Dependent ( 220 x $586.16 ) x 12 1,547,458.28$ HMO 58 Employee ( 96 x $399.23 ) x 12 459,915.29$ HMO 58 Dependent ( 16 x $558.25 ) x 12 107,183.26$ BO 3566 Economy Plan Employee ( 59 x $395.10 ) x 12 279,730.91$ BO 3566 Economy Plan Dependent ( 13 x $597.47 ) x 12 93,205.43$ SUB TOTAL 71,163,170.80$
2014 INCURRED BUT NOT REPORTED (IBNR) 7,116,317.08$ 2013 INCURRED BUT NOT REPORTED (IBNR) 6,044,683.86$ CLAIM RESERVE CHANGE 1,071,633.22$
2014 EXPECTED INCURRED CLAIMS 72,234,804.02$
DV PLAN (Dental & Vision)Insured Premium ( 840 x $23.90 ) x 12 240,912.00$
2014 ADMINISTRATIVE FEES (Per Employee)BO 3562 ( 5514 x $36.19 ) x 12 2,394,619.92$ BO 3359 (HRA) ( 149 x $36.19 ) x 12 64,707.72$ BO 3559 ( 490 x $36.19 ) x 12 212,797.20$ BO 3769 ( 516 x $36.19 ) x 12 224,088.48$ HMO 10 ( 2094 x $36.19 ) x 12 909,382.32$ HMO 51 ( 866 x $36.19 ) x 12 376,086.48$ HMO 58 ( 96 x $36.19 ) x 12 41,690.88$ HRA fee ( 149 x $4.25 ) x 12 7,599.00$ BO 3566 Economy Plan ( 59 x $36.19 ) x 12 25,622.52$ BO 3565 Plan ( 0 x $36.19 ) x 12 -$ BO 3361 Dependent Only Plan ( 0 x $36.19 ) x 12 -$ SUB TOTAL ADMINISTRATIVE FEES 4,256,594.52$
2014 Administrative Fee Termination Reserve (7.9% of IBNR) 562,189.05$ 2013 Administrative Fee Termination Reserve (7.9% of IBNR) 477,530.03$ TERMINATION RESERVE ADMINISTRATION FEE CHANGE 84,659.02$
2014 STOP LOSS FEESBO 3562 Specific Employee ( 5514 x $35.25 ) x 12 2,332,422.00$ BO 3562 Specific Dependent ( 1372 x $0.00 ) x 12 -$ BO 3359 (HRA) Specific Employee ( 149 x $35.25 ) x 12 63,027.00$ BO 3359 (HRA) Specific Dependent ( 76 x $0.00 ) x 12 -$ BO 3559 Specific Employee ( 490 x $35.25 ) x 12 207,270.00$ BO 3559 Specific Dependent ( 109 x $0.00 ) x 12 -$ BO 3769 Specific Employee ( 516 x $35.25 ) x 12 218,268.00$ BO 3769 Specific Dependent ( 409 x $0.00 ) x 12 -$ HMO 10 Specific Employee ( 2094 x $35.25 ) x 12 885,762.00$ HMO 10 Specific Dependent ( 378 x $0.00 ) x 12 -$ HMO 51 Specific Employee ( 866 x $35.25 ) x 12 366,318.00$ HMO 51 Specific Dependent ( 220 x $0.00 ) x 12 -$ HMO 58 Specific Employee ( 96 x $35.25 ) x 12 40,608.00$ HMO 58 Specific Dependent ( 16 x $0.00 ) x 12 -$ BO 3566 Economy Plan Employee ( 59 x $35.25 ) x 12 24,957.00$ BO 3566 Economy Plan Dependent ( 13 x $0.00 ) x 12 -$ BO 3565 Plan ( 0 x $35.25 ) x 12 -$ BO 3361 Dependent Only Plan ( 0 x $35.25 ) x 12 -$ SUB TOTAL STOP LOSS FEES 4,138,632.00$
2014 SELF-INSURED HEALTH PROGRAM FUNDING
SOhlson
Text Box
11

Action Item 2.b. FBMC Agreement Post Facto

ACTION Council of Presidents - Risk Management Council Agenda Item: 2.b. February 6, 2014
FBMC Agreement-Post Facto The Florida College System Risk Management Consortium secured approval from the Operations Committee to form a Vetting Committee to select a Consortium-wide benefit administration and consolidated billing platform. FCSRMC is requesting approval of the Vetting Committee’s recommendation. FCSRMC will work with FBMC on a phased approach to implementation, with the expectation that all colleges will be fully implemented by January 1, 2015. Motion made by ___________, second by ___________ to approve the selection of FBMC as the Employee Benefit Plans Benefit Administration and Billing Platform vendor effective January 1, 2014 at $294,360 in accordance with Fiscal Agent guidelines and FCSRMC’s General Counsel review. In addition, to provide the Executive Director authority to enter into a contract with such named vendor without the need for further Committee approval. Contract duration shall be 3 years with optional 1 year renewals. Discussion: Tina Ingram, AFC to provide voting results.
SOhlson
Text Box
12

Billing Administration
On behalf of the Florida College System Risk Management Consortium, we are excited to share that our new Benefits Manager, FBMC Benefits Management (FBMC), has commenced the implementation process for the recently awarded Benefits Administration and Consolidated Billing Platform, which includes Benefits Administration, an electronic benefits portal (Benefits Management Center), Retiree Services (Billing), Leave of Absence Services (Billing), and Service Center (Call Center).
This implementation will occur in 2 Phases:
Phase I (Includes Two Components-Billing Administration and the Call Center)
FBMC will implement their Benefits Administration service and Service Center (Call Center) for all 22 Colleges. The Benefits Administration service includes managing the benefits deductions and consolidated billing on behalf of the Colleges and the Consortium with the Carriers. This will replace the cumbersome and inefficient Employee Benefits Portal, which will, in turn, eliminate the need to submit the periodic headcount to the Consortium and to contact each Carrier every time there is a change, issue or question regarding benefits and deductions. In addition, the Service Center (Call Center) will be available to all employees to ask questions related to deductions, general benefits questions, etc. The process of implementation of Phase 1, is expected to be completed by March 31, 2014.
In order to accomplish Phase 1, it will be imperative that all 22 participating colleges, adhere to the time lines set forth in the project plan. FCSRMC and FBMC do recognize that the time line is demanding, but it is necessitated by the fact that our current Billing Portal is failing and the infrastructure is failing and obsolete.
Thank you for your support in this initiative.
Justin Piazza
Enterprise Risk Manager
SOhlson
Text Box
13

Benefits Administration and Consolidated Billing VETTING COMMITTEE REPORT
November 12, 2013 OVERVIEW The Florida College System Risk Management Consortium (FCSRMC) secured approval from the Operations Committee to form a Vetting Committee for the Consortium wide benefits administration and consolidated billing platform. The Committee was formed and consisted of 17 Members: 1 Business Officer, 11 HR Directors and/or Benefits Administrators, and 5 FCSRMC staff. FCSRMC spent several months interviewing appropriate companies in the benefits administration and consolidated billing field. It was determined that there were two vendors, FBMC and Benefitfocus, that would be the best fit for the Consortium. BACKGROUND It was determined that the Consortium employee benefit plan administration was in need of two critical areas of improvement in order to effectively and efficiently serve the member colleges into the future. The first need was the replacement of the current outdated accounts receivable administration function that essentially was a manual process with some limited legacy systems support. The second need was to move from a predominantly manual process to a highly efficient and effective automated enrollment and compliance administration. Our market evaluation included formal interview sessions with Buck, Mercer and Segal from the State approved list of national actuarial benefit consulting firms along with FBMC as a Florida based regional vendor that serves a number of major public entities in the State. BenefitFocus as the current enrollment administrator for FloridaBlue was subsequently included in the evaluation process. VETTING PROCESS On October 29th, The Vetting Committee (members below) convened for an organizational discussion and a complete review of FBMC and Benefitfocus’s respective programs. Justin Piazza chaired the Committee as the Project Manager. At the completion of the formal presentations by each vendor the Committee met together to discuss the materials presented, and the benefits and drawbacks for each respective program. At the conclusion of that meeting it was determined additional information was required from each vendor before the Committee could reach a decision on a recommendation.
SOhlson
Typewritten Text
FBMC Agreement Post Facto
SOhlson
Text Box
14

FCSRMC requested additional information from each vendor. In addition, a member of the Vetting Committee checked the references provided by each vendor. Security measures were also checked and verified with the help of Edison State College’s CIO. COMMITTEE ASSESSMENT The Vetting Committee, with FCSRMC staff abstaining, voted 10-1 (One Vote Per College) to recommend FBMC as the vendor for the Consortium’s Benefit Administration and Consolidated Billing Platform. One Member of the Vetting Committee abstained from voting because they were unable to attend the vetting workshop. RECOMMENDATION AND ASSOCIATED COST: Based on the voting of the Vetting Committee, FCSRMC is requesting approval on the Vetting Committee’s recommendation. FCSRMC will work with FBMC on a phased approach to implementation, with all colleges being fully implemented by Jan. 1, 2015. Per Employee Per Month (PEPM): $2.23 Implementation Fee: $0 Based on 11,000 Employee Count: Year 1 Total Cost: $294,360 (11,000 x 2.23) x 12 Year 2 Total Cost: $294,360 Year 3 Total Cost: $294,360 VETTING COMMITTEE: Voting Members: Ronald Dente: Edison State College Vivian Friend: Pasco Hernando Community College Susie Hale and Anita Kovacs: South Florida State College (Joint Vote) Jill Hall: Polk State College Bill Hunter: North Florida Community College Tonya Kelly: College of Central Florida (abstained from voting) Mae Kline: Seminole State College
SOhlson
Text Box
15

Anita Kovacs: South Florida State College Jennifer Lahurd: State College of Florida Manatee/Sarasota Al Little: Saint Johns River State College Fran Pistilli: Lake Sumter State College Renae Tolson: Tallahassee Community College Non-Voting Members: Chauncey Fagler: FCSRMC Executive Director Natalie Dyksterhouse: FCSRMC Tony Ganstine: FCSRMC Justin Piazza: FCSRMC Robert Pralle: FCSRMC
SOhlson
Text Box
16

CO
ST
AN
ALY
SIS
*BAS
ED ON 11,000 PER EM
PLOYEE PER MONTH
COUNT (PEPM)
PEPM
: $7.65 (All Inclusive)
Implem
entatio
n Fee: $333,000
•Year 1: $809,100
•Year 2: $544,100
•Year 3: $544,100
PEPM
: $2.23 (All Inclusive)
Implem
entatio
n Fee: $0
•Year 1: $294,360
•Year 2: $294,360
•Year 3: $294,360
Note: In previous m
arket e
valuation, Ceridian includ
ed a to
tal:
•Year 1: $1,285,200
•Year 2: $871,200
•Year 3: $871,200
SOhlson
Text Box
17

Information Item 3.a. Direct Service Organization/Foundation
Coverage

Proposed Task Force to Review Foundation/DSO Coverage
Background:
Over the years, the position of the Council of Presidents has been that the FCSRMC does not
provide insurance coverage or risk management services to Direct Service Organizations (DSOs),
including college foundations. This position was established, in part, because of a concern that
DSOs and Foundations may not be subject to the provisions of Fl. Stat. 768.28, dealing with
Sovereign Immunity. A recent ruling in: UCF Ath. Ass'n v. Plancher, 121 So. 3d 1097, (Fla. 5th
DCA 2013), has confirmed that under certain circumstances, DSOs may be entitled to limited
Sovereign Immunity as described in 768.28.
In addition, the FCSRMC has received a number of requests from Member Colleges concerning
possible insurance coverage for Foundations, and Foundation property.
Questions and Possible Implications:
If DSOs are entitled to limited Sovereign Immunity, there may be overlaps in liability coverage
between insurance policies which are currently being purchased by the DSOs coverage, and the
terms of the FCSRMC Plan Document. In addition, questions continue to arise regarding possible
overlaps or gaps in other areas of coverage including: Errors and Omissions, Crime, Property,
Auto Liability, etc.
Proposed Task Force (Sub-Committee):
The FCSRMC Operations Committee is recommending that a task force or subcommittee be
formed and charged with reviewing the current process for insuring DSOs and determining if
any changes or recommendations are warranted in regards to the relationship between DSOs
and Foundations and the FCSRMC.
The task force representatives should include a cross section of FCSRMC participating members,
to include Foundation Officers, FCSRMC staff, College Attorneys, Business Officers and Risk
Managers.
SOhlson
Text Box
18
SOhlson
Text Box
Information Item 3.a.
Information Item 3.b. Legal Panel Application

Agenda Item 5.a.2.
FCSRMC Litigation Panel Application
Firm Information
Firm Name: Lead Contact:
Address: Street Address Suite # City State ZIP Code Phone: Email Partner Hourly Rate: $
Associate Hourly Rate: $
Paralegal Hourly Rate: $
Travel rate: $_______________ URL/Web Address: ____________________________________ Area of Emphasis: Counties covered (without additional fees for travel): ________________________________________________ Have you ever provided service to FCSRMC?
YES
NO If yes, when?
Were you referred to FCSRMC by a member college?
YES
NO By whom?
Name Title
References Please list two professional references.
Full Name: Relationship:
Company: Phone:
Address: Full Name: Relationship:
Company: Phone:
Address:
Agreement to abide by Litigation Guidelines and Signature I agree to handle and defend claims based upon the FCSRMC Litigation Guidelines.
Signature: Date:
SOhlson
Text Box
19
SOhlson
Text Box
SOhlson
Text Box
Information Item 3.b.

FCSRMC Litigation Guidelines March 1, 2014 - March 1, 2015
This guideline is intended to communicate the expectations and guidelines of our litigation management program. Any attorney or firm representing FCSRMC and/or its members must agree to and comply with the stated guidelines. The FCSRMC shall not be responsible for payment of legal services and/or expenses incurred should they fail to be in compliance with these guidelines. As such, familiarize yourself with these guidelines, and communicate them to your staff, and/or other counsel in your office who may be involved in the defense of our claims. Assigned counsel: Optimally, each case should be handled by a core group of legal professionals in your office. We expect that one attorney will be assigned to the case, and he/she may be assisted by an associate or paralegal. Counsel should remain on the case from start to finish unless otherwise discussed and approved by FCSRMC. Assignment of the case: Defense files will be forwarded to the lead counsel by the claims professional assigned to the claim. The assignment will be accompanied by a letter summarizing the claim information available to the adjuster at that time. The letter will also specify the immediate defense work that should be undertaken until an agreed defense strategy is determined. Within 3 days of the receipt of the assignment, counsel should send a brief acknowledgement of receipt of the materials in writing confirming the assignment of the case. Within 2 weeks of the assignment, the defense attorney must contact the adjuster to advise of their initial assessment and recommended plan based upon the information known to date. Thereafter, a detailed initial report and litigation plan will be due within 30 days of the initial assignment. Litigation Management Plan: A Litigation Management Plan is a detailed defense strategy developed cooperatively amongst the defense attorney, the claims adjuster, and when appropriate, FCSRMC. The plan should include:
• Initial analysis of the lawsuit and/or coverage issues • Identification of issues and case objectives • Development of defense strategy • Identification of required activities • Target dates for completion and projected cost for each litigation phase and anticipated activity
(budget) • Venue and jurisdictional concerns • Liability and damages issues • Legal and factual defenses • Recommendations for additional investigation (subject to adjuster approval) anticipated discovery
required and what will be achieved by doing so • Measures to be taken to achieve a summary disposition • Case value and settlement value
Counsel will memorialize the issues and strategies agreed to via a litigation plan and budget within 90 days from the date of initial assignment and send to the adjuster. The litigation status should be modified as circumstances dictate, and any changes in the plan should be highlighted. Any changes to the anticipated budget should also be highlighted. Legal Status Report: Counsel shall provide to the adjuster a written status report every 90 days, or upon occurrence of a significant event which affects the litigation plan, strategy, and/or budget. Status reports should succinctly state and analyze activities and information learned since the last status report. Counsel shall
SOhlson
Text Box
20

immediately advise the adjuster of any meditation dates, settlement conferences, or hearing dates anticipated and/or scheduled by the court. When providing a status report, please include any new developments and give the adjuster an analysis the developments have on the overall strategy and evaluation of the case. FCSRMC is looking to counsel to provide expertise and opinion to the adjuster, not a simple regurgitation of factual events. Discovery/Depositions: Counsel shall provide the adjuster with copies of significant pleadings/documents. Status reports relating to or accompanying discovery should highlight the significance and impact they have on the case, not simply restate the information therein. All depositions initiated by defense counsel retained to represent FCSRMC or its members must be discussed with and approved by the adjuster. Following depositions, the adjuster shall be notified of the deposition highlights and the effect on the overall case shall be included in the following status report. Investigation: Unless otherwise agreed, the adjuster will carry out all investigations required on third party claims. Legal research: Counsel shall obtain authorization from the adjuster prior to undertaking extraordinary legal research (research over 3 hours). Counsel should be prepared to discuss the purpose for the proposed research, how it relates to the litigation plan, and estimated cost associated with the research. Approval must be noted on the invoice. Medical records: Counsel shall not prepare detailed page and/or line digests, or detailed summaries of medical records unless requested by the adjuster. A brief summary of the relevance and effect on the case is all that is required. Experts: Experts must be approved in advance by the adjuster. Counsel should be prepared to explain the purpose of retaining the expert, a detailed assessment of the expert’s experience as well as the proposed budget for the retention of the expert. Negotiations and settlement: Defense counsel and the adjuster shall act cooperatively in the negotiation and settlement of appropriate cases. The adjuster is responsible for direct negotiation of the settlement. Counsel is expected to assist the adjuster as requested to effectively and quickly resolve litigated matters. The adjuster must be notified in writing of all settlement demands, settlement offers made by interested parties, and of all pretrial settlement conferences anticipated and/or scheduled by the court as soon as that information becomes known. Requests for settlement must be made on a timely basis, and requests for settlement authority on the “eve of trial” or the day prior to a known mediation will not be acceptable. Any settlement authority granted by FCSRMC will expire 90 days following the extension of authority from the FCSRMC. Pretrial report: At least 45 days prior to a scheduled trial date, counsel shall complete and submit to the adjuster a pre-trial report, and schedule a conference with the adjuster to discuss witness preparation, evidence evaluation, and overall strategy. Travel: Local travel is defined as less than 50 miles round trip. FCSRMC will not pay for local travel time, but will reimburse reasonable local travel expenses. Long-distance travel is defined as greater than 50 miles round trip. Long distance travel time and expenses must be approved in advance by the adjuster. FCSRMC will pay the full hourly rate for active travel (driving) and ½ the hourly rate for passive travel (flying, train travel) Any time billed to another file during travel shall not be billed to travel for the assigned file. Any time spent working on the assigned FCSRMC file during local or long-distance travel time may be billed at the full hourly rate. Mileage reimbursement shall not exceed applicable IRS rates.
SOhlson
Text Box
21

Trial: Unless otherwise agreed to by the adjuster, only one trial attorney will participate at trial. Trial counsel shall keep the adjuster apprised of the status of the trial at least once daily. Post-trial/Appeal: Within 3 days of the return of a judgment entered in a case affecting FCSRMC, or a member, counsel shall contact the adjuster to discuss post-trial and/or appellate issues that may impact the case. Fees and general billing practices: The hourly rates for legal service offered by your firm must be agreed to in advance and confirmed in writing by FCSRMC. Requests for hourly rate increases must be submitted in writing to FCSRMC at least 90 days prior to the proposed effective date of the increase. FCSRMC will not be responsible for any unilateral rate increases. FCSRMC will not pay for:
• Preparation of invoices or responses to billing questions • Preparation of responses to requests from legal auditors • Time spent reviewing or analyzing the law firm’s conflicts issues, opening or closing the files, or
administrative activities • Clerical work performed by attorneys or paralegals • Charges directly related to the departure of a lawyer or paralegal (including start-up work or
higher rates for replacement personnel) • Research on elementary issues which should be understood by an experienced defense firm. • Research or other work initially prepared for other files • Computerized research
Unless approved by adjuster, FCSRMC will not pay for:
• Extraordinary legal research • Digesting or otherwise preparing line and page summaries of depositions or testimony before trial
is imminent • Excessive reworking or redrafting of pleadings, correspondence, legal memoranda or other
documents • Trial preparation undertaken when trial is not imminent • More than one attendee at deposition or trial, hearing, court appearance, meeting with third
parties, or any other similar or related events • Duplicated effort caused by law firm’s staffing or training requirements • Time billed for greater than one lawyer involved in an intraoffice or interoffice communication
(including memoranda). Only the most senior attendee’s time is considered. • Motions and legal memoranda unless litigation time constraints preclude prior approval from the
adjuster • Time billed by summer associates or law clerks. If approved, the hourly rate shall not exceed the
paralegal rate • Activities that deviate from the stated guidelines and procedures contained in this document.
Expenses: FCSRMC will only pay the actual incurred costs for expenses. We will only pay expenses of $500 or more if the adjuster approved the expense prior to when it was incurred. Bills for expenses which require pre-approval of the adjuster must indicate the name of the approving adjuster, and the date on which it was approved.
SOhlson
Text Box
22

All bills for expenses must have supporting documentation available for review. Single expenses of $100 or more must be accompanied by supporting documentation. All invoices must contain a detailed itemization by category, cost item and date. FCSRMC will pay for:
• Photocopying up to 10 cents per page. The per page rate, date of the photocopying was performed, and the number of copies made must be noted on the bill
• Reasonable pre-approved long-distance travel expenses including airline transportation, not to exceed coach fares. Travel charges must provide detailed travel and itinerary information. Original receipts (including copies of tickets) must be submitted for all travel expenses exceeding $25.
• Experts expenses, provided prior approval for these expenses was given by the adjuster. • Messenger delivery and air/freight courier expenses, if required to meet litigation deadlines. • Court filing fees, jury fees, and witness fees • Litigation exhibits if pre-approved by the adjuster • Expenses for services provided by contractors or other non-employees of the law firm if approved
by the adjuster in advance.
FCSRMC will not pay for: • Case management or litigation software or systems • Continuing education for any personnel • Local travel time (less than 50 miles round trip) • Incoming or outgoing fax charges • Local or long distance telephone charges • Overhead including rent, conference rooms, equipment rentals, utilities, computer equipment,
software, books, publications, seminars, office supplies, routine postage, refreshments during meetings, employee courier services, meals, and non-attorney or non-paralegal staff
• Law office overtime charges • Overtime transportation and meals • Inadequately described or miscellaneous expenses • Secretarial and clerical work
Billing procedures: • FCSRMC shall establish the policies and procedures for submission of legal bills by counsel • For fees and expenses that, under these guidelines require advance approval, the name of the
claims adjuster from whom approval was obtained must be noted on the bill. • FCSRMC may withhold payment of bills that, in whole or in part, do not comply with the stated
guidelines • Bills should be submitted every 30 days. • Each bill shall reflect entry of single-activity time records. All time must be billed in tenth-of-an-
hour increments. No formula or value billing is permitted. Bills must reflect only actual time spent on a task. Block-billed time records are not acceptable and bills containing block-billed entries will be returned for proper formatting.
• Each time record shall provide the date of performance, type of work performed, the identity of the staff member performing the work, and the amount of time spent performing the task (in tenth-of-an-hour increments)
• Final invoice must be sent to the adjuster within 10 business days of final activity
SOhlson
Text Box
23

Bill format: Timekeeper information: Each bills should provide a summary of the charges billed by each individual timekeeper showing:
• The timekeeper’s full name • The initials or other identifier used to identify the timekeeper in the records • His/her status (partner, associate, paralegal) • The timekeeper’s hourly rate • Total hours billed be each timekeeper included on the invoice • Corresponding total dollar amount charged by each timekeeper
Each time record shall provide a detailed description of all work performed. Billing Judgment: FCSRMC expects to be charged reasonable fees for legal services as recognized in the prevailing rules of professional ethics. As an example, we expect the firm’s hourly charges to be reduced where, in the exercise of billing judgment, you believe the charges exceed the value of what was delivered or accomplished
SOhlson
Text Box
24
Information Item 3.c. International Travel

WorldRisk Foreign Commercial Package
WorldSource
The WorldRisk Foreign Commercial Package provided by WorldSource, a division of Chartis, provides flexible coverage solutions for the overseas operations of commercial U.S. and Canadian-based multinational organizations. Clients can choose up to nine different coverage options, plus a host of value-added coverage and service enhancements, to protect the breadth of their foreign exposure under one insurance portfolio. Coverage Clients can choose up to nine of the following foreign coverage options for a minimum premium of $2,500:
– Foreign Commercial General Liability including embedded third-party Accidental Death & Dismemberment coverage. > Limits: up to $10 million per occurrence
– Foreign Automobile for owned, hired or non-owned vehicles excess of locally required coverage. > Limits: up to $10 million per accident
– Foreign Comp Elite® including employers’ liability coverage for all classifications of employees. > Limits: up to $10 million for employers’
liability and up to $1 million for excess repatriation
– Travel Accident & Sickness including 24-hour, 365-day medical and legal assistance services overseas provided by Travel Guard, a Chartis company.
> Limits: wide range of options
– Commercial Property for real and personal property, or property at exhibition or in-transit. > Limits: up to $10 million per location
– Kidnap & Ransom/Extortion for kidnap or ransom, extortion, wrongful detention or hijacking occurrences while traveling abroad. > Limits: available up to $1 million
– Marine Ocean Cargo with optional war risk coverage. > Limits: $500,000 per vessel or conveyance
per occurrence
– Commercial Crime coverage for employee theft or forgery or robbery inside or outside of the premises. > Limits: $25,000 per occurrence and
$50,000 in the aggregate
– Political Risk for confiscation, expropriation or nationalization. > Limits: up to $500,000
Why Choose WorldRisk:
Global Network – Owned operations – On-the-ground
contacts – Local intelligence – Presence in emerging
markets
Claims Capabilities – Payments made
in-country – Proven specialist
network – Best-in-class crisis
response
Value-Added Services – Technological
efficiencies – Account
management – Educational
resources
Continued >
SOhlson
Text Box
25
SOhlson
Text Box
Information Item 3.c.

Chartis is a world leading property-casualty and general insurance organization serving more than 40 million clients in over 160 countries and jurisdictions. With a 90-year history, one of the industry’s most extensive ranges of products and services, deep claims expertise and excellent financial strength, Chartis enables its commercial and personal insurance clients alike to manage virtually any risk with confidence.
Chartis is the marketing name for the worldwide property-casualty and general insurance operations of Chartis Inc. For additional information, please visit our website at www.chartisinsurance.com.
All products are written by insurance company subsidiaries or affiliates of Chartis Inc. Coverage may not be available in all jurisdictions and is subject to actual policy language. Non-insurance products and services may be provided by independent third parties. Certain coverage may be provided by a surplus lines insurer. Surplus lines insurers do not generally participate in state guaranty funds and insureds are therefore not protected by such funds.
10/09
WorldRisk Foreign Commercial Package
WorldSource
Coverage Benefits
– Clients have the flexibility to choose nine different coverages under one insurance portfolio with one minimum premium and one invoice.
– Two and three-year policies are available.
– Our internal system platform allows clients to:
> Receive a trip travel quote within one business day of receiving the application
> Receive an electronic policy within one business day of binding
> Enjoy a streamlined renewal process
– Where required, locally admitted policies can be provided throughout Chartis’ owned global network which currently serves clients in over 160 countries and jurisdictions.
– Limits and premiums are available in either U.S. or Canadian Dollars.
Service Benefits
– Clients are provided 24-hour employment injury benefits on a primary basis while traveling overseas on a business trip through Foreign Comp Elite coverage.
– Clients can have immediate access to the resources needed to manage a man-made crisis event through CrisisResponse®, added by endorsement to General Liability coverage.
– The 24-hour, 365-day emergency medical and travel assistance services of Travel Guard are available to clients if an employee gets sick or injured while overseas.
Claims Benefits
– WorldSource claims specialists offer clients specialized support for a variety of claims throughout our claims offices in New York, Dallas, Dubai, Istanbul, San Juan, Croydon and Manchester.
> Further claims support is given by the Chartis worldwide network of 345 claims offices around the world
– We have the ability to remit foreign currency bank transfers to more than 180 countries in over 135 currencies when paying claims.
Target Classes
– Foreign Exporters and Importers
– Manufacturers
– Higher Education Institutions (study abroad programs, foreign travel)
– Non-Profit Organizations
– Energy
– Entertainment
– Service Companies (engineering, consulting, researchers)
– Specialty Trade Contractors
– Financial Services
– Many Other Classes Available
SOhlson
Text Box
26

Information Item 3.d. 2014 Risk Summit

2014 Risk Summit When: June 10-12, 2014
Where: Best Western Plus, Gainesville, FL
June 10th: Evening Reception
June 11th: Breakfast, Lunch, and Dinner
June 12th: Breakfast and Lunch
FCSRMC will cover both Employee Benefits and Property & Casualty on June 11th and the 12th. Possible topics include: Healthcare Reform, FBMC Benefits Administration and Self-Billing, Wellness, Enterprise Risk Management, Risk Management Information System, and much, much more. If you have a specific topic that you would like to be considered, please email Tony Ganstine at [email protected].
SOhlson
Text Box
143
SOhlson
Text Box
SOhlson
Text Box
SOhlson
Text Box
27
SOhlson
Text Box
Information Item 3.d.

SOhlson
Text Box
28
SOhlson
Text Box

Information Item 3.e. Shoes for Crews

Safety & Loss Prevention: FCSRMC has noticed an uptick in WC claims the last few years. The most significant contributing factor Workplace Slip and Fall’s. Last year alone FCSRMC claims due to slip and fall accidents in the workplace, totaled a little more than $1.8 million dollars. FCSRMC is committed to doing all it can to help curb these preventable costs. To that end, the FCSRMC Operations Committee has budgeted $50,000 for the 14-15 budget year for a pilot program with Shoes For Crews. Shoes For Crews a company that specializes in Reducing workplace slip & fall accidents by making and selling slip-resistant footwear. FCSRMC will be analyzing our Slip and Fall data and would like to partner with one College to implement a Shoes For Crews initiative. FCSRMC would provide a recommended number of shoes for those employees in Maintenance, Environmental Services, Facilities, and Food Services, at the Pilot College. After one year, FCSRMC will analyze the cost vs. ROI. We believe implementing this Shoes For Crews Safety Footwear Program for the Consortium could be an effective way to reduce your costs and protect your employees.
FCSRMC expects an effective Shoes For Crews initiative, will result in an average 70% decrease in Slip and Fall Costs.
Justin Piazza
Enterprise Risk Manager
SOhlson
Text Box
29
SOhlson
Text Box
Information Item 3.e.

Shoes For Crews® Safety Solutions
Shoes For Crews (SFC) Customer Commitment & Vision Statement Reduce workplace slip & fall accidents by making and selling the
best slip-resistant footwear in the world while delighting our customers.
™ and © 2014 Shoes For Crews, LLC | All Rights Reserved
reduce your employee’s risk of
slip & fall accidents up to 90%
decrease workers’ compensation costs
due to slip & fall accidents
increase employee productivity &
reduce employee lost workdays
SOhlson
Text Box
30

Shoes For Crews’ patented outsole OUTGRIPS the competition!
Costs due to slip and fall accidents can be frightening. Implementing a SFC Safety Footwear Program for your company, franchise, or unit location may be the single most effective way to reduce your costs, increase your profit margin and protect your employees.
Reduce workers’ compensation claims while increasing employee safety. Reduce insurance premiums while increasing employee morale and productivity.
average cost of a slip & fall accident is $21,782
slip and falls account for more injury and workers’ comp costs
slip-resistant footwear can reduce the rate of slipping by over 50%
safety put to the test Shoes For Crews’ top-rated, patented outsole speaks volumes to our commitment to safety; it’s what sets us apart from the rest. Using a third-party slip-resistant testing laboratory, our patented SFC Mighty Grip® outsole was compared to our top competitors on a smooth, worn quarry tile covered with Crisco brand shortening and water.
0.580.4
0.390.38
0.370.37
0.330.32
0.280.27
0.20.05
0 0.1 0.2 0.3 0.4 0.5 0.6 0.7
Shoes For CrewsSR Max
TredSafe by WalmartDansko
Payless Safe-T-StepTimberland PROLehigh SlipGrips
New Balance (SR Shoe)Keuka/SureGrip
Skechers WorkNursemates
Worx by Red Wing
December 2013 Independent Testing by Precision Testing Laboratories
importance of the coefficient of friction (COF) A crucial element in slip and fall prevention is maintaining the best possible COF. The COF is a measured amount of resistance between an object and a surface. The higher the friction between the shoe’s outsole and the floor, the lower the risk of injuries due to slipping and falling.
0.0 is the absence of friction and 1.0 is very high friction (e.g., dry carpet). For more information on our Independent Lab Testing, visit shoesforcrews.com/technology
Liberty Mutual Research Institute for Safety:
The rate in which an employee falls reduces by 21% for every .10 COF measured.
1Scott, W. E., PHD PE. "Falls at Work." National Safety Council Presentation (2007-2008). 2“Workplace Safety Index.” Liberty Mutual Research institute for Safety (2010). 3“From Research to Reality.” Liberty Mutual Research Institute for Safety Vol. 14 (2011).
delivering safety is our #1 priority
1
2
3
SOhlson
Text Box
31

safety made simple
get started today. select your corporate program
corporate discount pricing for over 100 styles SFC offers corporate discount pricing beyond the Factory Direct Price, the charged amount when purchased directly through our consumer catalog or website, averaging a 23% savings. With over 100 styles, SFC has a shoe that fits every taste, job and budget; from cowboy boots to ballerina flats, we have you covered! Our shoes are made of quality materials designed to keep you comfortable and stand the test of time.
*Expected slip and fall reduction is 80% multiplied by the average participation percent. Many factors contribute to the cost savings you will see when implementing a SFC Safety Footwear Program. The largest is the participation rate you achieve. SFC estimates that your slip and falls will decline by 80% or more when participation in an SFC Program approaches 100%. Factors that contribute to slips and falls include: first day/new employees and guests not wearing SFC footwear, employees tripping on objects, and employees wearing SFC footwear that is more than 6 months old. These are estimates based on actual customer data. Results may vary.
$5,000 slip & fall warranty
Shoes For Crews is so confident in the slip resistance of our outsoles that we back each pair of shoes purchased through a corporate program with a $5,000 slip & fall warranty. Should any employee have a slip and fall accident while wearing SFC brand footwear, we will reimburse you up to $5,000 per incident. Visit shoesforcrews.com/warranty
60-day wear & compare guarantee
If, for any reason, you are not 100% satisfied, we offer FREE Exchanges or E-Z Returns. No questions asked. Return the shoes within the first 60 days for a FREE Exchange or an E-Z Return using the pre-paid UPS label provided in
each pair purchased. Visit shoesforcrews.com/guarantee for more details.
tailored program & dedicated SFC representative We make signing up and maintaining your program seamless and easy. You’ll work with a dedicated SFC representative,
familiar with your account and needs, providing you outstanding service and a tailored program. SFC offers an array of marketing materials to reach your employees as well as custom portals and convenient billing options.
24/7 ordering & customer service available Call or click 24 hours a day, 7 days a week. A team of knowledgeable customer service representatives are available to answer any concerns or question you may have. Order online or by phone, fax or email. For your convenience, we offer support in English, Spanish, French and Mandarin Chinese.
SOhlson
Text Box
32

“We’ve tested other brands, but have not found the slip resistance or durability that we have found in SFC. Since our program’s inception, we have seen a reduction in our slip and fall claims by 81%.”
-Kurt Leisure, VP of Risk Services, Cheesecake Factory
“They (Shoes For Crews) have saved us millions in claims and we have never had one slip and fall injury with a SFC product... we have seen a drastic reduction in slip, trip and fall claims by 95%.” -Joey Pamaran Tugung, Director, Risk Management, Unified Care Services
“SFC ensures the safety of our most important resources – our team members. They are by far the best slip-resistant shoes out there!” -Mark Jeffares, Risk Manager, Chick-fil-A
“Without a doubt, SFC has made a significant impact in terms of reducing and preventing slip and falls in the workplace.” -Lonnie Harvey, Corporate Director of Human Resources and Risk Management, HCM Inc.
testimonials & trusted partners in safety
join over 15,000 companies in more than 100,000 locations worldwide that rely on SFC
as their solution for slip & fall accidents
Visit us online at shoesforcrews.com | call 1.877.NO SLIPS (667.5477)
SOhlson
Text Box
33
Information Item 4.a. Self-Insured Health Plan Update

SELF-INSURED HEALTH PLAN UPDATES
FINANCIAL 2013 Paid Claim Forecast $60,446,835 2013 Paid Claim Actual1 $60,492,096 2014 Paid Claim Forecast updated to reflect Daytona State College actual enrollment and the specific college plan selections (0%, 5% and 8% rate change). COLLEGE 2014 PLAN SELECTIONS AND CONTRIBUTION
11 colleges selected 8% change 6 colleges selected 0% and 8% change 1 college selected 5% and 8% change 1 college selected 5% change 1 college selected 0% and 5% change 1 college selected 0%, 5% and 8% change 1 college selected 0% change
16 colleges contribute 100% employee rate for all offered plans 4 colleges contribute 100% employee rate for lowest cost plan 1 college contributes 92% employee rate for all offered plans 1 college contributes 85% employee rate for all offered plans
1Annualized based on 11 month’s actual.
SOhlson
Text Box
34
SOhlson
Text Box
Information Item 4.a.

HEALTH CARE REFORM IMPACTS
For 2014 the colleges participating in the Consortium health plans were provided the option to remain on their current benefit plans that have a grandfathered compliant status at an 8% rate change or each individual college could select to offer the newly introduced completely compliant benefit plans at 0% and 5% rate change levels. The new plans are positioned very favorably for future Health Care Reform requirements. Each college could offer any combination of plans to their employees and dependents.
A 3% to 5% impact on paid claims can be anticipated from the Health
Care Reform mandated benefit change requirements.
Health Care Reform fees for the Consortium health plans are expected to be $975,000 for 2014 and $705,000 for 2015 based on the current available information.
In 2015 the Employer Shared Responsibility mandate for employees working 30 hours or more will be effective. The Consortium proactively introduced a minimum essential coverage product that meets the mandate requirements into their portfolio in 2014 so that it is ready for the colleges to potentially use as an offering.
SOhlson
Text Box
35

Information Item 4.b. 2014 Employee Benefit Plans
1/27/2014
MIS
SIO
N S
TATE
MEN
TFC
SR
MC
del
iver
s co
mpr
ehen
sive
and
inno
vativ
e en
terp
rise-
wid
e ris
k m
anag
emen
t ser
vice
s an
d so
lutio
ns to
sup
port
the
educ
atio
nal
mis
sion
of t
he F
lorid
a C
olle
ge S
yste
m.
SOhlson
Text Box
36
SOhlson
Text Box
Information Item 4.b.

20
14
EM
PLO
YE
E B
EN
EF
IT P
LA
NS
Ove
rvie
w
The
Flor
ida
Col
lege
sSy
stem
Ris
kM
anag
emen
tCon
sorti
umis
plea
sed
tosh
are
with
you
our
2014
EMPL
OYE
EB
ENEF
ITPL
AN
offe
rings
.Th
ese
high
valu
epl
ans
have
been
secu
red
usin
gth
eco
llect
ive
purc
hasi
ngpo
wer
ofth
epa
rtici
patin
gco
llege
sth
roug
hfo
rmal
mar
ket
eval
uatio
nsby
lead
ing
cons
ultin
gfir
ms.
Ther
ear
eno
rate
infla
ting
com
mis
sion
sin
any
ofou
rof
ferin
gsan
dth
eco
mbi
ned
colle
geen
rollm
ent
pres
ents
man
yad
vant
ages
:
•la
rger
risk
pool
and
pred
icta
bilit
yof
clai
mco
sts
•fa
vora
ble
plan
rese
rves
•lo
wer
adm
inis
trativ
efe
es•
colle
ctiv
epu
rcha
sing
ofco
nsul
tant
serv
ices
•m
ore
favo
rabl
est
oplo
ssin
sura
nce
rate
s•
exte
nsiv
em
edic
alm
anag
emen
t
The
Con
sorti
umis
wel
lpos
ition
edan
dpr
epar
edto
supp
ort
each
indi
vidu
alco
llege
empl
oyee
bene
fitpl
anne
eds
and
obje
ctiv
es.
SOhlson
Text Box
37

MEM
BERS
HIP
•22
enro
lled
colle
ges
•15,
000
enro
lled
mem
ber
s•N
ew c
olle
ge e
nrol
lmen
t•N
ew m
embe
r enr
ollm
ent
•Enr
olle
d co
llege
rete
ntio
n•E
nrol
led
mem
ber r
eten
tion
•Billi
ng•F
eder
al a
nd S
tate
co
mpl
ianc
e m
ana
gem
ent
•22
enro
lled
colle
ges
•15,
000
enro
lled
mem
ber
s•N
ew c
olle
ge e
nrol
lmen
t•N
ew m
embe
r enr
ollm
ent
•Enr
olle
d co
llege
rete
ntio
n•E
nrol
led
mem
ber r
eten
tion
•Billi
ng•F
eder
al a
nd S
tate
co
mpl
ianc
e m
ana
gem
ent
MEM
BER
CA
RE
•Com
preh
ensiv
e w
elln
ess
prog
ram
with
mem
ber a
nd
colle
ge in
cent
ives
•Med
ical
con
ditio
n m
ana
gem
ent
•Ded
ica
ted
Ca
se
Man
agem
ent
•Per
form
ance
bas
ed
prov
ider
net
wor
ks•M
embe
r out
reac
h an
d en
gage
men
t•M
embe
r edu
catio
n•O
nlin
e se
lf he
lp to
ols
•Mob
ile a
pp fo
r sm
art
phon
e, d
roid
and
web
app
fo
r bla
ckbe
rry•A
cces
s to
loca
l Flo
rida
Blue
St
ores
(11
loca
tions
) for
se
rvic
e, c
are
coor
din
atio
n,
educ
atio
n an
d p
erso
nal
heal
th a
sses
smen
ts•I
n-N
etw
ork
Acc
ess t
o C
are
loca
lly, n
atio
nally
and
w
orld
wid
e
MA
NA
GEM
ENT &
M
ON
ITORI
NG
•Ann
ual a
ctua
rial
certi
ficat
ion
by S
tate
ap
prov
ed n
atio
nal
actu
aria
l con
sulti
ng fi
rm•A
nnua
l Sta
te 1
12.0
8 ac
tuar
ial f
iling
and
ap
prov
al•F
iscal
age
nt re
venu
e an
d
disb
urse
men
t ma
nage
men
t•A
nnua
l fun
din
g ra
te
dev
elop
men
t by
Plan
A
dm
inist
rato
r und
erw
riter
an
d re
view
ed b
y St
ate
appr
oval
act
uaria
l co
nsul
ting
firm
•Rec
over
y cr
edits
m
ana
gem
ent
•Cos
t and
util
izatio
n an
alys
is•P
aid
cla
ims a
naly
sis•C
laim
ad
min
istra
tion
and
st
op lo
ss in
sura
nce
aud
it•M
edic
al m
anag
emen
t au
dit
•Fin
anci
al a
udit
•Bus
ines
s Par
tner
ven
dor
ne
gotia
tions
and
con
tract
a
gree
men
ts
EVA
LUA
TION
&
SUPP
ORT
•Hea
lth c
are
refo
rm im
pact
s•H
ealth
refo
rm ta
x/fe
e im
pact
s•P
art-
time
empl
oyee
co
vera
ge•M
arke
tpla
ce v
end
or a
nd
prod
uct v
alue
pro
posit
ions
•Con
sulta
nt se
rvic
e va
lue
prop
ositi
ons
•Nat
iona
l, re
gion
al a
nd
ind
ustry
ben
chm
arki
ng•P
rivat
e ex
chan
ges v
alue
pr
opos
ition
s•A
utom
ated
enr
ollm
ent,
billin
g a
nd c
ompl
ianc
e ad
min
istra
tion
Self-
Insu
red
HEA
LTH
PRO
GRA
MM
anag
emen
t Ove
rvie
w
SOhlson
Text Box
38

ME
DIC
AL
ME
DIC
AL
PP
O B
lue
Op
tio
ns
03
76
9
PP
O B
lue
Op
tio
ns
03
35
9
PP
O B
lue
Op
tio
ns
35
62
PP
O B
lue
Op
tio
ns
35
66
PP
O B
lue
Op
tio
ns
03
90
0
HR
A B
lue
Op
tio
ns
33
59
HM
O B
lue
Ca
re 5
8
HM
OB
lue
Ca
re 5
1
HM
O B
lue
Ca
re 1
0
DV
De
nta
l & V
isio
n
Blu
eM
ed
ica
re P
PO
DE
NTA
LD
EN
TAL
Em
plo
yer
Pa
idP
PO
De
nta
l
Vo
lun
tary
P
PO
De
nta
l
Em
plo
yer
Pa
id
HM
O D
en
tal
Vo
lun
tary
H
MO
De
nta
l
VIS
ION
VIS
ION
Em
plo
yer
Pa
id V
isio
n
Vo
lun
tary
Vis
ion
EA
PE
AP
Em
plo
yee
A
ssis
tan
ce
P
rog
ram
LIF
EL
IFE
Em
plo
yee
Gro
up
T
erm
Lif
e
Insu
ran
ce
P
rog
ram
De
pe
nd
en
t L
ife
AN
CIL
LA
RY
AN
CIL
LA
RY
Sh
ort
Te
rm
Dis
ab
ility
Lo
ng
Te
rm
Dis
ab
ility
20
14
PR
OG
RA
M O
FF
ER
ING
SIn
div
idu
al C
olle
ge
Pla
n C
ho
ice
s
WE
LL
NE
SS
IN
CE
NT
IVE
PR
OG
RA
M…whe
re you
can
Be Health
y, Live well,
and Get Rew
arde
d!
BE
NE
FIT
S A
DM
INIS
TR
AT
ION
FO
RT
HC
OM
ING
SOhlson
Text Box
39

•8am‐8pm
, 365
day su
pport ‐
Employees
•De
dicated Supp
ort Team ‐HR
staff
•Re
allocate HR to strategic initiatives
•External IT su
pported system
•8am‐8pm
, 365
day su
pport ‐
Employees
•De
dicated Supp
ort Team ‐HR
staff
•Re
allocate HR to strategic initiatives
•External IT su
pported system
Peop
le
•Integrated
Premium Billing & Con
solidation
•Au
tomated
Enrollm
ent a
nd Carrie
r Feeds
•Re
duced effort to
enter, retrie
ve, access, and
analyze stored
data
•Integrated
Premium Billing & Con
solidation
•Au
tomated
Enrollm
ent a
nd Carrie
r Feeds
•Re
duced effort to
enter, retrie
ve, access, and
analyze stored
data
Process
•Synchron
ized exchange of p
articipant records
to/from HR staff, HR
IS sy
stem
s, carrie
rs and
payrolls
•Intuitive enrollm
ent system in
a single portal for all
bene
fits and do
cuments
•Synchron
ized exchange of p
articipant records
to/from HR staff, HR
IS sy
stem
s, carrie
rs and
payrolls
•Intuitive enrollm
ent system in
a single portal for all
bene
fits and do
cuments
Techno
logy
Be
ne
fits
Ad
min
istr
atio
n
Fort
hc
om
ing
A s
ing
le s
ou
rce
on
line
pla
tfo
rm s
up
po
rtin
g e
ach
c
olle
ge
s’ u
niq
ue
be
ne
fit
pla
n n
ee
ds
SOhlson
Text Box
40

ME
DIC
AL
PL
AN
SS
ele
cti
on
•$25
/ $4
0 Ph
ysician Office Cop
ay•U
rgen
t Care Ce
nter $35
In‐Network Co
pay
•$50
0/ $1,50
0 Calen
dar Y
ear D
eductib
le (C
YD)
•$5,00
0 / $
10,000
Out‐of P
ocket M
axim
um Per Person
•$15
/ $4
5 / $
65 Pharm
acy
•$25
/ $4
0 Ph
ysician Office Cop
ay•U
rgen
t Care Ce
nter $35
In‐Network Co
pay
•$50
0/ $1,50
0 Calen
dar Y
ear D
eductib
le (C
YD)
•$5,00
0 / $
10,000
Out‐of P
ocket M
axim
um Per Person
•$15
/ $4
5 / $
65 Pharm
acy
PP
O P
lan
Blu
eO
pti
on
s 3
56
2
•$25
Fam
ily Physic
ian Office Cop
ay
•Urgen
t Care Ce
nter CYD
+ 25%
In‐Network
•$1,00
0 Calend
ar Year D
eductib
le•$5,00
0 / $
10,000
Out‐of P
ocket M
axim
um•$15
/ $4
5 / $
65 Pharm
acy
•$25
Fam
ily Physic
ian Office Cop
ay
•Urgen
t Care Ce
nter CYD
+ 25%
In‐Network
•$1,00
0 Calend
ar Year D
eductib
le•$5,00
0 / $
10,000
Out‐of P
ocket M
axim
um•$15
/ $4
5 / $
65 Pharm
acy
PP
O P
lan
Blu
eO
pti
on
s 3
56
6
•$25
/ $4
0 Ph
ysician Office Cop
ay•U
rgen
t Care Ce
nter $35
Cop
ay•N
o Calend
ar Year D
eductib
le (C
YD)
•$5,00
0 / $
10,000
Out‐of P
ocket M
axim
um•$15
/ $4
5 / $
65 Pharm
acy
•$25
/ $4
0 Ph
ysician Office Cop
ay•U
rgen
t Care Ce
nter $35
Cop
ay•N
o Calend
ar Year D
eductib
le (C
YD)
•$5,00
0 / $
10,000
Out‐of P
ocket M
axim
um•$15
/ $4
5 / $
65 Pharm
acy
HM
O P
lan
Blu
eC
are
10
SOhlson
Text Box
41

ME
DIC
AL
PL
AN
SS
ele
cti
on
Co
nti
nu
ed
•PCP
Office Visit C
YD + 20%
•Urgen
t Care Ce
nter CYD
+ 20%
•$1,00
0/ $3,00
0 Calend
ar Year D
eductib
le (C
YD)
•$15
/ $4
5 / $
65 Pharm
acy
•$3,00
0 / $
9,00
0 Out‐of P
ocket M
axim
um•H
RA Accou
nt / De
bit C
ard Offsets ½
of the
Ded
uctib
le
Employee
$50
0, Employee
+ Spo
use $1
,000
, Employee
+
Family $1,50
0
PP
O P
lan
/ H
RA
Blu
eO
pti
on
s3
35
9
•$30
/ $5
0 Ph
ysician Office Cop
ay•U
rgen
t Care Ce
nter‐$5
0 Co
pay
•$60
0/ $1,80
0 Calen
dar Y
ear D
eductib
le (C
YD)
•$6,00
0 / $
12,000
Out‐of P
ocket M
axim
um•$15
/ $6
0 / $
100 Ph
armacy
•$30
/ $5
0 Ph
ysician Office Cop
ay•U
rgen
t Care Ce
nter‐$5
0 Co
pay
•$60
0/ $1,80
0 Calen
dar Y
ear D
eductib
le (C
YD)
•$6,00
0 / $
12,000
Out‐of P
ocket M
axim
um•$15
/ $6
0 / $
100 Ph
armacy
PP
O P
lan
Blu
eO
pti
on
s0
35
59
SOhlson
Text Box
42

ME
DIC
AL
PL
AN
SS
ele
cti
on
Co
nti
nu
ed
•$30
/ $5
0 Ph
ysician Office Cop
ay•U
rgen
t Care Ce
nter $80
Cop
ay•N
o Calend
ar Year D
eductib
le (C
YD)
•$5,00
0 / $
10,000
Out‐of P
ocket M
ax.
•$15
/ $6
0 / $
100 Ph
armacy
•$30
/ $5
0 Ph
ysician Office Cop
ay•U
rgen
t Care Ce
nter $80
Cop
ay•N
o Calend
ar Year D
eductib
le (C
YD)
•$5,00
0 / $
10,000
Out‐of P
ocket M
ax.
•$15
/ $6
0 / $
100 Ph
armacy
HM
O P
lan
Blu
eC
are
51
•$30
/ $5
0 Ph
ysician Office Cop
ay•U
rgen
t Care Ce
nter $65
Cop
ay
•Calen
dar Y
ear D
eductib
le (C
YD) $
600/$1
,800
•$6,00
0 / $
12,000
Out‐of P
ocket M
ax.
•$15
/ $4
5 / $
65 Pharm
acy
•$30
/ $5
0 Ph
ysician Office Cop
ay•U
rgen
t Care Ce
nter $65
Cop
ay
•Calen
dar Y
ear D
eductib
le (C
YD) $
600/$1
,800
•$6,00
0 / $
12,000
Out‐of P
ocket M
ax.
•$15
/ $4
5 / $
65 Pharm
acy
PP
O P
lan
Blu
eO
pti
on
s0
37
69
•$30
/ $5
0 Ph
ysician Office Cop
ay•U
rgen
t Care Ce
nter $80
Cop
ay•N
o Calend
ar Year D
eductib
le (C
YD)
•$6,00
0 / $
12,000
Out‐of P
ocket M
ax.
•$15
/ $4
5 / $
65 Pharm
acy
•$30
/ $5
0 Ph
ysician Office Cop
ay•U
rgen
t Care Ce
nter $80
Cop
ay•N
o Calend
ar Year D
eductib
le (C
YD)
•$6,00
0 / $
12,000
Out‐of P
ocket M
ax.
•$15
/ $4
5 / $
65 Pharm
acy
HM
O P
lan
Blu
eC
are
58
SOhlson
Text Box
43

ME
DIC
AL
PL
AN
SS
ele
cti
on
Co
nti
nu
ed
•Alte
rnative plan
for e
ligible employees that h
ave health
coverage
through anothe
r sou
rce.
•Den
tal
•Vision
•Alte
rnative plan
for e
ligible employees that h
ave health
coverage
through anothe
r sou
rce.
•Den
tal
•Vision
DV
Pla
n
De
nta
l & V
isio
n P
lan
•$35
/ $5
0 Ph
ysician Office Cop
ay•U
rgen
t Care Ce
nter ‐De
ductible + 50%
Coinsurance
•Calen
dar y
ear D
eductib
le (C
YD) $
1,50
0/$4,500
•Out of P
ocket M
ax: In‐Network $6
,350
/ $1
0,00
0•$10
Gen
eric Only Ph
armacy
•$35
/ $5
0 Ph
ysician Office Cop
ay•U
rgen
t Care Ce
nter ‐De
ductible + 50%
Coinsurance
•Calen
dar y
ear D
eductib
le (C
YD) $
1,50
0/$4,500
•Out of P
ocket M
ax: In‐Network $6
,350
/ $1
0,00
0•$10
Gen
eric Only Ph
armacy
PP
O P
lan
Blu
eO
pti
on
s0
39
00
(Pa
rt-T
ime
)
SOhlson
Text Box
44

BLU
EM
ED
ICA
RE
PL
AN
Se
lec
tio
n
•Med
icare eligible
•$10 / $
30 In
‐Network Ph
ysician Office Cop
ay•CY
D & 20%
Out‐of‐N
etwork Ph
ysician Office
•Ca
lend
ar Year D
eductib
le (C
YD) ‐
$0 In
‐Network/
$1,000
Out ‐of‐Network
•Out‐of P
ocket M
axim
um $1,000 In‐Network /
$3,000
Out ‐of‐Network.
•$150
Inpatie
nt H
ospital Care ‐Co
pay (per day 1‐7
for a
Med
icare covered stay in a network ho
spita
l)•$10 / $
40 / $70 Ph
armacy
Blu
eM
ed
ica
reP
PO
1
Fu
lly In
sure
d
Me
dic
are
Elig
ible
FLO
RID
A B
LUE
Blu
e C
ross
Blu
e S
hiel
d of
Flo
rida
www.floridablue.com
SOhlson
Text Box
45

PP
O D
EN
TAL
PL
AN
SS
ele
cti
on
•DED
UCT
IBLE: $5
0 Per p
erson pe
r calen
dar y
ear –
applies to Ba
sic and
Major Services.
•MAX
IMUM BEN
EFITS: $1,00
0 Calend
ar Year M
axim
um.
•PRE
VENTIVE
SER
VICE
S: N
o De
ductible –Provided
at 1
00% of PP
O provide
r fee
sche
dule fo
r Oral Examinations, Cleanings and
Fluoride Treatm
ents ‐tw
o pe
r calen
dar y
ear.
•BAS
IC SER
VICE
S: X‐Rays a
nd Diagnostic
Services, Periodo
ntics (Gum
Treatmen
t), End
odon
tic
(Roo
t Canals), O
ral Surgery and
Restorativ
e Services (Fillings), and are covered at 80 % of the
PP
O provide
r fee
sche
dule in‐network and 60
% non
‐PPO
network.
•MAJOR SERV
ICES: Crow
ns, Bridges, Full D
entures a
nd Partia
l Den
tures are covered at 50%
of
the PPO
provide
r fee
sche
dule in‐network and 40
% out‐of‐n
etwork.
•MISSING TOOTH
RULE: Teeth extracted prior to effective date are covered
COLLEG
E PP
O DEN
TAL
Employer Paid
Delta
Dental
Incentive Plan
www.deltade
ntal.com
•DED
UCT
IBLE: $5
0 Per p
erson pe
r calen
dar y
ear –
applies to Ba
sic and
Major Services.
•MAX
IMUM BEN
EFITS: $1,00
0 Calend
ar Year M
axim
um.
•PRE
VENTIVE
SER
VICE
S: N
o De
ductible –Provided
at 1
00% of PP
O provide
r fee
sche
dule, O
ral
Exam
inations, Cleanings and
Fluoride Treatm
ents ‐tw
o pe
r calen
dar y
ear.
•BAS
IC SER
VICE
S: X‐Rays a
nd Diagnostic
Services, Periodo
ntics (Gum
Treatmen
t), End
odon
tic
(Roo
t Canals), O
ral Surgery and
Restorativ
e Services (Fillings), and are covered at 80 % of the
PP
O provide
r fee
sche
dule in‐network and 60
% non
‐PPO
network.
•MAJOR SERV
ICES: Crow
ns, Bridges, Full D
entures a
nd Partia
l Den
tures a
re covered
at 5
0% of
the PP
O provide
r fee
sche
dule in‐network and 40
% out‐of‐n
etwork.
•MISSING TOOTH
RULE: Teeth extracted prior to effective date are covered
.
VOLU
NTA
RY PPO
DEN
TAL
Employee
Paid
Delta
Dental
Incentive Plan
www.deltade
ntal.com
SOhlson
Text Box
46

HM
O D
EN
TAL
PL
AN
SS
ele
cti
on
•DE
DU
CTI
BLE
: $0
•CO
PA
Y S
CH
ED
ULE
•MA
X. B
EN
EFI
T: N
/A•O
FFIC
E V
ISIT
: $5
•PR
EV
EN
TATI
VE
: $0
•FIL
LIN
G:
$0•C
RO
WN
: $2
45•R
OO
T C
AN
AL
$21
0•R
EM
OV
AL
OF
IMP
AC
TED
TO
OTH
: $5
0•C
OM
P. O
RTH
OD
ON
TIC
: $1
,850
•DE
DU
CTI
BLE
: $0
•CO
PA
Y S
CH
ED
ULE
•MA
X. B
EN
EFI
T: N
/A•O
FFIC
E V
ISIT
: $5
•PR
EV
EN
TATI
VE
: $0
•FIL
LIN
G:
$0•C
RO
WN
: $2
45•R
OO
T C
AN
AL
$21
0•R
EM
OV
AL
OF
IMP
AC
TED
TO
OTH
: $5
0•C
OM
P. O
RTH
OD
ON
TIC
: $1
,850
•DE
DU
CTI
BLE
: $0
•CO
PA
Y S
CH
ED
ULE
•MA
X. B
EN
EFI
T: N
/A•O
FFIC
E V
ISIT
: $5
•PR
EV
EN
TATI
VE
: $5
•FIL
LIN
G:
$12
•CR
OW
N:
$290
•RO
OT
CA
NA
L $
265
•RE
MO
VA
L O
F IM
PA
CTE
D T
OO
TH: $
50•C
OM
P. O
RTH
OD
ON
TIC
: $2
,095
•DE
DU
CTI
BLE
: $0
•CO
PA
Y S
CH
ED
ULE
•MA
X. B
EN
EFI
T: N
/A•O
FFIC
E V
ISIT
: $5
•PR
EV
EN
TATI
VE
: $5
•FIL
LIN
G:
$12
•CR
OW
N:
$290
•RO
OT
CA
NA
L $
265
•RE
MO
VA
L O
F IM
PA
CTE
D T
OO
TH:
$50
•CO
MP
. OR
THO
DO
NTI
C:
Cop
ay $
2,09
5
•DED
UCT
IBLE: $0
•COPA
Y SCHE
DULE
•MAX
IMUM BEN
EFIT : N/A
•OFFICE VISIT: $5
•PRE
VENTA
TIVE
: $0 ‐$4
5•FILLING: $0
‐$1
15•C
ROWN $14
5 ‐$4
85•R
OOT CA
NAL: $1
10 ‐$2
45•R
EMOVA
L OF IM
PACT
ED TOOTH
: $5
0 ‐$1
35•C
OMPR
EHEN
SIVE
ORT
HODO
NTICS: $2
,100
Child and
$2
,250
Adu
lt
•DED
UCT
IBLE: $0
•COPA
Y SCHE
DULE
•MAX
IMUM BEN
EFIT : N/A
•OFFICE VISIT: $5
•PRE
VENTA
TIVE
: $0 ‐$4
5•FILLING: $0
‐$1
15•C
ROWN $14
5 ‐$4
85•R
OOT CA
NAL: $1
10 ‐$2
45•R
EMOVA
L OF IM
PACT
ED TOOTH
: $5
0 ‐$1
35•C
OMPR
EHEN
SIVE
ORT
HODO
NTICS: $2
,100
Child and
$2
,250
Adu
lt
COLLEG
E HMO DEN
TAL
[DeltaCa
re USA
–48
N]
Employer Paid
Delta
Den
tal
www.deltade
ntal.com
•DED
UCT
IBLE: $0
•COPA
Y SCHE
DULE
•MAX
IMUM BEN
EFIT : N/A
•OFFICE VISIT: $5
•PRE
VENTA
TIVE
: $0
‐$4
5•FILLING: $0
‐$1
15•C
ROWN $14
5 ‐$4
85•R
OOT CA
NAL: $1
10 ‐$2
45•R
EMOVA
L OF IM
PACT
ED TOOTH
: $5
0 ‐$1
35•C
OMPR
EHEN
SIVE
ORT
HODO
NTICS: $2
,100
Child and
$2
,250
Adu
lt
•DED
UCT
IBLE: $0
•COPA
Y SCHE
DULE
•MAX
IMUM BEN
EFIT : N/A
•OFFICE VISIT: $5
•PRE
VENTA
TIVE
: $0
‐$4
5•FILLING: $0
‐$1
15•C
ROWN $14
5 ‐$4
85•R
OOT CA
NAL: $1
10 ‐$2
45•R
EMOVA
L OF IM
PACT
ED TOOTH
: $5
0 ‐$1
35•C
OMPR
EHEN
SIVE
ORT
HODO
NTICS: $2
,100
Child and
$2
,250
Adu
lt
VOLU
NTA
RY HMO DEN
TAL
[DeltaCa
re USA
48N
]Em
ployee
Paid
Delta
Den
tal
www.deltade
ntal.com
SOhlson
Text Box
47

VIS
ION
PL
AN
SS
ele
cti
on
•Well V
ision
Exam: $1
0 copay every 12
mon
ths
•Prescrip
tion Glasses: $1
0 copay fo
r Lenses Single visio
n, line
d bifocal, and
lined
trifo
cal len
ses e
very 12 mon
ths
•Frames: $8
5 allowance fo
r a wide selection of fram
es or2
0% off the am
ount over
your allowance
•Con
tacts (instead of glasses) e
very 12 mon
ths ‐
Up to $60
cop
ay fo
r you
r con
tact
lens exam (fitting and evaluatio
n) and
$12
0 allowance fo
r con
tacts len
s material.
•Laser Vision
Correction –Av
erage 15
% off the regular p
rice or
5% off the
prom
otional price. D
iscou
nts o
nly available from
con
tracted facilities.
COLLEG
E VISION
Employer Paid
VSP
www.vsp.com
•Well V
ision
Exam: $1
0 copay every 12
mon
ths
•Prescrip
tion Glasses: $1
0 copay fo
r Lenses Single visio
n, line
d bifocal, and
lined
trifo
cal len
ses e
very 12 mon
ths
•Frames: $8
5 allowance fo
r a wide selection of fram
es or2
0% off the am
ount
over you
r allowance
•Con
tacts (instead of glasses) e
very 12 mon
ths ‐
Up to $60
cop
ay fo
r you
r contact len
s exam (fitting and evaluatio
n) and
$12
0 allowance fo
r con
tacts len
s material.
•Laser Vision
Correction –Av
erage 15
% off the regular p
rice or
5% off the
prom
otional price. D
iscou
nts o
nly available from
con
tracted facilities.
VOLU
NTA
RY VISION
Employee
Paid
VSP
www.vsp.com
Rat
es G
uara
ntee
thro
ugh
2016
SOhlson
Text Box
48

EM
PLO
YE
E A
SS
ISTA
NC
E
PL
AN
(E
AP
)S
ele
cti
on
•Unlim
ited Short Term cou
nseling (1‐5 visits (FTF or
Teleph
one) per issue un
limite
d issue
s)•Co
verage fo
r all eligible (d
efined
by college) and
their
househ
old mem
bers
•Legal and
Financial Cou
nseling (first 3
0 minutes free
pe
r issue
......... unlim
ited issue
s)•Free
On‐line Will kit
•8 po
oled
hou
rs to
be used
for e
ither
employee/sup
ervisor o
rientations and
/or E
AP
worksho
ps•Unlim
ited CISD
's•Web
sitewith
5k+ se
lf he
lp web
assist to
pics
•Web
site with
web
inar library (over 1
50)
•Teleph
onic W
orklife
(no more than
5 re
quests in
1 day)
•Managem
ent R
esou
rce Ce
nter fo
r Sup
ervisors and
above
•Mandatory Referrals
•He
alth Fair A
tten
dance
•Co
nfiden
tial (Governe
d by HIPAA
) •Quarterly Utiliza
tion Re
ports
•De
dicated Accoun
t Executive
EMPLOYEE
ASSISTAN
CE
PROGRA
MHo
rizon
Health
Employer Paid
Per E
mployee
Per M
onth
(PEPM)
Each college has th
e authority
to define,
based on
their ind
ividual college ru
les,
policy or procedu
res w
ho m
ay be
considered
a fu
ll‐tim
e or
part‐tim
e em
ployee
for the
purpo
ses o
f fun
ding
the
mon
thly premium.
SOhlson
Text Box
49

EM
PLO
YE
E G
RO
UP
LIF
E
INS
UR
AN
CE
Se
lec
tio
n
•Life insurance be
nefits a
re determined
by
each college’s Bo
ard of Trustees
•Fully‐In
sured through UNUM
•The mon
thly ra
te per $1,000 of group
life
insurance coverage is $0.135 with
accidental
death and dism
embe
rment a
t $0.019.
•These fully–insured
rates a
re guaranteed
through calend
ar year 2
015.
EM
PLO
YE
E G
RO
UP
TE
RM
L
IFE
& A
D&
D C
OV
ER
AG
E
Fu
lly In
sure
d T
erm
Lif
e C
ove
rag
e
UN
UM
ww
w.u
nu
m.c
om
SOhlson
Text Box
50

DE
PE
ND
EN
T T
ER
M L
IFE
INS
UR
AN
CE
Se
lec
tio
n
•PLAN 1
Spou
se Amou
nt of C
overage
$5,000
Child
14 days to
6 m
onths
$500
Child
6 M
onths to 25
Years
$2,500
•PLAN 1
Spou
se Amou
nt of C
overage
$5,000
Child
14 days to
6 m
onths
$500
Child
6 M
onths to 25
Years
$2,500
DE
PE
ND
EN
T T
ER
M L
IFE
CO
VE
RA
GE
[a ride
r togrou
p term
life
and cann
ot be offered on
a stand‐alon
e basis
]
Fu
lly In
sure
d T
erm
Lif
e C
ove
rag
e
UN
UM
EM
PL
OY
EE
MO
NT
HL
Y P
LA
N C
OS
T P
ER
DE
PE
ND
EN
T U
NIT
PL
AN
1FS 627
.5575 Dep
ende
nt life coverage may not exceed 50
% of the
em
ployee's basic group
term
life coverage am
ount
•PLAN
2Spou
se Amou
nt of C
overage
$10,000
Child
14 days to
6 m
onths
$500
Child
6 M
onths to 25
Years
$5,000
•PLAN
2Spou
se Amou
nt of C
overage
$10,000
Child
14 days to
6 m
onths
$500
Child
6 M
onths to 25
Years
$5,000
DE
PE
ND
EN
T T
ER
M L
IFE
CO
VE
RA
GE
[a ride
r togrou
p term
life
and cann
ot be offered on
a stand‐alon
e basis
]
Fu
lly In
sure
d T
erm
Lif
e C
ove
rag
e
UN
UM
EM
PL
OY
EE
MO
NT
HL
Y P
LA
N C
OS
T P
ER
DE
PE
ND
EN
T U
NIT
PL
AN
2
FS 627
.5575 Dep
ende
nt life coverage may not exceed 50
% of the
em
ployee's basic group
term
life coverage am
ount
•PLAN
3•Spou
se Amou
nt of C
overage
$20,000
•Ch
ild 14 days to
6 m
onths
$500
•Ch
ild 6 M
onths to 25
Years
$10,000
•PLAN
3•Spou
se Amou
nt of C
overage
$20,000
•Ch
ild 14 days to
6 m
onths
$500
•Ch
ild 6 M
onths to 25
Years
$10,000
DE
PE
ND
EN
T T
ER
M L
IFE
CO
VE
RA
GE
[a ride
r togrou
p term
life
and cann
ot be offered on
a stand‐alon
e basis
]F
ully
In
sure
d T
erm
Lif
e C
ove
rag
eU
NU
ME
MP
LO
YE
E M
ON
TH
LY
PL
AN
CO
ST
PE
R D
EP
EN
DE
NT
UN
ITP
LA
N 3
FS 627
.557
5 Dep
ende
nt life coverage may not exceed 50
% of the
em
ployee's basic group
term
life coverage am
ount
SOhlson
Text Box
51

SH
OR
T T
ER
M D
ISA
BIL
ITY
Se
lec
tio
n
•Unu
m will customize
ben
efits to
match existing
plan
offe
red through college or u
niqu
e plan
preferred by college
•Unu
m will offe
r a 10%
savings v
ersus e
xisting plan
(sub
ject to
cen
sus a
nd plan inform
ation for
colleges <
500 eligible employees; su
bject to
expe
rience for colleges 5
00+ eligible employees)
•Unu
m will customize
ben
efits to
match existing
plan
offe
red through college or u
niqu
e plan
preferred by college
•Unu
m will offe
r a 10%
savings v
ersus e
xisting plan
(sub
ject to
cen
sus a
nd plan inform
ation for
colleges <
500 eligible employees; su
bject to
expe
rience for colleges 5
00+ eligible employees)
Sh
ort
Te
rm D
isa
bili
ty
Cu
sto
m P
lan
UNUM
Employer Paid & Volun
tary
*Rates 10%
lower
than
current plan
•BE
NEFIT: 60% of b
asic weekly earnings
•MAX
IMUM: $1,000
•ELIM
INATION PER
IOD: 7 days A
cciden
t and
Sickness
•MAX
IMUM DURA
TION: 12
weeks
•BE
NEFIT: 60% of b
asic weekly earnings
•MAX
IMUM: $1,000
•ELIM
INATION PER
IOD: 7 days A
cciden
t and
Sickness
•MAX
IMUM DURA
TION: 12
weeks
Sh
ort
Te
rm D
isa
bili
ty
Ba
sic
Pla
nUNUM
Employer Paid
Voluntary: age bande
d
Enrollm
ent sup
port fo
r each individu
al college available through Unu
m
SOhlson
Text Box
52

LON
G T
ER
M D
ISA
BIL
ITY
Se
lec
tio
n
•Unu
m will customize
ben
efits to
match existing
plan
offe
red through college or u
niqu
e plan
preferred by college
•Unu
m will offe
r a 10%
savings v
ersus e
xisting plan
(sub
ject to
cen
sus a
nd plan inform
ation for
colleges <
1,000 eligible employees; su
bject to
expe
rience for colleges 1
,000
+ eligible
employees)
•Unu
m will customize
ben
efits to
match existing
plan
offe
red through college or u
niqu
e plan
preferred by college
•Unu
m will offe
r a 10%
savings v
ersus e
xisting plan
(sub
ject to
cen
sus a
nd plan inform
ation for
colleges <
1,000 eligible employees; su
bject to
expe
rience for colleges 1
,000
+ eligible
employees)
Cu
sto
m P
lan
UNUM
Employer Paid & Volun
tary
*Rates 10%
lower th
an
current p
lan
•BE
NEFIT: 60% of b
asic weekly earnings
•MAX
IMUM: $5,000
•Own Occup
ation protectio
n of 2 years
•ELIM
INATION PER
IOD: 90 days
•MAX
IMUM DURA
TION: To age 65
•Includ
es Partia
l and
Residual disa
bility, Survivor
Bene
fit, W
aiver o
f Premium, and
3/12 pre‐existing
cond
ition
s lim
itatio
n•Worldwide Em
ergency Travel Assistance includ
ed
Ba
sic
Pla
nUNUM
Voluntary: age bande
d
Enrollm
ent sup
port fo
r each individu
al college available through Unu
m
SOhlson
Text Box
53

WELLN
ESS INCE
NTIVE
PR
OGRA
M DESIGN
•Defined
health
focus ‐
gene
ral health
risks
•Recognitio
n of varying
de
grees o
f program
en
gagemen
t•Inclusiv
e set o
f wellness
incentive activ
ities
•Add
ition
al ways to earn
points!
•Total incentive reward
available increased from
$5
0.00
to $17
5.00
!•P
oints c
an be rede
emed
for g
ift cards and
/or
merchandise!
•Tim
ing 12
mon
th period
WELLN
ESS AC
TIVITY
TYPES
•Personal H
ealth
Assessmen
t (PHA
)(with
Biom
etric
screening)
shou
ld be the baseline
activ
ity with
subseq
uent
wellness p
rogram
s focused and tailored to
individu
al PHA
results
•Health
Trackers h
elp
chart h
ealth
measuremen
ts ,
progress over tim
e and
is sharable with
providers!
•Settin
g an
online goal
with
My He
alth
Assistant.
EMPLOYEE RE
WAR
DS
STRU
CTURE
•As participating eligible
employees work toward
their w
ellness g
oals,
they will earn po
ints
rede
emable fo
r brand
name merchandise or
gift cards.
•Earn 10
0 po
ints‐earn
$25 reward.
•Red
eem up to 700
po
ints fo
r a to
tal of
$175
.00 to sh
op fo
r rewards!
•As participating eligible
employees work toward
their w
ellness g
oals,
they will earn po
ints
rede
emable fo
r brand
name merchandise or
gift cards.
•Earn 10
0 po
ints‐earn
$25 reward.
•Red
eem up to 700
po
ints fo
r a to
tal of
$175
.00 to sh
op fo
r rewards!
INDIVIDUAL
COLLEG
E RE
WAR
D STR
UCT
URE
•Overall Program
Participation
•50%
participation in th
e
Person
al Health
Assessmen
t on campu
s at Health
Fair =
$10
,000
•Total Points E
arne
d•1
stPlace = $5
,000
•2ndPlace = $2
,500
•3rdPlace = $1
,000
•Overall Program
Participation
•50%
participation in th
e
Person
al Health
Assessmen
t on campu
s at Health
Fair =
$10
,000
•Total Points E
arne
d•1
stPlace = $5
,000
•2ndPlace = $2
,500
•3rdPlace = $1
,000
WE
LL
NE
SS
INC
EN
TIV
EP
RO
GR
AM
SOhlson
Text Box
54

Information Item 4.c. Health Care Reform

HE
ALT
H C
AR
E R
EFO
RM
R
EC
AP
OF
FIN
AN
CIA
L IM
PA
CT
ITE
MS
Mat
thew
Sno
ok, P
artn
er
Not
Pee
r R
evie
wed
SOhlson
Text Box
55
SOhlson
Text Box
Information Item 4.c.

© 2
013
Mer
cer
This
is fo
r inf
orm
atio
nal p
urpo
ses
only
, and
is n
ot in
tend
ed to
be
used
as
lega
l adv
ice.
Pat
ient
-Cen
tere
d O
utco
mes
Res
earc
h In
stitu
te (P
CO
RI)
Fee
Ove
rvie
w
Purp
ose
-To
fund
a fe
dera
l pro
gram
cre
ated
by
AC
A to
rese
arch
the
use
of
com
para
tive
effe
ctiv
enes
s in
med
ical
pra
ctic
e.
Fee
appl
ies
to:
Fee
does
not
app
ly to
:
•In
sure
d an
d se
lf-in
sure
d he
alth
pl
ans.
•R
etire
e-on
ly p
lans
.
•C
erta
in c
arve
d-ou
t Rx
bene
fits.
•C
erta
in H
RA
bene
fits.
•S
tand
-alo
ne d
enta
l and
vis
ion
plan
s.
•E
AP
s, w
elln
ess,
and
dis
ease
m
anag
emen
t pla
ns th
at d
on’t
prov
ide
sign
ifica
nt b
enef
its in
the
natu
re o
f m
edic
al c
are/
treat
men
t.
•O
n-si
te c
linic
s.
•St
op-lo
ss.
•H
ealth
-FS
A if
HIP
AA e
xcep
ted
bene
fit.
•R
eins
uran
ce p
olic
ies.
SOhlson
Text Box
56
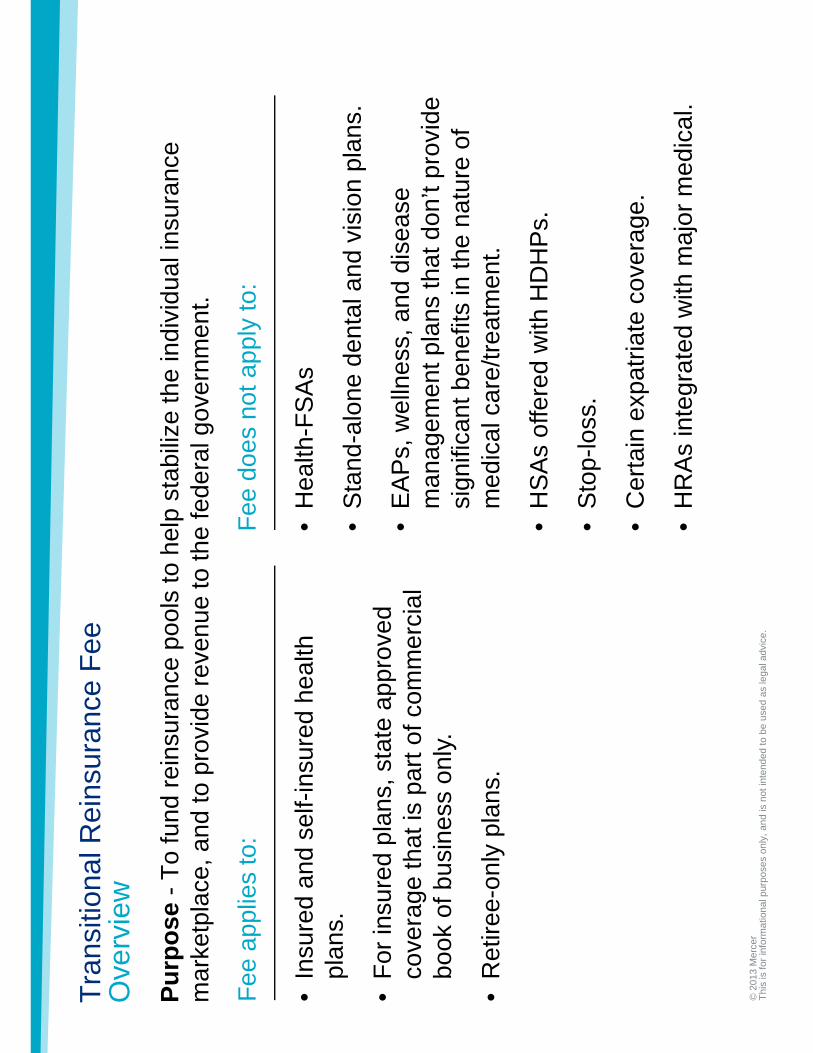
© 2
013
Mer
cer
This
is fo
r inf
orm
atio
nal p
urpo
ses
only
, and
is n
ot in
tend
ed to
be
used
as
lega
l adv
ice.
Tran
sitio
nal R
eins
uran
ce F
eeO
verv
iew
Purp
ose
-To
fund
rein
sura
nce
pool
s to
hel
p st
abili
ze th
e in
divi
dual
insu
ranc
e m
arke
tpla
ce, a
nd to
pro
vide
reve
nue
to th
e fe
dera
l gov
ernm
ent.
Fee
appl
ies
to:
Fee
does
not
app
ly to
:
•In
sure
d an
d se
lf-in
sure
d he
alth
pl
ans.
•Fo
r ins
ured
pla
ns, s
tate
app
rove
d co
vera
ge th
at is
par
t of c
omm
erci
al
book
of b
usin
ess
only.
•R
etire
e-on
ly p
lans
.
•H
ealth
-FS
As
•S
tand
-alo
ne d
enta
l and
vis
ion
plan
s.
•E
AP
s, w
elln
ess,
and
dis
ease
m
anag
emen
t pla
ns th
at d
on’t
prov
ide
sign
ifica
nt b
enef
its in
the
natu
re o
f m
edic
al c
are/
treat
men
t.
•H
SA
s of
fere
d w
ith H
DH
Ps.
•S
top-
loss
.
•C
erta
in e
xpat
riate
cov
erag
e.
•H
RA
s in
tegr
ated
with
maj
or m
edic
al.
SOhlson
Text Box
57

© 2
013
Mer
cer
This
is fo
r inf
orm
atio
nal p
urpo
ses
only
, and
is n
ot in
tend
ed to
be
used
as
lega
l adv
ice.
Tran
sitio
nal R
eins
uran
ce F
eeIm
porta
nt D
ates
and
Dea
dlin
es
Mec
hani
sm fo
r pay
men
t is
not y
et k
now
n, b
ut…
By
Nov
. 15,
201
4
Con
trib
utin
g en
titie
s m
ust
subm
it to
HH
S av
erag
e nu
mbe
r of
cov
ered
live
s
By
Dec
. 15,
201
4 (o
r 30
days
afte
r pr
evio
us d
ate)
HH
S no
tifie
s co
ntrib
utin
g en
tity
of a
mou
nt
due
30 d
ays
afte
r H
HS
notif
icat
ion
Paym
ent d
ue
to H
HS
(typi
cally
late
20
14 /
early
201
5)
SOhlson
Text Box
58

© 2
013
Mer
cer
This
is fo
r inf
orm
atio
nal p
urpo
ses
only
, and
is n
ot in
tend
ed to
be
used
as
lega
l adv
ice.
Hea
lth C
are
Ref
orm
Fee
sS
umm
ary
Dire
ct F
ees
Who
Pay
sD
ueH
ow m
uch
How
pai
dPe
rmis
sibl
e to
pay
from
ER
ISA
plan
as
sets
Perm
issi
ble
to p
ass
thro
ugh
to
empl
oyee
Patie
nt-
Cen
tere
d O
utco
mes
R
esea
rch
Inst
itute
(P
CO
RI)
Fee
Fully
insu
red
plan
s: In
sure
r
Sel
f-ins
ured
pl
ans:
grou
p he
alth
pla
n sp
onso
r
Ann
ually
by
July
31
of c
alen
dar
year
afte
r clo
se
of p
lan
year
$1 P
MP
Y fo
r 20
12. I
ncre
ases
to
$2
PM
PY
for
2013
, and
in
dexe
d th
erea
fter*
.
Form
720
, Q
uarte
rly
Fede
ral E
xcis
e Ta
x R
etur
n
Insu
red
plan
s:ye
s
Sel
f-ins
ured
pl
ans:
no
Insu
red
plan
s:ye
s
Sel
f-ins
ured
pl
ans:
no
Tran
sitio
nal
Rei
nsur
ance
Fe
e
Insu
ranc
e pr
ovid
ers;
sel
f-in
sure
d pl
an
spon
sor i
s lia
ble
(but
TPA
or A
SO
m
ay tr
ansf
er fe
e at
pla
n’s
disc
retio
n)
With
in 3
0 da
ys o
f no
tific
atio
n fro
m
HH
S
Est
imat
ed $
63
PM
PY
for
2014
**,
decr
easi
ng to
$4
0 in
201
5***
an
d $2
5 in
20
16**
*. C
urre
ntly
will
suns
et a
fter
2016
.
TBD
Yes
Yes
*A
fter 2
013,
fee
incr
ease
is a
n es
timat
e ba
sed
on N
atio
nal H
ealth
Exp
endi
ture
Pro
ject
ions
**B
ased
on
HH
S e
stim
ate
issu
ed o
n M
arch
11,
201
3 in
fina
l rul
e**
*M
erce
r est
imat
es.
SOhlson
Text Box
59

© 2
013
Mer
cer
This
is fo
r inf
orm
atio
nal p
urpo
ses
only
, and
is n
ot in
tend
ed to
be
used
as
lega
l adv
ice.
2014
Req
uire
d P
lan
Cha
nges
and
Wha
t The
y Ty
pica
lly C
ost
•20
14 C
hang
es –
1%-6
%*
–D
epen
dent
cov
erag
e to
age
26
for a
ny c
over
ed e
mpl
oyee
’s c
hild
–N
o an
nual
dol
lar l
imits
on
esse
ntia
l hea
lth b
enef
its–
No
pre-
exis
ting
cond
ition
lim
its–
No
wai
ting
perio
d ov
er 9
0 da
ys–
Add
ition
al s
tand
ards
for n
on-g
rand
fath
ered
hea
lth p
lans
, inc
ludi
ng li
mits
on
out-
of-p
ocke
t max
imum
s, p
rovi
der n
ondi
scrim
inat
ion,
and
cov
erag
e of
rout
ine
med
ical
cos
ts o
f clin
ical
tria
l par
ticip
ants
* Typ
ical
cos
ts. H
ighe
r or l
ower
resu
lts c
ould
occ
ur d
epen
ding
on
orig
inal
des
igns
and
oth
er fa
ctor
s.
SOhlson
Text Box
60

© 2
013
Mer
cer
This
is fo
r inf
orm
atio
nal p
urpo
ses
only
, and
is n
ot in
tend
ed to
be
used
as
lega
l adv
ice.
Em
ploy
er M
anda
te fo
r 201
5Sh
ared
Res
pons
ibilit
y
•La
rge
empl
oyer
s –
thos
e w
ith a
t lea
st 5
0 FT
E e
quiv
alen
tsin
pre
viou
s ca
lend
ar y
ear
–m
ay fa
ce p
enal
ties
if at
leas
t one
FTE
rece
ives
tax-
subs
idiz
ed b
enef
its th
roug
h a
publ
ic h
ealth
exc
hang
e
•Th
ese
empl
oyer
s m
ust o
ffer m
inim
um e
ssen
tial c
over
age
to “s
ubst
antia
lly a
ll” F
TEs
or fa
ce a
pen
alty
of $
2,00
0 m
ultip
lied
by th
e nu
mbe
r of F
TEs
(not
cou
ntin
g fir
st 3
0 FT
Es)
–C
over
age
offe
red
to 9
5% o
f FT
empl
oyee
s an
d de
pend
ent c
hild
ren
cons
ider
ed
offe
r to
“sub
stan
tially
all”
–FT
E is
any
em
ploy
ee w
ho w
orks
on
aver
age
30 o
r mor
e ho
urs
per w
eek
–M
ust o
ffer t
o FT
Es
and
thei
r dep
ende
nt c
hild
ren
unde
r age
26
(but
not
requ
ired
to o
ffer t
o sp
ouse
s or
dom
estic
par
tner
s)
•E
mpl
oyer
s of
ferin
g m
inim
um e
ssen
tial c
over
age
may
stil
l fac
e pe
nalti
es if
cov
erag
e do
es n
ot h
ave
a va
lue
of a
t lea
st 6
0% o
r is
not “
affo
rdab
le” a
s de
fined
in
regu
latio
ns.
–P
enal
ty is
$3,
000
for e
ach
empl
oyee
rece
ivin
g ta
x-su
bsid
ized
ben
efits
thro
ugh
a pu
blic
hea
lth e
xcha
nge
(unl
ess
abov
e pe
nalty
is s
mal
ler)
SOhlson
Text Box
61

© 2
013
Mer
cer
This
is fo
r inf
orm
atio
nal p
urpo
ses
only
, and
is n
ot in
tend
ed to
be
used
as
lega
l adv
ice.
Janu
ary
28, 2
014
And
Fur
ther
Into
the
Futu
re20
18 E
xcis
e Ta
x on
Hig
h-co
st P
lans
•40
% e
xcis
e ta
x st
artin
g in
201
8 on
“hig
h co
st” e
mpl
oyer
-spo
nsor
ed c
over
age.
–E
mpl
oyee
s in
clud
e fo
rmer
em
ploy
ees
and
surv
ivin
g sp
ouse
s.•
Initi
al c
ap s
et a
t $10
,200
/sel
f-onl
y an
d $2
7,50
0 “c
over
age
othe
r tha
n se
lf-on
ly” (
fam
ily).
–H
ighe
r thr
esho
lds
($11
,850
/$30
,950
) for
retir
ees
and
wor
kers
in h
igh-
risk
prof
essi
ons.
•B
enef
it ad
min
istra
tors
resp
onsi
ble
for t
ax fo
r sel
f-ins
ured
cov
erag
e.•
No
guid
ance
has
bee
n is
sued
yet
rega
rdin
g fil
ing
proc
ess.
•A
ggre
gate
cos
t det
erm
ined
usi
ng a
met
hodo
logy
sim
ilar t
o th
at u
sed
for d
eter
min
ing
appl
icab
le C
OB
RA
pre
miu
ms
•C
over
age
incl
uded
in th
e ex
cise
tax
calc
ulat
ion:
–M
edic
al–
Con
tribu
tions
to (a
nd c
erta
in re
imbu
rsem
ents
from
) a h
ealth
FS
A–
Em
ploy
er c
ontri
butio
ns to
an
HR
A.
–E
mpl
oyee
Ass
ista
nce
Pro
gram
s
•C
over
age
excl
uded
from
the
exci
se ta
x ca
lcul
atio
n:–
Acc
iden
t and
dis
abili
ty in
sura
nce,
–
Sta
nd-a
lone
, ins
ured
den
tal a
nd v
isio
n pl
ans.
–S
peci
fied
illne
ss o
r fix
ed in
dem
nity
insu
ranc
e, if
pai
d fo
r on
an a
fter-
tax
basi
s.
SOhlson
Text Box
62

© 2
013
Mer
cer
This
is fo
r inf
orm
atio
nal p
urpo
ses
only
, and
is n
ot in
tend
ed to
be
used
as
lega
l adv
ice.
1/28
/201
4
Mer
cer h
as p
repa
red
thes
e pr
ojec
tions
exc
lusi
vely
for t
he F
lorid
a C
olle
ge S
yste
m R
isk
Man
agem
ent C
onso
rtiu
m
(FC
SRM
C),
to e
stim
ate
the
rang
e of
the
impa
ct o
f fed
eral
Hea
lth C
are
Ref
orm
. The
se e
stim
ates
may
not
be
used
or
relie
d up
on b
y an
y ot
her p
arty
or f
or a
ny o
ther
pur
pose
than
for w
hich
they
wer
e is
sued
by
Mer
cer.
Mer
cer i
s no
t re
spon
sibl
e fo
r the
con
sequ
ence
s of
any
una
utho
rized
use
.
All
proj
ectio
ns a
re b
ased
on
the
info
rmat
ion
and
data
ava
ilabl
e at
a p
oint
in ti
me
and
the
proj
ectio
ns a
re n
ot a
gu
aran
tee
of re
sults
whi
ch m
ight
be
achi
eved
. The
pro
ject
ions
are
sub
ject
to u
nfor
esee
n an
d ra
ndom
eve
nts
and
so
mus
t be
inte
rpre
ted
as h
avin
g a
pote
ntia
lly w
ide
rang
e of
var
iabi
lity
from
the
estim
ates
.
Furt
her,
the
estim
ates
set
fort
h in
this
repo
rt h
ave
been
pre
pare
d be
fore
all
regu
latio
ns n
eede
d to
impl
emen
t the
Pat
ient
Pr
otec
tion
and
Affo
rdab
le C
are
Act
(PPA
CA
) and
Hea
lth C
are
Educ
atio
n an
d R
econ
cilia
tion
Act
(HC
ERA
) hav
e be
en
issu
ed, i
nclu
ding
cla
rific
atio
ns a
nd te
chni
cal c
orre
ctio
ns, a
nd w
ithou
t gui
danc
e on
com
plex
fina
ncia
l cal
cula
tions
that
m
ay b
e re
quire
d. (F
or e
xam
ple,
som
e H
ealth
Car
e R
efor
m p
rovi
sion
s w
ill li
kely
invo
lve
calc
ulat
ions
at t
he in
divi
dual
em
ploy
ee le
vel.)
Acc
ordi
ngly
, the
se e
stim
ates
are
not
Act
uaria
l Opi
nion
s.FC
SRM
C i
s re
spon
sibl
e fo
r all
finan
cial
an
d de
sign
dec
isio
ns re
gard
ing
PPA
CA
and
HC
ERA
.Su
ch d
ecis
ions
shou
ld b
e m
ade
only
afte
r FC
SRM
C ‘s
car
eful
co
nsid
erat
ion
of a
ltern
ativ
e fu
ture
fina
ncia
l con
ditio
ns a
nd le
gisl
ativ
e sc
enar
ios,
and
not
sol
ely
on th
e ba
sis
of th
e es
timat
es il
lust
rate
d he
re.
FCSR
MC
und
erst
ands
that
Mer
cer i
s no
t eng
aged
in th
e pr
actic
e of
law
and
this
repo
rt, w
hich
may
incl
ude
com
men
ting
on le
gal i
ssue
s or
regu
latio
ns, d
oes
not c
onst
itute
and
is n
ot a
sub
stitu
te fo
r leg
al a
dvic
e. A
ccor
ding
ly,
Mer
cer r
ecom
men
ds th
at F
CSR
MC
sec
ures
the
advi
ce o
f com
pete
nt le
gal c
ouns
el w
ith re
spec
t to
any
lega
l mat
ters
re
late
d to
this
repo
rt o
r oth
erw
ise.
The
info
rmat
ion
cont
aine
d in
this
doc
umen
t and
in a
ny a
ttach
men
ts is
not
inte
nded
by
Mer
cer t
o be
use
d, a
nd it
can
not
be u
sed,
for t
he p
urpo
se o
f avo
idin
g pe
nalti
es u
nder
the
Inte
rnal
Rev
enue
Cod
e or
impo
sed
by a
ny le
gisl
ativ
e bo
dy o
n th
e ta
xpay
er o
r pla
n sp
onso
r.
SOhlson
Text Box
63

Ser
vice
s pr
ovid
ed b
y M
erce
r Hea
lth &
Ben
efits
LLC
.
SOhlson
Text Box
64

Information Item 5.a. Property/Casualty Financial Highlights
as of November 2013
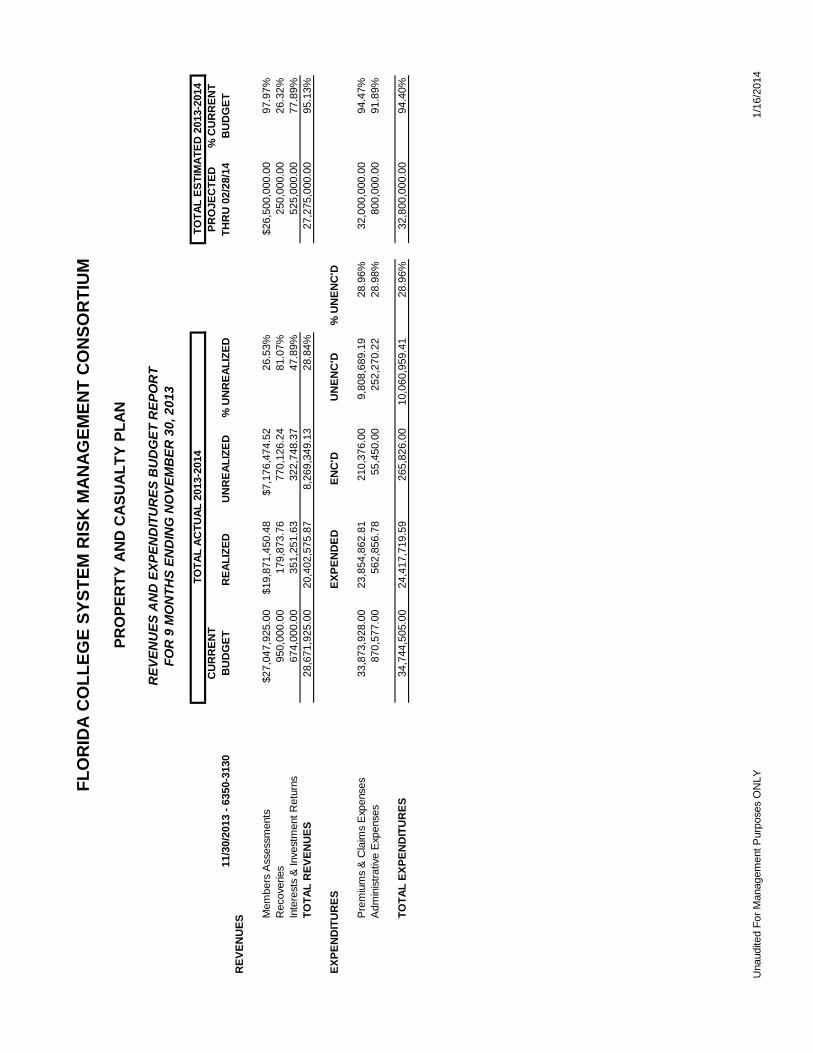
Una
udite
d Fo
r Man
agem
ent P
urpo
ses
ON
LY1/
16/2
014
11/3
0/20
13 -
6350
-313
0C
UR
REN
T B
UD
GET
REA
LIZE
DU
NR
EALI
ZED
% U
NR
EALI
ZED
PRO
JEC
TED
TH
RU
02/
28/1
4%
CU
RR
ENT
BU
DG
ETR
EVEN
UES
Mem
bers
Ass
essm
ents
$27,
047,
925.
00$1
9,87
1,45
0.48
$7,1
76,4
74.5
226
.53%
$26,
500,
000.
0097
.97%
Rec
over
ies
950,
000.
0017
9,87
3.76
770,
126.
2481
.07%
250,
000.
0026
.32%
Inte
rest
s &
Inve
stm
ent R
etur
ns67
4,00
0.00
351,
251.
6332
2,74
8.37
47.8
9%52
5,00
0.00
77.8
9%TO
TAL
REV
ENU
ES28
,671
,925
.00
20,4
02,5
75.8
78,
269,
349.
1328
.84%
27,2
75,0
00.0
095
.13%
EXPE
ND
ITU
RES
EXPE
ND
EDEN
C'D
UN
ENC
'D%
UN
ENC
'D
Pre
miu
ms
& C
laim
s E
xpen
ses
33,8
73,9
28.0
0
23,8
54,8
62.8
1
21
0,37
6.00
9,80
8,68
9.19
28
.96%
32,0
00,0
00.0
0
94.4
7%A
dmin
istra
tive
Exp
ense
s87
0,57
7.00
562,
856.
78
55,4
50.0
0
25
2,27
0.22
28.9
8%80
0,00
0.00
91
.89%
TOTA
L EX
PEN
DIT
UR
ES34
,744
,505
.00
24
,417
,719
.59
265,
826.
00
10
,060
,959
.41
28.9
6%32
,800
,000
.00
94
.40%
TOTA
L ES
TIM
ATED
201
3-20
14
FLO
RID
A C
OLL
EGE
SYST
EM R
ISK
MA
NA
GEM
ENT
CO
NSO
RTI
UM
PRO
PER
TY A
ND
CAS
UAL
TY P
LAN
REV
ENU
ES A
ND
EXP
END
ITU
RES
BU
DG
ET R
EPO
RT
TOTA
L AC
TUAL
201
3-20
14
FOR
9 M
ON
THS
END
ING
NO
VEM
BER
30,
201
3
SOhlson
Text Box
65
SOhlson
Text Box
Information Item 5.a.

Florida College System Risk Management ConsortiumProperty and Casualty PlanStatement of Net Position
November 30, 2013 and 2012
Unaudited- For Management Purposes ONLY 1/16/2014
FY FY2013-14 2012-13
ASSETS
CASH IN BANKS 102,653.91$ 4,926,341.28$
INVESTMENT STATE BOARD OF ADMIN. (1) 4,996,719.74 4,789,046.50 INVESTMENT SPECIAL PURPOSE INVESTMENT ACCT. 38,868,696.91 41,336,282.57
CASH INVESTMENTS - STATE INVESTMENT POOLS 43,865,416.65 46,125,329.07
INVESTMENT SECURITIES - Managed Account (2) 6,222,366.89 6,181,284.78 UNREALIZED HOLDING GAIN OR (LOSS) ON SECURITIES 9,930.87 31,556.04
MANAGED INVESTMENTS AVAILABLE FOR SALE 6,232,297.76 6,212,840.82
ACCRUED INTEREST RECEIVABLE 10,842.49 18,186.78
A/R FACILITIES USE 3,229.46 3,632.61 A/R OTHER SPECIAL ASSESSMENT 75,417.69 2,004.50 PREPAID EXPENSES - -
PREMIUMS RECEIVABLE & PREPAYMENTS 78,647.15 5,637.11
RESTRICTED DEPOSIT (3) 4,737,396.00
PROPERTY AND EQUIPMENT - NET DEPRECIATION 41,854.26 56,809.67
TOTAL ASSETS 55,069,108.22 57,345,144.73
LIABILITIES
CLAIMS INCURRED BUT NOT REPORTED OR PAID 23,901,000.00 22,603,000.00
ACCOUNTS PAYABLE - CLAIMS 186,296.96 137,444.36
LIABILITY FOR LOSSES INCURRED 24,087,296.96 22,740,444.36
UNEARNED FUNDING ASSESSMENT REVENUE 7,421,889.46 7,062,245.28 PREPAID INSURANCE PREMIUMS (5,692,351.03) (5,470,561.04)
UNEARNED FUNDING ASSESSMENTS - NET OF PREPAID INSURANCE PREMIUMS 1,729,538.43 1,591,684.24
ACCOUNTS PAYABLE - OPERATIONS 21,348.02 38,013.63
ACCRUED LIABILITY - COMPENSATED ABSENCES 52,437.05 46,349.22
TOTAL LIABILITIES 25,890,620.46 24,416,491.45 NET POSITIONUNDESIGNATED 28,178,487.76 31,928,653.28
DESIGNATED FOR CYBER RISK LOSS CONTINGENCY 1,000,000.00 1,000,000.00
TOTAL NET POSITION 29,178,487.76$ 32,928,653.28$
(1) Includes $221,735.28 of SBA Fund B shares (Balance of $184,414.70 plus unrealized gain of $37,320.58)(2) Investment Securities includes $1,489,870.40 funds collateral held by US Bank- all of which has been released as of December 05, 2013(3) Restricted Deposit represents collateral funds held in deposit by previous Workers Compensation Carrier- reduced by $28,139.34 as of December 05, 2013
SOhlson
Text Box
66

Florida College System Risk Management ConsortiumProperty and Casualty Plan
Statement of Revenues, Expenses and Changes in Net Position
For month ended November 30, 2013 and 2012
Unaudited For Management Purposes ONLY 1/16/2014
FY FY2013-14 2012-13
REVENUES
ALLIED HEALTH ASSESSMENT 236,812.07$ 243,260.76$ ANNUAL ASSESSMENT 17,550,536.03 16,483,097.25 FACILITIES USE ASSESSMENT 43,791.47 44,077.02 INTERCOLLEGIATE ASSESSMENT 1,189,206.32 1,170,695.75 EDUCATION / TRAINING 264,815.64 231,013.99 CYBER RISK ASSESSMENT 135,000.00 250,000.00 WC SIR ASSESSMENT 177,821.59 177,390.45 OTHER SPECIAL ASSESSMENT 273,467.36 594,125.18
PREMIUMS EARNED - Members Assessments 19,871,450.48 19,193,660.40
ANNUAL ASSESSMENTS (14,134,468.17) (13,360,163.83)
WC - CARRIER AUDIT (PRIOR YEAR) (13,611.00) (27,263.00) WC SIR ASSESSMENT (182,536.56) (177,390.45) SPECIAL ASSESSMENTS (268,461.55) (594,125.18)
PREMIUMS CEDED TO REINSURERS (14,599,077.28) (14,158,942.46)
NET PREMIUMS EARNED 5,272,373.20 5,034,717.94
INTEREST EARNED FROM BANK 8,719.36 INTEREST EARNED ON INVESTMENT - SBA 5,261.84 9,200.28 INTEREST EARNED ON INVESTMENT - SPIA 311,846.81 667,929.76 INTEREST EARNED ON INVESTMENTS - Managed Account 52,835.61 74,714.51
INVESTMENT INCOME 369,944.26 760,563.91
REALIZED GAIN OR (LOSS) ON SALE OF SECURITIES (34,614.23) (4,841.34) UNREALIZED GAIN OR (LOSS) ON SALE OF SECURITIES 16,133.51 81,654.06
NET GAIN (LOSS) ON INVESTMENTS (18,480.72) 76,812.72
TOTAL REVENUES 5,623,836.74$ 5,872,094.57$
EXPENSES
INCURRED CLAIMS 8,380,694.67 8,019,763.78 INCURRED CLAIMS - Boiler & Machinery 153,158.35 - INCURRED CLAIMS - Cyber Risk 89,944.51 - RECOVERIES (179,873.76) (764,680.77)
INCURRED CLAIMS 8,443,923.77 7,255,083.01
CLAIM SERVICING - FEES 631,098.00 613,701.00 CLAIM SERVICING - ADJUSTMENTS 1,101.91 4,842.00
CLAIM SERVICING COSTS 632,199.91 618,543.00
ADMINISTRATIVE EXPENSES 562,856.78 542,328.74
TOTAL EXPENSES 9,638,980.46$ 8,415,954.75$
INCREASE (DECREASE) IN NET POSITION (4,015,143.72) (2,543,860.18)
NET POSITION, BEGINNING 33,193,631.48 35,472,513.46
NET POSITION, ENDING 29,178,487.76$ 32,928,653.28$
SOhlson
Text Box
67

Information Item 5.b. Employee Benefit Plans Financial Highlights
as of November 2013

Bud
get R
epor
t
Una
udite
d-Fo
r Man
agem
ent P
urpo
ses
ON
LY1/
16/2
014
11/3
1/20
13C
UR
REN
T B
UD
GET
REA
LIZE
DU
NR
EALI
ZED
%
UN
REA
LIZE
DPR
OJE
CTE
D
THR
U 1
2/31
/13
% C
UR
REN
T B
UD
GET
REV
ENU
ES
Mem
bers
Ass
essm
ents
80,3
92,3
85.0
071
,994
,595
.75
8,39
7,78
9.25
10.4
5%78
,567
,081
.00
97.7
3%R
ecov
erie
s2,
157,
502.
003,
321,
446.
19(1
,163
,944
.19)
-53.
95%
3,65
5,29
7.00
169.
42%
Inte
rest
s &
Inve
stm
ent R
etur
ns60
0,00
0.00
332,
297.
0226
7,70
2.98
44.6
2%46
2,16
4.00
77.0
3%
TOTA
L R
EVEN
UES
83,1
49,8
87.0
075
,648
,338
.96
7,50
1,54
8.04
9.02
%82
,684
,542
.00
99.4
4%
EXPE
ND
ITU
RES
EXPE
ND
EDEN
C'D
UN
ENC
'D%
UN
ENC
'D
Pre
miu
ms,
Cla
ims
& F
ees
78,9
49,3
54.0
0
74,2
56,3
31.1
9
-
4,69
3,02
2.81
5.94
%80
,764
,000
.00
102.
30%
Adm
inis
trativ
e E
xpen
ses
772,
065.
00
719,
528.
22
9,55
0.00
42,9
86.7
8
5.57
%78
2,34
0.00
10
1.33
%
TOTA
L EX
PEN
DIT
UR
ES79
,721
,419
.00
74
,975
,859
.41
9,
550.
00
4,
736,
009.
59
5.
94%
81,5
46,3
40.0
0
10
2.29
%
INC
REA
SE (D
ECR
EASE
) IN
FU
ND
BA
LAN
CE
3,42
8,46
8.00
672,
479.
55
1,13
8,20
2.00
TOTA
L A
CTU
AL
2013
TOTA
L ES
TIM
ATE
D 2
013
FLO
RID
A C
OLL
EGE
SYST
EM R
ISK
MA
NA
GEM
ENT
CO
NSO
RTI
UM
EMPL
OYE
E B
ENEF
IT P
LAN
S
REV
ENU
ES A
ND
EXP
END
ITU
RES
BU
DG
ET R
EPO
RT
FOR
TH
E 11
TH M
ON
TH E
ND
ING
NO
VEM
BER
30,
201
3
SOhlson
Text Box
68
SOhlson
Text Box
Information Item 5.b.

Florida College System Risk Management ConsortiumEmployee Benefit Plans
Statement of Net PositionNovember 30, 2013 and 2012
Unaudited-For Management Purposes Only 1/16/2014
ASSETS 2013 2012
INVESTMENTS SECURITIES-Managed Account 9,328,359.76$ 9,248,965.69$ UNREALIZED HOLDING GAIN /(LOSS) ON SECURITIES 19,575.12 62,201.68
INVESTMENTS AVAILABLE FOR SALE 9,347,934.88 9,311,167.37
CASH IN BANKS 649,881.06 5,604,779.93
INVESTMENT STATE BOARD OF ADMIN. (1) 241,663.30 49,915.75 INVESTMENT SPECIAL PURPOSE INVESTMENT ACCT. 25,227,692.88 24,019,041.83
CASH INVESTMENTS - STATE INVESTMENT POOLS 25,469,356.18 24,068,957.58
ACCRUED INTEREST RECEIVABLE 21,309.50 35,554.94
REINSURANCE & OTHER RECEIVABLES 1,059,101.65 1,375,907.70
PROPERTY AND EQUIPMENT - NET OF DEPRECIATION 44,347.08 59,302.49
TOTAL ASSETS 36,591,930.35$ 40,455,670.01$
LIABILITIES
ACCOUNTS PAYABLE-CLAIMS 4,786,475.28$ 10,931,117.24$ CLAIMS INCURRED BUT NOT REPORTED OR PAID 4,148,979.00 3,332,091.00
LIABILITY FOR LOSSES INCURRED 8,935,454.28 14,263,208.24
ACCOUNTS PAYABLE-OPERATIONS 1,155,355.20 50,867.39
ACCRUED LIABILITY-COMPENSATED ABSENCES 51,645.98 44,983.66
TOTAL LIABILITIES 10,142,455.46 14,359,059.29
TOTAL NET POSITION 26,449,474.89$ 26,096,610.72$
(1) Includes 24,195.43 of SBA Fund B shares (Balance of $20,123.06 plus unrealized gain of $4,072.37)
SOhlson
Text Box
69
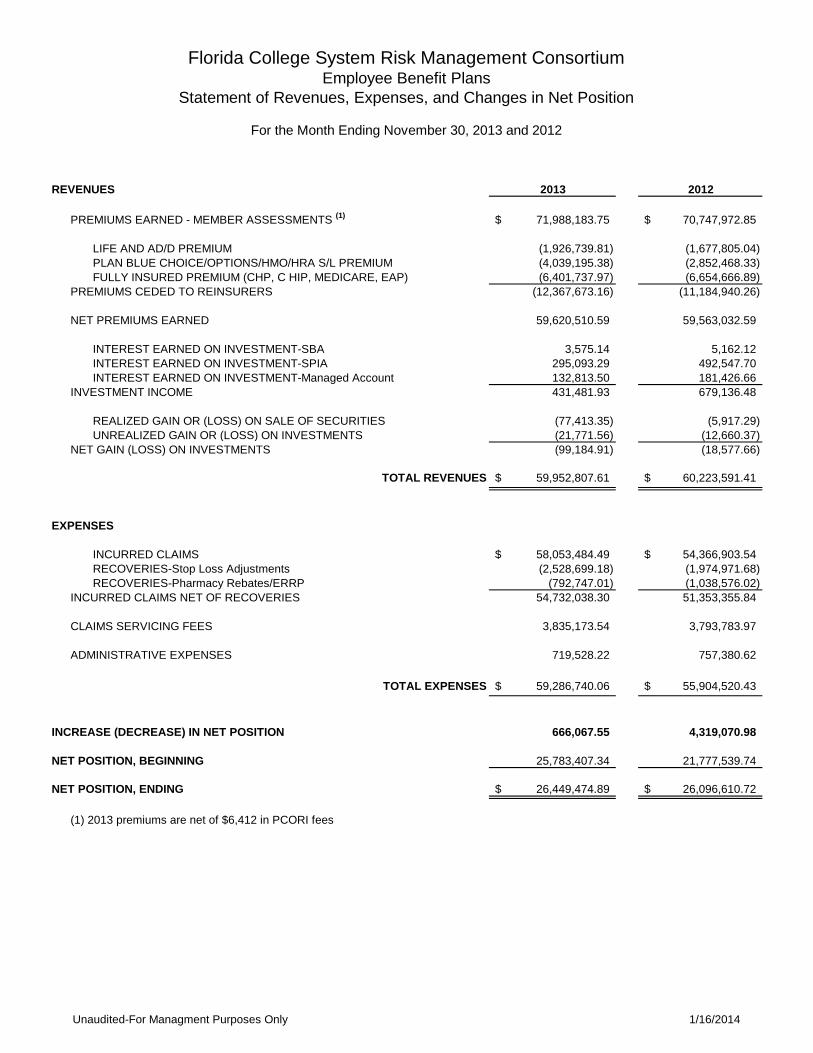
Florida College System Risk Management ConsortiumEmployee Benefit Plans
Statement of Revenues, Expenses, and Changes in Net Position
For the Month Ending November 30, 2013 and 2012
Unaudited-For Managment Purposes Only 1/16/2014
REVENUES 2013 2012
PREMIUMS EARNED - MEMBER ASSESSMENTS (1) 71,988,183.75$ 70,747,972.85$
LIFE AND AD/D PREMIUM (1,926,739.81) (1,677,805.04) PLAN BLUE CHOICE/OPTIONS/HMO/HRA S/L PREMIUM (4,039,195.38) (2,852,468.33) FULLY INSURED PREMIUM (CHP, C HIP, MEDICARE, EAP) (6,401,737.97) (6,654,666.89)
PREMIUMS CEDED TO REINSURERS (12,367,673.16) (11,184,940.26)
NET PREMIUMS EARNED 59,620,510.59 59,563,032.59
INTEREST EARNED ON INVESTMENT-SBA 3,575.14 5,162.12 INTEREST EARNED ON INVESTMENT-SPIA 295,093.29 492,547.70 INTEREST EARNED ON INVESTMENT-Managed Account 132,813.50 181,426.66
INVESTMENT INCOME 431,481.93 679,136.48
REALIZED GAIN OR (LOSS) ON SALE OF SECURITIES (77,413.35) (5,917.29) UNREALIZED GAIN OR (LOSS) ON INVESTMENTS (21,771.56) (12,660.37)
NET GAIN (LOSS) ON INVESTMENTS (99,184.91) (18,577.66)
TOTAL REVENUES 59,952,807.61$ 60,223,591.41$
EXPENSES
INCURRED CLAIMS 58,053,484.49$ 54,366,903.54$ RECOVERIES-Stop Loss Adjustments (2,528,699.18) (1,974,971.68) RECOVERIES-Pharmacy Rebates/ERRP (792,747.01) (1,038,576.02)
INCURRED CLAIMS NET OF RECOVERIES 54,732,038.30 51,353,355.84
CLAIMS SERVICING FEES 3,835,173.54 3,793,783.97
ADMINISTRATIVE EXPENSES 719,528.22 757,380.62
TOTAL EXPENSES 59,286,740.06$ 55,904,520.43$
INCREASE (DECREASE) IN NET POSITION 666,067.55 4,319,070.98
NET POSITION, BEGINNING 25,783,407.34 21,777,539.74
NET POSITION, ENDING 26,449,474.89$ 26,096,610.72$
(1) 2013 premiums are net of $6,412 in PCORI fees
SOhlson
Text Box
70

Information Item 5.c. Investment Program Fourth Quarter 2013

Flo
rid
a C
olle
ge S
yste
m R
isk
Man
agem
ent
Con
sort
ium 30
0 S.
Ora
nge
Aven
ue, S
uite
117
0O
rland
o, F
L 3
2801
(407
) 648
-220
8(4
07) 6
48-1
323
fax
PFM
Ass
et M
anag
emen
t LLC
One
Key
ston
e P
laza
, Sui
te 3
00N
orth
Fro
nt &
Mar
ket S
treet
sH
arris
burg
, PA
171
01-2
044
717-
232-
2723
• 71
7-23
3-60
73 fa
x
Inve
stm
ent
Per
form
ance
Rev
iew
Qu
arte
r E
nd
ed D
ecem
ber
31,
201
3
Inve
stm
ent A
dvis
ors
Ste
ven
Ale
xand
er, C
TP, C
GFO
, Man
agin
g D
irect
orD
. Sco
tt S
titch
er, C
FA, S
enio
r Man
agin
g C
onsu
ltant
Ric
hard
Pen
gelly
, CFA
, Sen
ior M
anag
ing
Con
sulta
ntG
regg
Man
jero
vic,
CFA
, Por
tfolio
Man
ager
Reb
ecca
Gey
er, C
TP, S
enio
r Ana
lyst
SOhlson
Text Box
71
SOhlson
Text Box
Information Item 5.c.

Flo
rid
a C
olle
ge S
yste
m R
isk
Man
agem
ent
Con
sort
ium
Inve
stm
ent
Rep
ort
- Q
uar
ter
En
ded
Dec
emb
er 3
1, 2
013
Tabl
e of
Con
tent
sTa
b I. Se
ctio
n A
Mar
ket R
evie
wTa
b II. S
ectio
n B
Exe
cutiv
e S
umm
ary
& 1
- 5
Year
Inve
stm
ent P
ortfo
lio P
erfo
rman
ceA
sset
Allo
catio
n C
hart
Tab
III.
Thi
s m
ater
ial i
s ba
sed
on in
form
atio
n ob
tain
ed f
rom
sou
rces
gen
eral
ly b
elie
ved
to b
e re
liab
le a
nd a
vaila
ble
to th
e pu
blic
, how
ever
PFM
A
sset
Man
agem
ent L
LC
can
not g
uara
ntee
its
accu
racy
, com
plet
enes
s or
sui
tabi
lity
. Thi
s m
ater
ial i
s fo
r ge
nera
l inf
orm
atio
n pu
rpos
es o
nly
and
is n
ot in
tend
ed to
pro
vide
spe
cifi
c ad
vice
or
reco
mm
enda
tion
. The
info
rmat
ion
cont
aine
d in
this
rep
ort i
s no
t an
offe
r to
pur
chas
e or
se
ll an
y se
curi
ties.
Dec
embe
r 31,
201
3 P
FM M
onth
-End
Sta
tem
ent (
Stat
emen
ts a
re a
vaila
ble
onlin
e at
ww
w.p
fm.c
om)
Tab
le o
f C
onte
nts
Sect
ion
i
SOhlson
Text Box
72

Flo
rid
a C
olle
ge S
yste
m R
isk
Man
agem
ent
Con
sort
ium
Inve
stm
ent
Rep
ort
- Q
uar
ter
En
ded
Dec
emb
er 3
1, 2
013
TA
B I
SOhlson
Text Box
73

© 2
013
PFM
Ass
et M
anag
emen
t LLC
Th
e W
eath
er is
Ref
lect
ive
of t
he
Clim
ate
in D
C…
SOhlson
Text Box
74

© 2
013
PFM
Ass
et M
anag
emen
t LLC
Eco
nom
ic C
ond
itio
ns
•Q
3 G
DP
rest
ated
to re
port
eco
nom
ic g
row
th a
t a 4
.1%
ann
ualiz
ed p
ace
driv
en b
y an
incr
ease
is c
onsu
mer
spen
ding
•U.
S. jo
b cr
eatio
n re
main
s stro
ng w
ith 2
03,0
00 jo
bs c
reat
ed in
Nov
embe
r; un
empl
oym
ent r
ate
falls
to 7
.0%
st
reng
then
ed b
y a
retu
rn o
f go
vern
men
t wor
kers
follo
win
g sh
utdo
wn
•Co
ngre
ss p
asse
s, an
d Pr
esid
ent O
bam
a sig
ns, t
wo y
ear b
udge
t dea
l for
mall
y en
ding
the
thre
at o
f an
othe
r par
tial
gove
rnm
ent s
hutd
own
in 2
014
•FO
MC
anno
unce
s the
long
ant
icip
ated
star
t to
a re
duct
ion
of th
eir a
sset
pur
chas
e pr
ogra
m w
hile
reaf
firm
ing
its
com
mitm
ent t
o a
low
Fed
Fun
ds R
ate;
mon
thly
ope
n m
arke
t pur
chas
es re
duce
d by
$10
B
Mar
ket
Rea
ctio
n
•Tr
easu
ry y
ield
curv
e st
eepe
ns a
s lon
ger m
atur
ity y
ields
rise
to th
e hi
gher
end
of
rece
nt tr
adin
g ra
nges
; yie
lds f
or
mat
uriti
es le
ss th
an a
yea
r fall
•M
arke
ts c
ontin
ue to
weig
h th
e fu
ture
of
FOM
C pu
rcha
ses a
nd p
repa
re fo
r a Ja
net Y
ellen
run
Fede
ral R
eser
ve; n
ext
FOM
C m
eetin
g is
Janu
ary
28th
-29th
•D
omes
tic e
quity
mar
kets
snub
FO
MC
tape
r ann
ounc
emen
t and
con
tinue
their
rally
with
key
indi
ces e
ndin
g 20
13 a
t hi
stor
ic re
cord
hig
hs
Eco
nom
ic S
um
mar
y
SOhlson
Text Box
75

© 2
013
PFM
Ass
et M
anag
emen
t LLC
Eco
nom
ic G
row
th R
emai
ns
Mod
erat
e
Sour
ce: B
urea
u O
f E
conom
ic A
nalys
is
•Q
3 G
DP
was
rest
ated
to sh
ow th
at th
e ec
onom
y gr
ew a
t a 4
.1%
ann
ualiz
ed p
ace;
a sig
nific
ant i
ncre
ase
from
the
prio
r rea
ding
of
3.6%
. W
hile
the
prev
ious
read
ing
was
driv
en la
rgely
by
inve
ntor
y bu
ild-u
p, th
e lat
est r
eleas
e sh
owed
a sig
nific
ant c
ontri
butio
n fr
om C
onsu
mer
Spe
ndin
g.
‐10%‐8%
‐6%
‐4%
‐2%0%2%4%6%
Q3
Q4
Q1
Q2
Q3
Q4
Q1
Q2
Q3
Q4
Q1
Q2
Q3
Q4
Q1
Q2
Q3
Q4
Q1
Q2
Q3
Q4
Q1
Q2
Q3
2008
2009
2010
2011
2012
2013
2014
QoQ % Change; Seasonally Adjusted Annualized Rate
0.1%
1.1%
2.5%
4.1%
Pos
t R
eces
sion
Ave
rage
= 2
.4%
Bloo
mbe
rg
Survey of
Econ
omists
SOhlson
Text Box
76

© 2
013
PFM
Ass
et M
anag
emen
t LLC
Inve
nto
ry B
uild
-Up
Ove
rsta
tes
Eco
nom
ic S
tren
gth
Sour
ce: B
urea
u of
Econ
omic
Ana
lysis,
Bloo
mberg
•Th
e re
cent
rest
atem
ent o
f Q
3 G
DP
som
ewha
t exa
gger
ated
the
curr
ent p
ace
of e
cono
mic
pro
duct
ion
as
near
ly ha
lf o
f th
e gr
owth
was
attr
ibut
ed to
an
accu
mul
atio
n in
inve
ntor
ies.
•In
vent
orie
s are
a v
olat
ile c
ompo
nent
and
cann
ot b
e co
nsist
ently
relie
d up
on.
If c
onsu
mer
s don
’t pu
rcha
se
prev
ious
inve
ntor
ies, t
hen
that
pro
duct
ion
diss
olve
s in
subs
eque
nt q
uarte
rs.
Con
trib
uti
on o
f In
ven
tori
es t
o G
DP
3.35
%2.11
%2.18
%2.14
%
0.22
%
2.07
%2.47
%
0.36
%
‐0.91%
0.60
%
‐2.00%
0.93
%
0.41
%
1.67
%
‐3.00%
‐2.00%
‐1.00%
0.00%
1.00%
2.00%
3.00%
4.00%
5.00%
Mar‐12
Jun‐12
Sep‐12
Dec‐12
Mar‐13
Jun‐13
Sep‐13
Non
‐Inventories
Inventories
SOhlson
Text Box
77
© 2
013
PFM
Ass
et M
anag
emen
t LLC
Con
sum
ers
Con
tinu
e to
Su
pp
ort
Gro
wth
Sour
ce: B
urea
u of
Econ
omic
Ana
lysis,
Bloo
mberg
.
•Th
e Q
3 G
DP
read
ing
portr
ayed
a si
gnifi
cant
con
tribu
tion
from
the
cons
umer
sect
or.
As C
onsu
mer
Co
nfid
ence
has
rebo
unde
d fr
om it
s dep
ths d
urin
g th
e he
ight
of
the
rece
ssio
n, so
has
spen
ding
.
•Co
nsum
er b
ehav
ior o
ffers
a v
ital i
ndica
tion
on th
e ge
nera
l dire
ctio
n of
eco
nom
ic g
row
th a
s Con
sum
er
Spen
ding
acco
unts
for a
ppro
xim
ately
70%
of
over
all G
DP
grow
th.
405060708090100
110
120
Dec‐00
Dec‐01
Dec‐02
Dec‐03
Dec‐04
Dec‐05
Dec‐06
Dec‐07
Dec‐08
Dec‐09
Dec‐10
Dec‐11
Dec‐12
Dec‐13
His
tori
cal A
vera
ge
$6$7$8$9$10
$11
Sep‐00
Sep‐01
Sep‐02
Sep‐03
Sep‐04
Sep‐05
Sep‐06
Sep‐07
Sep‐08
Sep‐09
Sep‐10
Sep‐11
Sep‐12
Sep‐13
Trillions
Un
iver
sity
of
Mic
hig
an C
onsu
mer
Con
fid
ence
Con
sum
er S
pen
din
g: C
ontr
ibu
tion
to
GD
P
SOhlson
Text Box
78

© 2
013
PFM
Ass
et M
anag
emen
t LLC
Lab
or M
arke
t C
ond
itio
ns
Stre
ngt
hen
0%2%4%6%8%10%
12%
‐1,000K
‐800K
‐600K
‐400K
‐200K0K
200K
400K
600K
Nov
‐08
May‐09
Nov‐09
May‐10
Nov‐10
May‐11
Nov‐11
May‐12
Nov‐12
May‐13
Nov‐13
Change in
Non
‐Farm Payrolls (left a
xis)
Une
mploymen
t Rate (right axis)
Sour
ce: B
urea
u of
Lab
or S
tatis
tics
8.8
Mill
ion
Job
s L
ost
7.4
Mill
ion
Job
s G
ain
ed
Ch
ange
in N
onfa
rm P
ayro
lls
Un
emp
loym
ent
Rat
e: 7
.0%
•Th
e pa
ce o
f jo
b gr
owth
rem
ains e
ncou
ragi
ng a
s the
U.S
. eco
nom
y ad
ded
203,
000
new
jobs
in N
ovem
ber.
Th
is br
ings
the
2013
mon
thly
aver
age
to a
not
able
188
,500
jobs
.
•Th
e U
nem
ploy
men
t Rat
e fe
ll to
7.0
% a
s pre
viou
sly fu
rloug
hed
gove
rnm
ent w
orke
rs re
turn
ed to
their
jobs
.
SOhlson
Text Box
79

© 2
013
PFM
Ass
et M
anag
emen
t LLC
“Tap
er T
alk”
Rev
erse
s . .
. A
gain
Sour
ce: F
edera
l Rese
rve
FO
MC
Pre
ss C
onfe
ren
ce: S
epte
mb
er 1
8, 2
013
“In
evalua
ting w
heth
er a m
odest
redu
ction
in th
e pac
e of
asset
purch
ases
would
be a
ppro
priat
e at t
his m
eetin
g, ho
wever
, the
Com
mit
tee
conc
lude
d th
at th
e ec
onom
ic d
ata
do n
ot y
et p
rovi
de
suff
icie
nt c
onfi
rmat
ion
of it
s ba
selin
e ou
tlook
. . .
the e
xten
t of
the e
ffects
of re
strict
ive fi
scal p
olicy
polic
ies re
main
unc
lear,
and
upco
min
g fi
scal
deb
ates
may
invo
lve
addi
tion
al r
isks
to fi
nanc
ial
mar
kets
and
the
broa
der
econ
omy .
”
FO
MC
Sta
tem
ent:
Dec
emb
er 1
8, 2
013
“In
light
of th
e cum
ulativ
e pro
gress
towar
d max
imum
emplo
ymen
t and
the
impr
ovem
ent i
n th
e out
look
for la
bor m
arke
t con
dition
s, th
e Com
mitte
e de
cided
to m
odes
tly
redu
ce th
e pa
ce o
f it
s as
set p
urch
ases
. . .
asse
t pur
chas
es a
re n
ot o
n a
pres
et c
ours
ean
d rem
ain co
ntin
gent
on th
e Com
mitte
e’s ou
tlook
. . I
t lik
ely w
ill b
e app
ropr
iate t
o main
tain
the
cu
rren
t tar
get ra
nge f
or th
e fed
eral f
unds
rate
wel
l pas
t the
tim
e th
at
the
unem
ploy
men
t rat
e de
clin
es b
elow
6.5
%”
SOhlson
Text Box
80

© 2
013
PFM
Ass
et M
anag
emen
t LLC
•Th
e FO
MC
anno
unce
d in
Dec
embe
r tha
t it w
ould
beg
in to
redu
ce it
s mon
thly
asse
t pur
chas
es b
y $1
0B
per m
onth
. W
hile
this
anno
unce
men
t inc
ited
a ris
e to
war
ds h
ighe
r rat
es in
long
er d
ated
mat
uriti
es, a
siz
able
and
volat
ile h
ike
was
avoi
ded
as m
arke
t par
ticip
ants
larg
ely a
ntici
pate
d a
tape
r in
the
com
ing
mon
ths.
•Th
e FO
MC
also
reaf
firm
ed th
eir c
omm
itmen
t to
a ne
ar-z
ero
Fed
Fund
s Rat
e fu
rther
anc
horin
g yie
lds f
or
shor
ter m
atur
ities
.
Mar
ket
Imp
act
of F
OM
C T
aper
U.S
. Tre
asu
ry Y
ield
s
0.20%
0.40%
0.60%
0.80%
1.00%
1.20%
1.40%
1.60%
1.80%
2.00%
Jan‐12
Feb‐12
Mar‐12
Apr‐12
May‐12
Jun‐12
Jul‐12
Aug‐12
Sep‐12
Oct‐12
Nov‐12
Dec‐12
Jan‐13
Feb‐13
Mar‐13
Apr‐13
May‐13
Jun‐13
Jul‐13
Aug‐13
Sep‐13
Oct‐13
Nov‐13
Dec‐13
2yr
5yr
“Taper Talk” Begins
Sour
ce: B
loomb
erg
Taper Announced
SOhlson
Text Box
81
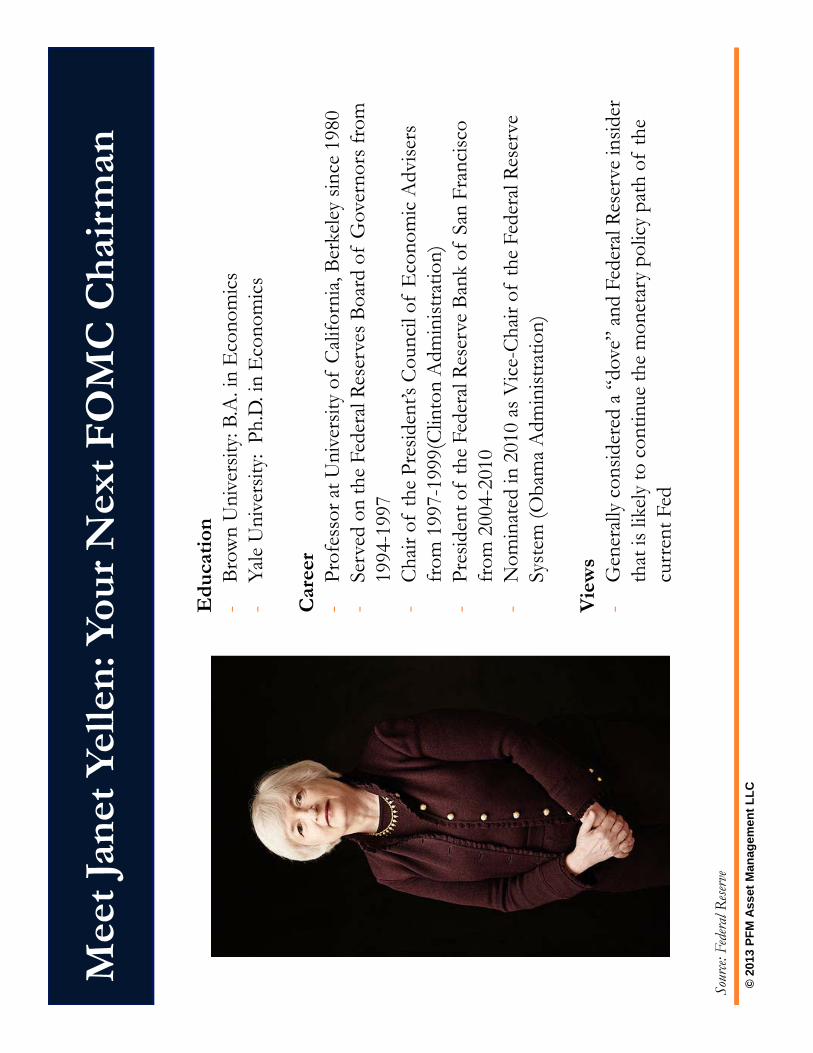
© 2
013
PFM
Ass
et M
anag
emen
t LLC
Mee
t Ja
net
Yel
len
: You
r N
ext
FO
MC
Ch
airm
an
Ed
uca
tion
-Br
own
Uni
vers
ity: B
.A. i
n E
cono
mics
-Ya
le U
nive
rsity
: Ph
.D. i
n E
cono
mics
Car
eer
-Pr
ofes
sor a
t Uni
vers
ity o
f Ca
lifor
nia,
Berk
eley
since
198
0-
Serv
ed o
n th
e Fe
dera
l Res
erve
s Boa
rd o
f G
over
nors
from
19
94-1
997
-Ch
air o
f th
e Pr
esid
ent’s
Cou
ncil
of E
cono
mic
Adv
isers
fr
om 1
997-
1999
(Clin
ton
Adm
inist
ratio
n)-
Pres
iden
t of
the
Fede
ral R
eser
ve B
ank
of S
an F
ranc
isco
from
200
4-20
10-
Nom
inat
ed in
201
0 as
Vice
-Cha
ir of
the
Fede
ral R
eser
ve
Syst
em (O
bam
a A
dmin
istra
tion)
Vie
ws
-G
ener
ally
cons
ider
ed a
“dov
e” an
d Fe
dera
l Res
erve
insid
er
that
is li
kely
to c
ontin
ue th
e m
onet
ary
polic
y pa
th o
f th
e cu
rren
t Fed
Sour
ce: F
edera
l Rese
rve
SOhlson
Text Box
82

© 2
013
PFM
Ass
et M
anag
emen
t LLC
U.S
. Tre
asu
ry Y
ield
Cu
rve
Stee
pen
s
Sour
ce: B
loomb
erg
•W
ith sh
ort m
atur
ity y
ields
anc
hore
d by
the
Fed
Fund
s rat
e, th
e m
id-y
ear r
ate
surg
e ha
s res
ulte
d in
a m
uch
stee
per y
ield
curv
e.
U.S
. Tre
asu
ry Y
ield
Cu
rve
Com
par
ison
Yie
ld C
urv
e H
isto
ry
0.00%
0.50%
1.00%
1.50%
2.00%
2.50%
3.00%
3.50%
4.00%
3 m6 m1 y
2 y3 y
5 y7 y
10 y30 y
Yield
Decembe
r 31, 2013
Septem
ber 3
0, 2013
Decembe
r 31, 2012
12/
31/
129/
30/
1312
/31
/13
1-M
o.0.
020.
020.
01
3-M
o.0.
040.
010.
07
6-M
o.0.
110.
030.
09
1-Y
r.0.
140.
090.
11
2-Y
r.0.
250.
320.
38
3-Y
r.0.
350.
610.
76
5-Y
r.0.
721.
381.
74
7-Y
r.1.
182.
002.
45
10-Y
r.1.
762.
613.
03
30-Y
r.2.
953.
683.
97
SOhlson
Text Box
83

© 2
013
PFM
Ass
et M
anag
emen
t LLC
0%1%2%3%4%5%6%
Dec‐06
Dec‐07
Dec‐08
Dec‐09
Dec‐10
Dec‐11
Dec‐12
Dec‐13
2‐Year
5‐Year
10‐Year
FedCu
ts Rates to
0%
QE1
QE2
Ope
ratio
nTw
ist
Ope
ratio
nTw
ist
Extend
ed
QE3
Rat
e E
nvi
ron
men
t B
efor
e Q
uan
tita
tive
E
asin
g
A L
onge
r V
iew
of
Tre
asu
ry Y
ield
s
Sour
ce: B
loomb
erg
•W
hile
the
Sept
embe
r and
Oct
ober
pul
l bac
k te
mpo
raril
y re
vers
ed th
e re
cent
rate
risin
g tre
nd, i
t is
impo
rtant
to v
iew
cur
rent
rate
s in
a lo
nger
con
text
.
•Th
e m
ultip
le ve
rsio
ns o
f Q
uant
itativ
e E
asin
g w
ere
gear
ed to
war
ds c
reat
ing
a lo
w ra
te e
nviro
nmen
t, an
d cu
rren
t yiel
ds a
re st
ill w
ell b
elow
their
leve
ls pr
ior t
o FO
MC
inte
rven
tion.
2 Y
ear
5 Y
ear
10 Y
ear
Dec
embe
r-06
4.81
4.69
4.70
Dec
embe
r-07
3.05
3.44
4.02
Dec
embe
r-08
0.76
1.55
2.21
Dec
embe
r-09
1.14
2.68
3.84
Dec
embe
r-10
0.59
2.01
3.29
Dec
embe
r-11
0.24
0.83
1.88
Dec
embe
r-12
0.25
0.72
1.76
Dec
embe
r-13
0.38
1.74
3.03
SOhlson
Text Box
84

© 2
013
PFM
Ass
et M
anag
emen
t LLC
•Th
e st
eadi
ly im
prov
ing
econ
omy,
com
bine
d w
ith a
Seq
uest
er re
lated
dec
reas
e in
gov
ernm
ent s
pend
ing,
is
evid
ent b
y an
impr
ovin
g bu
dget
situ
atio
n. T
he F
eder
al G
over
nmen
t’s b
udge
t def
icit
has f
allen
by
near
ly h
alf
over
the
past
two
year
s.
A W
ord
Ab
out
the
Bu
dge
t D
efic
it
Sour
ce: B
loomb
erg, U
S O
ffice
of B
udget
and
Man
agem
ent
U.S
. Bu
dge
t D
efic
itC
um
ula
tive
Fis
cal Y
ear-
to-D
ate
‐1,400
‐1,200
‐1,000
‐800
‐600
‐400
‐2000
Oct
Nov
Dec
Jan
Feb
Mar
Apr
May
Jun
Jul
Aug
Sep
FY 2014
FY 2013
FY 2012
FY 2011
$227
billion
$1.1 trillion
$1.3 trillion
$679
billion
SOhlson
Text Box
85

© 2
013
PFM
Ass
et M
anag
emen
t LLC
Fan
nie
Mae
an
d F
red
die
Mac
Up
dat
e
Sour
ce: F
anni
e Mae
, Fred
die M
ac a
s of
Sept
embe
r 30,
201
3. 1 In
clude
s $28
.6B
in d
eferr
ed ta
x as
set re
serves
.
•Th
e Fe
dera
l Gov
ernm
ent h
as p
rovi
ded
capi
tal i
njec
tions
into
Fan
nie
Mae
and
Fre
ddie
Mac
sinc
e th
ey
ente
red
cons
erva
tors
hip
in 2
008.
Und
er th
is ag
reem
ent,
the
agen
cies
are
man
date
d to
shrin
k th
eir b
alanc
e sh
eets,
and
pay
the
U.S.
a q
uarte
rly d
ivid
end
that
repr
esen
ts th
eir p
rofit
s.
•A
s the
age
ncies
con
tinue
to re
gain
thei
r fin
anci
al he
alth,
they
hav
e alm
ost r
epaid
the
full
amou
nt o
f th
eir
capi
tal d
raw
s.
$0$20
$40
$60
$80
$100
$120
2008
2009
2010
2011
2012
2013
Total
Capital D
raws
Divide
nds
Billions
Cum
ulat
ive
Tota
ls:Ca
pita
l Dra
ws:
$116
BD
ivid
ends
: $11
4B
Fan
nie
Mae
$0$20
$40
$60
$80
$100
$120
2008
2009
2010
2011
2012
2013
Total
Capital D
raws
Divide
nds
Billions
Cum
ulat
ive
Tota
ls:Ca
pita
l Dra
ws:
$71B
1 Div
iden
ds: $
95B
Fre
dd
ie M
ac
Cap
ital
Dra
ws
and
Div
iden
ds
Pai
d B
etw
een
th
e A
gen
cies
an
d t
he
Fed
eral
Gov
ern
men
t
SOhlson
Text Box
86

© 2
013
PFM
Ass
et M
anag
emen
t LLC
Yie
ld S
pre
ad –
Lon
ger
Per
spec
tive
Source: Bloomberg, M
errill Lynch. Spreads represented
by ML 1‐5 Agency, 1
‐5 A‐AAA Corporate, 1‐5, 1
‐5 M
unicipal, and 0‐5MBS indices.
020406080100
120
140
160
180
200
Dec‐07
Jun‐08
Dec‐08
Jun‐09
Dec‐09
Jun‐10
Dec‐10
Jun‐11
Dec‐11
Jun‐12
Dec‐12
Jun‐13
Dec‐13
Fed
eral
Age
nci
es
61 bps
7bp
s
0
100
200
300
400
500
600
700
800
Dec‐07
Jun‐08
Dec‐08
Jun‐09
Dec‐09
Jun‐10
Dec‐10
Jun‐11
Dec‐11
Jun‐12
Dec‐12
Jun‐13
Dec‐13
A-A
AA
Cor
por
ates
65 bps
186 bp
s
01020304050607080
Dec‐07
Jun‐08
Dec‐08
Jun‐09
Dec‐09
Jun‐10
Dec‐10
Jun‐11
Dec‐11
Jun‐12
Dec‐12
Jun‐13
Dec‐13
Mu
nic
ipal
s
11 bps
25 bps
‐50050100
150
200
250
Dec‐07
Jun‐08
Dec‐08
Jun‐09
Dec‐09
Jun‐10
Dec‐10
Jun‐11
Dec‐11
Jun‐12
Dec‐12
Jun‐13
Dec‐13
MB
S
101 bp
s
51 bps
SOhlson
Text Box
87

© 2
013
PFM
Ass
et M
anag
emen
t LLC
Cor
por
ate
Fu
nd
amen
tals
Are
Str
ong
Sour
ce: B
loomb
erg
$0$20
$40
$60
$80
$100
$120
Jun‐07Sep‐07Dec‐07Mar‐08Jun‐08Sep‐08Dec‐08Mar‐09Jun‐09Sep‐09Dec‐09Mar‐10Jun‐10Sep‐10Dec‐10Mar‐11Jun‐11Sep‐11Dec‐11Mar‐12Jun‐12Sep‐12Dec‐12Mar‐13Jun‐13Sep‐13Dec‐13
S&P
500
Ear
nin
gs p
er S
har
e
$0
$500
$1,000
$1,500
$2,000
$2,500
Jun‐07Sep‐07Dec‐07Mar‐08Jun‐08Sep‐08Dec‐08Mar‐09Jun‐09Sep‐09Dec‐09Mar‐10Jun‐10Sep‐10Dec‐10Mar‐11Jun‐11Sep‐11Dec‐11Mar‐12Jun‐12Sep‐12Dec‐12Mar‐13Jun‐13Sep‐13Dec‐13
Cor
por
ate
Pro
fits
($
bn
)
$0
$200
$400
$600
$800
$1,000
$1,200
Jun‐07Sep‐07Dec‐07Mar‐08Jun‐08Sep‐08Dec‐08Mar‐09Jun‐09Sep‐09Dec‐09Mar‐10Jun‐10Sep‐10Dec‐10Mar‐11Jun‐11Sep‐11Dec‐11Mar‐12Jun‐12Sep‐12Dec‐12Mar‐13Jun‐13Sep‐13Dec‐13
S&P
500
Tra
ilin
g 12
-Mon
th S
ales
per
Sh
are
0%10%
20%
30%
40%
50%
60%
Jun‐07Sep‐07Dec‐07Mar‐08Jun‐08Sep‐08Dec‐08Mar‐09Jun‐09Sep‐09Dec‐09Mar‐10Jun‐10Sep‐10Dec‐10Mar‐11Jun‐11Sep‐11Dec‐11Mar‐12Jun‐12Sep‐12Dec‐12Mar‐13Jun‐13Sep‐13Dec‐13
S&P
500
Bal
ance
Sh
eet
Cas
h &
Eq
uiv
alen
ts
Cash/Deb
t
Cash/Assets
SOhlson
Text Box
88

© 2
013
PFM
Ass
et M
anag
emen
t LLC
Fix
ed-I
nco
me
Ind
ex R
etu
rns
As of 1
2/31/13
Returns for p
eriods end
ed 12/31/13
Source: BofA M
errill Lynch Indices
Returns for periods greater than one year are annualized
U.S.
Tre
asur
y1.
910.
25%
0.36
%(0
.14%
)0.
06%
0.36
%0.
78%
1.09
%
Agen
cy1.
770.
31%
0.42
%(0
.10%
)0.
15%
0.42
%0.
93%
1.46
%
Corp
A-A
AA1.
851.
02%
1.41
%(0
.06%
)0.
46%
1.41
%2.
34%
4.53
%
MBS
(0 to
3 Y
ears
)1.
800.
87%
0.85
%0.
36%
0.82
%0.
85%
1.87
%3.
39%
Mun
icip
als
1.81
0.52
%1.
07%
0.03
%0.
34%
1.07
%1.
49%
1.98
%
U.S.
Tre
asur
y2.
700.
34%
(0.1
9%)
(0.4
8%)
(0.1
1%)
(0.1
9%)
1.35
%1.
57%
Agen
cy2.
480.
42%
0.03
%(0
.37%
)0.
11%
0.03
%1.
28%
1.86
%
Corp
A-A
AA2.
761.
26%
1.14
%(0
.36%
)0.
52%
1.14
%3.
16%
5.50
%
MBS
(0 to
5 Y
ears
)3.
420.
91%
0.00
%0.
17%
0.49
%0.
00%
2.51
%3.
79%
Mun
icip
als
2.55
0.71
%1.
24%
(0.0
5%)
0.55
%1.
24%
2.17
%2.
77%
U.S.
Tre
asur
y5.
610.
91%
(3.3
5%)
(1.0
4%)
(0.9
2%)
(3.3
5%)
2.72
%2.
02%
Agen
cy3.
970.
79%
(1.7
9%)
(0.6
4%)
(0.2
0%)
(1.7
9%)
1.93
%2.
25%
Corp
A-A
AA6.
402.
38%
(1.8
7%)
(0.3
4%)
0.63
%(1
.87%
)4.
70%
7.23
%
MBS
(0 to
30
Year
s)5.
570.
92%
(1.3
9%)
(0.4
8%)
(0.4
7%)
(1.3
9%)
2.40
%3.
71%
Mun
icip
als
8.09
2.48
%(2
.89%
)(0
.36%
)0.
37%
(2.8
9%)
5.01
%6.
27%
Mas
ter I
ndic
ies
(Mat
uriti
es 1
Yea
r and
Gre
ater
)
1-5
Year
Indi
cies
1-3
Year
Indi
ces
5 Ye
ars
1 Ye
ar3
Year
sEf
fect
ive
Dura
tion
YTD
Yiel
d1
Mon
th3
Mon
th
SOhlson
Text Box
89

© 2
013
PFM
Ass
et M
anag
emen
t LLC
1-3
Yea
r In
dex
Ret
urn
s
As of 1
2/31/13
Returns for p
eriods end
ed 12/31/13
Source: BofA M
errill Lynch Indices
Returns for periods greater than one year are annualized
U.S.
Tre
asur
y1.
910.
40%
0.36
%(0
.14%
)0.
06%
0.36
%0.
78%
1.09
%
Agen
cy1.
770.
49%
0.42
%(0
.10%
)0.
15%
0.42
%0.
93%
1.46
%
Non-
calla
ble
1.95
0.48
%0.
43%
(0.1
2%)
0.14
%0.
43%
0.97
%1.
56%
Calla
ble
1.16
0.52
%0.
40%
(0.0
6%)
0.18
%0.
40%
0.76
%1.
04%
U.S.
Tre
asur
y/Ag
ency
1.89
0.41
%0.
36%
(0.1
3%)
0.07
%0.
36%
0.81
%1.
20%
Corp
A-A
AA1.
850.
91%
1.41
%(0
.06%
)0.
46%
1.41
%2.
34%
4.53
%
Corp
AAA
1.89
0.67
%0.
87%
(0.1
1%)
0.33
%0.
87%
1.53
%2.
71%
Corp
AA
1.80
0.72
%1.
06%
(0.0
8%)
0.36
%1.
06%
1.81
%3.
45%
Corp
A1.
870.
98%
1.54
%(0
.05%
)0.
50%
1.54
%2.
56%
5.04
%
Corp
BBB
1.87
1.56
%2.
47%
0.02
%0.
87%
2.47
%3.
39%
7.29
%
Corp
/Gov
t1.
890.
60%
0.70
%(0
.12%
)0.
20%
0.70
%1.
25%
2.07
%
MBS
0 -
31.
801.
06%
0.85
%0.
36%
0.82
%0.
85%
1.87
%3.
39%
Corp
/Gov
t/Mtg
e1.
890.
61%
0.47
%(0
.11%
)0.
21%
0.47
%1.
21%
2.53
%
5 Ye
ars
3 Ye
ars
Effe
ctiv
e Du
ratio
nYT
D1
Mon
th3
Mon
th1
Year
Yiel
d
SOhlson
Text Box
90

© 2
013
PFM
Ass
et M
anag
emen
t LLC
1-5
Yea
r In
dex
Ret
urn
s
As of 1
2/31/13
Returns for p
eriods end
ed 12/31/13
Source: BofA M
errill Lynch Indices
Returns for periods greater than one year are annualized
U.S.
Tre
asur
y2.
700.
76%
(0.1
9%)
(0.4
8%)
(0.1
1%)
(0.1
9%)
1.35
%1.
57%
Agen
cy2.
480.
83%
0.03
%(0
.37%
)0.
11%
0.03
%1.
28%
1.86
%
Non-
calla
ble
2.59
0.79
%0.
03%
(0.3
8%)
0.11
%0.
03%
1.38
%2.
04%
Calla
ble
2.11
0.94
%(0
.01%
)(0
.34%
)0.
11%
(0.0
1%)
0.83
%1.
17%
U.S.
Tre
asur
y/Ag
ency
2.68
0.77
%(0
.16%
)(0
.47%
)(0
.09%
)(0
.16%
)1.
33%
1.67
%
Corp
A-A
AA2.
761.
46%
1.14
%(0
.36%
)0.
52%
1.14
%3.
16%
5.50
%
Corp
AA
A2.
941.
23%
0.41
%(0
.43%
)0.
10%
0.41
%2.
19%
3.77
%
Corp
AA
2.66
1.21
%0.
70%
(0.3
8%)
0.30
%0.
70%
2.44
%4.
25%
Corp
A2.
781.
53%
1.29
%(0
.36%
)0.
60%
1.29
%3.
42%
6.10
%
Corp
BBB
2.78
2.19
%2.
39%
(0.1
7%)
1.06
%2.
39%
4.67
%9.
10%
Corp
/Gov
t2.
701.
04%
0.32
%(0
.42%
)0.
14%
0.32
%1.
95%
2.97
%
MBS
0 -
53.
422.
55%
0.00
%0.
17%
0.49
%0.
00%
2.51
%3.
79%
Corp
/Gov
t/Mtg
e2.
781.
22%
0.06
%(0
.33%
)0.
19%
0.06
%2.
08%
3.27
%
5 Ye
ars
3 Ye
ars
Effe
ctiv
e Du
ratio
nYT
D1
Mon
th3
Mon
th1
Year
Yiel
d
SOhlson
Text Box
91

© 2
013
PFM
Ass
et M
anag
emen
t LLC
This
mat
eria
lis
base
don
info
rmat
ion
obta
ined
from
sour
ces
gene
rally
belie
ved
tobe
relia
ble
and
avai
labl
eto
the
publ
ic,h
owev
erP
FMA
sset
Man
agem
entL
LCca
nnot
guar
ante
eits
accu
racy
,com
plet
enes
sor
suita
bilit
y.Th
ism
ater
ial
isfo
rge
nera
lin
form
atio
npu
rpos
eson
lyan
dis
not
inte
nded
topr
ovid
esp
ecifi
cad
vice
ora
spec
ific
reco
mm
enda
tion.
All
stat
emen
tsas
tow
hat
will
orm
ayha
ppen
unde
rce
rtain
circ
umst
ance
sar
eba
sed
onas
sum
ptio
ns,s
ome
butn
otal
lofw
hich
are
note
din
the
pres
enta
tion.
Ass
umpt
ions
may
orm
ayno
tbe
prov
enco
rrec
tas
actu
alev
ents
occu
r,an
dre
sults
may
depe
ndon
even
tsou
tsid
eof
your
orou
rco
ntro
l.C
hang
esin
assu
mpt
ions
may
have
am
ater
ial
effe
cton
resu
lts.
Pas
tpe
rform
ance
does
not
nece
ssar
ilyre
flect
and
isno
tagu
aran
tyof
futu
rere
sults
.Th
ein
form
atio
nco
ntai
ned
inth
ispr
esen
tatio
nis
not
anof
fert
opu
rcha
seor
sell
any
secu
ritie
s.
Dis
clai
mer
SOhlson
Text Box
92

Flo
rid
a C
olle
ge S
yste
m R
isk
Man
agem
ent
Con
sort
ium
Inve
stm
ent
Rep
ort
- Q
uar
ter
En
ded
Dec
emb
er 3
1, 2
013
TA
B I
I
SOhlson
Text Box
93

Flo
rid
a C
olle
ge S
yste
m R
isk
Man
agem
ent
Con
sort
ium
Inve
stm
ent
Rep
ort
- Q
uar
ter
En
ded
Dec
emb
er 3
1, 2
013
Exe
cuti
ve S
um
mar
y
POR
TFO
LIO
STR
ATEG
Y
T
he C
onso
rtium
’s I
nves
tmen
t P
ortfo
lio is
of
high
cre
dit
qual
ity a
nd in
vest
ed in
U.S
. T
reas
ury,
Fed
eral
Age
ncy,
mor
tgag
e ba
cked
sec
uriti
es,
high
qua
lity
corp
orat
e an
d co
mm
erci
al p
aper
sec
uriti
es.
T
he I
nves
tmen
t P
ortfo
lio’s
qua
rterly
tot
al r
etur
n pe
rform
ance
was
0.0
5%,
outp
erfo
rmin
g th
e be
nchm
ark’
s pe
rform
ance
of
-0.1
1% b
y 0.
16%
. O
ver
the
past
yea
r, th
e P
ortfo
lio e
arne
d -0
.08%
, ver
sus
-0.1
9% fo
r the
ben
chm
ark.
O
ur in
vest
men
t str
ateg
y w
as b
ased
on
the
view
tha
t in
tere
st r
ates
wou
ld e
vent
ually
ris
e in
ant
icip
atio
n of
a ta
perin
g of
the
Fed
eral
Res
erve
’s
larg
e sc
ale
bond
pur
chas
e pr
ogra
m,
afte
r be
ing
surp
rised
by
no s
uch
actio
n in
Q3.
W
e ex
pect
ed t
hat
grow
th in
the
U.S
. ec
onom
y w
ould
be
suffi
cien
t to
supp
ort s
uch
a m
ove
in la
te 2
013
or e
arly
201
4. T
he k
ey p
illar
s of
our
stra
tegy
for Q
4 in
clud
ed:
M
aint
aini
ng a
def
ensi
ve p
ostu
re, p
ositi
onin
g po
rtfo
lio d
urat
ions
sho
rter t
han
benc
hmar
ks,
C
ontin
uing
to e
mph
asiz
e in
vest
men
t-gra
de c
redi
t ins
trum
ents
(e.
g. c
orpo
rate
s) th
at b
enef
it fr
om fa
vora
ble
cred
it m
arke
t con
ditio
ns th
at
incl
ude
stro
ng b
alan
ce s
heet
s, h
isto
rical
ly lo
w fu
ndin
g ra
tes,
and
stre
ngth
enin
g ec
onom
ic c
ondi
tions
in th
e U
.S. a
nd m
ost d
evel
oped
m
arke
ts a
roun
d th
e gl
obe,
Gen
eral
ly c
autio
us to
war
d in
vest
men
ts w
ith o
ptio
nalit
y, th
at c
ould
und
erpe
rfor
m if
rat
es s
pike
d, a
nd m
ake
dura
tion
man
agem
ent –
a k
ey
part
of o
ur s
trat
egy
– m
ore
diffi
cult,
Mai
ntai
ning
a m
ore
ladd
ered
mat
urity
dis
trib
utio
n, in
reco
gniti
on o
f the
pot
entia
l for
the
yiel
d cu
rve
to s
teep
en,
C
aref
ully
mon
itorin
g yi
eld
spre
ads,
whi
ch c
ause
d so
me
sect
ors
and
mat
uriti
es to
nar
row
to a
poi
nt w
here
it n
o lo
nger
mad
e se
nse
to
hold
them
.
Y
ield
s dr
ifted
mod
estly
low
er in
Oct
ober
and
Nov
embe
r, th
en ju
mpe
d sh
arpl
y in
ant
icip
atio
n of
the
Fed
’s ta
perin
g of
bon
d pu
rcha
ses.
Lon
ger-
term
yie
lds
ende
d th
e qu
arte
r ne
ar t
heir
high
s fo
r th
e ye
ar.
Our
sho
rter
dura
tion
stra
tegy
was
the
rig
ht o
ne,
but
the
mag
nitu
de o
f th
e yi
eld
incr
ease
s in
Dec
embe
r dam
pene
d al
l fix
ed-in
com
e re
turn
s fo
r th
e qu
arte
r.
C
orpo
rate
s pe
rform
ed w
ell
agai
n in
Q4,
ben
efitt
ing
from
hig
her
initi
al y
ield
s an
d m
odes
t sp
read
com
pres
sion
. W
hile
we
mai
ntai
ned
appr
opria
te d
iver
sific
atio
n, w
e co
ntin
ued
to e
mph
asiz
e is
suer
s in
the
ban
king
and
fin
anci
al s
ecto
rs,
whi
ch o
ffere
d th
e be
st r
etur
n po
tent
ial.
S
trong
dem
and
for
the
sect
or’s
incr
emen
tal y
ield
con
stra
ined
sup
ply,
mak
ing
it di
fficu
lt to
mee
t tar
gete
d al
loca
tions
. C
orpo
rate
spr
eads
end
ed
the
quar
ter a
t the
ir tig
htes
t lev
els
of th
e ye
ar, w
hich
furt
her n
arro
wed
the
univ
erse
of s
ecur
ities
with
attr
activ
e va
luat
ions
.
A
genc
y yi
eld
spre
ads
cont
inue
d to
con
tract
from
alre
ady
reco
rd ti
ght l
evel
s. A
t the
beg
inni
ng o
f Q4,
val
ue c
ould
stil
l be
foun
d in
Age
ncy
bond
s m
atur
ing
in 3
yea
rs, b
ut b
y th
e en
d of
qua
rter
, yie
ld s
prea
ds o
n A
genc
ies
3 ye
ars
and
shor
ter
wer
e cl
ose
to z
ero.
A
dditi
onal
ly, a
vera
ge d
aily
tra
ding
vol
ume
of A
genc
y de
bt d
eclin
ed b
y 32
% i
n 20
13 c
ompa
red
to 2
012,
cre
atin
g so
met
hing
of
a sc
arci
ty p
rem
ium
tha
t de
crea
sed
the
sect
or’s
rel
ativ
e va
lue.
I
t is
our
expe
ctat
ion
that
the
sour
ces
of e
xces
s re
turn
in 2
014
will
diff
er fr
om th
ose
that
dro
ve r
elat
ive
perfo
rman
ce in
201
3. If
rat
es r
ise
as th
e Fe
d w
ithdr
aws
its e
xtra
ordi
nary
mon
etar
y st
imul
us, n
egat
ive
retu
rns
on lo
nger
mat
uriti
es m
ay b
ecom
e un
avoi
dabl
e fo
r sh
ort p
erio
ds. A
fter
the
adju
stm
ent,
portf
olio
s w
ill b
e in
a m
uch
bette
r po
sitio
n to
gen
erat
e hi
gher
ear
ning
s go
ing
forw
ard.
Act
ive
dura
tion
man
agem
ent w
ill b
e a
criti
cal
aspe
ct o
f our
str
ateg
y in
ear
ly 2
014
to m
itiga
te th
e ef
fect
s of
rat
e no
rmal
izat
ion
and
to m
axim
ize
rela
tive
perfo
rman
ce.
Thi
s w
ill b
e ba
lanc
ed,
how
ever
, by
reco
gniz
ing
the
enha
nced
ear
ning
s po
tent
ial i
mbe
dded
in a
ste
epes
t yie
ld c
urve
.
W
e w
ill fo
cus
mor
e th
an e
ver
on s
afet
y of
prin
cipa
l and
app
ropr
iate
liqu
idity
in th
is n
ew a
nd c
halle
ngin
g en
viro
nmen
t, w
hile
max
imiz
ing
valu
e th
roug
h ca
refu
l, pr
uden
t ac
tive
man
agem
ent.
Our
stra
tegy
will
rem
ain
appr
opria
tely
fle
xibl
e an
d m
ay c
hang
e in
res
pons
e to
cha
nges
in
inte
rest
rat
es, e
cono
mic
dat
a, m
arke
t out
look
or s
peci
fic o
ppor
tuni
ties
that
aris
e.
PF
M A
sset
Man
agem
ent
LL
CSe
ctio
n B
- 1
SOhlson
Text Box
94

Flo
rid
a C
olle
ge S
yste
m R
isk
Man
agem
ent
Con
sort
ium
Inve
stm
ent
Rep
ort
- Q
uar
ter
En
ded
Dec
emb
er 3
1, 2
013
1 -
5 Y
ear
Inve
stm
ent
Por
tfol
io P
erfo
rman
ceTo
tal P
ortfo
lio V
alue
1D
ecem
ber 3
1, 2
013
Sep
tem
ber 3
0, 2
013
Mar
ket V
alue
$14,
063,
632.
22$1
4,05
9,58
9.09
Am
ortiz
ed C
ost
$14,
075,
575.
99$1
4,04
0,86
1.79
Qua
rterly
Ret
urn
Cal
enda
r Yea
rLa
st
Last
La
st
Sin
ce In
cept
ion
Tota
l Ret
urn2,
3,4
Dec
embe
r 31,
201
3to
Dat
e6
Mon
ths
12 M
onth
s2
Year
sS
epte
mbe
r 30,
201
01
- 5 Y
ear I
nves
tmen
t Por
tfolio
0.05
%-0
.08%
0.61
%-0
.08%
0.76
%1.
48%
Mer
rill L
ynch
1-5
Yea
r U.S
. Tre
asur
y In
dex
-0.1
1%-0
.19%
0.35
%-0
.19%
0.36
%1.
03%
Effe
ctiv
e D
urat
ion(
Year
s)4,
5D
ecem
ber 3
1, 2
013
Sep
tem
ber 3
0, 2
013
Yiel
dsD
ecem
ber 3
1, 2
013
Sep
tem
ber 3
0, 2
013
1 - 5
Yea
r Inv
estm
ent P
ortfo
lio2.
532.
43Yi
eld
at M
arke
t1.
01%
0.94
%M
erril
l Lyn
ch 1
-5 Y
ear U
.S. T
reas
ury
Inde
x2.
642.
64Yi
eld
at C
ost
1.19
%1.
18%
Por
tfolio
Dur
atio
n %
of B
ench
mar
k D
urat
ion
96%
92%
Not
es: 1.
In
orde
r to
com
ply
with
GA
SB
acc
rual
acc
ount
ing
repo
rting
requ
irem
ents
; fo
rwar
d se
ttlin
g tr
ades
are
incl
uded
in th
e m
onth
ly b
alan
ces.
E
nd o
f qua
rter t
rade
-dat
e m
arke
t val
ues
of p
ortfo
lio h
oldi
ngs,
incl
udin
g ac
crue
d in
tere
st.
4. M
erril
l Lyn
ch In
dice
s pr
ovid
ed b
y B
loom
berg
Fin
anci
al M
arke
ts.
5. In
clud
es m
oney
mar
ket f
und/
cash
in p
erfo
rman
ce a
nd d
urat
ion
com
puta
tions
.
2. P
erfo
rman
ce o
n tra
de d
ate
basi
s, g
ross
(i.e
., be
fore
fees
), is
in a
ccor
danc
e w
ith T
he C
FA In
stitu
te’s
Glo
bal I
nves
tmen
t Per
form
ance
Sta
ndar
ds (G
IPS
). Q
uarte
rly re
turn
s ar
e pr
esen
ted
on a
n un
annu
aliz
ed b
asis
. Ret
urns
pre
sent
ed fo
r 12
mon
ths
or lo
nger
are
pre
sent
ed
on a
n an
nual
bas
is. P
ast p
erfo
rman
ce is
not
indi
cativ
e of
futu
re re
sults
.
3. S
ince
Ince
ptio
n th
e be
nchm
ark
has
been
the
Mer
rill L
ynch
1-5
Yea
r U.S
. Tre
asur
y N
ote
Inde
x.
0.05
%
-0.1
1%-0
.25%
0.00
%
0.25
%
0.50
%
0.75
%
1.00
%
1.00
1.50
2.00
2.50
3.00
3.50
4.00
Return
Effe
ctiv
e D
urat
ion
(Yea
rs)
Qua
rter T
otal
Ret
urn
Com
paris
on
Qua
rter E
nded
12/
31/1
3
ML
1-5
Yea
r U.S
. Tre
asur
y In
dex
1-5
Year
Inve
stm
ent P
ortfo
lio
1.48
%
1.03
%
0.50
%
0.75
%
1.00
%
1.25
%
1.50
%
1.75
%
2.00
%
1.00
1.50
2.00
2.50
3.00
3.50
4.00
ReturnE
ffect
ive
Dur
atio
n (Y
ears
)
Tota
l Ret
urn
Com
paris
on S
ince
Ince
ptio
n as
of
Qua
rter E
nded
12/
31/1
3
ML
1-5
Yea
r U.S
. Tre
asur
y In
dex
1-5
Year
Inve
stm
ent P
ortfo
lio
PF
M A
sset
Man
agem
ent
LL
CSe
ctio
n B
- 2
SOhlson
Text Box
95

Flo
rid
a C
olle
ge S
yste
m R
isk
Man
agem
ent
Con
sort
ium
Inve
stm
ent
Rep
ort
- Q
uar
ter
En
ded
Dec
emb
er 3
1, 2
013
Qu
arte
rly
Acc
oun
t Su
mm
ary
2011
2012
1st Q
uart
er
2013
2nd
Qua
rter
20
133r
d Q
uart
er
2013
4th
Qua
rter
20
13La
st 1
2 M
onth
s1
- 5 Y
ear I
nves
tmen
t Por
tfolio
3.04
%1.
61%
0.22
%-0
.89%
0.56
%0.
05%
0.61
%M
erril
l Lyn
ch 1
-5 Y
ear U
.S. T
reas
ury
Inde
x3.
36%
0.91
%0.
15%
-0.6
9%0.
46%
-0.1
1%0.
35%
Flor
ida
PRIM
E Fu
nd0.
25%
0.31
%0.
23%
0.21
%0.
18%
0.17
%0.
20%
Mer
rill L
ynch
3 M
onth
U.S
. Tre
asur
y Bi
ll In
dex
0.10
%0.
11%
0.02
%0.
02%
0.02
%0.
02%
0.07
%
Mor
ning
Star
Gen
eral
Bon
d U
nive
rse4
Max
imum
5.03
%7.
77%
0.64
%-0
.04%
1.58
%0.
62%
0.89
%25
th P
erce
ntile
1.89
%3.
87%
0.28
%-0
.65%
0.59
%0.
31%
0.18
%50
th P
erce
ntile
1.35
%2.
62%
0.16
%-0
.90%
0.45
%0.
22%
-0.1
4%75
th P
erce
ntile
0.96
%1.
51%
0.06
%-1
.21%
0.31
%0.
06%
-0.5
0%M
inim
um-0
.82%
0.92
%-0
.16%
-2.7
0%-0
.14%
-0.4
5%-1
.62%
2000
2001
2002
2003
2004
2005
2006
2007
2008
2009
YTD
as
of J
une
30, 2
010
1 - 5
Yea
r Inv
estm
ent P
ortfo
lio3.
18%
9.37
%7.
75%
2.48
%1.
60%
1.97
%4.
77%
5.78
%4.
03%
1.06
%1.
84%
Mer
rill L
ynch
1-5
Yea
r U.S
. Tre
asur
y In
dex
3.15
%8.
37%
7.47
%2.
05%
1.31
%1.
39%
3.96
%8.
16%
8.73
%0.
23%
2.96
%Fl
orid
a PR
IME
Fund
2.71
%4.
16%
1.89
%1.
40%
1.50
%3.
29%
5.13
%5.
46%
2.56
%0.
58%
0.24
%M
erril
l Lyn
ch 3
Mon
th U
.S. T
reas
ury
Bill
Inde
x5.
73%
4.42
%1.
78%
1.15
%1.
33%
3.07
%4.
81%
5.00
%2.
06%
0.21
%0.
05%
Lipp
er U
nive
rse
Max
imum
3.85
%9.
20%
8.04
%9.
16%
2.30
%3.
51%
6.49
%7.
74%
7.05
%23
.77%
Not
Ava
ilabl
e25
th P
erce
ntile
2.70
%8.
10%
5.91
%2.
97%
1.08
%1.
88%
4.38
%5.
82%
2.84
%9.
49%
Not
Ava
ilabl
e50
th P
erce
ntile
2.46
%7.
55%
5.10
%2.
31%
0.80
%1.
49%
3.98
%5.
08%
0.09
%6.
77%
Not
Ava
ilabl
e75
th P
erce
ntile
2.20
%6.
87%
4.21
%1.
73%
0.41
%1.
15%
3.63
%4.
08%
-3.6
6%3.
95%
Not
Ava
ilabl
eM
inim
um0.
46%
4.10
%-4
.62%
-2.4
9%-1
.08%
-0.0
7%2.
67%
-8.7
9%-3
8.28
%-0
.13%
Not
Ava
ilabl
e
Not
es:
1. Q
uarte
rly re
turn
s ar
e pr
esen
ted
on a
n un
annu
aliz
ed b
asis
.
2. R
etur
ns p
rese
nted
for 1
2 m
onth
s or
long
er a
re p
rese
nted
on
an a
nnua
l bas
is.
3. P
FM s
tarte
d m
anag
ing
the
portf
olio
on
Sep
tem
ber 2
010.
The
per
form
ance
dat
a fo
r 201
0 is
onl
y av
aila
ble
for t
he fo
urth
qua
rter.
4. P
FM s
ubsc
ribes
to th
e M
orni
ngst
ar ra
ting
serv
ice.
Thi
s se
rvic
e is
com
para
ble
to L
ippe
r rat
ing
serv
ices
.
Tota
l Ret
urn
Perf
orm
ance
1, 2
, 3
Tota
l Ret
urn
Perf
orm
ance
PF
M A
sset
Man
agem
ent
LL
CSe
ctio
n B
- 3
SOhlson
Text Box
96

Flo
rid
a C
olle
ge S
yste
m R
isk
Man
agem
ent
Con
sort
ium
Inve
stm
ent
Rep
ort
- Q
uar
ter
En
ded
Dec
emb
er 3
1, 2
013
Qu
arte
rly
Acc
oun
t Su
mm
ary
Sept
embe
r 30,
201
3O
ctob
er 3
1, 2
013
Nov
embe
r 30,
201
3D
ecem
ber 3
1, 2
013
Qua
rter
End
(1)
Amor
tized
Cos
t of H
oldi
ngs
$13,
897,
640.
64$1
3,88
0,63
3.51
$13,
486,
975.
27$1
3,90
8,01
8.96
(2)
Accr
ued
Inte
rest
36,8
51.1
531
,361
.24
27,2
87.1
131
,173
.82
Am
ortiz
ed C
ost o
f Sec
uriti
es$1
3,93
4,49
1.79
$13,
911,
994.
75$1
3,51
4,26
2.38
$13,
939,
192.
78
(3)
Rec
onci
led
Mon
ey F
und
Bala
nce
106,
370.
0413
7,92
2.91
548,
742.
8413
6,38
3.21
To
tal A
mor
tized
Cos
t of P
ortfo
lio$1
4,04
0,86
1.83
$14,
049,
917.
66$1
4,06
3,00
5.22
$14,
075,
575.
99
N
et C
hang
e in
Am
ortiz
ed C
ost
$9,0
55.8
3$1
3,08
7.56
$12,
570.
77$3
4,71
4.16
Oct
ober
31,
201
3N
ovem
ber 3
0, 2
013
Dec
embe
r 31,
201
3Q
uart
er E
ndEn
ding
Am
ortiz
ed C
ost o
f Sec
uriti
es$1
3,91
1,99
4.75
$13,
514,
262.
38$1
3,93
9,19
2.78
$13,
939,
192.
78(4
)Pl
us P
roce
eds
on S
ales
739,
932.
00
75,1
75.0
0 35
2,96
6.80
1,
168,
073.
80
(5)
Plus
Pro
ceed
s of
Mat
uriti
es19
,271
.01
511,
911.
63
721,
790.
02
1,25
2,97
2.66
(6
)Pl
us C
oupo
ns R
ecei
ved
15,0
55.3
2 19
,221
.71
8,58
1.67
42
,858
.70
(7)
Less
Cos
t of N
ew P
urch
ases
(739
,717
.35)
(195
,488
.42)
(1,4
95,6
98.1
2)(2
,430
,903
.89)
Le
ss B
egin
ning
Am
ortiz
ed C
ost o
f Sec
uriti
es(1
3,93
4,49
1.79
)(1
3,91
1,99
4.75
)(1
3,51
4,26
2.38
)(1
3,93
4,49
1.79
)(8
)Pl
us (M
inus
) Rec
onci
ling
Tran
sact
ions
-
Tot
al P
ortfo
lio A
ccru
al B
asis
Ear
ning
s$1
2,04
3.94
$1
3,08
7.55
$1
2,57
0.77
$3
7,70
2.26
Not
es:
(1)
Det
ail o
f Sec
uriti
es H
eld
page
Am
ortiz
ed C
ost t
otal
. D
oes
not i
nclu
de fo
rwar
d se
ttlin
g tra
des.
(2)
Det
ail o
f Sec
uriti
es H
eld
page
Acc
rued
Inte
rest
tota
l.(3
)C
ash/
Mon
ey R
epor
t pag
e C
ash/
Mon
ey F
und
Bala
nce.
(4)
Secu
rity
Tran
sact
ions
& In
tere
st p
age
subt
otal
Sal
es.
(5)
Secu
rity
Tran
sact
ions
& In
tere
st p
age
subt
otal
Mat
uriti
es, S
inks
, MBS
Pm
ts.,
Cal
ls(6
)Se
curit
y Tr
ansa
ctio
ns &
Inte
rest
pag
e su
btot
al In
tere
st.
(7)
Secu
rity
Tran
sact
ions
& In
tere
st p
age
subt
otal
Buy
s.(8
)Ba
nk S
tate
men
t vs.
PFM
Sta
tem
ent R
econ
cile
d C
ash+
Mon
ey F
und
Bala
nce
Port
folio
Ear
ning
s:
Port
folio
Bal
ance
s:
PF
M A
sset
Man
agem
ent
LL
CSe
ctio
n B
- 4
SOhlson
Text Box
97
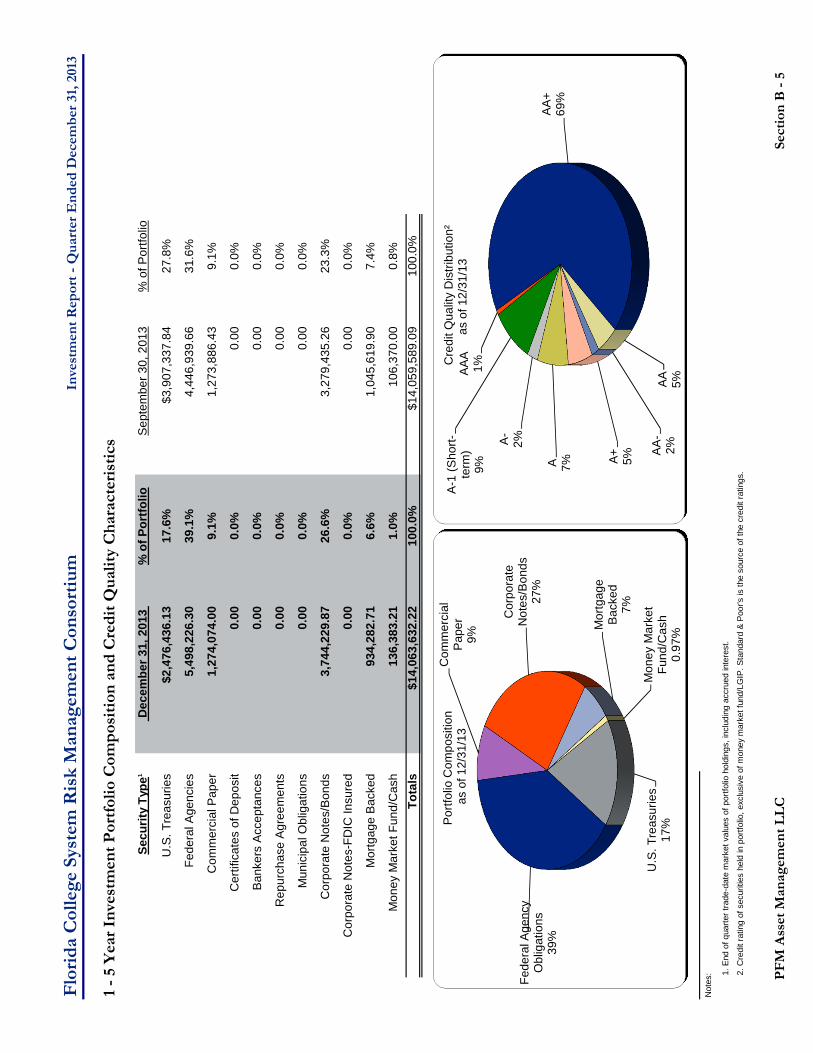
Flo
rid
a C
olle
ge S
yste
m R
isk
Man
agem
ent
Con
sort
ium
Inve
stm
ent
Rep
ort
- Q
uar
ter
En
ded
Dec
emb
er 3
1, 2
013
1 -
5 Y
ear
Inve
stm
ent
Por
tfol
io C
omp
osit
ion
an
d C
red
it Q
ual
ity
Ch
arac
teri
stic
s
Secu
rity
Type
1D
ecem
ber 3
1, 2
013
% o
f Por
tfolio
Sep
tem
ber 3
0, 2
013
% o
f Por
tfolio
U.S
. Tre
asur
ies
$2,4
76,4
36.1
317
.6%
$3,9
07,3
37.8
427
.8%
Fede
ral A
genc
ies
5,49
8,22
6.30
39.1
%4,
446,
939.
6631
.6%
Com
mer
cial
Pap
er1,
274,
074.
009.
1%1,
273,
886.
439.
1%
Cer
tific
ates
of D
epos
it0.
000.
0%0.
000.
0%
Ban
kers
Acc
epta
nces
0.00
0.0%
0.00
0.0%
Rep
urch
ase
Agr
eem
ents
0.00
0.0%
0.00
0.0%
Mun
icip
al O
blig
atio
ns0.
000.
0%0.
000.
0%
Cor
pora
te N
otes
/Bon
ds3,
744,
229.
8726
.6%
3,27
9,43
5.26
23.3
%
Cor
pora
te N
otes
-FD
IC In
sure
d0.
000.
0%0.
000.
0%
Mor
tgag
e B
acke
d93
4,28
2.71
6.6%
1,04
5,61
9.90
7.4%
Mon
ey M
arke
t Fun
d/C
ash
136,
383.
211.
0%10
6,37
0.00
0.8%
Tota
ls$1
4,06
3,63
2.22
100.
0%$1
4,05
9,58
9.09
100.
0%
Not
es: 1.
End
of q
uarte
r tra
de-d
ate
mar
ket v
alue
s of
por
tfolio
hol
ding
s, in
clud
ing
accr
ued
inte
rest
.
2. C
redi
t rat
ing
of s
ecur
ities
hel
d in
por
tfolio
, exc
lusi
ve o
f mon
ey m
arke
t fun
d/LG
IP. S
tand
ard
& Po
or's
is th
e so
urce
of t
he c
redi
t rat
ings
.
U.S
. Tre
asur
ies
17%
Fede
ral A
genc
y O
blig
atio
ns39
%
Com
mer
cial
P
aper
9%
Cor
pora
te
Not
es/B
onds
27%
Mor
tgag
e B
acke
d7%
Mon
ey M
arke
t Fu
nd/C
ash
0.97
%
Por
tfolio
Com
posi
tion
as o
f 12/
31/1
3 A
AA
1%
AA
+69
%
AA
5%
AA
-2%
A+
5%A 7%
A-
2%
A-1
(Sho
rt-te
rm)
9%
Cre
dit Q
ualit
y D
istri
butio
n²
as o
f 12/
31/1
3
PF
M A
sset
Man
agem
ent
LL
CSe
ctio
n B
- 5
SOhlson
Text Box
98

Flo
rid
a C
olle
ge S
yste
m R
isk
Man
agem
ent
Con
sort
ium
Inve
stm
ent
Rep
ort
- Q
uar
ter
En
ded
Dec
emb
er 3
1, 2
013
1 -
5 Y
ear
Inve
stm
ent
Por
tfol
io M
atu
rity
Dis
trib
uti
on
Mat
urity
Dis
trib
utio
n1D
ecem
ber 3
1, 2
013
Sep
tem
ber 3
0, 2
013
Ove
rnig
ht (
Mon
ey M
arke
t Fun
d)$1
36,3
83.2
1$1
06,3
70.0
0
Und
er 6
Mon
ths
1,77
5,24
5.71
2,58
8,46
2.68
6 - 1
2 M
onth
s76
1,99
0.89
1,16
2,57
5.05
1 - 2
Yea
rs3,
351,
900.
672,
356,
627.
49
2 - 3
Yea
rs2,
230,
970.
982,
442,
311.
33
3 - 4
Yea
rs88
4,08
9.32
249,
667.
00
4 - 5
Yea
rs3,
988,
768.
734,
107,
955.
64
5 Ye
ars
and
Ove
r93
4,28
2.71
1,04
5,61
9.90
Tota
ls
$14,
063,
632.
22$1
4,05
9,58
9.09
Not
es: 1.
Cal
labl
e an
d m
ortg
age
back
ed s
ecur
ities
in p
ortfo
lio a
re in
clud
ed in
the
mat
urity
dis
tribu
tion
anal
ysis
to th
eir s
tate
d m
atur
ity d
ate,
alth
ough
they
may
be
calle
d or
be
paid
off
prio
r to
mat
urity
.
2. T
his
char
t is
base
d on
sec
uriti
es fi
nal m
atur
ity d
ate;
incl
udin
g m
ortg
age
back
ed s
ecur
ities
.
1%
13%
5%
24%
16%
6%
28%
7%
0.8%
18%
8%
17%
17%
2%
29%
7%
0%10%
20%
30%
40%
50%
60%
70%
80%
Ove
rnig
htU
nder
6 M
onth
s6
- 12
Mon
ths
1 - 2
Yea
rs2
- 3 Y
ears
3 - 4
Yea
rs4
- 5 Y
ears
5 Y
ears
and
Ove
r
Percentage of Total Portfolio
Por
tfolio
Mat
urity
Dis
tribu
tion¹
, ²
Dec
embe
r 31,
201
3
Sep
tem
ber 3
0, 2
013
PF
M A
sset
Man
agem
ent
LL
CSe
ctio
n B
- 6
SOhlson
Text Box
99

Flo
rid
a C
olle
ge S
yste
m R
isk
Man
agem
ent
Con
sort
ium
Inve
stm
ent
Rep
ort
- Q
uar
ter
En
ded
Dec
emb
er 3
1, 2
013
1 -
5 Y
ear
Inve
stm
ent
Por
tfol
io M
atu
rity
Dis
trib
uti
on v
ersu
s th
e B
ench
mar
k¹
Not
es: 1.
Due
to th
e na
ture
of t
he s
ecur
ity, M
ortg
age-
Back
ed S
ecur
ities
are
repr
esen
ted
base
d on
thei
r ave
rage
life
mat
urity
rath
er th
an th
eir f
inal
mat
urity
.
0.0%
5.0%
10.0
%
15.0
%
20.0
%
25.0
%
30.0
%
Market Value
Yea
rs to
Mat
urit
y
1-5
Yea
r In
vest
men
t Por
tfol
ioM
erri
ll L
ynch
1-5
Yea
r U
.S. T
reas
ury
Not
e In
dex
PF
M A
sset
Man
agem
ent
LL
CSe
ctio
n B
- 7
SOhlson
Text Box
100

Flo
rid
a C
olle
ge S
yste
m R
isk
Man
agem
ent
Con
sort
ium
Inve
stm
ent
Rep
ort
- Q
uar
ter
En
ded
Dec
emb
er 3
1, 2
013
1 -
5 Y
ear
Inve
stm
ent
Por
tfol
io C
ompl
ianc
e R
epor
t
Inve
stm
ent P
olic
y R
ule
Com
plia
nt?
1.
Inve
stm
ents
lim
ited
to a
utho
rized
fixe
d se
curit
ies.
Yes
2.
Out
perfo
rm to
tal r
etur
n be
nchm
arks
ove
r a m
arke
t cyc
le (4
to 7
yea
rs):
Yes
Sinc
e In
cept
ion
Annu
aliz
ed T
otal
Ret
urns
as
of D
ecem
ber 3
1, 2
013
1-5
Year
Inve
stm
ent P
ortfo
lio1.
48%
ML
1 -5
Yea
r U.S
. Tre
asur
y N
ote
Inde
x1.
03%
Flor
ida
PRIM
E0.
26%
ML
3-M
onth
Tre
asur
y Bi
ll In
dex
0.10
%
3. T
op 5
0 pe
rcen
tile
of o
ther
man
ager
s ov
er a
mar
ket c
ycle
:Ye
sTo
p 25
th P
erce
ntile
for t
he L
ast 1
2 M
onth
s
4. M
axim
um e
ffect
ive
dura
tion
is fi
ve y
ears
Dec
embe
r 30,
201
8.¹
Yes
Long
est D
urat
ion
Nov
embe
r 13,
201
82
5.
Max
imum
effe
ctiv
e du
ratio
n of
the
portf
olio
is 1
20%
of b
ench
mar
k.Ye
sPo
rtfol
io's
Effe
ctiv
e D
urat
ion
2.53
Yea
rsBe
nchm
ark'
s Ef
fect
ive
Dur
atio
n2.
64 Y
ears
6. M
axim
um 4
5% o
f por
tfolio
with
effe
ctiv
e du
ratio
n gr
eate
r tha
n 3
year
s.Ye
sPe
rcen
t of P
ortfo
lio w
ith d
urat
ion
grea
ter t
han
3 ye
ars
40.1
3%2
M
inim
um 1
0% o
f por
tfolio
with
effe
ctiv
e du
ratio
n le
ss th
an 1
yea
r.Ye
sPe
rcen
t of P
ortfo
lio w
ith d
urat
ion
less
than
1 y
ear
23.3
0%
7.
Max
imum
of 5
% in
any
sin
gle
Cor
pora
te is
suer
.Ye
sTo
p 5
Cor
pora
te E
xpos
ure:
Perc
ent
Bank
of T
okyo
Mits
ubis
hi C
omm
erci
al P
aper
4.61
%BN
P Pa
ribas
Com
mer
cial
Pap
er4.
44%
Gen
eral
Ele
ctric
Cor
pora
te N
otes
3.50
%C
hevr
on C
orpo
rate
Not
es2.
99%
Wal
t Dis
ney
Co
Cor
pora
te N
otes
2.89
%
8.
Aver
age
portf
olio
qua
lity
ratin
g of
8.0
or h
ighe
r with
m
inim
um s
ecur
ity ra
ting
of B
BB o
r hig
her b
y 2
ratin
g ag
enci
es:
Yes
Qua
lity
Rat
ings
:Is
suer
Rat
ing3
Scal
eAl
loca
tion
U.S
. Tre
asur
y10
17.7
8%Ag
ency
946
.19%
AAA
(incl
udes
A-1
+)8
0.77
%AA
711
.23%
A (in
clud
es A
-1)
624
.03%
BBB
00.
00%
Port
folio
Ave
rage
8.22
100.
00%
9.
Inve
stm
ent m
anag
er re
spon
sibi
litie
s be
ing
fulfi
lled:
Yes
Mon
thly
repo
rting
of h
oldi
ngs
and
trans
actio
nYe
sQ
uarte
rly re
porti
ng o
f the
fund
's p
erfo
rman
ceYe
sM
aint
aini
ng a
n ap
prov
ed li
st o
f dea
lers
Yes
Tran
sact
ions
exe
cute
d vi
a co
mpe
titiv
e bi
dsYe
sM
aint
ain
a M
aste
r Rep
urch
ase
Agre
emen
tYe
sM
aint
ain
cust
odia
l arr
ange
men
ts a
nd a
gree
men
tsN
otes
:
1. B
loom
berg
is th
e so
urce
s fo
r the
Ave
rage
Life
of t
he M
ortg
age
Bac
ked
Sec
uriti
es a
s pe
rmitt
ed in
the
Con
sorti
um's
Inve
stm
ent P
olic
y.
3. B
ased
on
Sta
ndar
d &
Poo
r's c
redi
t rat
ing.
Acco
unt D
etai
ls
All a
re a
utho
rized
per
Inve
stm
ent P
olic
y
2. T
he a
vera
ge li
fe o
f mor
tgag
e ba
cked
sec
uriti
es fl
uctu
ates
thro
ugho
ut th
e lif
e of
the
secu
rity.
PF
M A
sset
Man
agem
ent
LL
CSe
ctio
n B
- 8
SOhlson
Text Box
101

Flo
rid
a C
olle
ge S
yste
m R
isk
Man
agem
ent
Con
sort
ium
Inve
stm
ent
Rep
ort
- Q
uar
ter
En
ded
Dec
emb
er 3
1, 2
013
1 -
5 Y
ear
Inve
stm
ent
Por
tfol
io Q
uar
terl
y T
ran
sact
ion
s
Trad
eSe
ttlem
ent
Tran
sact
ion
Secu
rity
Mat
urity
Equi
vale
ntG
ain/
Loss
Dat
eD
ate
Type
CU
SIP
Des
crip
tion
Cou
pon
(%)
Dat
ePa
r Val
ueYi
eld
(%)
on S
ale
12/1
/201
312
/1/2
013
MBS
PM
T31
408C
4D5
FNM
A M
BS P
OO
L #8
4782
05.
5012
/1/2
035
176.
320.
000.
0012
/1/2
013
12/1
/201
3M
BS P
MT
3141
8U4W
1FN
MA
MBS
PO
OL
#AD
7136
5.00
7/1/
2040
2,61
6.35
0.00
0.00
11/2
7/20
1312
/3/2
013
BUY
3135
G0P
Q0
FAN
NIE
MAE
GLO
BAL
NO
TES
0.88
10/2
6/20
17(5
00,0
00.0
0)1.
080.
00
12/1
6/20
1312
/16/
2013
BUY
0653
8CFG
1BA
NK
OF
TOKY
O M
ITSU
BISH
I LTD
CO
MM
PAP
ER0.
006/
16/2
014
(650
,000
.00)
0.25
0.00
12/1
6/20
1312
/16/
2013
MAT
UR
ITY
0653
8BZG
1BA
NK
OF
TOKY
O M
ITSU
BISH
I CO
MM
PAP
ER0.
0012
/16/
2013
650,
000.
000.
000.
00
12/1
2/20
1312
/30/
2013
BUY
3130
A0G
K0FH
LB (C
ALLA
BLE)
GLO
BAL
NO
TES
0.38
12/3
0/20
15(3
50,0
00.0
0)0.
390.
0012
/23/
2013
12/3
0/20
13SE
LL91
2828
KJ8
US
TREA
SUR
Y N
OTE
S1.
753/
31/2
014
350,
000.
000.
1118
5.52
Tota
l1($
17,0
27.3
4)($
382.
27)
Not
e:
1. T
he P
ar A
mou
nt to
tal d
oes
not r
epre
sent
a g
ain
or lo
ss o
n tra
nsac
tions
. C
ash
and/
or e
arni
ngs
wer
e ut
ilized
to m
ake
up th
e di
ffere
nce
in b
uy/s
ell t
rade
am
ount
s.
PF
M A
sset
Man
agem
ent
LL
CSe
ctio
n B
- 1
0
SOhlson
Text Box
102

Flo
rid
a C
olle
ge S
yste
m R
isk
Man
agem
ent
Con
sort
ium
Inve
stm
ent
Rep
ort
- Q
uar
ter
En
ded
Dec
emb
er 3
1, 2
013
1 -
5 Y
ear
Inve
stm
ent
Por
tfol
io I
nte
rest
Rec
eive
d D
uri
ng
the
Qu
arte
rM
ATU
RIT
YIN
TER
EST
SETT
LETR
AN T
YPE
SEC
UR
ITY
DES
CR
IPTI
ON
CU
SIP
PAR
CO
UPO
ND
ATE
REC
EIVE
D
10/1
/201
3IN
TER
EST
MO
NEY
MAR
KET
FUN
DM
ON
EY00
02$0
.00
0.00
$1.5
710
/15/
2013
INTE
RES
TFH
LMC
MBS
PO
OL
#G06
091
3128
M8C
44$1
02,2
43.6
95.
505/
1/20
4046
8.62
10/1
5/20
13IN
TER
EST
FHLM
C M
BS P
OO
L #G
0836
931
28M
JMT4
$163
,365
.07
5.00
10/1
/203
968
0.69
10/1
5/20
13IN
TER
EST
FHLM
C M
BS P
OO
L #A
9253
331
2940
Y60
$171
,837
.04
4.50
6/1/
2040
644.
3910
/17/
2013
INTE
RES
TFR
EDD
IE M
AC G
LOBA
L N
OTE
S31
37EA
DD
8$3
90,0
00.0
00.
504/
17/2
015
975.
0010
/20/
2013
INTE
RES
TW
ELLS
FAR
GO
& C
OM
PAN
Y (F
LOAT
ING
)94
974B
FM7
$275
,000
.00
0.77
7/20
/201
650
9.36
10/2
5/20
13IN
TER
EST
FNM
A M
BS P
OO
L #A
H15
1331
38A2
VF3
$267
,768
.90
4.50
10/1
/204
01,
004.
1310
/25/
2013
INTE
RES
TFN
MA
MBS
PO
OL
#847
820
3140
8C4D
5$9
7,62
2.38
5.50
12/1
/203
544
7.44
10/2
5/20
13IN
TER
EST
FNM
A M
BS P
OO
L #A
D71
3631
418U
4W1
$165
,537
.81
5.00
7/1/
2040
689.
7410
/26/
2013
INTE
RES
TFN
MA
NO
TES
3139
8A4M
1$5
00,0
00.0
01.
6310
/26/
2015
4,06
2.50
10/3
1/20
13IN
TER
EST
US
TREA
SUR
Y N
OTE
S91
2828
UY4
$315
,000
.00
0.13
4/30
/201
519
6.88
10/3
1/20
13IN
TER
EST
US
TREA
SUR
Y N
OTE
S91
2828
UZ1
$1,7
20,0
00.0
00.
634/
30/2
018
5,37
5.00
11/1
/201
3IN
TER
EST
MIC
RO
SOFT
CO
RP
GLO
BAL
NO
TES
5949
18AS
3$1
10,0
00.0
01.
005/
1/20
1854
6.94
11/1
/201
3IN
TER
EST
MO
NEY
MAR
KET
FUN
DM
ON
EY00
02$0
.00
0.00
3.40
11/3
/201
3IN
TER
EST
APPL
E IN
C G
LOBA
L N
OTE
S03
7833
AJ9
$150
,000
.00
1.00
5/3/
2018
750.
0011
/9/2
013
INTE
RES
TG
ENER
AL E
LEC
TRIC
CAP
ITAL
CO
RP
CO
RPO
RAT
E36
962G
4T8
$500
,000
.00
2.25
11/9
/201
55,
625.
0011
/15/
2013
INTE
RES
TBE
RKS
HIR
E H
ATH
AWAY
NO
TES
0846
64BW
0$1
30,0
00.0
01.
305/
15/2
018
845.
0011
/15/
2013
INTE
RES
TFH
LMC
MBS
PO
OL
#G06
091
3128
M8C
44$9
8,24
2.80
5.50
5/1/
2040
450.
2811
/15/
2013
INTE
RES
TFH
LMC
MBS
PO
OL
#G08
369
3128
MJM
T4$1
60,5
06.2
75.
0010
/1/2
039
668.
7811
/15/
2013
INTE
RES
TFH
LMC
MBS
PO
OL
#A92
533
3129
40Y6
0$1
69,6
46.5
74.
506/
1/20
4063
6.17
11/2
1/20
13IN
TER
EST
FAN
NIE
MAE
GLO
BAL
NO
TES
3135
G0W
J8$4
80,0
00.0
00.
885/
21/2
018
2,10
0.01
11/2
5/20
13IN
TER
EST
FNM
A M
BS P
OO
L #A
H15
1331
38A2
VF3
$267
,373
.50
4.50
10/1
/204
01,
002.
6511
/25/
2013
INTE
RES
TFN
MA
MBS
PO
OL
#847
820
3140
8C4D
5$9
0,99
2.45
5.50
12/1
/203
541
7.05
11/2
5/20
13IN
TER
EST
FNM
A M
BS P
OO
L #A
D71
3631
418U
4W1
$162
,342
.29
5.00
7/1/
2040
676.
4311
/30/
2013
INTE
RES
TU
S TR
EASU
RY
NO
TES
9128
28JT
8$5
00,0
00.0
02.
0011
/30/
2013
5,00
0.00
11/3
0/20
13IN
TER
EST
US
TREA
SUR
Y N
OTE
S91
2828
SW1
$400
,000
.00
0.25
5/31
/201
450
0.00
12/2
/201
3IN
TER
EST
MO
NEY
MAR
KET
FUN
DM
ON
EY00
02$0
.00
0.00
0.65
12/5
/201
3IN
TER
EST
CH
EVR
ON
CO
RP
(CAL
LABL
E) G
LOBA
L N
OTE
S16
6764
AA8
$100
,000
.00
1.10
12/5
/201
755
2.00
12/1
5/20
13IN
TER
EST
FHLM
C M
BS P
OO
L #G
0609
131
28M
8C44
$94,
492.
895.
505/
1/20
4043
3.09
12/1
5/20
13IN
TER
EST
FHLM
C M
BS P
OO
L #G
0836
931
28M
JMT4
$157
,807
.32
5.00
10/1
/203
965
7.53
12/1
5/20
13IN
TER
EST
FHLM
C M
BS P
OO
L #A
9253
331
2940
Y60
$167
,802
.40
4.50
6/1/
2040
629.
2612
/23/
2013
INTE
RES
TBA
NK
OF
AMER
ICA
CO
RP
(FLO
ATIN
G)
0605
1GEV
7$3
25,0
00.0
01.
073/
22/2
016
879.
2012
/24/
2013
INTE
RES
TC
HEV
RO
N C
OR
P G
LOBA
L N
OTE
S16
6764
AE0
$320
,000
.00
1.72
6/24
/201
82,
748.
8012
/25/
2013
INTE
RES
TFN
MA
MBS
PO
OL
#AH
1513
3138
A2VF
3$2
66,9
76.4
74.
5010
/1/2
040
1,00
1.16
12/2
5/20
13IN
TER
EST
FNM
A M
BS P
OO
L #8
4782
031
408C
4D5
$90,
816.
055.
5012
/1/2
035
416.
2412
/25/
2013
INTE
RES
TFN
MA
MBS
PO
OL
#AD
7136
3141
8U4W
1$1
59,2
97.1
25.
007/
1/20
4066
3.74
12/2
9/20
13IN
TER
EST
FRED
DIE
MAC
GLO
BAL
NO
TES
3137
EAD
H9
$120
,000
.00
1.00
6/29
/201
760
0.00
Tota
l$4
2,85
8.70
PF
M A
sset
Man
agem
ent
LL
CSe
ctio
n B
- 1
1
SOhlson
Text Box
103

Flor
ida
Col
lege
Sys
tem
Ris
k M
anag
emen
t Con
sort
ium
Asse
t Allo
catio
n as
of
Dec
embe
r 31,
201
3*
Secu
rity
Type
1Am
ortiz
ed C
ost
(Incl
udes
Inte
rest
)Al
loca
tion
Perc
enta
geN
otes
Perm
itted
by
Pol
icy
In
Com
plia
nce
Uni
ted
Sta
tes
Trea
sury
Sec
uriti
es2,
518,
575.
69
17
.89%
100%
YES
Uni
ted
Sta
tes
Gov
ernm
ent A
genc
y S
ecur
ities
-
0.00
%10
0%YE
SFe
dera
l Ins
trum
enta
litie
s5,
513,
403.
15
39
.17%
100%
YES
Mor
tgag
e-B
acke
d S
ecur
ities
894,
843.
27
6.36
%10
0%YE
SC
ertif
icat
es o
f Dep
osit
-
0.00
%10
0%YE
SR
epur
chas
e A
gree
men
ts-
0.
00%
100%
YES
Com
mer
cial
Pap
er
1,27
3,89
0.62
9.05
%10
0%YE
SC
orpo
rate
Not
es
3,73
8,48
0.05
26.5
6%10
0%YE
SA
sset
-Bac
ked
Sec
urite
is
-
0.00
%10
0%YE
SB
anke
rs' A
ccep
tanc
es-
0.
00%
100%
YES
Sta
te a
nd/o
r Loc
al G
over
nmen
t Deb
t-
0.
00%
100%
YES
Mon
ey M
arke
t Mut
ual F
unds
136,
383.
21
0.97
%10
0%YE
SIn
terg
over
nmen
tal I
nves
tmen
t Poo
l-
0.
00%
100%
YES
Not
es:
1. E
nd o
f mon
th tr
ade-
date
am
ortiz
ed c
ost o
f por
tfolio
hol
ding
s, in
clud
ing
accr
ued
inte
rest
. *
Doe
s no
t inc
lude
bon
d pr
ocee
ds.
© P
FM A
sset
Man
agem
ent L
LC1
United States
Treasury
Securities
17.89%
Fede
ral
Instrumen
talities
39.17%
Mortgage‐Ba
cked
Securities
6.36%
Commercial Paper
9.05%
Corporate Notes
26.56%
Mon
ey M
arket
Mutual Fun
ds0.97%
SOhlson
Text Box
104

Flor
ida
Col
lege
Sys
tem
Ris
k M
anag
emen
t Con
sort
ium
Asse
t Allo
catio
n as
of
Dec
embe
r 31,
201
3*
Indi
vidu
al Is
suer
Bre
akdo
wn
Amor
tized
Cos
t(In
clud
es In
tere
st)
Allo
catio
n Pe
rcen
tage
Not
esPe
rmitt
ed
by P
olic
yIn
C
ompl
ianc
eG
over
nmen
t Nat
iona
l Mor
tgag
e A
ssoc
iatio
n (G
NM
A)
-
0.00
%10
0%YE
SFe
dera
l Far
m C
redi
t Ban
k (F
FCB
)-
0.
00%
100%
YES
Fede
ral H
ome
Loan
Ban
k (F
HLB
)34
9,89
8.94
2.
49%
100%
YES
Fede
ral N
atio
nal M
ortg
age
Ass
ocia
tion
(FN
MA
)2,
676,
881.
20
19
.02%
100%
YES
Fede
ral H
ome
Loan
Mor
tgag
e C
orpo
ratio
n (F
HLM
C)
3,38
1,46
6.28
24.0
2%10
0%YE
SB
NP
Par
ibas
Com
mer
cial
Pap
er62
4,63
9.93
4.
44%
5%YE
SB
ank
of T
okyo
Mits
ubis
hi C
omm
erci
al P
aper
649,
250.
69
4.61
%5%
YES
Gen
eral
Ele
ctric
Cor
pora
te N
otes
492,
918.
55
3.50
%5%
YES
Che
vron
Cor
pora
te N
otes
420,
186.
63
2.99
%5%
YES
Ban
k of
Am
eric
a C
opor
ate
Not
es32
5,07
6.98
2.
31%
5%YE
SB
erks
hire
Hat
haw
ay C
orpo
rate
Not
es25
0,36
9.93
1.
78%
5%YE
SA
pple
Inc.
Cor
pora
te N
otes
149,
761.
83
1.06
%5%
YES
Wal
t Dis
ney
Co
Cor
pora
te N
otes
406,
441.
11
2.89
%5%
YES
IBM
Cor
pora
te N
otes
165,
198.
90
1.17
%5%
YES
JP M
orga
n C
hase
Cor
pora
te N
otes
401,
215.
08
2.85
%5%
YES
Mic
roso
ft C
orpo
rate
Not
es11
0,12
3.30
0.
78%
5%YE
SB
ank
of N
ew Y
ork
Mel
lon
Cor
pora
te N
otes
401,
628.
12
2.85
%5%
YES
Wel
ls F
argo
& C
ompa
ny C
orpo
rate
Not
es27
5,42
4.63
1.
96%
5%YE
SC
oca-
Col
a C
orpo
rate
Not
es75
,012
.30
0.53
%5%
YES
Am
eric
an H
onda
Cor
pora
te N
otes
99,9
31.5
6
0.
71%
5%YE
SJo
hn D
eere
Cor
pora
te N
otes
165,
191.
13
1.17
%5%
YES
Mon
ey M
arke
t - S
wee
p A
ccou
nt13
6,38
3.21
0.
97%
100%
YES
© P
FM A
sset
Man
agem
ent L
LC2
SOhlson
Text Box
105

Flo
rid
a C
olle
ge S
yste
m R
isk
Man
agem
ent
Con
sort
ium
Inve
stm
ent
Rep
ort
- Q
uar
ter
En
ded
Dec
emb
er 3
1, 2
013
TA
B I
II
SOhlson
Text Box
106

Flo
rid
a C
olle
ge S
yste
m R
isk
Man
agem
ent
Con
sort
ium
Inve
stm
ent
Rep
ort
- Q
uar
ter
En
ded
Dec
emb
er 3
1, 2
013
Inse
rtM
onth
End
Sta
tem
enth
ere
toco
mpl
ete
the
repo
rt.
Inco
nsid
erat
ion
ofth
esa
fety
and
secu
rity
ofou
rcl
ient
’sse
nsiti
vein
form
atio
n,P
FMA
sset
Man
agem
ent’s
com
plia
nce
depa
rtmen
tdo
esno
tal
low
the
incl
usio
nof
mon
then
dst
atem
ents
inan
yel
ectro
nic
com
mun
icat
ion
incl
udin
gth
isve
rsio
nof
the
quar
terly
perfo
rman
cere
port.
Sta
tem
ents
are
avai
labl
eon
line
atw
ww
.pfm
.com
logi
nan
dcl
ick
onth
elin
kto
“Mon
thly
Sta
tem
ents
”on
the
left
side
ofth
esc
reen
.
The
mos
tcur
rent
stat
emen
tsar
eal
way
sav
aila
ble
toth
ecl
ient
onlin
e,ho
wev
erth
eyca
non
lybe
acce
ssed
with
the
desi
gnat
edus
erna
me
and
pass
wor
d.
SOhlson
Text Box
107

Information Item 6.a. Three Year Performance/Projection
Property/Casualty & Administrative Services

Agenda Item 4.a.1.
Property & Casualty Three Year Results and Forecast
2011 - 2013 PROPERTY RESULTS
1. Property values increased 9% and average annual WIND loss increased 17%
(determined by RMS v11)
2. Average annual wind loss increased by 121% from 2011 to 2012 due to new wind model RMS v11.
3. AJG financially supported and conducted an underwriting data collection project.
This projected had two goals: 1) Present all possible Property program structures and options to determine optimal Property program and 2) collect all necessary Property underwriting data to minimize impact of RMS v11.
4. Underwriting data collection project’s outcome was 1) Operating committee
determined the desired Property program structure was currently being utilized and 2) 104% reduction in average annual wind loss from 2011 to 2013.
5. In person underwriter meetings were conducted for the 2013 renewal with the
London marketplace. This visit in conjunction with the underwriting data collection project produced four key results.
a. 40% increase in wind capacity for 2013. b. London’s total capacity increased to 25% of total program. c. Created competition throughout program driving rate reductions. d. Created stable capacity throughout program for future renewal success.
6. The Property rate increased by 13% from 2011 to 2013, which is approximately
8% below market for this period.
7. Executed FCSRMC/College Agreements
SOhlson
Text Box
108
SOhlson
Text Box
SOhlson
Text Box
Information Item 6.a.

2011 – 2013 CASUALTY RESULTS
1. Workers’ Compensation payroll exposure increased from $1,203,990,115 to $1,276,680,568 (6%).
2. The Workers’ Compensation premium during this period went from $592,628 to $598,017.
3. The total Workers’ Compensation collateral requirement has been reduced from
$8.7M to $5.6M. 4. Further refinement of School Leaders coverage wording addressing coverage
trigger for EEOC proceedings. 5. Completed School Leaders Limit of Liability analysis demonstrating that
FCSRMC limits purchased are in line with other college/education programs 6. Over a three year period, equipment breakdown premium has been reduced from
$234,291 to $178,428. This cost reduction includes adverse claims experience. 7. ERM Implementation
a. Planning meetings October 2012 b. Workshop November 2012 – FCSRMC Mission Statement c. Working Meeting – Key Risks Review January 2013 d. Ops Meeting Report January 2013 e. Risk Assessment Workshop March 2013 – Student Internships f. Working Meeting November 2013 – set course for 2014
8. Cyber Presentation (8/13) and indication for Cyber coverage will be provided for 2014 renewal.
9. Quarterly Claim Reviews held to review and strategize on various Workers’ Compensation and General Liability claims.
10. Propose Plan Document wording updated to better align definition and terms of
the property coverage with the excess property insurance program
11. Development and Testing of Accident and Incident Web Reporting Tool
12. Research options and post Bid Request for RMIS (Risk Management Information System), with assistance from Fiscal Agent.
SOhlson
Text Box
109

2014 - 2016 FORECAST
1. The Property marketplace for 2014 is softening. After two years of rate increases and no storms more wind capacity has entered the market and is expected to drive rates down.
2. A visit to London is scheduled for December 2014 to visit underwriters and solicit more competition and premium reduction.
3. Continue to pursue further reductions in cash collateral required by former Workers’ Compensation carrier (ACE).
4. Dedicated safety and loss prevention resource provided by AJG.
5. Monthly Safety Newsletters
6. Shoe’s for Crews Initiative
7. ERM Implementation efforts
a. Update 3 times a year at OPS b. Include sessions (s) at 2014 Risk Summit c. Develop ERM library and post to FCSRMC website
8. Monitor and report on emerging risks and exposures.
9. Implement and utilize RMIS system to provide access to data to better manage and
mitigate risk for member institutions. 10. Post Lawyer Application Form for prospective legal panel members. 11. Review Direct Service Organization/Foundation Insurance needs for possible current
coverage or overlaps through the FCSRMC.
SOhlson
Text Box
110

Information Item 6.b. Three Year Performance/Projection
Employee Benefit Plans

2011 – 2013 RESULTS
• Enrollment membership increased 17% to 22 colleges and 15,000 enrollees.
• Health program average annual rate change only 2.78% versus marketplace of 10.05%.
• Health program fund balance reserves increased 58% to $25,754,850
(8/31/2013).
• Actuarially and credible certified benchmark report with over 54 million lives indicates the Consortium health program cost share is lower than all national, regional (South) and industry specific (Education – South) comparisons. A lower cost share is an indicator that the Consortium health program is absorbing a larger percentage of total medical expenditures that the peer groups.
• $15.6 million in reduced fee costs for the health program were secured
through successful contract negotiations with the plan administrator Florida Blue through 2017.
• The health program annual actuarial 112.08 filing certifications were
successfully developed for and approved by the State of Florida each year.
• Employing the collective purchasing power of the participating colleges, market evaluations are conducted periodically to ensure the highest value employee benefit plan products at the most competitive rates. During this time period, formal requests for proposals were completed by Mercer for the group life, disability, dental and vision products. The Mercer consulting fees were paid by the winning carriers so there was no expense to the Consortium or the colleges. These efforts resulted in the selection of industry leading vendors and a savings of over one million dollars in premiums and multiple year rate guarantees.
• A wellness program valued at over $500,000 was secured and implemented
at no cost from the health program plan administrator. The Consortium has introduced member and college incentives within the wellness program.
• $214,000 was recovered on behalf of the participating colleges from the
Federal Government Early Retiree Reinsurance Program.
EMPLOYEE BENEFIT PLANS Three Year
Results and Forecast
SOhlson
Text Box
111
SOhlson
Text Box
Information Item 6.b.

• Over $300,000 was saved for the 25 colleges that participate in the Consortium sponsored post retirement actuarial evaluations.
• During the period, a health program claims and procedural audit, a medical
management assessment, a student health plan evaluation and a smoke free roadmap were all completed successfully.
• The coverage mandates and fees associated with the emerging Health Care
Reform were closely managed, monitored and implemented as required.
• The emerging Private Exchanges were evaluated.
• A work effort to evaluate and assess the marketplace benefit administration and consolidated billing capabilities was initiated. These services are needed to provide the employee benefit plans with a vendor supplied automated enrollment, compliance and accounts receivable administration. The work resulted in the formation of a Vetting Committee consisting of participating college and Consortium representatives. A finalist vendor was identified and is being presented to the Operations Committee for approval.
2014 -2016 FORECAST
• The impacts of Health Care Reform will continue to be closely monitored and managed to ensure compliance. The fees will need to be accounted for in the self-insured health program financial assessment.
• Assuming approval, the new automated enrollment, compliance and accounts
receivable system and process will need to be closely monitored and managed to ensure a completely successful and satisfactory outcome for all stake holders.
• The self-insured health program plan designs, cost and utilization analysis,
funding development, rate setting and reserves assessment will require expert management and monitoring to ensure a continuation of results and outcomes that are more favorable than the marketplace.
• The ongoing management and promotion of the member wellness program
will be an important contributor to favorable health plan cost and utilization results.
• An ongoing effort in identifying, evaluating and negotiating high value and
competitive pricing from the marketplace using the collective purchasing power of the participating colleges will be paramount in the continuation of attractive product offerings and premium renewals.
• The evaluation and assessment of the individual college employee benefit
plan needs and requirements will be an important component of maintaining a productive and attractive product portfolio.
SOhlson
Text Box
112

Information Item 6.c. Operations Committee Members
as of January 30, 2014 and March 01, 2014

FLORIDA COLLEGE SYSTEM RISK MANAGEMENT CONSORTIUM OPERATIONS COMMITTEE MEMBERS AS OF JANUARY 24, 2014
VOTING MEMBERS Dr. Chuck Mojock (Chair) 06/30/14 President Lake-Sumter State College 9501 Highway 441 Leesburg, FL 34788-8751 Office: 352-365-3523 Fax: 352-365-3548 Cell: 352-636-8524 E-MAIL: [email protected] Dr. James Henningsen (Vice-Chair) 06/30/14 President College of Central Florida 3001 SW College Road Ocala, FL 34477 Office: 352-873-5835 Fax: 352-873-5847 Cell: E-MAIL: [email protected] Richard Becker 02/28/16 Vice President, Administration & Business Services Palm Beach State College 4200 Congress Avenue Lake Worth, FL 33461-4796 Office: 561-868-3137 Fax: 561-868-3585 Cell: 561-523-0499 E-MAIL: [email protected] Ken Burdzinski 02/28/16 Vice President, Business Services Pasco-Hernando Community College 10230 Ridge Road New Port Richey, FL 34654-5199 Office: 727-816-3412 Fax: 727-816-3450 Cell: 727-207-8139 E-MAIL: [email protected] *Gean Ann Emond 02/28/17 Vice President, Business Affairs Pensacola State College 1000 College Boulevard Pensacola, FL 32504-8998 Office: 850-484-1728 Fax: 850-484-1995 Cell: 850-982-7298 E-MAIL: [email protected] Bill Hunter 02/28/15 Director, Human Resources North Florida Community College 325 NW Turner Davis Drive Madison, FL 32340 Office: 850-973-9448 Fax: 850-973-9435 Cell: 386-303-1765 E-MAIL: [email protected] E.H. Levering 02/28/15 Senior Vice President, Bus Affairs & Chief Financial Officer Miami Dade College 11011 SW 104th Street, Room 1131 Miami, FL 33176-3393 Office: 305-237-2389 Fax: 305-237-0957 Cell: 305-297-2042 E-MAIL: [email protected] Al Little 02/28/17 VP for Finance and Administration/CFO St. Johns River State College 5001 St. Johns Avenue Palatka, FL 32177-3897 Office: 386-312-4116 Fax: 386-312-4167 Cell: 321-403-4747 E-MAIL: [email protected]
Glenn Little 02/28/15 Vice President of Administrative Services South Florida State College 600 West College Drive Avon Park, FL 33825-9356 Office: 863-784-7218 Fax: 863-784-7497 Cell: 863-835-1152 E-MAIL: [email protected] NON-VOTING MEMBERS Chauncey Fagler Executive Director Florida College System Risk Management Consortium 4500 NW 27th Street, Suite D2 Gainesville, FL 32606 Office: 352-955-2190 Fax: 352-955-2069 Cell: 352-283-5597 E-MAIL: [email protected] Ginger Gibson Vice President for Admin Affairs/CFO Santa Fe College 3000 NW 83rd Street, Room F028 Gainesville, FL 32606-6200 Office: 352-395-5208 Fax: 352-395-7020 Cell: 352-572-9880 E-MAIL: [email protected] Dr. John Holdnak Florida Department of Education Division of Florida Colleges Executive Vice Chancellor 325 West Gaines Street, Suite 1548 Tallahassee, FL 32399 Office: 850-245-0448 Fax: 850-245-9454 Cell: 850-832-2306 E-MAIL: [email protected] IN TRAINING Mae Kline AVP, Human Resources Seminole State College 100 Weldon Boulevard Sanford, FL 32773 Office: 407-708-2170 Fax: 407-708-2359 Cell: E-MAIL: [email protected] Barbara Larson Vice President of Administration/CFO Hillsborough Community College 39 Columbia Drive Tampa, FL 33606 Office: 813-253-7015 Fax: 813-253-7183 Cell: E-MAIL: [email protected] GENERAL COUNSEL Thomas M. Gonzalez Thompson, Sizemore & Gonzalez One Tampa City Center 201 North Franklin Street, Suite 1600 Tampa, FL 33602 Office: 813-273-0050 ext 466 Fax: 813-273-0072 Cell: 813-727-4566
*Gean Ann Emond will serve for one year of the 3 year term. Peter Elliott will serve the remaining 2 years of the term.
SOhlson
Text Box
113
SOhlson
Text Box
SOhlson
Text Box
Information Item 6.c.

FLORIDA COLLEGE SYSTEM RISK MANAGEMENT CONSORTIUM OPERATIONS COMMITTEE MEMBERS AS OF MARCH 01, 2014
VOTING MEMBERS Dr. Chuck Mojock (Chair) 06/30/14 President Lake-Sumter State College 9501 Highway 441 Leesburg, FL 34788-8751 Office: 352-365-3523 Fax: 352-365-3548 Cell: 352-636-8524 E-MAIL: [email protected] Dr. James Henningsen (Vice-Chair) 06/30/14 President College of Central Florida 3001 SW College Road Ocala, FL 34477 Office: 352-873-5835 Fax: 352-873-5847 Cell: E-MAIL: [email protected] Richard Becker 02/28/16 Vice President, Administration & Business Services Palm Beach State College 4200 Congress Avenue Lake Worth, FL 33461-4796 Office: 561-868-3137 Fax: 561-868-3585 Cell: 561-523-0499 E-MAIL: [email protected] Ken Burdzinski 02/28/16 Vice President, Business Services Pasco-Hernando Community College 10230 Ridge Road New Port Richey, FL 34654-5199 Office: 727-816-3412 Fax: 727-816-3450 Cell: 727-207-8139 E-MAIL: [email protected] *Gean Ann Emond 02/28/17 Vice President, Business Affairs Pensacola State College 1000 College Boulevard Pensacola, FL 32504-8998 Office: 850-484-1728 Fax: 850-484-1995 Cell: 850-982-7298 E-MAIL: [email protected] Bill Hunter 02/28/15 Director, Human Resources North Florida Community College 325 NW Turner Davis Drive Madison, FL 32340 Office: 850-973-9448 Fax: 850-973-9435 Cell: 386-303-1765 E-MAIL: [email protected] E.H. Levering 02/28/15 Senior Vice President, Bus Affairs & Chief Financial Officer Miami Dade College 11011 SW 104th Street, Room 1131 Miami, FL 33176-3393 Office: 305-237-2389 Fax: 305-237-0957 Cell: 305-297-2042 E-MAIL: [email protected] Al Little 02/28/17 VP for Finance and Administration/CFO St. Johns River State College 5001 St. Johns Avenue Palatka, FL 32177-3897 Office: 386-312-4116 Fax: 386-312-4167 Cell: 321-403-4747 E-MAIL: [email protected]
Glenn Little 02/28/15 Vice President of Administrative Services South Florida State College 600 West College Drive Avon Park, FL 33825-9356 Office: 863-784-7218 Fax: 863-784-7497 Cell: 863-835-1152 E-MAIL: [email protected] NON-VOTING MEMBERS Chauncey Fagler Executive Director Florida College System Risk Management Consortium 4500 NW 27th Street, Suite D2 Gainesville, FL 32606 Office: 352-955-2190 Fax: 352-955-2069 Cell: 352-283-5597 E-MAIL: [email protected] Ginger Gibson Vice President for Admin Affairs/CFO Santa Fe College 3000 NW 83rd Street, Room F028 Gainesville, FL 32606-6200 Office: 352-395-5208 Fax: 352-395-7020 Cell: 352-572-9880 E-MAIL: [email protected] Dr. John Holdnak Florida Department of Education Division of Florida Colleges Executive Vice Chancellor 325 West Gaines Street, Suite 1548 Tallahassee, FL 32399 Office: 850-245-0448 Fax: 850-245-9454 Cell: 850-832-2306 E-MAIL: [email protected] IN TRAINING Mae Kline AVP, Human Resources Seminole State College 100 Weldon Boulevard Sanford, FL 32773 Office: 407-708-2170 Fax: 407-708-2359 Cell: E-MAIL: [email protected] Peter Elliott Vice President of Administration/CFO Polk State College 999 Avenue H, NE Winter Haven, FL 33881 Office: 863-297-1081 Fax: 863-297-1011 Cell: E-MAIL: [email protected] GENERAL COUNSEL Thomas M. Gonzalez Thompson, Sizemore & Gonzalez One Tampa City Center 201 North Franklin Street, Suite 1600 Tampa, FL 33602 Office: 813-273-0050 ext 466 Fax: 813-273-0072 Cell: 813-727-4566
*Gean Ann Emond will serve for one year of the 3 year term. Peter Elliott will serve the remaining 2 years of the term.
SOhlson
Text Box
114
SOhlson
Text Box