Risk Based Estimating Self Modeling Ovidiu Cretu, Ph.D., P.E. Terry Berends, P.E. David Smelser.
23
Risk Based Estimating Risk Based Estimating Self Modeling Self Modeling Ovidiu Cretu, Ph.D., P.E. Ovidiu Cretu, Ph.D., P.E. Terry Berends, P.E. Terry Berends, P.E. David Smelser David Smelser W ashington S tate D epartm ent of T ransportation
-
Upload
clinton-knight -
Category
Documents
-
view
216 -
download
0
Transcript of Risk Based Estimating Self Modeling Ovidiu Cretu, Ph.D., P.E. Terry Berends, P.E. David Smelser.

Risk Based EstimatingRisk Based EstimatingSelf ModelingSelf Modeling
Ovidiu Cretu, Ph.D., P.E.Ovidiu Cretu, Ph.D., P.E.Terry Berends, P.E.Terry Berends, P.E.David SmelserDavid Smelser
Washington StateDepartment of Transportation


Threat 1
All known and unknown All known and unknown risks are equally weightedrisks are equally weighted
Allows little control over the Allows little control over the project cost/scheduleproject cost/schedule
Reactive Reactive
Clear recognition of Clear recognition of project’s threats and project’s threats and opportunitiesopportunities
Allows a reasonable Allows a reasonable control over the project control over the project cost/schedulecost/schedule
ProactiveProactive
Traditional Estimating Risk Based Estimate
Base Estimate
Base Estimate
Contin
genc
y
Opp
ortu
ni
ty
Threat 2
New Threats

En
gin
eer’
s
Esti
mate
Identify Quantify Risks
Likelihood of Occurrence [%]Impact [$,Mo]
Validate Base CostDuration
Cost [$]Duration [Mo]
Variability+2% to +10%
Ris
k
Based
Esti
mat
eMonte Carlo Method

Base Cost and Base Cost and Schedule ValidationSchedule Validation
Review the project assumptionsReview the project assumptions Review the project cost and schedule Review the project cost and schedule
based on the information availablebased on the information available Update unit priceUpdate unit price Update quantitiesUpdate quantities
Capture the cost of unknown cost of Capture the cost of unknown cost of miscellaneous itemsmiscellaneous items
Remove some contingenciesRemove some contingencies

Variability of the Variability of the Base Cost and ScheduleBase Cost and Schedule
The entire construction cost/durationThe entire construction cost/duration A major group of pay itemsA major group of pay items An individual pay itemAn individual pay item
Symmetrical distributionSymmetrical distribution Beta3 DistributionBeta3 Distribution

En
gin
eer’
s
Esti
mate
Validate Base CostDuration
Identify Quantify Risks
Likelihood of Occurrence [%]Impact [$,Mo]
Cost [$]Duration [Mo]
Variability+2% to +10%
Ris
k
Based
Esti
mat
eMonte Carlo Method

Risks Identification and Risks Identification and QuantificationQuantification
Focus is on Focus is on Identify the Identify the key key ‘risky’ events‘risky’ events Estimate Estimate how likelyhow likely it is that the risky it is that the risky
event will materializeevent will materialize Estimate Estimate why why and by and by how muchhow much
events may turn out differently from the events may turn out differently from the base estimatebase estimate

Probability of Risk Probability of Risk OccurrenceOccurrence
Lowest value = 0 Lowest value = 0 Highest value = 1 Highest value = 1 Middle value = 0.5 Middle value = 0.5
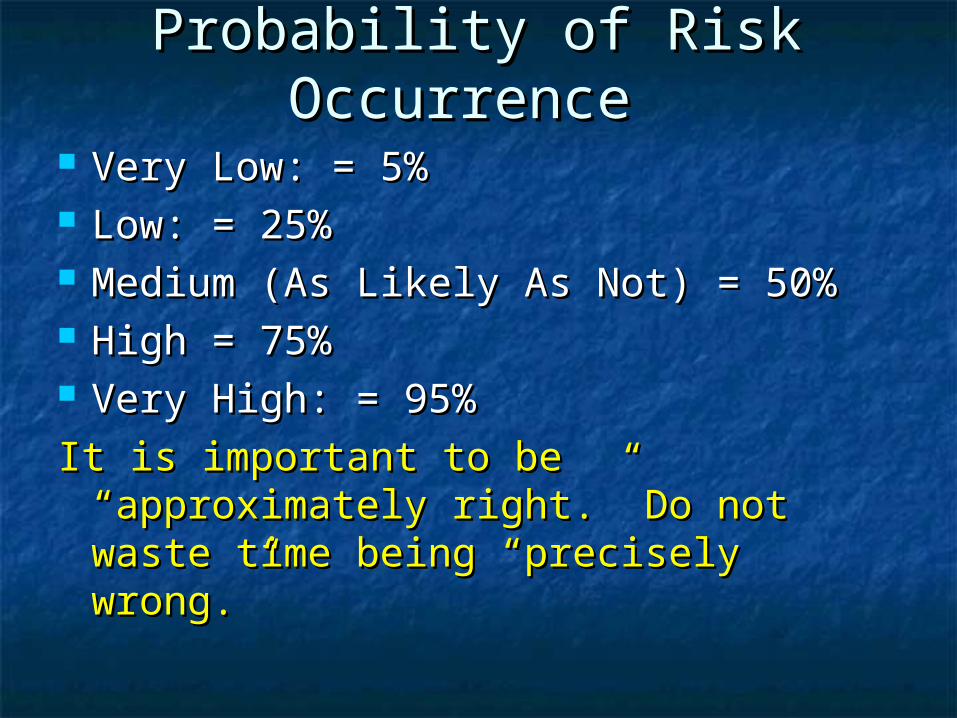
Probability of Risk Probability of Risk Occurrence Occurrence
Very Low: = 5%Very Low: = 5% Low: = 25%Low: = 25% Medium (As Likely As Not) = 50%Medium (As Likely As Not) = 50% High = 75%High = 75% Very High: = 95%Very High: = 95%
It is important to be “approximately It is important to be “approximately right.” Do not waste time being right.” Do not waste time being “precisely wrong.”“precisely wrong.”

Define Range and Shape Define Range and Shape
Three Point Estimate: about as much Three Point Estimate: about as much information an expert can provide.information an expert can provide.
1.1. ““MIN” the first pointMIN” the first point2.2. ““MAX” the second pointMAX” the second point3.3. ““The Best-guess” The Best-guess”
Range
Shape

Shape Shape
““The Best-guess”: This will be the The Best-guess”: This will be the expert’s “median guess”expert’s “median guess”
Median: Actual outcomes evenly Median: Actual outcomes evenly distributed over the median guessdistributed over the median guess
““The Best-guess” can’t be too close to The Best-guess” can’t be too close to the max or the min.the max or the min.

Entire range (100 to 700) includes
100% of the possibilities
MIN = 100
MAX = 700
ELICIT VALUES:
Best Guess = 400
Most Likely=400

Pert(100, 130, 700)
0 100 200 300 400 500 600 700 800
Entire range (100 to 700) includes
100% of the possibilities
MIN = 100
MAX = 700
ELICIT VALUES:
Best Guess = 200
Most Likely 130
Expert: Costs are more likelyto be at the lower end of the range

Pert(100, 670, 700)
0 100 200 300 400 500 600 700 800
Entire range (100 to 700) includes
100% of the possibilities
MIN = 100
MAX = 700
ELICIT VALUES:
Best Guess = 600
Most Likely=670
Expert: Costs are more likelyto be at the higher end of the range

En
gin
eer’
s
Esti
mate
Validate Base CostDuration
Identify Quantify Risks
Likelihood of Occurrence [%]Impact [$,Mo]
Cost [$]Duration [Mo]
Variability+2% to +10%
Ris
k
Based
Esti
mat
eMonte Carlo Method

Ris
k
Based
Esti
mat
e0.00
0.02
0.04
0.06
0.08
0.10
0.12
0.14
79
.0
81
.8
84
.6
87
.4
90
.2
93
.0
95
.8
98
.6
10
1.4
10
4.2
10
7.0
10
9.8
11
2.6
11
5.4
11
8.2
12
1.0
Total Project Cost $ Million
Pro
bab
ility
Cost
CY [$]
YOE [$]
Schedule
End CN
Ad Date
0%
10%
20%
30%
40%
50%
60%
70%
80%
90%
100%
Jan-
08
Apr-0
8
Jul-0
8
Oct
-08
Jan-
09
Apr-0
9
Jul-0
9
Oct
-09
Jan-
10
Apr-1
0
Jul-1
0
End of Construction
Cum
ulat
ive
Prob
abili
ty
RESULTS

INPUT OUTPUT
Base CostDurationVariability
Estimating Date
Escalation Factor
Risks Cost, Duration
StatusProject PhaseProbabilityRange and ShapeCritical Path Info
Markups
CostCYYOE
Diagram
Table Schedule
AD DateEnd CN
DiagramTable
Sensitivity Analysis
TheModel
10,000 Plausible
Cases
MCM
RBE

MCS -- DEMOMCS -- DEMO

Conclusions:Conclusions: Better understanding of the project’s Better understanding of the project’s
challenges challenges Crafts the project risk management plan Crafts the project risk management plan
with clear target on how to enhance the with clear target on how to enhance the project value project value
Helps in maximizing the project’s Helps in maximizing the project’s opportunities and reducing or eliminating opportunities and reducing or eliminating the project’s threatsthe project’s threats

The RBE Self-modelingThe RBE Self-modeling
Two Major FunctionsTwo Major Functions Estimating FunctionEstimating Function Risk Management Function Risk Management Function
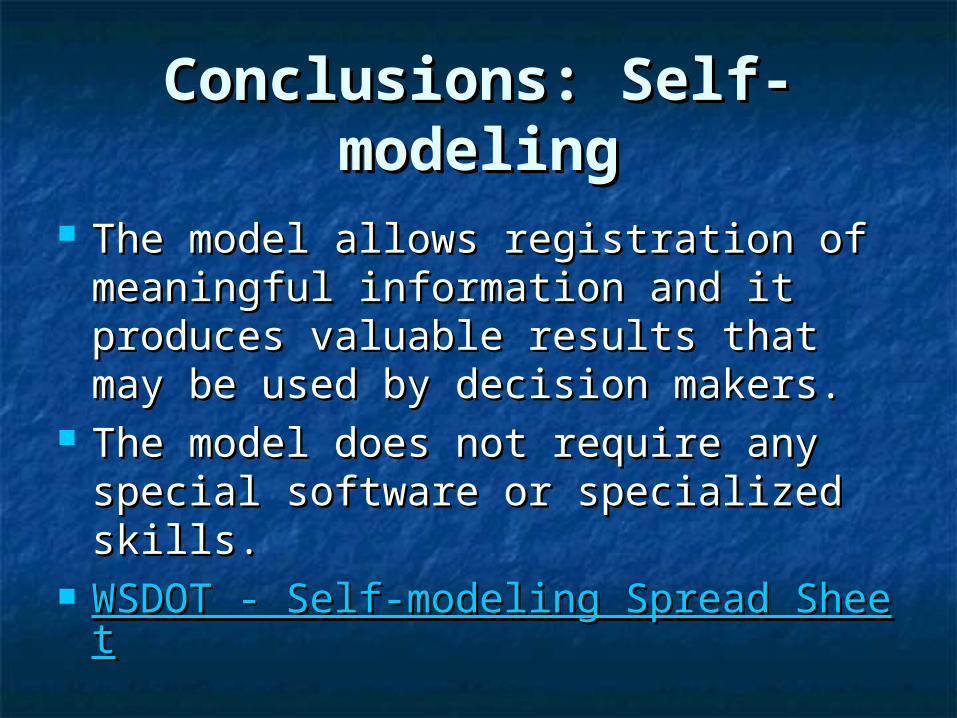
Conclusions: Self-Conclusions: Self-modelingmodeling
The model allows registration of The model allows registration of meaningful information and it meaningful information and it produces valuable results that may produces valuable results that may be used by decision makers. be used by decision makers.
The model does not require any The model does not require any special software or specialized skills.special software or specialized skills.
WSDOT - Self-modeling Spread SheetWSDOT - Self-modeling Spread Sheet

Any Questions??Any Questions??