Riding the LNG Wave - ESAI Energy LLC ENERGY WHITE PAPER Purpose This White Paper, Riding the LNG...
22
Riding the LNG Wave An Assessment of the Global LNG Market to 2025 ESAI Energy 401 Edgewater Pl Wake field, MA 01880 Tel. 781 ‐ 245 ‐ 2036 www.esaienergy.com An ESAI Energy White Paper
Transcript of Riding the LNG Wave - ESAI Energy LLC ENERGY WHITE PAPER Purpose This White Paper, Riding the LNG...

Riding the LNG Wave
An Assessment of the Global LNG Market to 2025
ESAI Energy 401 Edgewater Pl
Wakefield, MA 01880 Tel. 781‐245‐2036
www.esaienergy.com
An ESAI Energy White Paper

ESAI ENERGY WHITE PAPER
Purpose
This White Paper, Riding the LNG Wave: An Assessment of the Global LNG Market to 2025 was prepared
by ESAI Energy, LLC, an energy research and forecasting firm. The analysis presented is derived from a bottom up
database with projections of natural gas supply and demand by country. In addition, the forecast reflects the
information ESAI Energy has compiled in its global LNG plant database, which covers all liquefaction and
regasification plants in operation, under construction, and planned.
In addition to tracking location and capacity, ESAI Energy has developed estimates of capital and operating
costs and calculated breakeven production costs, generating IRRs and annual cashflow, for each liquefaction plant
in operation plus 15 newly operational/under construction, and six projects that are close to final investment
decision (FID) status.
The plant analysis also reflects ESAI Energy’s LNG shipping model, which provides detailed cost calculations
for delivery from each LNG production plant to over 30 LNG import locations. The model includes calculations for
shipping distance, steaming speed, daily charter rate, port and canal charges, bunkering costs and LNG boil‐off as
fuel. This plant by plant analysis, coupled with our country by country analysis of natural gas supply and demand,
underpins our projections of LNG supply, demand and trade.
For more information on how ESAI Energy can help with your existing LNG business or pending investment,
please contact Ken Downey at [email protected]
About ESAI Energy
Energy Security Analysis, Inc was incorporated in 1983, and since then, has provided independent analysis
of global, regional, and national energy markets. In 2009, ESAI Power, LLC and ESAI Energy, LLC were created. ESAI
Energy carries on ESAI’s work in the LNG, crude oil, petroleum product, NGL and alternative fuels markets.
ESAI Energy’s holistic approach to analysis combines thorough research, bottom‐up analysis of empirical–
source data and specialized economic, political and regulatory expertise to deliver dependable forecasts of the
future of supply, demand, trade and price.
©2017 ESAI Energy, LLC. The estimates, forecasts and analyses in this report are our judgment and are subject to
change without notice. No warranty is made or implied.

No part of this publication may be duplicated, transmitted or stored without ESAI Energy’s written permission. ©2017 ESAI Energy, LLC
2
ESAI ENERGY WHITE PAPER
Executive Summary
The global LNG market is going through a tumultuous time. LNG liquefaction production has grown
dramatically over the past ten years and LNG demand growth has become stagnant in many markets. Spot LNG prices
have collapsed to the lowest levels in twenty years, and some buyers secured too much LNG supply without firm
customers. Surplus cargoes will soon flood the market as new projects start up in 2017‐2018, and final investment
decisions for many new liquefaction projects have been delayed or cancelled.
With these negative market factors weighing on the sector, gas producers, LNG developers, buyers and
investors are trying to assess where the sector is going in both the short and long‐term. Questions include:
Will supply growth continue to outpace demand growth?
When will the surplus end?
Which liquefaction projects are well positioned, which projects will struggle?
What are the options for LNG buyers if they have over‐contracted LNG volume?
How will LNG trade and pricing change?
The biggest driver of the current market situation is a rapid build‐out of LNG production and pending over‐
capacity. At the end of 2016, total LNG liquefaction capacity was about 42 bcfd (317 MTPA1) and by 2020 global
capacity will reach 60 bcfd (446 MTPA). During this period, the emergence of the U.S. as an LNG exporter will be
significant. U.S. exports will rise from about 2.0 bcfd in 2017 to over 8.0 bcfd by 2020. This global growth in LNG
capacity will outpace demand through the beginning of the next decade.
LNG provides a secure gas supply in regions with no indigenous gas production and where import pipeline
gas infrastructure is lacking. Uncertainties impacting demand forecasts include the relative price of competing fuels
for power generation, financing and credit challenges for regasification projects in developing countries, and pollution
and climate policy goals. Global LNG demand is forecast to grow by about 8 percent annually through 2020, going
from 37 bcfd (276 MTPA) in 2017 to about 46 bcfd (344 MTPA) in 2020. The best prospects for demand growth come
from emerging markets, especially in Asia. There is also tremendous potential demand for LNG as a marine fuel but
logistical challenges will temper growth until the mid‐2020s.
The growing awareness of the emerging supply‐demand imbalance is slowing investment decisions for
development of new LNG liquefaction capacity. Future investment activity will need to target the right project size
and geography. Given our current LNG demand forecast, barring any significant events, we believe that the LNG
market will not eliminate its surplus capacity until about 2024. The imbalance is estimated to reach a high of 6.1 bcfd
in 2020 before dropping off in the following four years. By 2025, the next wave of LNG liquefaction will be needed as
demand catches up and then exceeds supply.
1 MTPA is million metric tons of LNG per annum, equivalent to 133 mmcfd of gas to one MTPA of LNG.

No part of this publication may be duplicated, transmitted or stored without ESAI Energy’s written permission. ©2017 ESAI Energy, LLC
3
ESAI ENERGY WHITE PAPER
Around the middle of the next decade, a significant number of long‐term LNG contracts will come up for
renewal. Given the experience with overbuilding and market surplus, the pricing terms of the next round of long‐term
contracts are likely to be more favorable to buyers with regard to contract length, pricing and destination flexibility.
Current Market Supply and Demand
Prices for LNG in Asia have been falling since 2014 due to weakening demand from the top importing Pacific
basin countries and an abundance of supply from new liquefaction plants in the market. Prices were also negatively
impacted by the steep decline in oil prices affecting oil‐linked LNG contracts.
Global LNG trade is estimated at approximately 34.4 bcfd (258 MTPA) in 2016, growing about 1.7 bcfd (13
MTPA) since the prior year. Contracted volumes were higher than demand, resulting in surplus LNG.
During the winter of 2016‐2017, LNG spot prices rose as cold weather increased demand, but contract prices
paid by key Asian countries for imports have still been less than half the price of 2014. In Japan, the largest market for
LNG, the contract price fell from an average of $14.41 per mmBtu in 2014 to $5.90 per mmBtu in 20162. Figure 1
shows annual global LNG supply and demand for the past two years, with a forecast through 2025. Clearly there is an
imbalance emerging and growing through the forecast period to 2020. Global LNG supply will grow substantially with
approximately 17 bcfd (129 MTPA) of additional capacity available from new projects in Australia, US, Russia and
Malaysia by 2020. This additional supply will keep downward pressure on prices over the next several years. Demand
growth will not be enough to absorb new supplies until after 2020. By 2024 investment in new LNG supplies will be
required as demand is forecast to catch up with supply.
Figure 1
2 METI http://www.meti.go.jp/english/statistics/sho/slng/index.html

No part of this publication may be duplicated, transmitted or stored without ESAI Energy’s written permission. ©2017 ESAI Energy, LLC
4
ESAI ENERGY WHITE PAPER
Figure 2 presents the installed capacity for LNG liquefaction by country, and the forecast production volume
in MTPA. The capacity factor shows approximate utilization of installed capacity. LNG production design capacity can
often exceed the "nameplate capacity" of a LNG liquefaction plant or train. As such the capacity factor can sometimes
exceed known operable capacity and result in a figure above 100 percent.
Figure 2
TOTAL BY COUNTRY
Installed
Capacity MT/YR CF %
Installed
Capacity MT/YR CF %
Installed
Capacity MT/YR CF %
Algeria 25.3 11.5 45% 25.3 15.2 60% 17.4 15.2 87%
Angola 5.2 0.8 15% 5.2 3.9 75% 5.2 3.9 75%
Australia 49.6 44.3 89% 86.6 83.6 97% 86.6 83.6 97%
Brunei 7.2 6.3 88% 7.2 6.1 85% 7.2 6.1 85%
Canada 0.0 0.0 n/a 0.0 0.0 n/a 0.0 0.0 n/a
Cameroon 0.0 0.0 n/a 1.2 1.2 0% 1.2 1.2 100%
Egypt 12.2 0.5 4% 12.2 3.6 30% 12.2 6.1 50%
Equatorial Guinea 3.7 3.4 92% 7.2 5.9 82% 7.2 5.9 82%
Indonesia 20.2 16.6 82% 20.7 16.3 79% 24.5 20.1 82%
Iran 0.0 0.0 n/a 0.0 0.0 n/a 0.0 0.0 n/a
Malaysia 28.7 25.0 87% 39.5 30.1 76% 39.5 30.1 76%
Mauritania 0.0 0.0 n/a 0.0 0.0 n/a 2.4 2.4 100%
Mozambique 0.0 0.0 n/a 0.0 0.0 n/a 3.3 3.3 100%
Nigeria 21.9 18.6 85% 21.9 20.4 93% 21.9 20.4 93%
Norway 4.3 4.3 100% 4.3 4.3 100% 4.3 4.3 100%
Oman 10.4 8.1 78% 10.4 7.8 75% 10.4 7.8 75%
Papua New Guinea 6.9 7.4 107% 6.9 7.2 105% 6.9 7.2 105%
Peru 4.5 4.0 90% 4.5 3.7 83% 4.5 3.7 83%
Qatar 77.0 77.2 100% 77.0 77.0 100% 77.0 77.0 100%
Russia 9.6 10.8 113% 26.1 25.1 96% 26.1 25.6 98%
Tanzania 0.0 0.0 n/a 0.0 0.0 n/a 0.0 0.0 n/a
Trinidad 15.3 10.6 69% 15.3 8.4 55% 15.3 8.4 55%
UAE 5.8 5.6 97% 5.8 3.2 55% 5.8 2.1 37%
USA 2.3 2.9 129% 62.0 61.1 99% 66.7 64.2 96%
Yemen 7.2 0.0 0% 7.2 5.4 75% 7.2 7.2 100%
Total MTPA 317.1 257.9 81% 446.3 389.4 87% 452.7 405.8 90%
Total bcfd 42.3 34.4 59.5 51.9 60.4 54.1
Source: Government agencies, company reports, ESAI Energy
2016 2020 2025
LNG Capacity Utilization by Country (MTPA)
No part of this publication may be duplicated, transmitted or stored without ESAI Energy’s written permission. ©2017 ESAI Energy, LLC
5
ESAI ENERGY WHITE PAPER
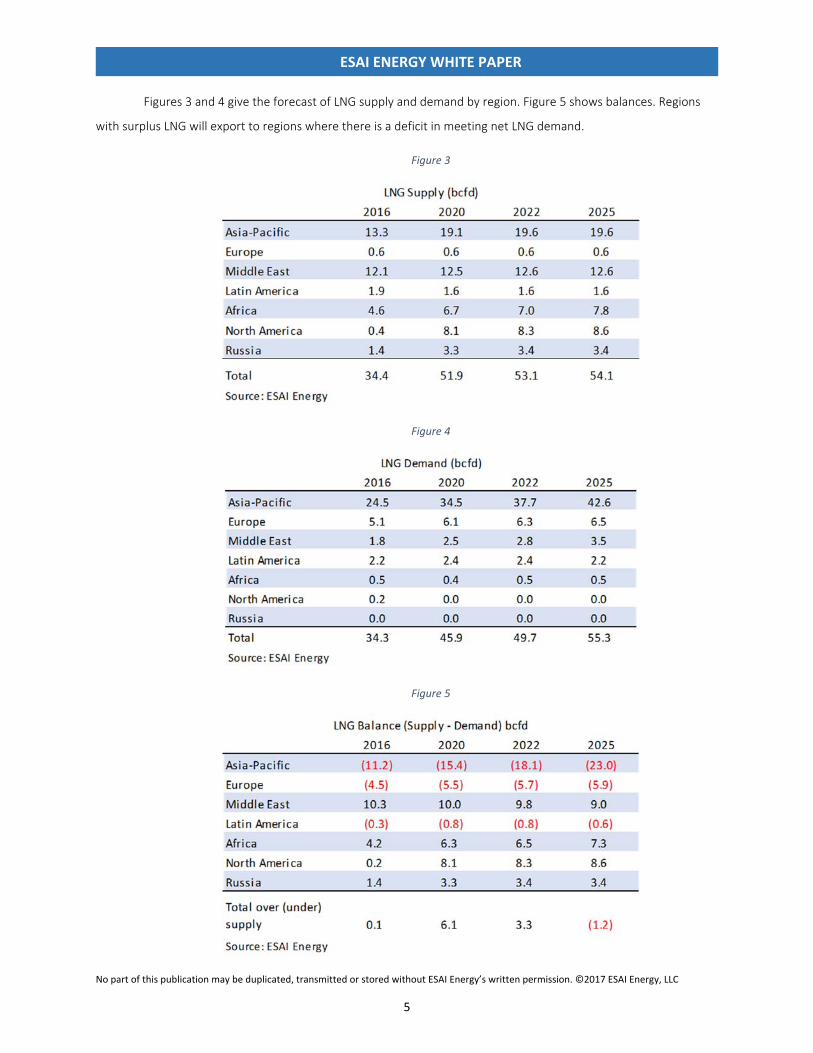
Figures 3 and 4 give the forecast of LNG supply and demand by region. Figure 5 shows balances. Regions
with surplus LNG will export to regions where there is a deficit in meeting net LNG demand.
Figure 3
Figure 4
Figure 5

No part of this publication may be duplicated, transmitted or stored without ESAI Energy’s written permission. ©2017 ESAI Energy, LLC
6
ESAI ENERGY WHITE PAPER
Current LNG supply: Asia‐Pacific and Middle East dominate capacity
By the end of 2016, 74 percent of global LNG supply originated from two regions, Asia‐Pacific and the Middle
East, which comprise 13.3 bcfd (99 MTPA) and 12.1 bcfd (91 MTPA), respectively. The remaining 26 percent came
from Africa, Russia, Europe, and the Americas.
Qatar has been the top exporter for the past decade, providing about a third of global LNG supply, but its
share of global exports declined in 2015 and 2016 as exporters from Asia‐Pacific, notably Australia, gained market
share. Since 2015, new projects and expansions in Australia have added a combined capacity of 31.5 bcfd (236 MTPA).
In 2016, Australia’s LNG exports to East Asia grew considerably, from 3.3 bcfd (25 MTPA) in 2015, to 5.2 bcfd
(39 MTPA) in 2016. Figure 6 shows exports to the three largest LNG consuming countries, Japan, South Korea and
China in 2016.
Figure 6
LNG Liquefaction Project Developments
By the end of 2017, an estimated 7.6 bcfd (57 MTPA) of global LNG capacity will be added in Australia, Russia
and the US. In addition to this volume, another 6.7 bcfd (50 MTPA) of supply is likely by 2022. Meanwhile, the
challenge for this supply is finding a market and competing with the contracted, unsold volumes already available. An
additional 36.9 bcfd (277 MTPA) of new capacity has been proposed, but most of this is unlikely to be built due to
uncompetitive cost structures. Figure 7 shows the liquefaction trains that started up in 2016 and those scheduled for
2017.

No part of this publication may be duplicated, transmitted or stored without ESAI Energy’s written permission. ©2017 ESAI Energy, LLC
7
ESAI ENERGY WHITE PAPER
Figure 7
Production costs
LNG production costs vary considerably depending upon when a project was built, with older projects
generally having a competitive advantage as capital costs have been amortized. The main components that drive cost
are fixed capital cost and feed gas cost. The most competitive projects are those that are developed efficiently, in
accessible locations, with access to competitive labor markets and low cost gas.
Not all projects can economically supply LNG in today’s low‐price environment. Figure 8 compares the
current LNG liquefaction break‐even price (US$/mmbtu), including an investor return that ranges from 12 to 16
percent, debt service payment, feed gas, operating costs, royalty and taxes, for 29 operating liquefaction plants.
Figure 8

No part of this publication may be duplicated, transmitted or stored without ESAI Energy’s written permission. ©2017 ESAI Energy, LLC
8
ESAI ENERGY WHITE PAPER
LNG projects currently under construction also have a range of projected production costs. US sourced LNG
generally has the lowest capital cost per ton, under $900 per ton of capacity. In comparison, Australian and Russian
projects have a higher overall cost structure with some projects exceeding $2,500 per ton.
For example, the Yamal project in Russia has been plagued by high capital expenditures and cost overruns
due to its isolated and challenging Arctic location. Australian projects have faced labor cost over‐runs. While
traditional large integrated LNG projects typically have a low fixed feed gas cost, most projects in Australia and US rely
on market‐based feed gas. The latter are vulnerable to the volatility of natural gas pricing.
Figure 9 compares the LNG liquefaction break‐even price, including gas cost, for nine new projects currently under construction.
Figure 9
Current LNG contracts drop off post‐2020
As of 2016, a total of 36.6 bcfd (274 MTPA) of LNG, or 88 percent of global LNG, is under long‐term contract.
Of this total, 16 percent is contracted as portfolio sales for re‐marketing. Portfolio volumes are destination flexible,
and can be sold in spot transactions to satisfy short‐term imbalances.
Most LNG production is under long‐term contract through 2020. However, after 2020, as older project off‐
take agreements expire, LNG under long‐term contract will decline, by 13.1 bcfd (98 MTPA) by 2022.
Figure 10 shows the percentage of LNG under‐contract declines dramatically by 2030. The exception is for
new LNG projects in Australia and the US. Together with the remaining smaller export projects and several new
entrants, this will likely put greater pressure on exporting countries to offer favorable LNG contract renewal terms by
the mid‐2020s.

No part of this publication may be duplicated, transmitted or stored without ESAI Energy’s written permission. ©2017 ESAI Energy, LLC
9
ESAI ENERGY WHITE PAPER
Figure 10
Contracted and available LNG volumes
Most LNG projects currently under‐construction are fully contracted. In the US, LNG developer Cheniere is
still marketing some LNG capacity it holds in its own portfolio. The Yamal project in Russia is fully contracted but some
Australian projects still hold excess capacity of LNG for sale. Several Australian LNG projects operating and under‐
construction are not yet fully contracted for full capacity utilization, with an estimated 1.2 bcfd (9.0 MTPA) available.
The volume of Australian LNG volume under contract is shown in Figure 11.
Figure 11

No part of this publication may be duplicated, transmitted or stored without ESAI Energy’s written permission. ©2017 ESAI Energy, LLC
10
ESAI ENERGY WHITE PAPER
Over the past five years, despite strong demand supporting contracted LNG supply from new liquefaction
projects, a large percentage of this contracted volume is not committed to satisfy specific market demand. Instead a
large portion of the contracted supply, particularly US sourced LNG, was secured by Asian and European utilities and
marketers for their trading portfolio. As much as 2 bcfd (15 MTPA) of contracted US LNG remains unsold or
uncommitted. Additional un‐marketed or flexible volume is also available.
Although most LNG is indexed to crude oil prices, higher volumes of un‐marketed and flexible LNG will have
a negative impact on world LNG prices by encouraging producers to keep and win LNG customers with pricing
flexibility, specifically regarding contract terms and price indexation formulas. Increased availability of LNG volume
will also hinder the ability of proposed LNG liquefaction projects to secure the long‐term customers that are necessary
to backstop financing of new project construction.
LNG Pricing Will Become More Flexible
Almost three‐quarters of LNG from producing projects is indexed against crude oil prices. For LNG destined
to markets in Asia, the majority is indexed against a basket of crude oil prices, called the Japanese Crude Cocktail (JCC).
In comparison, LNG marketed in Europe is typically priced against local gas market indices. As current contracts expire,
an increasing percentage of volume will be priced against a broader index, not only against oil, but also coal and
regional gas market prices, and even electricity netbacks.
While Australian and Russian sourced LNG are indexed to a crude oil formula, US sourced LNG is priced based
upon a fixed liquefaction tolling charge (take‐or‐pay) ranging from $2.50 – 3.50 per mcf and a variable feed gas cost
largely indexed to the Henry Hub market price. At the onset of the US LNG export push to secure long‐term LNG
buyers, a US indexed price was attractive to most Asian and some European LNG buyers. With crude oil hovering
about $100 per barrel, the delivered price of LNG with traditional JCC indexed contracts was much higher compared
to a US indexed price to Henry Hub. When global oil prices crashed in 2015 and LNG volume increased, LNG indexed
to Henry Hub gas prices became less attractive.
Over the next 5 years, a significant volume of LNG sold will still be linked to international crude prices.
However, given the growing oversupply, LNG suppliers will increasingly need to be flexible in contract terms including
length, destination, and price index formula.
LNG Demand – Where is the Growth?
Asia‐Pacific has been the dominant destination for global LNG exports, representing about 70 percent of
global trade during the past five years. With minimal domestic natural gas resources, the large Asia‐Pacific importers
of Japan and South Korea will continue to be destinations for LNG supplies. However, demand growth in these
countries has weakened due to slower economic growth and competition from competing fuels such as coal, nuclear,
and renewables.

No part of this publication may be duplicated, transmitted or stored without ESAI Energy’s written permission. ©2017 ESAI Energy, LLC
11
ESAI ENERGY WHITE PAPER
In 2016, even with relatively low prices for LNG, Japanese and South Korean imports are below volumes from
the past four years. As nuclear plants are brought back online and renewable fuel use increases, Japan’s LNG demand
could fall further. Meanwhile, China, Taiwan and India all increased their imports of LNG in 2016. The annual volume
of LNG imports since 2011 for Japan, South Korea, China, Taiwan and India are shown in Figure 12.
Figure 12
Full liberalization of the natural gas sector in Japan is slated for 2017, following the power market
liberalization last year. The reforms are intended to increase competition and thereby lower prices at the wholesale
and retail level. Japanese electricity and gas companies have been the largest buyers of LNG, and will have a new
market environment in which to adapt their procurement of supply. Furthermore, with the expectation of nuclear
reactor restarts over the next five years, we estimate Japan’s LNG requirement to stay flat or rise only marginally.
Even so, Japan will remain the largest importer of LNG.
China’s LNG demand growth will compete with pipeline gas
Chinese domestic production of natural gas was roughly 12 bcfd in 2016 and is expected to grow to 17 bcfd
in 2020. However, domestic production is not enough to meet demand, therefore China requires imports of pipeline
gas and LNG to meet its gas consumption needs.
Figure 13 shows the forecast for LNG demand in China to 2020, along with the current contracted volumes
and China’s regasification capacity. As with most markets or projects, LNG regasification capacity exceeds demand to
allow for market demand growth and peak gas deliveries.

No part of this publication may be duplicated, transmitted or stored without ESAI Energy’s written permission. ©2017 ESAI Energy, LLC
12
ESAI ENERGY WHITE PAPER
Figure 13
CNPC has invested in domestic natural gas production as well as pipeline infrastructure from Central Asia.
Looking ahead, CNPC has contracted with Gazprom for the Power of Siberia natural gas pipeline from Russia to China.
Reports have construction starting in 2018 with deliveries starting by 2020. Total capacity for the pipeline is nearly 3
bcfd at full capacity. From 2020‐2021, as pipeline volumes ramp up, this will temporarily reduce waterborne LNG
demand from China.
Figure 14 illustrates the decline in the growth of LNG demand as pipeline gas imports are expected to
increase in 2020 and 2021. LNG demand picks up again in 2022 with increased economic activity and a reduction in
coal consumption. Total LNG demand in China is forecast to reach about 7.2 bcfd (54 MTPA) in 2022 and rise to about
10 bcfd (75 MTPA) in 2025.
Figure 14
India – growth tempered by infrastructure constraints and coal use
Domestic production of natural gas in India has been stable for the past five years, around 3.3 bcfd (25
MTPA), but growth from developing offshore resources is hampered by low prices set by regulators. Domestic price
reform in 2015 was expected to raise gas prices paid to producers. However, regulators selected an index of relatively
No part of this publication may be duplicated, transmitted or stored without ESAI Energy’s written permission. ©2017 ESAI Energy, LLC
13
ESAI ENERGY WHITE PAPER
low international reference prices, and the price paid to producers only increased modestly. Since these regulated
prices have not been high enough to incentivize investment in domestic production, demand growth is outpacing
production growth. The gap between domestic supply and demand has been met with imports of LNG.
India currently has four regasification plants with a combined capacity of about 3 bcfd (23 MTPA). LNG
demand over the next several years is expected to be around 2.0 to 3.1 bcfd (15 to 23 MTPA). An additional 1.3 bcfd
(10 MTPA) of regasification capacity in India is under construction for start‐up in 2017.
There is much uncertainty in the longer‐term outlook for LNG demand in India. Coal is expected to remain a
prominent source of supply in power generation in India. Furthermore, domestic pricing regulation remains a
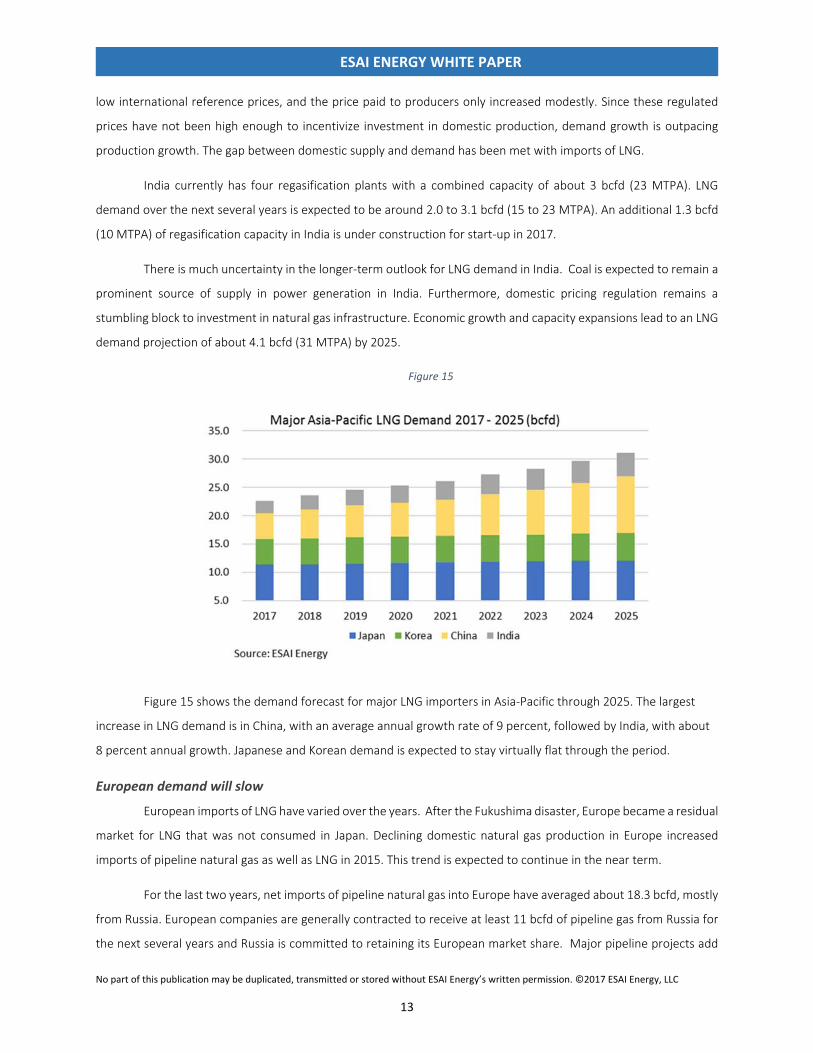
stumbling block to investment in natural gas infrastructure. Economic growth and capacity expansions lead to an LNG
demand projection of about 4.1 bcfd (31 MTPA) by 2025.
Figure 15
Figure 15 shows the demand forecast for major LNG importers in Asia‐Pacific through 2025. The largest
increase in LNG demand is in China, with an average annual growth rate of 9 percent, followed by India, with about
8 percent annual growth. Japanese and Korean demand is expected to stay virtually flat through the period.
European demand will slow
European imports of LNG have varied over the years. After the Fukushima disaster, Europe became a residual
market for LNG that was not consumed in Japan. Declining domestic natural gas production in Europe increased
imports of pipeline natural gas as well as LNG in 2015. This trend is expected to continue in the near term.
For the last two years, net imports of pipeline natural gas into Europe have averaged about 18.3 bcfd, mostly
from Russia. European companies are generally contracted to receive at least 11 bcfd of pipeline gas from Russia for
the next several years and Russia is committed to retaining its European market share. Major pipeline projects add

No part of this publication may be duplicated, transmitted or stored without ESAI Energy’s written permission. ©2017 ESAI Energy, LLC
14
ESAI ENERGY WHITE PAPER
to the uncertainty of demand growth. If natural gas pipeline projects materialize as planned, LNG demand will grow
less. The complex projects of the Southern Gas Corridor that are under development to deliver natural gas from the
Caspian region to Europe have faced many delays. At this point, we do not expect these pipeline projects to be
operational before 2025.
European demand growth will depend heavily on the pace of incorporating renewables and competition
from pipeline gas and is forecast to grow only modestly. By 2020, the LNG requirement for the region is forecast to
be roughly 6.1 bcfd (46 MTPA). Europeans are looking to diversify their supplies of gas. Even so, the increasing role of
renewables tempers the outlook for growth in demand for natural gas and LNG.
Figure 16
Growth prospects from emerging markets
Higher domestic demand for power generation is developing across many countries in North Africa, the
Middle East and Latin America. However, a lack of investment in infrastructure and uncertain policy for the energy
mix makes for an uncertain demand outlook. Some countries that have been net exporters of natural gas in the past
are not keeping up with domestic gas demand for power generation.
The MENA region increased its LNG imports by over 65 percent in 2016, including new importers Egypt and
Jordan. Low relative prices for LNG was the main reason behind the new import markets last year. Flexible,
uncommitted cargoes were re‐directed to these countries in mostly spot transactions. With the development of the
newly discovered Zohr natural gas field, Egypt’s LNG requirement is expected to diminish in the coming years, but
demand for LNG in Jordan and Kuwait is expected to grow.

No part of this publication may be duplicated, transmitted or stored without ESAI Energy’s written permission. ©2017 ESAI Energy, LLC
15
ESAI ENERGY WHITE PAPER
Figure 17
In 2016, Brazil, Chile, Argentina and Mexico imported LNG from multiple sources including Cheniere’s Sabine
Pass. Mexico is expected to receive more pipeline gas from the U.S. as multiple projects are under development to
meet most of Mexico’s import requirement. But additional LNG import terminals are also possible. The outlook for
the rest of Latin America depends on the pace of development from domestic resources. Inter‐regional trade has
been sparse due to the lack of natural gas pipeline infrastructure across challenging and vast terrain. Figure 17 shows
the LNG net imports in Latin America and the Middle East‐North Africa regions from 2012 to 2016.
Thailand and Pakistan are emerging markets in the Asia‐Pacific region that could see growth in LNG demand.
Thailand has experienced steady growth in demand for natural gas as its domestic production has plateaued. LNG
demand is expected to pick up in the near to medium term as Thailand continues its power sector development. The
outlook for the longer term is less certain, as the country is expanding the use of renewables and the government’s
development plan envisions nuclear power generation beginning in 2029.
Pakistan began importing LNG in 2015. LNG imports grew from 0.15 bcfd (1.1 MTPA) in 2015 to 0.46 bcfd
(3.4 MTPA) in 2016. The country is struggling to meet its soaring gas‐to‐power demand and LNG demand is expected
to increase. A final investment decision is expected this year to develop a fifth floating storage and regasification unit
that would come online in 2018. LNG has also been a fuel source in Pakistan’s automotive industry as market
deregulation has boosted demand for compressed natural gas.

No part of this publication may be duplicated, transmitted or stored without ESAI Energy’s written permission. ©2017 ESAI Energy, LLC
16
ESAI ENERGY WHITE PAPER
Figure 18
Expected LNG Trade Flows through 2025
Figure 19
Figure 19 summarizes the regions and countries where most growth in the supply and demand of LNG is
expected through 2025. These shifts will direct the trade flows of LNG in the coming years. Traditional suppliers from
the Middle East, such as Qatar and Oman, will maintain their LNG production, but will not expand production in this
time frame. With demand in some Middle East countries rising, more of these regional supplies will stay local.
The US is a new exporter of LNG and by 2018 will be the third largest supplier behind Australia and Qatar.
Exports from the U.S. are set to jump from about 2 bcfd (15 MTPA) in 2017 to over 8 bcfd (61 MTPA) in 2020, reflecting
the liquefaction projects under construction. By 2025, about 1 bcfd (7 MTPA) of additional capacity is expected, for a
total capacity of about 9.2 bcfd (69 MTPA).

No part of this publication may be duplicated, transmitted or stored without ESAI Energy’s written permission. ©2017 ESAI Energy, LLC
17
ESAI ENERGY WHITE PAPER
Figure 20
Figure 21 lists the US export projects that ESAI Energy believes will be completed through 2025.
Figure 21
The addition of US export volumes will shift some of the traditional trade flows starting in 2018. The following
section describes the likely patterns of LNG trade through 2020. The map below illustrates the regional net trade flows
of LNG. Net Importers are shown in blue and net exporters in yellow.

No part of this publication may be duplicated, transmitted or stored without ESAI Energy’s written permission. ©2017 ESAI Energy, LLC
18
ESAI ENERGY WHITE PAPER
Figure 22
Asia‐Pacific remains the dominant region for LNG demand through the 2020s. As discussed in the previous
section, most of the demand growth in the region is expected to come from China, Taiwan and India, followed by
Thailand and Pakistan. Demand from the mature LNG importers, Japan and South Korea, is expected to remain flat or
see only marginal growth.
Figure 23
About a third of the current LNG contracts to China are from portfolio LNG supply, LNG that is contracted
but not committed to a specific buyer or destination. LNG imports from other Asia‐Pacific countries such as Australia,
Malaysia and Indonesia will remain prominent through 2020. Qatar is contracted to supply about a quarter of the

No part of this publication may be duplicated, transmitted or stored without ESAI Energy’s written permission. ©2017 ESAI Energy, LLC
19
ESAI ENERGY WHITE PAPER
volumes going to China through 2020, and Russian LNG to China will also start increasing as the Yamal project ramps
up.
To date the largest supplier of LNG to India has been Qatar, with about 1.2 bcfd in 2015. Based on current
contracts, Qatar will continue to provide almost 60 percent of volumes contracted for delivery to India for the next
several years. Russian supplies will also make their way to India, as will exports from Malaysia and Indonesia. India
may also end up as the destination for surplus contracted volumes that are re‐exported.
Over the next three years to 2020, annual contracted volumes to Europe will come from Qatar, Nigeria and
Algeria. Marketed U.S. exports will flow to Europe as well. Contracted volumes that exceed demand will be redirected
to other markets.
Figure 24
Latin America will be a net importer of LNG through 2020, but demand is expected to stay relatively flat at
around 2.3 ‐ 2.5 bcfd. Flexible, non‐contracted LNG volume will come from North America and Africa.
Figure 25
The range of trade flows not only depends on the extent of new liquefaction projects, but also how regional
prices for LNG are impacted by the changing dynamics of the market. The challenges facing an over‐supplied market
and the attributes needed for the next wave of export projects to succeed is discussed in the following pages.

No part of this publication may be duplicated, transmitted or stored without ESAI Energy’s written permission. ©2017 ESAI Energy, LLC
20
ESAI ENERGY WHITE PAPER
Navigating the Global LNG Market
The roller‐coaster experience of the LNG market over the past ten years has made investors, developers,
producers and buyers almost dizzy. For producers and traders, a short market became long, and strong profits of LNG
revenue over crude evaporated. For buyers, expectation of energy demand growth and new markets led to irrational
exuberance and over‐contracting of supply.
Near‐term oversupply and overcapacity is the most pressing challenge facing the market. Until the market
balances, some projects and suppliers will face credit challenges as they try to secure markets for uncommitted LNG.
Some LNG may be sold below its marginal cost of production, directly impacting the credit‐worthiness of some
producers and customers. Producers that are under‐contracted or have high costs are vulnerable, as are over‐
contracted buyers.
In recent years, high winter gas prices of +$10 per mmBtu in Europe and +$14 per mmBtu in Asia were viewed
as foundation pricing for the LNG market. Utilities secured long‐term capacity to meet their gas‐to‐power demand
requirements and traders successfully exploited low cost LNG to secure the arbitrage value by importing it into higher
priced growth markets that were short LNG (and energy). With the over‐supply of LNG, increased pipeline gas options
in Europe, lower cost coal and the rapid growth of renewables fueling power sectors worldwide, market prices
converged and the “arb” differential disappeared. While gas markets are likely to continue to behave in this fashion
for some time, as LNG demand grows and liquidity narrows over time, trading opportunities are likely to re‐emerge
in several markets.
While the market is oversupplied, any buyer of LNG that can negotiate a new supply contract will be able to
secure more favorable terms. LNG buyers holding capacity rights for US volume and with firm inelastic customer
demand will also benefit. LNG producers who currently have most of their supply under contract are in an
advantageous position in the next few years as they will not have to compete with the flood of new LNG entering the
market. However, some multinationals are faced with high cost LNG that is uncompetitive in an over‐supplied market.
The “typical” LNG liquefaction project of the past was driven by reserve economics. Large low cost stranded
gas reserves particularly in a cash poor country was a big driver. These enabled multinationals to negotiate favorable
tax and royalty regimes and control the entire value chain of the project. Price certainty is also an important driver;
once the reserve is developed and the LNG plant is built, their cost structure is relatively stable over a project’s 40‐
year economic life. In contrast, independent (project financed) LNG projects must recover capital within 15 to 20
years.
Existing projects with low cost CAPEX per ton and access to competitively priced gas are most likely to be
expanded as demand rebounds. Multinationals will be well positioned, as they can finance projects through cash flow
and can build a project prior to securing complete off‐take commitments. They are likely to lower their cost of

No part of this publication may be duplicated, transmitted or stored without ESAI Energy’s written permission. ©2017 ESAI Energy, LLC
21
ESAI ENERGY WHITE PAPER
production at larger existing and planned overseas LNG projects rather than expand projects that lack these
advantages.
A competitive cost structure could also apply to projects in export‐dependent countries with vast gas
resources. The ability to aggressively monetize their inexpensive reserves to capture the next LNG demand wave with
a lower rate of return threshold could make projects economically viable.
Existing U.S. Gulf Coast projects are also in a good position to expand as they can utilize existing storage and
ancillary infrastructure by adding only a liquefaction train and processing capacity. However, to do this they may need
to rely on creative price contracts with upstream gas producers to minimize Henry Hub price volatility.
Conclusion
The most notable challenge over the next three to five years, as Figure 26 indicates, is LNG demand growth
will not keep pace with current and future LNG production volumes until after 2020. As the surplus starts to decline
after that, prices will find support. Then, some new liquefaction capacity will then be justified.
While significant volumes of LNG were contracted over the past decade by newly developed liquefaction
projects in Australia, Russia and the USA, a significant share of this LNG was uncommitted. Large Asian and European
utilities and Asian traders over‐committed and are now attempting to sell these volumes into an already oversupplied
LNG market.
Over the next five to seven years, and until the market balances, there will be considerable pressure on LNG
producers and capacity holders to sell excess volume into spot and medium term markets. This will negatively impact
on LNG projects currently under development. Some new projects will develop, but they will likely be integrated
projects backstopped by large project sponsors with strong balance sheets or small floating projects both focused on
developing stranded gas reserves.
Figure 26