
Rice Yield And Dangue Haemorrhagic Fever(DHF) · PDF file• In this study, we compare...
32
Dr Lai Lai Aung, Assistant Director( Met Service) Dr Khaing Khaing Soe Assistant Director(Public Health) Dr Thin Nwe htwe Staff Officer(Agriculture) Rice Yield And Dangue Haemorrhagic Fever(DHF) Condition depend upon Climate Data
Transcript of Rice Yield And Dangue Haemorrhagic Fever(DHF) · PDF file• In this study, we compare...

Dr Lai Lai Aung, Assistant Director( Met Service)
Dr Khaing Khaing Soe Assistant Director(Public Health)
Dr Thin Nwe htwe Staff Officer(Agriculture)
Rice Yield And Dangue Haemorrhagic
Fever(DHF) Condition depend upon Climate Data

Background
• Total area 678,500 square KM Latitudes 9.8̊ N - 29.8̊ N, • Longitudes 92.2̊ E - 101.1̊ E. • Lies in the Tropic • 14 Regions & State
Neighbouring Countries • China on the northeast, • Laos on the east, • Thailand on the southeast, • Bangladesh on the west, • India on the west & northwest • the Bay of Bengal to the west & southwest, • Andaman Sea at the South
CHINA INDIA BANGLA DESH LAOS
THAILAND BOB
ANDAMAN SEA

The Climate of Myanmar • lies in the monsoon region of Asia. • roughly divided into three seasons:
– Summer Season (Mar to mid May), – Rainy Season (mid May to Oct), – Winter Season (Nov to Feb)
► the central myanmar area an average
annual rainfall , 30 inches ►coastal region with annual average
rainfall , 200 inhes
Topography: mountainous area to the north, west and eastern parts, low land and deltaic areas and dry zone area in the central Myanmar areas
Population:52 million

4
Net Sown Area
17.70% Fallow Land 0.70%
Culturable Waste Land 7.80%
Reserved Forests 27.50%
Other Forests 21.80%
Other Land 24.60%
Land Utilization in Myanmar (2014-2015)

Number of Stations over the Country
92° 94° 96° 100°
ANDAMAN SEA
N
100 50 0 50 100
THAILAND
CHINA
INDIA
LAOS
6 6
14 14
2 12 12
14 9
16
7
6 8 7
3
4
10
Total:118


Comparison Rice Yield and Txgt50p (days above average temperature) data for Ayeyarwaddy Region( Pathein)
5
15
25
35
45
55
65
75
85
3000
3100
3200
3300
3400
3500
3600
3700
3800
3900
1993
1994
1995
1996
1997
1998
1999
2000
2001
2002
2003
2004
2005
2006
2007
2008
2009
2010
Rice yield
Txgt50p
adjusted
Correlation=0.74 Rice yield was related with Txgt50p at the year of 1994,00,2002-07,09


Comparison DHF and HWF(Heat wave frequency) data for Ayeyarwaddy Region( Pathein)
0
5
10
15
20
25
30
35
40
45
0
5000
10000
15000
20000
25000
1990 1991 1992 1993 1994 1995 1996 1997 1998 1999 2000 2001 2002 2003 2004 2005 2006 2007 2008 2009 2010
Health
HWF
Correlation=0.42 DHF was related with HWF at the year of 98,2002, 2005


Comparison Rice yield and Tx90p(amount of hot days) data for Ayeyarwaddy Region( Pathein)
0
5
10
15
20
25
30
35
40
45
3000
3100
3200
3300
3400
3500
3600
3700
3800
3900
1990 1991 1992 1993 1994 1995 1996 1997 1998 1999 2000 2001 2002 2003 2004 2005 2006 2007 2008 2009 2010
Rice Yield
Tx90p
Correlation=0.80 Rice yield was related with Tx90p most the year except the year 98,03,04,05

Rainfall Comparison between Normal(1961-1990) & Normal(1981-2010)
0.0
100.0
200.0
300.0
400.0
500.0
600.0
JAN FEB MAR APR MAY JUN JUL AUG SEP OCT NOV DEC
Normal(1961-1990) Normal(1981-2010)
► (81-10) normal was decreasing at the month of May, June, July and August and it was nearly unchanged for the other months.

Minimum Temperature Comparison between Normal(1961-1990) & Normal(1981-2010)
12.0
14.0
16.0
18.0
20.0
22.0
24.0
JAN FEB MAR APR MAY JUN JUL AUG SEP OCT NOV DEC
Normal(1961-1990) Normal(1981-2010)
► normal minimum temperature was decreasing from month January to May and September to December. ► It was nearly unchanged at month July and August.

Maximum Temperature Comparison between Normal(1961-1990) & Normal(1981-2010)
27.5
28.5
29.5
30.5
31.5
32.5
33.5
34.5
35.5
JAN FEB MAR APR MAY JUN JUL AUG SEP OCT NOV DEC
Normal(1961-1990) Normal(1981-2010)
► normal maximum temperature was increasing nearly all months except February and December. ► It was clear that rate of maximum temperature was higher at the month April,May June , July and August compare to other months.

Results
► Txgt 50p, Tx90p, HWF indices are relevant and beneficial for Rice yield and DHF diseases. ► Normal maximum temperature is also increasing all month of Myanmar except February and December and minimum temperature were decreasing. ► Normal rainfall pattern also shifted, it is decreasing in the month of May, June, July and August and rest of month is nearly unchanged.

• The Ministry of Health and Sports (Formerly, Ministry of Health) is responsible for enhancing the health status of the population through delivering comprehensive health services pertaining to the promotion of good health, the prevention of disease, and the provision of effective treatment and rehabilitation.
• It executes these health services through seven departments: 1. Department of Public Health 2. Department of Medical Services 3. Department of Heath Professional Resource Development and
Management 4. Department of Medical Research 5. Department of Traditional Medicine 6. Department of Food and Drug Administration 7. Department of Sports and Physical Education
Myanmar: Health sector overview
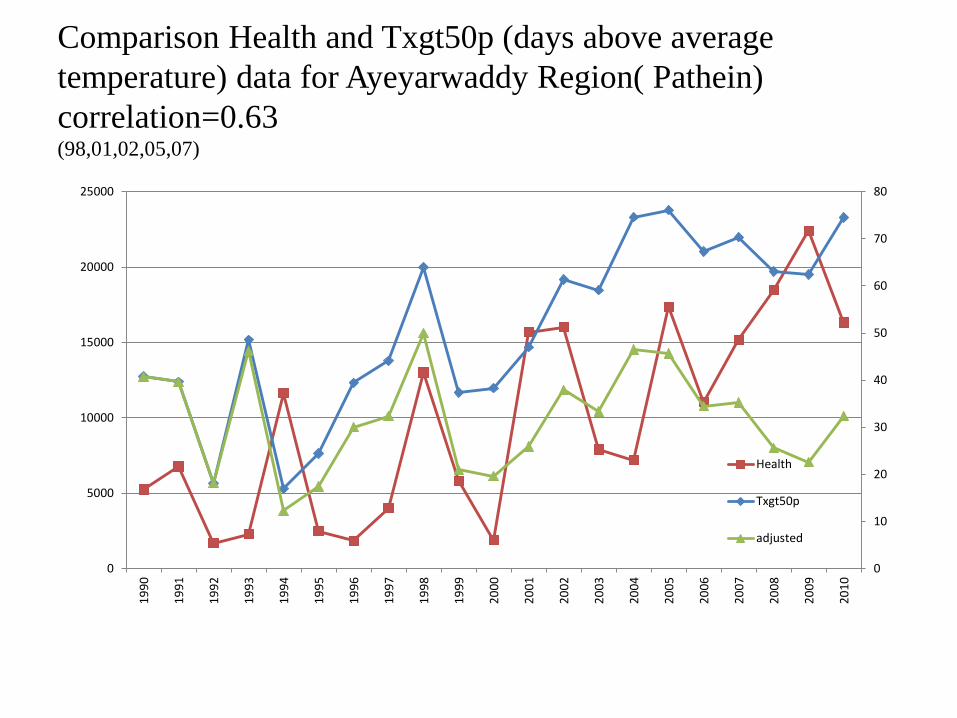
Comparison Health and Txgt50p (days above average temperature) data for Ayeyarwaddy Region( Pathein) correlation=0.63 (98,01,02,05,07)
0
10
20
30
40
50
60
70
80
0
5000
10000
15000
20000
25000
1990
1991
1992
1993
1994
1995
1996
1997
1998
1999
2000
2001
2002
2003
2004
2005
2006
2007
2008
2009
2010
Health
Txgt50p
adjusted

Comparison DHF and Tx90p(amount of hot days) data for Ayeyarwaddy Region( Pathein) correlation=0.55 (91,93,98,01,02,05,07)
0
5
10
15
20
25
30
35
40
45
0
5000
10000
15000
20000
25000
1990
1991
1992
1993
1994
1995
1996
1997
1998
1999
2000
2001
2002
2003
2004
2005
2006
2007
2008
2009
2010
Health
Tx90p

Comparison DHF cases and Txm(mean daily max temp) data for Ayeyarwaddy Region( Pathein) correlation=0.46 (91,93,98,02,05,07)
27
28
29
30
31
32
33
34
35
0
5000
10000
15000
20000
25000
1990 1991 1992 1993 1994 1995 1996 1997 1998 1999 2000 2001 2002 2003 2004 2005 2006 2007 2008 2009 2010
DHF Cases
txm

DHF cases and PRCPTOT (Annual total wet day) (94,97,01,02,07,09)
correlation=0.4
0
500
1000
1500
2000
2500
3000
3500
4000
0
5000
10000
15000
20000
25000
1990 1991 1992 1993 1994 1995 1996 1997 1998 1999 2000 2001 2002 2003 2004 2005 2006 2007 2008 2009 2010
DHF Cases
prcptot

Model Summary
a. Predictors: (Constant), Txgt50p, PRCPTOT b. Dependent Variable: DHF
Model R R square Adjusted R Square
Std. Error of the Estimate
0.731 .535 .483 4664.89663
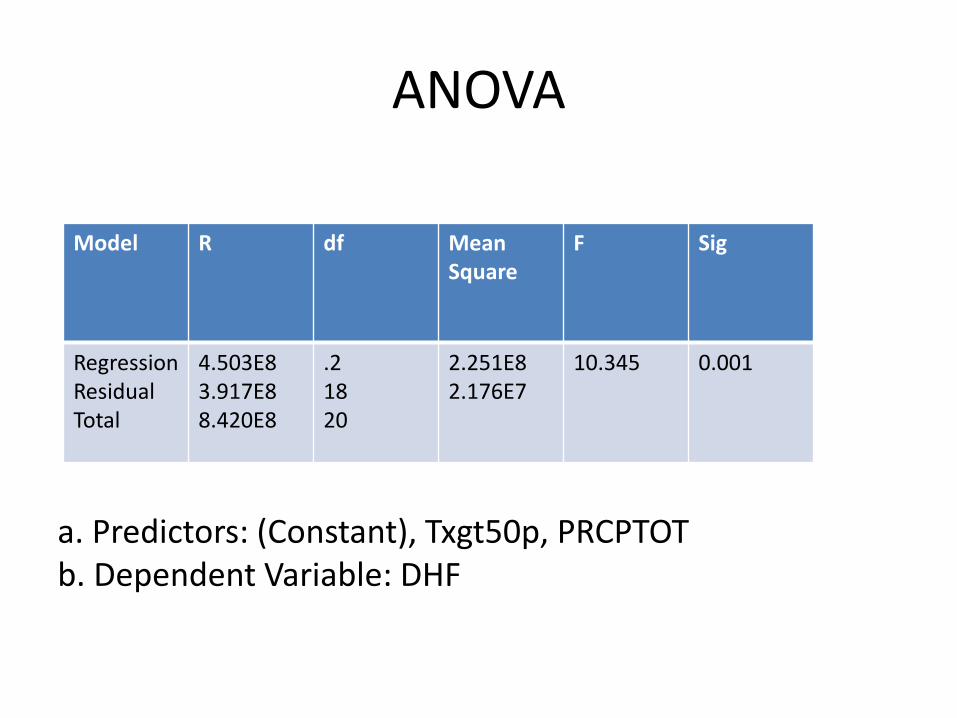
ANOVA
a. Predictors: (Constant), Txgt50p, PRCPTOT b. Dependent Variable: DHF
Model R df Mean Square
F Sig
Regression Residual Total
4.503E8 3.917E8 8.420E8
.2 18 20
2.251E8 2.176E7
10.345 0.001

conclusion
• In this study, we compare Annual DHF cases in Myanmar with Txgt50p (fraction of days with above average temperature), Tx90p (Amount of hot days), Txm (mean daily maxium temperature and PRCPTOT (Annual total wet day).
• We found that increase in days with above average temperature and increase in wet day are associated with increase in DHF cases.
• In Myanmar, mountain areas are cold and previously no DHF case and now increase in temperature in mountain area and more DHF cases are found.
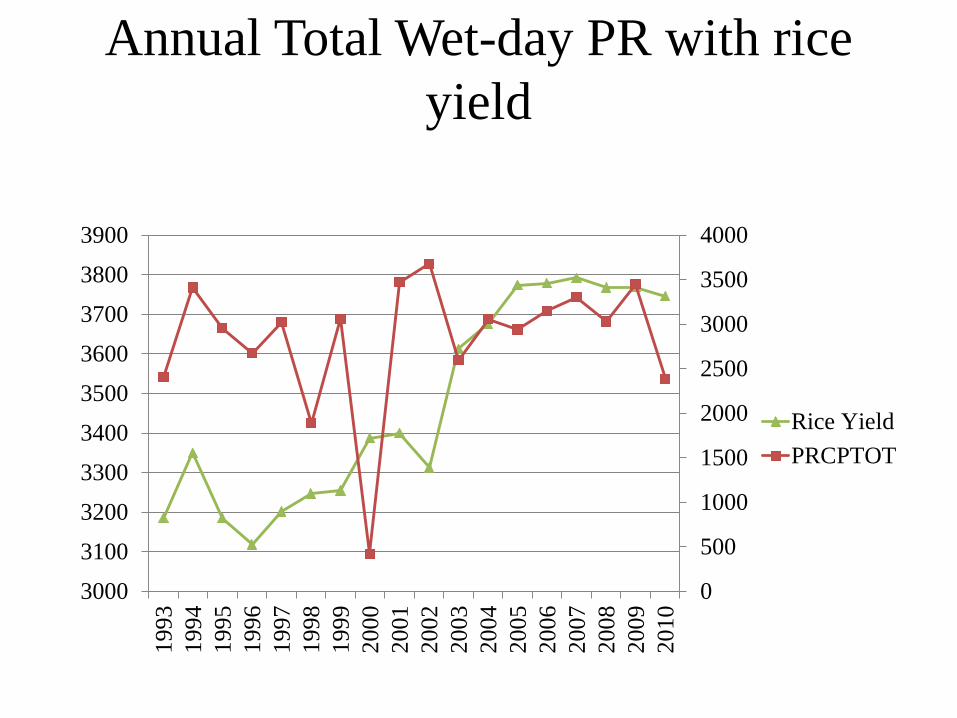
Annual Total Wet-day PR with rice yield
0
500
1000
1500
2000
2500
3000
3500
4000
3000
3100
3200
3300
3400
3500
3600
3700
3800
3900
1993
1994
1995
1996
1997
1998
1999
2000
2001
2002
2003
2004
2005
2006
2007
2008
2009
2010
Rice YieldPRCPTOT

No. of heavy rain days (30mm) with rice yield
y = 0.4778x + 27.516
-505101520253035404550
3000
3100
3200
3300
3400
3500
3600
3700
3800
390019
9319
9419
9519
9619
9719
9819
9920
0020
0120
0220
0320
0420
0520
0620
0720
0820
0920
10
Rice Yield
R30mm
Adjusted
Linear (R30mm)

Growing Degree Days with Rice Yield
y = 28.102x + 6115.6
5200
5400
5600
5800
6000
6200
6400
6600
6800
7000
3000
3100
3200
3300
3400
3500
3600
3700
3800
3900
1993
1994
1995
1996
1997
1998
1999
2000
2001
2002
2003
2004
2005
2006
2007
2008
2009
2010
Rice YieldGDDgrownAdjustedLinear (GDDgrown)

Regression model Model Summary
Model R R Square Adjusted R Square Std. Error of the Estimate 1
.567a .321 .231 224.45052 a. Predictors: (Constant), Growing degree days, Number of heavy rain days
ANOVAb
Model Sum of Squares df Mean Square F Sig.
1 Regression 357493.526 2 178746.763 3.548 .055a
Residual 755670.508 15 50378.034
Total 1113164.033 17
a. Predictors: (Constant), Growing degree days, Number of heavy rain days b. Dependent Variable: Rice Yield
Results For paddy production, not only climate data influence but also other factors (eg. Varieties, Soil Types, Fertilizer Application, Crop Management and Pest and Diseases, so on). But the climate data can really influence when the drought have the whole growing season or heavy rain (flood) during the harvesting time, so on. The relationship of climate indices and other crops’ production (maize or pigeon pea), the correlation will be high. And the seasonal data will be beneficial.

Annual mean daily maximum temperature For the year 2099

1961
Annual sum of daily precipitation 2070
2099
To get more accuracy, we need to use much more images and high resolution (30 m and 10 m, 5 m resolution) Predict for drought, flood and cyclone to use in agriculture sector

Thank you!!


![Dhf (Dengue Haemorrhagic Fever)[1]](https://static.fdocuments.net/doc/165x107/577c86e01a28abe054c2ee69/dhf-dengue-haemorrhagic-fever1.jpg)


