RI CorporatePresentation Agosto 2012 - GPA · Partner: Helbor 544 apartments, in 2 steps (1st step:...
22
CORPORATE PRESENTATION Grupo Pão de Açúcar and Viavarejo August 2012
Transcript of RI CorporatePresentation Agosto 2012 - GPA · Partner: Helbor 544 apartments, in 2 steps (1st step:...

CORPORATE PRESENTATION
Grupo Pão de Açúcar and Viavarejo
August 2012

ABOUT GRUPO PÃO DE AÇÚCAR
2
> Key Figures 2011>R$ 52.7 bi Sales
> #1 Retailer in Brazil
>Growth higher than the 2nd player’s
> Operational > 1.8k points of sales, located in 19 States and
the Federal District
> Multi-format distribution
> 635 million tickets per year
> 2.8 million m² of sales area
Net Profit(1)Net Profit(1)
EBITDAEBITDA
Gross SalesGross Sales
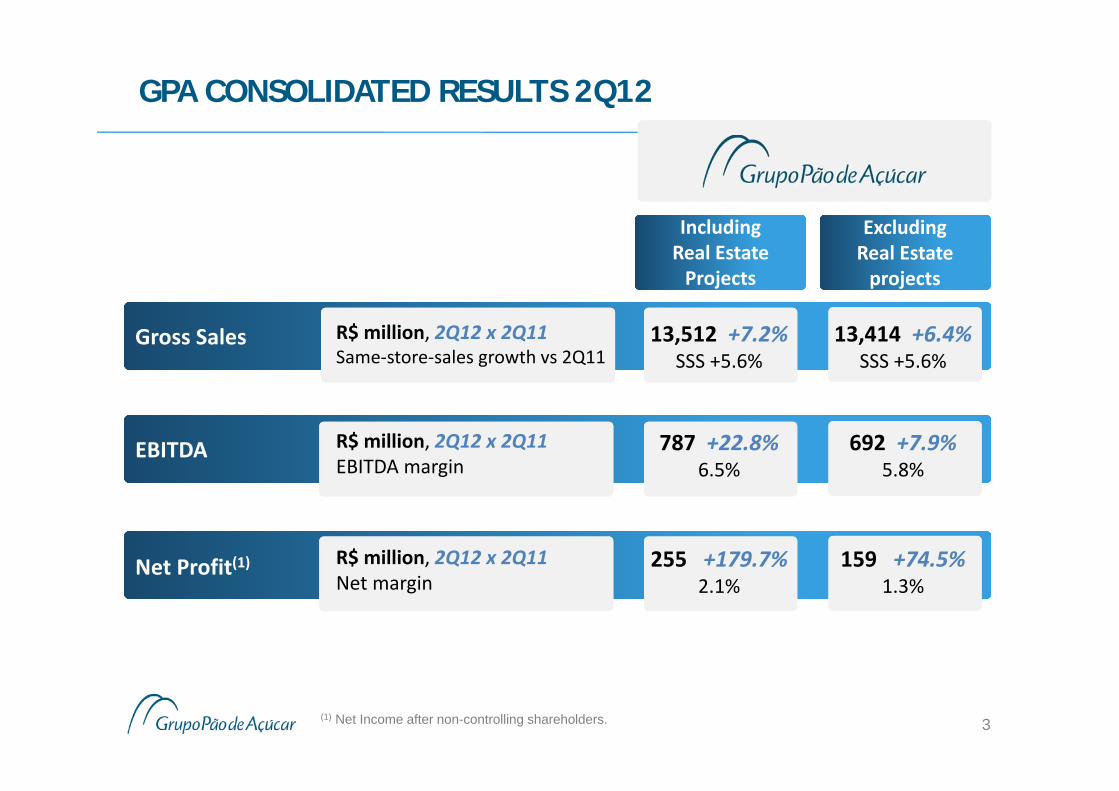
GPA CONSOLIDATED RESULTS 2Q12
3
R$ million, 2Q12 x 2Q11Same‐store‐sales growth vs 2Q11
13,512 +7.2%SSS +5.6%
13,414 +6.4%SSS +5.6%
R$ million, 2Q12 x 2Q11EBITDA margin
787 +22.8%6.5%
692 +7.9%5.8%
R$ million, 2Q12 x 2Q11Net margin
255 +179.7%2.1%
159 +74.5%1.3%
(1) Net Income after non-controlling shareholders.
Excluding Real Estate projects
Excluding Real Estate projects
Including Real Estate Projects
Including Real Estate Projects

GPA CONSOLIDATED - INDEBTEDNESS AND LEVERAGE
Net debt (R$ billion)Net debt (R$ billion) 4.84.8 4.94.9
Net debt /EBITDA(1)Net debt /EBITDA(1) 1.51x1.51x 1.50x1.50x
03/31/1203/31/12 06/30/1206/30/12
(1) EBITDA of the last twelve months 4
% of net sales
166 121
170164
2Q11 2Q12
3.0%2.4%
336285
Consolidated Net Financial Expenses (R$ mi)
Viavarejo
GPA Food
Capex(R$ million)Capex(R$ million)
1H126331H12633
2Q123922Q12392

Gross SalesGross Sales
2Q12 BUSINESSES RESULTS
Gross ProfitGross Profit
Operating ExpensesOperating Expenses
EBITDAEBITDA
Net Financial ExpensesNet Financial Expenses
Net Profit (1) Net Profit (1)
5
R$ million, 2Q12 x 2Q11Same‐store‐sales growth vs 2Q11
7,437 +7.3%SSS +4.7%
Gross margin, 2Q12 x 2Q11Δmargin 2Q12 x 2Q11
26.8% +14.8%+160 bps
% of net sales, 2Q12 x 2Q11Δ % of net sales 2Q12 x 2Q11
18.3% +6.7%‐20 bps
R$ million, 2Q12 x 2Q11EBITDA margin
574 +37.0%8.5%
% of net sales, 2Q12 x 2Q11Δ % of net sales 2Q12 x 2Q11
1.8% ‐27.4%‐90 bps
Net margin, 2Q12 x 2Q11Net margin
253 +171.3%3.8%
GPA Food
(1) Net Income after non-controlling shareholders.

6
6,9287,339
2Q11 2Q12
Gross Sales (R$ mi)
5.9%
Gross Profit (R$ mi)
1,5691,703
2Q11 2Q12
25.2% 25.7%
EBITDA (R$ mi)
419
479
2Q11 2Q12
14.2%6.7%
7.2%
% of net sales
Revenue recognition of R$ 98 million related to GPAMalls & Properties´s land swap for development andconstruction of real estate projects in partnership withdevelopers.
GPA Food excluding real estate projects results :
8.5%
GPA FOOD AND REAL ESTATE PROJECTS

Gross SalesGross Sales
2Q12 BUSINESSES RESULTS
Gross ProfitGross Profit
Operating ExpensesOperating Expenses
EBITDAEBITDA
Net Financial ExpensesNet Financial Expenses
Net Profit (1)Net Profit (1)
7
R$ million, 2Q12 x 2Q11Same‐store‐sales growth vs 2Q11
6,075 +7.0%SSS +6.7%
Gross margin, 2Q12 x 2Q11Δmargin 2Q12 x 2Q11
27.1% +1.5%‐100 bps
% of net sales, 2Q12 x 2Q11Δ % of net sales 2Q12 x 2Q11
23.1% +2.5%‐60 bps
R$ million, 2Q12 x 2Q11EBITDA margin
214 ‐3.5%4.0%
% of net sales, 2Q12 x 2Q11Δ % of net sales 2Q12 x 2Q11
3.1% ‐3,4%‐30 bps
R$ million, 2Q12 x 2Q11Net margin
5.4 n/c0.1%
GPA Non‐Food
(1) Net Income before non‐controlling shareholders.

8
100%Sold
93%Sold
SoonLaunching
TheraFariaLima
FiguéSantoAndré
GuarulhosBosqueMaia
GPA Mall & Properties: Grupo Pão de Açúcar's real estate unit, which is responsible for managesand explores the Company’s real estate assets, and looks at unlocking value in this market.GPA Mall & Properties: Grupo Pão de Açúcar's real estate unit, which is responsible for managesand explores the Company’s real estate assets, and looks at unlocking value in this market.
2012 OUTLOOK: GPA FOOD AND REAL ESTATE PROJECTS
Residential and Commercial Real EstatePartner: Cyrela399 residential apartments and 630 officesLand of 16,200 square meters Total PSV of R$ 502.0 million
Residential Real EstatePartner: RFM64 apartmentsLand of 2,000 square meters Total PSV of R$ 44.2 million
Residential Real EstatePartner: Helbor544 apartments, in 2 steps (1st step: 2012/ 2nd step: 2013)Land of 16,100 square metersExpected Total PSV of R$ 250.0 million

2012 OUTLOOK: GPA FOOD
9
Hyper: strengthen one‐stop‐shop concept (multi‐specialist in electro, home, baby and fashion)
Extra Super consolidation: investment rationalization
Increase the offering of organics, imported, regional e exclusive brands
Minimercado: new format, best convenience solution, resumption of expansion
Explore multichannel opportunities
Operational cost reduction
Logistic cost rationalization with higher inventory capacity at stores
Assortment rationalization focusing the new customer (reseller/foodservice/catering)
New format and resumption of expansion plan
Cash‐and‐carryCash‐and‐carry
RetailRetail
Fashion’s new approach, with renowned stylist and
new product line’s positioning
Perfumery investment on both industry’s lines and imported opportunities
Exclusive brands’ investment
Assaí’s new format

10
Focus on organic expansion
Capture synergies from already optimized processes and implement new initiatives throughout the year
One united culture as one of the priorities
Cash generation aiming at business strength
Expectations towards CADE’s final decision
EletroEletro
Addition of new categories
Explore multichannel opportunities
Deliver above market growth with profitability
Keep customer satisfaction indicator at high levels
E‐commerceE‐commerce
Categories addition in the e‐commerce
operation
New Ponto Frio’sconcept store
Store openings, specially atBrazil’s Northeast region
2012 OUTLOOK: GPA NON-FOOD
Kees customersatisfaction level at
Pontocom

Gross salesin R$ billion
2012 GUIDANCES
11
Net fin. expensesas % of net sales
EBITDA2012 margin
Capex¹ in R$ billion
Expansiongrowth vs Dec/11
FinancialsFinancials
OperationalOperational
New stores
¹ Maximum of R$1,966 million was approved at General Shareholders Meeting
GPA Non‐foodGPA Food
31.5
2.3%
25.7
3.3%
7.3% to 7.8% 5.2% to 6.5%
1.4 0.4
6.0% to 6.7%
57.2
2.8%
6.4% to 7.2%
1.8
70 to 80 50 to 60
Above
Below
Above
Below
Above
Below
-

12
GPA STORES AND FORMATS
*Stores as of 2Q12.
# Stores*
GPA
FO
OD
ELEC
TRO
NIC
S /
HO
ME
APP
LIA
NCESupermarkets
Cash & Carry
Hypermarket
Neighborhood
Gas stations and Drugstores
Specialized Stores
B2C
B2B
363
59
134
69
236
950
-
-
Malls & Properties -

RETAIL MOMENTUM IN BRAZILRETAIL MOMENTUM IN BRAZIL
Rise of the Purchasing Power
Focus on Middle Class Population
Informality Reduction
Distribution Channels Diversification
2014 World Cup
2016 Olympic Games
BRAZILIAN SCENARIO
ECONOMIC SCENARIOECONOMIC SCENARIO
GDP Growth
Social Rise
Greater Credit Offer
2014: 5th largest consumermarket of the world
2020: expense of Brazilianhomes: R$ 5,000 bn
13
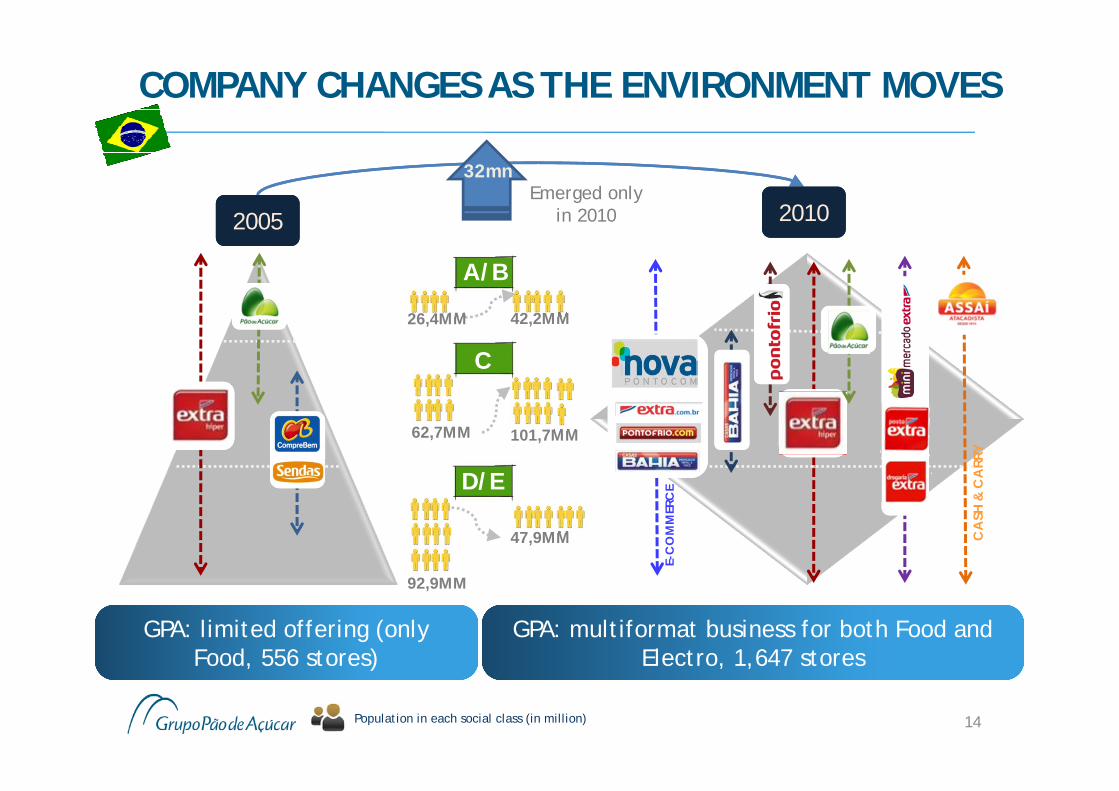
COMPANY CHANGES AS THE ENVIRONMENT MOVES
14Population in each social class (in million)
GPA: limited offering (only Food, 556 stores)
GPA: limited offering (only Food, 556 stores)
GPA: multiformat business for both Food and Electro, 1,647 stores
GPA: multiformat business for both Food and Electro, 1,647 stores
92,9MM
26,4MM
62,7MM 101,7MM
C
A/B
42,2MM
47,9MM
D/E
20052005 20102010
32mnEmerged only
in 2010
CA
SH &
CA
RRY
E-C
OM
MER
CE
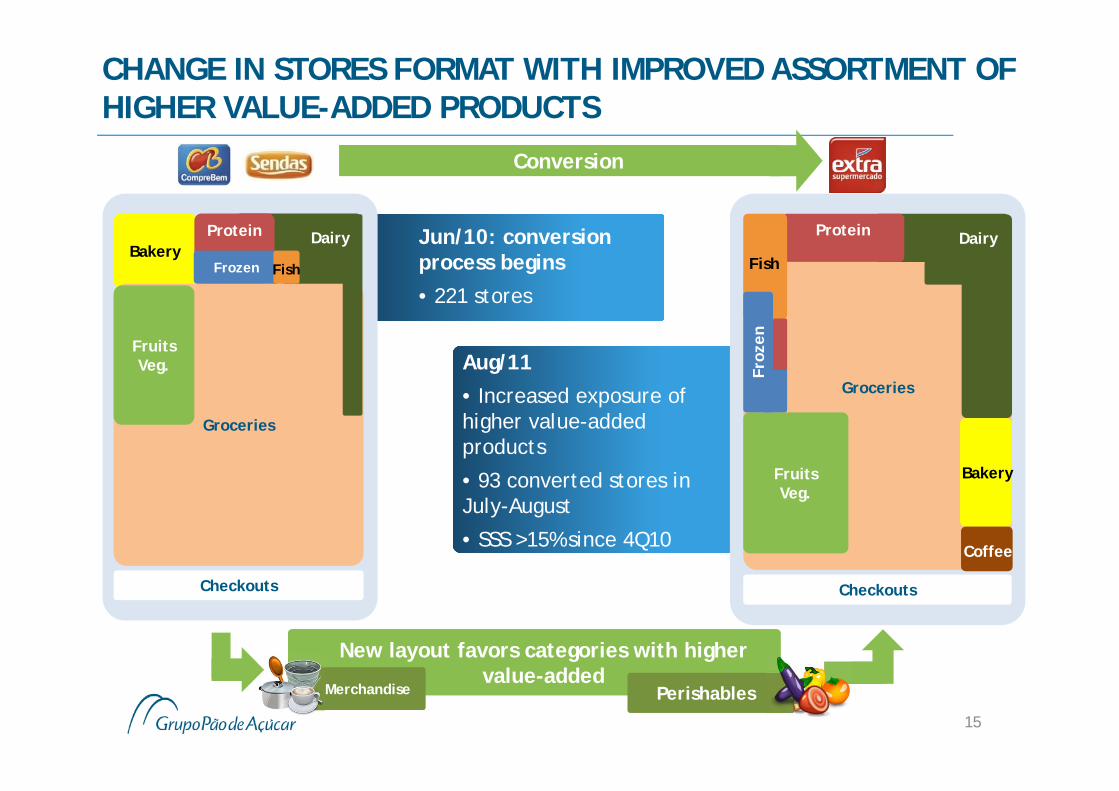
CHANGE IN STORES FORMAT WITH IMPROVED ASSORTMENT OF HIGHER VALUE-ADDED PRODUCTS
15
New layout favors categories with higher value-added
New layout favors categories with higher value-added
MerchandiseMerchandise PerishablesPerishables
Jun/10: conversion process begins
• 221 stores
Aug/11
• Increased exposure of higher value-added products
• 93 converted stores in July-August
• SSS >15% since 4Q10
Bakery
Checkouts
Groceries
FruitsVeg.
DairyProtein
Frozen Fish
Checkouts
Groceries
FruitsVeg.
DairyProtein
Fish
Bakery
Coffee
Froz
en
Conversion

16
Sales Area : from 200 to 300m²Bakery : services and broaden assortmentof productsSliced cheese/meat : sliced at thepurchase moment , self-service exposureand broaden assortmentButchery : customized servicesGroceries : refined products lineFruits/Vegetables : day-by-day productsbetter exposed.Differentiation AB/CD income classesSKUs: 3,600
Groceries: 2,600Perishables: 1,000
Sales Area: from 150 to 200m² Bakery: baken product (self-service)
Sliced cheese/meat: ready-to-go (fromindustry)
Butchery: vacuum packedGroceries: day-by-day productFruits/Vegetables: day-by-day product
Low differentiation AB/CD income classesSKUs: 3,600
Groceries: 2,800Perishables: 800
Previous Format(Focus: groceries, self-service)
Previous Format(Focus: groceries, self-service)
New modelNew model
Conversion
CHANGE IN STORES FORMAT WITH MORE PERISHABLES AND SERVICES

RETAIL INNOVATION AND PIONEERING GOES ON
Fashion in Extra• New positioning: near to specialized stores in terms of collection, communication and suppliers, but with hypermarket pricing strategy
Private Label Development• Strategic approach due to higher margin, profitability and customer loyalty
• Focus to increase share, with product life cycle management, quality control and more innovation
Perfumery • Scenario: Competition against Pharmacy, D2D and Beauty Salons• Actions: Exclusive products and exposition, reference for New product launch, beauty Consultant, growth in high penetration categories
17

18
GPA STORES CHARACTERISTICS
GPA FOOD Public Stores
Avg Sales Area (m2)
ABCD classes 134 6,000
AB classes 159 1,500
BCD classes 204 1,500
TransformersFood service 59 4,000
ABCD classes 69 300
Public Stores
ABC classes 403
CD classes 547
VIAVAREJO
Stores as of 2Q12.

*Stores as of 2Q12.Gas station and drugstores are not included.
NorthHyper: 1
Electro: 2
Total: 3
Middle-WestSuper: 14
Hyper: 12
Electro: 82
Cash & Carry: 3
Total: 111
North-EastSuper: 29
Hyper: 18
Electro: 36
Cash & Carry: 6
Total: 89
South-EastSuper: 316
Hyper: 101
Electro: 743
Cash & Carry: 50
Proximity: 69
Total: 1,279
SouthSuper: 4
Hyper: 2
Electro: 87
Total: 93
52 Distribution Centers in the country
GDP: 5.1%GDP: 5.1%
GDP: 9.2%GDP: 9.2%
GDP: 13.1%GDP: 13.1%
GDP: 56.0%GDP: 56.0%GDP: 16.6%GDP: 16.6%
REGIONAL PRESENCE (STORES*)
19
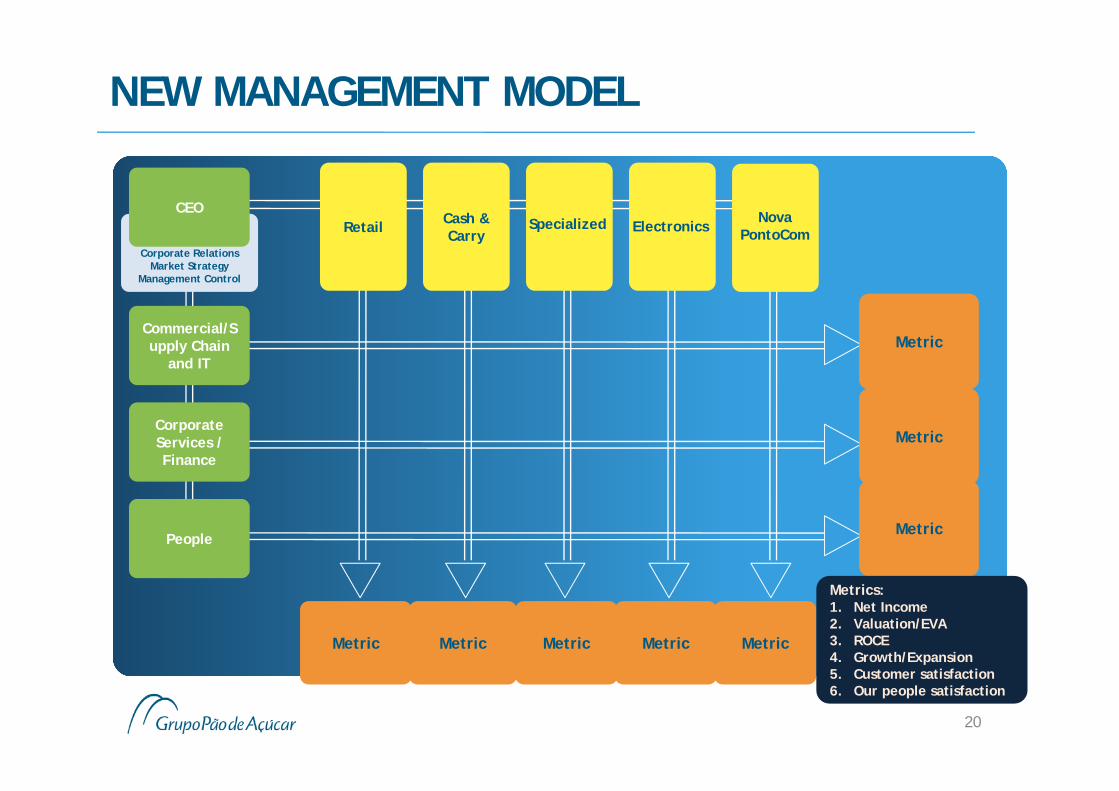
NEW MANAGEMENT MODEL
20
MetricCommercial/Supply Chain
and IT
Corporate Services / Finance
People
Retail Cash & Carry
Metric Metric Metric Metric Metric
Metric
Metric
Metrics:1. Net Income2. Valuation/EVA3. ROCE4. Growth/Expansion5. Customer satisfaction6. Our people satisfaction
Corporate RelationsMarket Strategy
Management Control
CEONova
PontoComSpecialized Electronics

21
OWNERSHIP STRUCTURE
37%
63%
47%53%
50% 6%
44%
FICFinancial JV 14%
36%
Banco Itaú
50%
Free Float
Controlling Group
Casas Bahia FoundersKlein Family
Management
As of March 31, 2012.

INVESTOR RELATIONS CONTACTS
Grupo Pão de Açúcar (GPA) | Viavarejo
Investor Relations TeamPhone: +55 (11) 3886‐0421 Fax: +55 (11) 3884‐2677
FORWARD‐LOOKING STATEMENTS> The forward‐looking statements contained herein are based on our management’s currentassumptions and estimates, which may result in material differences regarding future results,performance and events. Actual results, performance and events may differ substantially from thoseexpressed or implied in these forward‐looking statements due to a variety of factors, such as generaleconomic conditions in Brazil and other countries, interest and exchange rate levels, legal andregulatory changes and general competitive factors (whether global, regional, or national).
22