Grupo Pão de Açúcar - mzweb.com.br · Partner: Helbor Soon Bosque Launching Maia 544 apartments,...
11
2Q12 RESULTS Grupo Pão de Açúcar Grupo Pão de Açúcar July 24, 2012
Transcript of Grupo Pão de Açúcar - mzweb.com.br · Partner: Helbor Soon Bosque Launching Maia 544 apartments,...

2Q12 RESULTS
Grupo Pão de AçúcarGrupo Pão de AçúcarJuly 24, 2012

GPA CONSOLIDATED RESULTS 2Q12
Excluding Real Estate projects
Excluding Real Estate projects
Including Real Estate projects
Including Real Estate projects
Gross SalesGross Sales R$ million, 2Q12 x 2Q11Same‐store‐sales growth vs 2Q11
13,512 +7.2%SSS +5.6%
13,414 +6.4%SSS +5.6%
EBITDAEBITDA R$ million, 2Q12 x 2Q11EBITDA margin
787 +22.8%6.5%
692 +7.9%5.8%
Net Profit(1)Net Profit(1) R$ million, 2Q12 x 2Q11Net margin
255 +179.7%2 1%
159 +74.5%1 3%Net margin 2.1% 1.3%
2Q12 RESULTS 2(1) Net Income after non-controlling shareholders.
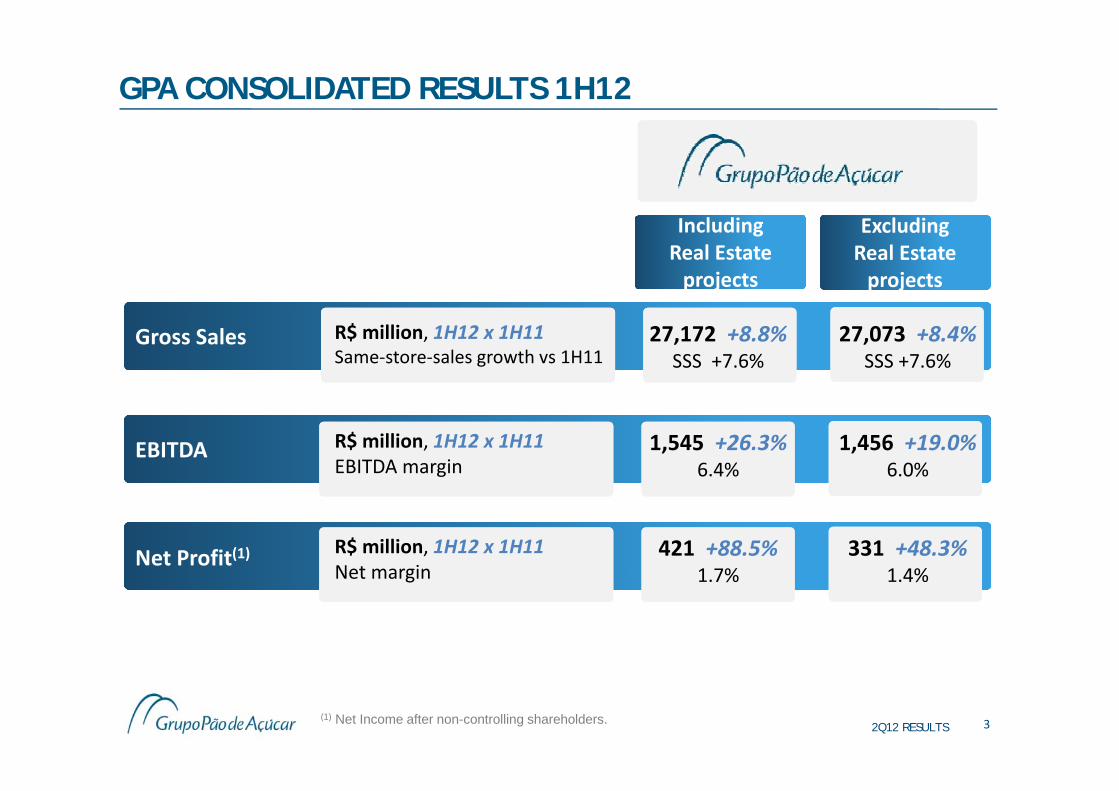
GPA CONSOLIDATED RESULTS 1H12
Excluding Real Estate projects
Excluding Real Estate projects
Including Real Estate projects
Including Real Estate projects
Gross SalesGross Sales R$ million, 1H12 x 1H11Same‐store‐sales growth vs 1H11
27,172 +8.8%SSS +7.6%
27,073 +8.4%SSS +7.6%
EBITDAEBITDA R$ million, 1H12 x 1H11EBITDA margin
1,545 +26.3%6.4%
1,456 +19.0%6.0%
Net Profit(1)Net Profit(1) R$ million, 1H12 x 1H11Net margin
421 +88.5%1 7%
331 +48.3%1 4%Net margin 1.7% 1.4%
2Q12 RESULTS 3(1) Net Income after non-controlling shareholders.
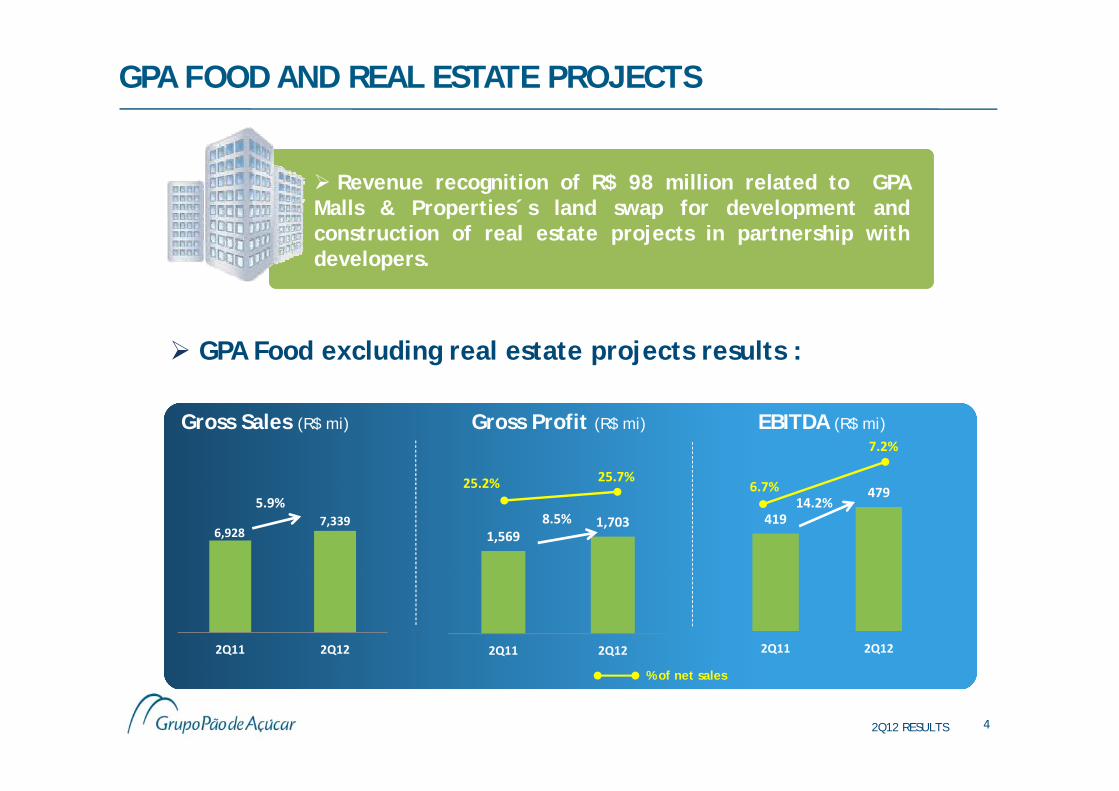
GPA FOOD AND REAL ESTATE PROJECTS
Revenue recognition of R$ 98 million related to GPAMalls & Properties´s land swap for development andp p pconstruction of real estate projects in partnership withdevelopers.
GPA Food excluding real estate projects results :
Gross Sales (R$ mi) Gross Profit (R$ mi)
25 2% 25.7%
EBITDA (R$ mi)
6 7%
7.2%
6,9287,339
5.9%
1,5691,703
25.2%
419
47914.2%
6.7%
8.5%
2Q11 2Q12 2Q11 2Q12 2Q11 2Q12
2Q12 RESULTS 4
% of net sales
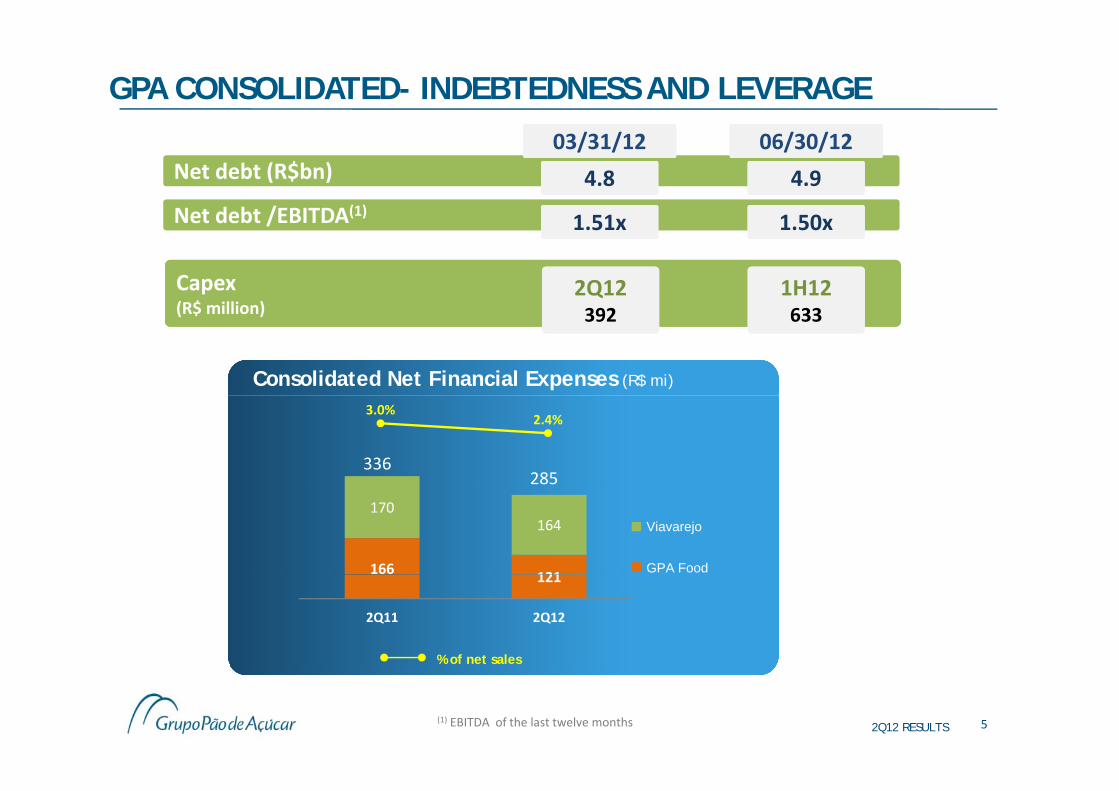
GPA CONSOLIDATED- INDEBTEDNESS AND LEVERAGE
Net debt (R$bn)Net debt (R$bn) 4.84.8 4.94.9
Net debt /EBITDA(1)Net debt /EBITDA(1)1 511 51 1 501 50
03/31/1203/31/12 06/30/1206/30/12
Net debt /EBITDA( )Net debt /EBITDA( )1.51x1.51x 1.50x1.50x
Capex(R$ million)Capex(R$ million)
1H121H122Q122Q12
Consolidated Net Financial Expenses (R$ mi)
(R$ million)(R$ million) 633633392392
3.0%2.4%
336285
166 121
170164 Viavarejo
GPA Food
% of net sales
121
2Q11 2Q12
2Q12 RESULTS(1) EBITDA of the last twelve months 5
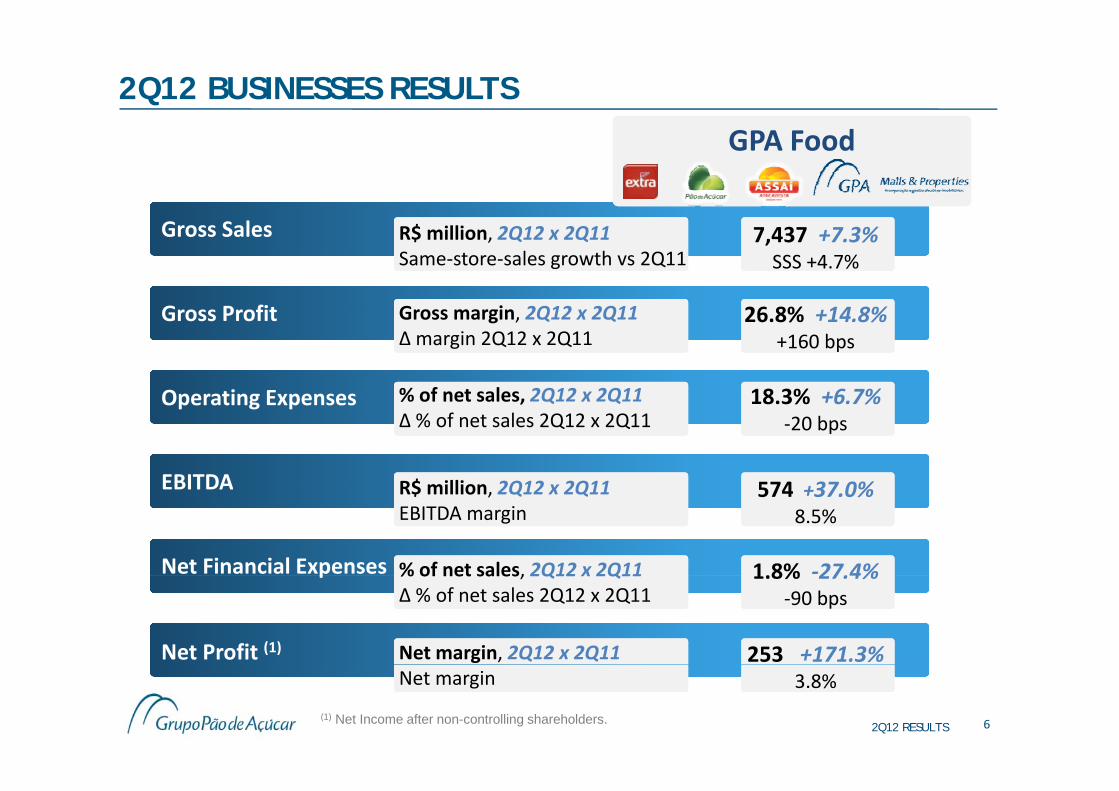
2Q12 BUSINESSES RESULTS
GPA Food
Gross SalesGross Sales
G P fiG P fi
R$ million, 2Q12 x 2Q11Same‐store‐sales growth vs 2Q11
7,437 +7.3%SSS +4.7%
G i 2Q 2 2QGross ProfitGross Profit
Operating ExpensesOperating Expenses
Gross margin, 2Q12 x 2Q11Δmargin 2Q12 x 2Q11
26.8% +14.8%+160 bps
% of net sales 2Q12 x 2Q11 18 3% +6 7%Operating ExpensesOperating Expenses
EBITDAEBITDA
% of net sales, 2Q12 x 2Q11Δ % of net sales 2Q12 x 2Q11
18.3% +6.7%‐20 bps
R$ million 2Q12 x 2Q11 574 37 0%EBITDAEBITDA
Net Financial ExpensesNet Financial Expenses
R$ million, 2Q12 x 2Q11EBITDA margin
574 +37.0%8.5%
% of net sales, 2Q12 x 2Q11 1 8% ‐27 4%pp
Net Profit (1) Net Profit (1)
% of net sales, 2Q12 x 2Q11Δ % of net sales 2Q12 x 2Q11
1.8% 27.4%‐90 bps
Net margin, 2Q12 x 2Q11 253 +171.3%
2Q12 RESULTS 6
Net margin 3.8%
(1) Net Income after non-controlling shareholders.
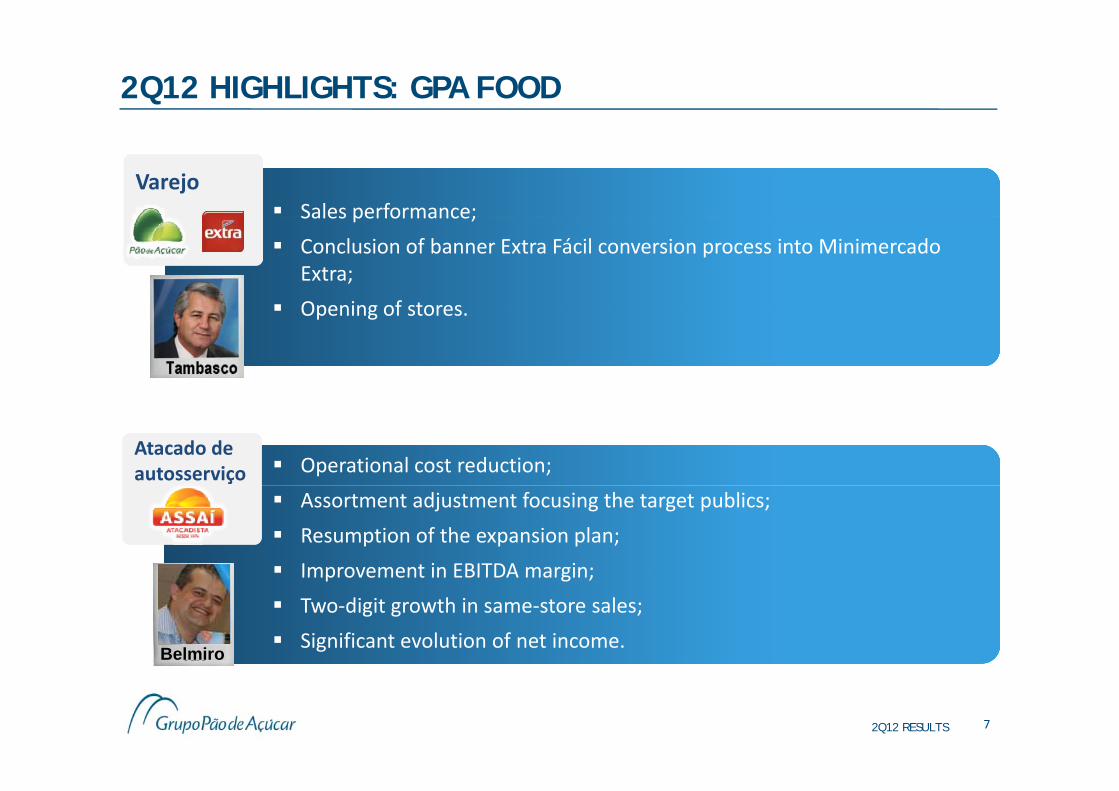
2Q12 HIGHLIGHTS: GPA FOOD
VarejoVarejo Sales performance;Sales performance;
Conclusion of banner Extra Fácil conversion process into MinimercadoExtra;
Opening of stores Opening of stores.
Atacado de autosserviçoAtacado de autosserviço Operational cost reduction;
Assortment adjustment focusing the target publics;
Resumption of the expansion plan;
Improvement in EBITDA margin;
Belmiro
Improvement in EBITDA margin;
Two‐digit growth in same‐store sales;
Significant evolution of net income.
2Q12 RESULTS 7
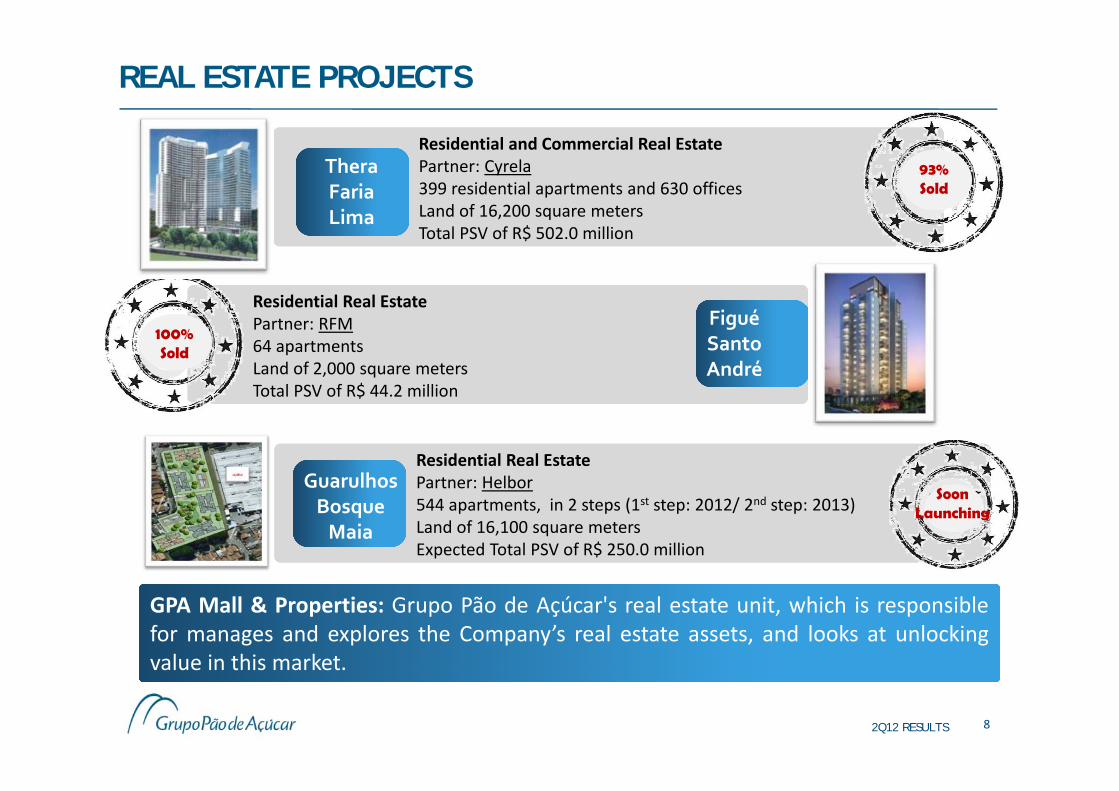
REAL ESTATE PROJECTS
93%Sold
TheraFariaLima
Residential and Commercial Real EstatePartner: Cyrela399 residential apartments and 630 officesLand of 16,200 square metersLima Land of 16,200 square meters Total PSV of R$ 502.0 million
Residential Real Estate
100%Sold
FiguéSantoAndré
Residential Real EstatePartner: RFM64 apartmentsLand of 2,000 square meters Total PSV of R$ 44.2 million
Guarulhos
Total PSV of R$ 44.2 million
Residential Real EstatePartner: Helbor
SoonLaunching
GuarulhosBosqueMaia
Partner: Helbor544 apartments, in 2 steps (1st step: 2012/ 2nd step: 2013)Land of 16,100 square metersExpected Total PSV of R$ 250.0 million
GPA Mall & Properties: Grupo Pão de Açúcar's real estate unit, which is responsiblefor manages and explores the Company’s real estate assets, and looks at unlockingvalue in this market
GPA Mall & Properties: Grupo Pão de Açúcar's real estate unit, which is responsiblefor manages and explores the Company’s real estate assets, and looks at unlockingvalue in this market
2Q12 RESULTS 8
value in this market.value in this market.
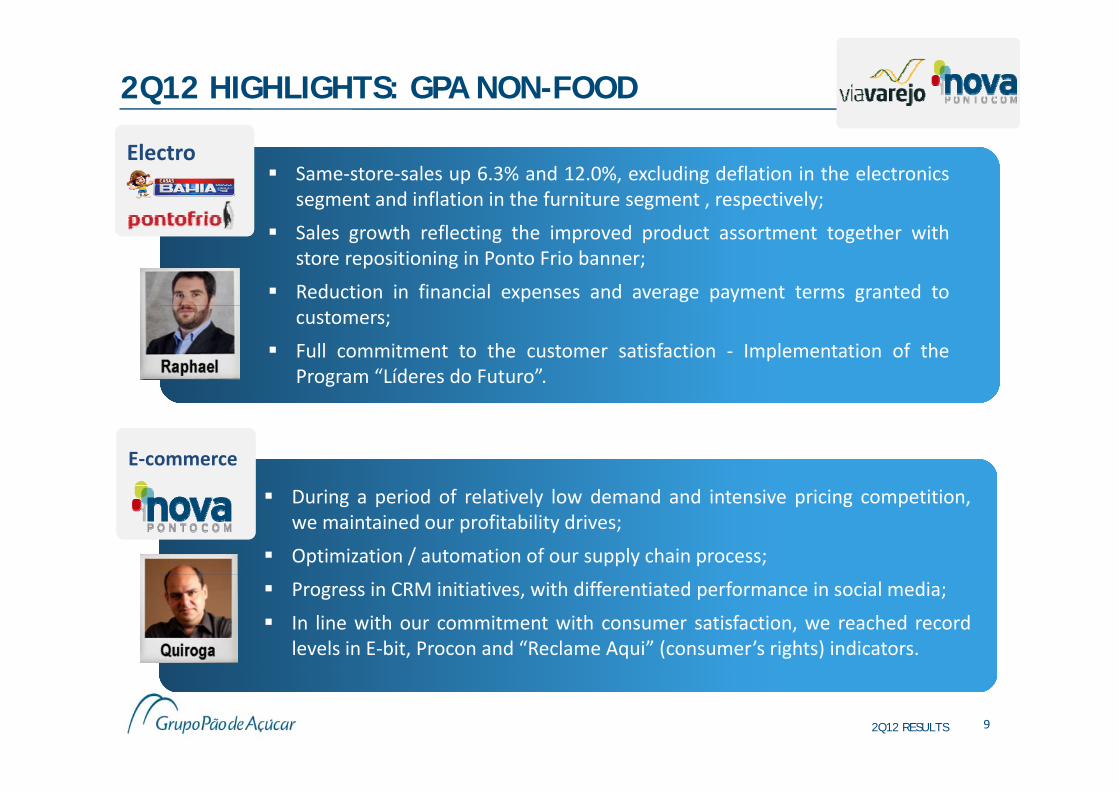
2Q12 HIGHLIGHTS: GPA NON-FOOD
ElectroElectro Same‐store‐sales up 6.3% and 12.0%, excluding deflation in the electronics
segment and inflation in the furniture segment , respectively;
Sales growth reflecting the improved product assortment together withstore repositioning in Ponto Frio banner;
Reduction in financial expenses and average payment terms granted tocustomers;
Full commitment to the customer satisfaction ‐ Implementation of theProgram “Líderes do Futuro”.
E‐commerceE‐commerce
During a period of relatively low demand and intensive pricing competition,we maintained our profitability drives;
Optimization / automation of our supply chain process;
Progress in CRM initiatives, with differentiated performance in social media;
In line with our commitment with consumer satisfaction, we reached recordlevels in E‐bit, Procon and “Reclame Aqui” (consumer’s rights) indicators.
2Q12 RESULTS 9
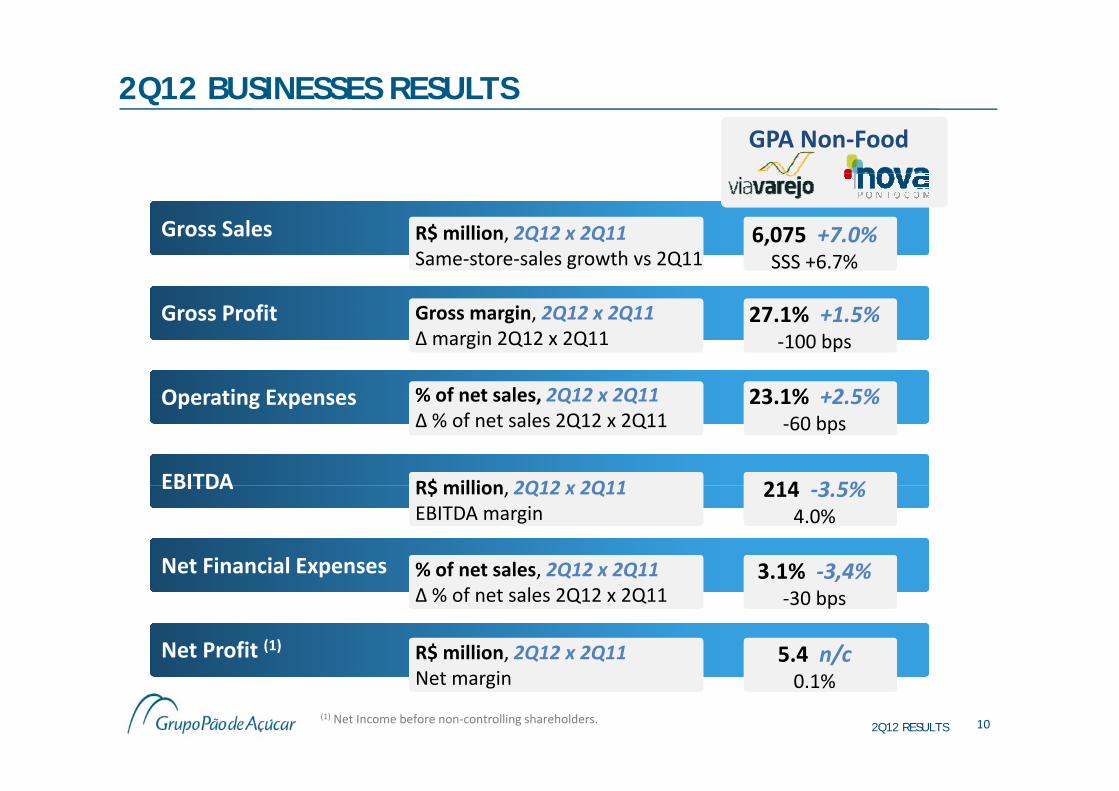
2Q12 BUSINESSES RESULTSGPA Non‐Food
Gross SalesGross Sales
G P fiG P fi
R$ million, 2Q12 x 2Q11Same‐store‐sales growth vs 2Q11
6,075 +7.0%SSS +6.7%
G i 2Q 2 2QGross ProfitGross Profit
Operating ExpensesOperating Expenses
Gross margin, 2Q12 x 2Q11Δmargin 2Q12 x 2Q11
27.1% +1.5%‐100 bps
% of net sales 2Q12 x 2Q11 23 1% +2 5%Operating ExpensesOperating Expenses
EBITDAEBITDA
% of net sales, 2Q12 x 2Q11Δ % of net sales 2Q12 x 2Q11
23.1% +2.5%‐60 bps
R$ million 2Q12 x 2Q11 214 3 5%EBITDAEBITDA
Net Financial ExpensesNet Financial Expenses
R$ million, 2Q12 x 2Q11EBITDA margin
214 ‐3.5%4.0%
% of net sales, 2Q12 x 2Q11 3 1% ‐3 4%pp
Net Profit (1)Net Profit (1)
% of net sales, 2Q12 x 2Q11Δ % of net sales 2Q12 x 2Q11
3.1% 3,4%‐30 bps
R$ million, 2Q12 x 2Q11 5.4 n/c
2Q12 RESULTS 10
Net margin/
0.1%
(1) Net Income before non‐controlling shareholders.
INVESTOR RELATIONS CONTACTS
Grupo Pão de Açúcar (GPA) | Viavarejo
Investor Relations Team
Phone: +55 (11) 3886‐0421
Fax: +55 (11) 3884‐2677Fax: 55 (11) 3884 2677
www gpari com brwww.gpari.com.br
FORWARD‐LOOKING STATEMENTS> The forward‐looking statements contained herein are based on our management’s currentassumptions and estimates, which may result in material differences regarding future results,performance and events. Actual results, performance and events may differ substantially from thoseexpressed or implied in these forward‐looking statements due to a variety of factors, such as generaleconomic conditions in Brazil and other countries interest and exchange rate levels legal andeconomic conditions in Brazil and other countries, interest and exchange rate levels, legal andregulatory changes and general competitive factors (whether global, regional, or national).
2Q12 RESULTS 11