
RFID in Manufacturing: Mapping the Shop Floor to IT ...
220
RFID in Manufacturing: Mapping the Shop Floor to IT-Enabled Business Processes DISSERTATION zur Erlangung des akademischen Grades doctor rerum politicarum (Dr. rer. pol.) im Fach Wirtschaftswissenschaft eingereicht an der Wirtschaftswissenschaftlichen Fakultät Humboldt-Universität zu Berlin von Frau Dipl.-Inf. Lenka Ivantysynova geboren am 09.12.1979 in Gera Präsident der Humboldt-Universität zu Berlin: Prof. Dr. Dr. h.c. Christoph Markschies Dekan der Wirtschaftswissenschaftlichen Fakultät: Prof. Oliver Günther, PhD Gutachter: 1. Prof. Oliver Günther, PhD 2. Prof. Dr.-Ing. Frank Straube eingereicht am: 24. Oktober 2008 Tag der mündlichen Prüfung: 26. November 2008
Transcript of RFID in Manufacturing: Mapping the Shop Floor to IT ...

RFID in Manufacturing: Mapping the ShopFloor to IT-Enabled Business Processes
DISSERTATION
zur Erlangung des akademischen Gradesdoctor rerum politicarum
(Dr. rer. pol.)im Fach Wirtschaftswissenschaft
eingereicht an derWirtschaftswissenschaftlichen Fakultät
Humboldt-Universität zu Berlin
vonFrau Dipl.-Inf. Lenka Ivantysynovageboren am 09.12.1979 in Gera
Präsident der Humboldt-Universität zu Berlin:Prof. Dr. Dr. h.c. Christoph MarkschiesDekan der Wirtschaftswissenschaftlichen Fakultät:Prof. Oliver Günther, PhDGutachter:
1. Prof. Oliver Günther, PhD2. Prof. Dr.-Ing. Frank Straube
eingereicht am: 24. Oktober 2008Tag der mündlichen Prüfung: 26. November 2008
Abstract
In this thesis, I investigate how radio-frequency identification (RFID) tech-nology can contribute to the optimization of production processes. RFIDallows the automatic identification of entire batches of goods on the level ofpallets, cases, or even individual items. Moreover, RFID facilitates electronicdata collection under circumstances in which alternative technologies – e.g.,bar codes – cannot be applied. Companies can use these data to create mod-els of their business processes which enable them to gain a virtual image ofaspects of their enterprise, such as their shop floor or supply chain. This vir-tual image can help them acquire higher awareness of problems and localizepotentials for process optimizations.
In the first chapters of my thesis I analyze potential benefits and chal-lenges of using RFID to improve production processes. To this end, I con-ducted case studies at six German manufacturing enterprises in which I ex-plore possible RFID scenarios. Based on the case studies I evaluate sevenuse cases for RFID. They are either a replacement of bar codes or an appli-cation that can only be realized using RFID. Furthermore, I evaluate whichchallenges the manufacturer has to face when applying RFID.
Chapters 4 and 5 of my thesis deal with the question of how RFID can beembedded into an existing IT infrastructure. For this I first evaluate generalIT infrastructures at diverse manufacturers by conducting seven additionalcase studies. I then design guidelines for integrating the RFID requirementsobtained from the case studies into existing software systems, showing whereRFID data processing can fit in.
The manufacturing domain still lacks dedicated models for evaluatingcosts and benefits of an RFID rollout especially concerning the intangi-ble, non-quantifiable aspects of such an investment. Therefore, Chapter 6presents such a model.
In Chapter 7 I look beyond inter-enterprise RFID applications in manu-facturing: RFID can ensure real-time information sharing when implementedin inter-organizational systems along the supply chain. However, besideschallenges in intra-organizational scenarios of applying RFID in productionprocesses, I can also observe an inter-organizational reservation of embed-ding RFID in supply chains. Therefore, I analyze and identify importantdeterminants of adopting RFID in supply chains; taking the automotive asan example.
Zusammenfassung
In dieser Doktorarbeit untersuche ich, wie Radiofrequenz-Identifizierung(RFID) zu einer Optimierung von Produktionsprozessen beitragen kann.RFID ermöglicht die automatische Identifizierung von gesamten Produkti-onschargen auf Paletten oder in Kisten sowie eine Identifizierung einzelnerProdukte. Darüber hinaus erleichtert RFID elektronische Datenerfassung inFällen, in denen alternative Technologien – z.B. Barcodes – nicht angewendetwerden können. Unternehmen können diese Daten nutzen, um Modelle ihrerUnternehmensprozesse zu erstellen. Diese Modelle ermöglichen es ihnen einevirtuelle Abbildung von Teilen ihres Unternehmens zu erstellen; z.B. ihrerProduktion oder der Lieferkette. Diese Abbildung kann ihnen dabei helfen,mögliche Probleme zu lokalisieren und Prozesse zu optimieren.
In den ersten Kapiteln meiner Dissertation analysiere ich, welchen po-tenziellen Nutzen die Anwendung von RFID für Prozessoptimierungen er-gibt und welche Herausforderungen daraus erwachsen. Diesbezüglich habeich sechs Fallstudien in deutschen Produktionsbetrieben durchgeführt, in de-nen ich mögliche RFID-Szenarien untersuche. Basierend auf den Fallstudienwerte ich sieben RFID-Anwendungsszenarien aus. Diese sind entweder einErsatz von Barcodes oder eine Anwendung, die nur mit Hilfe von RFID er-möglicht wird.
Kapitel 4 und 5 beschäftigen sich mit der Frage, wie RFID in die existie-rende IT-Infrastruktur eingebettet werden kann. Dafür evaluiere ich zunächstgenerelle IT-Infrastrukturen bei unterschiedlichen, produzierenden Unterneh-men, indem ich weitere sieben Fallstudien durchführe. Im Anschluss erstelleich Leitlinien für eine Integration von RFID in existierende Softwaresysteme,bei der die in diesen Fallstudien gewonnenen Anforderungen erfüllt werden.
Für die Produktion gibt es noch immer keine dedizierten Modelle fürdie Berechnung von quantifizierbaren und die Abschätzung von nicht-quantifizierbaren Nutzen und Kosten von RFID-Einführungen. Aus diesemGrund untersuche ich in Kapitel 6 quantifizierbare und nicht-quantifizierbareKosten und Nutzen von RFID-Einführungen in der Produktion.

In Kapitel 7 untersuche ich RFID-Anwendungen, die über die Unterneh-mensgrenzen hinausgehen: RFID kann, wenn es in inter-organisatorischenSystemen implementiert ist, einen Informationsaustausch in Echtzeit gewähr-leisten. Jedoch stelle ich bei den Unternehmen neben den unternehmensinter-nen auch in den inter-organisatorischen RFID-Szenarien Vorbehalte gegen-über RFID-Einführungen fest. Daher analysiere und identifiziere ich wichtigeFaktoren für die Einführung von RFID in Lieferketten am Beispiel der Lie-ferkette der Automobilindustrie.
iv

To Tobias, and my loving parents.
i

Contents
1 Introduction 11.1 Motivation . . . . . . . . . . . . . . . . . . . . . . . . . . . . . 11.2 RFID Technology: An Overview . . . . . . . . . . . . . . . . . 31.3 IT Infrastructures in Manufacturing . . . . . . . . . . . . . . . 51.4 Principal Contributions . . . . . . . . . . . . . . . . . . . . . . 71.5 Organization . . . . . . . . . . . . . . . . . . . . . . . . . . . 9
2 Potential Benefits of RFID on the Shop Floor 102.1 Automatic Identification Technologies . . . . . . . . . . . . . . 112.2 RFID Applications . . . . . . . . . . . . . . . . . . . . . . . . 132.3 Case Studies . . . . . . . . . . . . . . . . . . . . . . . . . . . . 16
2.3.1 Production of Airbags . . . . . . . . . . . . . . . . . . 172.3.2 Production of Sliding Clutches . . . . . . . . . . . . . . 232.3.3 Production of Engine-Cooling Modules . . . . . . . . . 282.3.4 Production of Cast Parts . . . . . . . . . . . . . . . . . 322.3.5 Production of Electronic Connectors . . . . . . . . . . 352.3.6 Production of Aluminum Foils for Packaging . . . . . . 41
2.4 Lessons Learned . . . . . . . . . . . . . . . . . . . . . . . . . . 462.4.1 Evaluating Potential Benefits . . . . . . . . . . . . . . 462.4.2 Comparing RFID with other Auto-ID Technologies . . 552.4.3 Evaluating Current Motives and Open Potentials . . . 58
2.5 Conclusion . . . . . . . . . . . . . . . . . . . . . . . . . . . . . 61
3 Challenges of Embedding RFID into Shop-Floor Processes 643.1 Reference Model for Production Processes . . . . . . . . . . . 643.2 Hindrances on the Shop Floor . . . . . . . . . . . . . . . . . . 67
3.2.1 Hostile Physical Conditions . . . . . . . . . . . . . . . 673.2.2 Presence of Metal . . . . . . . . . . . . . . . . . . . . . 683.2.3 Demand for Wireless Communication . . . . . . . . . . 683.2.4 Processes in Close Spatial Proximity . . . . . . . . . . 69
3.3 Required RFID Functionalities . . . . . . . . . . . . . . . . . . 69
ii
3.3.1 Filtering and Enriching RFID Data . . . . . . . . . . . 703.3.2 Storing RFID Data . . . . . . . . . . . . . . . . . . . . 713.3.3 Exchanging RFID Data . . . . . . . . . . . . . . . . . 723.3.4 Detecting Events in RFID Data . . . . . . . . . . . . . 73
3.4 Constraints for IT Infrastructures . . . . . . . . . . . . . . . . 753.4.1 Distributing Business Logic and Data . . . . . . . . . . 753.4.2 Supporting Heterogeneous Data Sources . . . . . . . . 783.4.3 Dealing with Noise and Uncertainty . . . . . . . . . . . 793.4.4 Supporting Process Analysis . . . . . . . . . . . . . . . 793.4.5 Supporting Asset Tracking . . . . . . . . . . . . . . . . 803.4.6 Providing RFID Data to Components of the Middle
Layer . . . . . . . . . . . . . . . . . . . . . . . . . . . . 803.5 Conclusion . . . . . . . . . . . . . . . . . . . . . . . . . . . . . 81
4 IT Infrastructures Deployed in Manufacturing 834.1 Flow of Information between Shop Floor and Top Floor . . . . 84
4.1.1 The Purdue Reference Model for Computer-IntegratedManufacturing . . . . . . . . . . . . . . . . . . . . . . 85
4.1.2 ISA-S95 . . . . . . . . . . . . . . . . . . . . . . . . . . 874.1.3 OPC . . . . . . . . . . . . . . . . . . . . . . . . . . . . 90
4.2 Case Studies . . . . . . . . . . . . . . . . . . . . . . . . . . . . 924.2.1 Production of Milk Products . . . . . . . . . . . . . . . 934.2.2 Production of Cooling Engines . . . . . . . . . . . . . . 984.2.3 Production of Refractories . . . . . . . . . . . . . . . . 1034.2.4 Production of Engines . . . . . . . . . . . . . . . . . . 1074.2.5 Production of Chemicals . . . . . . . . . . . . . . . . . 1164.2.6 Production of Power Plants . . . . . . . . . . . . . . . 1254.2.7 Production of Tires . . . . . . . . . . . . . . . . . . . . 128
4.3 Lessons Learned . . . . . . . . . . . . . . . . . . . . . . . . . . 1324.3.1 Data Acquisition and Dataflow in IT Infrastructures . . 1324.3.2 Mapping Analyzed IT Infrastructures to ISA-S95 . . . 1334.3.3 Central Versus Local Production Control . . . . . . . . 1344.3.4 Activities Supported by RFID . . . . . . . . . . . . . . 1364.3.5 Requirements for the ISA-S95 Level 3 . . . . . . . . . . 137
4.4 Conclusion . . . . . . . . . . . . . . . . . . . . . . . . . . . . . 139
5 Design Guidelines for Embedding RFID into IT Infrastruc-tures 1405.1 Related Work . . . . . . . . . . . . . . . . . . . . . . . . . . . 1415.2 RFID in Manufacturing: Common Functionalities . . . . . . . 141
5.2.1 Identifying Requirements . . . . . . . . . . . . . . . . . 142
iii

5.2.2 Analyzing Similarities and Variations . . . . . . . . . . 1445.2.3 Estimating Commonalities of Requirements . . . . . . 1445.2.4 Modeling the Flow of Common Activities . . . . . . . . 145
5.3 Implementation Issues . . . . . . . . . . . . . . . . . . . . . . 1465.3.1 Technologies for Implementing the Common Activities 1465.3.2 Distributing Data and Logic . . . . . . . . . . . . . . . 150
5.4 Conclusion . . . . . . . . . . . . . . . . . . . . . . . . . . . . . 153
6 Costs and Benefits of RFID Investments 1546.1 Related Work . . . . . . . . . . . . . . . . . . . . . . . . . . . 1556.2 Quantifiable Costs and Benefits . . . . . . . . . . . . . . . . . 158
6.2.1 Fixed Costs . . . . . . . . . . . . . . . . . . . . . . . . 1586.2.2 Variable Cost . . . . . . . . . . . . . . . . . . . . . . . 1596.2.3 Benefits . . . . . . . . . . . . . . . . . . . . . . . . . . 160
6.3 Non-Quantifiable Costs and Benefits . . . . . . . . . . . . . . 1646.3.1 Operational Benefits . . . . . . . . . . . . . . . . . . . 1646.3.2 Strategic Benefits . . . . . . . . . . . . . . . . . . . . . 1666.3.3 Risks and Costs . . . . . . . . . . . . . . . . . . . . . . 1676.3.4 Assessment . . . . . . . . . . . . . . . . . . . . . . . . 170
6.4 How to Combine Tangible and Intangible Costs and Benefits . 1716.5 Conclusion . . . . . . . . . . . . . . . . . . . . . . . . . . . . . 173
7 Beyond Manufacturing: RFID in the Automotive SupplyChain 1767.1 Related Work . . . . . . . . . . . . . . . . . . . . . . . . . . . 1777.2 Toward an RFID Adoption Model in the Automotive Industry 178
7.2.1 Technology-Related Factors . . . . . . . . . . . . . . . 1787.2.2 Organizational Readiness Factors . . . . . . . . . . . . 1797.2.3 External Environment Factors . . . . . . . . . . . . . . 1807.2.4 Inter-Organizational Pressure Factors . . . . . . . . . . 180
7.3 Method and Results . . . . . . . . . . . . . . . . . . . . . . . 1827.3.1 Technology-related Factors . . . . . . . . . . . . . . . . 1837.3.2 Organizational Readiness Factors . . . . . . . . . . . . 1857.3.3 External Environment Factors . . . . . . . . . . . . . . 1857.3.4 Inter-Organizational Pressure Factors . . . . . . . . . . 186
7.4 Conclusion . . . . . . . . . . . . . . . . . . . . . . . . . . . . . 188
8 Conclusion 192
Bibliography 195
iv

Appendix 206
Abbreviations 207
Acknowledgment 209
Declaration 211
v

Chapter 1
Introduction
Radio-frequency identification (RFID) can increase the accessibility of fine-grained process data. RFID technology enables the exchange of data withtagged physical objects in environments in which alternative technologiescannot effectively be deployed. It therefore possesses the potential to bridgethe gap between the real world and the virtual world of IT systems. Byincreasing the accessibility of precise data, RFID promises to alleviate exist-ing business problems [Floekermeier, 2006]. The term real-world awareness isused to characterize this convergence between the physical and virtual worldsand the availability of timely and accurate information.
In this chapter I outline the need for an analysis of the potential benefitsof RFID on the shop floor. Subsequently this chapter gives a short overviewof RFID technology and IT infrastructures in manufacturing. Then I outlinemy principal contributions and conclude the chapter with an overview of thisthesis.
1.1 MotivationDuring recent years, increased data storage capabilities on RFID chips, re-duced tag prices, and improved robustness of tags have made RFID-basedapplications increasingly appealing to a wide range of industries. In logistics,RFID is already used for numerous applications. Examples include the au-tonomous and decentralized management of logistic processes [Scholz-Reiteret al., 2004], tracking and tracing [Fruness, 2006], and the management ofperishable goods throughout supply chains [Kärkkäinen, 2003].
The characteristics of RFID technology include the capability to detecttags without a line of sight, the possibility to store data on the tag, andthe physical robustness of the tags. Even though the possibility of applying
1
RFID applications on the shop floor has recently gained attention [Chap-pell et al., 2003, MCBeath, 2006], little experience with such applicationscurrently exists. Therefore, it is often unclear if and when RFID technologyreally is a better basis for a solution than alternative technologies such as barcodes. Hence, there is a clear need for a profound analysis of RFID benefitsand an evaluation of RFID use cases in manufacturing. In addition to thebenefits one also has to study hindrances that prevent a ubiquitous use ofRFID in manufacturing today.
When applying RFID in production, it needs to be integrated into theused IT systems. Here, each manufacturer has to deal with the same chal-lenges: No consolidated findings on how to integrate RFID into the IT infras-tructure exist. The consequence is that each IT department has to developa solution from scratch, without the foundation of a design framework. Thisgenerally increases the complexity of RFID introductions and hampers RFIDinvestments in the manufacturing domain [Strüker et al., 2008, p.8]. Thereare several recurring challenges. First the IT staff needs to know whichfunctionalities they have to assure in the IT infrastructure when embeddingRFID. Secondly it is also essential to know what technologies are best suitedfor the implementation. Additionally, they have to decide what the mostefficient distribution of data and logic within the IT infrastructure is.
Even though each solution for embedding RFID is unique, manufacturersdeal with some common design structures. Therefore, it is possible to derivecommonalities and variations for IT systems that support RFID applicationsin manufacturing. This should cover reusable assets including requirementsand functional components. Beyond this, manufacturers need guidance forimplementing the required functionality and heuristics for mapping the soft-ware components to the hardware infrastructure.
Another hindrance for an RFID adoption is that managers lack dedicatedmodels that assess RFID investments. Lacking the possibilities for forecast-ing and measuring benefits is seen as one of the top three barriers regardingRFID deployments in enterprises [Strüker et al., 2008, p.26]. When investingin RFID, companies face the dilemma of most information communicationtechnology investments: these investments often do not have a “direct valuein [their] own right”; they rather open up “a potential for derived value”,stemming from a reorganization of business processes supported by the newtechnology [Remenyi et al., 2000]. As a result, it is often impossible to makereliable ROI calculations ex-ante. According to Lucas [1999], the likelihoodthat IT investments generate a positive ROI is 50% or even below for most in-vestment types (infrastructure investments, investments focusing on indirectreturns, strategic applications, transformational IT etc.).
However, does this really mean that such investments tend to be prob-
2

lematic, or does the problem rather lie within the purely monetary focusof the selected performance indicator (i.e., ROI)? Many benefits – but alsosome risks – of RFID are difficult to measure in monetary terms. RFID in-vestments might, for example, affect the company’s image, its relationshipswith customers and suppliers or the employees’ motivation. All these effectsare hardly quantifiable in advance.
A holistic evaluation approach that takes both monetary and intangi-ble aspects of the investment into account would help manufacturers decidewhether an investment in RFID is advantageous. Guidelines that wouldassess both the quantifiable and the non-quantifiable aspects of RFID inmanufacturing would help to reduce the main obstacle that leads to deci-sions against RFID; that is, the lack of predictable benefits [Schmitt andMichahelles, 2008].
RFID technology can also be implemented as an inter-organizational sys-tem along the supply chain to ensure real-time information sharing [Sharmaet al., 2007]. For instance Strassner and Fleisch [2003] have shown that theuse of RFID technology in such a collaborative manner can bring significantbenefits for the automotive supply chain. However, even though some origi-nal equipment manufacturers (OEMs) are currently engaged in RFID-relatedpilot projects, which involve both intra- and inter-organizational system sce-narios, the technology has not yet made a decisive step from the meetingroom to real-life implementations. It is therefore valuable to understandwhich factors influence RFID adoption.
1.2 RFID Technology: An OverviewRadio-frequency identification (RFID) is an automatic identification methodthat uses electromagnetic waves to remotely retrieve data stored on transpon-ders. These transponders can be associated with physical objects. Therefore,the retrieved data can be used to identify these objects. This concept wasexplored with several RFID-related technologies in the first part of the 20thcentury. One prominent example is the “friend or foe” transponder systemsfor military aircraft first used during World War II. In general, the devel-opment of RFID can be traced back to the landmark paper by Stockman[1948]. In his paper Stockman writes:
Point-to-point communication, with the carrier power generatedat the receiving end and the transmitter replaced by a modu-lated reflector, represents a transmission system [...]. Radio, light,or sound waves (essentially microwaves, infrared, and ultrasonicwaves) may be used for the transmission...
3

Today, the hardware of such a transmission system comprises RFID read-ers as carriers generating the power, and transponders (also referred to astags). The tags receive signals from the readers. Readers have the ability toread from as well as write to the transponders’ memory.
Each tag consists of an inlay and a casing for the inlay. Popular formsof casings are made out of paper labels and glue which allow the tag to beapplied in the manner of a sticker. Other casings (e.g., made of plastics)are designed for protecting the inlay from hostile environmental conditions.The inlay itself typically comprises a computer chip with a memory andcommunication logic as well as an antenna. Mass-produced versions of RFIDinlays are already available below 10 euro cents. Fully converted tags (e.g.,in the form of a sticker), usually cost from 20 euro cents upwards.
I categorize RFID tags according to their (i) energy supply, (ii) datastorage capabilities and (iii) communication frequency. Finkenzeller [2003]gives a detailed description of each of these attributes. Table 1.1 shows someexemplary tags and their corresponding attributes.
Table 1.1: Exemplary tags with their attributes energy supply (battery), datastorage capabilities (memory and access to memory), and frequency.
Tag Bat. data storage freq.Mem. Access
VOLCANO TAG 231 no 64Bit read only 125 kHz(Assion Electronic)BIS L no 192Byte read/write 125 kHz(Balluff)TFM 05 2205.210 no 44Byte read/write 13.56 MHz(Leuze electronic)Short Dipole Label no 96Bit read only 868 or 915 MHz(Intermec)AD-220 9 no 96Bit read/write 902-928 MHz(avery dennison)Beacon Tag 137001 yes 9Byte read only 868 or 915 MHz(Gao RFID Inc.)
Tags without batteries are referred to as passive tags. These tags harvestenergy from the communication signal sent by the RFID reader to run theiroperations. By contrast, active tags use a battery for energy supply.
RFID tags can have diverse storage capabilities starting at a few bits andgoing up to several megabytes. Furthermore, one can distinguish betweenread-only and rewritable tags, according to the properties of their memory.
4
Regarding the communication frequency, RFID tags are usually catego-rized into low-frequency (LF), high-frequency (HF) or ultra-high-frequency(UHF) transponders. Low-frequency tags typically operate on frequenciesaround 125 kHz and have communication ranges which are commonly below0.5 meters. HF tags operate on the frequency of 13.56 MHz and typicallyreach communication ranges of 0.5 meters to approximately one meter. Both,LF and HF tags use inductive coupling for communication. By contrast, UHFtags operate using backscattering and reach ranges of up to approximately 7meters. UHF tags operate in a frequency range between 860 and 960 MHz.For more details see Finkenzeller [2003].
The communication via air interface is regulated by standardized proto-cols. A popular standard for RFID tags is the Gen 2 standard from EPC-global [2005]. It is specified for UHF tags and ratified as the ISO standard18000-6c [ISO/IEC-18000, 2004a]. This standard is commonly used for lo-gistics applications which are based on the electronic product code (EPC).EPC numbers of 96-bit size can be read from and written to Gen 2 tags. Ad-ditionally, an optional user memory is specified for arbitrary use [EPCglobal,2005].
The software of an RFID system can be divided into applications andmiddleware. The middleware can run centrally on a single server or dis-tributed over different machines, e.g., Bornhövd et al. [2004], Floerkemeierand Lampe [2005], Goyal [2003]. Its role is to coordinate a number of RFIDreaders that are usually located close to each other, for example, within asingle plant or production line. The middleware buffers, aggregates and fil-ters data coming in from the readers. The main reason is to reduce the loadfor the upstream applications. These applications can come from diversesoftware systems. In manufacturing environments, these are typically MESor ERP systems.
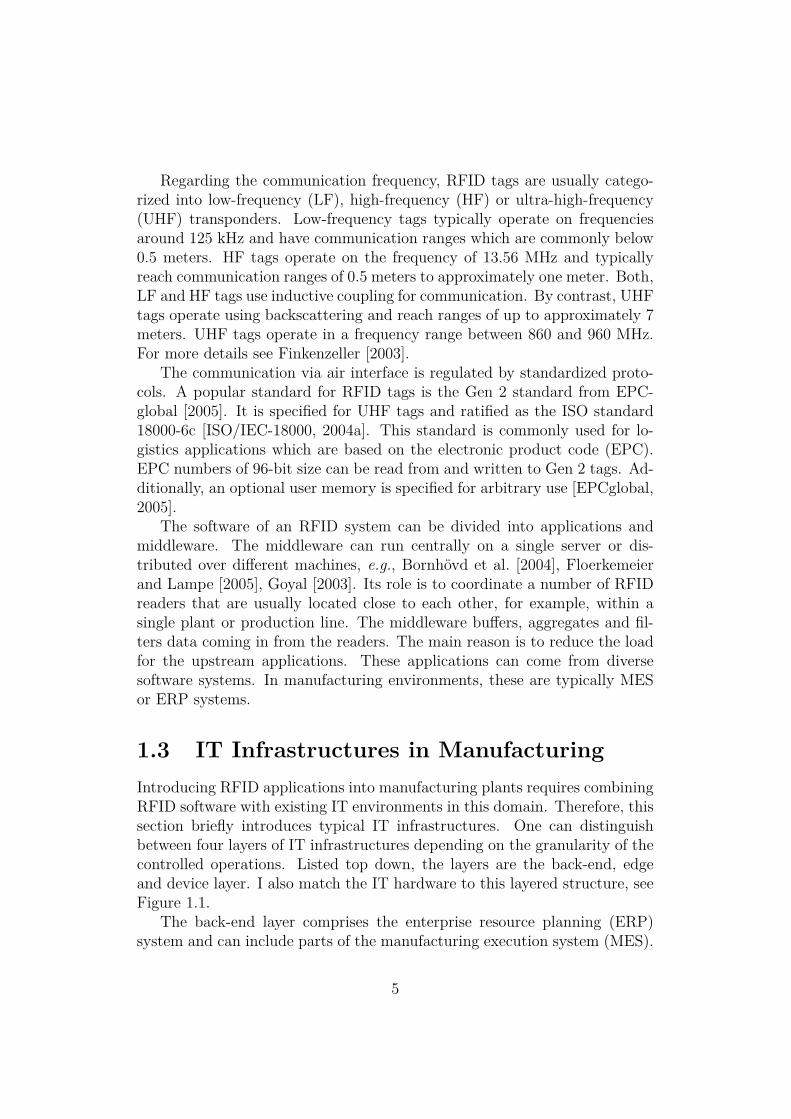
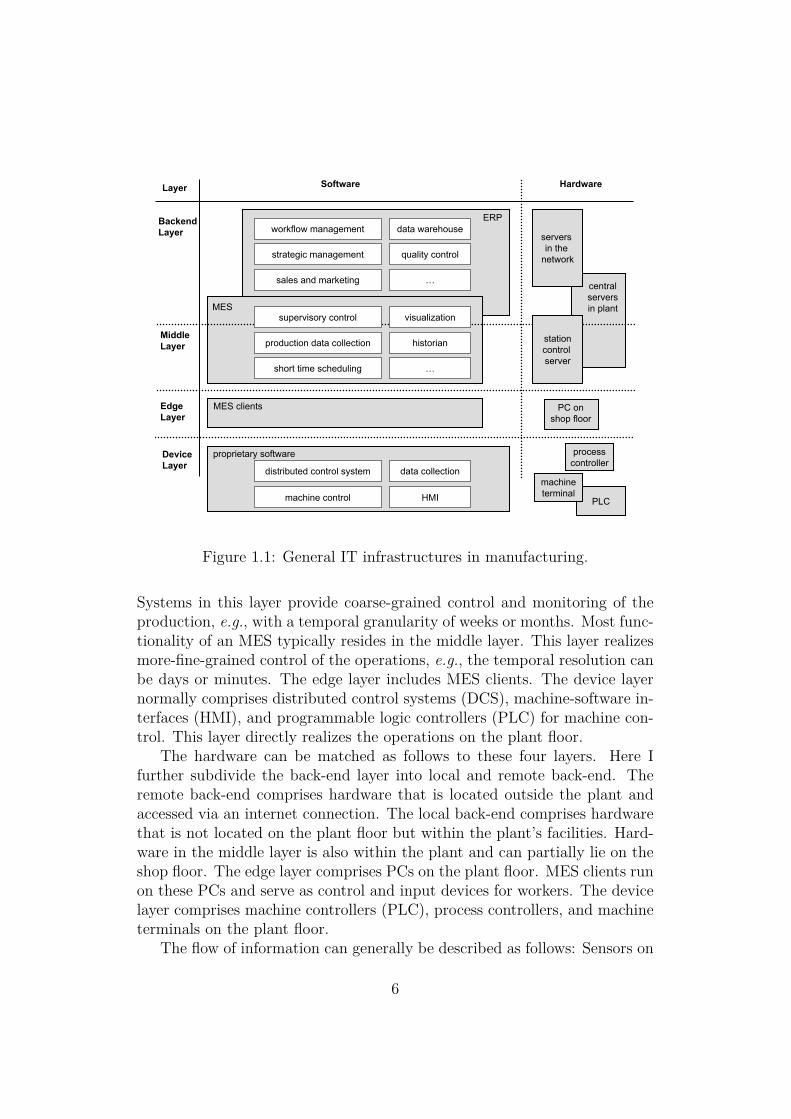
1.3 IT Infrastructures in ManufacturingIntroducing RFID applications into manufacturing plants requires combiningRFID software with existing IT environments in this domain. Therefore, thissection briefly introduces typical IT infrastructures. One can distinguishbetween four layers of IT infrastructures depending on the granularity of thecontrolled operations. Listed top down, the layers are the back-end, edgeand device layer. I also match the IT hardware to this layered structure, seeFigure 1.1.
The back-end layer comprises the enterprise resource planning (ERP)system and can include parts of the manufacturing execution system (MES).
5
quality control
PLC
servers in the
network
Software Hardware
Edge Layer
Backend Layer
Device Layer
data warehouseworkflow management
strategic management
sales and marketing
supervisory control
production data collection
short time scheduling
visualization
historian
machine control
data collection
stationcontrol server
ERP
MES
…
proprietary software
…
machineterminal
centralserversin plant
PC onshop floor
Layer
MES clients
Middle Layer
processcontroller
distributed control system
HMI
Figure 1.1: General IT infrastructures in manufacturing.
Systems in this layer provide coarse-grained control and monitoring of theproduction, e.g., with a temporal granularity of weeks or months. Most func-tionality of an MES typically resides in the middle layer. This layer realizesmore-fine-grained control of the operations, e.g., the temporal resolution canbe days or minutes. The edge layer includes MES clients. The device layernormally comprises distributed control systems (DCS), machine-software in-terfaces (HMI), and programmable logic controllers (PLC) for machine con-trol. This layer directly realizes the operations on the plant floor.
The hardware can be matched as follows to these four layers. Here Ifurther subdivide the back-end layer into local and remote back-end. Theremote back-end comprises hardware that is located outside the plant andaccessed via an internet connection. The local back-end comprises hardwarethat is not located on the plant floor but within the plant’s facilities. Hard-ware in the middle layer is also within the plant and can partially lie on theshop floor. The edge layer comprises PCs on the plant floor. MES clients runon these PCs and serve as control and input devices for workers. The devicelayer comprises machine controllers (PLC), process controllers, and machineterminals on the plant floor.
The flow of information can generally be described as follows: Sensors on
6
machines generate unfiltered data that are collected by PLCs. The collecteddata is used for monitoring current operations. The PLCs also control themachine. PLCs may have links to an HMI for transferring data. They canalso be connected to a DCS. A DCS is generally used to monitor and controllarge plants at a single site. HMIs can display job instructions and may alsobe used for collecting manual inputs from workers. Data from PLCs or DCSare passed to higher layers. In return, they receive machine configurationsfrom there.
The edge layer comprises clients. They display data from the deviceand middle layer and serve as input device for workers. The middle layertypically hosts an MES or systems with all and additional functionalities ofa production data collection system (PDC). The MES collects data acquiredby subsystems, filters this according to predefined business rules, and deliversmission-critical information about production activities [Chang et al., 2002,pp. 6]. It visualizes, optimizes, and coordinates the entire production processin a time frame between days and minutes. In the MES, data are compressed,filtered, and pushed into databases for later analysis, i.e., a historian. Onlya small amount of data is passed on to the upper level, to the ERP.
The ERP system conducts the long-term business plan and managesworkflows. It passes customer orders down to the MES. From the MES theERP receives aggregated status reports and information about the materialconsumption. The ERP neither directly controls machines on the plant floornor is it involved in production data acquisition.
Following this general architecture, I allocate RFID tags and readers inthe device layer. RFID middleware lies in the middle layer.
1.4 Principal ContributionsThis doctoral dissertation analyzes the use of RFID technology in manufac-turing. The following is an outline of my five main results.
1. This thesis analyzes potential benefits and manufacturers’ motivationof applying RFID technology in manufacturing enterprises. The re-search approach here was to conduct case studies. This research strat-egy enables one to gain an in-depth understanding of manufacturers’real-life challenges to preserve a smooth production. Based on the casestudies it was possible to evaluate seven use cases for RFID. They aretypically either a replacement of bar-code technology or an applica-tion that can only be realized using RFID. Five out of six companies’motives for an RFID adoption are purely operational uses within their
7
enterprise. That is, they would like to use this technology for improvingprocesses and productivity on the plant floor. Motivations to use RFIDas a strategic enabler and inter-enterprises along the supply chain werefound much less frequently.
2. Despite all the potential benefits, RFID technology is not yet widelyadopted in production. Therefore, it is valuable to understand why thisis the case. Using the case studies it was possible to study the challengesof embedding RFID into manufacturing processes. The contribution ofthis thesis is to identify and describe which RFID-specific constraintsIT infrastructures have to provide.
3. A further contribution is to show how RFID can be embedded into anexisting IT infrastructure in manufacturing. For this I first evaluateIT infrastructures at diverse manufacturers by conducting seven morecase studies. Only the case study approach enables to investigate ITinfrastructures within the real-life context. With the case studies it waspossible to evaluate how and where RFID-specific requirements can bedeployed in IT infrastructures specific to the manufacturing sector.
4. Another aim of my thesis is to provide guidance for assessing quan-tifiable and non-quantifiable costs and benefits of an RFID rollout inmanufacturing. The analysis is based upon experiences from the RFIDcase studies. The thesis outlines the most crucial tangible and intangi-ble risks and benefits. It also presents an assessment scheme to assesstangible and intangible aspects, using value-benefit analysis. The ap-proach assures that the most important aspects will be reflected in thedecision taken, thus reducing the remaining degree of uncertainty.
5. When looking beyond the shop floor one can see that RFID is also notalready widely adopted in the supply chain. The thesis analyzes andanswers why; taking the automotive supply chain as an example. Theresearch method here are semi-structured interviews with OEMs andsuppliers. The analysis builds on existing inter-organizational systemadoption models. It was possible to show that perceived benefits, un-certainty about the technology and directions of the standardization,pressure from powerful partners as well as competitive pressure playan important role in RFID diffusion in the automotive industry.
8

1.5 OrganizationThis section gives an overview of the structure of the following chapters andwith whom I worked on the different topics. In Chapter 2 I first give technicalfoundations about recognition systems used in manufacturing. Then thechapter describes and summarizes the findings of six case studies. Eachcase study comprises an analysis of the production process and (potential)use of RFID technology gained through a series of on-site interviews andobservations. I conducted the case studies and their analysis together withOliver Günther and Holger Ziekow in 2006. We published the results inGünther et al. [2008a].
Chapter 3 shows which challenges the manufacturer has to face whenapplying RFID in shop-floor processes. All challenges are derived from thecase studies. I conducted the work of this chapter together with OliverGünther and Holger Ziekow. We published the results in Ivantysynova et al.[2008a].
In Chapter 4 I first describe theoretical foundations about IT infrastruc-tures in manufacturing. Then the chapter presents an analysis about thedeployed IT infrastructure in seven additional case studies. It also revealslessons learned. I conducted the case studies together with Holger Ziekow in2007 and 2008. The case studies and their results are currently under review.
Chapter 5 deals with the question of how to embed RFID into the ITinfrastructure at manufacturers. This includes a description about com-mon functionalities, implementation issues and a discussion about how todistribute data and logic within the IT infrastructure. This work was ac-complished with Holger Ziekow. We published the results in Ivantysynovaand Ziekow [2008].
Chapter 6 addresses costs and benefits for RFID investments in manu-facturing. Here I cover quantifiable as well as non-quantifiable aspects. Iconducted this work with Oliver Günther, Seckin Kara, Michael Klafft, andHolger Ziekow. Parts of the results have already been published in Ivan-tysynova et al. [2007]. The entire results are currently under review.
Then Chapter 7 identifies important determinants of an RFID adoptiondecision, taking the automotive supply chain as an example. I conducted thiswork together with Hanna Krasnova and Lorenz Weser. The results of thischapter have been published in Krasnova et al. [2008]. Chapter 8 concludesmy thesis.
9

Chapter 2
Potential Benefits of RFID onthe Shop Floor
Applying RFID technologies on the shop floor has recently gained some atten-tion [Chappell et al., 2003, MCBeath, 2006]. However, still little experiencewith such applications exists. Therefore, it is often unclear if and when RFIDtechnology really is a better basis for a solution than alternative technologiessuch as bar codes.
Thus, this chapter presents an analysis of potential benefits of using RFIDfor improving production processes. To this end, Holger Ziekow and I con-ducted case studies at six German manufacturing enterprises to explore possi-ble RFID scenarios. Each case study comprises an analysis of the productionprocess and (potential) use of RFID technology gained through a series ofon-site interviews and observations.
RFID is an automatic identification technology (short Auto-ID). There-fore, I will start this chapter with a description of Auto-ID technologies, seeSection 2.1. The section focuses the overview of Auto-ID technologies specifi-cally on those used in manufacturing. It gives details about the technologies,and their potentials and drawbacks. RFID distinguishes itself from all otherAuto-ID technologies with some specific features. Hence these are discussedin detail. Despite the potential benefits of RFID it also exhibits a number ofchallenges.
Section 2.2 presents related work on RFID in manufacturing. Section 2.3then analyzes potential benefits of applying RFID technology in manufactur-ing enterprises in. Here I present our case studies. Section 2.4 reveals lessonslearned from the case studies. This section also discusses manufacturers’motives for considering an RFID rollout.
Five of the six case studies have been carried out in cooperation withthe MES software vendor MPDV Mikrolab GmbH. With their support, I
10
approached several of their customers which are interested in applying RFID.I conducted the case studies together with Holger Ziekow in 2006; Section
2.4 was accomplished together with Oliver Günther and Holger Ziekow. Wepublished the results in Günther et al. [2008a]. In particular, we publishedparts of Section 2.1 and the complete Sections 2.3 and 2.4 in Günther et al.[2008b], Ivantysynova et al. [2008b] and Ivantysynova et al. [2008a].
2.1 Automatic Identification TechnologiesAuto-ID refers to technologies that automatically identify objects, collectdata about these objects and map these data into IT systems without hu-man intervention. The aim of Auto-ID systems is to reduce errors in dataentries, increase efficiency, and free up personnel to perform more valuablefunctions [see Auto-ID-Center, 2002, p. 3]. Auto-ID entails the followingquite heterogeneous technologies: magnetic stripe, smart card, voice recog-nition, biometrics, machine vision, optical character recognition, bar code,and radio frequency.
Magnetic stripes and smart cards are contact recognition systems. Smartcards are also known as integrated circuit cards (ICC) [Rankl and Effing,2008]. Magnetic stripes contain three independent tracks for storing data.Each track can either contain 7-bit alphanumeric characters or 5-bit nu-meric characters [ISO/IEC-7813, 2006, ISO/IEC-4909, 2000]. Hence mag-netic cards have a limited identification depth of 265 byte (210 bits per inchon each track) whereby only the third track is read/write. IC cards can storearound 15 kbytes. Both systems have the disadvantage of mechanical wear.The magnetic stripe or the embedded integrated circuit may get scratched orbent, respectively, thereby making future reads impossible. Both technolo-gies are widely used as business or ID cards.
Voice recognition and biometric systems are more complex than magneticstripes and smart cards, may be more secure but also more expensive. How-ever, all four technologies may be used as access control systems in plants.
Machine vision uses digital cameras and image-processing software fortasks such as counting passing objects, reading serial numbers, or searchingfor wrongly assembled parts or surface defects [Wiltschi et al., 2000].
Optical character recognition (OCR) identifies information stored in tex-tual formats. Using OCR has the advantage that humans can also read theinformation, e.g., during system breakdowns. Both machine vision and OCRdepend on line of sight. Dirt, reflection, scratches or even vibration interferewith the automatic recognition.
Bar codes belong to optical recognition systems like machine vision and
11
OCR. Therefore, they have the same disadvantage that they depend on aline of sight between object and reader. The length of the encoded datadepends on the bar-code specification used. One-dimensional bar codes needmore space – especially in the x-axis – to encode the same information as 2Dbar codes. Popular 2D bar codes are the PDF417 bar code [ISO/IEC-15438,2001] or the matrix code [ISO/IEC-16022, 2006].
Bar codes are rather sensitive to disturbances. One non-readable bar issufficient to make the bar code no longer readable. Therefore, matrix codeshave an embedded error correction. By this they can still be read, even ifthey are partially damaged. However, they require a more sophisticated logicin the evaluating software. Bar codes are the cheapest Auto-ID system; thecarriers are merely printed stickers. In recent years the bar code has beenestablished in many areas including manufacturing. To identify goods orobjects within manufacturing this code carrier has become indispensable. Itrequires a careful analysis to see where an existing bar-code solution shouldbe replaced by RFID.
Radio-frequency identification (RFID) is the only identification systemthat works without any physical contact as well as without a line of sight.In particular, it works over a certain distance and even through non-metallicmaterials. An antenna emits radio waves generating voltage in the induc-tor of the passive transponder or triggering the active transponder to senddata. The transponder chip operates on the induced energy, uses the in-ductor as antenna and sends its ID to the reader antenna in bit-serial form.The transponder signal is evaluated in the decoder, checked for errors, andforwarded for further processing.
Low-frequency systems have proved sufficient in many contexts. Success-ful implementations exist in manufacturing, assembly, logistics, and accesscontrol – and this even though their range is limited to 0.5 meters. Thetransponders are not expensive and also work when embedded in metal. Thehigh-frequency systems reach read ranges of 1-2 meters and may have a mem-ory of up to several megabytes. Anti-collision technology enables them toread several transponders at the same time. However, the transponders arenot very resistant to adverse mechanical and thermal conditions and they donot work very well in environments with lots of metal.
UHF transponders also have the highest range, and the additional ad-vantage of combining write/read transponders with anti-collision technology.Due to their increased range, they are particularly suited to tracking palletsand cartons. By means of directional radiation, ranges of up to seven meterscan be reached with passive ultra high frequency (UHF) at high transportrates. A popular standard for UHF is the Gen 2 standard of [EPCglobal,2005]. The Gen 2 standard specifies 96 bits for the EPC and an optional user
12
memory. However, these transponders are typically not very robust with re-spect to adverse mechanical and thermal conditions. Location problems inthe presence of metal as well as the relatively high costs for readers constituteother disadvantages.
Active UHF allows read distances of up to 100 meters at high transportrates. In this case, multiple transponders can also be read simultaneously viaanti-collision technologies that can manage up to 2000 tags in the readingarea. Yet, the high costs for the transponders and readers as well as thelimitation of the temperature range due to the battery must be consideredas disadvantages. Metal reflections may also prevent the position from beingassigned uniquely.
Generally the advantages of RFID can be summed up as follows: The ba-sic technical benefit of RFID in comparison to bar codes or other recognitionsystems is that the tags may store information, and that this informationcan be modified, extended, or exchanged automatically, i.e., without requir-ing any contact. Secondly, RFID allows an item-based tagging. Thirdly,RFID tags have the advantage that they can be covered in protective casings[DeJong, 1998] and may thus work more reliably, especially when dirt cancause false reads. And finally, RFID tags allow bulk reading. Large num-bers of objects can be scanned virtually at once. With contact or opticalrecognition systems scanning only works on an per-object basis.
2.2 RFID ApplicationsIn logistics, RFID is already used for numerous applications. Examples in-clude the autonomous and decentralized management of logistic processes[Scholz-Reiter et al., 2004], tracking and tracing [Fruness, 2006], or the man-agement of perishable goods throughout supply chains [Kärkkäinen, 2003].Table 2.1 shows that companies bought 250 million tags in 2006 for retailapparel and pallet/case applications – both used in logistics operations. Thisis also because in 2004 and 2005 large retailers such as Wal-Mart and Metrostated that they use RFID in their supply chains and put the demand ontheir suppliers to use RFID. Since then, RFID has gained increased attentionfor logistic processes.
The advantages of using RFID in supply chains have been studied broadly.For instance, Wamba and Boeck [2008], Strassner [2005] describe several ad-vantages of using RFID in supply chains. Strassner [2005] gives detailed ex-amples and case studies of how RFID can enhance automotive supply chains.Nevertheless, Table 2.1 shows that smart cards still showed the highest salesof 350 m tags in 2006; whereby 1022.6 m tags were supplied in total.
13
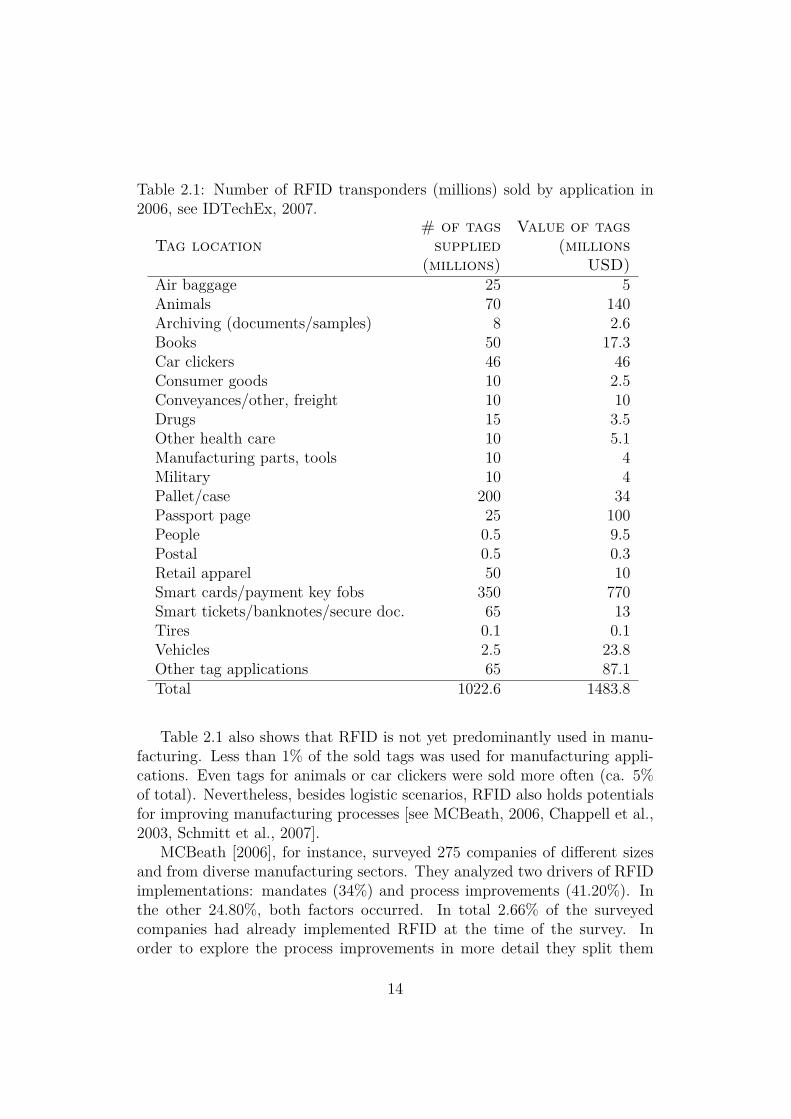
Table 2.1: Number of RFID transponders (millions) sold by application in2006, see IDTechEx, 2007.
# of tags Value of tagsTag location supplied (millions
(millions) USD)Air baggage 25 5Animals 70 140Archiving (documents/samples) 8 2.6Books 50 17.3Car clickers 46 46Consumer goods 10 2.5Conveyances/other, freight 10 10Drugs 15 3.5Other health care 10 5.1Manufacturing parts, tools 10 4Military 10 4Pallet/case 200 34Passport page 25 100People 0.5 9.5Postal 0.5 0.3Retail apparel 50 10Smart cards/payment key fobs 350 770Smart tickets/banknotes/secure doc. 65 13Tires 0.1 0.1Vehicles 2.5 23.8Other tag applications 65 87.1Total 1022.6 1483.8
Table 2.1 also shows that RFID is not yet predominantly used in manu-facturing. Less than 1% of the sold tags was used for manufacturing appli-cations. Even tags for animals or car clickers were sold more often (ca. 5%of total). Nevertheless, besides logistic scenarios, RFID also holds potentialsfor improving manufacturing processes [see MCBeath, 2006, Chappell et al.,2003, Schmitt et al., 2007].
MCBeath [2006], for instance, surveyed 275 companies of different sizesand from diverse manufacturing sectors. They analyzed two drivers of RFIDimplementations: mandates (34%) and process improvements (41.20%). Inthe other 24.80%, both factors occurred. In total 2.66% of the surveyedcompanies had already implemented RFID at the time of the survey. Inorder to explore the process improvements in more detail they split them
14
into eight major areas. However, the problem with the split beforehand isthat the companies had to categorize their RFID application into one ofthese prescribed groups. Sadly they also do not go into more detail as towhy so few companies use RFID. They do not discuss possible hindrances ofimplementations.
Chappell et al. [2003] give a list of possible impacts of Auto-ID technol-ogy in the manufacturing supply chain. This includes tracking and managingspare-parts inventory, reducing cycle time, increasing capacity utilization andyield, and improving product quality – just to name a few. For them Auto-ID are electronic product codes and RFID technologies. They argue thatthese benefits can directly impact shareholder value levers. Therefore, theyalso state that RFID applications on the shop floor have gained increasingattention in recent years. In their work they also present a schema of vari-ous components of an Auto-ID system rollout and give recommendations forcalculating the overall cost.
However, this description is quite cursory and may only be used as astarting point for a profound analysis. In their closing comments the authorsname five key areas where manufacturing processes may have opportunitiesfor improvement through Auto-ID. These are equipment effectiveness, assetutilization, product tracking and genealogy, inventory tracking and visibil-ity, and labor productivity. However, the authors do not describe experienceswith RFID including hindrances and advantages. Therefore, it is often un-clear if and when RFID really is a better solution compared to alternativeslike bar-code-based applications.
Besides Chappell et al. [2003] also Automation [2004] name potentials ofRFID on the plant floor. These are labor usage, inventory visibility, and plantasset management, and tracking and genealogy. The authors also see that“RFID has the potential of complementing MES in terms of providing newstreams of real-time data that can support existing [...] programs.” However,their discussion is too sketchy to give guidance for companies who are lookingto see whether or not RFID would be suitable a choice for them.
Schmitt et al. [2007]’s work is a meta analysis about the adoption anddiffusion of RFID in the automotive industry. In their work they list exam-ples of how manufacturing processes specific to the automotive industry canbe enhanced. These are improved management of valuable assets, containertracking or inventory management. Besides closed-loop applications the au-thors also discuss applications along the automotive supply chain. With theirmeta study they identify significant factors that facilitate adoption of RFIDin the automotive industry. The authors analyze the following dominantfactors: compatibility (i.e., technological, hardware, software and data stan-dards), costs, complexity of the technology, performance (i.e., technological
15
capability and environmental influences on systems), and top-managementsupport.
Summing up, still little experience with RFID applications in manufac-turing exists. None of the work describes detailed experiences with RFIDapplications. Hindrances of applying RFID are not discussed, nor guidelinesgiven on how to best embed RFID into the manufacturing landscape. Itis often unclear if and when RFID really is a better solution compared toalternatives like bar-code-based applications. None of the work provides de-tailed guidelines for calculating monetary effects, does not address strategicpotentials of RFID nor does it propose a corresponding evaluation model.We address these aspects with our case studies.
2.3 Case StudiesThis section shows how manufacturing companies can benefit from the above-described advantages of RFID. In order to truly examine the potential ofRFID we conducted six case studies at diverse manufacturers. With thisqualitative research method we aim at acquiring an in-depth understandingof the situation present in the manufacturing domain. As a result we evaluateRFID potentials that are specific for the manufacturing domain.
We specifically choose the case-study approach as a qualitative-empiricalmethod [see Wilde and Hess, 2007]. Case studies have the disadvantage ofleading to smaller samples compared to questionnaires. However, the fact ofhaving a much greater depth of the analysis clearly dominates on the positiveside [Flyvbjerg, 2006]. In our case studies, we have an interpretative researchapproach. As defined by [Walsham, 1993, p.4-5] interpretative methods ofresearch into information systems are
aimed at producing an understanding of the context of the infor-mation system, and the process whereby the information systeminfluences and is influenced by the context.
In each case study, we analyze the production processes of one specificplant. The participating companies are from the following industries (thecompany names are not revealed due to non-disclosure agreements):
1. automotive industry: manufacturer of airbags (short AIR),
2. automotive industry: manufacturer of sliding clutches (CLU),
3. automotive industry: manufacturer of engine-cooling modules (COO),
16

4. steel and mill industry: manufacturer of cast parts (CAS),
5. electronics industry: manufacturer of connectors (CON),
6. packaging industry: manufacturer of packaging (PAC).
All companies are headquartered in Germany. Their size ranges betweenseveral hundred and over 65,000 employees. Our reason for choosing thesecompanies is to gain several representatives from first- and second-tier suppli-ers. Additionally, most of them act as a supplier to OEMs in the automotiveindustry making them representative for many companies in Germany. Theautomotive industry is the largest employer in the country [OICA, 2007].
COO is one representative that is already using RFID in production.Two reasons dominate all participating companies’ interest in RFID. Onthe one hand, they expect their customers to demand RFID solutions inthe future and they want to be prepared for this scenario. On the otherhand, due to specific customers’ demands and the need to obtain competitiveadvantages, the companies aim at improving the tracking of their productionprocesses. All six companies assumed that RFID could either be a solutionfor cases where bar-code technology is not applicable, or be an advantageousalternative to bar-code technology.
2.3.1 Production of AirbagsI have published extracts of this case study in Ivantysynova and Ziekow[2007]. The investigated plant of AIR assembles complete car-airbag modulesand produces covers that are part of an airbag. An airbag module consistsof a cover, a cushion, and an inflator. The production is divided into sevenproduction steps injection molding, flash removal, special surface treatment,varnishing, pre-assembly, assembly, and shipment (see Figure 2.1).
The process starts with the injection molding of the airbag’s cover. Here,plastic is injected into a mold and formed into a cover. At this point a bar-code label is applied to the cover which later used for tracing the product inthe remaining process steps.
In the second step (flash removal), excess plastic at the parting lines ofthe mold is removed. The following step is a special surface treatment whichincreases the quality of varnishing (this step is not always conducted as somecustomers do not want this treatment). Subsequently, the covers are sent tovarnishing. After this step, pre- and assembly of the airbag start. Here, theemblem of the car brand is mounted on the front side of the cover. Thencover, cushion, and inflator are mounted together. Finally, in the last stepshipment, airbags are packed into boxes, labeled, and sent to a warehouse.
17

injection
raw materials are ready
apply & scanbarcode
X
injection & flash removal
apply & scanbarcode
assembly &scan barcode
scan barcode
shipment
end-products are shipped
emblem of the car brand
X
plastic machine
worker
robotmachine
plastic
cushion
cover
inflator
cover
infraredmachine
infraredmachine
X
flash removalflash removalworkerX
worker
cover
surface treatment
scan barcodeworker
Xvarnishingworker robotvarnishing
X
scan barcodeworker
preassembly &scan barcodeworker
cover with emblemworker
worker cover with airbag
Legend
Material Flow
Machine
Function
Event
Material
Process Flow
XLogical Operator
Figure 2.1: Production process for airbags at AIR.
After each process step, the bar code of the cover has to be scanned.It is of major importance to ensure that all information (executed activity,time etc.) is recorded correctly during the production process. This is donebecause some customers demand tracking of every process step executedduring production. Complete information collection is necessary to followthe product’s genealogy in case of claims regarding faulty products. Forinstance, the information is needed to determine who is liable if an airbagdid not work in a car accident.
Before each manufacturing operation is begun, a plausibility check is runto verify that the required preceding steps have been finished successfully.These checks help to prevent errors during the production process. For exam-ple, before varnishing starts, it is verified that the special surface treatmenthas been conducted. This check is triggered by the scanning of the bar codeattached to the airbag cover. The bar-code scan triggers a database queryin the back-end system and the query results determine whether or not pro-duction may proceed.
18

AIR uses manual as well as automatic bar-code scanning processes. Man-ual scanning is a relatively time-consuming process. Especially due to theirregular shapes of covers it is cumbersome to establish the line of sight re-quired by bar-code readers. Bar codes are often applied to the inside of thecover and the cover must be turned upside down in order to enable the scan.Furthermore, scanning may fail and may have to be repeated, resulting inextra delay. Within AIR’s production process, a manual scan takes four sec-onds on average. Due to the complicated handling, automating all of thebar-code scanning processes is not a cost-effective option.
Potential Improvements with RFID
AIR currently does not use RFID in its production. Data management andtracking of products is implemented by means of bar codes. Within thecase study, we have identified the subsequently described applications forRFID at AIR’s plant. They address the following four improvements: reduc-ing communication with the process control system, reducing manual scantransactions in the production process, reducing manual scan transactionsin the warehouse, and avoiding bar-code print-quality issues and reducingpenalties.
Reducing communication with the process control system: every scantransaction triggers a query in the process control system for getting therequired information about the product. The production process must waitfor the response to the query in order to ensure the correctness of the pro-duction flow. According to the plant manager, response times of more thanabout half a second are not tolerable. Achieving responses within this timeconstraint is already challenging with the current infrastructure. Consideringthat additional scans are planned to be introduced in the future, the loadfor the process control system will increase further. As a result, the responsetime may be longer than the tolerable waiting time. According to the pro-duction supervisor the scaling of AIR’s process control infrastructure is anexpensive solution to this problem.
By adopting RFID, the problem of time-consuming communication withthe process control system could be overcome. The covers could be labeledwith writable RFID tags. The necessary information for the productionprocess could be stored on the tag. As the cover flows through the productionprocess, RFID readers could communicate with the tag on the cover and readthe required information from there. Local processing logic could execute theplausibility check (e.g., previous process step has finished successfully). Acommunication with the process control system would be minimized sincemost of the required information would be accessible directly from the RFID
19
chip. However, this scenario would require a degree of “local intelligence”which may be provided by a PLC (Programmable Logic Controller) or a PCon the shop floor.
Reducing manual scan transactions in the production process: AIR hasimplemented scans of the products’ bar codes after each production step.Many of these scan transactions are conducted manually and account for asignificant percentage of the employees’ activities. Furthermore, since the barcodes are applied to the inside of a cover, the cover must be turned upsidedown before the bar code can be scanned; this takes extra time. ApplyingRFID would automate the identification process and save valuable employeetime. Since automatic scanning could be done in parallel to other tasks, thissolution would cause no process delay.
The manual varnishing facility is another point in the production processwhere an RFID adoption could improve production efficiency. This facility isa separate room with a single entry and exit. After the covers are varnishedworkers place them on a metal cart that consists of nine shelves. Each shelfcarries 200 to 300 covers. Then a worker pushes the cart out of the varnishingfacility.
After leaving the room all of the covers on the cart are scanned manually.In this scenario, RFID could be used for scanning whole batches of covers.This would minimize the human intervention and speed up the process. RFIDreaders could register the covers as they pass through the varnishing facilitydoor. One of the challenges in this scenario is the cart itself, since its metalstructure may interfere with the RFID process.
Reducing manual scan transactions in the warehouse: finished productsare placed in containers and sent to the warehouse from where they areshipped. At this stage, the management of products is no longer handledat item level but rather at container level. Products that have been placedin a container are booked to the container’s account. Booking airbags to acontainer or booking out an erroneous entry are tasks which are accomplishedmanually. Therefore, they are time-consuming and possibly error-prone.
RFID readers and tags could provide a more reliable and flexible ware-house and delivery management. RFID readers could be installed at thewarehouse door. Then the correctness of the containers’ content could bechecked automatically. Additionally, realizing this scenario would also allowAIR’s customers to use RFID at their inbound logistics, because the arrivingproducts and containers would already be equipped with RFID tags by AIR.If the customers make use of these tags, cost-sharing models might be fea-sible. Otherwise, reusing the existing RFID tags at the customer’s side canbe perceived as a service of AIR and thereby be a competitive advantage.
Avoiding bar-code print-quality issues and reducing penalties: after the
20

production process is completed, new bar codes are applied to airbags for-matted according to customer requirements. These bar codes are used foridentification and for enabling an information flow between supplier and cus-tomer. Bar codes on airbags must be correctly applied and flawless. Scratchesor dirt can make the bar code unreadable.
Achieving the printing quality required by the customer creates a consid-erable technical challenge. The bar-code scanners installed at the customer’slocation may have problems reading low-quality bar codes. Since many ofAIR’s customers implement a just-in-sequence delivery each unreadable barcode potentially causes a delay in the customer’s production. In such casesAIR has to pay high penalties. To avoid the penalties, AIR puts a great dealof effort into printing high-quality bar-code labels. Nevertheless, this doesnot prevent dirt and scratches.
If the respective costumer agreed to apply RFID tags instead of bar codes,the possibility of unreadable labels would decrease. The use of RFID wouldstill require a label printer (for printing textual information and applying thetag) but the printing quality (and therefore costs) would not need to be ashigh. Overall, the burden of printing the labels is eased and penalties due tounreadable labels are less likely.
Costs and Benefits
The main reason for considering RFID technology at AIR is to reduce man-ual bar-code scanning processes. Manual scanning accounts for a significantproportion of the employees’ time. AIR’s IT staff estimated that the appli-cation of RFID would save up to four seconds at each manual scan point.Applied to all production lines, this would sum up to approximately 26000hours of work per year (i.e., 24 sec/airbag total saving through the processx 4mio airbags/year).
Additional time could be saved in the outbound shipping processes, wherethe checkout could be automated. Yet, only a few euro cents could be savedper airbag. Since in this scenario RFID tags remain on the product, the tagcost must be weighed against the savings per airbag. At a price of 20-30 eurocents for low-cost passive RFID labels, this may or may not be cost-effective.
Thus, cost-sharing models with subsequent players in the value chain(who might reuse the tags) should be considered. Also, supply costs andmaintenance costs of RFID writers/scanners are likely to be significantlylower than the cost for bar-code scanners, printers and printer/applicators.
Another reason for an RFID adoption is to reduce the load for the pro-cess control system. Currently, the infrastructure at AIR is at its limit forprocessing plausibility checks in the process control system. The planned
21

expansion in the number of scan points would therefore require additionalinvestments in the server infrastructure. If tags with extended writable mem-ory are used, consistency checks could be processed independently from theback-end system. Here, the cost for additional servers must be traded againstthe running costs for RFID tags with sufficient memory as well the effort forimplementing plausibility checks on local PLCs or PCs located on the shopfloor.
Further savings may result from avoiding penalties for unreadable barcodes. Currently, AIR pays a few thousand euros per bar code when it isunreadable to the customer. Such penalties could be avoided if RFID isapplied. Yet, this requires that the customers agree to switch from bar codesto an RFID-based solution.
Besides these quantifiable effects, the manufacturer may also gain intan-gible improvements due to an RFID adoption. Strategic benefits that RFIDmay leverage are improvements in customer service, reputation, and inter-organizational collaboration. With RFID tags on the products, the manu-facturer enables its clients to benefit from the technology as well; therebyproviding an additional service. Reputation may increase because of themanufacturer’s positioning as an innovative company that quickly adaptsnew technologies. With regards to inter-organizational collaboration RFIDmay strengthen the manufacturer’s position as well.
Labeling each product with an RFID tag makes the manufacturer readyfor RFID-based supply chain management and collaboration. In addition tostrategic effects the manufacturer may gain non-quantifiable benefits in itsoperations. That is, RFID could ease the IT management in the mediumterm by taking away workload from the back-end system.
Summarizing Case AIR
In this case study we discuss the potential benefits of using RFID in AIR’sproduction processes. AIR assembles complete airbag modules and producescovers that are one of the three parts in an airbag module. We analyzedall of the production processes in order to define the potentials of RFIDadoption at the investigated plant. We examined whether the use of RFIDin this production process could be advantageous compared to the currentapplication of bar codes.
Furthermore, we outline five potential benefits RFID may hold for AIR.These advantages include (i) reducing communication with the back-endsystem, (ii) reducing manual scan transactions in the production process,(iii) reducing manual scan transactions in the warehouse, (iv) avoiding bar-code print-quality issues and reducing penalties, and (v) avoiding customer-
22

specific bar-code printing. We analyze all advantages with respect to theirresulting costs. This covers costs for RFID readers, tags and required soft-ware.
In the longer term, a tighter IT-enabled integration of the entire supplychain seems likely for AIR. This would be the case when the tags wouldremain on the product. At this point, however, the implementation of suchintegration measures, including related security measures and standards ac-tivities, is a costly and possibly risky endeavor. Possible benefits will a priorinot be distributed fairly between the different parties in the supply chain.This concerns not only costs for RFID readers, tags and required software,and costs for changing the underlying processes, but also the costs for con-structing a more detailed mapping between the shop-floor operations and theIT processes.
2.3.2 Production of Sliding ClutchesThe investigated plant of CLU assembles sliding clutches for car drive trains.With the following analysis HU adds to a previous study that was conductedby a consultancy. CLU investigates an RFID implementation due to its aimat narrowing costly product recalls.
The production process at CLU consists of seven operations which arehighly automated by machines. These operations are broaching, milling,cleaning, carburizing, hardening (combined with grit blasting), and assembly.An abstract model of this production process is shown in Figure 2.2. Humanintervention is limited to loading/unloading, setting up, and maintainingmachines as well as recording production data. Workers interact with the ITback-end system via terminals on the plant floor that are controlled by anMES.
CLU’s products are assembled from ready-bought parts and diverse metalrings which CLU produces itself. Plastic pallets are used for the internaltransportation of ready-bought parts and of the final products. Plastic pal-lets are also used for outbound shipping. Internally processed metal ringsare loaded into metal baskets before they are run through the productionprocess. These baskets are used for loading and unloading the machines aswell as for transporting parts to a subsequent operation. At each productionstep, machines pick up the metal rings from fixed positions in the baskets,process them, and place them back into the baskets. Note that rings are notnecessarily put back into the same basket as the one they were taken from.
23

raw materials are delivered
shipment
end-products are shipped
ready boughtparts on pallets
metal ringson pallets
metal ringsin baskets
sliding clutcheson pallets
processingmachine
processingmachine
processingmachine
processingmachine
processingmachine assembly
machine
ready boughtparts on pallets
broached metalrings in baskets
milled metalrings in baskets
cleaned metalrings in baskets
cleaned metalrings in baskets
cleaned metalrings in baskets
forklift
assembly
intake
broaching
milling
cleaning
carburizing
hardening/grit blasting
Legend
Material Flow
Machine
Function
Event
Material
Process Flow
XLogical Operator
Figure 2.2: Production process for sliding clutches at CLU.
Potential Improvements with RFID
CLU is currently running tests for a planned RFID implementation. Thecase study conducted by HU refers to the application which CLU is about toimplement as well as to other application scenarios which may be realized inthe long term. Altogether, HU identified the following scenarios for the in-vestigated plant, targeting the following four improvements: narrowing downthe scope of recalls, reducing workload for warehouse management, improv-ing quality and timeliness of production tracking, and improving customerservices and data exchange.
Narrowing down the scope of recalls: the predominant reason for consid-ering RFID solutions at CLU is to improve the traceability of the productionprocess. The goal is to narrow the scope of possible recalls and to limit re-sulting financial losses. This is of major importance as recalls account forsignificant costs at CLU. Using tracking information would help to limit thescope of recalls and manual checks of potentially faulty products. CLU cur-rently plans to equip all plastic pallets carrying material parts with RFIDtags. These rewritable tags will store information about the shipment.
Two scan points are planned which monitor three events within the pro-
24
duction process. The first event is captured at the gate between the intakeand the plant floor. Recording this event allows to track which items get intothe current production cycle. Readers at the assembly station register thesecond event. Here, each plastic pallet of ready-bought parts is scanned atthe assembly machine. (Note that only ready-bought parts are transportedon pallets at this stage).
The last event is captured when the transportation units pass throughthe gate between the intake and the plant floor, again indicating that theproduction process has finished. With the help of these three scans, it caneasily be determined which objects are in the production cycle at a particularmoment in time.
In the case of malfunctions in the production, the recall can be limitedto those items which were in the cycle at the respective time. If palletswere scanned individually, bar-code labels could provide similar functionality.However, since CLU wishes to scan the pallets in bulk at the gate to the plantfloor, bar codes are impractical. Through this gate, whole stacks of palletsare transported on a forklift and must be scanned as they pass by.
In the long term, one can also consider mounting RFID tags to the inter-nally used metal baskets. With RFID readers at each machine, the basketscould be traced through the whole production process. As a result, recallscould be narrowed down further. Yet, this application scenario would requirean update of the machine/PLC software.
With the current software some parts get moved from one basket to an-other without documenting this process. The plant IT staff has raised con-cerns about the effort required and risks involved when changing the soft-ware. Changing the proprietary software would require the launching of asoftware development project with the manufacturers of the machines. Thenew software would need to undergo extensive testing and fine-tuning in theproduction environment. Due to these required efforts, changing the ma-chines’ software is perceived as costly by the IT staff of CLU.
Reducing workload for warehouse management: realizing the scenario nar-rowing down the scope of recalls leverages other scenarios in which RFIDcould deliver benefits. Tracking the production process requires the trans-portation units to be equipped with RFID tags. This includes the transporta-tion units which are also used for shipment processes. RFID tags on thesetransportation units could be reused at the warehouse. For example, it wouldbe possible to use the RFID tags for managing the warehouse inventory.
Either smart shelves (shelves which are equipped with RFID readers) ormobile RFID readers could be used for quick updates of the whole inventory.Compared with bar-code-based solutions, this would reduce the workload forwarehouse management and could improve the accuracy of the inventory list.
25
Furthermore, goods entering and leaving the warehouse could be automati-cally registered if RFID readers were installed at the warehouse entry.
Improving quality and timeliness of production tracking: currently, CLUuses bar codes to measure the progress of running production tasks. The barcodes are printed on documents that accompany the stacks of metal basketswhich carry the materials for processing. Workers are required to scan thebar codes after the corresponding stack has passed a production step.
Thereby, information about the progress of the production is fed intothe back-end system and the process is documented. Yet, workers do notalways scan the bar codes in a timely manner. Occasionally accompanyingdocuments are even collected and scanned in bulk at the end of a shift. Thus,the status information obtained by scanning bar codes does not always reflectthe reality and is of limited use for performance analyses.
Tracking the production progress could be automated if scanning wasdone automatically with RFID instead of manually with bar codes. Thiswould require equipping every stack of internal transportation units with anRFID tag. Then, readers at each production step could detect if a stack ismoved to the next station and the information can be automatically updatedin the back-end system. Furthermore, the production process could be mon-itored in greater detail by implementing additional scan points at the plantfloor. For instance, for each stack of metal baskets how long it stays at whichoperation could be recorded. This would allow to further narrow recalls andto monitor the process in greater detail.
Improving customer services and data exchange: the application of RFIDat the production plant may not only improve the production itself but couldalso improve the information exchange with customers. Here, RFID mayserve as both, the medium for information exchange and as the enabler forgathering the information which is provided for the customer. As discussedabove, applying RFID in the production process enables the recording offine-grained process information in real time, assuming that writeable RFIDtags were used. This information may be used by CLU but could also beshared with the customers who ordered the products.
Costs and Benefits
Four potential application scenarios for RFID where identified at CLU. Yet,for some it is not possible to calculate monetary benefits without further anal-ysis. For instance, gains due to improved production tracing and improvedcustomer services cannot easily be estimated.
The main driver for implementing RFID at CLU is the expected savingsfrom improving the traceability of products. If a production error is detected,
26

all potentially affected sliding clutches must be checked manually. For faultyand already shipped products, checks must even take place at customers’plants. This results in additional costs for sending engineers to the customers.Costs for recalls are even higher for sliding clutches which were already usedin a customer’s production, because the manufacturer has to pay penaltiesin such a case. These penalties sum up to about 7.5% of CLU’s revenue.
Thus, improving traceability and thereby narrowing recalls can accountfor significant savings. The costs for realizing this application scenario de-pend on the desired level of granularity of tracing. The basic application canbe implemented with only one reader gate at the plant floor and reusabletags on the transport units.
Yet, the tracing would still be relatively coarse-grained. To achieve atracing on the level of individual operations, additional readers on the plantfloor would be needed. Furthermore, the software of the machines wouldneed to be updated as the machines move sliding clutches within and betweentransportation units.
However, when the manufacturer decides to apply RFID technology forexpanding traceability, then the technology could also be used for improvingother processes in production. For instance, this infrastructure can be usedto improve warehouse management and speed up the processes for loadingand unloading shipments. In combination with the scenario for improvedtraceability, only minor additional hardware costs would occur for this ap-plication.
Besides these quantifiable aspects one also has to consider intangible as-pects of applying RFID. Here we would improve the quality of the manu-facturer’s services due to more precise recalls. Additionally, a more detaileddata capturing may enable data analysts to reveal an unexpected potential forproduction improvements. With regards to inter-organizational collaborationthe RFID adaption would strengthen the manufacturer’s strategic position.The planned application would make the manufacturer ready for RFID-basedsupply chain management and RFID-based information exchange with itspartners.
Summarizing Case CLU
In this case study we discuss potentials benefits that CLU may gain fromRFID adoption. To specify these possible advantages, we investigate thecurrent situation and production processes. We identify areas that could beimproved by using RFID and outlined corresponding application scenarios.This comprises an investigation of whether the use of RFID in this productionprocess could be advantageous compared to the current application of bar
27
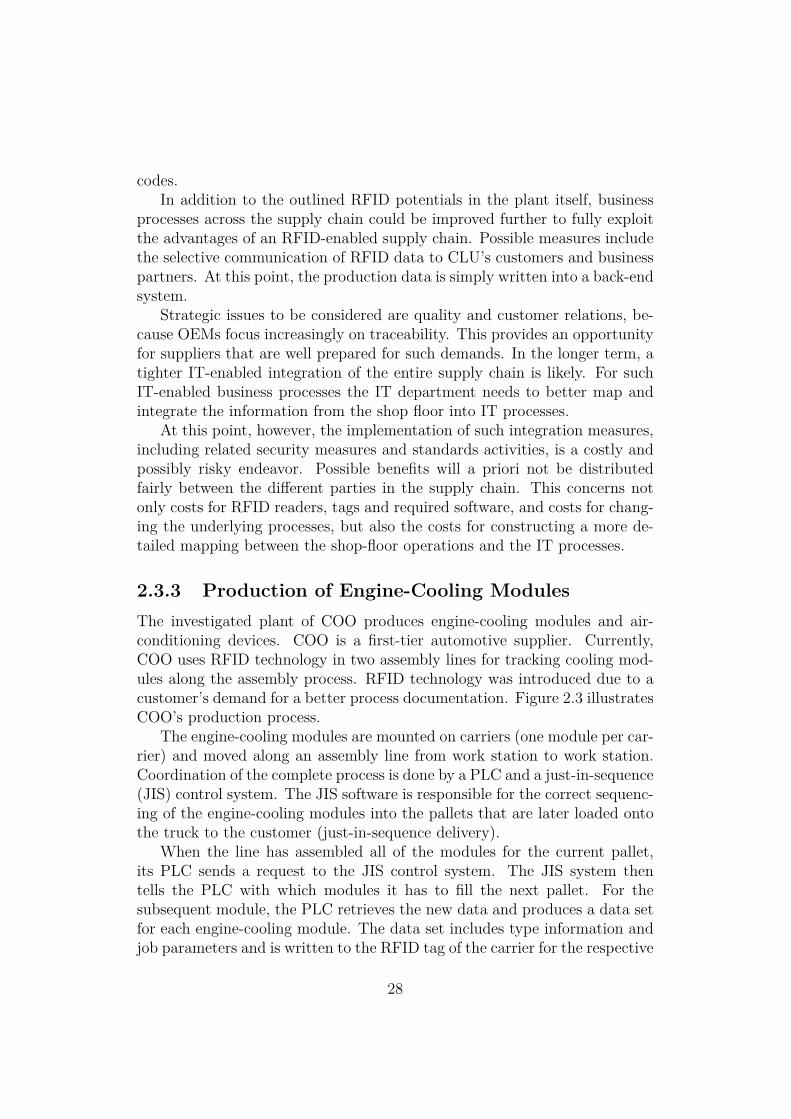
codes.In addition to the outlined RFID potentials in the plant itself, business
processes across the supply chain could be improved further to fully exploitthe advantages of an RFID-enabled supply chain. Possible measures includethe selective communication of RFID data to CLU’s customers and businesspartners. At this point, the production data is simply written into a back-endsystem.
Strategic issues to be considered are quality and customer relations, be-cause OEMs focus increasingly on traceability. This provides an opportunityfor suppliers that are well prepared for such demands. In the longer term, atighter IT-enabled integration of the entire supply chain is likely. For suchIT-enabled business processes the IT department needs to better map andintegrate the information from the shop floor into IT processes.
At this point, however, the implementation of such integration measures,including related security measures and standards activities, is a costly andpossibly risky endeavor. Possible benefits will a priori not be distributedfairly between the different parties in the supply chain. This concerns notonly costs for RFID readers, tags and required software, and costs for chang-ing the underlying processes, but also the costs for constructing a more de-tailed mapping between the shop-floor operations and the IT processes.
2.3.3 Production of Engine-Cooling ModulesThe investigated plant of COO produces engine-cooling modules and air-conditioning devices. COO is a first-tier automotive supplier. Currently,COO uses RFID technology in two assembly lines for tracking cooling mod-ules along the assembly process. RFID technology was introduced due to acustomer’s demand for a better process documentation. Figure 2.3 illustratesCOO’s production process.
The engine-cooling modules are mounted on carriers (one module per car-rier) and moved along an assembly line from work station to work station.Coordination of the complete process is done by a PLC and a just-in-sequence(JIS) control system. The JIS software is responsible for the correct sequenc-ing of the engine-cooling modules into the pallets that are later loaded ontothe truck to the customer (just-in-sequence delivery).
When the line has assembled all of the modules for the current pallet,its PLC sends a request to the JIS control system. The JIS system thentells the PLC with which modules it has to fill the next pallet. For thesubsequent module, the PLC retrieves the new data and produces a data setfor each engine-cooling module. The data set includes type information andjob parameters and is written to the RFID tag of the carrier for the respective
28
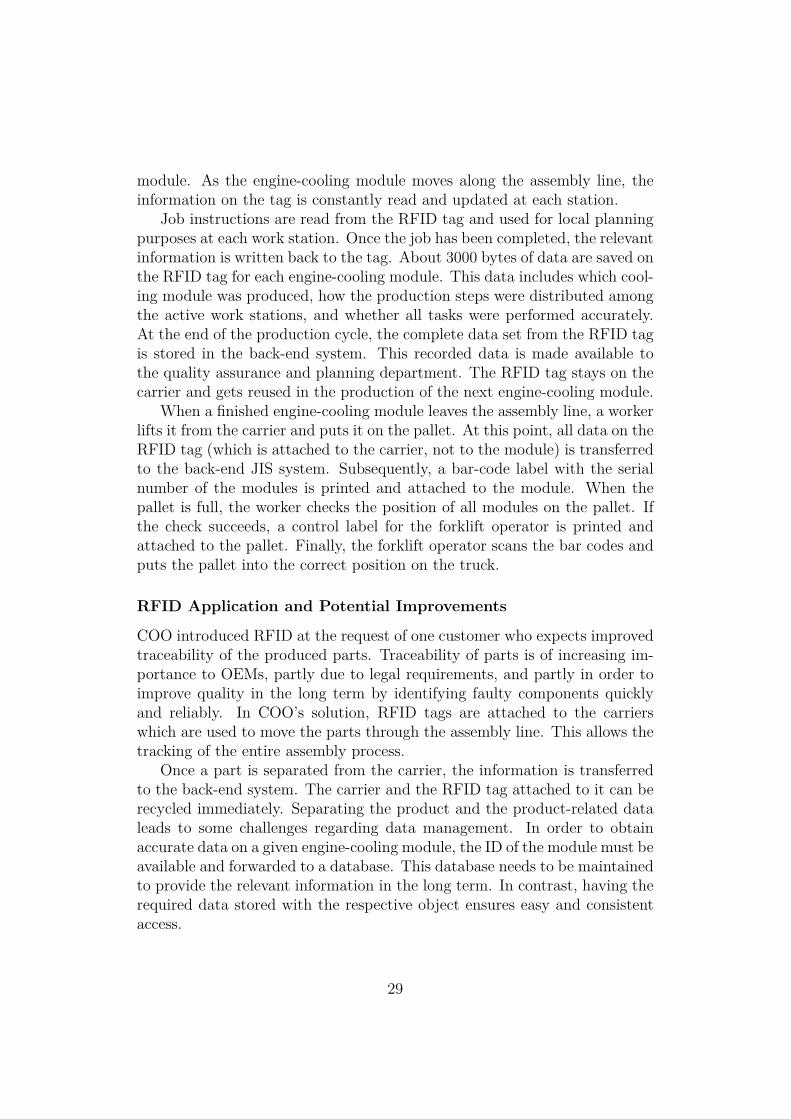
module. As the engine-cooling module moves along the assembly line, theinformation on the tag is constantly read and updated at each station.
Job instructions are read from the RFID tag and used for local planningpurposes at each work station. Once the job has been completed, the relevantinformation is written back to the tag. About 3000 bytes of data are saved onthe RFID tag for each engine-cooling module. This data includes which cool-ing module was produced, how the production steps were distributed amongthe active work stations, and whether all tasks were performed accurately.At the end of the production cycle, the complete data set from the RFID tagis stored in the back-end system. This recorded data is made available tothe quality assurance and planning department. The RFID tag stays on thecarrier and gets reused in the production of the next engine-cooling module.
When a finished engine-cooling module leaves the assembly line, a workerlifts it from the carrier and puts it on the pallet. At this point, all data on theRFID tag (which is attached to the carrier, not to the module) is transferredto the back-end JIS system. Subsequently, a bar-code label with the serialnumber of the modules is printed and attached to the module. When thepallet is full, the worker checks the position of all modules on the pallet. Ifthe check succeeds, a control label for the forklift operator is printed andattached to the pallet. Finally, the forklift operator scans the bar codes andputs the pallet into the correct position on the truck.
RFID Application and Potential Improvements
COO introduced RFID at the request of one customer who expects improvedtraceability of the produced parts. Traceability of parts is of increasing im-portance to OEMs, partly due to legal requirements, and partly in order toimprove quality in the long term by identifying faulty components quicklyand reliably. In COO’s solution, RFID tags are attached to the carrierswhich are used to move the parts through the assembly line. This allows thetracking of the entire assembly process.
Once a part is separated from the carrier, the information is transferredto the back-end system. The carrier and the RFID tag attached to it can berecycled immediately. Separating the product and the product-related dataleads to some challenges regarding data management. In order to obtainaccurate data on a given engine-cooling module, the ID of the module must beavailable and forwarded to a database. This database needs to be maintainedto provide the relevant information in the long term. In contrast, having therequired data stored with the respective object ensures easy and consistentaccess.
29

raw materials are ready
worker
raw material
engine coolingmodule
X
worker
X
write routing data on carrier’s RFID tag
worker
worker
X
confirm no error found
quality check
repair
print module’s label & stick to module
errorno error
errorno error
X
X
place on position in pallet
check if pallet fullworker
Xfullnot full
check modules’position on pallet
reorder
X
print pallet control la-bel 2 & stick to pallet
put pallet in right order on truck
end-products are shipped
empty pallet
pallet with 6 enginecooling modules
right orderwrong order
worker
worker
worker
∧
write RFID data to backend system
∧
Material Flow
Function
Event
Material
Legend
Process Flow
quality check
assign task to pallet
print pallet controllabel & stick to pallet
machine
worker
produce engine cooling module
X
Logical Operator
machine
machine
machine
machine
machine
Figure 2.3: Production process for an engine-cooling module at COO.
30
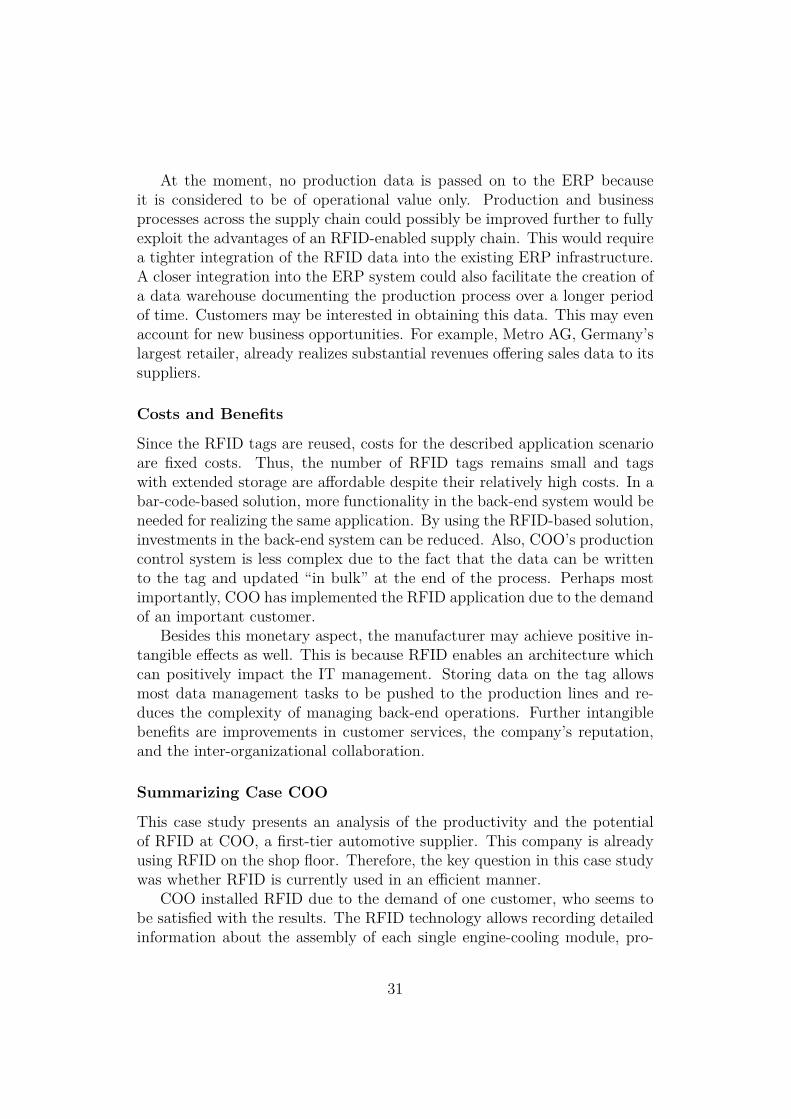
At the moment, no production data is passed on to the ERP becauseit is considered to be of operational value only. Production and businessprocesses across the supply chain could possibly be improved further to fullyexploit the advantages of an RFID-enabled supply chain. This would requirea tighter integration of the RFID data into the existing ERP infrastructure.A closer integration into the ERP system could also facilitate the creation ofa data warehouse documenting the production process over a longer periodof time. Customers may be interested in obtaining this data. This may evenaccount for new business opportunities. For example, Metro AG, Germany’slargest retailer, already realizes substantial revenues offering sales data to itssuppliers.
Costs and Benefits
Since the RFID tags are reused, costs for the described application scenarioare fixed costs. Thus, the number of RFID tags remains small and tagswith extended storage are affordable despite their relatively high costs. In abar-code-based solution, more functionality in the back-end system would beneeded for realizing the same application. By using the RFID-based solution,investments in the back-end system can be reduced. Also, COO’s productioncontrol system is less complex due to the fact that the data can be writtento the tag and updated “in bulk” at the end of the process. Perhaps mostimportantly, COO has implemented the RFID application due to the demandof an important customer.
Besides this monetary aspect, the manufacturer may achieve positive in-tangible effects as well. This is because RFID enables an architecture whichcan positively impact the IT management. Storing data on the tag allowsmost data management tasks to be pushed to the production lines and re-duces the complexity of managing back-end operations. Further intangiblebenefits are improvements in customer services, the company’s reputation,and the inter-organizational collaboration.
Summarizing Case COO
This case study presents an analysis of the productivity and the potentialof RFID at COO, a first-tier automotive supplier. This company is alreadyusing RFID on the shop floor. Therefore, the key question in this case studywas whether RFID is currently used in an efficient manner.
COO installed RFID due to the demand of one customer, who seems tobe satisfied with the results. The RFID technology allows recording detailedinformation about the assembly of each single engine-cooling module, pro-
31
viding a thorough documentation of the production process and thereby areliable basis for tracing parts in the case of future breakdowns or recalls.However, the advantages of using RFID vs. a classical bar-code solutionare limited. Here, we want to point out that business processes across thesupply chain could be improved further in order to fully exploit the advan-tages of an RFID-enabled supply chain. Possible measures include the useof part-specific RFID tags that remain on the part after delivery; a tighterintegration of the RFID data into the existing ERP infrastructure; the selec-tive communication of this data to COO’s customers and business partners;and the implementation of a production data warehouse.
In the longer term it seems likely that the customer will demand thatthe tags remain on the product. This would lead to a tighter IT-enabledintegration of the entire supply chain. At this point, however, the imple-mentation of such integration measures, including related security measuresand standards activities, is a costly and possibly risky endeavor. Possiblebenefits will a priori not be distributed fairly between the different parties inthe supply chain. This not only concerns costs for RFID readers, tags andrequired software, and costs for changing the underlying processes, but alsothe costs for constructing a more detailed mapping between the shop-flooroperations and the IT processes.
2.3.4 Production of Cast PartsThe main products of CAS are cast parts in diverse sizes. CAS also designsthe models required for casting. Models are the central asset in the produc-tion of cast parts. They consist of two model covers and up to 20 core forms.The covers and the cores are stored independently in one of the numerousstorage rooms of the plant. Several thousand of these parts are being used.Each part must be fetched in a timely manner before the production canstart.
At the beginning of the production, the workers select all needed modelparts from the stock. If a location of a part is unknown, workers must searchthrough all of the stocks. Currently, the workers are requested to updatethe positions of the models in the SAP R/3 system. However, updatingthe positions is a cumbersome manual task and is therefore not consistentlypursued. According to CAS’s workers, a consequence is that about 2% of allmodel parts need to be searched for before they can be used in the production.Reducing search times is of special interest, because the layout of CAS’splant makes searching a very time-consuming task and can possibly delaythe production. A model of the production process at CAS is depicted inFigure 2.4.
32
CAS manages the search problem by planning with time buffers for fetch-ing the required model parts. Currently, production plans are created on aweekly basis and models are fetched the day before they are needed. Thisallows reacting to situations where models must be searched for. However,CAS is about to switch to planning on a daily basis, leaving less time forsearching. Thus, the IT managers of CAS expressed the explicit demand toimprove the tracking system for model parts. This would reduce search timesand make short-term planning more reliable.
In the production process, model parts are used to create sand moldswhich are negatives of the final product. Subsequently, melted steel is castinto these sand molds where it cools down. When the cast part is cooled thesand form collapses. Finally, excess metal at parting lines is removed andthe product is shipped to the customer.
Potential Improvements with RFID
CAS is currently investigating how to reduce search times for model parts.RFID could be used to automatically keep track of the model parts. Thereby,searching could be avoided and it could be ensured that model parts areprovided on time.
For the technical realization, two options have been evaluated: One isbased on fixed reader gates while the other employs mobile readers. In bothcases, RFID tags would be mounted to model parts. Reader gates could beplaced at key points (e.g., doors) on the transport ways. This would allowto keep at least track of the room a certain model part is in.
As an alternative to using reader gates, the workers who transport themodel parts could be equipped with mobile readers. In this scenario, certainlandmarks on the plant floor would be marked with RFID tags. Duringtransportation, the RFID tags on the model parts as well as position tags onthe plant floor or walls would be read by the mobile readers. Evaluating thisinformation would allow to reconstruct the track of each model part. Thetrack’s granularity mainly depends on where RFID tags are located at theplant. Thus, tracks with a high spatial resolution could be achieved in thisscenario.
Costs and Benefits
CAS considers the application of RFID to overcome its problems in trackingmodel parts. Fast retrieval of model parts is especially a challenge when CASrealizes its goal to switch from a weekly planning cycle to a daily planningcycle.
33

melted metal
scrap metal
sand forms
order is placed
products is finished
task scheduling
fetching modelcores from stock
fetching modelcovers from stock
removing excessmetal
oven
forklift
injectionmachine
injectionmachine
worker
grindingmachine
model cores
sand forms
model cores
sand forms
melting discardedmetal
creating sand mould
assembling completesand mould
creating sand mould
casting product
Material Flow
MachineFunction
Event
Material
Legend
Process Flow
XLogical Operator
Figure 2.4: Production process at CAS.
Thus, the manufacturer must trade the cost for an improved trackingsystem against the increasing effort for the search process of needed forms.To determine the hardware cost, two different scenarios must be consideredat CAS.
In the first scenario the forms should only be tracked between differentproduction floors and the diverse storage rooms. For this scenario, about tenreader gates would be required at way points on the transportation routes.Additionally, tens of thousands of RFID tags would be needed to label all ofthe model parts.
In the other scenario, mobile readers and position tags on the plant floorare required. Two mobile readers would be sufficient to equip each of the twowarehouse workers. Compared to the first scenario, the second scenario needsfewer investments in hardware, although additional RFID tags for markingpositions on the plant floor are needed. Furthermore, the second scenariowould allow tracking with finer granularity.
However, evaluating the reader data is more complex in the mobile readerscenario. Thus, more complex and likely more expensive software would berequired. One of the main drivers for RFID was in fact an intangible benefit.That is, the reduced search times would allow the manufacturer to optimize
34
the production planning by switching from weekly to daily planning.
Summarizing Case CAS
In this case study we investigate potential solutions for tracking model partsat CAS. We describe the benefits which CAS may derive from implementinga tracking application and what technological options may be considered forthe implementation. We elaborate on different hardware solutions for cap-turing the tracking data. In particular we discuss potential implementationswith mobile readers and fixed reader gates. For these scenarios we pointout differences such as the achievable granularity and the related hardwarecosts. We furthermore describe how data can be captured, evaluated andcommunicated to the back-end system.
Before CAS implements the mobile-reader or fixed-reader-gates option,hardware tests need to be conducted to determine the read reliability thatcan be achieved in the different scenarios. Results of these tests have im-plications not only on the hardware setup but also on the needed softwarefunctionality. The achieved reliability and the desired degree of automationdetermine what inference and filter operations are needed to be performed onthe data. Finally, after deciding on these issues, the appropriate architectureand distribution of functionalities can be picked for the tracking applicationat CAS.
In addition to the outlined RFID potentials in the plant itself, businessprocesses across the supply chain could be improved further to fully exploitthe advantages of an RFID-enabled supply chain. At this point, however,the implementation of such integration measures, including related securitymeasures and standards activities, is a costly and possibly risky endeavor.Possible benefits will a priori not be distributed fairly between the differentparties in the supply chain. This concerns not only costs for RFID readers,tags and required software, and costs for changing the underlying processes,but also the costs for constructing a more detailed mapping between theshop-floor operations and the IT processes.
2.3.5 Production of Electronic ConnectorsCON produces electronic connectors which are used by the automotive in-dustry, telecommunications, and industrial automation. CON processes pre-dominantly two types of input material: plastic granulates and copper straps.Figure 2.5 shows a model of the whole production process. In order to createthe pins for the connectors, the copper straps are punched and galvanized.Plastic granulates are molded into the shape of the connector. Finally, pins
35

and plastic parts are joined to create the final product. This is either donein a separate step or in combination with the molding (injection molding).
Each production step is documented twice. First, data about the process-ing steps is manually written onto paper tickets. Second, the documentationof the production is written into the back-end system. At the beginning of aprocessing step, a worker selects an open task via the workstation’s terminal.The worker must book the task back to the back-end system after the taskis completed. This is necessary for tracking and controlling the productionprogress.
The paper tickets are attached to the corresponding materials’ trans-portation units. Plastic parts have boxes as transportation units. Copperstraps are transported on coils. Materials are moved from the original to anew transportation unit at each processing step. For instance, copper strapsare reeled from a source coil, processed, and reeled to a target coil. Theaccompanying ticket is then moved from the old to the new coil.
punching
raw materials are ready
galvanizing
X
punching
galvanizing
moulding
injectionmouldingassembly
shipment
machine
machine
machine
end-products are shipped
punched copper straps
on coils
galvanizedcopper straps
on coils
punched copper straps
on coils
raw copperstraps on coils
galvanizedcopper straps
on coils
synthetic granules
Rasmachine
X
synthetic granules
plastic parts in boxes
assemblymachine
connectors
connectors
raw copperstraps on coils
Material Flow
Machine
Function
Event
Material
Legend
Process Flow
X
Logical Operator
metal parts
plastic straps
Figure 2.5: Production process of connectors at CON.
36

After the production, products must be labeled with the correct informa-tion and packed into the right containers for shipment. This is a particularchallenge, since every customer requires different formats for the bar-codelabels. Consequently, special printers are required that allow handling ofmultiple formats. Labels are printed at a central location in the plant anddistributed to various packing stations. Furthermore, it is required to pickappropriate containers depending on the product and client. Most contain-ers are reusable and cycle in the supply chain. Here, CON faces challengesin locating the transportation units because no detailed tracking system isapplied.
Potential Improvements with RFID
CON currently does not yet use RFID technology in its production. How-ever, some processes may be improved through the use of RFID. Withinthe case study, HU has identified the subsequently described applications atCON’s plant. They target the following five improvements: improving qual-ity of production tracking and avoiding interruptions, reducing workload formaintaining process data, improving container localization, reducing effortfor printing customer-specific labels, and improving process quality.
Improving quality of production tracking and avoiding interruptions: Be-fore a production step can start, the required material must be transportedto the input buffer of the operation. Additionally, the booking of the previ-ous production step must be finished. Currently, transporting and bookingare done independently and it is not ensured that both processes are syn-chronized.
According to CON’s employees, occasionally booking is accidentally leftout. If a booking is omitted, the worker at the subsequent production stepwill need to interrupt his task in order to complete the missing booking fromthe previous operation. The time loss per omitted booking can be as highas 30 minutes according to CON’s staff. Instead of correcting such a missingbooking, it is also possible to proceed with the production. However, in sucha case, the production and the material flow are not accurately tracked anddocumented.
RFID technology could possibly improve the processes efficiency by en-suring that booking and transporting processes are synchronous. Internaltransport units would have to be equipped with RFID tags. Tags could beattached to the coils for the copper straps and to the boxes for the plasticparts. RFID readers would detect when an internal transportation unit ismoved to the next production step. Thereby, missing bookings could auto-matically be detected and the responsible worker could be informed. In a
37
more advanced solution, the booking process itself may be automated. Thiswould make transporting and booking synchronous and ease the maintenanceof process data.
Two options exist regarding the installation of RFID readers at the plantfloor. One option is to use only a few reader gates which are placed at inter-section points of internal routes for material transportation. The installationpoints must be chosen in a way that materials pass at least one reader whenthey are transported between subsequent processing steps. This setup couldbe used to automatically check for missing bookings. An alarm could betriggered if a reader detects material movements which cannot be associatedwith a corresponding booking. The second option is to have readers at eachprocessing step. Having readers at the machines would enable to controlwhether or not a processing step has been conducted. Booking could beautomated.
Reducing workload for maintaining process data: according to estimatesof CON’s employees, a worker on the plant floor spends approximately 15%of their working time on maintaining process data. Up to a third of thistime is spent on the maintenance of tickets for the internal transportation.A portion of the data maintenance could be automated if tickets were partly(if not totally) replaced by writable RFID tags. This would increase workers’productivity as well as reduce errors in manual data entries.
Having boxes and coils equipped with RFID tags allows for associatingthe internal transfer units with data about their content. For example, amachine could automatically identify the transportation unit for the outputmaterial. Then, it could link data about the conducted operation with theidentified unit. Thereby, manual writing of process information on papersheets could be avoided or at least reduced.
In general, two options exist for automatically storing data. One is towrite the data directly onto an RFID tag attached to the internal transferunits. In this case, a tag with a sufficient amount of memory is needed. Al-ternatively, the information could be written to a database in the back-endsystem. This scenario requires internal transfer units to be equipped withan RFID tag holding only an ID. The tag ID could automatically be readand used as a key in the database. Thereby, the RFID technology allowsto automatically associate data about processes with the corresponding in-ternal transfer unit. Yet, using a database instead of writing data to RFIDtags would increase the number of back-end transactions and may thereforerequire investments in the back-end system. It must be analyzed carefullywhich option for storing data is more cost effective.
Improving container localization: numerous types of containers for ship-ping are used at the plant. Different customers require different packing units
38

for shipping, making container management a challenging task. Containerscan be at various locations within the plant and no detailed tracking of con-tainers exists today. Automatic tracking of containers could be realized withthe use of RFID technology (see also the previous scenario).
If containers were equipped with RFID tags, readers at different locationscould update a database that holds the container’s position. Alternatively,mobile readers could be used for a quick update of the inventory. This wouldreduce time for searching containers, lower the risk of losing containers andreduce costs of renting containers by decreasing the required safety stocks.
For tagging containers, low-cost RFID tags could be utilized to store thecontainer’s identifier. If these tags are only used internally, CON could labelcontainers at the inbound. CON’s customers could possibly benefit fromhaving RFID tags on these containers as well. In such an arrangement, thepartners may agree on the type and format of the data be stored on the tagsin order to increase the efficiency of container management across companyboundaries.
Reducing effort for printing customer-specific labels: labels on the out-bound shipping units vary from customer to customer. The labels differ interms of which paper is used and which information is printed on the paper.Currently, CON handles this situation by having a central printing stationwhere different labels can be printed on different types of paper. The nu-merous formats could be handled much more easily if customers agree onreplacing paper labels with RFID tags. Different information required onthe various labels could then be written on the same type of RFID tags. Ifreaders/writers would be available at the packing station, labels would nolonger need to be created at the central location.
Improving process quality: the accuracy of processes at CON currentlydepends on employees’ care and attention. For instance, workers must becareful not to accidentally mix up input materials for a process step or notto mix up labels. If RFID technology were used, correctness could be auto-matically inferred based on read events and ensured by alerts.
RFID readers at every processing step could be used to identify the ma-terials which are about to be processed. Therefore, internal transfer unitshad to be equipped with RFID tags. Data about the materials they containcould either be stored on the tag or directly written into the back-end system.However, the latter case would cause additional communication overheads.
Costs and Benefits
The use of RFID technology offers a number of potential benefits for CON.Each application scenario would account for different investment costs and
39

resulting benefits. Not all of the benefits are quantifiable in terms of costsavings. The major investments and savings for the different applicationscenarios are outlined in the following.
Fixed investment costs are those for readers, RFID tags, training staff andconfiguring the software system. Tag costs are fixed because the tags cyclein a closed loop. Running costs are those for software licenses and replace-ments of defect readers and tags. Different requirements for the RFID tags’capabilities exist in the diverse application scenarios. Thus, tag prices mayrange from about 20 euro cents to several euros. Reader prices range from afew hundred to several thousand euros. Investment costs vary substantiallybetween the scenarios, because of the high variance in required scan points.The same applies to the savings which may be gained within the differentapplications.
The scenario improving quality of production tracking and avoiding inter-ruptions presents two types of cost savings: One is that labor time, requiredto reconstruct data for missing bookings, can be reduced. Fixing missingbookings can take up to 30 minutes of employee time, according to interviewswith the staff. Furthermore, missing bookings can interrupt the productionprocess. The frequency of such incidents and the value generated in the run-ning production process determine the monetary benefit of avoiding theseinterruptions.
The scenario reducing workload for maintaining process data accounts forsavings in labor time. Employees on the plant floor spend about 5% of theirtime on copying data from and to accompanying tickets. This time can besaved if the data is transferred automatically via RFID.
In the scenario for improving container localization, RFID can reduce theoverall cost for purchasing and renting containers. Tracing containers wouldallow the reduction of the safety stock for containers and fewer containerswould need to be rented. Furthermore, loss of containers could be reducedor external partners could be held accountable for losses at their site.
In the scenario reducing effort for printing customer-specific labels, labortime and hardware cost can be saved. This scenario is highly interlinked withother RFID applications. If RFID readers are in place, they can be used towrite customer-specific information on tags in the outbound. In this case,expensive, specialized printers for labels would no longer be necessary. Thiswould result in saving hardware cost and increased productivity.
In the scenario improving process quality, production waste could be re-duced by avoiding false machine settings. The resulting savings of this ap-plication scenario depend on the value of the wasted material and the costof processing it.
Besides these quantifiable aspects, applying RFID might leverage intan-
40
gible gains. The technology could improve the data tracks on the productionprocesses. This in turn may enable to spot so-far-undetected potentials forimprovement.
Summarizing Case CON
This case study presents an analysis of the potentials of adopting RFID atCON. The analysis revealed five areas that hold the potential for improve-ments at CON’s plant. In the case of CON we recommend focusing onclosed-loop scenarios within the plant in the short term. This is becauseCON controls all factors of the setup and can gain experience before negoti-ating with partners about collaboration. Closed-loop scenarios would addressthe automatic synchronization of processes with corresponding data tracks,maintenance of process data, and process safety.
In addition to the outlined RFID potentials in the plant itself, businessprocesses across the supply chain – like the container management scenario –could be improved further to fully exploit the advantages of an RFID-enabledsupply chain. Possible measures include the selective communication of RFIDdata to CON’s customers and business partners. At this point, all data aboutthe containers are simply written into the ERP system.
However, for such IT-enabled business processes the IT department needsto better map and integrate the information from the shop floor into the ITprocesses. Today, CON cannot fully map the container tracking into the ITsystems. This results in repeated container shortages.
At this point, however, the implementation of such integration measures,including related security measures and standards activities, is a costly andpossibly risky endeavor. Possible benefits will a priori not be distributedfairly between the different parties in the supply chain. This concerns notonly costs for RFID readers, tags and required software, and costs for chang-ing the underlying processes, but also the costs for constructing a more de-tailed mapping between the shop-floor operations and the IT processes.
2.3.6 Production of Aluminum Foils for PackagingPAC produces printed aluminum foils for packaging. Its customers belongprimarily to the food industry and the pharmaceutical industry. The produc-tion is subdivided into two sections: The first section is used to mill aluminumfoils into the desired thickness and then cut into a specific length and width.Between the milling steps, the foils are also annealed in an oven which heatsup to about 400◦C (750 F). This section is referred to as pre-processing.
41

raw materials are delivered
end-products are shipped
intake
packing/labelling
X
shipping
X
X
aluminum foils
milled aluminum foils
cut aluminum foils
annealed aluminum foils
annealed aluminum foils
refined aluminum foils
roll
cuttingmachine
cutting
cutting
refinementmachine
milling
annealing
cuttingmachine
label printer
label printer
oven
plastic granulates
refinementpacking/labelling
glue
colors
Material Flow
MachineFunction
Event
Material
Legend
Process Flow
XLogical Operator
Figure 2.6: Production process of aluminum foils at PAC.
In the second section, the foil is colored and coated with cellulose films.This section is referred to as the refining section. Figure 2.6 shows the gen-eral workflow of a production step for pre-processing along with the relatedactivities for data management.
At the beginning of a production step, the required material is fetchedaccording to the production plan. Rolls with aluminum foils carry accom-panying paper tickets which are used to identify the materials. After therequired material has been fetched, the machine is configured and the milling(or cutting) is started. Subsequently, the completed processing step is docu-mented on the accompanying ticket and booked to the MES. Processed rollsare moved on to the next production step or to a material buffer on the plantfloor.
At the refinement section a production step starts with loading materialsinto the machines. Additional input materials are varnish and glue which arefilled into the machines. All of these processing tasks are conducted withinthe same machine. In the final step, the foils can be cut into smaller partsand reeled on rolls for shipment.
Within the production, all foils are transported on rolls. Each processingmachine winds off the input foils from the source roll. After processing, the
42

foil is reeled back to a new target roll. In a cutting process, a foil from oneroll can be split up into several foils and reeled to so-called child rolls. Also,multiple foils can be reeled in several layers of one roll. This material flowmust be tracked during the whole production process. An accurate track isnecessary for picking the correct materials at each step and for documentingthe production.
Due to the larger number of input materials, configuring the machines inthe second section is more complex than during the first one. Like during thepre-processing, each input material and machine setting must be documentedin case the information is required for later recalls. A special challenge inthe refining section is that input materials may be subject to changes duringthe processing. An example is refilling glue or varnish. Here it must betracked which parts of the resulting foil were created under which conditionswith which input materials (e.g., the first 100 meters where produced withglue A, and the rest with glue B). Additionally, temporary production errorscan affect the foil, at least in parts. These parts must be marked and cutout later. Figure 2.6 provides an overview of how refining is conducted anddocumented.
In the final step, foils are packed and labeled for shipment. Differentcustomers require different bar-code labels on the packed rolls. Also, labelsmay change for different orders. Thus, each roll has individual bar codesthat are printed right before packing. Labeling information is associatedwith each roll and retrieved from the back-end system right before printing.
Potential Improvements with RFID
PAC does not yet use RFID technology in its production. Instead, data man-agement is realized with bar codes and paper documents. However, PAC iscurrently investigating whether RFID technology could improve the datamanagement. Within the case study, HU has identified the subsequentlydescribed applications for the investigated plant. They target the follow-ing three improvements: better process reliability by realizing an emergencybackup system, more detailed location tracking of rolls, and better qualityof production tracking.
Better process reliability by realizing emergency backup system: realizingan emergency system was explicitly demanded by the IT staff of PAC. Theissue is of high importance because currently the production at the inves-tigated plant will stop in cases of a back-end failure. Such incidents haverepeatedly occurred in the past and caused downtimes of several days withassociated financial losses. Consequently, it is highly desired to decouplecritical functionality from the back-end system and to ensure at least partial
43
operation if the back-end systems fail.RFID can be used as an enabler for an emergency system which can
operate without the back-end. This is due to the ability of RFID tags tostore data. In the desired application, rolls would be equipped with writableRFID tags. Using the memory on the tags, product and process informa-tion related to the associated foils can be stored directly at the rolls. Thus,required information must no longer be queried in the back-end system butcould rather be retrieved from the tags directly. However, some of the man-ufacturing steps such as the heating may cause challenges for the selectionof appropriate RFID tags.
More detailed location tracking of rolls: the IT staff expressed the demandto improve the granularity of tracking the rolls’ locations on the plant floor.In particular, the process of annealing was the focus of this demand. Here,the rolls are moved into a chamber for heating where they must remain fora specific period of time. Workers document the time when they loaded andunloaded the chamber. However, as tracking is done on the level of batches,it is unknown how long a particular roll was in the chamber. In general, itis not documented where exactly the rolls are located. Before and after eachprocessing step, the aluminum foils are stored in material buffers. Currently,workers must keep track of the rolls without any technical support.
RFID can be used to establish an automatic tracking system for rolls. Forthis scenario, rolls could be marked with RFID tags. This would enable theautomatic registration of the rolls’ position at checkpoints on the plant floor.Together with the back-end system, the solution would allow the recording ofdetailed tracks of the rolls’ positions, and the monitoring of the productionprogress. Thereby, searching for rolls would be avoided and it would beensured that all rolls are transported as planned. Furthermore, each rollcould be tracked individually in the process of annealing (given that RFIDtags were used that can resist the heat). This would enable the exact timeof heat exposure to be recorded in detail. This could help to address qualityissues.
Better quality of production tracking: at PAC, management of processdata on the plant floor is currently done with tickets which accompany therolls during the process. Information on these tickets is used by the workersto identify the materials on the plant floor and to choose the appropriatemachine settings. Here, the manual data maintenance is a potential sourceof errors. For instance, if multiple foils are reeled in layers on one roll,the workers determine the order of layers via the tickets. Mixing up thesepositions results in false processing of the material. Another issue is thattickets can fall off and get mixed up.
These problems may be solved by an application which uses writable
44
RFID tags for maintaining process data. In this application scenario, RFIDtags could be permanently attached to the rolls. Thereby, information wouldbe directly coupled with the corresponding object and could not be mixedup or get lost. Data about the conducted operations could be copied elec-tronically from the machines or from the back-end system to the RFID tag’smemory. Thereby, errors in manual data management could be avoided. Forinstance, information about the order of multiple layers on a roll could becopied from the machine which reeled the foils on the roll.
Costs and Benefits
The main reason for the manufacturer to investigate the usage of RFIDis the decentralization of the IT system. The manufacturer suffered frombreakdowns of the back-end system in the past. This resulted in productionstops of several days, causing a loss of revenue and reputation. A fail-oversolution for the central database has been discussed, but decentralized datamanagement via RFID is currently favored by the company’s productionsupervisor.
RFID would provide a simple solution for managing production data inan emergency case. This would require writable RFID tags with a few kilo-bytes of memory as well as one reader per workstation. Additionally, RFIDmay help to reduce production errors and improve the product quality. Thiscould be achieved by automating the data management and thereby avoidingerrors in manual data maintenance. The frequency of errors and the relatedcosts determine the potential savings for this application scenario. Further-more, improvements in the data accuracy may help to better analyze andstreamline the processes. Altogether, applying RFID would enable more re-liable production planning, ease the IT management, improve the reliabilityof the production, as well as increase the manufacturers’ reputation. Yet,the monetary effects of these applications are difficult to estimate.
Summarizing Case PAC
In this case study we present an analysis of the potentials of adopting RFIDat PAC. We identified three main scenarios of how RFID can improve PAC’soperations. The first scenario is to realize an application for tracking foils.Here, the ability of RFID to be read out without line of sight and the possi-bility to provide protective casings for RFID tags are the major argumentsfor considering RFID instead of bar codes.
The second scenario targets the maintenance of production data. Here,RFID could be used to ensure that production information is associated
45

with the right object. In the third scenario, RFID would be used to realizean emergency system. This system should ensure at least partial operationof the production even if the back-end system fails. Here, the possibilityto write information onto the RFID tags is exploited (“data-on-tag”). Thisallows to decentralize the business logic and to decouple it from the back-end system. All three scenarios require a detailed mapping of the shop-floorprocesses into the IT systems.
In addition to the outlined RFID potentials in the plant itself, businessprocesses across the supply chain could be improved further to fully exploitthe advantages of an RFID-enabled supply chain. Possible measures includethe selective communication of RFID data to PAC’s customers and businesspartners. At this point, however, the implementation of such integrationmeasures, including related security measures and standards activities, is acostly and possibly risky endeavor. Possible benefits will a priori not bedistributed fairly between the different parties in the supply chain. Thisconcerns not only costs for RFID readers, tags and required software, andcosts for changing the underlying processes, but also the costs for construct-ing a more detailed mapping between the shop-floor operations and the ITprocesses.
2.4 Lessons LearnedThis section summarizes the key findings of the conducted case studies re-garding evaluated RFID potentials. First we present typical use cases ofRFID which we derive from the case studies. Then in 2.4.2 we portray foreach use case whether and why other Auto-ID technologies, especially barcode, are not as suitable as RFID. Finally in Section 2.4.3 we describe currentmotives and open potentials for using RFID.
2.4.1 Evaluating Potential BenefitsBased on the experiences drawn from the case studies we now describe severalgeneral use cases for RFID. They are typically either a replacement of bar-code technology or an application that can only be realized using RFID.Our findings are in line with Chappell et al. [2003] and show the practicalrelevance of RFID in manufacturing. We found that most of the relevantissues came up repeatedly in the case studies. The most common motivationsfor planning RFID introduction were:
1. accelerating scan processes,
46
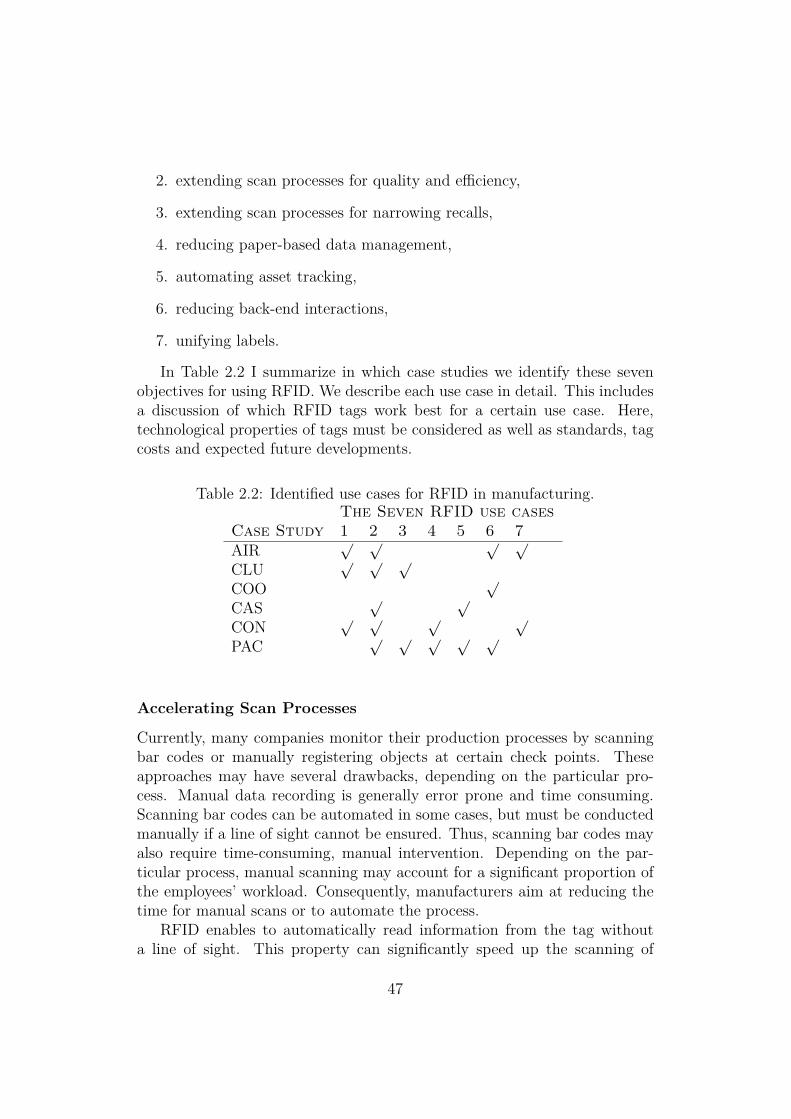
2. extending scan processes for quality and efficiency,
3. extending scan processes for narrowing recalls,
4. reducing paper-based data management,
5. automating asset tracking,
6. reducing back-end interactions,
7. unifying labels.
In Table 2.2 I summarize in which case studies we identify these sevenobjectives for using RFID. We describe each use case in detail. This includesa discussion of which RFID tags work best for a certain use case. Here,technological properties of tags must be considered as well as standards, tagcosts and expected future developments.
Table 2.2: Identified use cases for RFID in manufacturing.The Seven RFID use cases
Case Study 1 2 3 4 5 6 7AIR
√ √ √ √
CLU√ √ √
COO√
CAS√ √
CON√ √ √ √
PAC√ √ √ √ √
Accelerating Scan Processes
Currently, many companies monitor their production processes by scanningbar codes or manually registering objects at certain check points. Theseapproaches may have several drawbacks, depending on the particular pro-cess. Manual data recording is generally error prone and time consuming.Scanning bar codes can be automated in some cases, but must be conductedmanually if a line of sight cannot be ensured. Thus, scanning bar codes mayalso require time-consuming, manual intervention. Depending on the par-ticular process, manual scanning may account for a significant proportion ofthe employees’ workload. Consequently, manufacturers aim at reducing thetime for manual scans or to automate the process.
RFID enables to automatically read information from the tag withouta line of sight. This property can significantly speed up the scanning of
47
identifiers due to the following three advantages of RFID technology: First,some objects in the manufacturing plant are shaped in a way that bar codesmust be applied at places which are difficult to scan (see case studies 2.3.1,2.3.5). In such cases, RFID can help to speed up manual scan processes[García et al., 2003]. This property may also allow the automation of manualscan processes – a second major advantage of RFID technology.
The third advantage occurs when whole batches of objects must be iden-tified (see case studies 2.3.1 2.3.2). With RFID, all of the objects in thesebatches can be captured at once. Scanning without line of sight and cap-turing whole batches of objects reduces the need for manual labor [Chappellet al., 2003]. In cases in which line of sight for traditional identification meth-ods is hard to achieve, RFID allows the time workers spend on scanning tobe reduced. This in turn enables labor costs to be reduced and productivityto be improved.
Extending Scan Processes for Quality and Efficiency
Manufacturers have a high interest in getting more insight into the operationson the plant floor. Analyzing information about activities in the productionand measurements of environmental conditions can help to identify causes ofquality problems and point out potentials for improvements. Furthermore,analyzing live data can enable fast reactions to exceptions in the process. Ingeneral, a larger data set allows better insights into the process. Thus, manycompanies aim at extending data recording on the plant floor.
With RFID technology, activities in production are often much easier tomonitor in detail. With the help of RFID technology, new scan points can beintroduced without increasing the workload of the staff. Furthermore, RFIDlabels are typically more robust to hostile conditions that may occur in theproduction environment. For example, bar codes can become unreadable dueto exposure to dirt, heat, or mechanical influence.
RFID tags have the advantage that they can be covered in protectivecasings [DeJong, 1998]. Thus, in some production environments, RFID tagsmay work more reliably than bar codes do (2.3.1, 2.3.4, 2.3.6). On the otherhand, there are environments where bar codes still beat RFID by a margin.This is especially true if a substantial quantity of metal is present.
Some of the investigated companies have stringent requirements on pro-cess reliability and process documentation (e.g., consistency checks must en-sure that no process step is skipped). In one example from the case studies,the investigated company scanned the WIP parts after every operation to becompliant with customers’ demands (2.3.1). RFID can help to meet such de-mands by simplifying the process of scanning items. Thereby the technology
48
also makes it easier to comply with regulations for process documentation.The exact information about which object was manufactured from which
components and materials is required to identify all of the products whichinclude potentially flawed parts. Additionally, fine-grained and reliable datarecords can be important in legal disputes (2.3.1). A company may be heldliable if malfunctioning products cause damage. In this case, data recordsare important to be able to prove that the production was conducted in away consistent with the state of the art. Here, sensor data can help to detectthe cause of failure and further narrow the scope of potentially affected prod-ucts. Evaluating this data can provide additional insights into performancemeasures like cycle times. It can even help to identify the cause of qualitychanges.
RFID technology can also be used to ensure accurate and real-time re-porting about the production status. Typically, a production step is reportedback to the MES after processing has been completed. This information mayalso be required in future consistency checks and for later process analysis.As the case studies have shown, it is not uncommon that manual reportingis sometimes forgotten or not conducted in a timely manner (2.3.2, 2.3.5).Occasionally, production process information is even reported in a wrongorder. Possible consequences are inaccurate data tracks, incorrect status in-formation, or even interruptions in the production process. These problemsmay be overcome if RFID tags are applied to the materials or to the trans-portation units. In such setups, RFID readers could automatically detectif materials are transported to the next process step. Thereby consistencywould be guaranteed.
Extending Scan Processes for Narrowing Recalls
Narrowing the scope of recalls was a major concern for many of the investi-gated plants. Manufacturers may have to pay high penalties for each objectthat is called back. Recalls can significantly reduce companies’ revenue andtheir reputation with customers. It is therefore a major concern to limitrecalls and their effects to the largest degree possible.
To narrow recalls it is first necessary to locate the cause of failure asspecifically as possible. Commonly, a faulty material or malfunctioning ma-chine has to be identified. In the second step, all potentially affected productsmust be located. This requires a detailed track of which materials and in-termediate products are assembled in which finalized products, as well asinformation about these products’ locations. If the cause of failure was amalfunctioning machine, it is important to know the exact period of time inwhich the machine did not work properly and which products were processed
49
during this period.In order to limit recalls to the maximum extent, companies aim at creating
fine-grained tracks of their internal material flow. Yet, manual tracking ortracking by using bar-code technologies may not always be feasible. Time-consuming scans or the inability to create line of sight or hostile conditionscan pose a limit on the number of possible checks and thereby the granularityof data tracks.
RFID can help to introduce additional scan points into the productionprocesses. This is partly because RFID tags can automatically be read outin more situations than bar-code labels. Additionally, RFID tags can handlehostile conditions such as exposure to dirt. Furthermore, RFID tags withsensing capabilities can help to determine the cause of failure and to ratethe damage. All these properties of RFID render the technology helpful tonarrow recalls in cases where more traditional approaches fail (2.3.2, 2.3.6).
Reducing Paper Based Data Management
Paper documents that accompany the WIP are currently a common methodfor recording and maintaining data throughout the production process.These paper documents are transported along with their correspondingmaterials and are used to record data about the production process. Ad-ditionally, these documents can hold information about how to conductsubsequent operations. The accompanying documents are usually onlyloosely coupled with the objects they belong to. That is, documents movealong with the corresponding objects but are physically separated from themwhile data is written on the paper. This may cause a mix up of documentsand incorrect data maintenance. Furthermore, handwritten notes occa-sionally cannot be deciphered, which effectively constitutes an informationloss.
A correct data track of the production is crucial in many cases. Customersmay demand high-quality data tracks or the company itself needs those tracksfor recalls and legal disputes about liability. Furthermore, the data is usedfor steering and controlling production itself. Thus, mixed-up documents canlead to production errors and loss. Consequently, companies seek a way toensure that data are recorded correctly and are permanently associated withthe right object.
RFID tags with writable memory can be used to store data from accom-panying documents right at the corresponding object. Thus, informationcannot get lost on the shop floor or accidentally get mixed up with otherdocuments, like can be the case with paper documents. Loosing informationwould only occur, when the tags get damaged or the RFID reader had a read
50
or write error.Using RFID may also leverage the automation of some of the manual
data maintenance. For instance, records of the conducted operations can au-tomatically be written from machines to tags. Automatic data maintenancewould account for time savings and a reduction of errors.
Alternatively, information about an object can be stored in the back-endsystem. In these cases an identifier for the corresponding object is needed.Depending on particularities in the targeted application environment, barcodes can be a suitable alternative to RFID. As mentioned, however, theapplication of bar codes may be infeasible, e.g., in dirty environments. Fur-thermore, applying bar codes may reduce the degree of automation in caseswhere line of sight cannot be created automatically.
Other trade-offs concern the required adaptations of the back-end system.In order to guarantee fast response times and high availability, an appropriatenetwork infrastructure and software system for the back-end is required. Theinvestment in such an infrastructure must be traded against the investmentin RFID tags and readers and the resulting network load must be consideredcarefully. However, even when data is stored locally on an RFID tag, theback-end system typically keeps a copy of this information, which may causeproblems regarding data synchronization.
Automating Asset Tracking
Knowing the spatial location of assets can be crucial to ensure the productionprocesses. All materials for an operation and the required tools need to beat the designated machine in time. If timely fetching of required materialscannot be ensured, the production process may be interrupted and result ina reduction of productivity.
In general, companies follow two strategies to avoid downtimes due tomissing assets: One is to fetch the required materials and tools with a longtime buffer before production starts. This allows reacting to situations wherethe assets cannot be found and must be searched for (2.3.4). Yet, in this ap-proach it is necessary to schedule the production in the long term to havethe work plan ready for asset fetching. Consequently, this strategy is in-feasible for companies that seek high flexibility and reactivity in using theirproduction lines.
Another way to reduce fetching times for assets is to keep a detailed trackof their positions. This reduces search times and makes planning of the fetch-ing time more reliable. Yet, keeping an accurate and updated track of assetstypically requires – often manual – interference. A special challenge is totrack materials in material buffers on the plant floor. These material buffers
51
are often only loosely structured and their content is changed dynamically.However, tracking objects in wide-spread stocks can be challenging and timeconsuming as well.
RFID technology has the potential to facilitate the recording of assets’positions. For instance, assets can be equipped with RFID tags and regis-tered by stationary readers at key points. Alternatively, mobile readers canbe used to quickly register items at certain locations. Thereby, the RFIDtechnology leverages detailed asset tracking and can help to avoid searchtimes for materials and tools [Lampe and Strassner, 2003].
Furthermore, companies also demanded better container tracking, 2.3.5,2.3.2. It is often attractive to use low-cost RFID tags for container-trackingscenarios. UHF Gen 2 tags may be an option. The Gen 2 standard is wellestablished and designed for logistic processes. Applying this standard wouldleverage the utilization of these tags by customers and other supply chainpartners and may allow the investment costs to be shared. Furthermore, tagsfor this standard are already produced in large quantities and are relativelycheap.
Reducing Back-end Interactions
Some of the investigated companies expressed the demand for reducing in-teraction with the back-end IT system. In one case, the network infras-tructure and the back-end database were perceived as unreliable (2.3.6).Consequently, production IT systems should also work during temporarydisconnections from the back-end servers.
In another case, the company’s network and back-end computers werebarely able to serve the demanded response time (2.3.1). Its IT staff pre-dicted significant bottlenecks when data volumes increase in the future. Inboth cases, RFID tags with writable memory (“data-on-tag”) could help todecouple processing of business logic from the back-end system and to dis-tribute the workload.
Currently, interaction with databases in the back-end system is needed toretrieve task-related data at each operation. In 2.3.3 the company decidedin advance to build their production line to be independent from back-endinteractions. The production line can work autarkically because all routingdata is stored on writable RFID tags.
With the help of RFID the workload of the back-end system as well as thecommunication with back-end databases can be reduced significantly. Thecapability of RFID tags to store up to several megabytes of data enables anovel distribution of data and business logic. Data needed for consistencychecks and process control can be stored directly on the RFID tag of the cor-
52
responding objects. Usually that comprises tasks descriptions of the referringorder and history data about the conducted operations. For instance, consis-tency checks that verify if all needed steps were conducted can be performedsolely on the basis of the history data stored on the tag.
Moreover, using the memory on RFID tags, the business logic for checksand process control can be moved close to the point of operation. For in-stance, the business logic can be run on PCs that are connected to RFIDreaders and machines on the plant floor.
Higher-class RFID tags could enable more distribution of business logic.Programmable readers can perform check operations locally and even inde-pendently of PCs on the shop floor. Furthermore, smart sensor tags canprocess business logic on the items themselves. Early examples for such ap-plications are investigated, for instance, in the CoBIs project [Spiess, 2005].This EU-funded project deals with distributing business logic to smart sensornodes. Prototypes have been construed with partners like BP and Infineon.
Moving the business logic closer to the point of action on the plant floorhelps to ensure fast responses of the system without tuning the back-enddatabases and the network infrastructure. It also helps to increase systemreliability because in a distributed system device failures only affect smallparts of the infrastructure.
By storing information on the tags, investments in the back-end systemcould be avoided. The used database would need to be adjusted if the manu-facturer decides to use tags that only hold an ID. Which option is most costefficient depends on the tag prices and the cost of extending the back-endsystem.
Unifying Labels
The case studies showed that manufacturers face challenges in handling la-bels at the outbound shipment. Different customers typically demand differ-ent bar-code solutions for labeling transportation units and packages (2.3.1,2.3.5). These differences can be in the demanded label format, coding schemeand the information on the label. Thus, manufacturers have to manage andprint a wide range of different labels for their shipment processes.
Another challenge is that customers may claim financial compensationfrom the manufacturer if bar-code labels are unreadable. In the case studyin 2.3.1, a customer’s production line stops if a bar code is unreadable. Re-sulting costs for unreadable bar codes must be reimbursed. Consequently,the manufacturer checks each created label to make sure they can be read.
This demand for high-quality labels that hold diverse information in var-ious formats poses challenges in managing and printing bar-code labels. Of-
53
ten, special printers are used to achieve the desired print quality and tohandle different label formats. Since these printers are expensive devices,some manufacturers create labels at a central location to reduce the numberof printers needed. Yet, printing at a central location has the drawback thatlabels must be transported to the respective packing stations. This causesextra time and bears the risk that labels will get mixed up.
RFID technology can be used for unified labels that abstract from thephysical representation of data. Radio-frequency protocols such as definedin the ISO 18000 or EPCglobalTM standards [ISO/IEC-18000, 2004b, EPC-global, 2005] provide well-defined ways to access data on RFID tags. Forinstance, the Gen 2 standard specifies an optional user memory that can beused for arbitrary purposes. Using such standards, customer-specific infor-mation can be written on the same kind of label in a standardized way. Thisholds even if customers require individual coding schemes for the data.
Abstracting from the physical representation of data allows for usingstandard RFID readers to create customer-specific labels. Thus, one kindof reader can be used for all labels and specialized printing stations are nolonger necessary. Note that RFID readers may be available at packing sta-tions for scanning logistic applications. In contrast to bar-code scanners,RFID readers also have the ability to write on tags. Thus, only one devicefor reading and writing is needed.
Yet, to achieve this abstraction, the supply chain partners need to agreeon applying RFID in general and on the frequency to be used in particular.Within a given RF spectrum, the readers’ software can support differentcommunication protocols and thereby abstract from different tag versions.
RFID can help to increase the reliability of labels. This accounts espe-cially for environments where dirt or mechanical influence can affect the barcode. It is generally easier to protect RFID tags from mechanical damage likescratches or loss. This is because RFID tags do not need to be applied to theoutside of an object where they are visible. Instead, they can be built intothe product during the manufacturing process, applied inside the product’scasing or be protected by a special casing for the tag’s inlay.
Note that the discussed cases for label handling not only affect operationsat the manufacturers, but also at their customers (OEMs etc.) down thesupply chain. Using RFID tags as uniform labels therefore implies a closecoordination across the whole supply chain (or at least significant parts ofit). Customers would at least need to equip their intakes with RFID readers.Having incoming items labeled with RFID tags would leverage an extendeduse of this technology within customers’ processes and may lead to significantproductivity gains there as well.
54
2.4.2 Comparing RFID with other Auto-ID Technolo-gies
In this section we discuss if and how the previously described use cases couldalso be realized using other Auto-ID technologies. Voice recognition andbiometrics are useful systems for access control. However we do not focuson access control. Magnetic stripes and smart cards suffer from mechanicalwear. Additionally they need physical contact to the reader while read.
Machine vision, bar codes or RFID do not have this disadvantage. There-fore, these systems are used in manufacturing. Machine vision and bar codeneed a line of sight to work. Manufacturers are likely to use machine-visiontechnologies when products have to be compared to pictures stored in adatabase (2.3.3). In cases where bar codes would get damaged due to hostileconditions machine-vision or OCR technologies are used as well. Neverthe-less, machine-vision technologies are more complex and thereby more expen-sive than bar-code technology. However both systems do not allow data tobe stored right at the object.
Today bar codes are predominantly used in manufacturing. All inspectedcompanies rely on this technology in one case or the other. The comparisonbetween RFID and bar code is an important part of our evaluation as labelsand readers for RFID require higher investments than corresponding bar-code equipment. Consequently, technical arguments or process requirementsmust account for the economic feasibility of an RFID adoption.
Accelerating Scan Processes
This use case exploits the property of RFID that no line of sight is needed.Thereby it allows for automatic reading of tags. Thus, tags can be readwithout workers’ intervention and the booking process can be automatedand thereby speeded up (2.3.1). If a line of sight does not affect the speed ofthe process, then bar codes could be used as well. Only when this use caserelies on the capability of RFID to detect tags without a line of sight is itnot possible to use any other Auto-ID technology.
Extending Scan Processes for Quality and Efficiency
Additional consistency checks are often added to the production steps forprocess safety (see 2.3.1, 2.3.2, 2.3.6, 2.3.5). Information about the contentof internal transfer units as well as configurations from terminals and theproduction planning are required to perform consistency checks.
At least an ID must be read to retrieve information about the internal
55
transfer units. This can be done using passive ID tags without user memoryor bar codes. Yet, in both cases additional database lookups are necessary toretrieve the required information. If the manufacturer uses bar codes, thenhe may also need a manual intervention to ensure a line of sight for the readprocess. This may cause additional workload and thereby additional cost. Incontrast, RFID tags with sufficient memory could enable automatic consis-tency checks without additional database queries and manual intervention.
Extending Scan Processes for Narrowing Recalls
Often the same degree of automation can be achieved with bar codes (2.3.1,2.3.5, 2.3.3). Yet, this would require modifications of the production processensuring line of sight read outs after each step. For instance, this could beachieved by using conveyors for transportation. However, such an investmentrenders a bar-code-based approach infeasible. However, in many other casesbar codes cannot be used, because of the hostile conditions on the plant floor(2.3.6, 2.3.4, 2.3.2). And even at 2.3.1 and 2.3.3 – here the conditions allowthe usage of bar codes – RFID is more feasible due to the use case reducingback-end interactions.
Reducing Paper Based Data Management
This use case comprises the idea to automatically communicate process databetween different operations, rather than using manually written papers. Thedata can be communicated on tags or via back-end systems.
Bar-code labels can theoretically be used in the same way as RFID tagswithout user memory. Yet, if process data is not manually written on paperanymore, workers must identify internal transfer units by their labels. UnlikeRFID, bar-code labels would require time-consuming, manual scanning withline of sight.
Automating Asset Tracking
Besides asset tracking this use case can also include container management.Assets are usually managed only within the boundaries of the company. How-ever, in one case study assets were also shipped between the manufacturerand its customers (2.3.4).
RFID technology could be applied to keep track of assets’ movements.Scanning without a line of sight allows for an easy observation of their po-sitions. Any RFID tag capable of holding an ID could be used for thisapplication. Yet, the tag price plays an important role, even though tagscan possibly be reused. One reason for that is the relatively high number
56

of assets and containers. Another reason is that assets may, and contain-ers nearly always do, leave the plant. Consequently, manufacturers cannotalways ensure that they are returned in due time.
However, using bar codes as identifiers would also be an option. Yet, a lineof sight must be ensured for the scanning process. This would cause severalmanual interventions and additional costs, i.e., workers’ time. Moreover, barcodes are less robust than RFID tags and may be rendered illegible or getlost. Thus, applying bar codes for asset management and container trackingis possible but may not be cost effective.
Reducing Back-end Interactions
With RFID it is possible to decentralize data storage and reduce the bot-tleneck to central databases. This scenario cannot be conducted with anyAuto-ID technology other than RFID. This is because one can store infor-mation on the object, e.g., routing data for the production.
Unifying Labels
This use case targets the challenge of handling labels for the shipment pro-cess. Different customers require different information and different labelformats for shipment. These different formats could be realized on the samekind of RIFD label if the customers agree on using RFID in the shipmentprocess. Information for each customer can then be encoded in the desiredformat and written to the RFID tags.
For this use case, tags with sufficient storage such as active tags or passivetags with user memory are required. Yet, labeling packing units with activeRFID tags is cost intensive. Thus, passive tags with user memory should bepreferred. Using bar codes is possible but has several disadvantages. Themanufacturer then needs high-quality printers and checks whether bar codesare readable (2.3.1). Printers need to be adjusted, with new labels added.And last but not least, bar codes can be ripped off or destroyed.
Summary
In Table 2.3 I summarize the use cases with regard to the possible utilizationof RFID and bar code. Bar code is predominantly used in manufacturingtoday. And during the case studies we repeatedly found that RFID shouldreplace the used bar-code technology. In Table 2.3 I further divide RFIDinto active tags (a. tag) and passive tags (p. tag). Regarding passive tags,we distinguish between tags that only hold an ID (only ID) and tags thatare equipped with additional user memory (mem.). Note that we consider
57
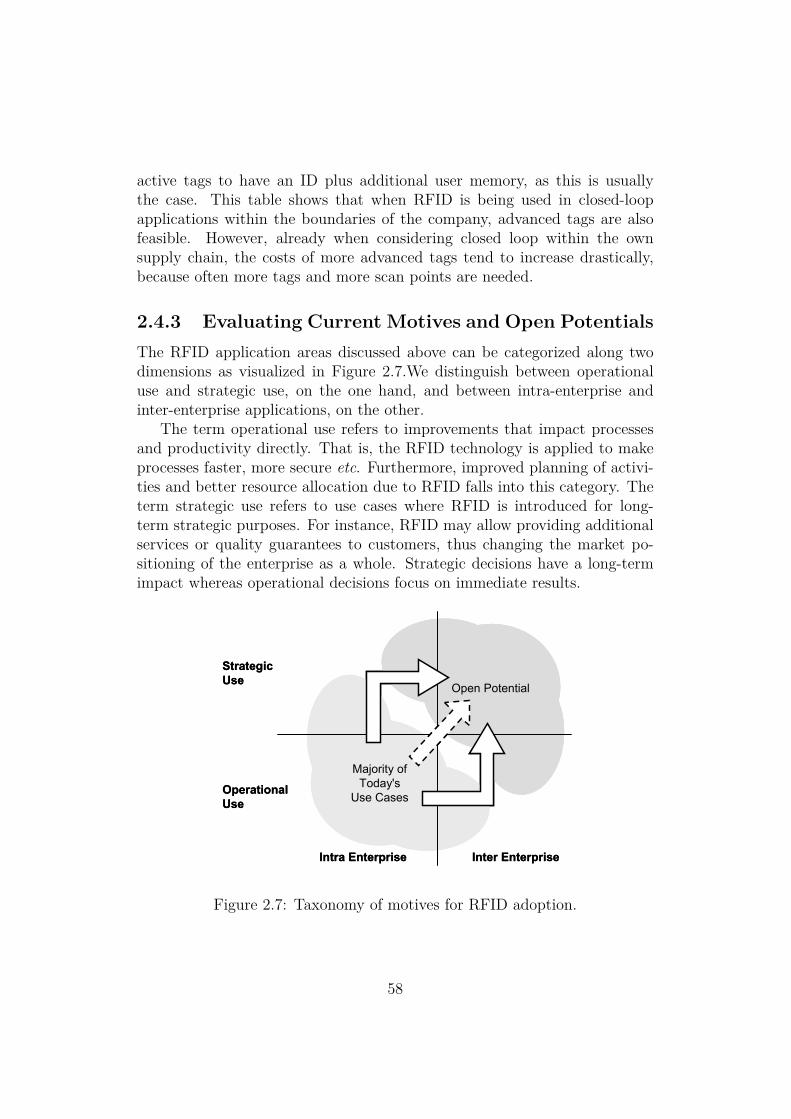
active tags to have an ID plus additional user memory, as this is usuallythe case. This table shows that when RFID is being used in closed-loopapplications within the boundaries of the company, advanced tags are alsofeasible. However, already when considering closed loop within the ownsupply chain, the costs of more advanced tags tend to increase drastically,because often more tags and more scan points are needed.
2.4.3 Evaluating Current Motives and Open PotentialsThe RFID application areas discussed above can be categorized along twodimensions as visualized in Figure 2.7.We distinguish between operationaluse and strategic use, on the one hand, and between intra-enterprise andinter-enterprise applications, on the other.
The term operational use refers to improvements that impact processesand productivity directly. That is, the RFID technology is applied to makeprocesses faster, more secure etc. Furthermore, improved planning of activi-ties and better resource allocation due to RFID falls into this category. Theterm strategic use refers to use cases where RFID is introduced for long-term strategic purposes. For instance, RFID may allow providing additionalservices or quality guarantees to customers, thus changing the market po-sitioning of the enterprise as a whole. Strategic decisions have a long-termimpact whereas operational decisions focus on immediate results.
Majority ofToday's
Use Cases
Inter Enterprise
Operational Use
StrategicUse
Intra Enterprise
Open Potential
Majority ofToday's
Use Cases
Inter Enterprise
Operational Use
StrategicUse
Intra Enterprise
Open Potential
Figure 2.7: Taxonomy of motives for RFID adoption.
58

Inter Enterprise
Operational Use
StrategicUse
Intra Enterprise
AIRCLU
COO
CAS
CONPAC
Figure 2.8: Motives for RFID adoption depending on the company.
Use cases for RFID in which the technology as well as the captured dataare only used within one organization fall into the category intra-enterpriseapplications. However, RFID holds the potential of applications that spanseveral steps in the supply chain. For instance, enterprises may exchange datathat is obtained using RFID. Also, RFID labels may remain on products andcould be reused by several companies downstream in the supply chain. Wecategorize these use cases as inter-enterprise applications. Figure 2.8 depictshow the cases fit into this taxonomy. The motives to use RFID determinethe position in the taxonomy chart for each case.
The manufacturer of airbags (AIR) aims to apply RFID for several rea-sons. One driver is the operational improvement of accelerating scan pro-cesses and thereby raising productivity. However, another argument was thatAIR expects some of its costumers to demand RFID adoption in the nearfuture and wants to be prepared. At this point AIR can potentially gainstrategic advantages by being ready for an RFID-enabled value chain. Thiscould be a distinguishing factor and competitive advantage to competitors.
AIR was also interested in using RFID for product labeling. KeepingRFID labels on the products would enable to improve operations at thecustomers’ side as well. This way AIR could provide additional services toits customers which may account for further strategic advantages. Becausethe main driver for RFID at AIR is to increase productivity on the plant
59
floor, this case belongs to the cluster of operational use within one enterprise.However, we also found aspects of strategic use for the enterprise as well asinter-enterprise operational use. Consequently the case of AIR overlaps withthese clusters in Figure 2.8.
For the manufacturer of sliding clutches (CLU) the main driver of itsRFID efforts is to improve product tracking in order to narrow recalls. Aminor reason was to obtain more accurate reports about the production sta-tus. Consequently, the case of CLU is clearly motivated by operational intra-enterprise use. However, narrowed recalls may have the positive side effect ofa better reception of CLU by customers. Therefore, it includes some strate-gic aspects as well. Another effect is that efficient handling of recalls reducesthe risk of disturbances in the production at the customers’ side. These sideeffects are reflected in the positioning of CLU in Figure 2.8.
The manufacturer of packaging (PAC) aims to use RFID to improve ma-terial tracking in the plant as well as to reduce the dependency on its ITback-end layer. Thus, the targeted improvements are operation and intra-enterprise. Similarly, the motives of the manufacturer of connectors (CON)are also merely for operational improvements within the company. In thiscase the main goal was to improve the material tracking on the plant floorand to create more accurate production reports. Since in the cases of CONand PAC only operational use within the enterprise is targeted, these casesbuild a group in Figure 2.8.
The motive for the RFID efforts at the manufacturer of cast pasts (CAS)is to improve asset tracking within the plant. This application is mainly oflocal and operational use. However, reducing search times for assets allowsCAS to produce more flexibly and at shorter notice which can lead to astrategic advantage (see Figure 2.8).
The RFID application at the manufacturer of engine-cooling modules(COO) is solely motivated by strategic issues. In this case no apparent oper-ational benefits result from the use of RFID. Instead, RFID was introducedon a customer’s demand. Meeting this requirement is a strategic decision ofCOO. Additionally the case has some aspect of inter-enterprise collaboration,because COO provides the captured RFID data to the respective customers.However, the option is currently rarely used. In Figure 2.8, the case of COOis placed accordingly.
As visualized in Fig 2.8 the motives for RFID applications in the investi-gated cases are dominated by local operational improvements. That is, thetechnology helps to improve processes and productivity on the plant floor.With regards to planning, RFID-enabled decisions are also mainly of localscope. In most cases only locally obtained RFID data are used and deci-sions are made for local processes. Using RFID for strategic issues or across
60
company boundaries is rarely targeted.This focus on operational, intra-enterprise applications neglects the po-
tential of RFID technology to be used in many steps of the supply chain.Companies may collaborate on the operational level to use RFID in severalsteps of the value chain [Günther et al., 2006]. Operational use across en-terprises can be enabled due to the reuse of RFID tags. One option is topermanently leave RFID tags on the products as they move through thesupply chain.
Another option is to reuse the tags in a closed loop but extending theloop across several enterprises. This does not only supports seamless integra-tion of processes but also enables cost-sharing models for hardware expenses[Ivantysynova and Ziekow, 2007]. Beyond this, RFID use across enterprisesmay strengthen the strategic position of the supply chain as a whole. Forinstance, cooperating partners can use the technology to provide fine-grainedproduct traceability and quality assurances across the whole supply chain.Moving towards this opportunity may become a distinguishing factor andcompetitive advantage for innovative manufacturers in the near future.
A problem when considering RFID introduction in a supply chain is thatcosts and benefits are not always correlated. Some participating companiesmay incur considerable costs that outweigh the local benefits, and vice versa.This can lead to a classical prisoner’s dilemma: It could well be possible thatan existing supply chain could gain considerably from introducing RFID tech-nology. These gains, however, are never realized because some participantswould need to incur costs that are not justifiable in comparison to their localbenefits.
As a result, they decide – for completely rational reasons – not to adoptthe new technology. One way to break this deadlock is to negotiate com-pensation payments between different participants in the supply chain withthe objective of distributing the global benefit fairly among the participants.These compensation payments do not have to be monetary – in the retaildomain, certain types of data (e.g., sales data about one’s own products orthe products of one’s competitors) are also common currency.
2.5 ConclusionGenerally, the case studies show that RFID technology holds many promisesfor improving manufacturing processes while also exhibiting new challenges.The automation of object identification processes through RFID can helpto increase the efficiency by reducing scan times and manual work, reduceerrors due to manual data entry and analysis, and improve product tracking
61

and tracing. Detailed data tracks can help increasing product quality andnarrowing the extent of necessary product recalls.
In comparison to bar-code technology, RFID does not require a line ofsight for scanning, enables simultaneous batch scanning, does not require thetechnological effort for high-quality printing, and is more resistant to physicalinfluences such as dirt or scratches. Avoiding problems related to unreadablebar codes may help to reduce the number returns and penalties and increasecustomer satisfaction, especially in supply chains operating according to thejust-in-sequence paradigm.
Five out of six companies’ motives for an RFID adoption are purely op-erational uses within their enterprise. That is, they would like to use thistechnology to improve processes and productivity on the plant floor. Motiva-tions to use RFID as a strategic enabler of data exchange between enterprisesalong the supply chain were found much less frequently. However, this focuson operational, intra-enterprise applications fails to exploit the full potentialof RFID technology.
Despite the high potential of RFID technology, the manufacturer has toconsider a number of issues before starting an implementation. The nextchapter analyzes these challenges.
62
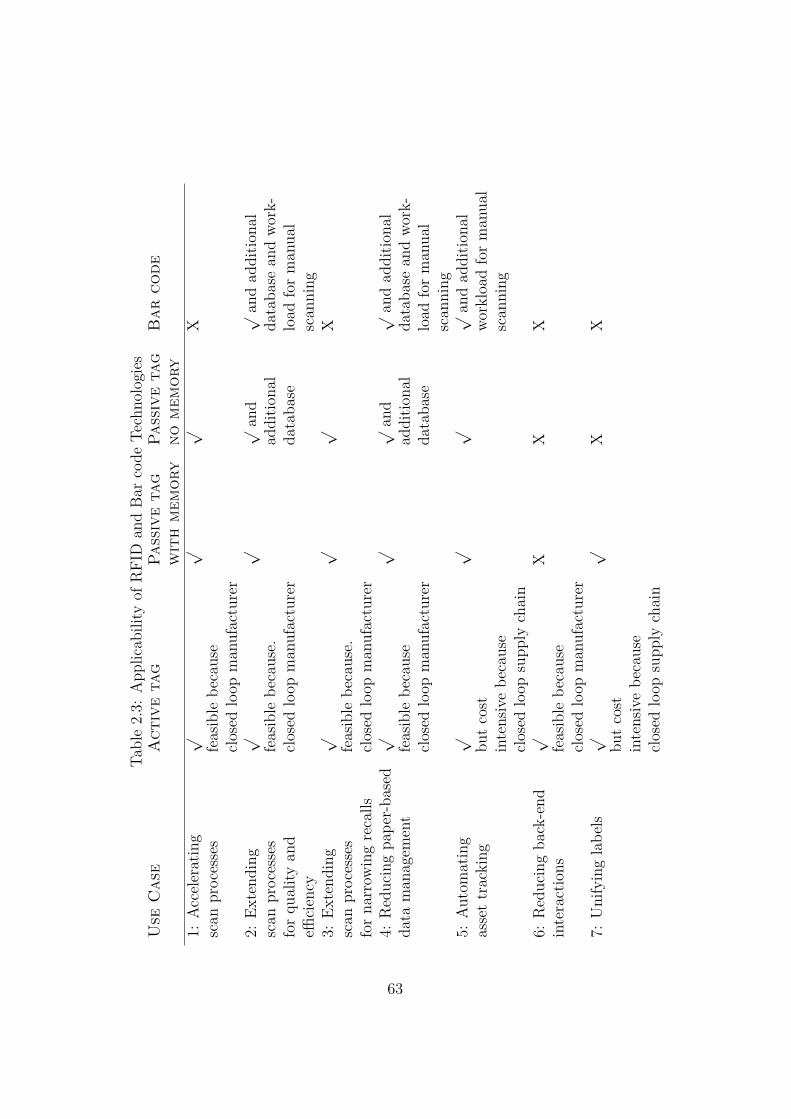
Table2.3:
App
licab
ility
ofRFI
Dan
dBa
rcode
Techno
logies
Use
Cas
eA
ctiv
eta
gPa
ssiv
eta
gPa
ssiv
eta
gB
arco
dew
ith
mem
ory
nom
emor
y1:
Accelerating
√√
√X
scan
processes
feasible
because
closed
loop
man
ufacturer
2:Ex
tend
ing
√√
√an
d√
andad
ditio
nal
scan
processes
feasible
because.
additio
nal
databa
sean
dwo
rk-
forqu
ality
and
closed
loop
man
ufacturer
databa
seload
forman
ual
efficiency
scan
ning
3:Ex
tend
ing
√√
√X
scan
processes
feasible
because.
forna
rrow
ingrecalls
closed
loop
man
ufacturer
4:Reducingpa
per-ba
sed√
√√
and
√an
dad
ditio
nal
data
man
agem
ent
feasible
because
additio
nal
databa
sean
dwo
rk-
closed
loop
man
ufacturer
databa
seload
forman
ual
scan
ning
5:Autom
ating
√√
√√
andad
ditio
nal
assettracking
butcost
workload
forman
ual
intensivebe
cause
scan
ning
closed
loop
supp
lychain
6:Reducingba
ck-end
√X
XX
interactions
feasible
because
closed
loop
man
ufacturer
7:Unifyinglabe
ls√
√X
Xbu
tcost
intensivebe
cause
closed
loop
supp
lychain
63
Chapter 3
Challenges of Embedding RFIDinto Shop-Floor Processes
This chapter evaluates which challenges the manufacturer has to face whenapplying RFID in shop-floor processes. All challenges are derived from thecase studies described in Chapter 2. These challenges include software as wellas hardware issues. Section 3.1 presents a reference model for productionprocesses and the management of the corresponding production data. Themodel enables me later to better describe required RFID functionalities andconstraints for IT infrastructures. I conducted the work for this chaptertogether with Oliver Günther and Holger Ziekow. We published the resultsin Ivantysynova et al. [2008a].
Section 3.2 discusses diverse difficulties and impediments of using RFIDhardware in hostile conditions on the shop floor. Then Section 3.3 describesthe functional requirements of RFID infrastructures. In the subsequent Sec-tion 3.4 we discuss constraints for IT infrastructures when integrating RFIDin manufacturing. This goes along with an overview of upcoming paradigmsfor data processing that are useful in the context of RFID and manufacturing.Section 3.5 concludes this chapter.
3.1 Reference Model for Production Pro-cesses
The reference model for production captures typical activities on the plantfloor and the corresponding data management issues. We derive this modelbecause it will later enable us later to describe required RFID functionalitiesand constraints for IT infrastructures along this model. The model focuseson activities that may be affected by the introduction of RFID.
64
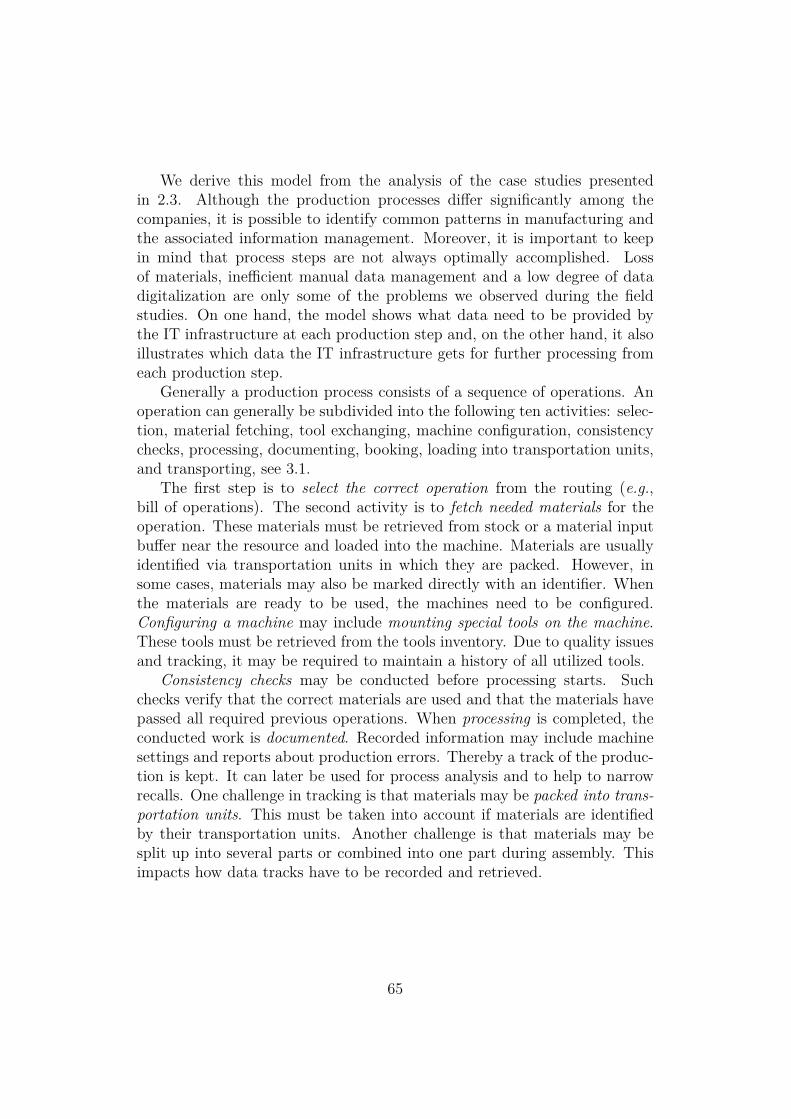
We derive this model from the analysis of the case studies presentedin 2.3. Although the production processes differ significantly among thecompanies, it is possible to identify common patterns in manufacturing andthe associated information management. Moreover, it is important to keepin mind that process steps are not always optimally accomplished. Lossof materials, inefficient manual data management and a low degree of datadigitalization are only some of the problems we observed during the fieldstudies. On one hand, the model shows what data need to be provided bythe IT infrastructure at each production step and, on the other hand, it alsoillustrates which data the IT infrastructure gets for further processing fromeach production step.
Generally a production process consists of a sequence of operations. Anoperation can generally be subdivided into the following ten activities: selec-tion, material fetching, tool exchanging, machine configuration, consistencychecks, processing, documenting, booking, loading into transportation units,and transporting, see 3.1.
The first step is to select the correct operation from the routing (e.g.,bill of operations). The second activity is to fetch needed materials for theoperation. These materials must be retrieved from stock or a material inputbuffer near the resource and loaded into the machine. Materials are usuallyidentified via transportation units in which they are packed. However, insome cases, materials may also be marked directly with an identifier. Whenthe materials are ready to be used, the machines need to be configured.Configuring a machine may include mounting special tools on the machine.These tools must be retrieved from the tools inventory. Due to quality issuesand tracking, it may be required to maintain a history of all utilized tools.
Consistency checks may be conducted before processing starts. Suchchecks verify that the correct materials are used and that the materials havepassed all required previous operations. When processing is completed, theconducted work is documented. Recorded information may include machinesettings and reports about production errors. Thereby a track of the produc-tion is kept. It can later be used for process analysis and to help to narrowrecalls. One challenge in tracking is that materials may be packed into trans-portation units. This must be taken into account if materials are identifiedby their transportation units. Another challenge is that materials may besplit up into several parts or combined into one part during assembly. Thisimpacts how data tracks have to be recorded and retrieved.
65
Raw materials are ready
Task Selection
Production step completed
Material Fetching
Tool Exchanging
MachineConfiguration
Processing
Documenting
Booking
Loading to new transportation units
Transporting
Consistency Checks
ProductionPlan
ProductionRecord
ProductionPlan
InventoryList
InventoryList
Routing
ProductionRecord
ProductionRecord
ProductionRecord
InventoryList
Legend
Data
Event
Function(Activity)
Process Flow
Data Flow
Figure 3.1: Reference model for production.
An operation usually ends with booking the finished tasks into the MESin the middle layer. The data may be required for consistency checks inthe following operations. Then, the processed parts or WIP are transportedto the next operation, the stock, or a material buffer on the plant floor.
66
Information about the materials’ locations may need to be recorded in someinventory list or may be derived from their current status in the production.
After the production has been completed, the finished products are trans-ferred to a shipping area where they are packed and labeled for shipment. Aspecial challenge is that different customers may demand different labels anddifferent information on the labels. This may comprise different numberingand coding schemes for identification- and product-related data.
Note that a particular production process may only implement a subset ofthe described activities. For instance, in many cases it may not be necessaryto exchange tools on the machines. Thus, apart from the processing itself,each activity is optional in the reference model. Not all actions necessarilyoccur in every case and others may be added. Still, the reference model mayserve as a general pattern which approximates most production processes.All activities in the derived model may be supported by RFID or can influ-ence RFID adoption. A software system supporting RFID in manufacturingshould certainly take the steps of this reference model into account.
3.2 Hindrances on the Shop FloorAs the case studies in the previous Chapter 2 show, plant floors of manu-facturing companies are often hostile environments with extreme conditions,e.g., 2.3.1, 2.3.4, 2.3.6. Challenging factors include dirt, heat, presence ofmetal, limited space and others. RFID solutions for manufacturing must beable to cope with such conditions. Yet, no standard solutions can serve therequirements of all production environments. Instead, an individual solutionmust be found for each case. In this section we discuss general hardwareissues for RFID implementations in manufacturing. In particular we focuson the following: hostile physical conditions, presence of metal, demand forwireless communication, and processes in close spatial proximity.
3.2.1 Hostile Physical ConditionsIn many of the studied companies, products are exposed to extreme condi-tions, of which heat occurred most frequently 2.3.1, 2.3.6. Special casingsor foils can protect RFID tags from external influences. Protection againstheat ensures slow heat conduction from the environment to the tag. Thereby,the temperature at the tag can be kept below its tolerance threshold if theexposure is only temporary. For Gen 2 tags the maximal tolerance for heatis 85◦C and correct operation is ensured up to 65◦C. Consequently, a pro-tection is needed for temperatures above 85◦C. Some RFID tags are already
67
shipped in protection cases. Others can be wrapped in protective materialsby so-called converters (converters add materials to RFID inlays and producecomplete labels).
3.2.2 Presence of MetalMany metal objects are present on the plant floor of the investigated plants,e.g., 2.3.2 – 2.3.4, 2.3.6. For instance, transportation units, machines oreven the products themselves can be made out of metal. The presence ofmetal can influence communication with RFID tags due to signal attenuation,reflection, detuning, and eddy currents. How the communication is influenceddepends on the communication technology of the physical layer.
Ultra-high-frequency tags communicate using a backscatter technology[Finkenzeller, 2003]. High-frequency and low-frequency tags communicateby inductive coupling in the near field. In general, ultra-high-frequencytags suffer less form detuning effects and distortions due to eddy currentsthan low-frequency and high-frequency tags do. By contrast, near-field-communicating tags face fewer problems caused by reflected waves. Suchwaves may cancel out a signal totally. Also, ultra-high-frequency signals aremore actuated when passing materials. This holds especially for materialscontaining water. Yet, all frequencies are shielded by metal.
Problems caused by detuning and eddy currents can be overcome byapplying an isolation layer between the metal object and the tag. Reflectionsby metal objects in the near can be blocked by RF absorbers. Also, reflectionsmay even be beneficial to direct signals around metal object which wouldotherwise block the communication. Which effects have the most influencedepends on the particularities of the application environment. Thus, onlyfield tests can fully clarify which hardware setup is most suitable.
3.2.3 Demand for Wireless CommunicationIntroducing new scan points and sensor devices on the plant floor requiresthe establishment of new communication channels. This can either be anextension of existing channels or the introduction of new communicationmeans. Fixed wires may be sufficient for stationary scan points. However,wireless communication is necessary if mobile hand readers are applied, see2.3.4. Furthermore, the number of devices may render wired communicationchannels infeasible. This is especially the case if large numbers of sensor tagsare installed on the plant floor. For easy deployment in the target setting,sensor tags are designed to work independently of fixed infrastructures andfacilitate establishments of wireless ad-hoc networks.
68

The wireless medium poses numerous challenges which are already knownfrom other application domains. Security problems, bandwidth changes andenergy issues of battery-powered devices are just some of them. Further-more, the diversity on the physical layer must be considered in the systemdesign. Devices with different operation frequencies and communication pro-tocols must be integrated via gateways and hubs which bridge channels withdifferent communication technologies.
3.2.4 Processes in Close Spatial ProximityAt some plant floors, different production steps take place in close physicalproximity. In one of the investigated plants, different assembly steps havebeen conducted within a one-meter distance (2.3.1). Associating an RFIDread event with the correct process step may be challenging if several stepsare performed within the range of a reader. The read range for tags that com-municate in the near field is generally easier to control than for backscattertags.
For tags which use inductive coupling the read range is limited to thesize of the near field. High-frequency tags can typically be read out withinabout a one-meter distance. The relative long range of seven meters andthe possibility of reflections may cause ultra-high-frequency tags to be readfrom unexpected positions. In general, this makes ultra-high-frequency tagsmore difficult to handle than low-frequency and high-frequency tags if itemsin different process steps are physically close. However, directional antennasand limitations in the signal strength can help to restrict read outs of ultra-high-frequency tags to the point of interest.
3.3 Required RFID FunctionalitiesIn this section we describe functional building blocks which are needed forIT infrastructures supporting RFID. Prominent middleware solutions likeBornhövd et al. [2004] provide modules that support these functionalities to acertain extent. Note that in this section, we discuss the software functionalityindependently of our use cases. We address generic building blocks that aretypically required in RFID infrastructures. Therefore, this section applies toRFID setups in logistics as well as in manufacturing, or in other applications.Special requirements for RFID systems in manufacturing are discussed inthe next Section 3.4. IT infrastructures supporting RFID need the followingfunctional components: filtering and enriching RFID data, storing RFIDdata, exchanging RFID data (sharing information along the supply chain),
69
and detecting events in RFID data. We now describe each component indetail.
3.3.1 Filtering and Enriching RFID DataSeveral operations must be applied to make use of RFID data. These arefiltering of events, enriching RFID data with process semantics and addi-tional information, as well as inference on the data and reactions to events.Filtering RFID data takes place on the edge or middle layer, e.g., duringpre-processing or complex pre-processing. Read errors like double reads arefiltered during pre-processing, see Figure 3.2. This is usually done by thedevice controller which provides the software interface to the readers. RFIDreaders communicate via proprietary protocols with the device controller. Ifpre-processing and complex pre-processing are in different software modules,data can be exchanged via the PML standard [Floerkemeier et al., 2003].During the complex pre-processing RFID data must be filtered with regardto the events of interest. At a gate, for instance, appearance and disappear-ance events may be dropped and replaced by one aggregate passing event.
If additional information for an RFID tag is available, this informationmust be associated with the read event. This can be, for example, infor-mation in the user memory of a tag or corresponding sensor measures. Onhigher levels the read events must be enriched with process semantics. Thatis, for each event which aspect of the production process is reflected needsto be inferred.
For implementing business logic based on RFID data, we further evaluatethe event data after it has been filtered and enriched. This is done by rulesthat define actions to be conducted when certain observations have beenmade. Such rules can operate on an intermediate storage holding RFID datathat were collected during a certain period. Alternatively, the rules couldrun directly on the input stream of the read events. Any other system couldbe informed via application-level events [short ALE EPCglobal, 2005] andactions could be triggered if certain predefined conditions occur.
The ALE standard describes how client applications can access middle-ware in order to read data from various sources. The ALE interface allowsclient applications to be completely agnostic of the reader infrastructure,e.g., the number of readers or their make and model. In addition, it providesmeans for client applications to specify what to do with EPC data, e.g., howto filter or aggregate the data.
70
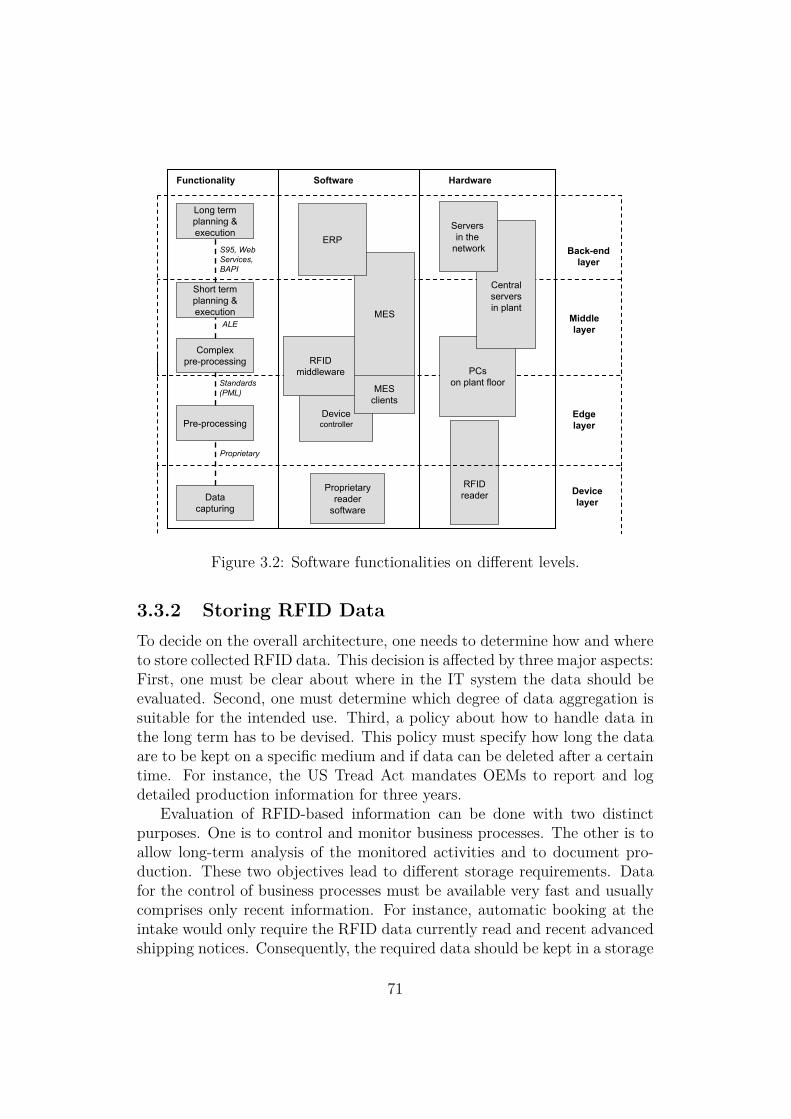
Datacapturing
Proprietaryreader
software
Pre-processing
Short termplanning &execution
Complexpre-processing
Long termplanning &execution
Devicecontroller
RFIDmiddleware
MES
ERP
RFIDreader
PCson plant floor
Centralserversin plant
Servers in the
network
Functionality Software Hardware
Edgelayer
Back-endlayer
Devicelayer
Proprietary
Standards(PML)
ALE
S95, WebServices,BAPI
MESclients
Middlelayer
Figure 3.2: Software functionalities on different levels.
3.3.2 Storing RFID DataTo decide on the overall architecture, one needs to determine how and whereto store collected RFID data. This decision is affected by three major aspects:First, one must be clear about where in the IT system the data should beevaluated. Second, one must determine which degree of data aggregation issuitable for the intended use. Third, a policy about how to handle data inthe long term has to be devised. This policy must specify how long the dataare to be kept on a specific medium and if data can be deleted after a certaintime. For instance, the US Tread Act mandates OEMs to report and logdetailed production information for three years.
Evaluation of RFID-based information can be done with two distinctpurposes. One is to control and monitor business processes. The other is toallow long-term analysis of the monitored activities and to document pro-duction. These two objectives lead to different storage requirements. Datafor the control of business processes must be available very fast and usuallycomprises only recent information. For instance, automatic booking at theintake would only require the RFID data currently read and recent advancedshipping notices. Consequently, the required data should be kept in a storage
71
that may be relatively small but must be fast.Long-term data analysis and business intelligence require different fea-
tures. Typical tasks can be, for example, an investigation of how overallperformance developed over time. Such tasks do not have demands for real-time data. Instead, a database is needed to store the data in the long term.Data historians are tailored to store large amounts of time-stamped data.Using a data historian would allow to store information from every RFIDread out. Such fine-grained information could be useful in detailed analysisof the production processes. Mining tools could use the rich data source tosearch for patterns in the data and for identifying potential improvements inproduction.
Another way of data analysis is provided by data warehouses. Such soft-ware systems support data analysis by advanced tools for reporting and vi-sualization (e.g., OLAP cubes). However, reports in data warehouses do notdisplay raw data. Instead, the data is aggregated and evaluated to showkey performance parameters. The raw read events must be mapped to thecorresponding process step and enriched with context information in orderto reflect the process semantics. Thus, data warehouses work on an excerptof the complete data set.
In case of recalls, detailed information from the history is needed. De-pending on the type of possible recalls perhaps no aggregation is suitable.For instance, the US Tread Act mandates OEMs to report and log detailedproduction information for three years. Then fine-grained event data mustbe kept in a database (e.g., data historian) at least for the time a recallcan occur. That is, the stored data must provide all information about theproduction process of parts which could be called back.
3.3.3 Exchanging RFID DataFully exploiting the potential of RFID may involve the exchange of capturedRFID data with business partners, i.e., sharing information along the supplychain. For instance, since January 2005 the regulation on consumer protec-tion (EC) No. 178/2002 of the European Parliament and of the Council hasforced food companies to ensure a seamless traceability for all food and theiringredients – from the producer to the wholesalers and retailers [Cox andCamps, 2002]. Increasing the transparency across organizational borders al-lows for optimizing the collaboration. EPCglobalTM is developing the EPCNetwork for this purpose [EPCglobal, 2005]. The network will contain ser-vices for discovering and accessing information.
Several issues need careful consideration before RFID data can be ex-changed with business partners. First, it must be decided which information
72
should be available to whom. This requires management of roles and rightsfor all partners. Also, it is not sufficient to just provide the captured RFIDdata. The information must be aggregated and semantically enriched to bereasonably interpretable for the business partners.
Furthermore, the exchange format and the communication model mustbe determined. EPCglobalTM has proposed the Physical Markup Language(PML) for exchanging RFID related data [Floerkemeier et al., 2003]. ThisXML-based language allows to associate RFID reads with additional datasuch as sensor measures. It is used to encode the output of RFID readersin existing middleware solutions [Bornhövd et al., 2004]. However, data ex-change on enterprise level may go beyond using pure PML or may be realizedbased on different standards.
With the specification of EPC Information Services (EPCIS), EPCglob-alTM has released another standard that is relevant for exchanging RFIDdata [EPCglobal, 2007]. EPCIS leverage exchange of data that is related toElectronic Product Codes (EPC) [EPCglobal, 2006]. The standard specifiesdata types as well as query interfaces and describes the use of an EPCIS ina framework for exchanging RFID data.
EPCIS supports both, interfaces for ad-hoc queries, and a callback inter-face for standing queries. It needs to be decided whether information shouldbe pushed via callback functions to the recipient once they are available orif data should be queried on demand via ad-hoc requests. This trade off canbe decided on the frequencies in which data would be requested and pushed.Pushing information can reduce network traffic in case of high informationdemand, while the opposite is the case when demand is low.
Another important aspect is security. If trusted partners are getting in-sight into business operations, competitors may try to spy on the transferredinformation. Thus, it is highly recommendable to conduct a detailed securityanalysis before deciding on a concrete information-sharing arrangement.
3.3.4 Detecting Events in RFID DataIt is necessary to evaluate the semantics of RFID read events in order to usethe data for monitoring and controlling production processes. Evaluatingthese semantics is generally straightforward in logistics applications. Forinstance, the semantics of reading an object at the inbound gate is that theobject has been taken in; an object which is read repeatedly by a smart shelfis stored in this shelf.
Processes on the shop floor can add complexity to the evaluation of thesemantic. To be more precise: Observing an object at a certain point maynot be sufficient for determining its status in the process. For example,
73
registering a certain process step may involve detecting an object at themachine, registering a disappearance as it is loaded to the machine, checkingthat the machine is running, and observing the object to appear again.
Evaluating such complex events requires explicit domain knowledge. Thatis, a model of how a series of read events adds up to a complex event andhow this is mapped to certain steps in the production process is needed.Modeling and evaluating such domain knowledge should be supported bysoftware systems for embedding RFID in manufacturing applications. Thiscomprises a language for expressing evaluation rules and software componentsto execute these rules. Technologies of complex event processing (CEP) aresuitable for processing such rules [Luckham, 2001].
A complex event rule comprises three parts: a pattern, a constraint, andan action part. The pattern part and the constraint part together describethe complex event that should be detected. The action part defines howthe system must react when the defined event occurs. In that sense, CEPrules are similar to Event Condition Action rules (ECA) in active data bases[Paton et al., 1998]. However, active databases focus on in-database eventsand do not support temporal constraints in RFID-specific queries well [Wanget al., 2006, Wu et al., 2006].
Dedicated approaches for detecting complex events often use finite-stateautomata [e.g., Gehani et al., 1992, Coral8] or Petri Nets [e.g., Gatziu andDirtrich, 1994]. Particularities of RFID-specific applications for CEP havebeen targeted in recent research [Wang et al., 2006, Wu et al., 2006, Gyll-strom et al., 2007]. For RFID solutions in manufacturing it must be de-termined what kind of events the software system should detect and whatevent-detection technology is implemented in the software system.
The streaming nature of RFID data must be considered as well. Readevents float into the back-end layer as continuous data streams. Read outswhich belong to one complex event are usually distributed over time. Thus,modeling processing rules requires a windowed operation on event streams.Research projects like STREAM [Arasu et al., 2003] and AURORA [Abadiet al., 2003] have targeted the issue of modeling and executing stream queries.Even though they lack expressiveness for complex events, results may beadopted to RFID in manufacturing.
In Jaroszewicz et al. [2007] we developed an algorithm that correctlymatches imperfectly documented incoming data streams to large databaseswithout seeing the whole steam. By this it is possible to identify likely corre-spondences between attributes of the stream and the database. However, ex-act calculation of these similarities requires processing of all database records,which is infeasible for data streams. Therefore we devise a fast matching al-gorithm that uses only a small sample of records, and is yet guaranteed to
74

find a matching that is a close approximation of the matching that would beobtained if the entire stream were processed. The method can be applied toany given (combination of) similarity metrics that can be estimated from asample with bounded error. This procedure enables us to detect occurringevents in RFID-data streams.
3.4 Constraints for IT InfrastructuresLarge-scale RFID applications are already in use, for instance, in logistics.Such applications are supported by existing middleware solutions for cap-turing and processing RFID data. The typical use cases in manufacturingdescribed above pose new requirements for the IT infrastructure. In this sec-tion we summarize technological issues which must be respected by softwaresystems for a successful RFID integration in the manufacturing context. Thiscomprises middleware issues that are important for any RFID integration inthe business context.
Additionally, we focus on the particular requirements of RFID applica-tions on the plant floor. This covers aspects of integration with other sys-tems, paradigms for data processing as well as architectural and functionalrequirements. In particular the following six issues for IT systems were de-rived: distributing business logic and data, supporting heterogeneous datasources, dealing with noise and uncertainty, supporting process analysis, sup-porting asset tracking, and providing RFID data to components of ISA-95Level 3.
They all aim to support RFID integration on the plant floor. In thefollowing we describe each in detail.
3.4.1 Distributing Business Logic and DataDistributing business logic and decoupling it from the back-end layer was anexplicit demand in some of the investigated enterprises (2.3.1, 2.3.6). Onereason was the aim to improve reliability of the IT infrastructure by decen-tralization. For decentralized processes, the back-end layer would no longerbe a single point of failure and the overall reliability would be improved.For instance, production control and consistency checks could be conductedindependently of the back-end layer on PCs on the shop floor. In this setup,a failure of the back-end database or the communication network would havea smaller impact on the production. Besides pushing business logic to theedge layer on the shop-floor PCs, it is even possible to push queries on theRFID-data streams into the device layer. This is possible when the data is
75
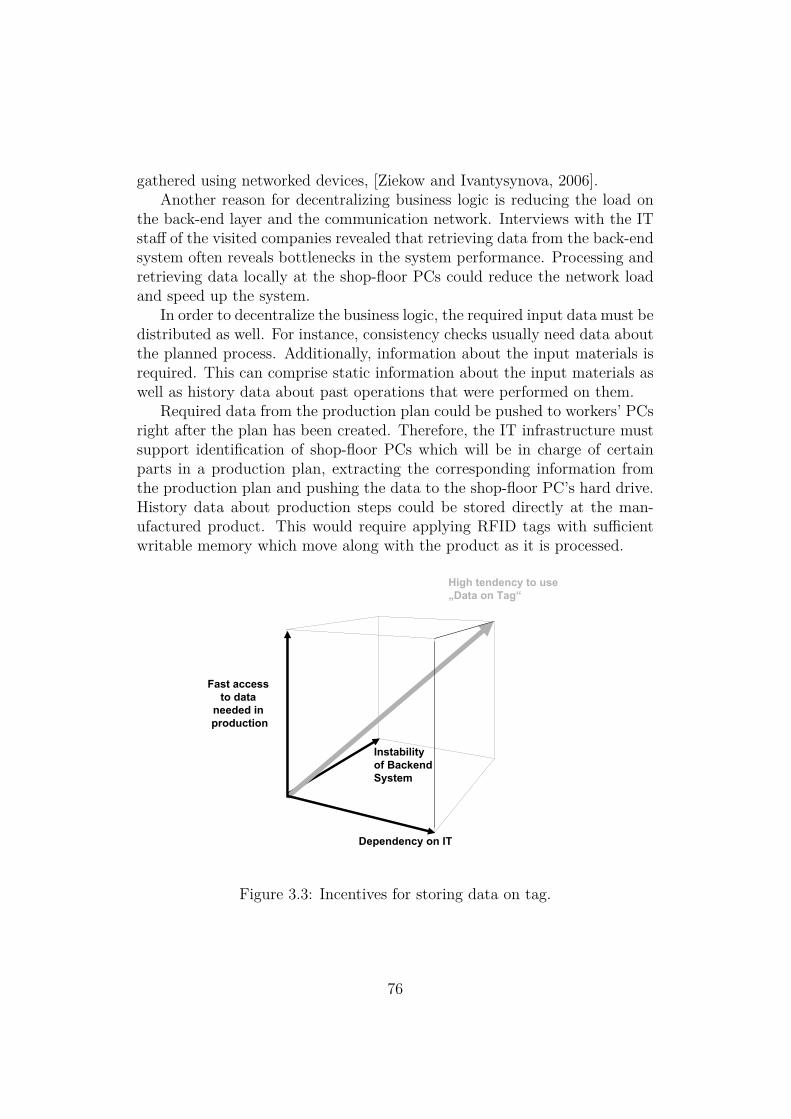
gathered using networked devices, [Ziekow and Ivantysynova, 2006].Another reason for decentralizing business logic is reducing the load on
the back-end layer and the communication network. Interviews with the ITstaff of the visited companies revealed that retrieving data from the back-endsystem often reveals bottlenecks in the system performance. Processing andretrieving data locally at the shop-floor PCs could reduce the network loadand speed up the system.
In order to decentralize the business logic, the required input data must bedistributed as well. For instance, consistency checks usually need data aboutthe planned process. Additionally, information about the input materials isrequired. This can comprise static information about the input materials aswell as history data about past operations that were performed on them.
Required data from the production plan could be pushed to workers’ PCsright after the plan has been created. Therefore, the IT infrastructure mustsupport identification of shop-floor PCs which will be in charge of certainparts in a production plan, extracting the corresponding information fromthe production plan and pushing the data to the shop-floor PC’s hard drive.History data about production steps could be stored directly at the man-ufactured product. This would require applying RFID tags with sufficientwritable memory which move along with the product as it is processed.
Instability of Backend System
Dependency on IT
Fast access to data
needed in production
High tendency to use„Data on Tag“
Figure 3.3: Incentives for storing data on tag.
76
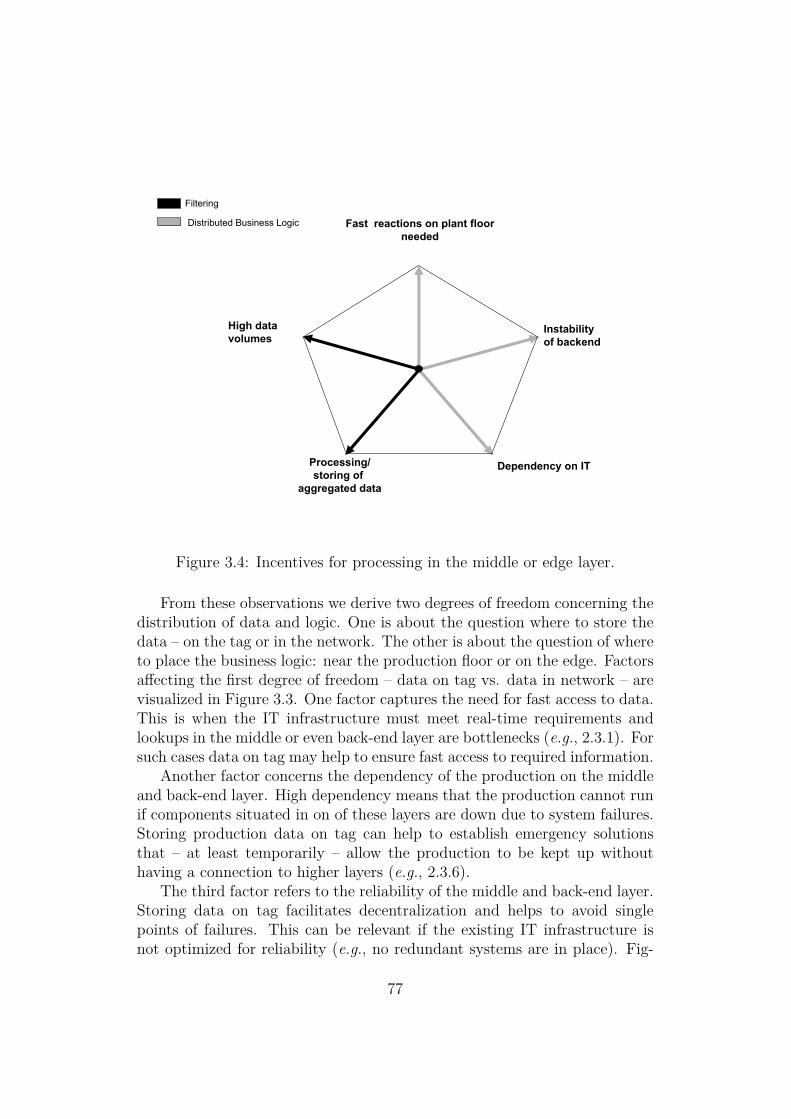
Filtering
Distributed Business Logic Fast reactions on plant floor needed
Instabilityof backend
Dependency on IT
High data volumes
Processing/storing of
aggregated data
Figure 3.4: Incentives for processing in the middle or edge layer.
From these observations we derive two degrees of freedom concerning thedistribution of data and logic. One is about the question where to store thedata – on the tag or in the network. The other is about the question of whereto place the business logic: near the production floor or on the edge. Factorsaffecting the first degree of freedom – data on tag vs. data in network – arevisualized in Figure 3.3. One factor captures the need for fast access to data.This is when the IT infrastructure must meet real-time requirements andlookups in the middle or even back-end layer are bottlenecks (e.g., 2.3.1). Forsuch cases data on tag may help to ensure fast access to required information.
Another factor concerns the dependency of the production on the middleand back-end layer. High dependency means that the production cannot runif components situated in on of these layers are down due to system failures.Storing production data on tag can help to establish emergency solutionsthat – at least temporarily – allow the production to be kept up withouthaving a connection to higher layers (e.g., 2.3.6).
The third factor refers to the reliability of the middle and back-end layer.Storing data on tag facilitates decentralization and helps to avoid singlepoints of failures. This can be relevant if the existing IT infrastructure isnot optimized for reliability (e.g., no redundant systems are in place). Fig-
77
ure 3.4 visualizes the second degree of freedom, which is about processingthe business logic locally vs. at the edge.
We identified five factors of influence, each reflected in a dimension of thepentagon in Figure 3.4. Three of these factors are identical to the factors inthe cube described above. This is because identified use cases for data ontag often coincide with the deployment of business logic in the middle layer.For instance, decentralization by means of data on tag is only beneficial ifthe processing is decentralized as well.
The remaining two factors are high data volumes and processing/storingof aggregated data. These factors refer to issues of data pre-processing interms of filtering and aggregation. Reducing the amount of data by meansof filtering and aggregation is a necessity if data volumes are high. Pushingthese operations to the edge layer can help to avoid bottlenecks and improvescalability of the system. The higher the data volumes are, the higher theincentive to push pre-processing to the edge or even device layer.
Another reason for pre-processing and aggregation is that raw data areoften not of interest. Instead, semantically enriched and meaningful infor-mation must be extracted from the stream of input data. Performing relatedoperations in the middle layer, avoids forwarding unnecessary information tothe back-end layer and reduces the overall system load.
Altogether five factors support the tendency toward pushing processing tolower layers. These are depicted in the pentagon in Figure 3.4. Properties ofa given production environment span a surface in this pentagon. The biggerthis surface is, the higher the motivation of pushing business logic towardlower layers.
3.4.2 Supporting Heterogeneous Data SourcesOne driver for adopting RFID in manufacturing is the demand for gettingbetter insights into production processes (2.3.2, 2.3.6). For instance, the de-mand for applications which help to address quality issues was mentionedin several of the case studies (2.3.6). Such applications need to keep trackof each object in the production along with corresponding machine settingsand sensor measurements of environmental conditions. Furthermore, controlapplications that evaluate production data in real time would have accessto these information sources as well. For instance, the investigated manu-facturer of cooling frames uses optical sensors to automatically route faultyproducts to a separate control station.
To enable such applications, RFID and sensor data must be correlatedwith information from different data sources. Therefore, a software moduleis needed that supports numerous ways of data acquisition and provides an
78
integrated view on the collected information. Besides interfaces for RFIDand bar-code readers, interfaces for sensor networks, relational databases,XML databases and machines on the plant floor are relevant as well.
3.4.3 Dealing with Noise and UncertaintyUsing RFID and sensor data to monitor processes on the plant floor requiresadvanced evaluation of the raw input data. Sensor data are inherently over-laid with noise and distorted by measurement errors. Thus, software forusing sensor data in business processes must take the imperfect nature of theinput data into account. This can be done by various filtering algorithms.A simple example would be to apply low-pass filtering over a set of inputdata or to build the average over multiple measurements in order to suppressnoise.
Like sensor measurements, data from RFID readers also include errors.These errors are usually not corrupted read outs of RFID tags, since thoseerrors are filtered out by checksums in the communication protocol in thereader. However, readers can miss RFID tags within their read range. Thisresults in the false observation that the respective tag is absent (false nega-tive).
3.4.4 Supporting Process AnalysisIn several investigated plants, the predominant reason for considering RFIDadoption was to be able to better narrow recalls, see 2.4.1. This is becauseRFID eases scan processes and makes data capturing in more situationsfeasible than other Auto-ID technologies do. Fine-grained data tracks wouldenable to determine faulty products. Due to the importance of narrowingrecalls, software systems that support RFID applications in manufacturingmust provide special analysis tools.
Another major potential of applying RFID on the plant floor is to gainmore insight into the processes. The collected data may help to detect inef-ficiencies and reasons for quality problems in the production. Yet, analysistools are needed to extract this knowledge from the data. These tools shouldbe tailored to the application domain to extract performance measures incorrespondence to the respective manufacturing processes as well as datafrom sensors and machines. For instance, identifying an unexpected qualityproblem due to humidity on the plant floor requires detecting a correlationbetween data from quality checks and sensor data taken during the processingof the respective products.
79

3.4.5 Supporting Asset TrackingUsing RFID for tracking crucial assets was a targeted application in sev-eral of the plants. This was desired to improve planning of the productionschedule and to direct employees who fetch the assets. In order to meetthis demand, tracking software must be integrated with RFID data and theplanning application.
For integrating RFID data, the tracking application must be able to as-sociate RFID readers or RFID position tags with spatial positions. Further-more, the software must be capable of inferring relocation of assets from thecaptured RFID read events. In some technical setups, this may be realizedby simple rules that associate objects registered by certain readers with therespective positions. For instance, this can be suitable for assets in smartshelves that are equipped with RFID readers.
However, inferring the position of assets may be more complex in othersituations. For instance, if assets are registered by mobile readers, assettracking requires determining the reader’s position first and then inferring theposition of registered objects. Such particularities of the planned applicationsetup pose requirements to the tracking software of choice. Here it is ofspecial interest how object positions can be obtained and analyzed by thesoftware system.
3.4.6 Providing RFID Data to Components of theMiddle Layer
In our case studies, we observed similarities in the IT infrastructures thatare used at the investigated plants. The used software systems support aset of typical functionalities such as planning, controlling and monitoringproduction processes.
A complete RFID solution always spans multiple layers from the IT in-frastructure. We put RFID readers, plant-local control devices such as aPLC or PCs on the shop floor into the device layer. PCs on the shop floorwith RFID device controller aggregate RFID read events and provide theinterface to higher-layer control systems such as an MES or an ERP sys-tem. MES lie in the middle layer. They are responsible for orchestrating themanufacturing processes in the factory. This includes responsibilities such asoperations scheduling, production control, or labor management. In manyuse cases monitoring components in the device layer will be based on RFIDtechnology, see Section 2.3. Thus, data from RFID readers must be fed intothe middle layer components in order to support the workflow management.Yet, it is infeasible to directly link reader interfaces to components of the
80
middle layer. Instead, RFID data must be pre-processed to extract infor-mation which is of relevance for this system level. To be more precise, atleast noise in the form of double reads or false disappearance events shouldbe filtered. Furthermore, RFID reads should be aggregated to meaningfulevents; e.g., the completion of a certain production step.
Thus, interfaces to pre-processing components must be defined for thecomponents in the middle layer. These interfaces should support push-basedcommunication paradigms to account for the event character of RFID readouts. Furthermore, a coding scheme for data exchange must be defined. Thiscoding scheme should allow associating identification numbers of RFID tagswith related data and information about the read event.
Notice that the distinction of clearly separated layers often does not cor-respond to reality. The functionality of certain layers may be combined intoan integrated system. For example, an ERP system may include an RFIDintegration component, such as SAP’s Auto-ID Infrastructure, which enablesit to directly communicate with manufacturing or logistics processes. In thefuture, the strict separation into layers and system boundaries is likely to dis-appear in favor of a more modular and flexible service-oriented architecture,see [Günther et al., 2008a, Chapt.3].
3.5 ConclusionThis chapter shows that despite the high potential of RFID technology, man-ufacturers have to consider a number of issues before starting an implementa-tion. Environmental conditions, such as heat, the presence of metal or water,or the plant layout may impact the applicability of RFID. Furthermore, theeffort for creating and maintaining an infrastructure of RFID readers, shop-floor PCs communication networks as well as the costs for the tags must beweighed against the benefits. This is because tag costs will become significantin high-volume, low-value products that are individually tagged. Apart fromthe hardware, robust and scalable software is needed to handle the processingof RFID data streams.
When implementing RFID, the company needs to integrate it into itsexisting IT infrastructure. A tight integration with existing ERP and MESsystems facilitates that RFID leads to concrete and local productivity im-provements in the short and medium term. Then the company can use thefull potential of this technology. This is because RFID can be used for datacollection in cases in which other Auto-ID technologies are impractical. Inte-grating these data into IT-enabled business processes would result in a moreprecise match of the shop floor with the company’s IT processes. This leads
81

to more visibility about production processes; permitting faster adaptationsto production variations.
Such improvements – especially if they are purely intra-enterprise, i.e.,independent of any coordination with supply chain partners – facilitate theadoption decision considerably. Therefore, I will focus on how to integrateRFID into existing IT infrastructures in the next two chapters, starting witha detailed analysis of deployed IT infrastructures.
82
Chapter 4
IT Infrastructures Deployed inManufacturing
Before embedding RFID into IT infrastructures one needs to evaluate wherethe resulting RFID data should be integrated and which applied softwarecomponents would be affected. Furthermore, it is important to know howRFID data could be passed to these software components.
In order to be able to give well-founded design guidelines for embeddingRFID into shop-floor applications and the company’s IT infrastructure it isnecessary to conduct an in-depth analysis of the state-of-the-art in manu-facturing IT infrastructures. I completed this analysis together with HolgerZiekow in 2007 and 2008. Our research method was the case-study approach.We plant to publish the results of the case studies.
Manufacturing operations can be generally classified as discrete, contin-uous, or batch processes. Continuous and batch can be summed up into theprocess industry. Discrete and process industry are likely to have heteroge-neous software requirements. Therefore, for our case studies we explicitlychose manufacturers from both industry sectors.
For a profound understanding of the state-of the-art in manufacturingit is essential to evaluate technical fundamentals beforehand. This includesapplied standards and software systems. This part of the chapter was con-ducted with Oliver Günther and Holger Ziekow. Parts of it are published inGünther et al. [2008b].
The chapter starts with a discussion of these technical foundations. Sec-tion 4.2 presents the conducted case studies with an analysis of actual in-dustrial implementations. Section 4.3 reveals lessons learned. Section 4.4concludes this chapter.
83
4.1 Flow of Information between Shop Floorand Top Floor
In general, today’s flow of information in the producing industry can bedescribed as follows: Sensors on machines generate unfiltered data that arecollected through so-called distributed control systems (DCS). The tasks ofthe DCS are to monitor the actual processes and to provide a human-machineinterface for control of the machines. They also pass the collected data onto the next level, to the manufacturing execution system (MES). The MEScollects and filters the data for analysis, and coordinates the entire productionprocess. Here, all data that could be needed can be accessed in a time framebetween days and minutes, compared to a time frame between hours andseconds in a DCS. In the MES, data are compressed, and passed to historiansfor later analysis. Only a few data for long-term analysis are passed on to theupper level. This level is the enterprise resource planning software (ERP).The ERP deals with data in the range of months and weeks. It manages thelong-term production and passes customer orders down to the MES.
In order to make development and, even more importantly, maintenanceof software easier, several consortia are devising standards that define andnormalize the flow of information. Together these standards give a detaileddescription of every level, define what tasks have to be completed and whichinformation has to be kept on every level. They also characterize the ex-change between these levels. With the use of the standards, replacing andadjusting installed software promises to be easier.
In the following I describe these standards. I begin with the description ofthe Purdue reference model for computer-integrated manufacturing (PRM).The goal of this standard is to create a general design about the operationsof any production plant. The second standard family that we consider isthe ISA-S95 family. This is a standard family for plant-to-business (P2B)integration with a special focus on manufacturing. The ISA-S95 standardbuilds on the PRM.
Besides the ISA-S95 P2B standard there are two other P2B integrationstandards: RosettaNet [Malakooty, 2005], and OAGIS [OAGIS]. In contrastto these standards, ISA-S95 focuses solely on the integration of ERP andMES. Both, RosettaNet and OAGIS go far beyond P2B integration in anattempt to model every class of B2B (Business-to-Business) transaction. Thecost of this approach is the lack of depth for P2B integration.
The section closes with the outline of the OLE for process control standard(OPC). It is a standard for exchanging messages on the shop floor.
84

Figure 4.1: Purdue reference model showing connectivity from shop floor totop floor for adaptive manufacturing; source Williams [1992].
4.1.1 The Purdue Reference Model for Computer-Integrated Manufacturing
The Purdue reference model (PRM) for computer-integrated manufacturing(CIM) Williams [1992] was prepared by the CIM reference model commit-tee at the international Purdue workshop on industrial computer systems in1989. The goal was to create a general design about the operations of anyproduction plant. It divides the manufacturing domain into six levels of com-puting functionality, which are based on the hierarchy of the manufacturingenterprise. These six levels are considered to be sufficient for the purpose ofidentifying necessary integration standards. The levels in their hierarchicalstructure are shown in Figure 4.1. Besides the detailed description of thesix levels and their functions for a generic manufacturing facility, the PRMprovides definitions for the flow of data.
In level 1 are the actual processes on the equipment-machines and robots.It represents the realization of level 2 commands. Because of the wide differ-ences of equipment and functions between different industries, the detailed
85
descriptions of the functions in this level are not included in the PRM. Thescope of the PRM lies between levels 2 and 5.
Level 2 maintains the direct control of the plant units, the whole of theequipment and coordinates the activities of the shop floor. It detects and re-sponds to emergency conditions which may occur in the plant units. Anothertask is the collection of information on production, raw material and energyuse and the transmission of this information to the next level. Also, diag-nostics and updates on any standby systems belong to the tasks performedhere. Programmable logic controllers (PLC) and human-machine interfaces(HMI) lie in this level.
Level 3 coordinates multiple machines and operations. The responsibilityhere is the sequencing and supervision of the jobs at the shop floor and sup-port of various services. It responds to any emergency condition which mayexist in its region of the plant. The second control task is the optimizationof units within the limits of the established production schedule. For systemcoordination and operational data reporting it collects and maintains dataqueues of production, inventory, raw material and energy usage informationfor the units under its control. Levels 2 and 3 carry out necessary controland optimization functions for individual production units to enforce theproduction schedule, which is defined in the upper levels and communicateddown.
Level 4 deals with an area of a plant. It handles the detailed productionscheduling and area coordination for one plant subdivision. This level con-trols the allocation and supervision of materials and resources, coordinatesthe production and supports the jobs and obtains needed resources. An-other task is caring out the production schedule that has been created by theupper level. Together with the upper level it also modifies the productionschedules in order to compensate interruptions of the production, which mayoccur in the area of its responsibility. Operational reports, including vari-able manufacturing costs, are generated here. The data for offline analysisare collected. As on the lower levels, this level also diagnoses itself and theunderlying functions of the other levels.
Level 5 is the last level which lies in the scope of the PRM. It deals withthe planning of the production for the whole plant. It coordinates the imple-mentation of the enterprise functions and plans and also modifies the basicschedule of the production for all units. Other basic functions include theproduct design and production engineering and the upper-level productionmanagement, procurement, resource and maintenance management. It is themain interface with the plant for company management, sales and shippingpersonnel, accounting and supply production. All status information is col-lected and is supplied in the form of regular production and status reports.
86

In coordination with the actual schedule it develops the optimal inventorylevels of raw material and energy sources. Another function on this levelis the collection and maintenance of all goods in process. There is also afunction for the maintenance of the used equipment. This level does notinclude any control functions. It only deals with the production schedulingand overall plant data functions. It is used as an upper-management andstaff-level interface.
Level 6 is not included due to the fact that it is considered as an externalentity. This level represents the corporate management, the task of whichis to achieve the mission of the enterprise. Basic functions include finance,marketing and sales, and research and development.
4.1.2 ISA-S95ANSI/ISA-S95 (internationally standardized under ISO/IEC-62246) is aprominent plant-to-business (P2B) integration standard relevant for manu-facturing [Brandl, 2000, 2001, 2005]. This standard builds on the Purduereference model for computer-integrated manufacturing to define a multi-level functional reference model for manufacturing systems.
This standard defines a terminology and concepts to structure manufac-turing systems and operations. Figure 4.2 illustrates how the functional-ity within a manufacturing system is distributed across four different levels.Each of these comprises manufacturing functionality on a particular level ofabstraction. In particular, the following areas are addressed:
• Level 0: Physical processes (machines). Location of the actual produc-tion processes.
• Level 1: Sensing and manipulating physical processes (sensors, actua-tors, RFID readers).
• Level 2: Monitoring and controlling physical processes (PLC, HMI).
• Level 3: Manufacturing operations & control: dispatching production,detailed production, scheduling, reliability assurance, etc. Maintainingrecords and optimizing the production process. Relevant time frame:seconds to days.
• Level 4: Business planning & logistics: plant production scheduling,production, material use, delivery and shipping, inventory manage-ment. Relevant time frame: days to months.
87
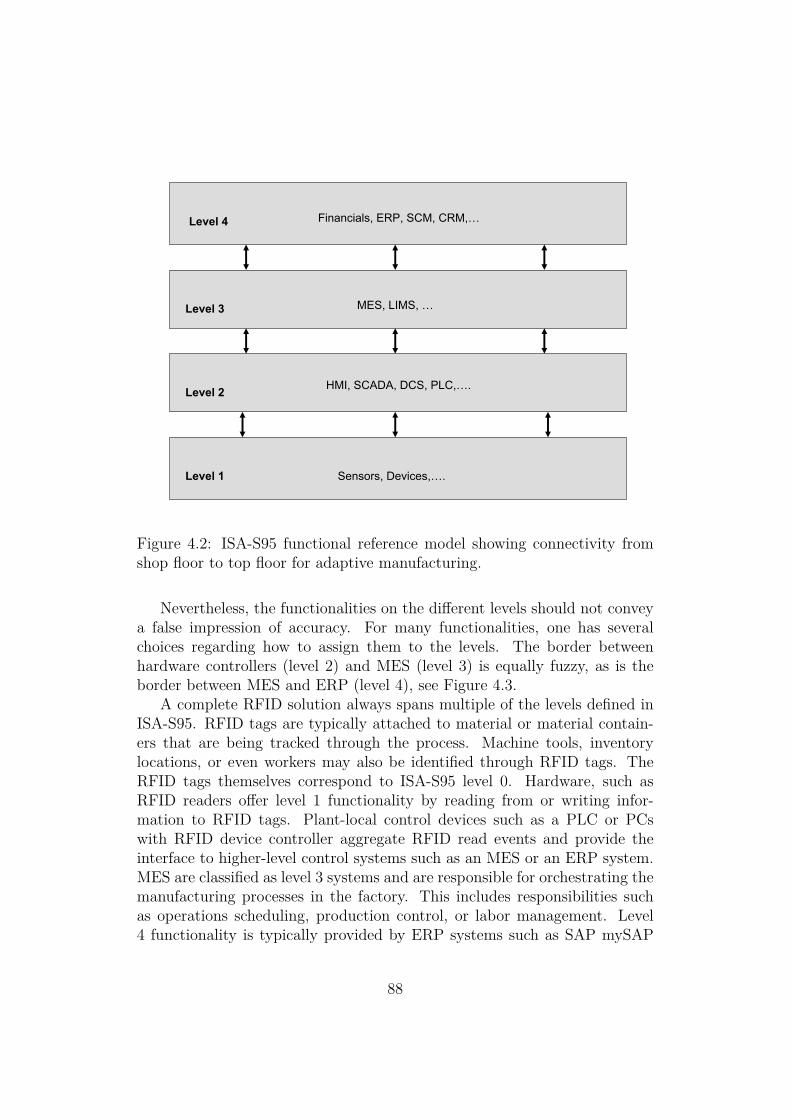
Level 1
Level 2
Level 3
Level 4 Financials, ERP, SCM, CRM,…
MES, LIMS, …
HMI, SCADA, DCS, PLC,….
Sensors, Devices,….
Figure 4.2: ISA-S95 functional reference model showing connectivity fromshop floor to top floor for adaptive manufacturing.
Nevertheless, the functionalities on the different levels should not conveya false impression of accuracy. For many functionalities, one has severalchoices regarding how to assign them to the levels. The border betweenhardware controllers (level 2) and MES (level 3) is equally fuzzy, as is theborder between MES and ERP (level 4), see Figure 4.3.
A complete RFID solution always spans multiple of the levels defined inISA-S95. RFID tags are typically attached to material or material contain-ers that are being tracked through the process. Machine tools, inventorylocations, or even workers may also be identified through RFID tags. TheRFID tags themselves correspond to ISA-S95 level 0. Hardware, such asRFID readers offer level 1 functionality by reading from or writing infor-mation to RFID tags. Plant-local control devices such as a PLC or PCswith RFID device controller aggregate RFID read events and provide theinterface to higher-level control systems such as an MES or an ERP system.MES are classified as level 3 systems and are responsible for orchestrating themanufacturing processes in the factory. This includes responsibilities suchas operations scheduling, production control, or labor management. Level4 functionality is typically provided by ERP systems such as SAP mySAP
88
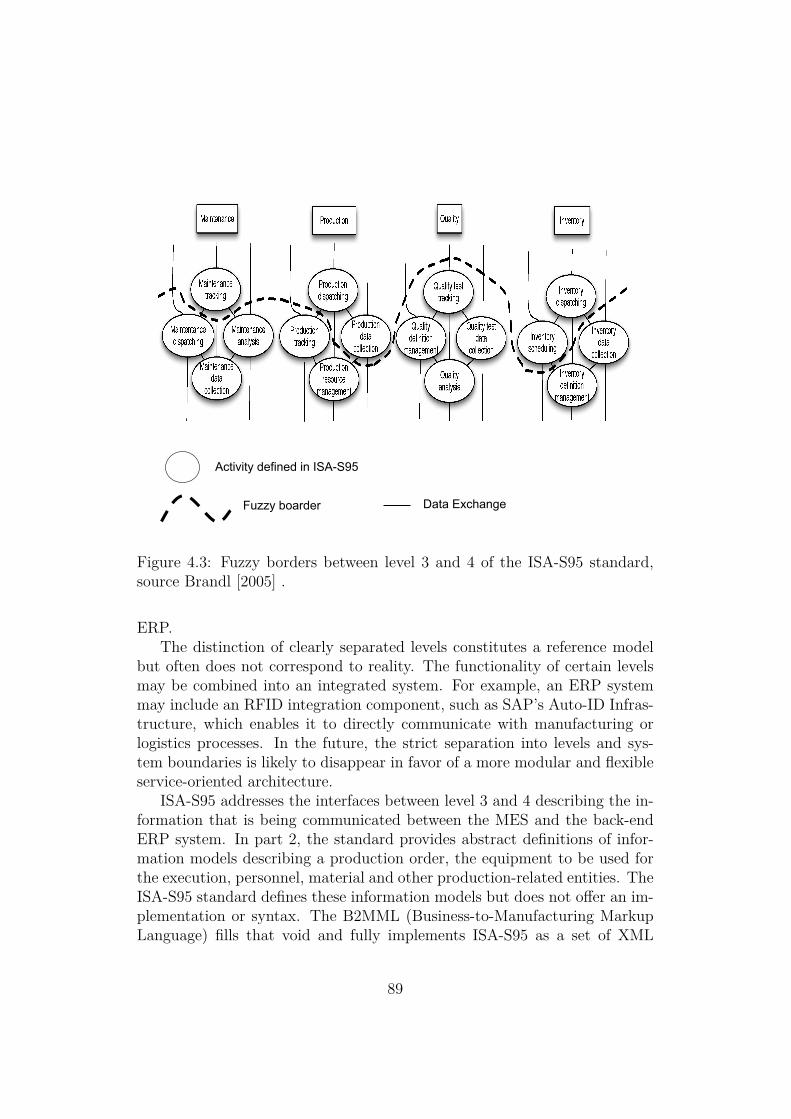
Activity defined in ISA-S95
Fuzzy boarder Data Exchange
Figure 4.3: Fuzzy borders between level 3 and 4 of the ISA-S95 standard,source Brandl [2005] .
ERP.The distinction of clearly separated levels constitutes a reference model
but often does not correspond to reality. The functionality of certain levelsmay be combined into an integrated system. For example, an ERP systemmay include an RFID integration component, such as SAP’s Auto-ID Infras-tructure, which enables it to directly communicate with manufacturing orlogistics processes. In the future, the strict separation into levels and sys-tem boundaries is likely to disappear in favor of a more modular and flexibleservice-oriented architecture.
ISA-S95 addresses the interfaces between level 3 and 4 describing the in-formation that is being communicated between the MES and the back-endERP system. In part 2, the standard provides abstract definitions of infor-mation models describing a production order, the equipment to be used forthe execution, personnel, material and other production-related entities. TheISA-S95 standard defines these information models but does not offer an im-plementation or syntax. The B2MML (Business-to-Manufacturing MarkupLanguage) fills that void and fully implements ISA-S95 as a set of XML
89

schemas, one schema per information model.A recently started cooperation between ISA and OAGIS is likely to further
harmonize the currently competing standards. ISA-S95, although still farfrom being mainstream, has already been deployed successfully by a numberof businesses and is currently the leading standard for plant-to-business dataexchange.
RFID itself is not explicitly considered within ISA-95. However, manyof the ISA-S95 information models include identification information suchas data to identify a particular material or personnel. These data may becontained on an RFID tag attached to a material or carried by plant-floorpersonnel.
4.1.3 OPCOPC is a family of different standards. The goal is to ensure the interoper-ability of different shop-floor devices among each other as well as providinga standardized way for applications to communicate with shop-floor devices,e.g., sensors, PLCs, or Historians. The OPC Foundation is responsible forthe OPC standards. It offers free tools for its members to test OPC compli-ance. Initiated in 1996 by a task force of a handful of companies from theautomation industry the organization today has more than 300 members.Originally the OPC standard was based on Microsoft Object Linking andEmbedding (Distributed) Component Object Model technology (short OLECOM/DCOM technology) and, therefore, the name was OLE for Produc-tion Control. In the meantime the OPC standards are no longer restrictedto COM/DCOM technology and therefore the name has been changed toOpenness, Productivity and Collaboration.
The OPC architecture is based upon the client/server computer modelas depicted in Figure 4.4. In this model an OPC server is a data source.It receives requests for data from an OPC client, obtains the data from thedevice - often the proprietary system - and serves the data to the OPC client.
The first standard in the OPC family was the OPC Data Access Speci-fication. It is still the most important standard within the family and rulesthe acquisition of data from shop-floor devices through production controlstations, manufacturing execution systems or even ERP systems. A so-calledOPC server running on a shop-floor device or industrial PC close to the shopfloor communicates via field buses with the data sources and exposes the datain a standardized way to higher-level applications, the OPC clients. Withthe new OPC XML-DA standard a web-service-based data access standardis provided. It allows OPC components to be run on non-Microsoft systems.
The OPC Alarm & Events Specification provides a means to OPC clients
90

OPC Client -Application
OPC Server -Gateway to data
Device A
OPC Client -Application
OPC Client -Application
OPC Server -Gateway to data
OPC Server -Gateway to data
Device B Device C
Figure 4.4: Accessing devices via OPC.
for registering certain events or alarm conditions. Thereby, the clients onlyreceive messages when something of interest to them happens instead ofhaving to read data streams continuously as would be necessary if OPCData Access was used.
OPC Batch specifies interfaces for the exchange of information aboutequipment capabilities and operating conditions with a special focus on batchprocesses. OPC Data eXchange specifies the communication between OPCservers via field buses. In contrast to the OPC Data Access standard thatdeals with real-time data only, the OPC Historical Data Access standardspecifies how data that is already stored in some system, e.g., a plant histo-rian, can be accessed. OPC Security defines how the sensitive data on OPCservers can be protected against accidental or intentional manipulation.
The OPC Unified Architecture (OPC-UA) is the latest specification fromthe OPC foundation. The first parts of this new specification were finalizedin June 2006. OPC-UA provides a uniform web-service-based access to thevarious formerly separated functionalities like OPC DA, A&E, HDA. It alsoovercomes the dependability on Microsoft COM/DCOM with the specifica-tion of an own communication stack. This allows OPC-UA to be run onnon-Microsoft systems including embedded systems that get more and more
91
important as OPC servers.The OPC standard primarily addresses communications with systems
close to the shop floor like PLCs or plant historians. In an RFID scenario,OPC/OPC-UA would be most suitable for the communication between themiddleware and the readers. As of today, OPC is not broadly accepted forthis purpose. However, it is an important standard for shop-floor integrationwith IT systems in general and is used in cases where RFID readers andshop-floor equipment have to be used in combination.
4.2 Case StudiesIn this section we show how manufacturing companies apply informationtechnology for their production processes. In order to truly examine the useof IT, we conducted several case studies at diverse manufacturers. This qual-itative research method enables us to acquire an in-depth understanding ofthe situation present. As is true for any case-based analysis we cannot claimthat our insights are representative for the whole manufacturing domain.However, the fact of having more depth in the analysis dominates on thepositive side [Flyvbjerg, 2006]. In the case studies we have an interpretiveresearch approach.
I conducted the case studies together with Holger Ziekow in the periodfrom August 2007 to August 2008. The participating companies are fromthe following industries (the company names are not revealed due to non-disclosure agreements):
1. batch production: manufacturer of milk products (short MIP),
2. discrete production: manufacturer of engine cooling modules (COO),
3. discrete production: manufacturer of refractories (REF),
4. discrete production: manufacturer of engines (ENG),
5. batch production: manufacturer of chemicals (CHE),
6. discrete production: manufacturer of power plants (POW),
7. discrete production: manufacturer of tires (TIR).
All seven companies are headquartered in Germany. Their size rangesbetween several hundred and over 100,000 employees. Four out of seven arelisted in the DAX or MDAX, respectively. Our reason for choosing thesecompanies was to gain several representatives from diverse industrial sectors.
92

4.2.1 Production of Milk ProductsThe production at the manufacturer of milk products (short MIP) is orga-nized in several divisions producing diverse products. For this case studywe analyzed two departments. Dep1 produces plastic cups and blank shapesfor bottles. Dep2 produces and processes perishable products. The produc-tion processes in Dep1 are highly automated. Manual intervention is limitedto: configuring machine settings, loading and unloading the machines, andtaking samples for quality checks.
The set-up time for a machine depends on how much the settings fromthe previous production task differ from the subsequent one. Furthermore,machines need to be cleaned in periodical intervals and after processing ofspecific ingredients. Therefore, the setup times range between 30 minutesand 4 hours. A production step itself runs for about half a day to one dayin the same configuration.
The production processes at Dep1 differ slightly depending on the pro-duced product. The department produces blank shapes for bottles, coloredplastic cups and cups which are decorated with paper sleeves. Blank shapesfor bottles are directly transported to another department for filling or aredirectly sold. In contrast, plastic cups are decorated before they leave thedepartment. The processes for producing cups vary with respect to howcups are decorated. The cups can either be colored or decorated with paper.Figure 4.5 shows the production process for colored plastic cups.
In the first step, plastic granules are melted and molded to a reel. Sub-sequently, the same machine punches plastic cups out of the molded reel. Adifferent machine is used to color these cups with the desired imprint. Inputmaterials for the coloring steps are a range of colors and blank plastic cups.The output of this step is the finished cups that leave Dep1. The cups aresubsequently filled with food and sealed at another department.
In the production at Dep2 milk and yogurt is processed and bottled.Figure 4.6 shows the exemplary process of processing and filling flavored milkat Dep2. Each process step is conducted by a different machine. Therefore,we omit machines in the process model in Figure 4.6.
The first steps of the production process in Dep2 run in parallel. In onepart milk is processed while bottles are prepared in the other part. Processingmilk covers heating the milk and enriching it with flavors. Processing ofbottles starts with blowing blank shapes from Dep1 into the desired bottleshape. In the following step the bottles are cleaned with acid. Subsequently,the bottles are filled with the flavored milk and closed with a lid. After that,the blank bottles are decorated with plastic foils which are shrink-fitted ontothe bottle’s body. Finally the bottles are packed. Like all the other steps, the
93
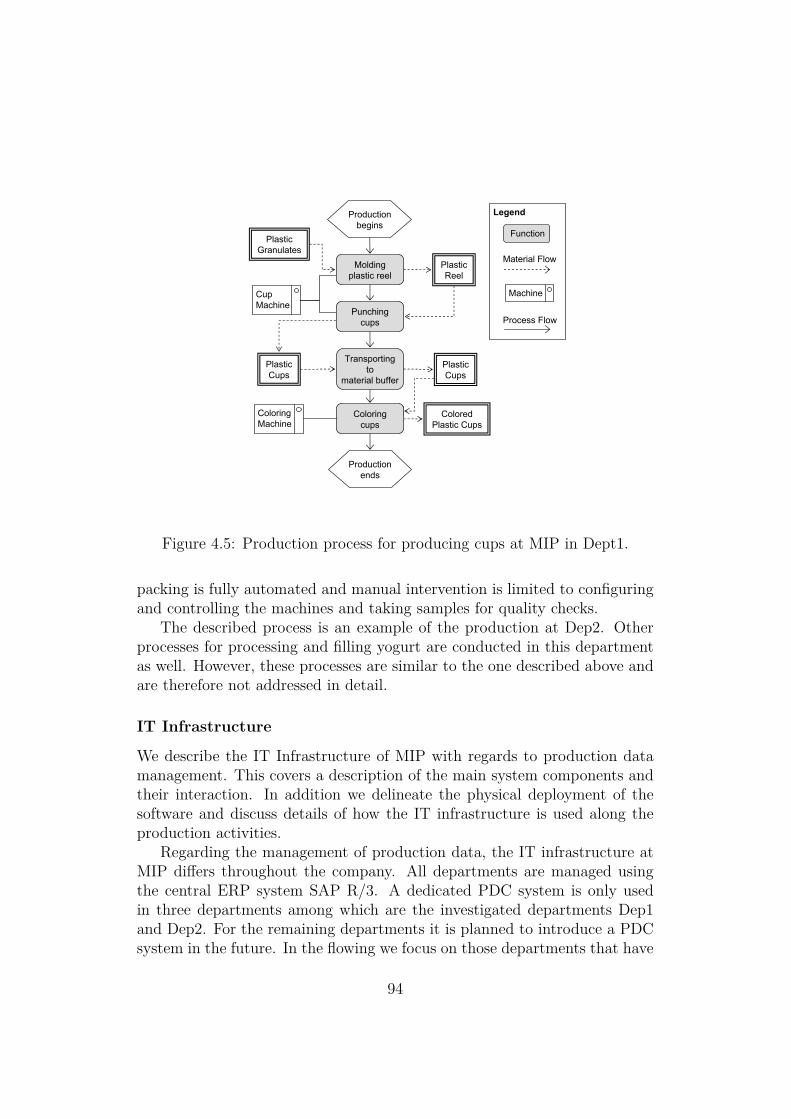
Productionbegins
Material FlowPlasticReel
Function
Legend
Transportingto
material buffer
PlasticGranulates
Cup Machine
Moldingplastic reel
Coloring Machine
Machine
Process FlowPunching
cups
ColoredPlastic Cups
Coloringcups
PlasticCups
PlasticCups
Productionends
Figure 4.5: Production process for producing cups at MIP in Dept1.
packing is fully automated and manual intervention is limited to configuringand controlling the machines and taking samples for quality checks.
The described process is an example of the production at Dep2. Otherprocesses for processing and filling yogurt are conducted in this departmentas well. However, these processes are similar to the one described above andare therefore not addressed in detail.
IT Infrastructure
We describe the IT Infrastructure of MIP with regards to production datamanagement. This covers a description of the main system components andtheir interaction. In addition we delineate the physical deployment of thesoftware and discuss details of how the IT infrastructure is used along theproduction activities.
Regarding the management of production data, the IT infrastructure atMIP differs throughout the company. All departments are managed usingthe central ERP system SAP R/3. A dedicated PDC system is only usedin three departments among which are the investigated departments Dep1and Dep2. For the remaining departments it is planned to introduce a PDCsystem in the future. In the flowing we focus on those departments that have
94
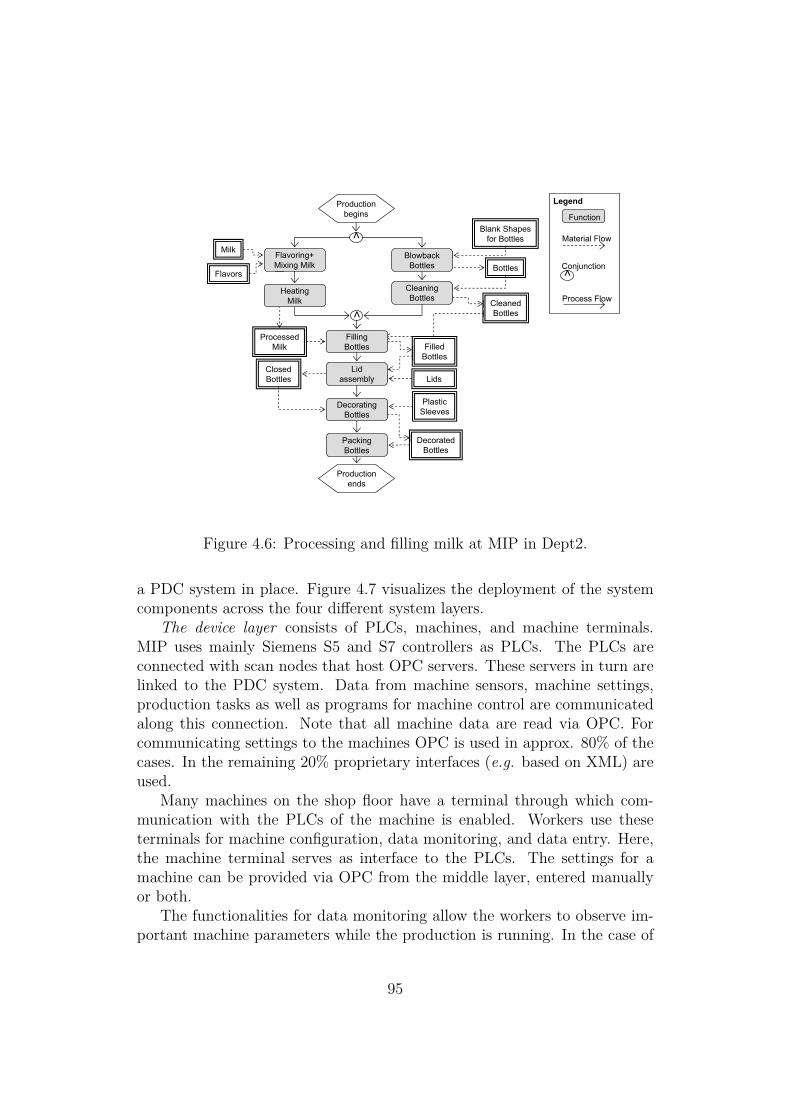
>
Productionbegins
Material Flow
Function
Legend
Process Flow
Productionends
PackingBottles
> Blank Shapesfor Bottles
Bottles
DecoratedBottles
ProcessedMilk
Milk
>ConjunctionBlowback
Bottles
CleaningBottles
FillingBottles
DecoratingBottles
PlasticSleeves
CleanedBottles
FilledBottles
Flavors
Flavoring+Mixing Milk
ClosedBottles Lids
Lidassembly
HeatingMilk
Figure 4.6: Processing and filling milk at MIP in Dept2.
a PDC system in place. Figure 4.7 visualizes the deployment of the systemcomponents across the four different system layers.
The device layer consists of PLCs, machines, and machine terminals.MIP uses mainly Siemens S5 and S7 controllers as PLCs. The PLCs areconnected with scan nodes that host OPC servers. These servers in turn arelinked to the PDC system. Data from machine sensors, machine settings,production tasks as well as programs for machine control are communicatedalong this connection. Note that all machine data are read via OPC. Forcommunicating settings to the machines OPC is used in approx. 80% of thecases. In the remaining 20% proprietary interfaces (e.g. based on XML) areused.
Many machines on the shop floor have a terminal through which com-munication with the PLCs of the machine is enabled. Workers use theseterminals for machine configuration, data monitoring, and data entry. Here,the machine terminal serves as interface to the PLCs. The settings for amachine can be provided via OPC from the middle layer, entered manuallyor both.
The functionalities for data monitoring allow the workers to observe im-portant machine parameters while the production is running. In the case of
95
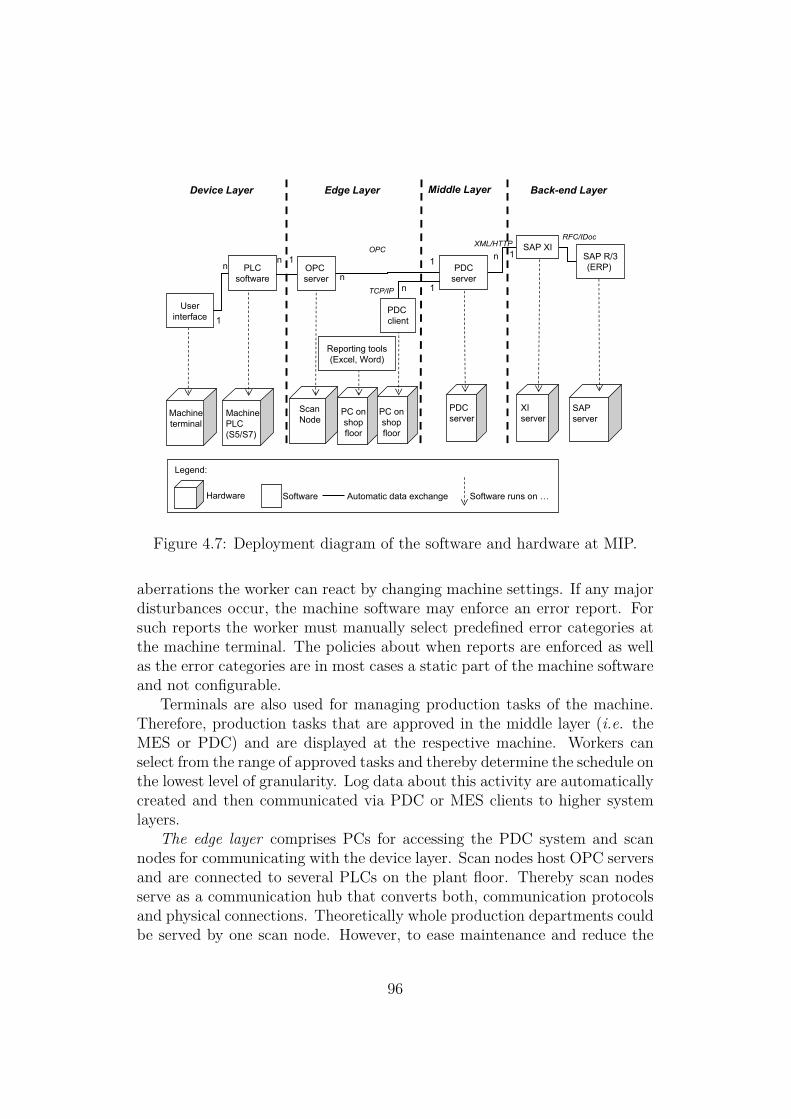
OPCn
n
Machineterminal
MachinePLC(S5/S7)
XML/HTTPRFC/IDoc
n
1 n
XIserver
1SAP XI
TCP/IP
Device Layer Edge Layer Back-end Layer
PC on shop floor
SAPserver
PDCserver
PDCserver
1
1
PDC client
PLCsoftware
ScanNode
OPC server
Userinterface
n
1
PC onshop floor
Reporting tools(Excel, Word)
Middle Layer
Hardware Software
Legend:
Automatic data exchange Software runs on …
SAP R/3(ERP)
Figure 4.7: Deployment diagram of the software and hardware at MIP.
aberrations the worker can react by changing machine settings. If any majordisturbances occur, the machine software may enforce an error report. Forsuch reports the worker must manually select predefined error categories atthe machine terminal. The policies about when reports are enforced as wellas the error categories are in most cases a static part of the machine softwareand not configurable.
Terminals are also used for managing production tasks of the machine.Therefore, production tasks that are approved in the middle layer (i.e. theMES or PDC) and are displayed at the respective machine. Workers canselect from the range of approved tasks and thereby determine the schedule onthe lowest level of granularity. Log data about this activity are automaticallycreated and then communicated via PDC or MES clients to higher systemlayers.
The edge layer comprises PCs for accessing the PDC system and scannodes for communicating with the device layer. Scan nodes host OPC serversand are connected to several PLCs on the plant floor. Thereby scan nodesserve as a communication hub that converts both, communication protocolsand physical connections. Theoretically whole production departments couldbe served by one scan node. However, to ease maintenance and reduce the
96
risk of failure only about 15-30 PLCs are connected to one scan node.PCs on the edge layer are used for accessing data in the PDC system.
Shift foreman and workers use such PCs for obtaining statistics about theperformance of production lines and machines. Therefore, these PCs runPDC clients. However, most access is done via dedicated reporting toolsthat MIPs IT staff implemented on request. In parts of the production,terminal PCs are used for manually created reports. In such cases workersfill out Microsoft Excel sheets or Word documents to report about details ofthe conducted production processes. In addition to these electronic notes,some data are handwritten on paper forms, e.g., to document quality checks.
The middle layer comprises the PDC system installations. For commu-nicating machine events to the ERP system, the PDC system creates notifi-cations that are passed through a Notification Monitor to the SAP XI. TheSAP XI then passes the data on to the ERP via RFC calls. A part of thePDC system solution is an Order Monitor. This component is used to man-age production tasks at specific process steps. From the Order Monitor theproduction tasks are communicated to the PLC of the respective machine.
Machine data are captured by the PDC system via OPC. Overall 10,000measuring points are recorded, of which about 7,000 are located at the in-vestigated departments (approx. 2,500 at Dep1 and approx. 4,500 at Dep2).The machine data are regularly polled at a frequency of typically 1Hz (upto 10Hz). For saving and reporting, the information is aggregated wherebyredundant information is omitted. That is, identical measurements are notrecorded in the database.
Furthermore, only an extract of information is reported to the SAP sys-tem. This includes key information such as the produced quantities andfinished production tasks. This information accounts for about 20% of theevaluated production data. Thus, most of the data evaluation is done withthe PDC system’s visualization tools that use the PDC database. Here,potentials for improving the production are identified based on analysis ofthe recorded machine data. Along with improved data safety, these analy-ses are one major reason for MIP to use a PDC system. According to thestaff at MIP, these analyses have already enabled major improvements in theproduction.
Another functionality of the middle layer is the management of alerts andnotification. Notifications about abbreviations in the production process aregenerated if the deviation between the recorded data and the correspondingproduct recipe exceeds a specific threshold. However, many abbreviationsare due to necessary adjustments and should not result in a notification.Overall, only 60% of the created notifications reflect real errors. Therefore,each notification is manually checked using the notification monitor of the
97
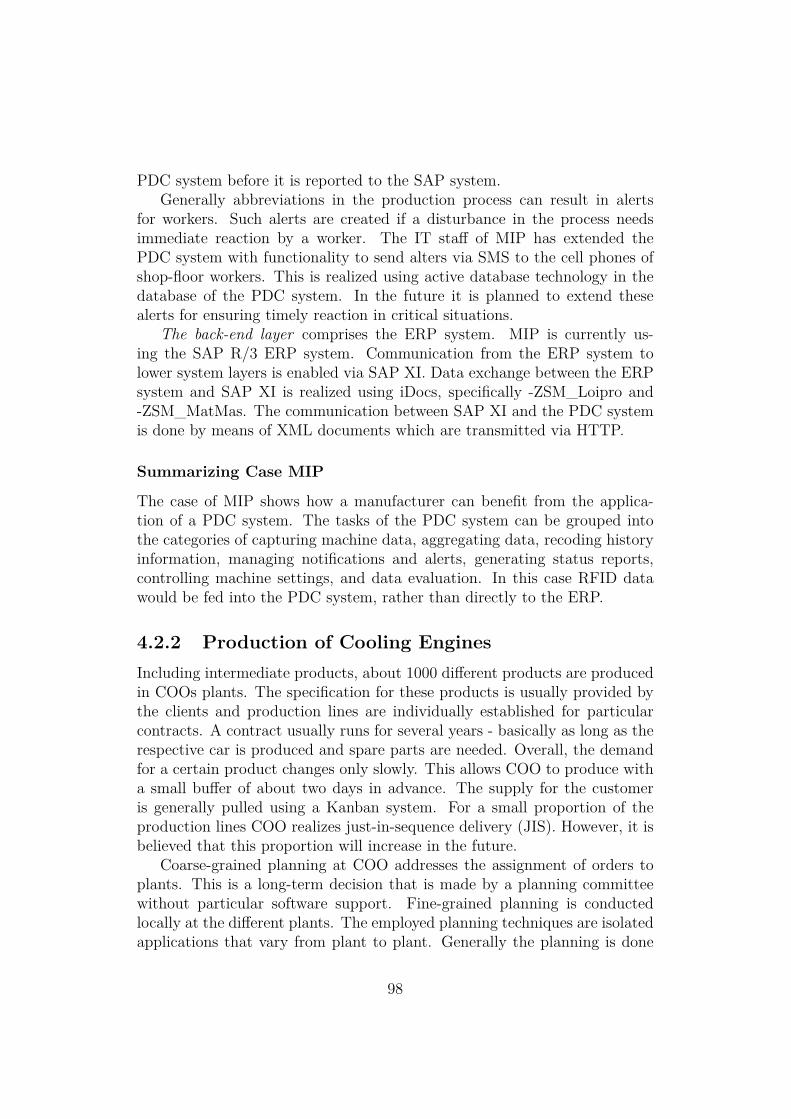
PDC system before it is reported to the SAP system.Generally abbreviations in the production process can result in alerts
for workers. Such alerts are created if a disturbance in the process needsimmediate reaction by a worker. The IT staff of MIP has extended thePDC system with functionality to send alters via SMS to the cell phones ofshop-floor workers. This is realized using active database technology in thedatabase of the PDC system. In the future it is planned to extend thesealerts for ensuring timely reaction in critical situations.
The back-end layer comprises the ERP system. MIP is currently us-ing the SAP R/3 ERP system. Communication from the ERP system tolower system layers is enabled via SAP XI. Data exchange between the ERPsystem and SAP XI is realized using iDocs, specifically -ZSM_Loipro and-ZSM_MatMas. The communication between SAP XI and the PDC systemis done by means of XML documents which are transmitted via HTTP.
Summarizing Case MIP
The case of MIP shows how a manufacturer can benefit from the applica-tion of a PDC system. The tasks of the PDC system can be grouped intothe categories of capturing machine data, aggregating data, recoding historyinformation, managing notifications and alerts, generating status reports,controlling machine settings, and data evaluation. In this case RFID datawould be fed into the PDC system, rather than directly to the ERP.
4.2.2 Production of Cooling EnginesIncluding intermediate products, about 1000 different products are producedin COOs plants. The specification for these products is usually provided bythe clients and production lines are individually established for particularcontracts. A contract usually runs for several years - basically as long as therespective car is produced and spare parts are needed. Overall, the demandfor a certain product changes only slowly. This allows COO to produce witha small buffer of about two days in advance. The supply for the customeris generally pulled using a Kanban system. For a small proportion of theproduction lines COO realizes just-in-sequence delivery (JIS). However, it isbelieved that this proportion will increase in the future.
Coarse-grained planning at COO addresses the assignment of orders toplants. This is a long-term decision that is made by a planning committeewithout particular software support. Fine-grained planning is conductedlocally at the different plants. The employed planning techniques are isolatedapplications that vary from plant to plant. Generally the planning is done
98

Productionbegins
Material FlowCooler
Function
Legend
MetalParts
Compressor
AssemblingCooler
Machine
Process Flow
FinishedCoolers
SolderedCooler
Productionends
SolderingOven
Soldering
TestingMachine
QualityCheck
Figure 4.8: Production process for coolers.
several days ahead and on the granularity of shifts (approx. 6-8 hours). Plansfor the lines with JIS are made when the sequence specification is stated bythe customer. This is about two days ahead of the delivery date.
Figure 4.8 shows an exemplary process of the production at COO thatis used to assemble and check coolers. In the fist process step several metalparts are squeezed and combined into a cooler. At this stage the parts of thecooler are only loosely attached to each other and moistened with solder. Inthe subsequent step the parts are soldered together in an oven. After thisthe product is ready but still needs to undergo an intensive quality check. Inthis last step the cooler is filled with air under different pressure. This allowsleaks to be discovered and faulty products to be sorted out.
IT Infrastructure
COO uses SAP as ERP system. However, no consistent solution for pro-duction data acquisition is currently in place. We describe aspects of theIT infrastructure that are relevant to the acquisition and processing of pro-duction data. We introduce this description with a discussion of functionalrequirements for the infrastructure. This is followed by an outline of thecommon data flow from the plant floor through the system. Subsequent to
99

this general overview of the data flow we discuss details of the data acqui-sition. This is done along the sample process which was introduced in theprevious section.
Production data at COO is used for three general purposes: analyzingand eliminating production errors, performance control of production lines,and benchmarking between production plants. Analyzing and eliminatingproduction errors is the primary use of the production data. Due to the na-ture of the contracts with clients, COO is obligated to ensure process safety.If a production error occurs, COO must be able to identify the cause andexclude future repetition of the problem. The second utilization of the datais for performance control of the production line. Performance indicators areused by shift foremen and maintenance staff for detecting declines in produc-tivity. Here, the collection of production data allows anomalies to be spottedand helps to prioritize maintenance activities. Beyond this, performanceindicators impact the workers’ salaries.
At COO the salary has a variable component. It depends on the amountof products the worker produces during his/her shifts and is calculated fromthe production data. The third use of the collected data is benchmarking.Benchmarking between production plants is important on the managementlevel. In order to make investment decisions and to assign production tasksthe performance of different locations must be considered. For this purposethe management demands regular reports on key performance parametersfrom each plant. These parameters are aggregates from production datathat are acquired on the plant floor.
The IT solutions at COO’s plants are not unified. This is due to the factthat the management of log files is within the responsibility of each plant.Consequently the particular solutions differ across the facilities. However,some similarities can be identified throughout the isolated solutions. Weoutline these similarities in Figure 4.9, which gives an overview of the ITsystem.
Device layer: Commonly, production data is recorded by programmablelogic controllers (PLCs) on the machines. Depending on its purpose thedata is then forwarded from the PLCs through different channels to thehigher-edge layer for reporting. These machine data are also displayed onmachine terminals. This allows workers to monitor the machine activityand to intervene in cases of aberrations. Moreover, workers use the displayeddata for writing production reports on paper. These reports differ from plantto plant. However, the reports include some attributes which are commonthroughout the whole company. For instance, COO records the amount offinished products and defective goods in all plants.
The edge layer: For monitoring the performance of plants and production
100

n
Machineterminal
MachinePLC
1
PC
1
Device Layer Edge Layer Back-end Layer
PC SAPserver
Localserver
BackupProgram
1
PLCsoftware
LoggingProgram SAP
(ERP)
Userinterface
n
n
PC
Middle Layer
emailclient
PPT
CentralDB
server
DBAccess
1
1 1n
DBclient
emailclient
ProductionProtocol onPaper
Hardware Manual entrySoftware
Legend:
Automatic data exchange Software runs on …
Figure 4.9: Deployment diagram of the software and hardware at COO.
lines each plant of COO has to generate reports at monthly intervals. Thestaff creates all reports based on the above-mentioned paper documents fromthe plant floor. Here again, some particularities of how the reports are createdvary among the plants. Yet, a significant proportion of COO’s plants applythe same solution: Via MS Access clients in the plants, workers enter datainto the database from the manually written paper reports. For plants whichdo not use the MS Access database the key performance parameters arecommunicated via email
The middle layer is used for logging all data from the PLCs. This coversmachine settings, sensor data, and user input. These log files are recordedon the machines and copied to PCs as well as local servers for archiving. Themiddle layer is neither directly connected with the edge layer nor with theback-end layer.
In the first production step – the assembly – several constraints on ma-chine parameters are set. These constraints are defined as upper and lowerbounds. For instance, during the testing step machines pump gas into thecoolers. Here, upper and lower bounds define the allowed gas pressure for thetest. The machines measure these parameters during production and checkwhether they are within the defined bounds. In addition, the machines record
101

these parameters with the corresponding upper and lower bounds into logfiles. An example is the power consumption which is measured at differentparts of the machine.
Overall eight measurements are logged along with their bounds. In ad-dition six bytes with Boolean values are recorded. Each bit in these valuescorresponds to a Boolean measurement of checkpoints. These bits may beaggregates of several measurements that indicate success or failure of a check.In addition to these values each data record keeps the machine identifier, atimestamp, and a running counter value as identifier. Overall these datafields add up to about 300 bytes. Within a year each machine stores about250,000 records, creating log files of approx. 72 MB.
Further data records are created at the process step quality check. At thisstep the machine fills the coolers with gas under a certain pressure to checkfor leaks and conducts mechanical checks. Again, upper and lower boundsare defined for certain sensor values and are logged along with the measureddata. The most important attributes from the quality check are depicted inTable 4.1. This table includes attributes that were defined for improving theacquisition of production data.
Table 4.1: Attributes for quality checks
Number Description1 Equipment data2 Employee identity3 Article code of the product4 Maximal admissible gas concentration5 Minimal admissible gas concentration6 Measured gas concentration7 Maximal admissible measuring pressure8 Minimal admissible measuring pressure9 Measured measuring pressure10 Configured maximal testing time11 Actual testing time12 Minimal admissible pressure after testing time13 Measured pressure after testing time14 Mechanical check at checkpoint 115 Mechanical check at checkpoint 216 Mechanical check at checkpoint 317 Mechanical check at checkpoint 418 Mechanical check at checkpoint 5
102

In the back-end layer COO hosts the MS Access database on a centralserver for maintaining the production data. This MS Access database wasdeveloped in house for one plant and was subsequently introduced at otherproduction sites. The IT department uses this data source for generatingregular reports on performance data. Shift foremen revise monthly perfor-mance statistics about production lines under their responsibility. The ITdepartment also generates reports of key performance parameters for thewhole plant. The management receives this information via Microsoft PowerPoint slides that summarize the overall and relative performance. For plantswhich do not use the MS Access database the key performance parametersare communicated via email and added to the presentations for the manage-ment.
Summarizing Case COO
COO does not employ a dedicated system for production data acquisition.Instead, numerous isolated solutions are installed at different plants. The lowdegree of vertical integration accounts for significant manual intervention inthe data acquisition and poses the risk of data errors. Furthermore, thecurrent solution limits the room for in-depth data analysis. Due to thisCOO has started to analyze the option of using a dedicated software solutionfor production data acquisition. The reasons are improvements in the dataaccuracy, data availability and enhanced options for in-depth data analysis.In addition, having one consistent solution for production data acquisitionand evaluation in place would bring positive scale effects.
4.2.3 Production of RefractoriesREF is a globally operating company producing refractories for diverse in-dustrial sectors. Customer orders require between 8 weeks and approx. 8months. Each order is subdivided into several detailed planning units. Theyspan between one day and approx. 15 weeks. Each unit specifies the produc-tion of a given amount of refractories. Each refractory unit has an accompa-nying ticket with the following data: order number, amount to be produced,sort, customer order, delivery date, net weight, and kilning / drying ◦C.We describe the production of a refractory in detail. Figure 4.10 depicts anabstracted exemplary process model for producing a certain refractory. Theprocess comprises five steps: weighing, shaking, drying, kilning and finishing.
REF produces refractories either via compression or via casting. Themode depends on the amount of produced refractories; REF uses castingonly for orders under 300 pieces. Each refractory is made out of a specific
103
Productionbegins
Powder Mix
Drying
Powder
Weighing
Kiln
Shaking
Kilning
Productionends
Machine
Function
Event
Legend
Process Flow
Logical OR
Material Flow
Form
Finishing(Grinding, Drilling, Sawing)
Drying Kiln
Productionends
Concrete Vibrator
Refractory
Scale
Figure 4.10: Production process for refractories.
mix of cementitious materials. The mix is always approved with the customerand should therefore be exactly as specified in the recipe. Consequently eachproduction starts with weighing the used cementitious substitutes for thepowder mix.
In the second step workers mix the powder with water and pour it intoforms. This is done manually if it is an order under 300 pieces. Subsequentlya concrete vibrator shakes the forms, so that excess air can get out. In thethird step the mixed compound dries. REF uses special drying kilns forthe drying process. The temperature in the drying kilns depends on theselected program; the maximal temperature is 200◦C. Which program theworkers select depends on the thickness of the material. The foreman incharge advises each worker orally about which program is to select.
After the material is dry, workers move it out of the drying kiln, checkit for cracks, and move it to the entrepot for the kiln. REF has three kilnswhich run 24/7/365. The temperature is up to 1800◦C. These kilns are theproduction’s bottleneck. Workers load all kiln cars with as much material aspossible. How much fits on a car strongly depends on the form and thicknessof each dry form.
After the kilning step some refractories undergo a finishing process. Here
104
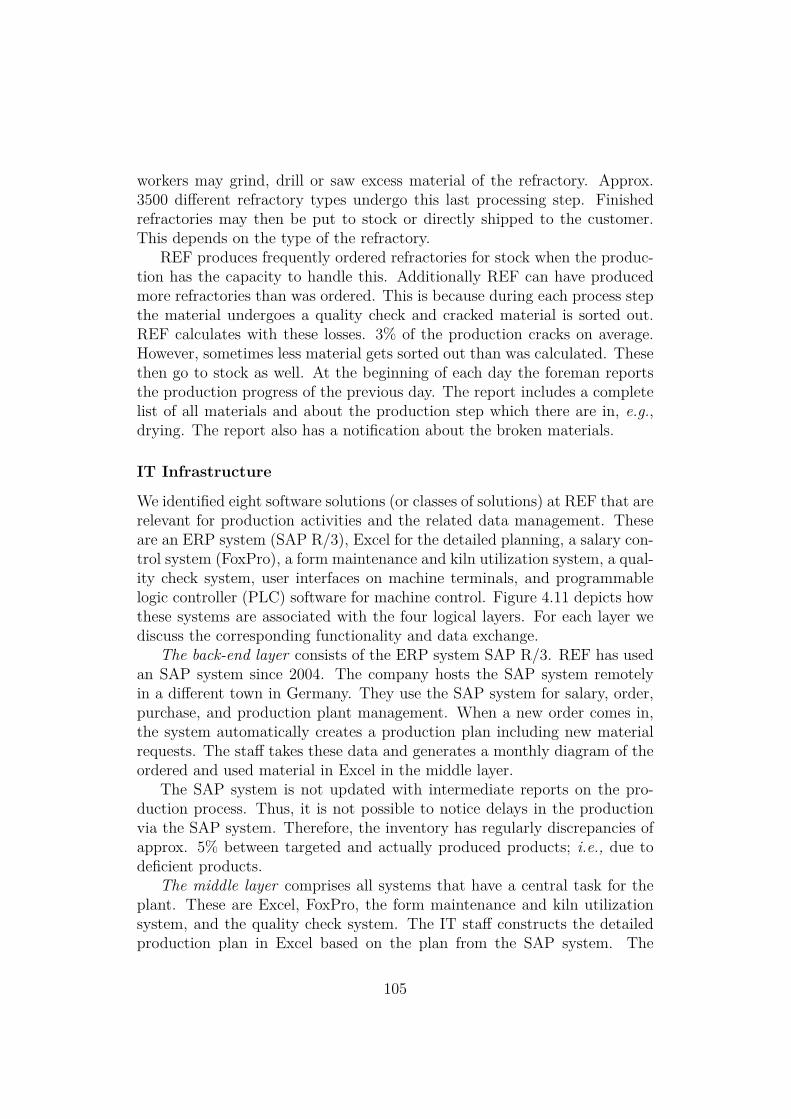
workers may grind, drill or saw excess material of the refractory. Approx.3500 different refractory types undergo this last processing step. Finishedrefractories may then be put to stock or directly shipped to the customer.This depends on the type of the refractory.
REF produces frequently ordered refractories for stock when the produc-tion has the capacity to handle this. Additionally REF can have producedmore refractories than was ordered. This is because during each process stepthe material undergoes a quality check and cracked material is sorted out.REF calculates with these losses. 3% of the production cracks on average.However, sometimes less material gets sorted out than was calculated. Thesethen go to stock as well. At the beginning of each day the foreman reportsthe production progress of the previous day. The report includes a completelist of all materials and about the production step which there are in, e.g.,drying. The report also has a notification about the broken materials.
IT Infrastructure
We identified eight software solutions (or classes of solutions) at REF that arerelevant for production activities and the related data management. Theseare an ERP system (SAP R/3), Excel for the detailed planning, a salary con-trol system (FoxPro), a form maintenance and kiln utilization system, a qual-ity check system, user interfaces on machine terminals, and programmablelogic controller (PLC) software for machine control. Figure 4.11 depicts howthese systems are associated with the four logical layers. For each layer wediscuss the corresponding functionality and data exchange.
The back-end layer consists of the ERP system SAP R/3. REF has usedan SAP system since 2004. The company hosts the SAP system remotelyin a different town in Germany. They use the SAP system for salary, order,purchase, and production plant management. When a new order comes in,the system automatically creates a production plan including new materialrequests. The staff takes these data and generates a monthly diagram of theordered and used material in Excel in the middle layer.
The SAP system is not updated with intermediate reports on the pro-duction process. Thus, it is not possible to notice delays in the productionvia the SAP system. Therefore, the inventory has regularly discrepancies ofapprox. 5% between targeted and actually produced products; i.e., due todeficient products.
The middle layer comprises all systems that have a central task for theplant. These are Excel, FoxPro, the form maintenance and kiln utilizationsystem, and the quality check system. The IT staff constructs the detailedproduction plan in Excel based on the plan from the SAP system. The
105
RemoteServer
Server inControl Center
Back-end Layer
Machine Terminal
Machine(S5/S7)
FoxPro
Edge LayerDevice Layer
SAP R/3(ERP)
PLCSoftware
1
1
n1
1
1n
User Interface
1
AccompanyingTicket
Form Maintenance
Quality Software
Kiln Allocation
Kiln Utilization
ExcelWork Schedule
nn
n
n
nn
nn
1
1
n
n
Hardware Manual entrySoftware
Legend:
Automatic data exchange Software runs on …
Salary Sheets
Middle Layer
Figure 4.11: Deployment diagram of the software and hardware at REF.
reason for conducting the fine-granular plan outside the SAP system is thatit is not possible to generate a volume flow of the materials with their currentSAP modules. In the fine planning the staff subsumes orders from diversecustomers to one production unit if the orders contain identical refractories.They create the fine-granular plans once a month, generating four weeklyplans in advance. These plans are printed out and given to the foremen asthe work schedule.
FoxPro is used for calculating the exact salary for the workers, which hasa variable factor depending on the overall productivity. The IT staff onlyinsert working hours into the FoxPro system. The FoxPro data is manuallyentered into the SAP system at the end of each month.
The middle layer also comprises a software tool for the management ofused refractory forms. Herewith, REF records the wear out of its forms thatthey use with the compression machines. As described in the previous sectionafter each production step there can be a quality check. Especially the checkat the end of the production includes an optical, chemical and a size accuracycheck. These checks are recorded in a specific quality software package.
Last but not least, the middle layer also includes software, where thekiln utilization is recorded. They use this software for controlling which
106
refractories are in the kiln. From this they can calculate when the refractorieswill be ready for delivery.
In the edge layer all production data is recorded on paper documents.Workers write all collected production data into the work schedule, or theaccompanying ticket. The foremen and workers fill them out while produc-ing the products and return them after completion. They include the exactamount of produced products and the time the workers spent on the pro-duction. Foremen create summaries on extra work sheets for reporting databack to the planning system. This information from the paper documents ismanually written into the software components from the middle layer. How-ever, workers do not conduct this task by themselves. It is a task of the ITstaff.
The device layer comprises only the user interface of the machine termi-nals and the PLCs of machines and robots on the plant floor. Workers selectspecific configurations from the user interfaces. For instance, the drying kilnshave 20 diverse drying programs; which one to choose is communicated viathe paper work schedule in the edge layer.
Summarizing Case REF
REF does not employ a dedicated system for production data collection. In-stead, data is recoded manually on paper. Integration with the ERP systemis realized manually. All production operations are managed in the SAPsystem and self-created Excel tools. REF uses paper documents for com-municating production tasks to the plant floor and for recording productiondata.
4.2.4 Production of EnginesENG assembles, checks, and varnishes engines. Located on the plant floorare several production units for different production tasks. A unit for onetask may have several production stations that can be physically distributedacross the shop floor. For example, ENG has three stations for post assembly.These stations are identical in terms of the tasks that they can conduct andare subdivided into several production cells.
Figure 4.12 depicts an abstracted exemplary process model for producinga certain engine type. The process starts with the material intake whichis conducted by a completely automated transport system. Robots au-tonomously unload and load incoming trucks and transport the materialto its destination in the shop floor. Therefore, the incoming trucks are all la-beled with HF RFID tags. The gates at the material intake read the content
107

Assembly
MaterialIntake
PostAssembly
Repair
Check
PostAssemblyStation 1
AssemblyLine
AutomaticVarnishing
TestStation
ManualVarnishing
VarnishingStationRobotAssembly
Line
Materials Ready
AutomatedIntakeStation
ProductionDone
Machine
Function
Event
Legend
Process Flow
Logical XOR
TransportingAutomatedTransportSystem
TransportingAutomatedTransportSystem
TransportingAutomatedTransportSystem
RepairSystem
TransportingAutomatedTransportSystem
PostAssembly
TransportingAutomatedTransportSystem
TransportingAutomatedTransportSystem
PostAssembly
PostAssemblyStation 2
PostAssemblyStation 3
Repair
Figure 4.12: Production process for engines.
of the truck with an RFID reader and trigger an unloading conveyor if a truckwith the correct load is present. The load is then piled up and an automatedtransport system (ATS) with driverless forklifts moves the materials to theirdestination on the plant floor. This central transport system also controls allfurther transportation of materials throughout the production. It calculatesa globally efficient transportation using all forklifts in the shop floor.
After the material has been transported to the right assembly line, theassembly of an engine starts. An engine can consist of up to about 550production steps including approx. 400 different parts. The assembly beginswith mounting parts to the crankcase in one of the two assembly lines. Eachassembly line includes about 80 sequential assembly steps. At these stepsworkers and robots mount different engine parts to the crankcase. The usedmaterials and machine settings for these tasks can vary from engine to engine.Yet, the variability in the assembly lines is relatively low compared to laterpost-assembly steps (the line can construct several different variants of anengine).
Workers and machines control the assembly process as the engines movethrough the line. Workers detect visible aberrations and control their ownoperations on the engine. Additionally, machines check their sensor informa-
108
tion against reference parameters for their respective production task.At the test station workers conduct a comprehensive check of the en-
gines. Each engine requires different tests and has different setpoint valuesassociated with it. Predefined values determine if an engine can proceed tothe subsequent production step painting or requires repair. Legal regula-tions or customer requirements determine some of the setpoint values. It ismandatory to meet these values in the tests.
When the engines successfully pass the tests, the automated transportsystem moves them into a painting facility. Some engines require an addi-tional post assembly at post assembly station 2 before painting. The paintingfacility comprises two painting steps: In the first step a robot paints the en-gines. In the second step a worker checks the varnished engine and manuallyadds paint where necessary. Depending on the engine’s shape the robot mustuse different control programs. A standard program exists which they useif no other program is available. However, the standard program generallyyields suboptimal results. This increases the workload in the second paint-ing step and reduces the throughput of the painting facility. To avoid this,it is possible to adjust the robots’ CNC programs and associate them withspecific engine types.
A final post assembly step at assembly station 3 follows the painting. Likethe other post assembly step the assembly at assembly station 3 is optionaland conducted dependent on the engine type. The production of engines isaccomplished after painting or the optional last assembly step.
IT Infrastructure
We identified nine software solutions (or classes of solutions) at ENG that arerelevant for production activities and the related data management. Theseare an ERP system (SAP R/3), an integration software (SAP XI), a facilitycontrol system (FCS), a visualization system (VIS), a control system forautomated transports (ATS), worker clients for plant-floor workers, stationcontrol systems for production facilities (SCS), programmable logic controller(PLC) software for machine control, and CNC programs for robot control.Table 4.2 lists all of these systems with their abbreviations. Figure 4.13 showsthe deployment of these systems at ENG along with logical communicationlinks.
Figure 4.14 shows the physical network that realizes the described com-munication links. The investigated plant has a 10/100 MBit Ethernet con-nection. Via this connection the FCS interacts with the ERP and an externalapplication at a logistic partner of ENG. In the local area network ENG usesa 10/100 MBit Ethernet connection which interlinks PCs, servers, and PLCs
109
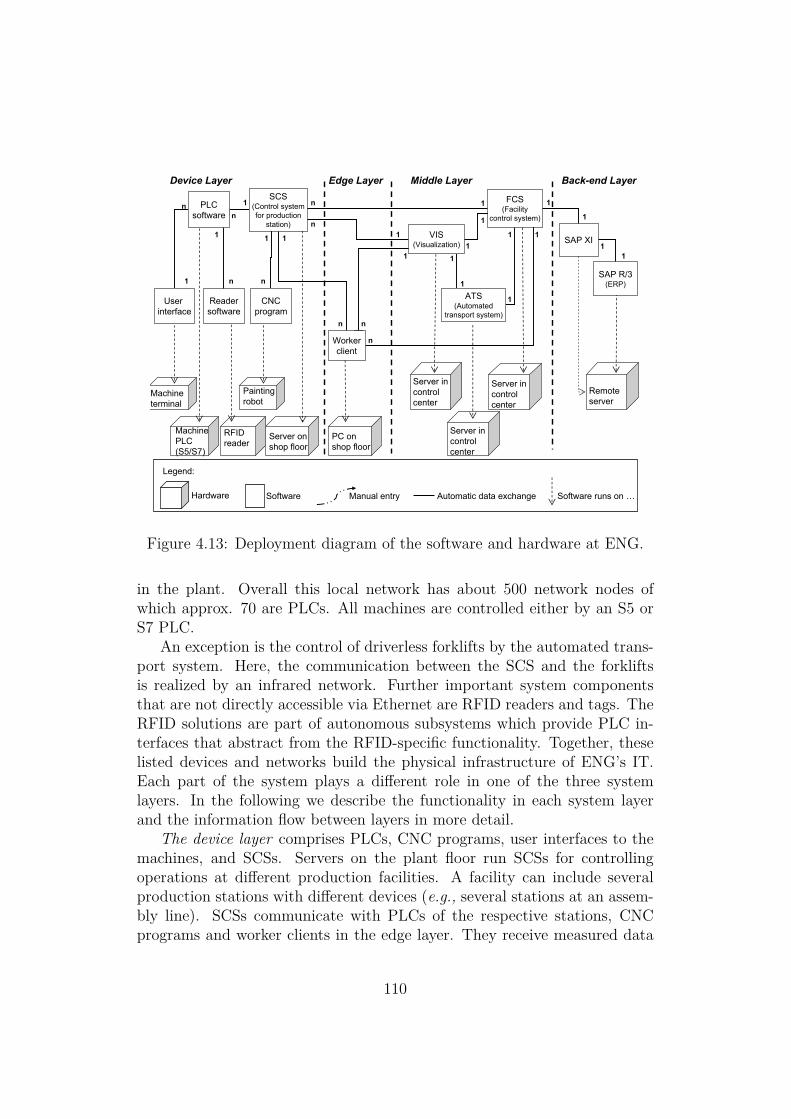
1
Remoteserver
Server incontrol center
Server incontrol center
Server incontrol center
SAP XI
Back-end Layer
PC onshop floor
Server onshop floor
MachinePLC(S5/S7)
Edge LayerDevice Layer
SAP R/3(ERP)
11
1n1 1 1
1
1
n
n
1
n
1
1
n
n
Painting robot
1
n
1
1
1ATS
(Automatedtransport system)
VIS(Visualization)
Machineterminal
User interface
n
1
Workerclient
CNCprogram
1
Middle Layer
RFIDreader
SCS(Control systemfor production
station)
Readersoftware
PLCsoftware
1
n
Hardware Manual entrySoftware
Legend:
Automatic data exchange Software runs on …
FCS(Facility
control system)
Figure 4.13: Deployment diagram of the software and hardware at ENG.
in the plant. Overall this local network has about 500 network nodes ofwhich approx. 70 are PLCs. All machines are controlled either by an S5 orS7 PLC.
An exception is the control of driverless forklifts by the automated trans-port system. Here, the communication between the SCS and the forkliftsis realized by an infrared network. Further important system componentsthat are not directly accessible via Ethernet are RFID readers and tags. TheRFID solutions are part of autonomous subsystems which provide PLC in-terfaces that abstract from the RFID-specific functionality. Together, theselisted devices and networks build the physical infrastructure of ENG’s IT.Each part of the system plays a different role in one of the three systemlayers. In the following we describe the functionality in each system layerand the information flow between layers in more detail.
The device layer comprises PLCs, CNC programs, user interfaces to themachines, and SCSs. Servers on the plant floor run SCSs for controllingoperations at different production facilities. A facility can include severalproduction stations with different devices (e.g., several stations at an assem-bly line). SCSs communicate with PLCs of the respective stations, CNCprograms and worker clients in the edge layer. They receive measured data
110

Table 4.2: Software solutions at ENGSystem Component DescriptionERP -> SAP R/3 Enterprise resource planning
SAP XI Integration softwareFCS Facility control system – similar to an MESVIS Visualization systemATS Automated transport system
PLC and CNC Programmable logic and numeric controllerSCS Station control system for production facilities
Worker Client SCS client with interface for workers
from the PLCs and manual entries from worker clients.Via the SCSs the PLCs exchange data with the VIS and the FCS in
the middle layer. That is, an SCS serves as a gateway to the middle layer.The data exchange includes status reports on the production, alerts, andengine-specific documentation of the conducted tasks. These are measure-ments related to the production of a certain engine. This information iscommunicated to the FCS along with engine-specific status reports. OverallENG records values from about 60 measurement points per engine. Statusreports and log data are forwarded to the FCS for documenting. However,the VIS receives alerts and status reports for immediate visualization of theplant’s operational status.
The painting robots download CNC programs for painting different en-gines from the respective SCS. Other machines have fixed programs but re-ceive configuration parameters along with the routing data for a task. Forexample, testing stations get parameters that determine what to measureduring the tests and what value ranges are expected. Thus, no manual con-figuration of machines is required.
Furthermore, ENG caches the data for the upcoming productions tasksbeforehand in the SCS. That is, the FCS loads all necessary informationto the SCS. It does this one hour in advance. Thereby ENG is able toseamlessly continue the production in cases of temporary downtimes of themiddle layer. The two assembly lines are special cases. Here, ENG also usesRFID technology to store routing data directly at the material carriers.
This RFID application serves two purposes: One is to support the autarkyof the assembly lines from the SCS. The other purpose is to ease the linkageof carriers with the corresponding engine and routing information. PLCs ateach assembly step read the routing information and write logging data tothe RFID tags. At the last step on the assembly lines all data from the tagsare read and forwarded to the SCS of the assembly line.
111
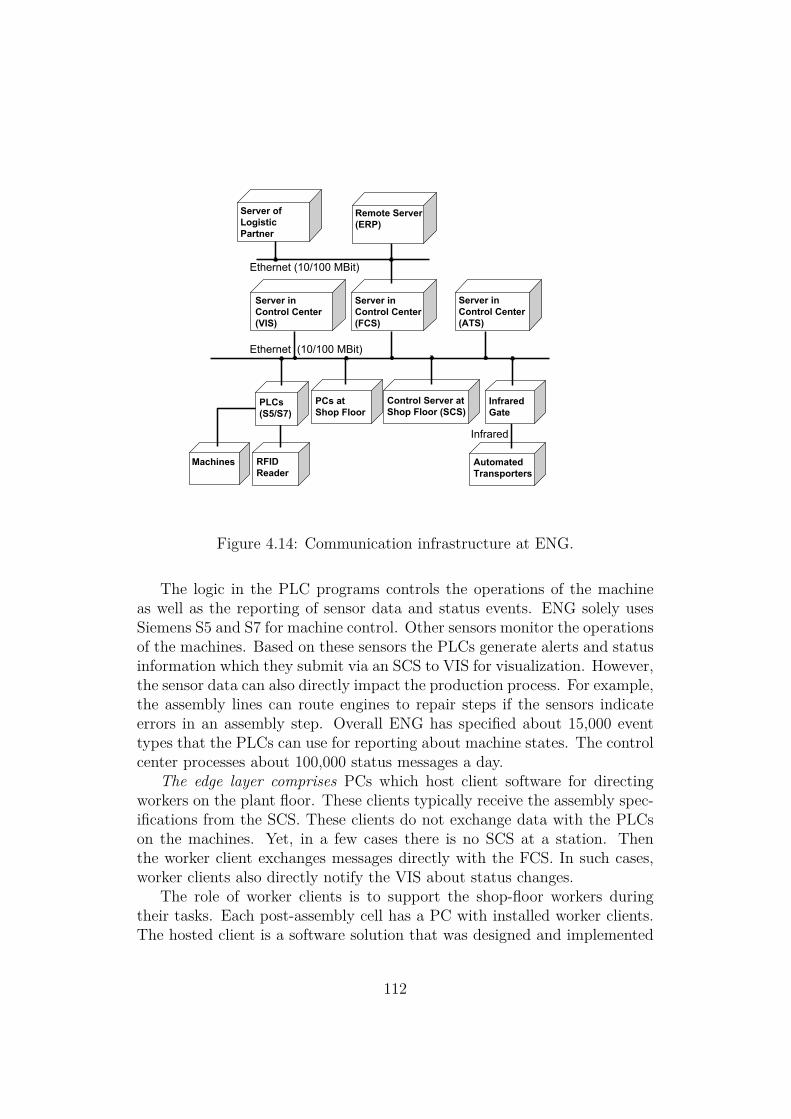
Machines RFIDReader
PLCs(S5/S7)
PCs atShop Floor
Server inControl Center(VIS)
Infrared
Server inControl Center(FCS)
Ethernet (10/100 MBit)
Server inControl Center(ATS)
Control Server at Shop Floor (SCS)
Ethernet (10/100 MBit)
Remote Server(ERP)
AutomatedTransporters
InfraredGate
Server ofLogisticPartner
Figure 4.14: Communication infrastructure at ENG.
The logic in the PLC programs controls the operations of the machineas well as the reporting of sensor data and status events. ENG solely usesSiemens S5 and S7 for machine control. Other sensors monitor the operationsof the machines. Based on these sensors the PLCs generate alerts and statusinformation which they submit via an SCS to VIS for visualization. However,the sensor data can also directly impact the production process. For example,the assembly lines can route engines to repair steps if the sensors indicateerrors in an assembly step. Overall ENG has specified about 15,000 eventtypes that the PLCs can use for reporting about machine states. The controlcenter processes about 100,000 status messages a day.
The edge layer comprises PCs which host client software for directingworkers on the plant floor. These clients typically receive the assembly spec-ifications from the SCS. These clients do not exchange data with the PLCson the machines. Yet, in a few cases there is no SCS at a station. Thenthe worker client exchanges messages directly with the FCS. In such cases,worker clients also directly notify the VIS about status changes.
The role of worker clients is to support the shop-floor workers duringtheir tasks. Each post-assembly cell has a PC with installed worker clients.The hosted client is a software solution that was designed and implemented
112
according to ENG’s specifications. Workers use the client for displaying in-formation about their upcoming assembly tasks. This includes data itemssuch as illustrative pictures and texts. For the next ten scheduled productiontasks the clients proactively request and cache the associated texts and pic-tures. Cached data remain at the client until the FCS notifies the PCs abouta new version of the data. The PCs on the shop floor display production in-formation, and serve as input devices for manual data entries. Here, workerscan report finished production tasks. Furthermore, workers can detect andreport errors.
The middle layer includes soft- and hardware that is not located on theplant floor but within the plant’s facilities. These are the FCS, the VIS, theATS and hosting servers for these systems. The production control systemFCS organizes the production tasks and manages the corresponding informa-tion exchange. The FCS runs on a server in the plant’s control center. Thesystem VIS and ATS run in the same control center but on different servers.
Production tasks coming from the ERP system describe production stepsand production units where these steps can be conducted. Yet, several workplaces within a station may be a candidate for a certain production step onthe plant floor. The FCS forwards the production task to the appropriateSCS. The SCS then autonomously decides at which work place the task willbe conducted. When the SCS receives a task it sends a request for materialto the FCS. The FCS is in charge of ordering the required materials for theupcoming production tasks in advance. The FCS sends orders to an externallogistic service provider directly via an Ethernet connection to a server ofthe logistic service provider. The FCS then receives status reports about thedelivery via the same connection.
The central transport system at ENG identifies arriving shipments andnotifies the FCS. The FCS triggers the coordination of the material transportto the production stations. Therefore, the FCS issues transportation tasks tothe ATS. The ATS in turn coordinates the autonomous forklifts on the plantfloor and reports conducted transports back to the FCS. That is, addition-ally to coordinating the ordering of material at the logistic service provider,the FCS similarly triggers the internal transport of the engines between theproduction stations.
Besides planning and control, the middle layer also includes functionalitiesfor monitoring and visualizing the operations on the plant floor. The softwarethat implements this functionality is the VIS. It is hosted in the controlcenter of the plant where the responsible employees have permanent accessto visualization terminals. The visualization interface is designed accordingto specifications of ENG. Via this interface the employees get a live view ofthe plant and the operational status of each facility. This includes display of
113
operational machine statuses in the color code of traffic lights.The employees can also see detailed machine-specific reports if needed.
That is, they can display charts on how certain performance indicators havedeveloped over time. Overall, the VIS is a sink for alerts and performancemeasures which help to spot problems in the operation. Employees in thecontrol center detect curtail aberrations. Via an internal phone system theycan directly contact workers on the plant floor and advise them to take careof the detected problems.
The back-end layer comprises soft- and hardware that is located outsidethe plant. In the ENG’s case this is the ERP system SAP R/3 and theintegration software SAP XI which are on a remote server. SAP XI facilitatesthe interaction between the back-end and the middle layer (the FCS in theplant).
ENG employs a wide range of SAP modules. Within the ERP, ENG keepsdifferent assembly specification for producing each engine type. These spec-ifications include information about the engine parts, associated productionand testing steps, machine parameters, machine programs, as well as illustra-tive texts and pictures. Note that binary data such as pictures and machineprograms are not always directly stored in the ERP. Instead some assemblyspecifications hold pointers to files in the FCS. This has historical reasons:it was not possible to store binary data in ENG’s former ERP version.
All data for the assembly specification is organized in a tree-like datastructure. The job descriptions can be derived from this tree structure. Inaddition ENG extended the SAP system table to reflect relations betweenelements in the specifications. These relations encode knowledge on howelements of the specification can be combined in a job description and whichcombinations are feasible.
The ERP system uses two interfaces for the communication with the FCS:one is order related and the other not. Through the first interface the ERPsends all orders to the FCS. The second interface is used for transmittingPLC parameters and texts and pictures for the worker clients. The FCSstores these data. The SCS or worker client pulls these data from the FCSif they are required for an order.
The information management for a production task starts in the back-end. Orders from the sales and distribution module trigger the process ofplanning in the ERP system. At this point quantity, type, delivery dates andtechnical specifications for the order are already defined. In the subsequentstep the information from the assembly specifications is resolved to create anassembly task. This task defines which production steps must be conductedwith which materials and when the task has to be completed. To estimatethe total production time of a task, the time of each sub-step is added up.
114
Based on this a task plan with the granularity of days is created.The ERP system then forwards the created task plan to the FCS. The
FCS forwards the assembly plan to the right SCS in the plant and sendspermanent status reports about the production’s progress to the ERP. Oneexception is the test station. Here the FCS reports only about the completionof an order. Generally when the ERP system receives the message “order isaccomplished” it calculates the used material for this order. The informationis then used for calculating the processing time, which is needed for planningand inventory updates. As a side effect this information may also be used bythe sales department to check the status of orders. This data is communicatedvia SAP XI to the ERP system. ENG uses for this a self-designed datastructure that is wrapped in iDOCs.
ENG uses the reported data for planning and inventory updates. Ad-ditionally, they also archive the data in the ERP. For this purpose ENGespecially extended the SAP system with additional tables. This serves astheir historian for archiving engine-specific production data. In the historytables ENG stores all measurements of machine sensors that are associatedwith a specific engine and the corresponding assembly specification. Withthe assembly specification they also store the texts for the worker clients intheir history. However, ENG does not directly store the used pictures for theworker clients in the history. Here they use pointers to the directories in theFCS.
Summarizing Case ENG
The IT infrastructure was built from scratch along with the production hall.Major components like the FCS and worker clients were developed under theguidance and with the involvement of ENG’s IT staff. The IT infrastructureis therefore very well tailored to ENG’s needs, both in terms of functionalityand architecture.
From the functional point of view ENG has implemented most function-alities of a manufacturing execution system. This includes, for instance, vi-sualization and archiving of production data as well as dedicated modules forfine-grained production planning. The solution yields some remarkable par-ticularities. One notable aspect is that not all functionalities are embeddedin the same system. In particular visualization and control are completelydecoupled. Thus, workers in the control center use different systems for de-tecting and reacting to aberrations in the production.
Another particularity of the IT at ENG is the solution for storing historydata. This is a self-designed extension of the SAP system. Engine-specificreports from the plant floor are stored in supplementary added tables. An
115

advantage of this solution is the integration in one system. Future improve-ments could address the coupling with the FCS and the integrity of historyinformation. The coupling with the FCS is currently realized via a tunnelthrough SAP XI.
Of further note is the high degree of automation in the plant floor. ENGrealized a completely paperless data management on the plant floor and alsoavoids manual configuration of machines. In addition, ENG uses an auto-mated transport system for material movements on the plant floor. Togetherwith the direct coupling of machines to the back-end this allows ENG to getan accurate and detailed view on the production in real time.
From the architectural point of view two aspects of ENG’s infrastructureare remarkable: One is the pronounced decentralization of data and logicand the other is the consequent implementation of event-driven communi-cation. Decentralization and autarky of system components was a designrequirement that ENG emphasized during the planning of the plant. This isreflected in the distribution of routing data and processing logic close to thecorresponding operations. Due to proactive caching ENG is able to continuethe production in cases of back-end downtimes for up to four hours. In addi-tion, caching at the point of operation enables ENG to realize fast responsetimes of the systems easily.
The event-driven communication of production data further improves thereactivity of the system and increases the scalability. By employing thiscommunication scheme, ENG is able to reduce load on the local networkand completely avoids bottlenecks in the managing of the 180 productionstations.
4.2.5 Production of ChemicalsCHE is a globally operating company producing various chemicals. We cate-gorize the production into batch production. In total CHE produces around5000 products. CHE produces in a 7/24 time frame and has a delivery reli-ability of 99%. The company gets orders typically 1–2 months in advance.However, JIT orders can come in at very short notice; starting productiontwo days later. Nevertheless a lead time of one week is the usual practice.
Generally the production of chemicals consists of the following steps: dos-ing of diverse chemicals, heating up the chemical mix, letting it react, per-forming quality checks, optional distilling, cooling down and finally pumpingthe chemical mix into tanks and shipping it to the customer. Figure 4.15 de-picts an abstracted exemplary process model for producing a certain chemicalmix in one production facility.
116

Quality check
Dosing
Distilling
Pumping into tanks
Production Start
Empty reactor
Production done
Machine
Function
Event
Legend
Process Flow
Logical XOR
Reaction
Chemical components
Cooling down
Waiting
Cooling down
Stock
Materialoknot ok
Heating
Adjusting
Pumping into tanks
Shipping
Return Order done
Optional components from return
Chemical mix
Worker
Chemical components
ChemicalsBinning
Chemicals can be reused
Quality check Worker
oknot ok
Heating
Figure 4.15: Production process for chemicals.
Before the production starts, a worker constructs the fine-granular pro-duction planning from the orders deposited in the ERP system. This hap-pens one day in advance. Along with planning, the worker checks whetherall needed chemical components are available in the required amounts. Forsome components this check is conducted automatically. In cases compo-nents are on hand but not in the correct amounts, CHE tries to vary thescheduled quantities in the recipe. Each batch contains between 2 and 10different components. Additionally CHE checks whether all delivered chemi-cal components satisfy the required quality standards. CHE refuses deliveredcomponents which do not meet the quality tests. The production gets theneeded clearance only when all components are available, their quality checkshave been successfully passed, and the specific amounts declared in the recipecan be applied.
After clearance, all components are put into the reactor and heated upto the point of reaction. The chemical mix reacts for a defined amount oftime. Then workers take a first sample for the quality check and send it tothe laboratory. If the check is passed, the chemical mix may optionally bedistilled and then cooled down. If the quality check fails, several steps are
117
possible depending on the specific chemical mix. Either the mixture is leftto react for a longer time, or it is heated up to support more reactions or itis adjusted with some more chemical components. The laboratory tells theworkers which one of these steps they have to conduct.
For each product the laboratory defines an exact number of samples tobe taken during production. They store this information in the recipe. Thechemical mix is only allowed to the next production step if the demandedquality checks are satisfactory. The product has to be adjusted as long asthe mix does not pass the tests. The exact time when the samples have tobe taken is also stored in the recipe. In summary, the workers take at leastthree samples during production. In the unlikely case that the product needsto undergo several quality tests – and be adjusted with a large amount ofmore components – the laboratory changes the currently used recipe.
A last quality check is taken after cooling the product down. Then the mixis either directly pumped into tanks for shipment or stays on hold. GenerallyCHE aims to produce its products as late as possible. By this they try tohave resources – tanks and reactors – available as long as possible for otherorders.
The shipped products may get returned by the customers if they arenot satisfied with the quality. In such cases the returned chemicals mayget reused in production. Sometimes they can be further adjusted to meetthe customer’s requirements or they may get used as components for otherproducts. If none of this is possible, they are binned.
IT Infrastructure
CHE has numerous production plants in several countries. Each plant hasits own specific IT processes for production. For instance, several plantsuse different software solutions for managing and controlling their produc-tion. Examples of installed MES solutions are Siemens’ Simatic IT, Werum’sPAS-X, and Wonderware ArchestrA. Nevertheless, one company-wide serviceorganization manages all these diverse IT processes. On top of these systems,CHE uses one ERP system (SAP) for the company-wide management of itsoperations.
We now describe one specific production plant. Figure 4.16 shows thedeployment diagram with the components of the plant’s IT system. In totalwe identify twelve major software components. These are the SAP ERP,Simatic IT, Simatic Batch, a LIMS, a Wrapper GUI, Batch to SQL, Analyze,OSI PI, Matrikon Process Guard, WinCC Server, WinCC Client, and PLCSoftware. Table 4.3 gives an overview of these components with a briefdescription. We drill now down to each system layer.
118

iDoc
RemoteServer
Back-end Layer
MachinePLC(S5/S7)
Simatic IT
Edge LayerDevice Layer
SAP (ERP)PLC
Software
1
n1
1SimaticBatch
2
Visualization Server
LIMSBach toSQL
OSI PI
Win CCClient
Server
1
1
1
ServerPC on shop floor
Server
Server
1
n
1
1
1
1
1
11
1
1
1
Server
MatrikonProcess
Guard
Middle Layer
Win CCServer
AnalyzeWrapper
GUI
Hardware Software
Legend:
Automatic data exchange Software runs on …
Figure 4.16: Deployment diagram of the software and hardware at CHE.
The device layer at CHE controls hardware such as boilers, tanks, andpipes that are used in the production. The PLCs steer actuators like agitatorsor valves and capture sensor data like temperature or pressure values fromthe machines. The PLCs receive control information from the edge layer andpass back event data about sensor measures. Overall, the shop floor of thesample plant has about 2500 actuators and 2500 measuring points. The PLCsare also responsible for running control logic, particularly for safety-relevantchecks. (Implementing safety-relevant logic is required by law). About 80%of the used PLCs are either S5 or S7. For communication with higher sys-tem layers they mainly use OPC via Microsoft’s Component Object Model(COM). Specifically OPC Command and OPC A/E are in use. OPC UA isnot applied. For time-critical operations CHE uses OPC with UDP and notTCP.
The edge layer at CHE comprises only WinCC clients. A number ofWinCC clients is connected to one WinCC server. Workers use these clientsfor starting/stopping production tasks and for monitoring operations. Theclients also integrate interfaces of the Simatic Batch system in the middlelayer. The WinCC clients provide user interfaces for monitoring and control-ling operations on the plant floor. They receive event data and sensor mea-
119

Table 4.3: Attributes for quality checksSystem Component DescriptionSAP ERP The ERP system at CHE.Simatic IT Siemens system for production management.Simatic Batch Siemens system for automating and
controlling batch processes.LIMS Laboratory information management system.Wrapper GUI Self-implemented solution for integrating
several functionalities of Simatic ITin one user interface.
Batch to SQL Self-implemented solution for transferringdata from Simatic Batch into arelational database.
Analyze Self-implemented tool for OSIsoft solutionfor analyzing measured values frommachine sensors.
Matrikon Process Guard Matrikon solution for managing alarmsand event messages.
WinCC Server Server component of a Siemens solution for(belongs to PCS7) process visualization and control.WinCC Client Client component of a Siemens solution for(belongs to PCS7) process visualization and control.PLC Software Software for PLCs on machines.(belongs to PCS7)
surements from the WinCC servers. With this information the clients gen-erate a real-time visualization of the current operations in the plant. There-fore, CHE uses a self-designed interface that graphically represents the plant.Besides observing production processes, workers use WinCC clients for con-trolling plant-floor operations. Thus, the clients also embed functionalitiesfrom the Simatic Batch in the middle layer.
The middle layer at the investigated plant includes the most system com-ponents. Core components are the WinCC server, installations of Simatic IT,and Simatic Batch. Several additional components exist for accessing data inthese systems. These are OSI PI, Matrikon Process Guard, a LIMS, and self-implemented components which we refer to as Batch to SQL, Analyze, andWrapper GUI. From these systems Simatic Batch, OSI PI, and the MatrikonProcess Guard directly interact with the WinCC servers.
Two separate WinCC servers run independently in the investigated plant.This is to keep the workload for each server at a moderate level. Due to the
120

central role of the WinCC servers their availability is crucial for the opera-tions at CHE. To ensure reliability, both WinCC servers run redundantly ontwo separate machines. That is, one machine acts as a master and the otheras a slave. The master conducts the actual operations while the slave is onlyinternally replaying the operations. This way both systems keep the samestate and the slave can seamlessly take over if the master fails.
The WinCC servers act as hubs for the communication with devices on thedevice layer, the WinCC clients, and other system components. They receivecommands from the Simatic Batch system as well as from the WinCC clientsand dispatch them to the respective PLCs. From the PLCs they captureevent messages and sensor data. These data are stored in a ring buffer fortwo weeks and passed on to WinCC clients, OSI PI, the Matrikon ProcessGuard and Simatic Batch.
OSI PI is used for long-term storage and analysis of measurement datafrom machine sensors. The WinCC servers in the edge layer store the com-plete sensor data. Yet, they only keep this data for two weeks. OSI PIretrieves an extract of this data and keeps it permanently. It also providesan interface to Microsoft Excel that is used for data analysis. The systemdirectly communicates with the WinCC servers.
Matrikon Process Guard is used for storing and managing alarms andevent messages from the shop floor. It persistently keeps an extract of theevent data coming from the plant floor. Furthermore, the Matrikon ProcessGuard is used for monitoring and controlling error messages. Here, workerscan view, edit, and discard error messages before they are passed on to othersystems. The system directly communicates with the WinCC servers.
The Simatic Batch system is the central component for controlling theproduction. That is, it receives the recipes for scheduled production processesfrom the ERP and controls the execution of the production steps accordingly.From the Simatic Batch system the production steps are scheduled and exe-cuted. This system exchanges data with the two WinCC servers. Its interfaceis also integrated in WinCC and can be controlled via WinCC clients fromthe edge layer.
The Simatic Batch system interacts with machines on the plant floor viaWinCC servers. It passes down commands for executing production stepsand receives status reports. Via the WinCC servers it is also integrated inthe interface of the WinCC clients. Users of WinCC clients can therebydirectly use the functionalities of Simatic Batch.
High reliability of the Simatic Batch system is crucial due to its centralrole in controlling the shop-floor operations. Consequently it runs redun-dantly on two independent servers. Similar to the solution for the WinCCservers, Simatic batch servers run in a master and a slave mode. The slave
121
replays the actions of the master and can seamlessly replace the master inthe case of a system failure. Systems which interact with Simatic Batch arethe self-implemented Analyze tool, and Simatic IT.
The Analyze tool was implemented to graphically evaluate data fromSimatic Batch. For this evaluation, data on production tasks (e.g., product-specific production times) are transferred to a relational database. Theself-implemented analysis tool provides workers with reports and statisticsabout the production. Therefore, data from Simatic Batch are extracted toa database via the self-implemented conversion component Batch to SQL.
Communication with further system components is realized via SimaticIT. Simatic IT is used to configure production tasks and recipes. It also facil-itates data exchange with the LIMS and ERP system (via iDoc). Simatic ITalso provides a user interface for its configuration. However, the actual accessis done via the self-implemented Wrapper GUI that provides several function-alities of Simatic IT via a single interface. CHE uses the self-implementedtool Batch to SQL for realizing this transfer. The Analyze tool creates re-ports on the information in the database, which help workers to evaluateconducted production tasks.
Simatic IT is a system for integrating different software solutions in amanufacturing environment. That is, it enables the description of manufac-turing processes and coordinates the functions of involved system compo-nents. It serves as the central hub between the Simatic Batch, the LIMSand the ERP system. The system provides graphical interfaces for configu-ration. However, the IT staff implemented a Wrapper GUI to combine a setof Simatic IT functionalities. Simatic IT, the LIMS and the Wrapper GUIall run on the same server.
The back-end layer only includes the ERP system SAP. The communica-tion with the ERP system varies among different MES. Integration with SAPcan be done via BAPI calls, IDoc, or via xMII. Hence, the exchange formatand the exchanged data can vary between the MES installations. This isbecause CHE has no abstraction layer or unified intermediate component fordata conversion in place.
The IT processes in the ERP and in the MESs are very loosely coupled.By this the production plants can operate independently from the ERP sys-tem. The diverse MESs buffer all messages for the ERP and verify the suc-cessful transmission. This is required since availability of the ERP systemcannot be guaranteed: the SAP system is regularly shut down for mainte-nance every week. Thus, the MES must run autonomously to a large extent.Consequently all production-relevant operations run locally in the MES andphysically at the plants. The maintenance of each MES is also commonlydone locally at the plants. In some cases, VPN connections enable remote
122
access for administrators. Yet, this is not realized for every system. This isbecause some plants have security concerns to connect their MES via VPNto the internet.
Furthermore, we interviewed the IT staff regarding requirements for theIT infrastructure. The identified requirements are reliability, performance,autarky, open interfaces, and security.
Reliability is crucial for the systems involved in data capturing and pro-duction control. The high degree of automation renders this requirementparticularly relevant. CHE ensures reliability by running key componentsredundantly on different servers. That is, identical components run on twodifferent servers.
High system performance is especially relevant for components that aredirectly involved in the control of production tasks. Steering machines in theplants includes time-critical tasks. CHE implements three main measures toensure fast response times and scalability of the system. The first measure isto run a great proportion of processing tasks on PLCs. This is even pursuedby law, because PLCs are considered as reliable system components. Thesecond measure is to decentralize processing by using multiple servers forcertain operations. As the third measure, CHE uses connectionless commu-nication via UDP instead of connection-oriented communication via TCP fortime-critical tasks.
Autarky of the systems for production control is required in terms of inde-pendence from the ERP back-end. The SAP system has an availability of nomore than 99.5 %. The 0.5% downtime is mainly due to maintenance tasks.To ensure seamless operations, CHE only loosely couples the IT processes ofthe plant floor with the ERP system. That is, the IT systems in the plantsstore production tasks in advance, run them independent from the ERP, andbuffer reporting messages to the ERP until delivery is verified.
Open interfaces are seen as important by the IT staff. This is becausethey tailor the system to the needs of each production. For instance, theyintegrate different system components into one graphical user interface orprogram reporting tools for production data analysis. It is therefore impor-tant that proprietary system components are accessible for self-implementedextensions. Consequently, it is perceived as an important advantage if asoftware solution provides open APIs.
Security of operational systems is important. However, the probabilityof attacks on the IT system of production plants is perceived as low. Thisis because the system is operated as a closed system. External connectionsare very limited and secured via VPN. Security is therefore not perceived asa primary concern of systems for production data acquisition.
Regarding the interaction of software components, we have identified one
123
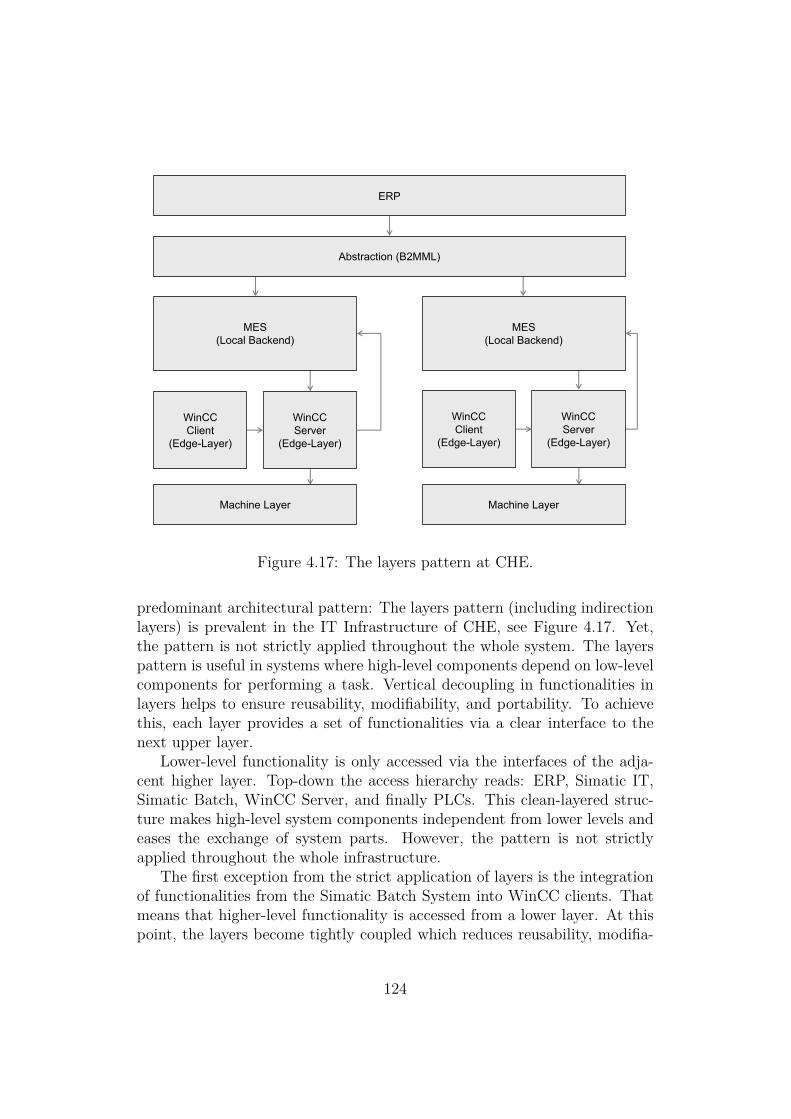
WinCCServer
(Edge-Layer)
ERP
WinCCClient
(Edge-Layer)
Machine Layer Machine Layer
WinCCServer
(Edge-Layer)
WinCCClient
(Edge-Layer)
MES(Local Backend)
MES(Local Backend)
Abstraction (B2MML)
Figure 4.17: The layers pattern at CHE.
predominant architectural pattern: The layers pattern (including indirectionlayers) is prevalent in the IT Infrastructure of CHE, see Figure 4.17. Yet,the pattern is not strictly applied throughout the whole system. The layerspattern is useful in systems where high-level components depend on low-levelcomponents for performing a task. Vertical decoupling in functionalities inlayers helps to ensure reusability, modifiability, and portability. To achievethis, each layer provides a set of functionalities via a clear interface to thenext upper layer.
Lower-level functionality is only accessed via the interfaces of the adja-cent higher layer. Top-down the access hierarchy reads: ERP, Simatic IT,Simatic Batch, WinCC Server, and finally PLCs. This clean-layered struc-ture makes high-level system components independent from lower levels andeases the exchange of system parts. However, the pattern is not strictlyapplied throughout the whole infrastructure.
The first exception from the strict application of layers is the integrationof functionalities from the Simatic Batch System into WinCC clients. Thatmeans that higher-level functionality is accessed from a lower layer. At thispoint, the layers become tightly coupled which reduces reusability, modifia-
124

bility and portability of the solution. For instance, replacing the lower-levelsystem (WinCC) with an alternative solution impacts how the higher-levelsystem (Simatic Batch) is accessed.
The second exception from the strict application of layers is the couplingof the various MESs with the ERP. At this point, we see a clear logicalseparation of the layers but no clear interface between them. Here, an indi-rection layer or intermediate representation would improve the independenceof the layers and support reusability, modifiability, as well as portability.The XML-based Business To Manufacturing Markup Language (B2MML)is a good candidate for a common intermediate data representation. Thelanguage is part of the ISA-S95 standards and is designed for the data ex-change between ERP systems and MES. CHE is currently evaluating the useof B2MML to achieve the abstraction properties of the layers pattern.
Summarizing Case CHE
The IT infrastructure is very well tailored to CHE’s needs, both in terms offunctionality and architecture. The infrastructure of CHE is an example ofarchitectures with centralized control. That is, a small number of powerfulcomputers are used for production data management. This is in contrast toarchitectures with distributed control systems on the plant floor.
Centralized control fits well to the high degree of automation and com-plex interdependent processes at CHE. Process control at CHE requires anintegrated view over large parts of the plant within one system. Such ar-chitectures can pose challenges for reliability and performance. CHE solvesthe issue of reliability by running critical system components redundantly.However, performance bottlenecks are avoided, because here CHE does notstrictly stick to the centralized approach. That is, communication with thedevice layer is realized via parallel servers.
4.2.6 Production of Power PlantsPOW produces power plants that include numerous pipelines in diverse sizesand dimensions. The production starts after the design of the plant in CADsystems. When the plant design is ready, the company sends the engineeringdrawings to the state’s certification bureau. After receiving a certificate theproduction can begin. In this study we focus on the processes along themanufacturing of pipes for power plants. This production process comprisesseven compulsory steps. The production begins with the material intake anda subsequent check that verifies the correct delivery. This is followed byvarious repetitions of welding or bending. Subsequent production steps are
125
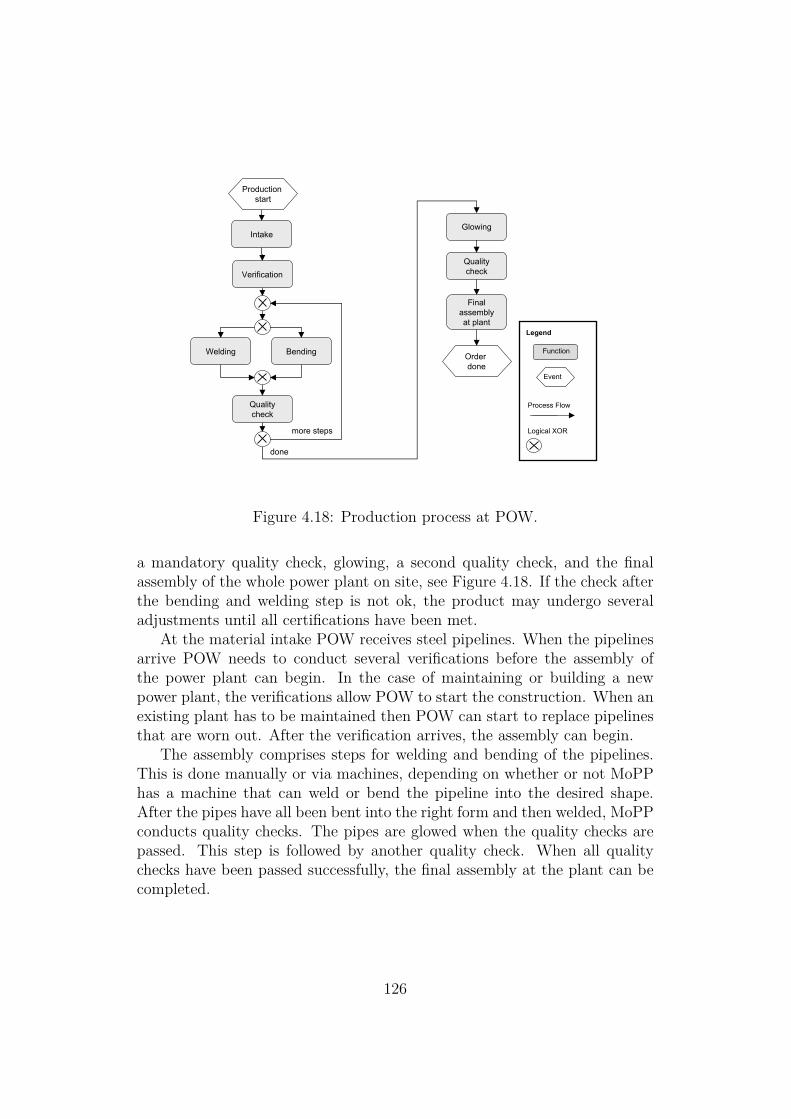
Intake
Welding
Verification
Bending
Glowing
Qualitycheck
Qualitycheck
done
more steps
Finalassemblyat plant
Production start
Order done
Function
Event
Legend
Process Flow
Logical XOR
Figure 4.18: Production process at POW.
a mandatory quality check, glowing, a second quality check, and the finalassembly of the whole power plant on site, see Figure 4.18. If the check afterthe bending and welding step is not ok, the product may undergo severaladjustments until all certifications have been met.
At the material intake POW receives steel pipelines. When the pipelinesarrive POW needs to conduct several verifications before the assembly ofthe power plant can begin. In the case of maintaining or building a newpower plant, the verifications allow POW to start the construction. When anexisting plant has to be maintained then POW can start to replace pipelinesthat are worn out. After the verification arrives, the assembly can begin.
The assembly comprises steps for welding and bending of the pipelines.This is done manually or via machines, depending on whether or not MoPPhas a machine that can weld or bend the pipeline into the desired shape.After the pipes have all been bent into the right form and then welded, MoPPconducts quality checks. The pipes are glowed when the quality checks arepassed. This step is followed by another quality check. When all qualitychecks have been passed successfully, the final assembly at the plant can becompleted.
126

IT Infrastructure
Figure 4.19 shows the physical deployment of involved software systems alongwith logical communication links.
The device layer comprises machines and their PLC devices. The onlysoftware that runs in the device layer is the PLC software. The companyuses no terminals for machine control. That is, workers configure the ma-chines directly. The reason for this thin device layer lies in the nature of theproduced products. The company does not use many machines during thewelding and bending process. Most work needs to be done manually.
The edge layer includes logging programs that log data from the PLCs.Some customers desire reports about the production process. In such a casePOW extracts the desired data from the logging program and feeds them intoreports. The data extraction is done on a case-to-case basis with manualqueries. Besides the logging program and the reports, the edge layer alsocomprises ERP clients and BHR clients.
The middle layer comprises the CAD system. The CAD system is, forexample, used for design and construction of new power plants. Furthermore,we find the BHR system in this layer. BHR is their self-programmed MESsolution. The BHR provides only simple user interfaces on UNIX shelves andbecome increasingly hard to maintain and to update. Thus, for moderniza-tion POW considers the introduction of new solutions in the future.
The back-end layer includes the ERP system, a business intelligence sys-tem, and a fileserver. The fileserver is used for all backups of all logged dataworldwide.
Two aspects are remarkable about the IT infrastructure at POW: Oneis the thin edge layer with little IT support on the plant floor. POW hassuch a thin IT solution because they only produce unique products. Forinstance, POW only has manual communication between the shop floor andthe ERP/MES. There is also no IT support in the coordination of the pro-duction. Workers get all the production plans (what they have to weld andbend) on paper documents.
The other aspect is that the IT infrastructure at POW falls into two inde-pendent parts. That is, the data flows of the log data and general feedbacksfrom the workers are completely separated. There is also no connection be-tween the log data and reports in the MES/ERP clients see Figure 4.20. Thisfigure also reveals that the IT infrastructure has a clear dominance of theclient-server patterns; there are no layers or tiers in the classical sense.
127
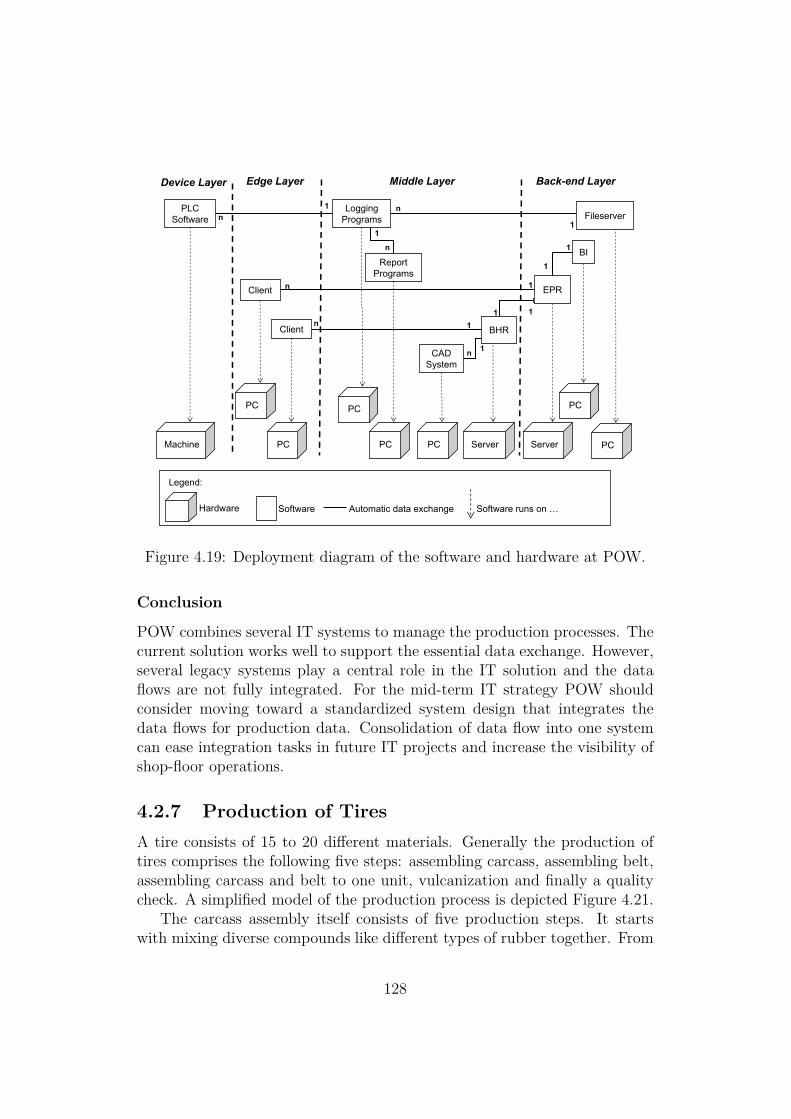
n
1
BI
Client
Client
CADSystem
PLCSoftware
ReportPrograms
PC
Machine PCPC PCPC Server
PC
Server
PC
EPR
Back-end LayerEdge LayerDevice Layer
n
1
1
n
n
n
n
1
1
1
1
11
LoggingPrograms
1
n
Middle Layer
Fileserver
BHR
Hardware Software
Legend:
Automatic data exchange Software runs on …
Figure 4.19: Deployment diagram of the software and hardware at POW.
Conclusion
POW combines several IT systems to manage the production processes. Thecurrent solution works well to support the essential data exchange. However,several legacy systems play a central role in the IT solution and the dataflows are not fully integrated. For the mid-term IT strategy POW shouldconsider moving toward a standardized system design that integrates thedata flows for production data. Consolidation of data flow into one systemcan ease integration tasks in future IT projects and increase the visibility ofshop-floor operations.
4.2.7 Production of TiresA tire consists of 15 to 20 different materials. Generally the production oftires comprises the following five steps: assembling carcass, assembling belt,assembling carcass and belt to one unit, vulcanization and finally a qualitycheck. A simplified model of the production process is depicted Figure 4.21.
The carcass assembly itself consists of five production steps. It startswith mixing diverse compounds like different types of rubber together. From
128
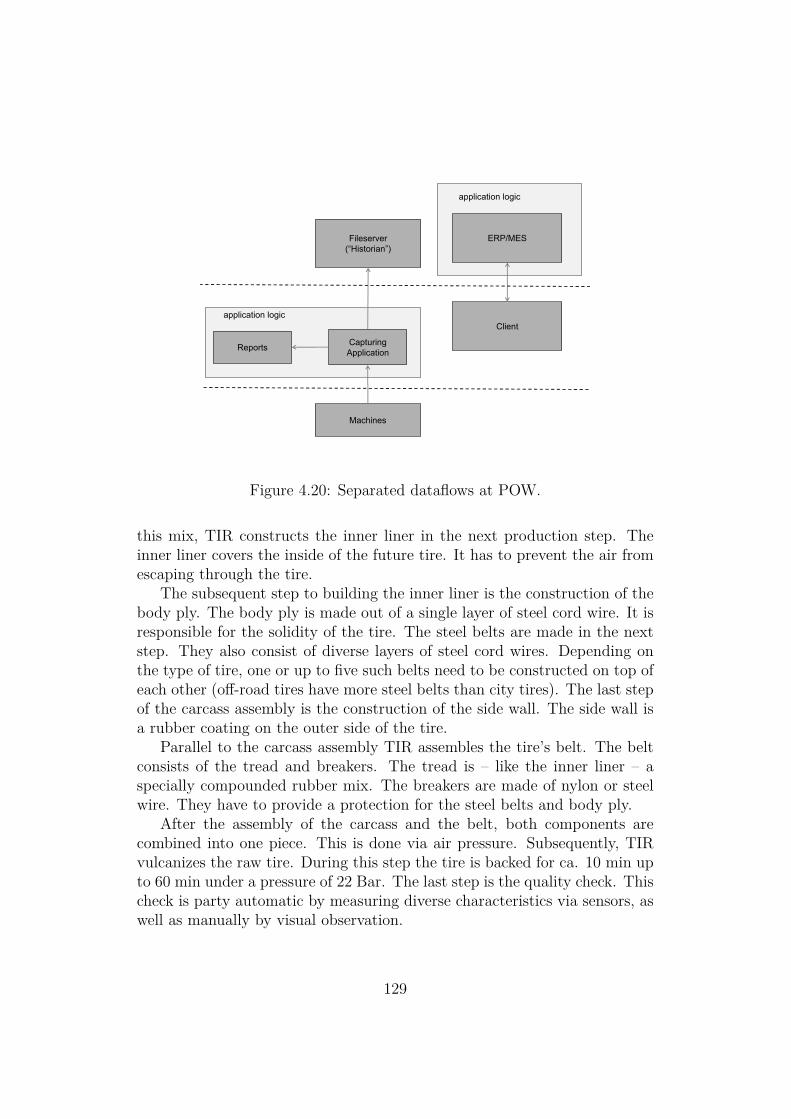
Fileserver(“Historian”)
Machines
ERP/MES
Client
CapturingApplicationReports
application logic
application logic
Figure 4.20: Separated dataflows at POW.
this mix, TIR constructs the inner liner in the next production step. Theinner liner covers the inside of the future tire. It has to prevent the air fromescaping through the tire.
The subsequent step to building the inner liner is the construction of thebody ply. The body ply is made out of a single layer of steel cord wire. It isresponsible for the solidity of the tire. The steel belts are made in the nextstep. They also consist of diverse layers of steel cord wires. Depending onthe type of tire, one or up to five such belts need to be constructed on top ofeach other (off-road tires have more steel belts than city tires). The last stepof the carcass assembly is the construction of the side wall. The side wall isa rubber coating on the outer side of the tire.
Parallel to the carcass assembly TIR assembles the tire’s belt. The beltconsists of the tread and breakers. The tread is – like the inner liner – aspecially compounded rubber mix. The breakers are made of nylon or steelwire. They have to provide a protection for the steel belts and body ply.
After the assembly of the carcass and the belt, both components arecombined into one piece. This is done via air pressure. Subsequently, TIRvulcanizes the raw tire. During this step the tire is backed for ca. 10 min upto 60 min under a pressure of 22 Bar. The last step is the quality check. Thischeck is party automatic by measuring diverse characteristics via sensors, aswell as manually by visual observation.
129
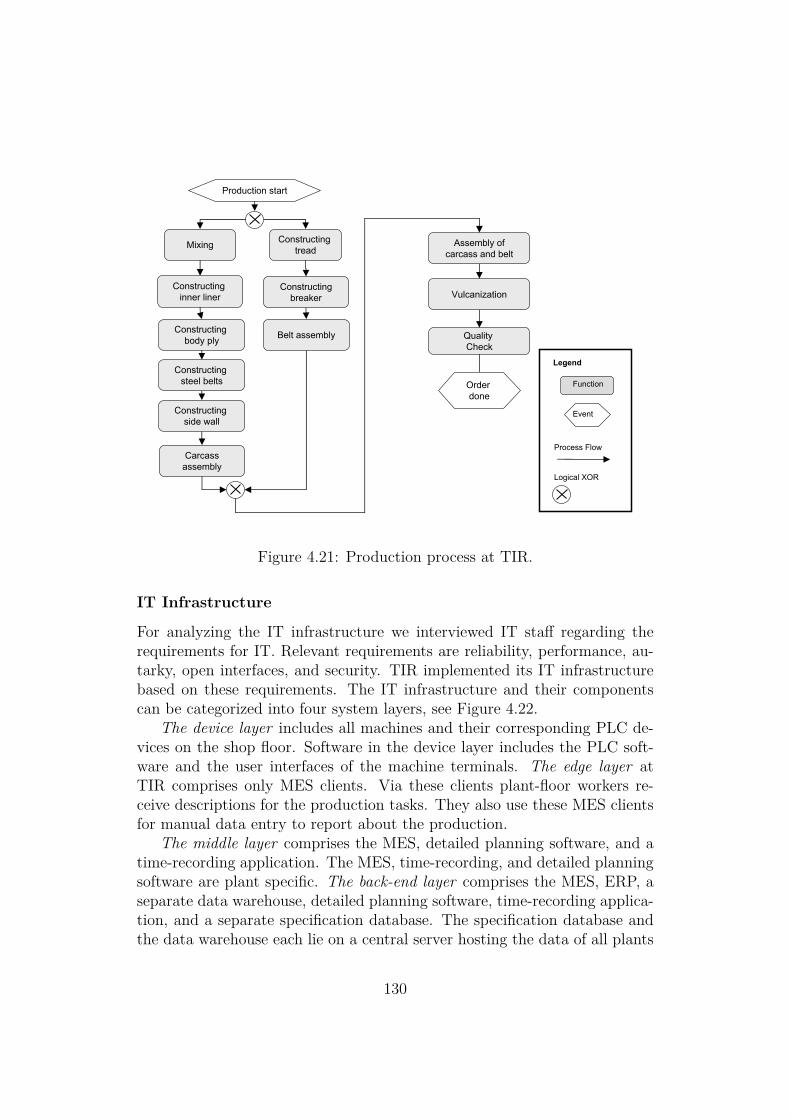
Mixing
Constructing inner liner
Assembly ofcarcass and belt
Vulcanization
Quality Check
Production start
Order done
Function
Event
Legend
Process Flow
Logical XOR
Constructing tread
Constructingbreaker
Constructing body ply Belt assembly
Constructing steel belts
Constructing side wall
Carcassassembly
Figure 4.21: Production process at TIR.
IT Infrastructure
For analyzing the IT infrastructure we interviewed IT staff regarding therequirements for IT. Relevant requirements are reliability, performance, au-tarky, open interfaces, and security. TIR implemented its IT infrastructurebased on these requirements. The IT infrastructure and their componentscan be categorized into four system layers, see Figure 4.22.
The device layer includes all machines and their corresponding PLC de-vices on the shop floor. Software in the device layer includes the PLC soft-ware and the user interfaces of the machine terminals. The edge layer atTIR comprises only MES clients. Via these clients plant-floor workers re-ceive descriptions for the production tasks. They also use these MES clientsfor manual data entry to report about the production.
The middle layer comprises the MES, detailed planning software, and atime-recording application. The MES, time-recording, and detailed planningsoftware are plant specific. The back-end layer comprises the MES, ERP, aseparate data warehouse, detailed planning software, time-recording applica-tion, and a separate specification database. The specification database andthe data warehouse each lie on a central server hosting the data of all plants
130
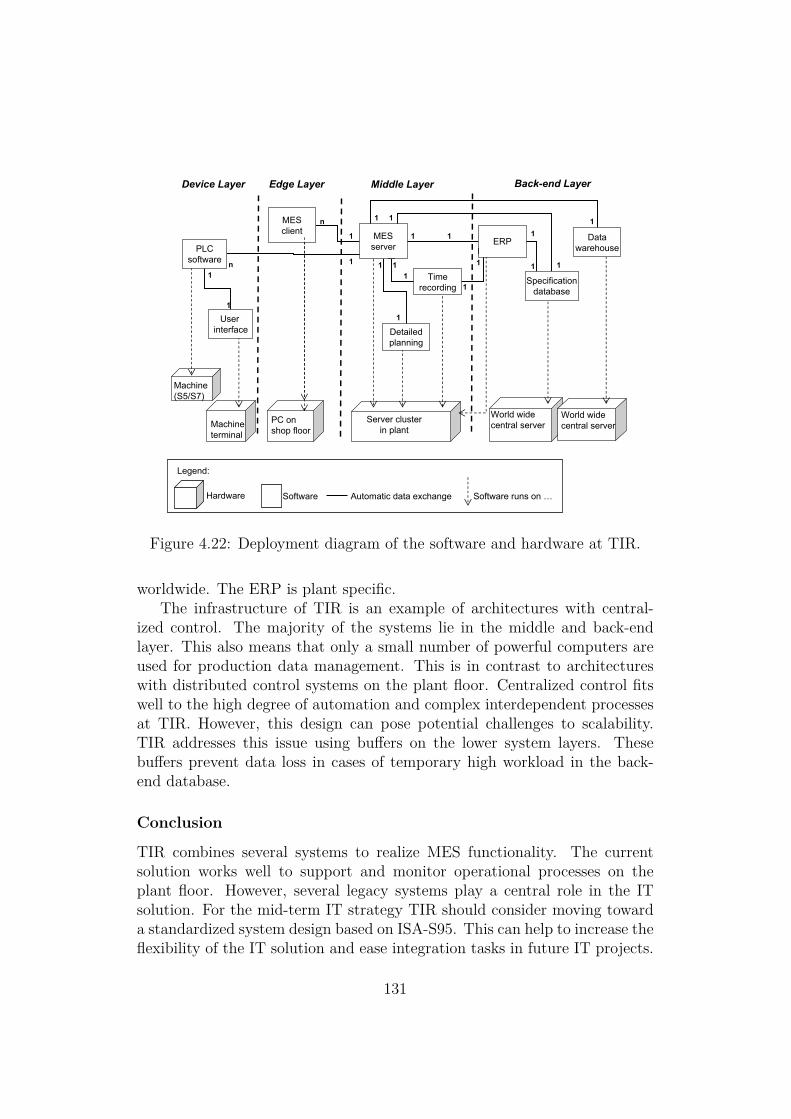
Server clusterin plant
Back-end Layer
PC onshop floor
Machine(S5/S7)
Edge LayerDevice Layer
n
1
1
World widecentral server
PLCsoftware
World widecentral server
ERP
Machineterminal
n
1 1 1
1
1
11 1
1 11
1
1 1
1
1
Hardware Software
Legend:
Automatic data exchange Software runs on …
Datawarehouse
Specificationdatabase
MESserver
Detailedplanning
Timerecording
User interface
MESclient
Middle Layer
Figure 4.22: Deployment diagram of the software and hardware at TIR.
worldwide. The ERP is plant specific.The infrastructure of TIR is an example of architectures with central-
ized control. The majority of the systems lie in the middle and back-endlayer. This also means that only a small number of powerful computers areused for production data management. This is in contrast to architectureswith distributed control systems on the plant floor. Centralized control fitswell to the high degree of automation and complex interdependent processesat TIR. However, this design can pose potential challenges to scalability.TIR addresses this issue using buffers on the lower system layers. Thesebuffers prevent data loss in cases of temporary high workload in the back-end database.
Conclusion
TIR combines several systems to realize MES functionality. The currentsolution works well to support and monitor operational processes on theplant floor. However, several legacy systems play a central role in the ITsolution. For the mid-term IT strategy TIR should consider moving towarda standardized system design based on ISA-S95. This can help to increase theflexibility of the IT solution and ease integration tasks in future IT projects.
131
4.3 Lessons LearnedThis section discusses how data acquisition and data flow is accomplished inthe case studies. The discussion also includes how activities of productionplanning are distributed across the different IT systems in common IT in-frastructures. In the following, I map the analyzed IT infrastructures and ITrequirements to the plant-to-business integrations standard ISA-S95. Thisenables us to later describe common functionalities which have to be fulfilledwhen manufacturers aim to embed RFID.
Moreover, the case studies reveal that companies use central or localproduction control depending on their specific requirements; we discuss thisin detail. Then we evaluate which activities can be supported by RFID.Most of them lie in level 3 of the ISA-S95 standard. Therefore, this sectionconcludes with an evaluation of which requirements this level has to fulfill.These requirements are according to the case studies.
4.3.1 Data Acquisition and Dataflow in IT Infrastruc-tures
Activities of production planning are commonly distributed across differentIT systems. The ERP system generates the raw production plan, see Figure4.23. This plan is then finalized in the MES and mapped to concrete machineson the shop floor. During the production, various systems in the devicelayer collect production data. The sources can be any type of senors, RFIDreaders, bar-code readers, HMIs or PLCs. Collection of source data from theshop floor provides information about the current state of the processes. Ingeneral, it is possible to divide the acquisition of data into the following fourgroups:
1. short time collection without storing (e.g., current worker, paper thatis thrown away)
2. collection on a medium from that the data cannot automatically bewritten to a back-end system (e.g., paper)
3. collection on a medium that can be read automatically and its dataeasily linked to the back-end storage (e.g., mobile PDA, RFID chips)
4. direct collection in back-end systems without using a secondary storage(e.g., MES)
After the data is acquired it needs to be fed into the IT systems. Thisis then followed by various stages of processing, storage and use of the data.
132
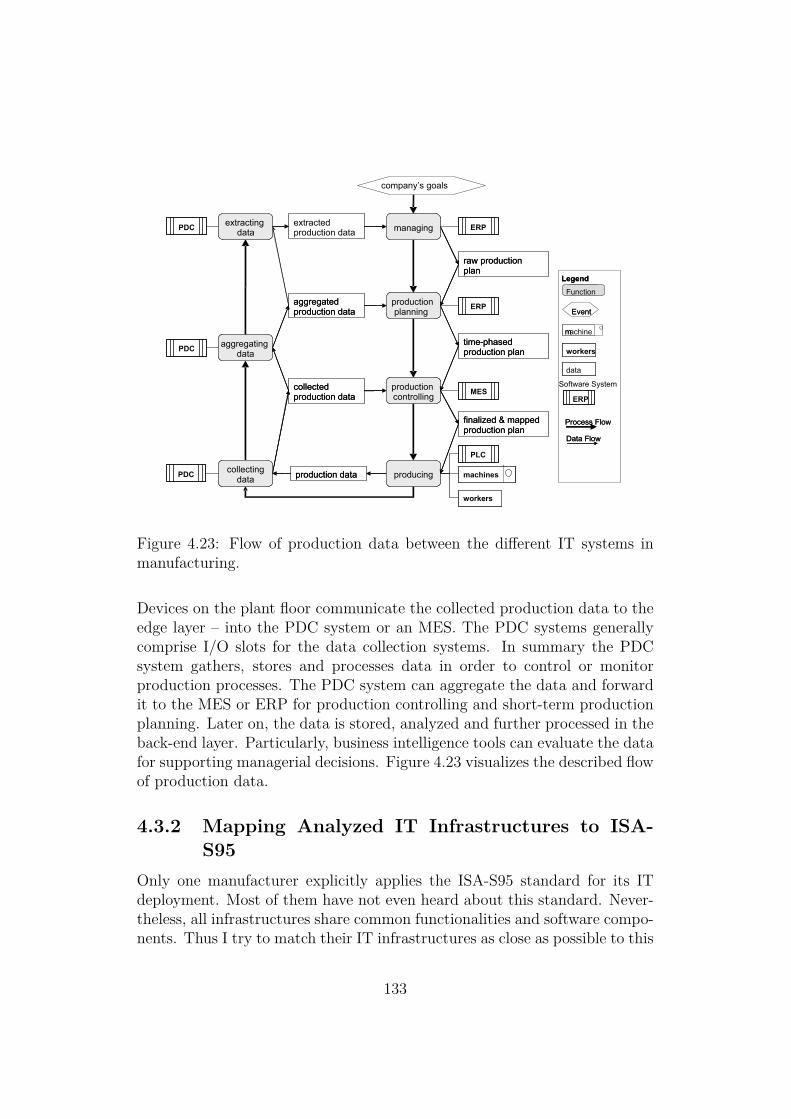
machine
Function
Event
Legend
Process Flow
Data Flow
workers
data
ERP
Software System
m
Function
Event
Legend
Process Flow
production planning
managing
production controlling
producingcollectingdata
aggregating data
extracting data
extracted production data
aggregated production data
PDC
PDC
PDC
ERP
ERP
MES
PLC
machines
workers
collected production data
production data
raw productionplan
time-phased production plan
finalized & mapped production plan
production planning
managing
production controlling
producingcollectingdata
aggregating data
company’s goals
extracting data
aggregated production data
machinesmachines
workersworkers
collected production data
production data
raw productionplan
time-phased production plan
finalized & mapped production plan
Data Flow
workersworkers
datadata
Figure 4.23: Flow of production data between the different IT systems inmanufacturing.
Devices on the plant floor communicate the collected production data to theedge layer – into the PDC system or an MES. The PDC systems generallycomprise I/O slots for the data collection systems. In summary the PDCsystem gathers, stores and processes data in order to control or monitorproduction processes. The PDC system can aggregate the data and forwardit to the MES or ERP for production controlling and short-term productionplanning. Later on, the data is stored, analyzed and further processed in theback-end layer. Particularly, business intelligence tools can evaluate the datafor supporting managerial decisions. Figure 4.23 visualizes the described flowof production data.
4.3.2 Mapping Analyzed IT Infrastructures to ISA-S95
Only one manufacturer explicitly applies the ISA-S95 standard for its ITdeployment. Most of them have not even heard about this standard. Never-theless, all infrastructures share common functionalities and software compo-nents. Thus I try to match their IT infrastructures as close as possible to this
133

standard. This enables us to later describe – along a well-defined standard– common functionalities which have to be fulfilled when manufacturers aimto embed RFID.
In the case studies we use device, edge, middle, and back-end layer forthe deployment of IT infrastructures. In this section I map these four layersto the ISA-S95 standard. The device layer comprises user interfaces on themachines, PLC software, and distributed control systems. This layer can bematched to ISA-S95 level 1 and 2.
In the edge layer we put OPC servers and diverse clients like MES orPDC client. This layer is not explicitly elaborated in the standard; it israther included in level 3. Following the standard level 3 includes the clientsand their associated servers. In our case studies the servers are positionedin the middle layer. This includes MES or PDC systems and related soft-ware components. The software components can be programs responsible forvisualization of the shop floor, logging programs – also referred to as histo-rians, or utility maintenance software. In the back-end layer we position theERP system, data warehouse, and business intelligence systems. This layermatches to level 4 of the ISA-S95 standard.
When integrating RFID, we would position it into the device layer. Ac-cording to ISA-S95 RFID readers belong to level 1. Only when a distributedcontrol system is in place would the RFID data then have to be processedalready in the device layer, or level 2, respectively. Otherwise the data goesdirectly to MES systems in the middle layer, or level 3, respectively.
4.3.3 Central Versus Local Production ControlWe observed two approaches to production control: production control witha central component, and decentralized production control. It depends on theproduction environment as to which option is favorable. Production controlwith a central component is depicted in Figure 4.24. Here the productioncontrol is accomplished in three steps. The first step is the generation of aproduction plan in the ERP system. This can be mapped to ISA-S95 level 4activities. The production plan is then coordinated in the second step. Thisincludes sending control commands and job instructions to the hardware onthe shop floor. These activities fit to ISA-S95 level 3. The instructions areperformed on the shop floor and events reported back to level 3.
This approach has little functionality on level 3. It is suitable if a detailedview of all actuators is required. Examples for such IT infrastructures are thecase studies 4.2.1 and 4.2.5. It is also suitable for lightweight infrastructureslike 4.2.3.
The advantages of this central approach are a straightforward realization
134

Machine control
Production control
ERP
Productionplan Reports
Controlcomands &Job instructions
Performance data & Event reporting
Server in remoteback-end
Server in localback-end
Hardware on theshop floor
Level 4
Level 3
Level 2
ISA- S95
Figure 4.24: Central production control.
of a central view about the whole shop floor or a specific facility. This isbecause the whole infrastructure is kept simple. However, the drawbacksare poor reliability and scalability. It is possible to increase reliability byembedding redundancies, which in return make the whole infrastructure morecomplex. Scalability is increased by integrating filters. The fever data arepushed from level 2 to level 4 and instead processed in the lower levels themore scalable the respective infrastructure is.
The second approach is decentralized production control in a hierarchy,see Figure 4.25. Production control is conducted in four steps. The first stepis also generation of a production plan in the ERP system. We can also mapthis to the ISA-S95 level 4. In the second step a detailed production plan isgenerated from the production plan. This is then split up and sent to theappropriate PCs on the shop floor. They are responsible for the productioncontrol of specific processes and the corresponding machines.
This approach has substantial functionalities in level 3. Information iskept redundant in the system. This enables a high level of scalability. It alsosupports productions with well-encapsulated tasks. An example is the case4.2.4. The advantages are higher autarky of all system components, whichreduces the problem of bottlenecks. Through this decentralization the IT
135

Productionplan Reports
Server in remoteback-end
Server in localback-end
Hardware on theshop floor
Machine controlTerminals for Process A
Production control
ERP
Machine controlTerminals for Process B
Production control forspecific processes
Production controlfor specific processes
Detailed production plan
Aggregated performance data & Event reporting
PCs on theshop floor
Control comands &Job instructions
performance data & event reporting
performance data & event reporting
Control comands &Job instructions
Aggregated performance data & Event reporting
Detailed production plan
Level 4
Level 3
Level 2
ISA- S95
ISA- S95
ISA- S95
Figure 4.25: Local production control.
systems can react faster to changes on the shop floor. Nevertheless, one hasto keep the disadvantage in mind that maintenance is more complex. Thisis also due to the problem of redundant data storage.
For both approaches RFID data processing would have to be embeddedinto those modules that are responsible for retrieving events and performancedata. In the first case the modules would lie on the server in the local backend. In the second case the location would be on the PCs on the shop floor.
4.3.4 Activities Supported by RFIDRFID technology may support most MES functionalities. The typical func-tionalities of an MES are described by MESA (Manufacturing EnterpriseSolutions Association). These include:
• Operations scheduling and production control
• Labor management
• Maintenance management
• Document control
136
• Data collection
• Quality management
• Performance analysis
In operations scheduling and production control, RFID can be used forguaranteeing process safety and interlocking. If a material or material con-tainer is equipped with a unique ID (provided via bar code or RFID), theMES can ensure that all proceeding process steps have been conducted suc-cessfully before starting the next manufacturing step. Furthermore, produc-tion order data and manufacturing parameters may be written to the RFIDtag at the first manufacturing step and then read and updated locally, pro-viding fast local data maintenance and redundancy for the MES.
Concerning labor management, plant personnel could automatically beregistered via appropriate sensor technologies. Also, it could potentially en-able the location tracking of the plant personnel. However, privacy concernsneed to be taken into account when considering such measures. In mainte-nance management, data may be stored locally at the resource in an RFIDtag. This may reduce the required paperwork for performing maintenanceand updating associated records. Regarding data collection, RFID can helpto automate the tracking and tracing of materials, Work In Process (WIP),location of mobile resources, etc. In quality management, data about thequality targets may be stored locally at the material within an RFID tag.
Moreover, there are enterprises that prefer not to use an MES and connectthe hardware controllers directly to the ERP. This is only possible if theERP is equipped to do this, i.e., if it contains modules that accept thecontroller output as input and that perform the necessary modeling andfiltering. SAP’s Auto-ID Infrastructure Bornhövd et al. [2004] provides suchfunctionalities. Moreover, vendors such as Infosys Dubey [2006] or PEAKSchultz [2007] offer middleware components that serve as interface betweenthe hardware on the shop floor and the ERP. Often, however, this includesonly a technical interface without any application and process support asprovided, for example, by an MES.
4.3.5 Requirements for the ISA-S95 Level 3Following the ISA-S95 standard, RFID data are generated on level 1 and col-lected on level 2. The data must then be integrated into level 3 for processing.But before one can integrate the data we need to know which requirementslevel 3 has to meet. Only then is it possible to fully integrate RFID datain a way that manufacturers gain full advantage out of them. As described
137
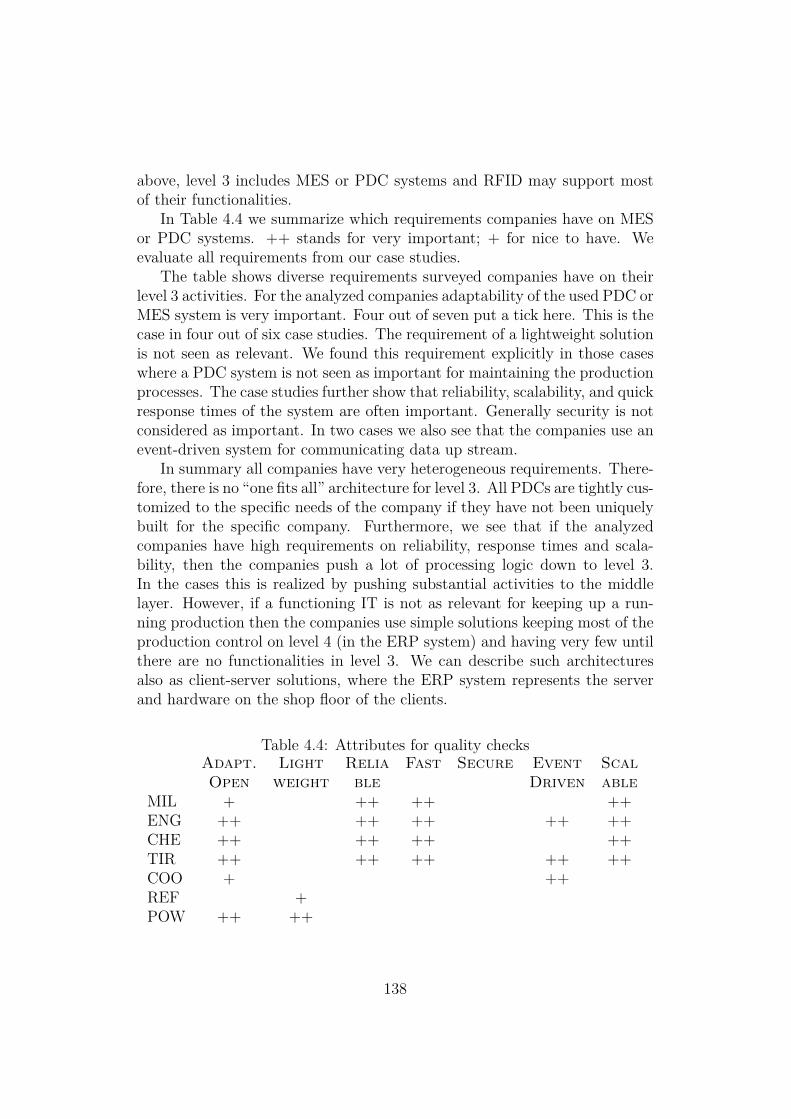
above, level 3 includes MES or PDC systems and RFID may support mostof their functionalities.
In Table 4.4 we summarize which requirements companies have on MESor PDC systems. ++ stands for very important; + for nice to have. Weevaluate all requirements from our case studies.
The table shows diverse requirements surveyed companies have on theirlevel 3 activities. For the analyzed companies adaptability of the used PDC orMES system is very important. Four out of seven put a tick here. This is thecase in four out of six case studies. The requirement of a lightweight solutionis not seen as relevant. We found this requirement explicitly in those caseswhere a PDC system is not seen as important for maintaining the productionprocesses. The case studies further show that reliability, scalability, and quickresponse times of the system are often important. Generally security is notconsidered as important. In two cases we also see that the companies use anevent-driven system for communicating data up stream.
In summary all companies have very heterogeneous requirements. There-fore, there is no “one fits all” architecture for level 3. All PDCs are tightly cus-tomized to the specific needs of the company if they have not been uniquelybuilt for the specific company. Furthermore, we see that if the analyzedcompanies have high requirements on reliability, response times and scala-bility, then the companies push a lot of processing logic down to level 3.In the cases this is realized by pushing substantial activities to the middlelayer. However, if a functioning IT is not as relevant for keeping up a run-ning production then the companies use simple solutions keeping most of theproduction control on level 4 (in the ERP system) and having very few untilthere are no functionalities in level 3. We can describe such architecturesalso as client-server solutions, where the ERP system represents the serverand hardware on the shop floor of the clients.
Table 4.4: Attributes for quality checksAdapt. Light Relia Fast Secure Event ScalOpen weight ble Driven able
MIL + ++ ++ ++ENG ++ ++ ++ ++ ++CHE ++ ++ ++ ++TIR ++ ++ ++ ++ ++COO + ++REF +POW ++ ++
138
4.4 ConclusionIn summary, all companies have very heterogeneous requirements. There isno “one fits all” IT deployment. All infrastructures are tightly customizedto the specific needs of the company. Also, software components in use areadjusted if not uniquely built for the specific company. Furthermore, we seethat if the analyzed companies have high requirements on reliability, responsetimes and scalability, then they push processing logic from the edge to themiddle layer, level 3 according to ISA-S95. However, if a functioning IT isnot the bottleneck for keeping up the production then the companies havelittle functionality in layer 3 and rather use simple client-server solutions.
Furthermore, we reveal in this chapter that IT implementations followingthe ISA-S95 standard and most IT infrastructures in practice differ. Six ofthe seven analyzed companies do not apply the ISA-S95 standard. Only onemanufacturer explicitly applies this standard for its IT deployment. Never-theless, all infrastructures share common functionalities and software compo-nents. Thus it is possible to match their IT infrastructures to this standard.This enables us to describe – along this well-defined standard – commonfunctionalities which have to be fulfilled when manufacturers aim to embedRFID. We identify such commonalities and use them to derive general designguidelines in the next chapter.
139

Chapter 5
Design Guidelines forEmbedding RFID into ITInfrastructures
As Chapter 2 shows RFID technology opens new opportunities to moni-tor and control manufacturing processes. However, Chapter 3 reveals thatIT staff faces various challenges when adapting software infrastructures forRFID. Also Strüker et al. [2008] detected recently by a survey among 102manufacturers that IT integration is a barrier. Manufacturers attach to thebarrier “complex integration into existing IT infrastructures” an importanceof 55%. It is seen as the second most important barrier after “complex in-ntegartion into cross-company business processes. Therefore in this chapterI present design principles which guide application designers in developingand adapting RFID solutions for manufacturing environments. This workwas conducted with Holger Ziekow. We published the results in Ivantysyn-ova and Ziekow [2008].
We derive the design guidelines from a Product Line Analysis (PLA).Based on the PLA we present a toolset of standard components and theirvariations along with guidelines for the application design. These guidelinescover processing paradigms for RFID data and heuristics for distributing dataand logic in the IT system. In particular we derive commonalities and varia-tions for IT systems that support RFID applications in manufacturing. Thiscovers reusable assets including requirements and functional components.Beyond this, we provide guidance for implementing the required function-ality and heuristics for mapping the software components to the hardwareinfrastructures.
The next section reviews related work. Section 5.2 presents results ofthe completed product line analysis of the manufacturing domain. Here we
140
derive common activities and required data when using RFID. Section 5.3discusses implementation issues. Section 5.4 concludes this chapter.
5.1 Related WorkWe categorize existing work on RFID application design into work for hori-zontal and work for vertical integration of RFID data. The research commu-nity has put a lot of effort into defining services for horizontally exchang-ing RFID data. The most prominent set of standards and propositionsfor enabling services for horizontal integration is the EPCglobal network.Currently specified services in this network comprise interfaces for inter-organizational data exchange [EPCglobal, 2007] and a lookup service forobject-related data [EPCglobal, 2005]. However, applications and designguidelines on top of these services target mainly scenarios outside the shopfloors of manufacturers [e.g., Angeles, 2005, Främling et al., 2006].
Work on vertical integration of RFID is embedded into the context ofRFID middleware [e.g., Bornhövd et al., 2004, Floerkemeier and Lampe,2005]. These approaches focus on functionalities and requirements for readermanagement and data filtering. Here Moon and Yeom [2007] identified ab-stract functional components that are common for general RFID applica-tions. They identify general interfaces and functionalities.
In contrast to all these works we explicitly focus on shop-floor applicationsin manufacturing. For the components that we derive in the domain-specificrequirement analysis we provide concrete implementation approaches. Un-like existing work our design guidelines also provide heuristics for physicallydistributing processing logic and required data within the IT infrastructureof manufacturers. These guidelines will ease the integration of RFID systemsand middleware components in manufacturing environments.
5.2 RFID in Manufacturing: Common Func-tionalities
In this section we present our key findings of the domain analysis. We conductthe analysis based on the method of Moon et al. [2005]. Using this method weidentify common activities and variations in IT applications supporting RFIDin manufacturing. Our results focus on common activities which a softwaresolution for RFID in manufacturing should generally support. We relatethese common activities to the required input data from different softwaresystems. Thereby, we provide cornerstones for the architectural design of
141
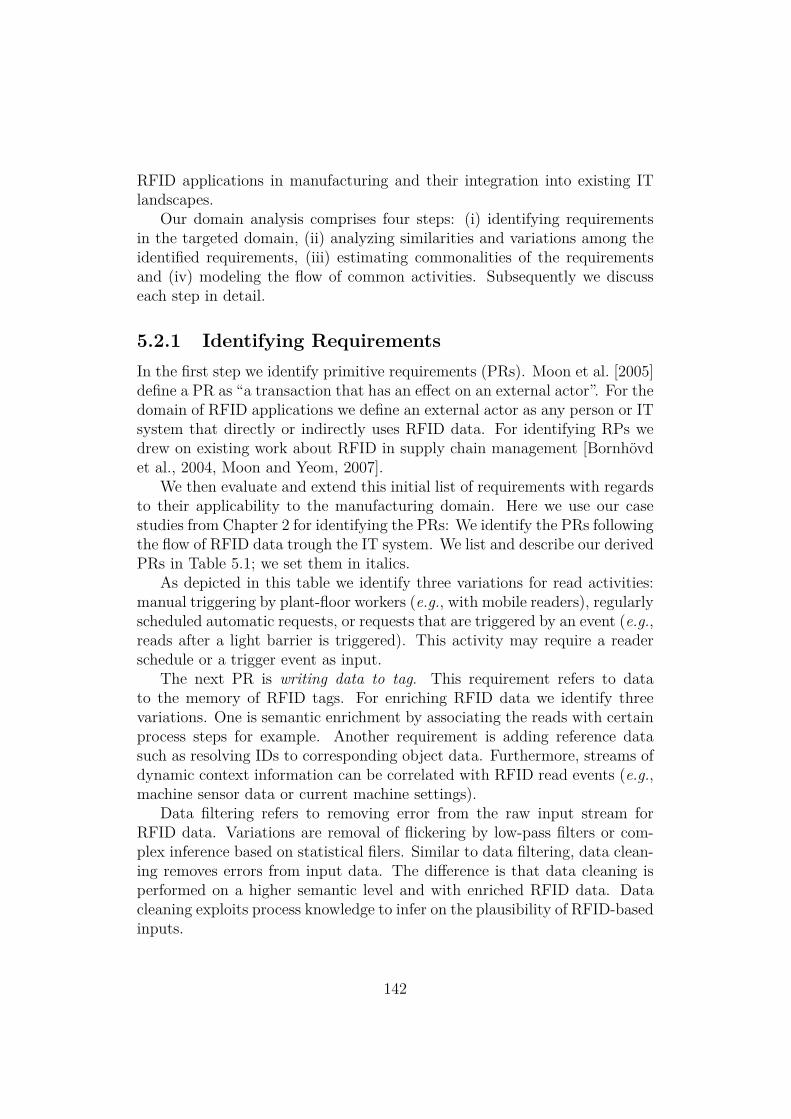
RFID applications in manufacturing and their integration into existing ITlandscapes.
Our domain analysis comprises four steps: (i) identifying requirementsin the targeted domain, (ii) analyzing similarities and variations among theidentified requirements, (iii) estimating commonalities of the requirementsand (iv) modeling the flow of common activities. Subsequently we discusseach step in detail.
5.2.1 Identifying RequirementsIn the first step we identify primitive requirements (PRs). Moon et al. [2005]define a PR as “a transaction that has an effect on an external actor”. For thedomain of RFID applications we define an external actor as any person or ITsystem that directly or indirectly uses RFID data. For identifying RPs wedrew on existing work about RFID in supply chain management [Bornhövdet al., 2004, Moon and Yeom, 2007].
We then evaluate and extend this initial list of requirements with regardsto their applicability to the manufacturing domain. Here we use our casestudies from Chapter 2 for identifying the PRs: We identify the PRs followingthe flow of RFID data trough the IT system. We list and describe our derivedPRs in Table 5.1; we set them in italics.
As depicted in this table we identify three variations for read activities:manual triggering by plant-floor workers (e.g., with mobile readers), regularlyscheduled automatic requests, or requests that are triggered by an event (e.g.,reads after a light barrier is triggered). This activity may require a readerschedule or a trigger event as input.
The next PR is writing data to tag. This requirement refers to datato the memory of RFID tags. For enriching RFID data we identify threevariations. One is semantic enrichment by associating the reads with certainprocess steps for example. Another requirement is adding reference datasuch as resolving IDs to corresponding object data. Furthermore, streams ofdynamic context information can be correlated with RFID read events (e.g.,machine sensor data or current machine settings).
Data filtering refers to removing error from the raw input stream forRFID data. Variations are removal of flickering by low-pass filters or com-plex inference based on statistical filers. Similar to data filtering, data clean-ing removes errors from input data. The difference is that data cleaning isperformed on a higher semantic level and with enriched RFID data. Datacleaning exploits process knowledge to infer on the plausibility of RFID-basedinputs.
142
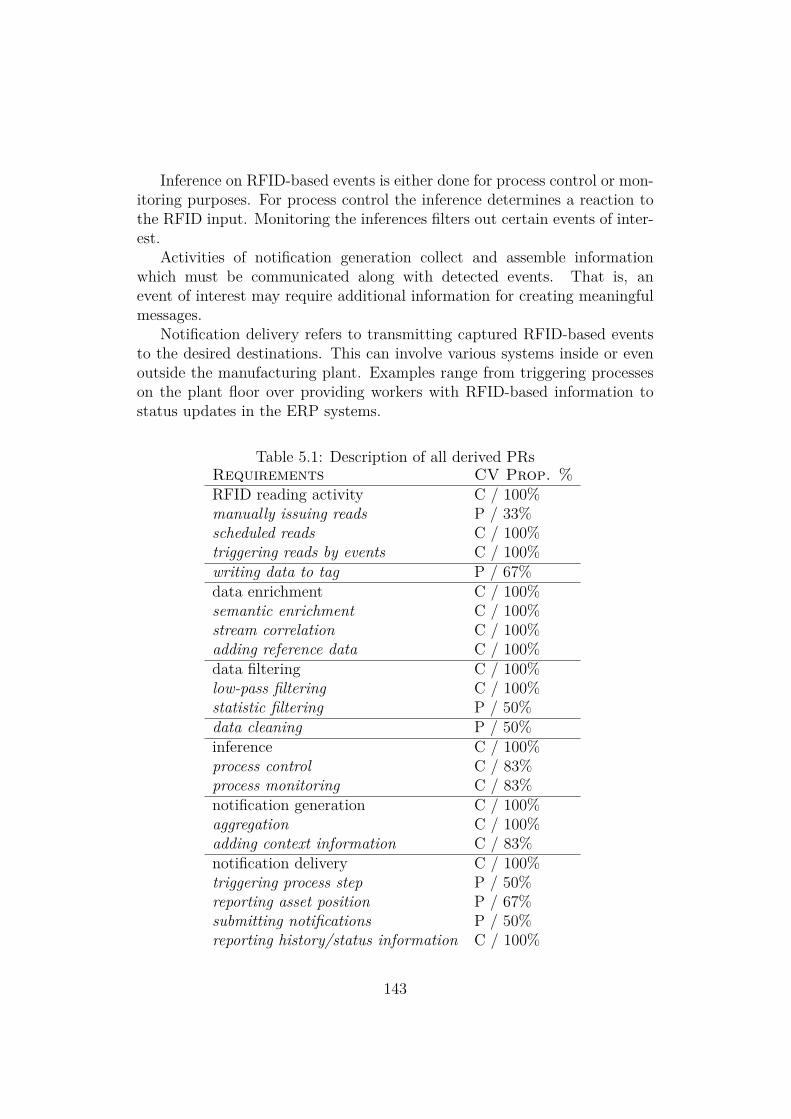
Inference on RFID-based events is either done for process control or mon-itoring purposes. For process control the inference determines a reaction tothe RFID input. Monitoring the inferences filters out certain events of inter-est.
Activities of notification generation collect and assemble informationwhich must be communicated along with detected events. That is, anevent of interest may require additional information for creating meaningfulmessages.
Notification delivery refers to transmitting captured RFID-based eventsto the desired destinations. This can involve various systems inside or evenoutside the manufacturing plant. Examples range from triggering processeson the plant floor over providing workers with RFID-based information tostatus updates in the ERP systems.
Table 5.1: Description of all derived PRsRequirements CV Prop. %RFID reading activity C / 100%manually issuing reads P / 33%scheduled reads C / 100%triggering reads by events C / 100%writing data to tag P / 67%data enrichment C / 100%semantic enrichment C / 100%stream correlation C / 100%adding reference data C / 100%data filtering C / 100%low-pass filtering C / 100%statistic filtering P / 50%data cleaning P / 50%inference C / 100%process control C / 83%process monitoring C / 83%notification generation C / 100%aggregation C / 100%adding context information C / 83%notification delivery C / 100%triggering process step P / 50%reporting asset position P / 67%submitting notifications P / 50%reporting history/status information C / 100%
143
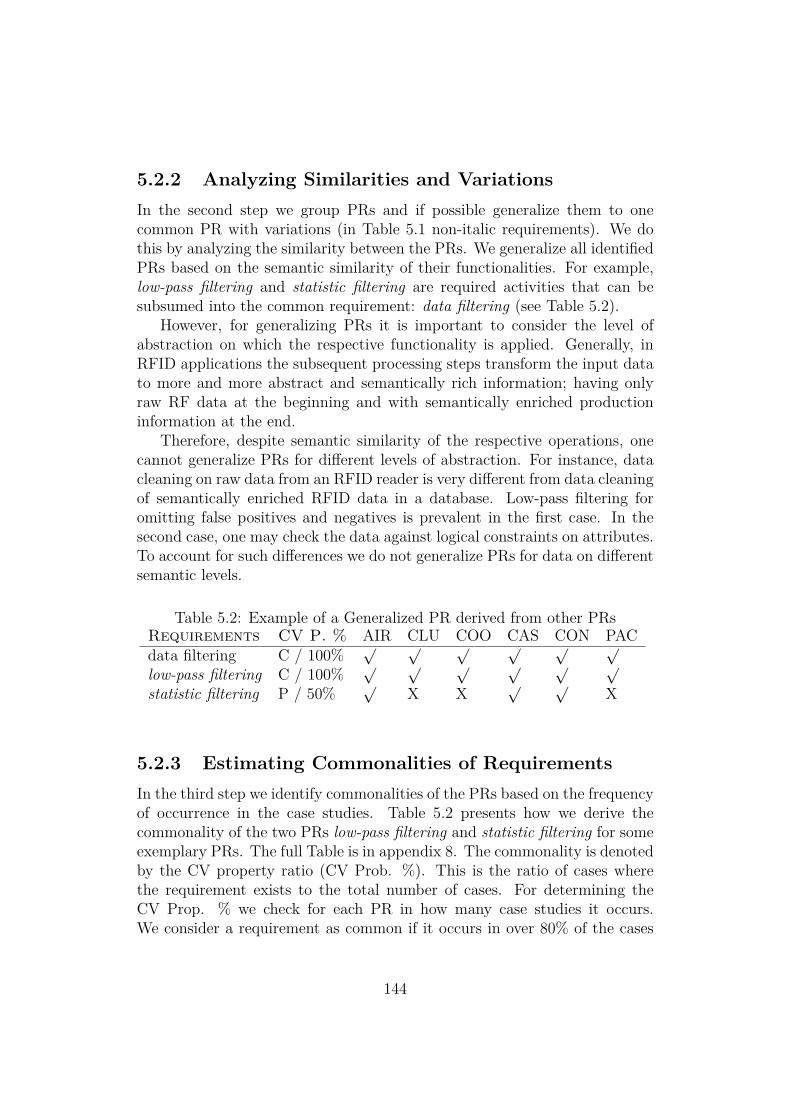
5.2.2 Analyzing Similarities and VariationsIn the second step we group PRs and if possible generalize them to onecommon PR with variations (in Table 5.1 non-italic requirements). We dothis by analyzing the similarity between the PRs. We generalize all identifiedPRs based on the semantic similarity of their functionalities. For example,low-pass filtering and statistic filtering are required activities that can besubsumed into the common requirement: data filtering (see Table 5.2).
However, for generalizing PRs it is important to consider the level ofabstraction on which the respective functionality is applied. Generally, inRFID applications the subsequent processing steps transform the input datato more and more abstract and semantically rich information; having onlyraw RF data at the beginning and with semantically enriched productioninformation at the end.
Therefore, despite semantic similarity of the respective operations, onecannot generalize PRs for different levels of abstraction. For instance, datacleaning on raw data from an RFID reader is very different from data cleaningof semantically enriched RFID data in a database. Low-pass filtering foromitting false positives and negatives is prevalent in the first case. In thesecond case, one may check the data against logical constraints on attributes.To account for such differences we do not generalize PRs for data on differentsemantic levels.
Table 5.2: Example of a Generalized PR derived from other PRsRequirements CV P. % AIR CLU COO CAS CON PACdata filtering C / 100%
√ √ √ √ √ √
low-pass filtering C / 100%√ √ √ √ √ √
statistic filtering P / 50%√
X X√ √
X
5.2.3 Estimating Commonalities of RequirementsIn the third step we identify commonalities of the PRs based on the frequencyof occurrence in the case studies. Table 5.2 presents how we derive thecommonality of the two PRs low-pass filtering and statistic filtering for someexemplary PRs. The full Table is in appendix 8. The commonality is denotedby the CV property ratio (CV Prob. %). This is the ratio of cases wherethe requirement exists to the total number of cases. For determining theCV Prop. % we check for each PR in how many case studies it occurs.We consider a requirement as common if it occurs in over 80% of the cases
144
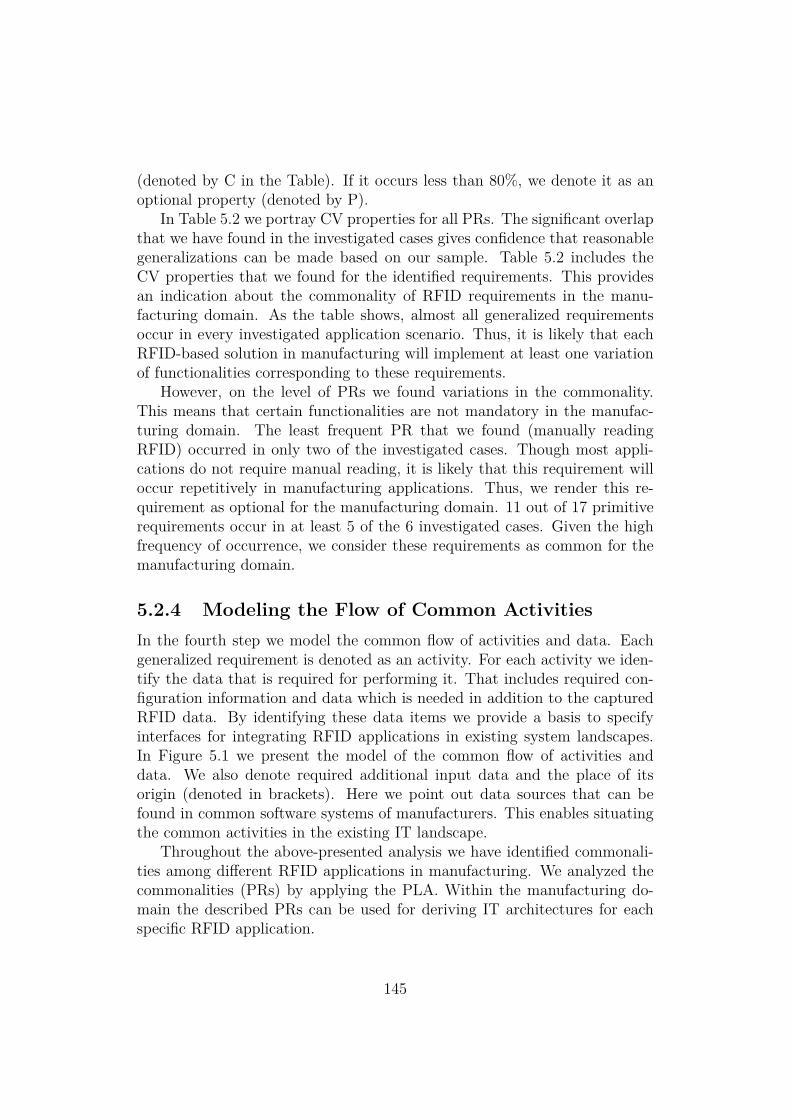
(denoted by C in the Table). If it occurs less than 80%, we denote it as anoptional property (denoted by P).
In Table 5.2 we portray CV properties for all PRs. The significant overlapthat we have found in the investigated cases gives confidence that reasonablegeneralizations can be made based on our sample. Table 5.2 includes theCV properties that we found for the identified requirements. This providesan indication about the commonality of RFID requirements in the manu-facturing domain. As the table shows, almost all generalized requirementsoccur in every investigated application scenario. Thus, it is likely that eachRFID-based solution in manufacturing will implement at least one variationof functionalities corresponding to these requirements.
However, on the level of PRs we found variations in the commonality.This means that certain functionalities are not mandatory in the manufac-turing domain. The least frequent PR that we found (manually readingRFID) occurred in only two of the investigated cases. Though most appli-cations do not require manual reading, it is likely that this requirement willoccur repetitively in manufacturing applications. Thus, we render this re-quirement as optional for the manufacturing domain. 11 out of 17 primitiverequirements occur in at least 5 of the 6 investigated cases. Given the highfrequency of occurrence, we consider these requirements as common for themanufacturing domain.
5.2.4 Modeling the Flow of Common ActivitiesIn the fourth step we model the common flow of activities and data. Eachgeneralized requirement is denoted as an activity. For each activity we iden-tify the data that is required for performing it. That includes required con-figuration information and data which is needed in addition to the capturedRFID data. By identifying these data items we provide a basis to specifyinterfaces for integrating RFID applications in existing system landscapes.In Figure 5.1 we present the model of the common flow of activities anddata. We also denote required additional input data and the place of itsorigin (denoted in brackets). Here we point out data sources that can befound in common software systems of manufacturers. This enables situatingthe common activities in the existing IT landscape.
Throughout the above-presented analysis we have identified commonali-ties among different RFID applications in manufacturing. We analyzed thecommonalities (PRs) by applying the PLA. Within the manufacturing do-main the described PRs can be used for deriving IT architectures for eachspecific RFID application.
145
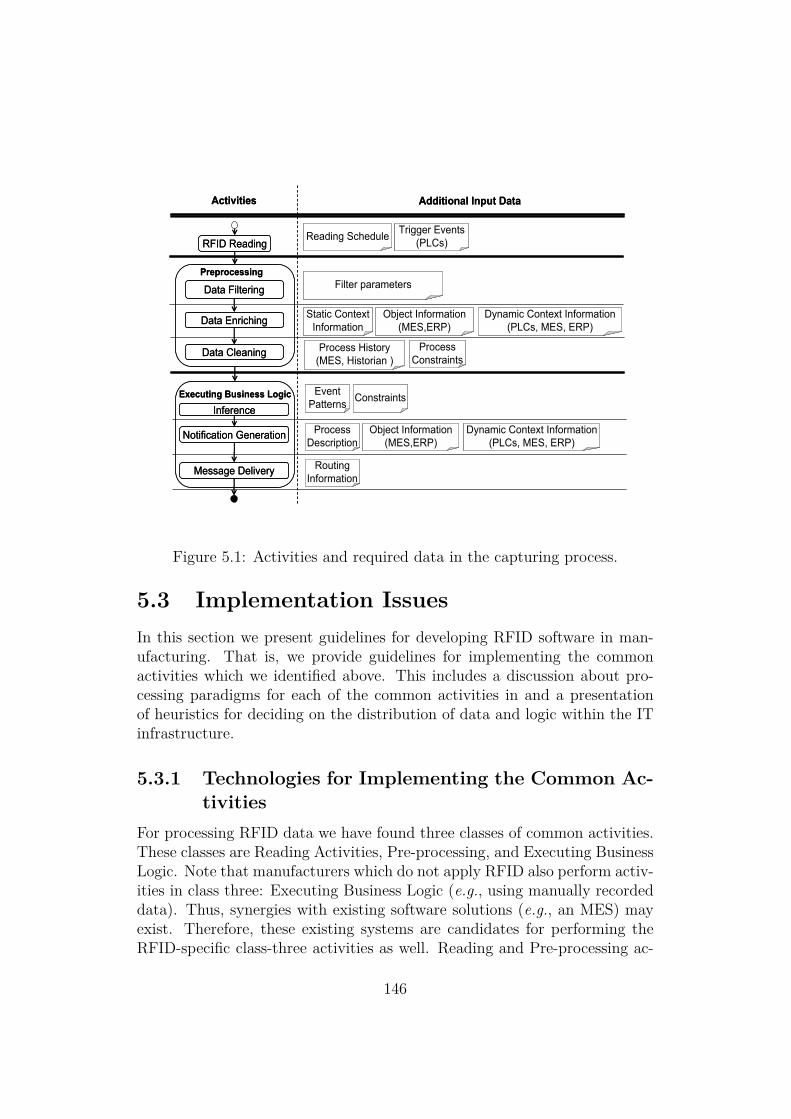
RFID Reading
Activities
Preprocessing
Inference
Notification Generation
Message Delivery
Additional Input Data
Executing Business Logic
Data Filtering
Data Enriching
Data Cleaning
Reading Schedule Trigger Events(PLCs)
Filter parameters
Static ContextInformation
Object Information(MES,ERP)
Dynamic Context Information(PLCs, MES, ERP)
Process History(MES, Historian )
ProcessConstraints
EventPatterns Constraints
ProcessDescription
Object Information(MES,ERP)
Dynamic Context Information(PLCs, MES, ERP)
RoutingInformation
Figure 5.1: Activities and required data in the capturing process.
5.3 Implementation IssuesIn this section we present guidelines for developing RFID software in man-ufacturing. That is, we provide guidelines for implementing the commonactivities which we identified above. This includes a discussion about pro-cessing paradigms for each of the common activities in and a presentationof heuristics for deciding on the distribution of data and logic within the ITinfrastructure.
5.3.1 Technologies for Implementing the Common Ac-tivities
For processing RFID data we have found three classes of common activities.These classes are Reading Activities, Pre-processing, and Executing BusinessLogic. Note that manufacturers which do not apply RFID also perform activ-ities in class three: Executing Business Logic (e.g., using manually recordeddata). Thus, synergies with existing software solutions (e.g., an MES) mayexist. Therefore, these existing systems are candidates for performing theRFID-specific class-three activities as well. Reading and Pre-processing ac-
146

tivities are to a large extent RFID specific. These activities require dedicatedor specially adapted solutions. Subsequently we discuss technologies for im-plementing each activity in all three classes in detail.
Reading Activities
The first activity is capturing raw read events, see Figure 5.1. This activityoccurs in the device layer. In general there are three options for capturingread events. These are regularly polling read requests, event-triggered reads,and manual reads. For regular polling one must create schedules that avoidcollisions between readers with overlapping signal fields. For example, acentral control system can avoid signal collisions [Goyal, 2003]. Alternatively,it is possible to use a decentralized solution where agents on the readersnegotiate a schedule [Spiess, 2005].
For event-triggered reads it is necessary to couple readers with an externalactuator. Especially in the production environment, activities in the produc-tion process can trigger reads: a tag on a material carrier is read out when amachine loads the carrier. However, this requires coupling the machine sen-sors to the controller of the RFID reader. For manual reads, workers needan interface to readers. This is commonly the case for mobile readers whichtypically come to be used in scenarios with manually issued RFID reads.
Data Filtering Activities
After capturing the raw read events, the data must be filtered. Existingsolutions in the device layer use low-pass filters to avoid flickering and cancelout double reads [Bornhövd et al., 2004]. However, simple low-pass filteringwith fixed filter windows is not suitable in every application.
In our case studies we frequently found conditions on the plant floor thatare challenging for RFID installations. This includes presence of metal andspatial proximity of different reading points. This causes the need for moreadvanced filters that can be configured to account for particularities of shop-floor conditions. Such filters must be implemented in the software positionedin the edge layer.
Jeffery et al. [2006] have proposed an adaptive filtering solution basedon characteristics of the underlying data stream. Brusey et al. [2003] usestatistical filters that weight read events to account for particular physicalconditions in a specific application scenario. The applied RFID system shouldtherefore provide the option of embedding a range of highly configurablefiltering solutions.
147
Data Enriching Activities
A simple solution for enriching filtered RFID events with additional data isusing a relational database. Here one could dump the incoming data in atable and run batch processes for creating the correlations. This is mainlyconducted in the middle layer. However, this approach does not account forthe streaming nature of RFID events. One disadvantage of the batch-drivenparadigm is that it decouples execution time from the arrival time of events.Batch processing is therefore contrary to real-time requirements.
Furthermore, query languages for databases have poor support for oper-ations on data streams [Babu and Widom, 2001]. Dedicated stream enginesexist that are designed for real-time correlation of data streams with addi-tional data [Abadi et al., 2003]. These approaches match the requirements forthe data-enriching activity. Stream operators can correlate RFID read eventswith static information about their sources and dynamic information frommachine sensors. Expressive high-level languages for defining such streamoperations are available, e.g., Arasu et al. [2006]. Thus, the stream-orientedprocessing paradigm is suitable for realizing the activity of data enrichment;especially for applications with real-time requirements.
Data-Cleaning Activities
The data-cleaning activity is for checking the plausibility of detected eventsand making corrections where possible. For instance, previous scans of thepallet can allow completing missing reads in pallet scans. Also, duplicatereads from different sensors may be dropped. Jeffery et al. [2006] presenta framework for such cleaning based on stream-processing operations andpredicate checks. Here, the predicates implicitly encode process knowledge.The peculiar conditions on many plant floors make cleaning steps on this levelnecessary. Software systems for RFID applications in this domain shouldtherefore support the definition on semantic-rich rules for constraint-baseddata cleaning. This software would normally lie in the edge layer.
Pattern Matching and Notification Generation Activities
The fifth activity in the flow of common activities is inference on input datafor detecting events of interest. The sixth is for generating correspondingnotifications. From the computational point of view these are different pro-cessing tasks that are conducted in the middle layer. Yet, techniques of CEP[Luckham, 2001] cover both tasks.
CEP is of relevance whenever the events of interest result from a set ofinput events rather than from single events. The semantic aggregation of
148

CEP is necessary to avoid information overload. This applies specifically tonotifications to the back-end layer, e.g., notifications from the MES to theERP. Thus, direct support for defining and running CEP rules within theRFID solution is beneficial in many manufacturing applications.
CEP evaluates rules which define an event pattern, constraints on thepattern, and an action. In that sense CEP is similar to ECA rules in activedatabases. However, CEP rules can be triggered by arbitrary event messagesand are not limited to database-specific events (such as insert or update).This supports formulation event patterns on RFID events captured in a pro-duction process and fits to the event-driven nature of RFID data. Usingstate machines for complex event processing [Gehani et al., 1992] or adaptedPetri nets [Gatziu and Dirtrich, 1993] are options for implementing this kindof pattern evaluation.
Notification Delivery Activities
The last activity for RFID data capturing is delivering notification messagesto the respective addressees in all three layers. Here we distinguish fourdifferent communication styles. The dimensions for the distinction are push-vs. pull-based communication and direct vs. indirect addressing schemes.Periodic pull-based loading of data chunks in the manner of an ETL processis appropriate for analytic applications. Though, push-based communicationis a better fit to the event-driven generation of notification messages.
Furthermore, monitoring and control applications need more timely up-dates. This applies in particular if control applications directly steer opera-tions on the plant floor. These are arguments for applying the push-basedcommunication scheme for RFID data acquisition at manufacturers. Both,push-based and pull-based communication can be combined with direct orindirect addressing.
Direct addressing requires to explicitly denote the destinations of eachnotification type. Indirect addressing via an intermediate service decou-ples data provision from data consumption. This decoupling enables flexibleadaptation of notification delivery because data sources and recipients can bemanaged separately. Event-based systems use a notification service and pub-lish/subscribe mechanisms combine the push-based communication schemewith indirect addressing [Mühl et al., 2006]. Using such a notification servicematches to the requirements of many of the investigated application scenar-ios and should therefore be available in RFID-enabled IT infrastructures formanufacturing.
149

5.3.2 Distributing Data and LogicI now provide heuristics for decisions on the distribution of the functionalcomponents. This goes in hand with the distribution of corresponding inputand output information. Writable memory of RFID tags enables pushingdata management down to lower system layers.
RFID memory can store production data – such as recipes or productionrecords – right at the object (e.g., the product). This allows running severaloperations solely in the device or edge layer, i.e., consistency checks canrun locally on station control servers or on PCs on the shop floor withoutback-end interactions.
However, throughout the case studies we found reoccurring arguments for,as well as against decentralization. The benefits are better scalability, perfor-mance, reliability, and an eased data association with objects. The drawbacksof decentralization are worse redundancy, maintainability and inconsistency.We now describe each of the identified key benefits of decentralization andthe drawbacks.
Scalability
Decentralized systems distribute the total workload on several devices is thesystem. As the system grows, the number of devices that share a task growsas well. Furthermore, pushing aggregation and filter functions down thehierarchy to the information sources reduces network traffic and avoids over-loading higher system layers.
Performance
Performance bottlenecks in the IT can impact the productivity on the plantfloor. We found that the tolerable delay is typically about 0.5 sec for amanually issued request and in the order of milliseconds for machines. Thecause for longer delays can be delays for accessing remote systems or peaksin the workload. Placing the logic and required data close to the point ofoperation avoids the problem of network delay. Furthermore, decentralizationof processing tasks mitigates peaks in the workload.
Reliability
system failures that cause a breakdown of the production can account formajor expenses. Decentralization can help to avoid single points of failureand limit the number of affected production tasks.
150
Eased Data Association With Objects
Through the RFID-enabled decentralized information storage it is ensuredthat the information is available at the point of operation. This helps toavoid that the wrong information is associated with an object.
Redundancy
A lot of data that is collected on shop floors is not only used for steeringthe production but also to document the conducted steps. That is, a certainpercentage of the data must be available in the back-end layer. Distributingthis data to lower system layers consequently results in a certain degree ofredundancy.
Maintainability
Distributing logic across system layers adds complexity to the managementof the IT systems. This is because maintenance tasks cover systems that runat several locations and possibly different platforms. If most functionalityresides on a central system, the majority of maintenance tasks are done onthe same platform.
Inconsistency
Information on tags can only be read if the item is in the proximity of areader. Thus, for applications that require data access independently fromthe corresponding object, it is necessary to have the information availablein the network as well. Keeping data redundantly on the tags and in thenetwork bears the risk of inconsistency.
Application designers can decide on the distribution of data and logicwithin the system along these listed arguments. It depends on the particularapplication how much these arguments weigh. In our case studies we foundthat RFID applications fall into two major categories regarding the trade-offbetween centralization and decentralization. These categories are applica-tions for monitoring/analyzing and controlling/steering processes. For eachapplication category we derive guidelines for distributing processing function-ally. We base our analysis on the three previously identified main activities:RFID Reading, Pre-processing and Executing Business Logic, see Figure 5.1.
Applications for controlling/steering processes perform checks in the run-ning processes and steer the operations on the shop floor. These applicationscommonly have strong real-time constraints. That is, the production pro-cesses slow down if machines or workers have to wait for responses from the
151
IT system, e.g., case study 2.3.1. Thus, performance is typically the mainconcern. Consequently, it is often desirable to run the three activities RFIDReading, Pre-processing and Executing Business Logic in the edge and mid-dle layer and without back-end interaction. The guideline is to push theoperations as close to the physical processes as possible.
Applications formonitoring/analyzing processes support management de-cisions and help spot potentials for improvements in the production processes.Here, no real-time requirements apply. Typically, solutions like data ware-houses or reporting tools extract, process, and visualize data from severalsources on the plant floor. Such applications are often integrated in MES orERP systems. Consequently, the activities of Executing Business Logic formonitoring/analyzing processes with RFID should run in the back-end.
However, in order to ensure scalability it is desirable to reduce the inputdata on lower system layers; i.e., the edge layer. Particularly data cleaningand data filtering (part of the activity Pre-processing) reduce the amountof transmitted RFID data. Filtering raw read events can take place withindevice controllers [Bornhövd et al., 2004]. These may run on terminal PCsin the edge layer.
Data enriching and data cleaning (part of the activity Pre-processing)can require information from the back-end and other sensors on the plantfloor, see Figure 5.1. Such context information is particularly relevant formonitoring and analyzing production processes.
A suitable placement of enriching and cleaning operations is thereforewhere RFID data and required context information join. This point dependson the targeted system environment. Yet, we found that station controlservers in the middle layer are suitable for enriching and cleaning operationsin many cases. Therefore, the guideline is to join information as close to theirsources as possible and run operators of data enriching and data cleaning atthis point.
Note that design decisions on the distribution of data and logic are heavilydependent on the targeted manufacturing environment. In our case studieswe found that hardware infrastructures at manufacturers are very hetero-geneous. That is, not every device type depicted in Figure 1.1 is alwaysin place; e.g., not every manufacturer has PCs on the shop floor or stationcontrol servers for controlling several machines. Yet, most IT systems at man-ufacturers have some sort of a hierarchically structured hardware landscape.Our guidelines help the placing of operations for RFID data processing intothis hierarchy.
152
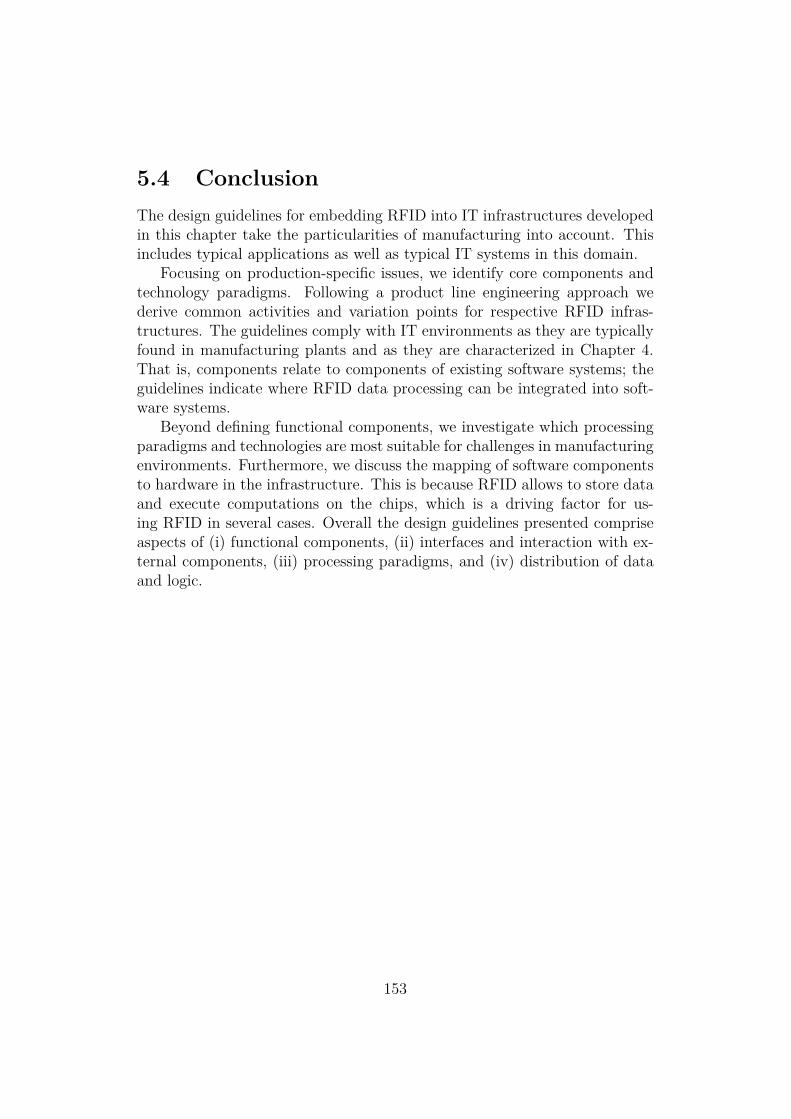
5.4 ConclusionThe design guidelines for embedding RFID into IT infrastructures developedin this chapter take the particularities of manufacturing into account. Thisincludes typical applications as well as typical IT systems in this domain.
Focusing on production-specific issues, we identify core components andtechnology paradigms. Following a product line engineering approach wederive common activities and variation points for respective RFID infras-tructures. The guidelines comply with IT environments as they are typicallyfound in manufacturing plants and as they are characterized in Chapter 4.That is, components relate to components of existing software systems; theguidelines indicate where RFID data processing can be integrated into soft-ware systems.
Beyond defining functional components, we investigate which processingparadigms and technologies are most suitable for challenges in manufacturingenvironments. Furthermore, we discuss the mapping of software componentsto hardware in the infrastructure. This is because RFID allows to store dataand execute computations on the chips, which is a driving factor for us-ing RFID in several cases. Overall the design guidelines presented compriseaspects of (i) functional components, (ii) interfaces and interaction with ex-ternal components, (iii) processing paradigms, and (iv) distribution of dataand logic.
153

Chapter 6
Costs and Benefits of RFIDInvestments
The previous chapters show that RFID promises to improve a broad range ofprocesses in manufacturing. However, market acceptance of RFID is develop-ing slower than anticipated. One likely reason is the difficulty to evaluate theresulting effects beforehand [see Strüker et al., 2008]. Strüker et al. [2008]’ssurvey reveals that manufacturers see “lacking possibilities for forecasting andmeasuring the benefits” as one of the three main barriers regarding RFIDdeployments in their enterprise.
Substantial research has already been conducted on assessing costs andbenefits of RFID investments. But until now the focus has mainly been onlogistic applications. The manufacturing domain still lacks dedicated modelsfor evaluating costs and benefits of an RFID rollout especially concerning theintangible, non-quantifiable aspects of such an investment. Therefore, thischapter provides guidance for assessing both the quantifiable and the non-quantifiable aspects of RFID in manufacturing. I conducted this work withOliver Günther, Seckin Kara, Michael Klafft, and Holger Ziekow. I publishedparts of the results in Ivantysynova et al. [2007]. The complete results arecurrently under review.
The next section reviews related work. In Section 6.2 we discuss quantifi-able costs and benefits resulting from the seven typical RFID advancementsevaluated in Chapter 2. Section 6.3 describes non-quantifiable aspects ofan RFID investment. Section 6.4 deals with the question of how to combinetangible and intangible costs and benefits. Section 6.5 concludes this chapter.
Note that we use the terms quantifiable, tangible, and monetary inter-changeably as opposed to the terms non-quantifiable, intangible, or non-monetary. As we will discuss later, this taxonomy is independent of thetaxonomy classifying certain measures into being operational vs. strategic.
154
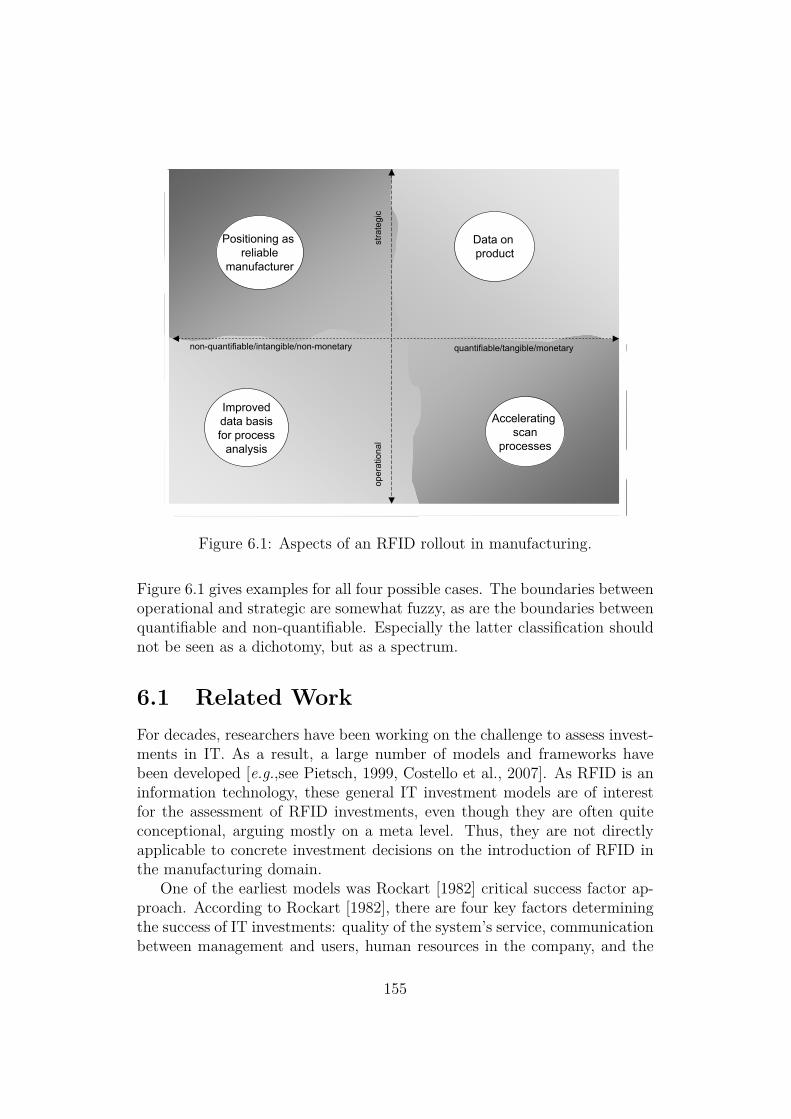
quantifiable/tangible/monetarynon-quantifiable/intangible/non-monetary
oper
atio
nal
stra
tegi
c
Accelerating scan
processes
Positioning as reliable
manufacturer
Data on product
Improveddata basisfor process
analysis
Figure 6.1: Aspects of an RFID rollout in manufacturing.
Figure 6.1 gives examples for all four possible cases. The boundaries betweenoperational and strategic are somewhat fuzzy, as are the boundaries betweenquantifiable and non-quantifiable. Especially the latter classification shouldnot be seen as a dichotomy, but as a spectrum.
6.1 Related WorkFor decades, researchers have been working on the challenge to assess invest-ments in IT. As a result, a large number of models and frameworks havebeen developed [e.g.,see Pietsch, 1999, Costello et al., 2007]. As RFID is aninformation technology, these general IT investment models are of interestfor the assessment of RFID investments, even though they are often quiteconceptional, arguing mostly on a meta level. Thus, they are not directlyapplicable to concrete investment decisions on the introduction of RFID inthe manufacturing domain.
One of the earliest models was Rockart [1982] critical success factor ap-proach. According to Rockart [1982], there are four key factors determiningthe success of IT investments: quality of the system’s service, communicationbetween management and users, human resources in the company, and the
155
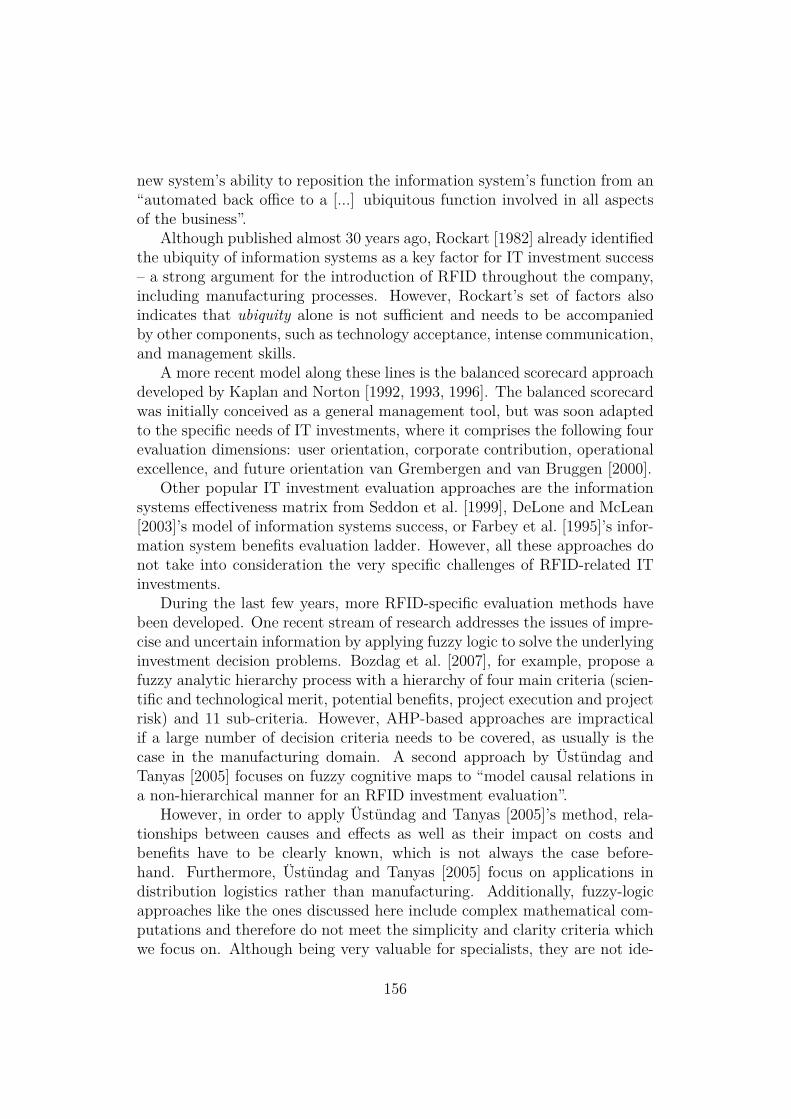
new system’s ability to reposition the information system’s function from an“automated back office to a [...] ubiquitous function involved in all aspectsof the business”.
Although published almost 30 years ago, Rockart [1982] already identifiedthe ubiquity of information systems as a key factor for IT investment success– a strong argument for the introduction of RFID throughout the company,including manufacturing processes. However, Rockart’s set of factors alsoindicates that ubiquity alone is not sufficient and needs to be accompaniedby other components, such as technology acceptance, intense communication,and management skills.
A more recent model along these lines is the balanced scorecard approachdeveloped by Kaplan and Norton [1992, 1993, 1996]. The balanced scorecardwas initially conceived as a general management tool, but was soon adaptedto the specific needs of IT investments, where it comprises the following fourevaluation dimensions: user orientation, corporate contribution, operationalexcellence, and future orientation van Grembergen and van Bruggen [2000].
Other popular IT investment evaluation approaches are the informationsystems effectiveness matrix from Seddon et al. [1999], DeLone and McLean[2003]’s model of information systems success, or Farbey et al. [1995]’s infor-mation system benefits evaluation ladder. However, all these approaches donot take into consideration the very specific challenges of RFID-related ITinvestments.
During the last few years, more RFID-specific evaluation methods havebeen developed. One recent stream of research addresses the issues of impre-cise and uncertain information by applying fuzzy logic to solve the underlyinginvestment decision problems. Bozdag et al. [2007], for example, propose afuzzy analytic hierarchy process with a hierarchy of four main criteria (scien-tific and technological merit, potential benefits, project execution and projectrisk) and 11 sub-criteria. However, AHP-based approaches are impracticalif a large number of decision criteria needs to be covered, as usually is thecase in the manufacturing domain. A second approach by Üstündag andTanyas [2005] focuses on fuzzy cognitive maps to “model causal relations ina non-hierarchical manner for an RFID investment evaluation”.
However, in order to apply Üstündag and Tanyas [2005]’s method, rela-tionships between causes and effects as well as their impact on costs andbenefits have to be clearly known, which is not always the case before-hand. Furthermore, Üstündag and Tanyas [2005] focus on applications indistribution logistics rather than manufacturing. Additionally, fuzzy-logicapproaches like the ones discussed here include complex mathematical com-putations and therefore do not meet the simplicity and clarity criteria whichwe focus on. Although being very valuable for specialists, they are not ide-
156
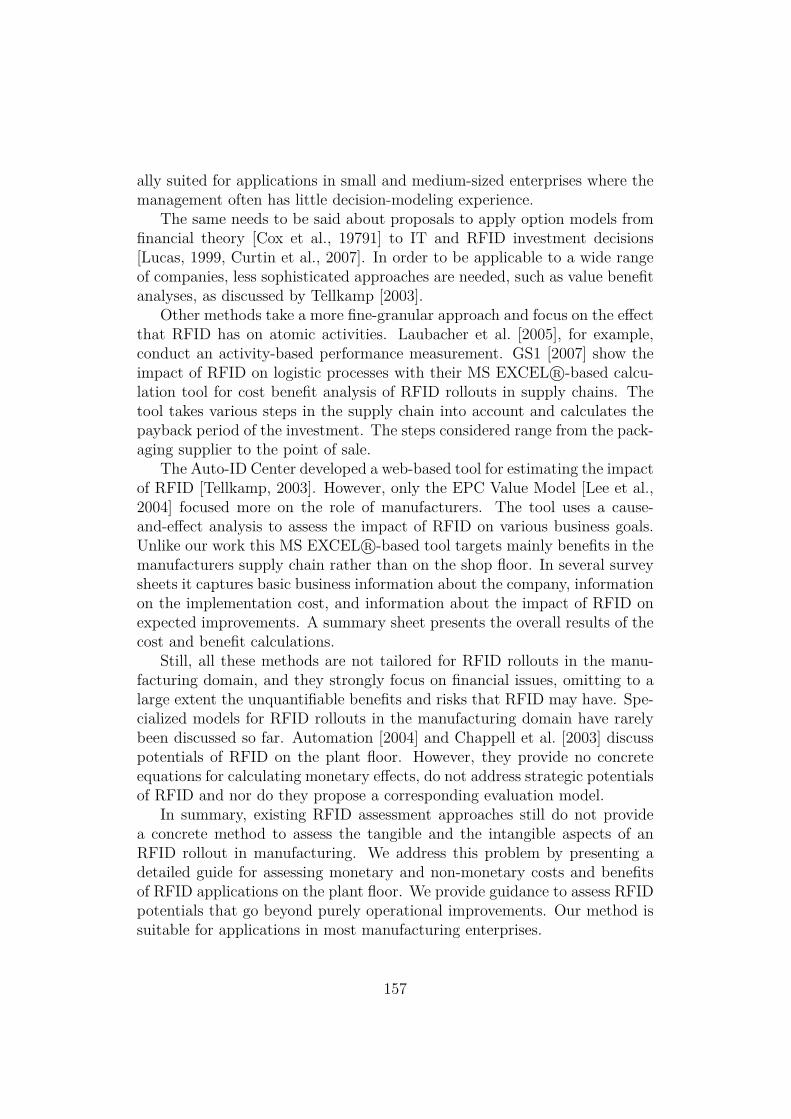
ally suited for applications in small and medium-sized enterprises where themanagement often has little decision-modeling experience.
The same needs to be said about proposals to apply option models fromfinancial theory [Cox et al., 19791] to IT and RFID investment decisions[Lucas, 1999, Curtin et al., 2007]. In order to be applicable to a wide rangeof companies, less sophisticated approaches are needed, such as value benefitanalyses, as discussed by Tellkamp [2003].
Other methods take a more fine-granular approach and focus on the effectthat RFID has on atomic activities. Laubacher et al. [2005], for example,conduct an activity-based performance measurement. GS1 [2007] show theimpact of RFID on logistic processes with their MS EXCEL R©-based calcu-lation tool for cost benefit analysis of RFID rollouts in supply chains. Thetool takes various steps in the supply chain into account and calculates thepayback period of the investment. The steps considered range from the pack-aging supplier to the point of sale.
The Auto-ID Center developed a web-based tool for estimating the impactof RFID [Tellkamp, 2003]. However, only the EPC Value Model [Lee et al.,2004] focused more on the role of manufacturers. The tool uses a cause-and-effect analysis to assess the impact of RFID on various business goals.Unlike our work this MS EXCEL R©-based tool targets mainly benefits in themanufacturers supply chain rather than on the shop floor. In several surveysheets it captures basic business information about the company, informationon the implementation cost, and information about the impact of RFID onexpected improvements. A summary sheet presents the overall results of thecost and benefit calculations.
Still, all these methods are not tailored for RFID rollouts in the manu-facturing domain, and they strongly focus on financial issues, omitting to alarge extent the unquantifiable benefits and risks that RFID may have. Spe-cialized models for RFID rollouts in the manufacturing domain have rarelybeen discussed so far. Automation [2004] and Chappell et al. [2003] discusspotentials of RFID on the plant floor. However, they provide no concreteequations for calculating monetary effects, do not address strategic potentialsof RFID and nor do they propose a corresponding evaluation model.
In summary, existing RFID assessment approaches still do not providea concrete method to assess the tangible and the intangible aspects of anRFID rollout in manufacturing. We address this problem by presenting adetailed guide for assessing monetary and non-monetary costs and benefitsof RFID applications on the plant floor. We provide guidance to assess RFIDpotentials that go beyond purely operational improvements. Our method issuitable for applications in most manufacturing enterprises.
157

6.2 Quantifiable Costs and BenefitsIn this section we first discuss quantifiable costs and benefits of RFID invest-ments along the identified RFID use cases from Section 2.4. We structurethis discussion along three parts: fixed costs, variable costs, and benefits.
One part of the fixed costs arise only in the first period T0. These are, forinstance, costs of an RFID reader R or costs for additionally needed softwareS. However, another part of the fixed costs are uniformly distributed betweenT1 and Tn. This are in particular maintenance costs M .
Also, variable costs and benefits are basically uniformly distributed be-tween T1 and Tn. If the proportion of the fixed costs in comparison to thetotal costs in T0 is low then a calculation of one period is sufficient, otherwisenot. When conducting the calculation for more than one period the amountfor each Ti with T0 < Ti < Tn must be discounted. When discounting, thecorrect discount rate has to be chosen. This can be done with the capitalasset pricing model.
Note that the implementation of RFID has a lot in common with anygeneric IT project: the IT project’s costs for integration, support, training,and maintenance are much higher than the actual purchase price of the re-quired hardware and software. Therefore, the costs should be calculated withthe Total Cost of Ownership (TCO) analysis [Wolf and Holm, 1998].
A complete TCO analysis spans over a specific period of time (such as5 years) and includes expectation values for all costs to be encountered bythe specific company in question. Therefore, a TCO analysis cannot be doneat a general level; it has to be case specific. In this section we restrict thediscussions to aspects that apply to any manufacturer.
6.2.1 Fixed CostsSome fixed costs are common to practically all RFID applications in man-ufacturing. Equation 6.1 captures these costs by summing up the cost forsoftware, hardware, training, maintenance, and system integration:
CFixed = S +R +N + A+O + F +M + I (6.1)
with
158

A Cost per reusable RFID tagC... Cost per reusable RFID tagF Cost for training staffI Integration cost in the introduction phase of RFIDM Average cost per hour of maintenanceN Cost for network technologyO Cost per PC on the shop floorR Cost of an RFID readerS Cost for additionally needed software
Of course these fixed costs must be compared to the fixed costs of (existingor potential) alternative solutions.
If RFID is used as a replacement for an existing bar-code solution, forexample, Cfixed needs to be offset by the fixed cost of the existing infras-tructure.
6.2.2 Variable CostWhen considering variable costs of an RFID application, one needs to distin-guish closed-loop and open-loop scenarios. In closed-loop applications, RFIDtags do not remain on the product post-sale. They are recycled, typicallyat the point of sale, and reused in future production cycles. It is possible tocompute the variable costs as the product of the expected lifetime of the ap-plication, the number of items labeled per time unit, and the cost of applyingand later recycling an RFID tag:
CV arClosed = T × L× (E +D +G) (6.2)
with
C... Cost per reusable RFID tagD Cost of removing an RFID tag from an objectE Cost of applying an RFID tag to an objectG Cost for transporting tagsL Number of items per hour labeled with RFID tagsT Expected service life of the application in hours
Note that if RFID tags are applied directly to a specific part of the prod-uct, the number of tags (L) equals the number of manufactured productsper hour. However, one may also apply RFID tags to several parts of theproduct or to material carriers which hold more than one object. In manyuse cases, RFID tags could be applied to transportation units which cycle on
159
the plant floor (e.g., material carriers). In such cases, tags are applied onlyonce.
However, the data written on the tag (or associated with the tag) mustbe changed in each cycle. Depending on the particular setup, this task mayrequire manual intervention which results in variable labor costs. D refersto costs per tagged item which occur if RFID tags are removed at the end ofthe production process. Removing tags accounts for additional labor costs.However, no removal is necessary if tags cycle on transportation units on theplant floor.G refers to the cost per object for transporting reusable RFID tags be-
tween the points of application and removal. Tags may just be transportedwithin the plant floor in applications that are restricted to one plant. Yet,advanced RFID applications may span several production steps in the supplychain and tags may need to be transported between different plants.
In open-loop applications, the RFID tags are only used once and sub-sequently discarded (or left with the customer). In this case we adapt thecalculation of variable costs as follows:
CV arOpen = T × L× (E + J −K) (6.3)
with
C... Cost per reusable RFID tagE Cost of applying an RFID tag to an objectJ Cost per non-reusable RFID tagK Cost savings per tag due to cost-sharing
models or discountsL Number of items per hour labeled with RFID tagsT Expected service life of the application in hours
Note that K represents cost discounts per tag due to cost sharing modelsor discounts. Cost-sharing models are typical of complex supply chains whereRFID tags are used by several supply chain partners at once, which then sharethe related expenses.
6.2.3 BenefitsIn the following we discuss and provide equations for all use cases for RFIDlisted in Table 2.2 except no. 2 (extending scan processes for quality and ef-ficiency), because here the monetary effects cannot be quantified in a generalmanner.
160
Accelerating Scan Processes
One reason for applying RFID is to accelerate or to completely automatethe scanning of identifiers. This allows reducing labor costs. Resulting totalbenefits can be quantified as the product of the expected application lifetimeT , the number of identifiers scanned per hour Q, the time saved by RFID(U −W ), and the relevant labor costs P :
BAcceleratingScanProcesses = T ×Q× (U −W )× P (6.4)
with
B... Used to denote various types of benefitsP Labor cost per hour for scanning labelsQ Number of identifiers scanned per hourU Time which is needed for scanning identifiers with
RFID alternativesW Time for scanning an RFID tagT Expected service life of the application in hours
Extending Scan Processes for Narrowing Recalls
Equation 6.5 estimates the monetary benefits of reducing the batch size fortracking. In the considered case, errors occur at a known single point in timeand only affect a single item. Total benefits are the product of the expectedapplication lifetime T , the error frequency X, the improvement in batch sizes(Y − Z), and the cost for recalling an item n:
BNarrowingRecalls = T ×X × (Y − Z)× n (6.5)
with
B... Used to denote various types of benefitsT Expected service life of the application in hoursX Frequency of errors which result in a product recallY Tracked batch sizes without RFIDZ Tracked batch sizes with RFIDn Cost for recalling an item
Reducing Paper-Based Data Management
As described above, improving data maintenance by RFID may reduce costswhich result from errors in collected production data. This is because RFID
161
can help to automate data maintenance in some applications and therebyreduce the impact of human mistakes.
Equation 6.6 captures the potential savings due to improved data main-tenance, taking into account various types of data maintenance errors andrelated costs. For instance, wrongly configured machines may produce waste(m× cm), or forgotten bookings of finished steps may delay the production(f × cf ). Furthermore, RFID may accelerate or automate data maintenancetasks, thus saving labor costs (e× (a− r)× P ).
BReducingPaperBasedDataManagement = T×(m×cm+f×cf+w×cw+e×(b−r)×P )(6.6)
withB... Used to denote various types of benefitsP Labor cost per hour for scanning labelsT Expected service life of the application in hoursb Time for making a data entry without RFID supportc... Used to denote various costs resulting from
false or missing data entriese Frequency of manual label scansf Frequency of forgotten data entriesm Frequencies of data mix-upsr Time for making a data entry with RFID supportw Frequency of wrong data entries
Automating Asset Tracking
Having the right assets available at the right time is crucial for seamless op-eration of a production plant. The expected monetary benefits can be com-puted as the product of the expected application lifetime T , the improvementregarding missing assets (b− d), and the related costs (o+ p):
BAutomatingAssetTracking = T × (a− d)× (o+ p) (6.7)
withB... Used to denote various types of benefitsT Expected service life of the application in hoursa Frequency that assets are missing without
RFID-based trackingd Frequency that assets are missing with
RFID-based trackingo Opportunity cost resulting from production downtimesp Penalties for delays resulting from production downtimes
162
Reducing Back-End Interactions
RFID allows storing data with the corresponding object rather than in back-end databases. Applications that work on data from RFID tags are lessvulnerable to system failures than centralized solutions (no single point offailure). We estimate the monetary value of this effect as the product of theexpected application lifetime T , the improvement regarding back-end systemfailures (k × g × t− s× u× v), and the related costs (o+ p):BReducingBack−EndInteractions = T × (k × g × t− s× u× v)× (o+ p) (6.8)withB... Used to denote various types of benefitsT Expected service life of the application in hoursg Number of production tasks affected by a back-end
system failurek Frequency in which back-end systems failso Opportunity cost resulting from production downtimesp Penalties for delays resulting from production downtimess Frequency of failures in an RFID-based systemt Time back-end system failures lastsu Number of products affected by a failing RFID tagv Time until a broken RFID tag is replaced
Unifying Labels
One cost driver for printing labels are specialized multi-format printers. An-other cost factor that is related to label handling, concerns the penalties forlabels which cannot be read by the customers. We estimate the monetaryeffect as the product of the expected application lifetime T and the improve-ment regarding unreadable labels ((i−j)×x), plus some label transportationcosts (y × z):
BUnifyingLabels = T × ((i− j)× x+ y × z) (6.9)with
B... Used to denote various types of benefitsT Expected service life of the application in hoursi Frequency that bar-code labels are unreadablej Frequency that RFID tags are unreadablex Penalty per unreadable labely Cost for transporting a bar-code label from
the printer to a packing stationz Number of labels applied per hour
163

6.3 Non-Quantifiable Costs and BenefitsDespite the advantages of RFID, adoption by the marketplace proceedsslower than expected. Among the main reasons for not implementing RFIDare the high implementation costs, e.g., Ivantysynova and Ziekow [2007], andthe lack of foreseeable benefits [Schmitt and Michahelles, 2008]. Taken to-gether, this often leads to a negative expected return on investment in theshort and medium term. It is, however, necessary to consider not only quan-tifiable (tangible, monetary) aspects but also non-quantifiable, intangiblebenefits and costs.
Yet, another challenge in making investment decisions is to assess incor-porate factors that are hard to quantify or not quantifiable at all. As weobserved in the case studies this results in companies’ tendency to adoptRFID for operational improvements first. For such applications it is possi-ble to determine the breakeven point based on the equations presented inSection 6.2. However, the potential of RFID in manufacturing goes beyondoperational benefits and can be a means to achieve strategic goals [Knebelet al., 2007]. In particular with increasingly tighter supply chain integrationRFID may become a distinguishing factor in collaboration.
In this section, we first analyze potential operational benefits, then strate-gic benefits, and intangible risks and costs manufacturers have to take intoaccount before adopting RFID. We also present a method for how to assesssuch intangible aspects.
6.3.1 Operational BenefitsThe case studies show that operational benefits are the main driver in mostRFID projects. They provide short-term positive returns on investment,which should convince every controller. However, some RFID applicationscan leverage additional intangible benefits on top, which may tip the scalein favor of adoption, even though the short-term ROI may be negative. Wehave observed the potential for such effects regarding improved productionplanning (PP), process optimization (PO), and IT management (IT). Table6.1 shows in which case studies we observed these three potentials.
Production Planning
Production planning requires accurate information on the availability of re-sources. RFID enables better control of assets and materials through itstracking functionality, thus reducing loss and search times. The direct effectof this is easy to quantify. However, these applications open up new opportu-
164
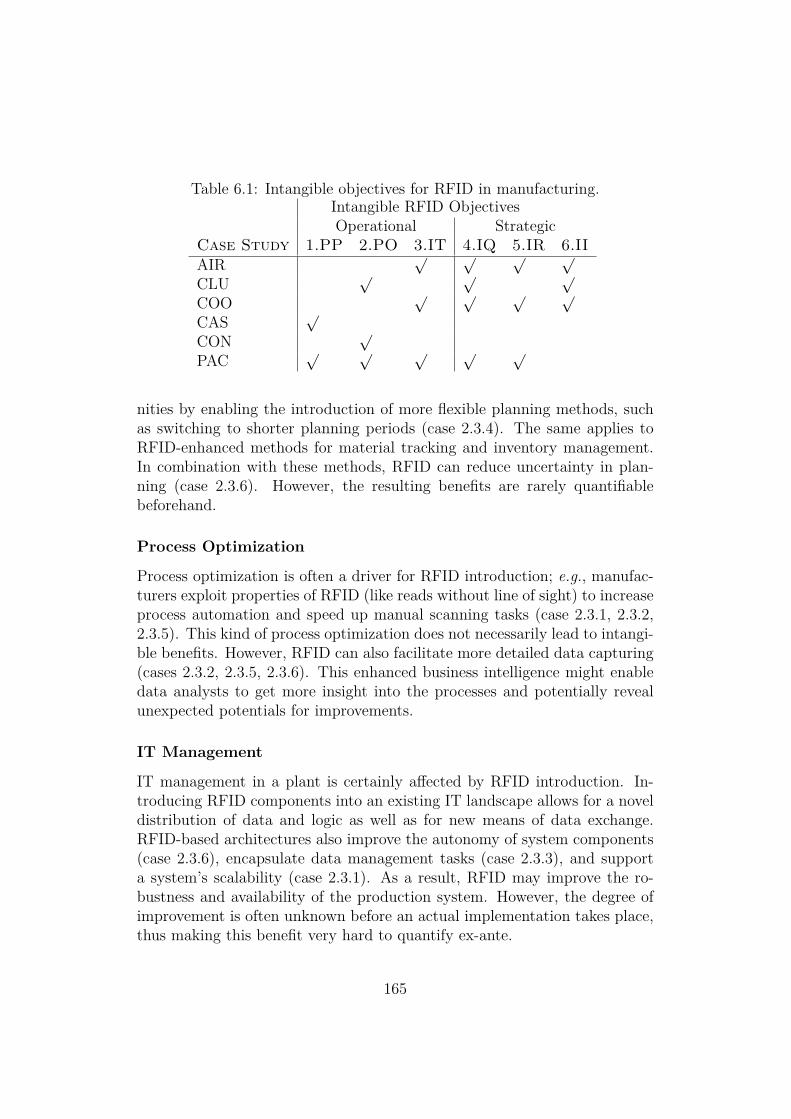
Table 6.1: Intangible objectives for RFID in manufacturing.Intangible RFID ObjectivesOperational Strategic
Case Study 1.PP 2.PO 3.IT 4.IQ 5.IR 6.IIAIR
√ √ √ √
CLU√ √ √
COO√ √ √ √
CAS√
CON√
PAC√ √ √ √ √
nities by enabling the introduction of more flexible planning methods, suchas switching to shorter planning periods (case 2.3.4). The same applies toRFID-enhanced methods for material tracking and inventory management.In combination with these methods, RFID can reduce uncertainty in plan-ning (case 2.3.6). However, the resulting benefits are rarely quantifiablebeforehand.
Process Optimization
Process optimization is often a driver for RFID introduction; e.g., manufac-turers exploit properties of RFID (like reads without line of sight) to increaseprocess automation and speed up manual scanning tasks (case 2.3.1, 2.3.2,2.3.5). This kind of process optimization does not necessarily lead to intangi-ble benefits. However, RFID can also facilitate more detailed data capturing(cases 2.3.2, 2.3.5, 2.3.6). This enhanced business intelligence might enabledata analysts to get more insight into the processes and potentially revealunexpected potentials for improvements.
IT Management
IT management in a plant is certainly affected by RFID introduction. In-troducing RFID components into an existing IT landscape allows for a noveldistribution of data and logic as well as for new means of data exchange.RFID-based architectures also improve the autonomy of system components(case 2.3.6), encapsulate data management tasks (case 2.3.3), and supporta system’s scalability (case 2.3.1). As a result, RFID may improve the ro-bustness and availability of the production system. However, the degree ofimprovement is often unknown before an actual implementation takes place,thus making this benefit very hard to quantify ex-ante.
165

6.3.2 Strategic BenefitsThe decision as to whether or not a manufacturer should adopt an RFIDhas impacts beyond the operations on the plant floor. Depending on thespecific industry, RFID may be a distinctive factor in a company’s strategy.Strategic potentials of RFID may concern improving quality and customers’service (IQ), increasing reputation (IR), and improving inter-organizationalcollaboration (II). Table 6.1 shows in which case studies we observed thesethree strategic potentials.
Improving Quality and Customer Service
Improving quality and customer service are both important strategic meansto gain an advantage over one’s competitors. The introduction of RFID possi-bly affects the quality and the range of customer services that a manufacturercan provide to its clients. As a side effect of operational improvements, bet-ter control of shop-floor processes can improve the quality of a manufacturesoutput. For instance, RFID-based process monitoring could enhance the de-tection and correction of production errors before products are shipped (case2.3.2).
Moreover, RFID can improve production quality by helping to ensurethat shipments are complete, consistently documented, and that all productspassed through the production process correctly. As an additional service,the manufacturer may share the captured RFID data with its clients (case2.3.3). This could streamline operations and leverage benefits at the clientside (e.g., better planning due to updates on the production status).
Another potential for additional services is to leave RFID tags on theshipped products (case 2.3.1). This leverages RFID applications at the clientside. For instance, clients could benefit from RFID at their material intake.Manufacturers may also store production data on the RFID tags. This servicecould help clients to route products through their production and facilitateconsistency checks on the plant floor (case 2.3.2, 2.3.6).
Increasing Reputation
Reputation is another strategic benefit that RFID can contribute to. A com-pany’s reputation can profit from new technology advancements – such asRFID – because the company is perceived as innovative by its business part-ners (case 2.3.1, 2.3.3). Additionally, RFID enables narrowing and avoidingrecalls for some products (case 2.3.2), thus limiting adverse reputation effectsassociated with production problems.
166
Improving Inter-Organizational Collaboration
Inter-organizational collaboration can leverage optimization across valuechains and strengthen the position of partner networks. Depending on themarket structure, good positioning in such a partner network is a crucialstrategic issue. RFID is developing more and more into a technology forinter-organizational collaboration. Collaboration infrastructures – such asthe EPCglobal network [EPCglobal, 2007] – are increasingly based on RFIDtechnology. Early adopters may have the opportunity to improve theirstrategic position in the market.
A manufacturer may strengthen its market position by offering new ser-vices that are enabled by the RFID technology. Possible options includeproviding detailed tracking information to clients or storing production dataright at the products. In one of the case studies we already observed such aclient request. Prominent examples where RFID was demanded are the sup-ply chains of Wal-Mart and Metro. Moving towards RFID today can makea manufacturer ready to participate in RFID-driven value chains. This maybecome a distinguishing factor or even a requirement for getting new con-tracts if value chains move towards more RFID-based collaboration [Güntheret al., 2006].
An RFID rollout provides the strategic option to opt into RFID-basedcollaboration networks and become part of RFID-enabled value chains. Dom-inant players in a value chain may even force their suppliers into RFID adop-tion (see Chapter 7). These market forces influence manufacturers as well.Thus, getting ready for RFID is of strategic importance for many manufac-turers, see 2.3.1, 2.3.2, 2.3.3.
6.3.3 Risks and CostsAny IT project bears intangible risks with associated costs that decisionmakers must weigh against expected benefits. In the following, we discussspecific intangible risks that are related to RFID technology. We identifiedthree major risk categories concerning technology integration, privacy andsecurity, and standardization. While these general risk categories also exist insupply chain processes, manufacturing shows different particularities withinthese categories. Specifically the importance of concrete risks differs fromsupply chain applications.
167
Technology Integration
Technology integration for RFID systems comprises two levels: the softwarelevel for back-end integration, and the hardware level for physical integra-tion in the process. At the software level it is necessary to connect RFIDmiddleware with two systems (e.g., an ERP or MES, see Chapter 5). Likein any IT integration project this poses challenges: e.g., in finding suitableinterfaces and organizing the migration to new solutions. A special challengeof RFID data integration is data quality. Compared to identification tech-nologies such as bar codes, RFID reads require more advanced pre-processingand filtering of the input. It is important to understand that raw RFID datacan include false-positive and false-negative reads [Derakhshan et al., 2007].It is therefore crucial to define the required data quality and to implementappropriate cleaning mechanisms. This causes the demand for advancedmiddleware [Bornhövd et al., 2004].
Achieving the required data quality can be a serious obstacle in someprojects and may pose the risk of failure. We found such challenging condi-tions in several of our case studies (case 2.3.1, 2.3.2, 2.3.3, 2.3.6). In manycases the products and production environments contained a lot of metalwhich can distort the RFID signals. Particularly in cases 2.3.2 we founddifferent process steps in very close spatial proximity. This makes it difficultto associate the RFID reads with the correct process step.
RFID is affected by the environment, especially if metal or liquids arepresent. Solid objects (especially metal) can absorb and reflect RFID signals.Thus, tags may be missed or captured at positions outside the intended readerscope (e.g., at a different process step). Possible effects include shielding ofsignals or detuning of the communication frequency. Furthermore, RFIDsignals may travel unexpected ways due to reflection causing readers to cap-ture tags outside their intended scope. These properties of RFID make itnecessary to test the physical integration of RFID into the production pro-cesses carefully. The same may apply if production processes are changed orphysically rearranged.
Privacy and Security
Privacy and security continues to be a controversial aspect of RFID appli-cations. Privacy concerns mainly arise in B2C markets and after-sale ap-plications [Spiekermann and Ziekow, 2005]. Depending on the applicationcontext, this has to be taken into account when implementing RFID. It maybe advisable, for example, to remove or even destroy the tags at the end ofthe production line.
168

Additionally, the (in-)security of RFID data potentially jeopardize theconfidentiality of business operations. Most RFID solutions are vulnerable tounauthorized reads or to eavesdropping tag-reader communication [Hancke,2006]. The possibility to read out tags without line of sight exposes RFIDdata to anyone who can come close to the tag (e.g., staff of logistic serviceproviders). It is therefore important to assess the confidentiality of data onRFID tags, to weigh the risks, and to possibly implement counter measures.
Beyond protecting information on RFID tags, security analysts must care-fully evaluate network-based exchange of RFID data. The standards that arecurrently under discussion for querying RFID information sources can leakinformation [Fabian and Günther, 2007]. Again, one must trade the confi-dentiality of RFID data against the security risks of the technology used.However, compared to risks regarding technology integration and technol-ogy development the risks for privacy and security are less important in themanufacturing domain.
Even though RFID-related privacy concerns mainly occur in the B2Cmarket [Günther and Spiekermann, 2005], RFID can affect the privacy ofplant-floor workers as well. Thus, workers may perceive the technology in anegative way.
Technology Development
Standardization is essential for the sustainability of an application and forleveraging network effects. The global standardization consortium GS1 playsa major role in developing standards for the RFID technology. With Gen2GS1 has released a well-known standard for UHF tags that is already appliedby major retailers. Yet, unsolved standardization questions exist until today.The authorized frequency spectra for RFID must still be harmonized anddominating standards for HF technology are still missing. Even though thestandardization situation is improving, there remains a degree of uncertaintyfor some solutions. These aspects specifically play a role when the productionprocess requires RFID-based information from suppliers.
Another threat of early adoption is that having RFID in place may leadto an unfavorable negotiating position for cost-sharing models. This is athreat many companies mentioned during the case studies. In such modelspartners in the value chain share costs of applying RFID tags if the benefitsoccur in several steps of the value chain. However, the manufacturer bearsthe risk of taking most of the cost for RFID while most of the benefits areobtained in subsequent steps of the value chain.
169

6.3.4 AssessmentIn previous sections we have evaluated non-quantifiable, intangible aspectsof RFID in manufacturing. As the reader could see, not all aspects occur ineach RFID rollout. Moreover, if they occur, their importance may differ sub-stantially. In order to assess non-quantifiable costs and benefits, we suggest alightweight multidimensional decision model where one assigns weights to thedifferent aspects, specific to each case. Aspects and weights are representedby a tree whose root represents the specific RFID rollout (Figure 6.2).
The nodes and leaves of the tree correspond to the non-quantifiable fac-tors discussed above Note, that on a coarse-grained level some – yet not all –factors are also known from RFID applications in supply chain management.Furthermore, some effects in supply chain management (like improved de-mand forecast) cannot be achieved by using RFID on the shop floor. There-fore, the relative importance of the various aspects is domain specific. Eventhough in manufacturing each aspect weighs differently depending on thecase, we found some general trends in the case studies. In Figure 6.2, thesetendencies are denoted as ++ (for very important) + (for important), and− (for less important).
The tree should be traversed first top-down, then bottom-up. Whiletraversing the tree, each node should be assigned with a relative importanceand a score, respectively. The relative importance will typically be assignedby management, while the improvement will be evaluated by domain experts.We assign positive scores for benefits and negative scores for risks and theirassociated expected cost.
Traversing Top-Down
Managers proceed top-down using their corporate knowledge when assigningweights for the relative importance of each node. For example, productionplanning may be considered more important than IT management or processoptimization. During the top-down traversal, managers assign weights to alldescendant nodes in relative importance to each other by using Value BenefitAnalysis (VBA), which is a common scoring model [Bernroider and Koch,1999]. The goal of the pairwise comparison method is to create a rank tableamong the children for each node.
Traversing Bottom-up
Subsequently, domain experts traverse the tree bottom-up and give eachnode a score for an expected improvement or occurring risk. They start byanalyzing all leaves of the tree and assigning each leaf a score. The score
170
denotes the impact of RFID on this particular aspect. We use a standardequidistant scale for the scores. After completing all scores for the leaves, weuse the ranking data (the relative importance) created by the management.We calculate a weighted average score for each leaf. Then we assess thefinal score of the analyzed investment by recursively calculating the scoresbottom-up; i.e., for all interior nodes we multiply each child node’s scorewith its relative importance, add the scores of all children, and pass the totalscore to the parent.
I calculate the overall score for the planed RFID rollout by traversingthe tree both ways. An analogous approach can be used to evaluate possiblealternatives, such as bar-code-based solutions. Hereby it is irrelevant whetherthe competing technology is already in use. If the competing technology isbar code, then the tree can be used as it is. If the RFID rollout should becompared with some other technology, like OCR, the tree would need to beadjusted accordingly.
After having evaluated competing alternatives from the perspective ofnon-quantifiable costs and benefits, evaluation results need to be integratedwith the results from the monetary evaluation. This combined assessmentthen serves as the basis for the final investment decision.
6.4 How to Combine Tangible and IntangibleCosts and Benefits
Integrating monetary and non-monetary assessments has always been a chal-lenging task, due to the heterogeneity of decision-relevant factors, as well asthe diversity of possible investment scenarios. In general, it is hardly possi-ble to use one type of approach for all types of investment [Andresen, 2001].Therefore, we propose to apply different decision techniques, depending onthe investment’s main focus and motivation. The following investment types– adapted from Lucas [1999] – can be distinguished in the manufacturingdomain:
1. Direct returns as the main investment focus: In the manufacturing do-main, this is, for example, the case if RFID is implemented to acceleratescan processes. In such a case, the financial assessment is the key to themanagement’s investment decision. Out of several proposed solutions,the one with the highest calculated return is selected. The intangibleassessment is secondary and mainly focuses on the assessment of risks,which must not exceed risk limits predefined in the company’s policy.
171
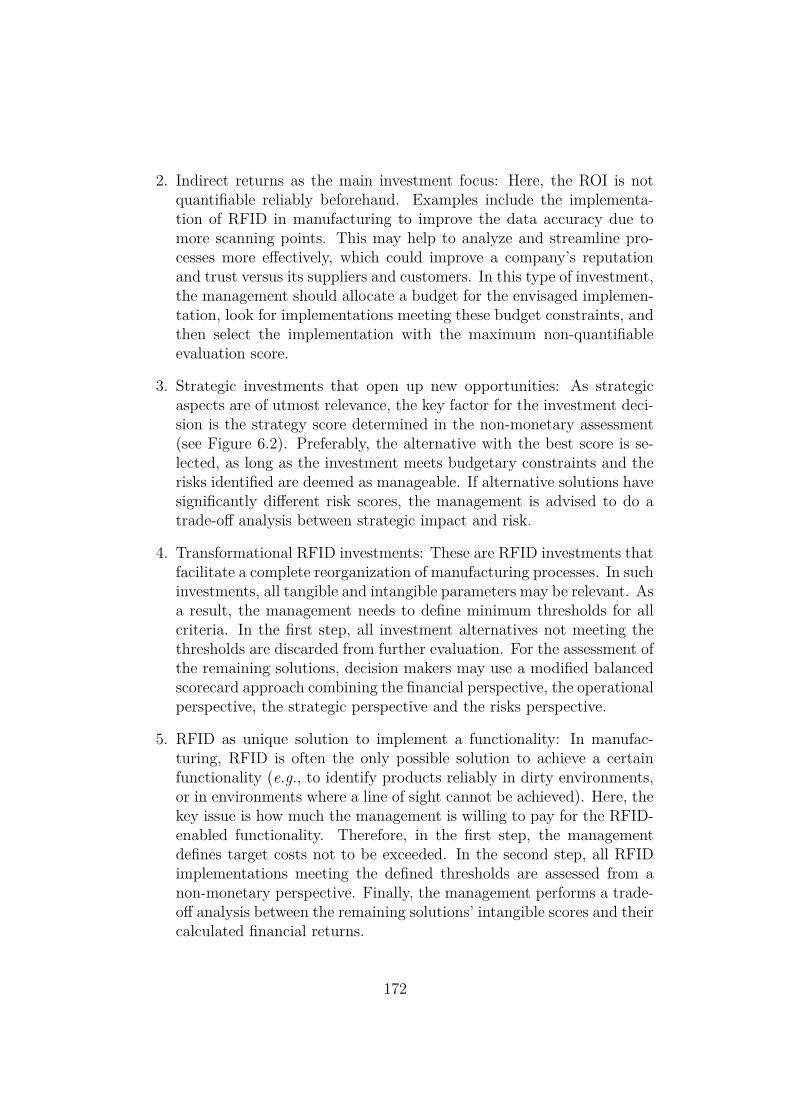
2. Indirect returns as the main investment focus: Here, the ROI is notquantifiable reliably beforehand. Examples include the implementa-tion of RFID in manufacturing to improve the data accuracy due tomore scanning points. This may help to analyze and streamline pro-cesses more effectively, which could improve a company’s reputationand trust versus its suppliers and customers. In this type of investment,the management should allocate a budget for the envisaged implemen-tation, look for implementations meeting these budget constraints, andthen select the implementation with the maximum non-quantifiableevaluation score.
3. Strategic investments that open up new opportunities: As strategicaspects are of utmost relevance, the key factor for the investment deci-sion is the strategy score determined in the non-monetary assessment(see Figure 6.2). Preferably, the alternative with the best score is se-lected, as long as the investment meets budgetary constraints and therisks identified are deemed as manageable. If alternative solutions havesignificantly different risk scores, the management is advised to do atrade-off analysis between strategic impact and risk.
4. Transformational RFID investments: These are RFID investments thatfacilitate a complete reorganization of manufacturing processes. In suchinvestments, all tangible and intangible parameters may be relevant. Asa result, the management needs to define minimum thresholds for allcriteria. In the first step, all investment alternatives not meeting thethresholds are discarded from further evaluation. For the assessment ofthe remaining solutions, decision makers may use a modified balancedscorecard approach combining the financial perspective, the operationalperspective, the strategic perspective and the risks perspective.
5. RFID as unique solution to implement a functionality: In manufac-turing, RFID is often the only possible solution to achieve a certainfunctionality (e.g., to identify products reliably in dirty environments,or in environments where a line of sight cannot be achieved). Here, thekey issue is how much the management is willing to pay for the RFID-enabled functionality. Therefore, in the first step, the managementdefines target costs not to be exceeded. In the second step, all RFIDimplementations meeting the defined thresholds are assessed from anon-monetary perspective. Finally, the management performs a trade-off analysis between the remaining solutions’ intangible scores and theircalculated financial returns.
172
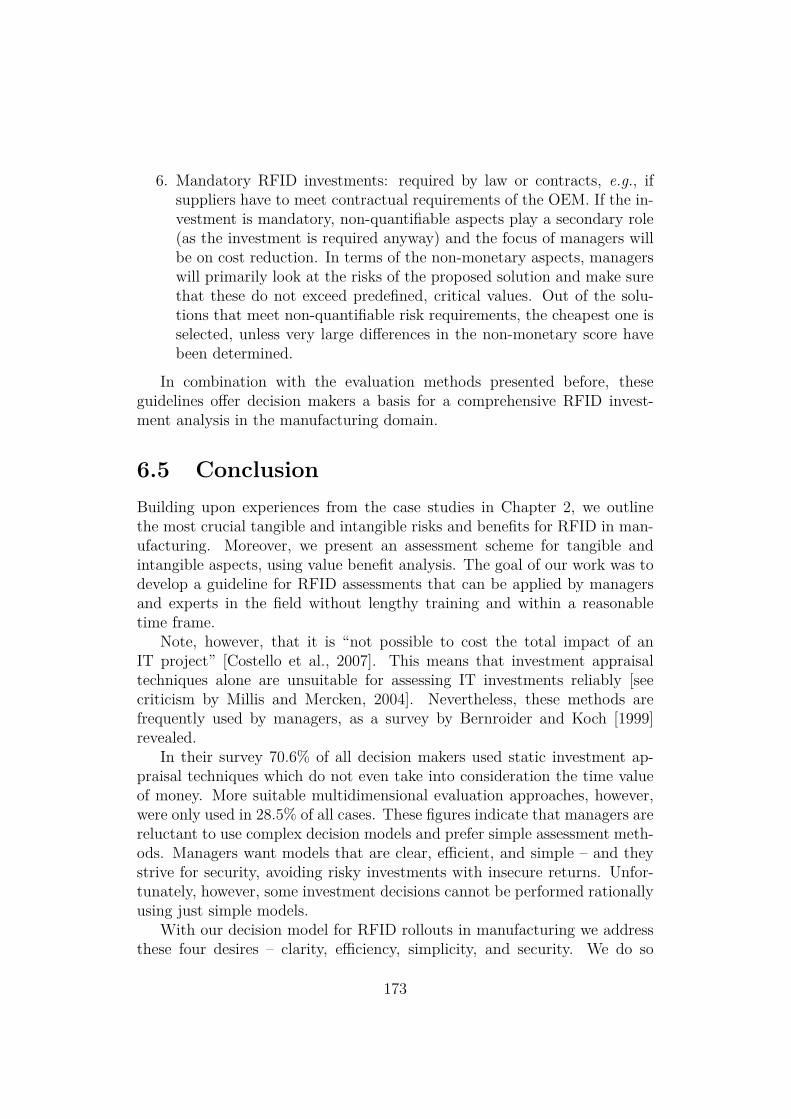
6. Mandatory RFID investments: required by law or contracts, e.g., ifsuppliers have to meet contractual requirements of the OEM. If the in-vestment is mandatory, non-quantifiable aspects play a secondary role(as the investment is required anyway) and the focus of managers willbe on cost reduction. In terms of the non-monetary aspects, managerswill primarily look at the risks of the proposed solution and make surethat these do not exceed predefined, critical values. Out of the solu-tions that meet non-quantifiable risk requirements, the cheapest one isselected, unless very large differences in the non-monetary score havebeen determined.
In combination with the evaluation methods presented before, theseguidelines offer decision makers a basis for a comprehensive RFID invest-ment analysis in the manufacturing domain.
6.5 ConclusionBuilding upon experiences from the case studies in Chapter 2, we outlinethe most crucial tangible and intangible risks and benefits for RFID in man-ufacturing. Moreover, we present an assessment scheme for tangible andintangible aspects, using value benefit analysis. The goal of our work was todevelop a guideline for RFID assessments that can be applied by managersand experts in the field without lengthy training and within a reasonabletime frame.
Note, however, that it is “not possible to cost the total impact of anIT project” [Costello et al., 2007]. This means that investment appraisaltechniques alone are unsuitable for assessing IT investments reliably [seecriticism by Millis and Mercken, 2004]. Nevertheless, these methods arefrequently used by managers, as a survey by Bernroider and Koch [1999]revealed.
In their survey 70.6% of all decision makers used static investment ap-praisal techniques which do not even take into consideration the time valueof money. More suitable multidimensional evaluation approaches, however,were only used in 28.5% of all cases. These figures indicate that managers arereluctant to use complex decision models and prefer simple assessment meth-ods. Managers want models that are clear, efficient, and simple – and theystrive for security, avoiding risky investments with insecure returns. Unfor-tunately, however, some investment decisions cannot be performed rationallyusing just simple models.
With our decision model for RFID rollouts in manufacturing we addressthese four desires – clarity, efficiency, simplicity, and security. We do so
173

by presenting a holistic evaluation approach that takes into account bothquantifiable (tangible, monetary) and non-quantifiable aspects of the invest-ment. Our aim is to provide managers with means to estimate the benefitsof RFID when making rollout decisions. We thus address the main obstaclethat leads to decisions against RFID, viz., the inability to foresee concretebenefits [Schmitt and Michahelles, 2008].
The guidelines that we have developed meet clarity, efficiency and sim-plicity criteria. However, it is not possible to meet the reliability criterionas of now. This is not a drawback of our guidelines but inherent in the un-derlying investment decision problem. Little available experience with thetechnologies and related organizational solutions, as well as the heterogeneityof application scenarios, make a reliable assessment of tangible and intangiblerisks and benefits impossible.
However, by guiding managers and experts through the decision process,our approach assures that most important aspects will be reflected in thedecision taken, thus reducing the remaining degree of uncertainty. In thefuture, when more experience with RFID applications in manufacturing be-comes available, the remaining uncertainties may be reduced further, thusmaking RFID investments a less risky venture.
174
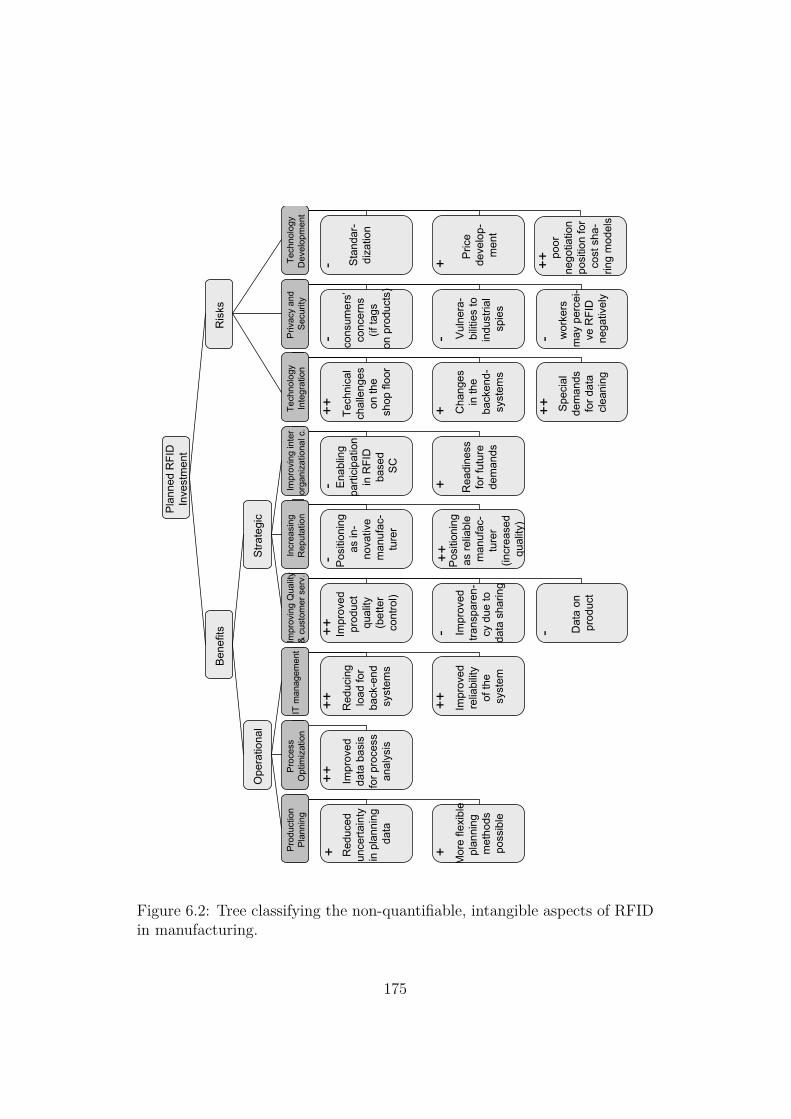
Pla
nned
RFI
D
Inve
stm
ent
Ben
efits
Ope
ratio
nal
Ris
ks
Stra
tegi
c
Incr
easi
ng
Rep
utat
ion
Impr
ovin
g Q
ualit
y&
cust
omer
ser
v.
IT m
anag
emen
t P
roce
ss
Opt
imiz
atio
n P
rodu
ctio
n P
lann
ing
Tech
nolo
gy
Inte
grat
ion
Impr
ovin
g in
ter
orga
niza
tiona
l c.
Tech
nica
l ch
alle
nges
on
the
shop
floo
r
Cha
nges
in th
e ba
cken
d-sy
stem
s
Spe
cial
de
man
ds
for d
ata
clea
ning
cons
umer
s’co
ncer
ns
(if ta
gs
on p
rodu
cts)
Vuln
era-
bilit
ies
toin
dust
rial
spie
s
Enab
ling
parti
cipa
tion
in R
FID
ba
sed
SC
Rea
dine
ss
for f
utur
e de
man
ds
Impr
oved
da
ta b
asis
fo
r pro
cess
an
alys
is
Red
ucin
g lo
ad fo
r ba
ck-e
nd
syst
ems
Impr
oved
re
liabi
lity
of th
e sy
stem
Red
uced
un
certa
inty
in
pla
nnin
g da
ta
Mor
e fle
xibl
epl
anni
ng
met
hods
poss
ible
Impr
oved
pr
oduc
t qu
ality
(bet
ter
cont
rol)
Impr
oved
trans
pare
n-cy
due
to
data
sha
ring
Dat
a on
pr
oduc
t
Pos
ition
ing
as in
-no
vativ
em
anuf
ac-
ture
r
Pos
ition
ing
as re
liabl
e m
anuf
ac-
ture
r(in
crea
sed
qual
ity)
Sta
ndar
-di
zatio
n
Pric
e de
velo
p-m
ent
+
++-
+++
-
++++
--
+
++++ +++
- -+-
wor
kers
m
ay p
erce
i-ve
RFI
D
nega
tivel
y
-po
or
nego
tiatio
n po
sitio
n fo
r co
st s
ha-
ring
mod
els
++
Priv
acy
and
Secu
rity
Tech
nolo
gyD
evel
opm
ent
Figure 6.2: Tree classifying the non-quantifiable, intangible aspects of RFIDin manufacturing.
175

Chapter 7
Beyond Manufacturing: RFIDin the Automotive SupplyChain
In addition to closed-loop applications, RFID technology can also be im-plemented as an inter-organizational system (IOS) along the supply chainto ensure real-time information sharing [Sharma et al., 2007]. However,besides the intra-organizational challenges of applying RFID in productionprocesses – as described in the previous chapters – one can also observe aninter-organizational reservation of embedding RFID in supply chains. For in-stance, even though most OEMs and their suppliers are currently engaged inRFID-related pilot projects, which involve both internal and IOS scenarios,the technology has not yet made the decisive step from the meeting roomto real-life implementations. It is therefore valuable to understand whichfactors influence RFID adoption in the automotive industry.
I conducted this work together with Hanna Krasnova and Lorenz Weser.Lorenz Weser has conducted the ten interviews during his master thesis in2007. The results of this chapter have been published in Krasnova et al.[2008].
Building on existing inter-organizational system adoption models [e.g.,Chwelos et al., 2001, Sharma et al., 2007] tailored to RFID specifics we iden-tify important determinants of an RFID adoption decision. Our investigationhas an explorative nature and is based on ten interviews conducted with ex-ecutives from the automotive industry (3 OEMs and 7 suppliers).
The next section provides an overview of existing research on the adoptionand diffusion of inter-organizational systems. Section 7.2 describes factorswhich potentially play a role in RFID adoption decisions in the automotiveindustry. In Section 7.3 we present our research method and the results of
176
the conducted interviews. Section 7.4 concludes this chapter.
7.1 Related WorkStrassner and Fleisch [2003] consider the value of RFID applications to beeven higher if the technology is introduced in a collaborative manner. Similarto Sharma et al. [2007], we view driving forces for adoption of RFID forinternal use to be a sub-group of factors relevant for RFID introduction inan inter-organizational context.
In the past few decades, a large number of researchers have attemptedto identify the factors influencing IOS adoption. For instance, Iacovou et al.[1995] have studied the impact of perceived benefits, organizational readi-ness and external pressure on the electronic data interchange (EDI) adoptionamong small firms.
Based on the work from Iacovou et al. [1995], Chwelos et al. [2001] haveempirically studied the impact of various factors on EDI adoption decisions.They have shown that perceived benefits of the EDI, organizational readinessfactors (such as financial resources), IT sophistication and trading partnerreadiness as well as the two external pressure factors competitive pressure andenacted trading partner power, are significant determinants of EDI adoption.
Sharma et al. [2007] have applied the model from Chwelos et al. [2001]to the RFID context and qualitatively assessed it. The study shows thattechnology-related factors such as perceived benefits and costs as well as thedominant partner pressure are the main determinants behind RFID adop-tion. Additionally, Whitaker et al. [2007] provide empirical evidence that ITintegration and firm size are significant determinants of RFID adoption.
There also exist studies which specifically explore RFID adoption deci-sions in the automotive industry [e.g., Schmitt et al., 2007, Fleisch et al.,2004, Strassner, 2005]. For example, Schmitt et al. [2007] have singled outtechnological factors, such as compatibility, costs, complexity of the technol-ogy and its implementation as well as top-management (TM) support, asrelevant RFID adoption drivers for the automotive industry.
Most of these studies are either technology-centric or mainly concentrateon internal RFID application scenarios. However, Strassner [2005] providesa comprehensive analysis of RFID potentials in the automotive industry inthe collaborative context. We build on his study and explore RFID adoptiondynamics in the supply chain of the automotive industry through the lens ofa technology adoption model in the B2B context. Thereby we take a broaderview of supply chain relations and their dependencies.
177
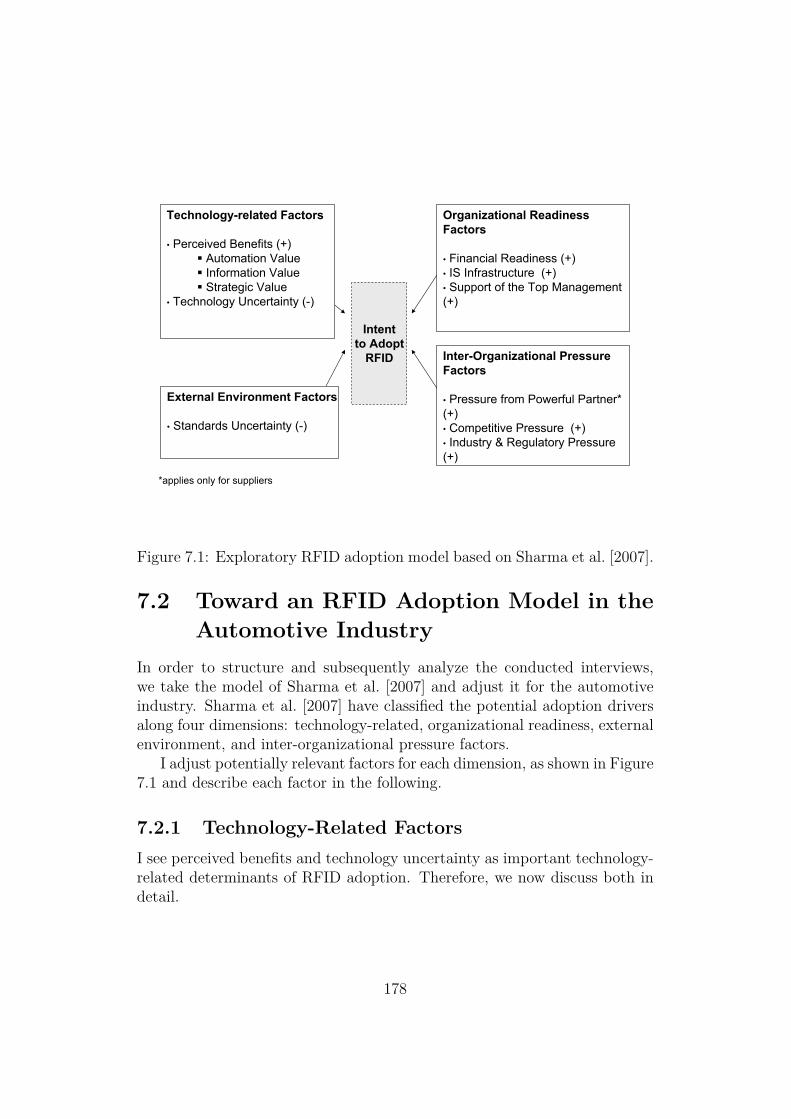
Intentto Adopt
RFID
Technology-related Factors
• Perceived Benefits (+)Automation ValueInformation ValueStrategic Value
• Technology Uncertainty (-)
External Environment Factors
• Standards Uncertainty (-)
Organizational ReadinessFactors
• Financial Readiness (+)• IS Infrastructure (+)• Support of the Top Management (+)
Inter-Organizational PressureFactors
• Pressure from Powerful Partner* (+)• Competitive Pressure (+)• Industry & Regulatory Pressure(+)
*applies only for suppliers
Figure 7.1: Exploratory RFID adoption model based on Sharma et al. [2007].
7.2 Toward an RFID Adoption Model in theAutomotive Industry
In order to structure and subsequently analyze the conducted interviews,we take the model of Sharma et al. [2007] and adjust it for the automotiveindustry. Sharma et al. [2007] have classified the potential adoption driversalong four dimensions: technology-related, organizational readiness, externalenvironment, and inter-organizational pressure factors.
I adjust potentially relevant factors for each dimension, as shown in Figure7.1 and describe each factor in the following.
7.2.1 Technology-Related FactorsI see perceived benefits and technology uncertainty as important technology-related determinants of RFID adoption. Therefore, we now discuss both indetail.
178
Perceived Benefits
Perceived benefits were consistently found to have a significant positive effecton the intention to adopt IOS technology [e.g., Chwelos et al., 2001, Iacovouet al., 1995, Premkumar and Ramamurthy, 1995]. For the purposes of ourstudy we differentiate between automation, information and strategic benefitsof RFID. Automation benefits arise when efficiency gains or cost savings(i.e., labor costs) are achieved resulting from automation of previously non-automated processes.
Information value can be created through improved transparency of pro-cesses in the enterprise and along the supply chain, e.g., improved inventoryvisibility. Strategic benefits result from a potential first-mover advantage aswell as innovation-leader acknowledgment. For example, an original equip-ment manufacturer (OEM) might aspire to the innovator image, similar toMETRO AG in the retailing industry.
Technology Uncertainty
Schmitt et al. [2007] single out technology uncertainty factors, such as com-patibility and complexity as relevant impediments of RFID adoption in theautomotive industry. Due to the characteristics of RF signals the readabilityof RFID tags depends on the environment [Finkenzeller, 2003]. Consequently,all RFID applications need to be sorely tested and the downstream softwaresystem – capturing the data – may need to be adjusted to deal with incom-plete or false data.
7.2.2 Organizational Readiness FactorsOrganizational readiness factors encompass, but are not limited to, financialreadiness, information systems (IS) infrastructure as well as the support ofthe top management. We discuss all three factors in the following.
Financial Readiness
Financial readiness has consistently been found to be positively linked to theintent to adopt IOS [e.g., Chwelos et al., 2001] and implies having enoughresources to pay for the technology. Financial readiness is especially crucialfor suppliers, because they have to bear the costs of necessary changes inthe infrastructure, the production process, and the RFID hardware costs,see Chapter 6. The suppliers’ financial readiness can be supported throughappropriate cost-benefit-sharing schemes with OEMs [Strassner and Fleisch,2003, Iacovou et al., 1995]. OEM’s investment is limited to installing a reader
179

infrastructure and having RFID integration costs [Strassner and Fleisch,2003].
Information Systems Infrastructure
[Sharma et al., 2007, p.7] define information systems infrastructure readinessas "firm possessing appropriate technology infrastructure, people and exper-tise to support easy adoption”. An advanced IT infrastructure has beenconsistently found to be a significant positive determinant of IOS adoption[e.g., Chwelos et al., 2001, Premkumar and Ramamurthy, 1995].
Top-Management Support
Introduction of RFID is associated with significant financial investments andcostly process changes and therefore can be a strategic decision requiringtop-management support. We consistently found top-management supportto be a significant positive determinant of IOS adoption [e.g., Premkumarand Ramamurthy, 1995].
7.2.3 External Environment FactorsSharma et al. [2007] have additionally pointed out RFID-specific externalenvironment factors such as standards convergence and privacy concerns.Whereas privacy discussion mainly concerns daily consumer goods [e.g.,Rothensee. and Spiekermann, 2008], RFID standards convergence is anintensively debated issue in the automotive industry. Standards uncertainty(data on tag vs. data on network) can be an impediment of RFID adoption.
7.2.4 Inter-Organizational Pressure FactorsAccording to Sharma et al. [2007], RFID-related external pressure can takethe following forms: competitive pressure, pressure from powerful partnersor industry organizations. All three pressure factors are discussed in thefollowing.
Competitive Pressure
Competitive pressure in the automotive industry can take two appearances.On the one hand, sheer competition intensity at both OEM and suppliers’levels can induce organizations to adopt RFID to gain competitive edge. Onthe other hand, competitive pressure can manifest itself in the organizationaldesire not to be left behind if the rest of the industry adopts the technology
180

[e.g., Premkumar and Ramamurthy, 1995, Chwelos et al., 2001] have shownthat competitive pressure is a relevant factor of EDI adoption. On the con-trary, Sharma et al. [2007] have not found any evidence that RFID adoptionis driven by the competitive pressure.
Pressure from Powerful Partners
Pressure from powerful partners can be an important determinant of RFIDadoption for the suppliers, who often perceive net benefits of the technol-ogy as negative. Hart and Saunders [1997] differentiate between persuasiveand coercive approaches to power exercise. A persuasive approach can, forexample, take the form of information exchange and recommendations withthe aim to change the perception of the supplier towards RFID [Frazier andSummers, 1984]. Furthermore, coercive approaches focus on punishment andthreats. Whether and which type of influence strategy is exercised dependson the type of relationship between partners.
Hart and Saunders [1997] state that coercive power is often applied in sit-uations when suppliers can be exchanged easily. For example, upstream theautomotive supply chain, producers of low-cost spare parts can be exchangedwithout difficulty due to low sophistication of their products. However, notall suppliers can be replaced in such an easy manner.
Due to increasing outsourcing trends and therefore growing reliance ofOEMs on supplier’s expertise, successful collaboration and coordination be-comes the key to market success [Kalmbach and Kleinhans, 2004]. Supplier’sexpertise (expert power) is becoming the most important determinant of theirbargaining position against OEMs. [Crook and Combs, 2006, p. 547] evensuggest “that stronger firms forbear [from the] use of bargaining power whenexercising it [...] would threaten the chain’s ability to coordinate”. Thus,when a relationship with a particular supplier is important for the OEM,persuasive sources of power will be preferred [Frazier and Summers, 1984].
Industry and Regulatory Pressure
This type of pressure manifests itself in certain regulations which promotetechnology use. For example, the US TREAD Act obligates OEMs to assuretransparency of the production processes. Such regulations can facilitateRFID adoption along automotive supply chains.
181
7.3 Method and ResultsTaking into account the early stage of RFID adoption, we choose an explo-rative approach to fulfill the aim of our study. We conduct ten interviews:three with OEMs and seven with suppliers at different tiers. We interviewhigh-level executives with relevant RFID and supply chain management ex-pertise. All interviews were conducted in Germany between September andNovember 2007, either personally or by telephone. Each interview took be-tween 18 and 93 minutes.
Despite a commonly low sample size and resulting lack of generalizability,research interviews are a widespread instrument of qualitative research. Weadopt this method because of the explorative nature of the subject. Moreover,due to the personal nature of interviews as opposed to surveys, we are ableto collect opinions and impressions rather than just clear facts.
We structure the interviews along the lines of the model described above.We ask the participants about their current RFID experiences, RFID benefitsin internal and IOS applications, as well as the main factors of their RFIDadoption decision. The analysis of the interviews allows the above-suggestedRFID adoption model to be modified, as shown in Figure 7.2.
All excerpts from the interviews are translated from German into English.In the following we first describe each participant and then discuss eachfactor from OEMs’ and suppliers’ viewpoints. Tables 7.1 and 7.2 providean extracted summary of the interviews. In Table 7.1 we depict the RFIDstanding of the company: whether they have RFID pilots or also real-lifeimplementations. Moreover, one can see on what their adoption decisionmainly and secondarily depends on, and why they intended to adopt RFID.
OEM 1’s position to the suppliers is that they first want to the suppliers tovoluntarily participate in pilots; using their persuasive power. Later coercionmay also be possible. OEM 1 thinks that RFID is beneficial for both sides;seeing cost-benefit sharing as a possible opportunity. Here the competitivepressure on suppliers supersedes OEM’s coercive power. Additionally, thisOEM sees that the supplier might be negatively impacted if EPC becomes astandard.
OEM 2 thinks that RFID is beneficial for both sides. He does not intendto apply cost-benefit-sharing models for the long-term. OEM 3 also sharesthe opinion that RFID is beneficial for both sides. Furthermore, he thinksthat the main driver for the suppliers is competitive pressure.
Supplier 1 belongs to the first tier: systems integration. He develops elec-tronics and entertainment systems. Supplier 2 is a first- as well as second-tiersupplier: systems integration and developer. They produce car bodies andchassis frames. Supplier 3 manufactures brakes, steering, suspensions, and
182

Intentto Adopt
RFID
Technology-relatedFactors
• Perceived Benefits (+)Automation ValueInformation ValueStrategic Value*
• Technology Uncertainty (-)
External EnvironmentFactors
• Standards Uncertainty** (-)• Expected Dependencyon EPCglobal (-)
Organizational ReadinessFactors
• Financial Readiness* (+)(mainly in relation to the cost-benefit sharing
scheme)
Inter-Organizational PressureFactors
• Pressure from PowerfulPartner* (+)• Competitive Pressure (+)
* applies only forsuppliers** applied to OEMs
Figure 7.2: Exploratory RFID adoption model based on interview results.
safety systems. Therefore they belong to the developers in the second tier.Supplier 4 is also a second-tier supplier, developing interior air-conditioningsystems. Supplier 5 and 6 are both in the first tier: 5 produces tires, and 6car bodies and chassis frames. Supplier 6 does not belong to the second tier;his customers are only OEMs. Supplier 7 is a first- and third-tier supplier,having as customers both the OEMs and second-tier suppliers. He producescomponents for engines, transmissions, and power trains.
7.3.1 Technology-related FactorsThe interviews show that both previously discussed technology-related fac-tors – technology uncertainty and perceived benefits – are relevant. Neverthe-less, the strategic value from the perceived benefits only applies to suppliers.We discuss perceived benefits for OEMs and suppliers separately.
Perceived Benefits for Original Equipment Manufacturers
All OEMs in the sample pointed out benefits of RFID as the most importantadoption driver. All respondents were asked to rank automation (A), infor-
183

mation (I) and strategic (S) benefits of RFID. All OEMs ranked automationbenefits higher than information benefits. OEMs see most automation bene-fits in the process optimization through time and labor cost reductions: “Barcodes had to be placed under a bar code scanner, and there were workers whomanaged the check-out gate [...]. We reduced costs by cutting down almostten workers [through RFID]”.
Nevertheless, information benefits which RFID can provide along the sup-ply chain are also in the focus of the OEMs. Information value was stressedin the context of traceability and process documentation: “Again and againit happens that suppliers say they don’t have our containers any more. Butaccording to our calculations, there should be enough(...)” or: “Our visionis: when the car is completely assembled, to see at an electronic glance thatall parts in the car are appropriate”.
Being an “innovation leader” was not the main motivation for the OEMs:“RFID has never been an end in itself”. This is despite the fact that OEMsrecognize that RFID can potentially cut costs and improve their competitiveposition.
Perceived Benefits for Suppliers
All OEMs implied that RFID can bring mutual benefits to them as well astheir suppliers: “Normally, the reasons for “lost” containers can be foundat both sides; looking for them costs time, resources, and a lot of money”.However, most of the suppliers in our interviews evaluated RFID benefitsto be too low or absent, especially compared to the costs: “We don’t seeany radical advantages, so that the investments into hardware and softwareimplementation are worth it”.
Despite their importance for the financial plausibility of the investment,only suppliers 3, 5 and 6, who had a relatively strong market position, recog-nized that perceived benefits would be the most important criteria in theiradoption decision. Interestingly, when asked to rank specific RFID benefits,three out of five suppliers placed automation before information benefits.This result is unexpected, because automation benefits are usually derivedin internal applications. Conversely they all reported having a low internalvalue from RFID. Informational benefits of RFID were seen in the area ofprocess documentation and traceability: “Our customer demands that we areable to relate which component is placed into which module”.
Some suppliers saw RFID introduction as a strategic investment into theirrelationship with the OEM. Suppliers who adopt RFID can potentially beevaluated as more trustworthy by the OEM and therefore can hope for morecooperation: “There is more trust in collaboration with those suppliers who
184

already use RFID. Others have to prove that they are able to fulfill our [theOEM’s] requirements”. Similarly, mutual investment into RFID infrastruc-ture might create higher switching costs for the OEM and therefore bind it:“RFID represents strategic value when one cooperates better with the OEM,for example when both invest into hardware, which can be seen as a specificinvestment.”
Technology Uncertainty
RFID adoption is still hindered by physical problems in some areas: “Thequestion is how exact the tag stability and readability is. If we cannot assureit, we won’t do it”. Similarly, one OEM recognized: “At the moment, weare in a learning phase. We are running the first RFID projects to see ifit makes sense to continue with this technology. Actually we want to knowif the technology is even mature”. Two suppliers could also predict possiblereadability issues.
7.3.2 Organizational Readiness FactorsWe have evaluated that for OEMs organizational readiness factors do notplay an important role. However, suppliers mentioned financial readiness asan important factor for RFID adoption. Many of them see no benefits inRFID but have to finance it. Interestingly only some low- and moderatelydependent suppliers (3, 5 and 6) explicitly mentioned high costs of RFIDintroduction. To alleviate the problem of high investments, many suppliersexpect the OEM to partly share the costs of RFID introduction. This isindependent of their OEM’s dependency: “If OEM says, we want you tointroduce RFID, we will do so. But we will then negotiate price with them.At the end it is their requirement”.
Although OEMs generally agree to support their suppliers during pilots,their support will diminish or stop after the pilot phase ends: “If we wantto use RFID permanently after the pilot phase and we would have to provideall suppliers with the hardware [...] then all cost savings will be gone”.
7.3.3 External Environment FactorsBased on the literature review we have identified uncertainty about standardsas an external environment factor. The interviews have shown that OEMsare indeed negatively influenced by standards uncertainty. Their absenceis an obvious impediment of RFID introduction: “When we later adopt the
185
new standards [...], we would be confronted with huge IT problems [in ourcompany]”.
Additionally, expected dependency on EPCglobal emerged as an impedi-ment of RFID adoption. EPC dependency risks represent a two-sided prob-lem. Some OEMs do not want to depend on EPC: “I want cryptography onthe tag that allows me to identify if the parts inside the car are original. Idon’t want to use any IT infrastructure [...]”.
Furthermore, adoption of EPC standard might result in extra costs forsuppliers who have to buy identification number area from EPCglobal. Thiscan become a significant financial burden for small suppliers: “The identifi-cation number area will impact suppliers considerably”.
7.3.4 Inter-Organizational Pressure FactorsThe interviews show that industry and regulatory pressure factors have nosignificant relevance. However, pressure from powerful partners and compet-itive pressure do play a role.
Pressure from Powerful Partner
This is a decisive factor of RFID introduction for OEM-dependent suppliers(1, 2). They feel that they have no choice but to adopt RFID, if the OEMdemands it: “If OEM demands RFID introduction, we will for sure do so”.
Suppliers (3, 4, 5) with a better bargaining position saw estimated bene-fits of RFID as an important factor in their decision to adopt. Even so, thesesuppliers acknowledged that their OEMs still remain their customer. Thus,his wishes are to be respected: “If for example an OEM sends a request re-garding RFID, then we have a different situation”. Suppliers in this categoryexpected the OEM to share upcoming RFID-related costs with them: “IfOEMs say: we would like you to introduce RFID – no bar code any more –then it will be done. [...] but we can conduct price negotiations. At the endof the day it is their requirement and it has its costs”.
Suppliers in the third category (6, 7) viewed themselves as an equal part-ner with their OEM either due to their size or unique expert power. Thesesuppliers were mainly guided by estimated benefits and competitive pressurein their decision to introduce RFID. For example, supplier 6 mentioned thatthey “would invest into RFID introduction and process re-engineering onceOEMs show RFID benefits to them”.
Despite differences in the dependency structure between interviewed sup-pliers, most of them expected the OEM to adopt a persuasive approach first:“Such things are medium-term and long-term strategies. As a rule they are
186

clearly communicated, so that one can prepare oneself for the new businessmodel”. Only supplier 1 did not have illusions regarding its role in the RFIDadoption process. Answering the question of whether an “OEM is likely torecommend RFID adoption kindly!”, he answered: “I have never experiencedit in this form. There are clear requirements, which state that this and thatinformation should be placed at the deliverables. And we simply have to fulfillit. There is no other alternative”.
The OEMs were also asked how they plan to enforce RFID adoption attheir suppliers. Being in the pilot phase now OEMs are trying to win thesuppliers on their side by using persuasive influences: “We have to persuadeour colleagues in the motor-producing factories that they will also have valueadded [from RFID]. [...] Gradually we can win more suppliers by showingthe savings that can be achieved along the supply chain”.
Coercive power is not applied at the moment: “We try to win the suppliers[...]. At the moment we don’t coerce them to adopt RFID”. Once the valueof RFID has been proved in the pilot projects, OEMs are likely to requestRFID for the next contract: “Once we persuade ourselves that RFID makessense and offers a lot of benefits for all, but we have partners who are noton the same line, then we will say: we demand this”. Most OEMs confirmedthat if, in this case, their demands are not met, they are likely to change thesupplier for the next contract.
Competitive Pressure
Competitive pressure was an important factor for OEMs and as well as sup-pliers. Throughout the interviews OEMs recognized high cost pressure in-dicating intensive competition. One OEM stated that competitive pressurewill be the main factor for suppliers to adopt RFID so that no coercive in-fluence is necessary: “the pressure is already so high that people start to goin this direction by themselves [...] without the need to use the “brutal bruteforce” [coercive power]”. This potential rotation threat also translates intocompetitive pressure for the suppliers: "Since most suppliers know quite wellthat RFID will come sooner or later, they are currently preparing themselves,so that they do not fall behind the competition”.
Supplier 7 saw no internal benefits of RFID. Nevertheless, he will be readyto introduce it due to competitive pressure: “When one of our customers asksfor RFID, it is a signal for us that the trend is going in this direction. As[...] at some point another customer will come, and then the third and thefourth”.
187

7.4 ConclusionIn this chapter we analyzed RFID adoption dynamics in the automotive in-dustry. We show that perceived benefits, technology uncertainty, pressurefrom a powerful partner as well as competitive pressure play an importantrole in RFID diffusion in the automotive industry. Moreover, dependencyon the organization for defining RFID standards – EPCglobal – emergedas an additional determinant of RFID adoption decision. For OEMs stan-dards uncertainty is an industry-wide impediment. Financial readiness of thesuppliers was mentioned mainly in relation to cost-benefit-sharing schemes.Other determinants, such as top-management support, were mentioned onlysporadically.
In our interviews we found that OEMs consider competitive pressure as aself-enforcing mechanism for RFID diffusion at suppliers. This will make theexercise of coercive power by OEMs redundant. Being primarily motivatedby perceived benefits OEMs persuade suppliers to find meaningful RFIDapplications at their site.
However, only two suppliers with a relatively strong market position rec-ognized that perceived benefits would be a key determinant in their decisionto adopt RFID. Some suppliers consider pressure from the OEM as the keyadoption determinant, independent of their RFID benefits. Moreover, onceOEMs fully recognize the usefulness of RFID in collaborative scenarios, theywill demand it coercively. But until now they prefer to use persuasive power.Finally, cooperation in common RFID projects creates more trust betweenpartners and increases the supplier’s chances of gaining future contracts.
From our study we see the following implications for an RFID adoptionin the automotive industry. The use of a coercive approach could be redun-dant because of the market-driven RFID adoption among many suppliers.This is also the reason why OEMs could promote their RFID activities moreopenly and already integrate suppliers at early stages. Furthermore, sup-pliers should adopt a more global view when considering RFID adoption.Suppliers implementing RFID now can gain an early-mover competitive ad-vantage by developing higher trust in their relationship with the OEM aswell as accumulating unique expertise in this area.
Our study furthermore shows that RFID adoption can be accelerated andfurther enhanced by cost-benefit-sharing arrangements, such as, for example,cross payments or non-monetary compensation. This is not contingent uponthe level of supplier dependency. However, the forms which these arrange-ments should take is subject to further research.
Summing up, our key findings are that the use of a coercive approach bythe OEM could be redundant because of the market-driven RFID adoption
188

among many suppliers. Furthermore, suppliers implementing RFID can nowgain an early-mover competitive advantage by developing higher trust in theirrelationship with the OEM as well as accumulating unique expertise in thisarea.
189
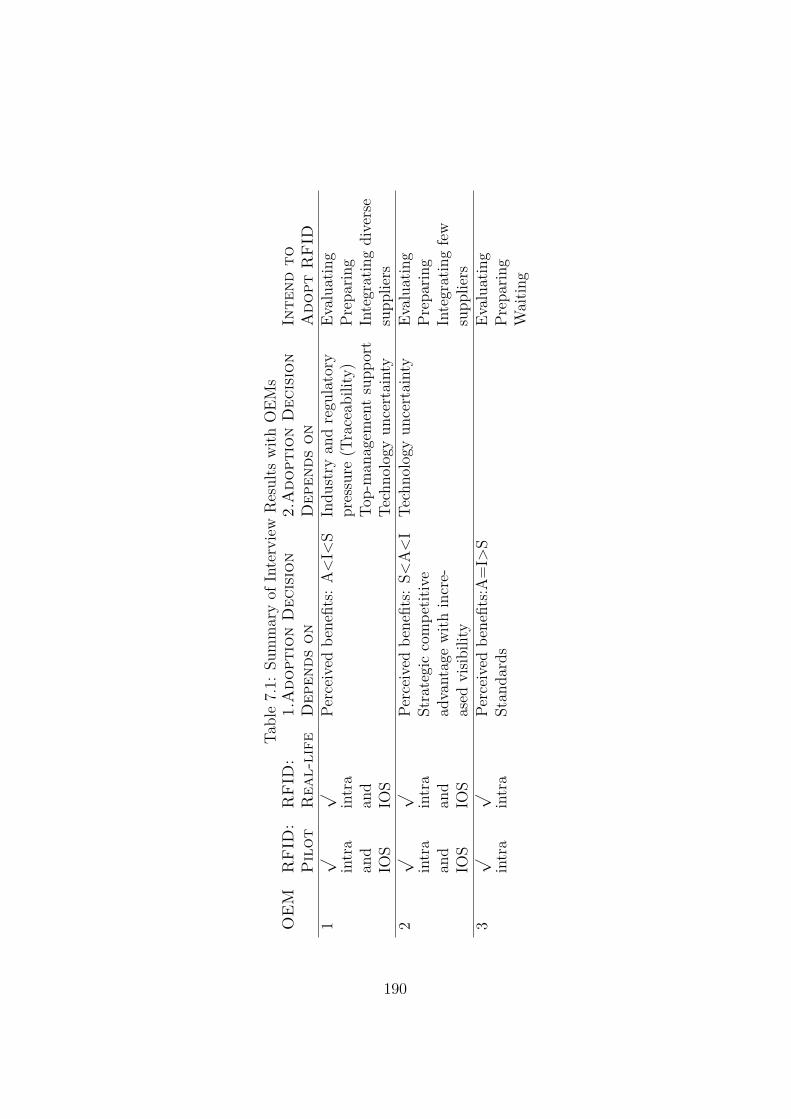
Table7.1:
Summaryof
Interview
Results
with
OEM
sO
EM
RF
ID:
RF
ID:
1.A
dopt
ion
Dec
isio
n2.
Ado
ptio
nD
ecis
ion
Inte
ndto
Pil
otR
eal-
life
Dep
ends
onD
epen
dson
Ado
ptR
FID
1√
√Pe
rceivedbe
nefits:
A<I<
SIndu
stry
andregu
latory
Evalua
ting
intra
intra
pressure
(Traceab
ility)
Preparing
and
and
Top-man
agem
entsupp
ort
Integratingdiverse
IOS
IOS
Techno
logy
uncertainty
supp
liers
2√
√Pe
rceivedbe
nefits:
S<A<I
Techno
logy
uncertainty
Evalua
ting
intra
intra
Strategiccompe
titive
Preparing
and
and
advantagewith
incre-
Integratingfew
IOS
IOS
ased
visib
ility
supp
liers
3√
√Pe
rceivedbe
nefits:A
=I>
SEv
alua
ting
intra
intra
Stan
dards
Preparing
Waitin
g
190
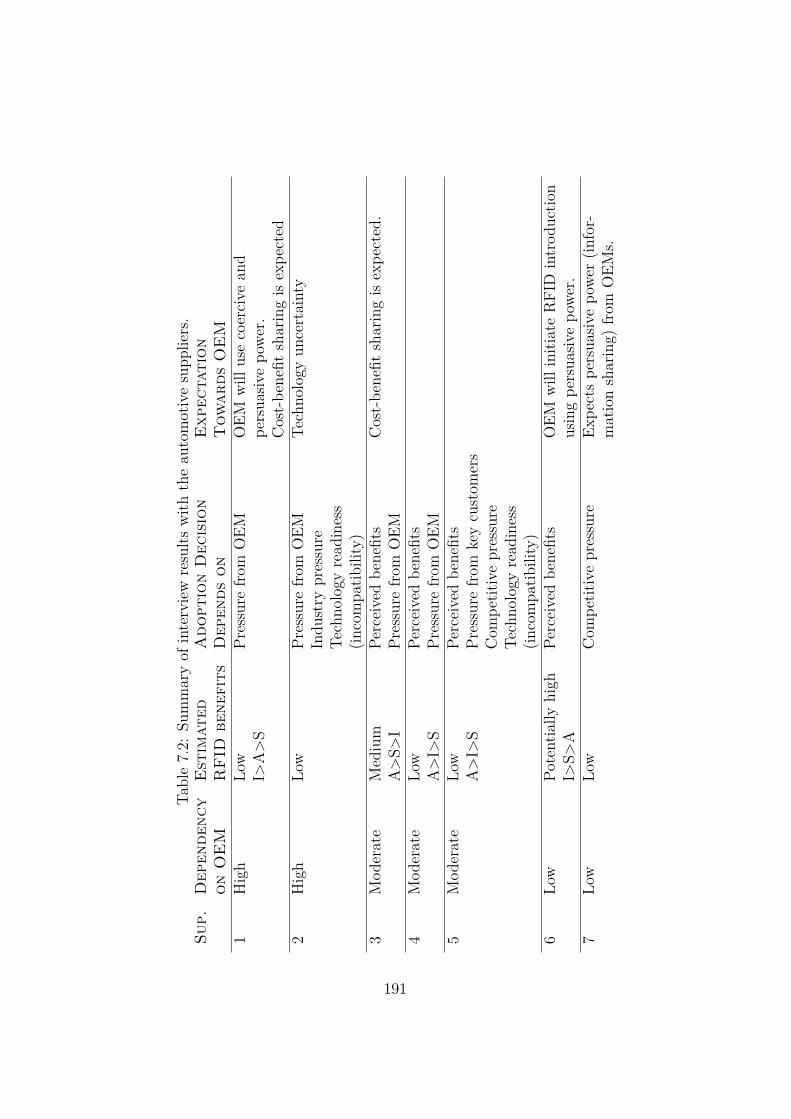
Table7.2:
Summaryof
interview
results
with
theau
tomotivesupp
liers.
Sup.
Dep
ende
ncy
Est
imat
edA
dopt
ion
Dec
isio
nE
xpec
tati
onon
OE
MR
FID
bene
fits
Dep
ends
onT
owar
dsO
EM
1High
Low
Pressure
from
OEM
OEM
will
usecoercive
and
I>A>S
persua
sivepo
wer.
Cost-be
nefit
sharingis
expe
cted
2High
Low
Pressure
from
OEM
Techno
logy
uncertainty
Indu
stry
pressure
Techno
logy
read
iness
(incompa
tibility)
3Mod
erate
Medium
Perceivedbe
nefits
Cost-be
nefit
sharingis
expe
cted.
A>S>
IPr
essure
from
OEM
4Mod
erate
Low
Perceivedbe
nefits
A>I>
SPr
essure
from
OEM
5Mod
erate
Low
Perceivedbe
nefits
A>I>
SPr
essure
from
keycustom
ers
Com
petit
ivepressure
Techno
logy
read
iness
(incompa
tibility)
6Lo
wPo
tentially
high
Perceivedbe
nefits
OEM
will
initiateRFI
Dintrod
uctio
nI>
S>A
usingpe
rsua
sivepo
wer.
7Lo
wLo
wCom
petit
ivepressure
Expe
ctspe
rsua
sivepo
wer(in
for-
mationsharing)
from
OEM
s.
191
Chapter 8
Conclusion
This thesis evaluates the use of RFID in the manufacturing industry. Basedon case studies we analyze seven use cases for RFID. They occurred frequentlyduring our evaluation and are typically either a replacement of bar-codetechnology or an application that can only be realized using RFID. TheseRFID use cases are: accelerating scan processes, extending scan processesfor quality and efficiency, extending scan processes for narrowing recalls,reducing paper-based data management, automating asset tracking, reducingback-end interactions, and unifying labels.
However, despite all the potential benefits these use cases promise, RFIDtechnology is not yet widely adopted in intra-enterprise applications. This isbecause manufacturers face various challenges when embedding RFID intoshop-floor processes. This includes physical hindrances on the shop floor aswell as software issues, and the difficulty to evaluate quantifiable and non-quantifiable costs and benefits of RFID investments beforehand.
Hostile physical conditions on the shop floor or the presence of metal canbe solved using appropriate hardware. Concerning software issues, compa-nies need to integrate RFID into their existing IT infrastructures. Only atight integration with existing ERP and MES facilitates that RFID leadsto concrete and local productivity improvements. Integrating RFID datainto IT-enabled business processes results in a more precise match of theshop floor with the companies’ IT processes. This leads to more visibil-ity about production processes; permitting faster adaptations to productionvariations. Additionally, the software has to be robust and scalable for han-dling the processing of RFID data streams. Thus, besides the evaluation ofRFID use cases, another contribution of this thesis is the identification ofRFID-specific constraints that IT infrastructures in manufacturing have toprovide. An additional contribution is to give guidelines for the constructionof IT infrastructures that satisfy these constraints.
192
By conducting seven more case studies we evaluated that IT implementa-tions following the ISA-S95 standard and most IT infrastructures in practicediffer. Most of the analyzed companies do not follow the ISA-S95 stan-dard. Nevertheless, the seven case studies show that all infrastructures stillshare common functionalities and software components. It was even possi-ble to at least partially match their IT infrastructures to this standard. Thismeans that manufacturers share common parts in their IT infrastructure eventhough their productions differ in diverse ways. This enabled us to generallydescribe – along the well-defined ISA-S95 standard – common functionalitieswhich have to be implemented for an integration of RFID technology.
We evaluated how and where RFID-specific requirements should be de-ployed in IT infrastructures specific to the manufacturing sector. Overall, thedesign guidelines comprise which functional components the IT has to pro-vide for RFID, which interfaces and interactions with external componentsare needed, and which RFID-specific technologies have to be implemented.Moreover, we developed guidance on how to decide where RFID data shouldbe integrated in the four layers of IT infrastructures.
Another impediment of RFID adoption is the lack of dedicated models forevaluating costs and benefits of an RFID rollout. This concerns especiallythe intangible, non-quantifiable aspects of such an investment. Therefore,this thesis provides guidance for assessing both the quantifiable and the non-quantifiable aspects of RFID in manufacturing.
The analysis is based upon experiences from the RFID case studies. Thethesis outlines the most crucial tangible and intangible risks and benefits. Wealso present an assessment scheme to assess tangible and intangible aspects,using value-benefit analysis. The approach assures that the most importantaspects will be reflected in the decision taken, thus reducing the remainingdegree of uncertainty.
Furthermore, the RFID use cases also reveal that manufactures’ motivesfor an RFID adoption are operational uses within manufacturers’ enterprises.Five out of the six evaluated companies would like to use this technologymainly to improve processes and productivity on the shop floor. Motivationsto use RFID as a strategic enabler of data exchange between enterprisesalong the supply chain were found much less frequently. However, this focuson operational, intra-enterprise applications fails to exploit the full potentialof RFID technology.
A hindrance when considering RFID introduction in a supply chain isthat costs and benefits are not always correlated. Some participating com-panies may incur considerable costs that outweigh the local benefits, andvice versa. This can lead to a classical prisoner’s dilemma: It could well bepossible that an existing supply chain could benefit from introducing RFID
193
technology. These gains, however, are never realized because some partici-pants would need to incur costs that are not justifiable in comparison to theirlocal benefits. As a result, they decide – for completely rational reasons –not to adopt the new technology.
Therefore, we also conducted ten semi-structured interviews with OEMsand suppliers analyzing if and how this deadlock not to adopt RFID in supplychains could be resolved.
We show that RFID adoption can be accelerated and further enhancedby cost-benefit sharing arrangements, such as, for example, cross paymentsor non-monetary compensation. This is not contingent upon the level ofsupplier dependency. However, the forms these arrangements should takeare subject to further research.
Perceived benefits, technology uncertainty, pressure from a powerful part-ner as well as competitive pressure play an important role in RFID diffusionin the automotive industry. Moreover, dependency on the non-profit stan-dardization EPCglobal emerged as an additional determinant of the RFIDadoption decision. For OEMs standards uncertainty is an industry-wide im-pediment.
We could also observe that cooperation in common RFID projects cre-ates more trust between partners and increases suppliers’ chances of gainingfuture contracts from their OEMs. If OEMs more openly promoted theirRFID activities and communicated that they give RFID-interested suppli-ers privilege treatment, suppliers would be more encouraged to talk abouttheir RFID motivations. OEMs and suppliers could then solve upcominghindrances collectively.
If manufacturers implement RFID now, they can gain an early-movercompetitive advantage by developing higher trust in their relationship withthe OEM as well as accumulating unique expertise in this area.
194

Bibliography
C. Floekermeier. Infrastructure Support for RFID Systems. PhD thesis,ETH, Zurich, Switzerland, 2006.
B. Scholz-Reiter, K. Windt, and M. Freitag. Autonomous logistic processes- new demands and first approaches. In L. Monostori, editor, Proceedingsof the 37th CIRP International Seminar on Manufacturing Systems, pages357–362, Budapest, 2004.
A. Fruness. Data carriers for traceability. In A. Fruness and I. Smith, editors,Improving Traceability in Food Processing and Distribution, pages 199–237,Cambridge, England: Woodhead Publishing, 2006.
M. Kärkkäinen. Increasing efficiency in the supply chain for short shelf lifegoods using RFID tagging. International Journal of Retail & DistributionManagement, 31(10):529–536, 2003.
G Chappell, L Ginsburg, P Schmidt, J Smith, and J Tobolski. Auto-ID onthe line: The value of Auto-ID technology in manufacturing. Technicalreport, Auto-ID Center, 2003.
B. MCBeath. RFID for manufacturers: How manufacturers are improvingprocesses by using RFID. Technical report, ChainLink Research, 2006.
Jens Strüker, Daniel Gille, and Titus Faupel. RFID report 2008. Technicalreport, Alber-Ludwig University, Friedrichstr. 50, Freiburg im Breisgau,Germany, 2008.
D. Remenyi, A. Money, M. Sherwood-Smith, and Z. Irani. The effectivemeasurement and management of IT costs and benefits. Oxford et al.:Butterworth - Heinemann, 2nd edition, 2000.
H. C. Lucas. Information Technology and the Productivity Paradox - As-sessing the Value of Investing in IT. Oxford et al.: OUP, 2nd edition,1999.
195
P. Schmitt and F. Michahelles. Economic impact of RFID report. Technicalreport, BRIDGE, 2008.
A. Sharma, A. Citurs, and B. Konsynski. Strategic and institutional perspec-tives in the adoption and early integration of radio frequency identification(RFID). In Proceedings of the HICSS – 40th Annual Hawaii InternationalConference on System Sciences, Hawaii, USA, 2007.
M. Strassner and E. Fleisch. The promise of Auto-ID in the automotiveindustry. Technical report, Auto-ID Center Massachusetts Institute ofTechnology, Cambridge, February 2003.
Harry Stockman. Communication by means of reflected power. In Proceedingsof the IRE Conference, pages 1196–1204, October 1948.
Klaus Finkenzeller. RFID Handbook: Fundamentals and Applications in Con-tactless Smart Cards and Identification. John Wiley and Sons, Inc., NewYork, NY, USA, 2nd edition, 2003.
EPCglobal. EPC generation 1 tag data standards version 10 1.1 rev.1.27,standard specification. Technical report, EPCglobal powered by GS1, 2005.
ISO/IEC-18000. Information technology – radio frequency identification foritem management – part 6: Parameters for air interface communicationsat 860 mhz to 960 mhz. Technical report, ISO – International Organizationfor Standardization, 2004a.
C. Bornhövd, T. Lin, S. Haller, and J. Schaper. Integrating automatic dataacquisition with business processes – experiences with SAP’s Auto-ID in-frastructure. In Proceedings of the VLDB – Very Large Data Bases, pages1182–1188, 2004.
C. Floerkemeier and M. Lampe. RFID middleware design: addressing ap-plication requirements and RFID constraints. In Proceedings of the sOc-EUSAI – Smart Objects Conference, pages 219–224, Grenoble, France,October 2005.
Amit Goyal. Savant guide. Technical report, Auto-ID Center MassachusettsInstitute of Technology, Cambridge, 2003.
Y. Chang, D. McFarlane, R. Koh, C. Floerkmeier, and L. Putta. Method-ologies for integrating Auto-ID data with existing manufacturing businessinformation systems. Technical report, Auto-ID Labs, 2002.
196
Oliver Günther, Wolfhard Kletti, and Uwe Kubach. RFID in Manufacturing.Springer, Berlin, Heidelberg, Germany, 1st edition, 2008a.
Lenka Ivantysynova, Holger Ziekow, Oliver Günther, Wolfhard Kletti, andUwe Kubach. Lessons learned. In Oliver Günther, Wolfhard Kletti, andUwe Kubach, editors, RFID in Manufacturing, pages 113–151, Berlin, Hei-delberg, Germany, 2008a. Springer.
Lenka Ivantysynova and Holger Ziekow. Design guidelines for RFID-basedapplications in manufacturing. In Proceedings of the ECIS – Europeanconference on informations systems, Irland, 2008.
Lenka Ivantysynova, Holger Ziekow, and Oliver Günther. A guide to assesscosts and benefits for RFID investments in manufacturing. In Proceedingsof ICIS 2007 Workshop on E-Business, pages 420–432, Montreal, Canada,December 2007.
Hanna Krasnova, Lorenz Weser, and Lenka Ivantysynova. Drivers of RFIDadoption in the automotive industry. In Proceedings of the AMCIS – Amer-ican Conference on Information Systems, 2008.
Oliver Günther, Wolfhard Kletti, Uwe Kubach, Lenka Ivantysynova, andHolger Ziekow. RFID in manufacturing: From shop floor to top floor.In Oliver Günther, Wolfhard Kletti, and Uwe Kubach, editors, RFID inManufacturing, pages 1–23, Berlin, Heidelberg, Germany, 2008b. Springer.
Lenka Ivantysynova, Holger Ziekow, Oliver Günther, Wolfhard Kletti, andUwe Kubach. Case studies. In Oliver Günther, Wolfhard Kletti, and UweKubach, editors, RFID in Manufacturing, pages 61–111, Berlin, Heidel-berg, Germany, 2008b. Springer.
Auto-ID-Center. Technology guide. Technical report, Auto-ID Center, 2002.
Wolfgang Rankl and Wolfgang Effing. Handbuch der Chipkarten. Aufbau– Funktionsweise – Einsatz von Smart Cards. Hanser Fachbuchverlag,Germany, 5th edition, 2008.
ISO/IEC-7813. Information technology – identification cards – financialtransaction cards. Technical report, ISO – International Organization forStandardization, 2006.
ISO/IEC-4909. Bank cards – magnetic stripe data content for track 3. Tech-nical report, ISO – International Organization for Standardization, 2000.
197

K. Wiltschi, A. Pinz, and T. Lindeberg. An automatic assessment schemefor steel quality inspection. Machine Vision and Applications, 12:113–128,2000.
ISO/IEC-15438. Information technology – automatic identification and datacapture techniques – bar code symbology specifications – PDF417. Tech-nical report, ISO – International Organization for Standardization, 2001.
ISO/IEC-16022. Information technology – automatic identification and datacapture techniques – data matrix bar code symbology specification. Tech-nical report, ISO – International Organization for Standardization, 2006.
CA DeJong. Material handling tunes in. Automotive Manufacturing andProduction, 110(7):66–69, 1998.
Samuel Fosso Wamba and Harold Boeck. Enhancing information flow in aretail supply chain using RFID and the EPC network: A proof-of-conceptapproach. Journal of Theoretical and Applied Electronic Commerce Re-search, 3(1):92–105, 2008.
M. Strassner. RFID im Supply Chain Management: Auswirkungen undHandlungsempfehlungen am Beispiel der Automobilindustrie. DUV, Wies-baden, 2005.
IDTechEx, 2007. IDTechEx RFID forecasts, players and opportunities 2007-2017. Technical report, IDTechEx, Cambridge, 2007.
P. Schmitt, F. Thiesse, and E. Fleisch. Adoption and diffusion of RFID tech-nology in the automotive industry. In Proceedings of the ECIS – EuropeanConference on Information Systems, St. Gallen, Switzerland, 2007.
Rockwell Automation. RFID in manufacturing. Technical report, RockwellAutomation, 2004.
Thomas Wilde and Thomas Hess. Forschungsmethoden der Wirtschaftsinfor-matik – eine empirische Untersuchung. Wirtschaftsinformatik, 4:280–287,2007.
Bent Flyvbjerg. Five misunderstandings about case study research. Quali-tative Inquiry, 2:219–245, 2006.
G. Walsham. Interpreting Information Systems in Organizations. Wiley,U.K., 1st edition, 1993.
198
OICA. Organisation internationale des constructeurs d’automobiles.http://oica.net/, December 2007.
Lenka Ivantysynova and Holger Ziekow. RFID in der Produktion: eine Fall-studie aus der Airbagindustrie. In Proceedings of the GI Workshop RFID-Einsatz in kleinen und mittelständischen Unternehmen, September 2007.
A García, D McFarlane, M Fletcher, and A Thorne. Auto-ID in materialshandling. Technical report, Auto-ID Center, 2003.
M Lampe and M Strassner. The potential of RFID for moveable asset man-agement. In Proceedings of the Workshop on Ubiquitous Commerce inconjunction with the UbiCom Conference, 2003.
Patrick Spiess. Collaborative business items: Decomposing business processservices for execution of business logic on the item. In Proceedings of theEuropean Workshop on Wireless Sensor Networks, 2005.
ISO/IEC-18000. Information technology – radio frequency identification foritem management – part 1: Reference architecture and definition of pa-rameters to be standardized. Technical report, ISO – International Orga-nization for Standardization, 2004b.
Oliver Günther, Lenka Ivantysynova, Maximilian Teltzrow, and HolgerZiekow. Kooperation in RFID-gestützten Wertschöpfungsnetzen. IndustrieManagement, 2006.
C. Floerkemeier, D. Anarkat, T. Osinski, and M. Harrison. PML core spec-ification 1.0. Technical report, Auto-ID Center Massachusetts Institute ofTechnology, Cambridge, 2003.
P. Cox and J.P.I. Camps. Regulation (ec) no 178/2002 of the europeanparliament and of the council of january 2002 – laying down the generalprinciples and requirements of food law, establishing the european foodsafety authority and laying down procedures in matters of food safety.Official Journal of the European Communities, 31:1–24, 2002.
EPCglobal. EPCIS standard version 1.0. Technical report, EPCglobal pow-ered by GS1, 2007.
EPCglobal. EPCglobal tag data standards version 1.3. Technical report,EPCglobal powered by GS1, 2006.
199
D. Luckham. The Power of Events: an Introduction to Complex Event Pro-cessing in Distributed Enterprise Systems. Addison-Wesley Longman Pub-lishing Co., Inc, 1st edition, 2001.
NW. Paton, F. Schneider, and D. Gries, editors. Active Rules in DatabaseSystems. Springer-Verlag, Inc, New York, 1st edition, 1998.
F. Wang, S. Liu, P. Liu P, and Y. Bai. Bridging physical and virtual worlds:Complex event processing for RFID data streams. In Proceedings of theEDBT, 2006.
E. Wu, Y. Diao, and S. Rizvi. High-performance complex event processingover streams. In Proceedings of the ACM SIGMOD International Confer-ence on Management of Data, 2006.
N. Gehani, H. Jagadish, and O. Shmueli. Event specification in an active ob-jectoriented database. In Proceedings of the ACM SIGMOD InternationalConference on Management of Data, 1992.
Coral8. Complex event processing: Ten design patterns. Technical report,Coral8 Inc, 2006.
S. Gatziu and K. Dirtrich. Detecting composite events in active databasesystems using petri nets. In Proceedings of the Workshop on ResearchIssues in Data Engineering: Active Database Systems, 1994.
D. Gyllstrom, E. Wu, H. Chae, Y. Diao, P. Strahlberg, and G. Anderson.SASE: complex event processing over streams. In Proceedings of the 3rdBiennial Conference on Innovative Data Systems Research, Asimolar, CA,USA, Jan 2007.
A. Arasu, B.Babcock, S. Babu, M. Datar, K. Ito, R. Motwani, I. Nishizawa,U. Srivastava, D. Thomas, R. Varma, and J. Widom. STREAM: Thestanford stream data manager. IEEE Data Eng. Bull., 26(1):19–26, 2003.
DJ. Abadi, D. Carney, U. Çetintemel, M. Cherniack, C. Convey, C. Erwin,EF. Galvez, M. Hatoun, A. Maskey, A. Rasin, A. Singer, M. Stonebraker,N. Tatbul, Y. Xing, R. Yan, and SB. Zdonik. Aurora: A data streammanagement system. In Proceedings of the ACM SIGMOD InternationalConference on Management of Data, page 666, 2003.
Szymon Jaroszewicz, Lenka Ivantysynova, and Tobias Scheffer. Schemamatching on streams with accuracy guarantees. Intelligent Data Analysisspecial issue on Knowledge Discovery from Data Streams, 12(3):253–270,2007.
200
Holger Ziekow and Lenka Ivantysynova. Stream processing in networks ofsmart devices. In Proceedings of ACS/IEEE International Conference onPervasive Services, ICPS, pages 269 – 272, Lyon, France, June 2006.
Nina Malakooty. Rosettanet:the organization and the system. Technical re-port, Personal Computing Industry Center University of California, Irvine,http://www.rosettanet.org/cms/sites/RosettaNet/, october 2005.
OAGIS. Open applications group integration specification (OAGIS). Tech-nical report, OAGIS, http://www.openapplications.org, 2007.
T. Williams. The purdue enterprise reference architecture – a technical guidefor CIM planning and implementation. Technical report, ISA ResearchTriangle Park, North Carolina, USA, 1992.
D. Brandl. ANSI/ISA-95.00.01 enterprise-control system integration part 1:Models and terminology. Technical report, ISA Research Triangle Park,North Carolina, USA, 2000.
D. Brandl. ANSI/ISA-95.00.02 enterprise-control system integration part 2:Object model attributes. Technical report, ISA Research Triangle Park,North Carolina, USA, 2001.
D. Brandl. ANSI/ISA-95.00.03 enterprise control system integration part3: Activity models of manufacturing operations management. Technicalreport, ISA Research Triangle Park, North Carolina, USA, 2005.
P. Dubey. Tagging the supply chain. SAP INFO, 141, 2006.
C. Schultz. A roadmap to rfid integration on an sap-centric platform. SAPNetWeaver Magazine, 2007.
R. Angeles. RFID technologies: Supply-chain applications and implementa-tion issues. Information Systems Management, 22(1):51–65, 2005.
K. Främling, M. Harrison, and J. Brusey. Globally unique product iden-tifiers – requirements and solutions to product lifecycle management. InProceedings of the 12th IFAC Symposium on Information Control Problemsin Manufacturing, pages 855–860, 2006.
M. Moon and K. Yeom. Product line architecture for RFID-enabled appli-cations. In Proceedings of the BIS Conference, pages 638–651, 2007.
201
M. Moon, K. Yeom, and H.S. Chae. An approach to developing domainrequirements as a core asset based on commonality and variability analysisin a product line. IEEE Transactions on Software Engineering, 31(7):551–569, 2005.
S. Jeffery, G. Alonso, M. Franklin, W. Hong, and J. Widom. Declarative sup-port for sensor data cleaning. In Proceedings of the Pervasive Conference,pages 83–100, 2006.
J. Brusey, C. Floekermeier, M. Harrison, and M. Fletcher. Reasoning aboutuncertainty in location identification with RFID. In Proceedings of theWorkshop on Reasoning with Uncertainty in Robotics at IJCAI, 2003.
S. Babu and J. Widom. Continuous queries over data streams. SIGMODRecord, 30(3):109–120, 2001.
A. Arasu, S. Babu, and J. Widom. The CQL continuous query language:semantic foundations and query execution. The VLDB Journal, 15(2):121–142, 2006.
S. Gatziu and K. Dirtrich. Events in an active object-oriented database sys-tem. In Proceedings of the International Conference on Rules in DatabaseSystems, pages 23–39, 1993.
G. Mühl, L. Fiege, and P. Pietzuch. Distributed Event-Based Systems.Springer-Verlag, Inc, 1st edition, 2006.
T. Pietsch. Bewertung von Informations- und Kommunikationssystemen: einVergleich betriebswirtschaftlicher Verfahren. Erich Schmidt Verlag, Berlin,1999.
P. Costello, A. Sloane, and R. Moreton. IT evaluation frameworks – do theymake a valuable contribution? A critique of some of the classic models foruse by SMEs. The Electronic Journal Information Systems Evaluation, 10(1):57–64, 2007.
J.F. Rockart. Sloan working paper 1297-82: The changing role of the infor-mation systems executive: A critical success factors perspective. Technicalreport, MIT, Cambridge, USA, 1982.
R. Kaplan and D. Norton. The balanced scorecard measures that driveperformance. Harvard Business Review, 70(1):71–79, 1992.
R. Kaplan and D. Norton. Putting the balanced scorecard to work. HarvardBusiness Review, 71(5):134–142, 1993.
202
R. Kaplan and D. Norton. The balanced scorecard as a strategic managementsystem. Harvard Business Review, 74(1):75–85, 1996.
W. van Grembergen and R. van Bruggen. Measuring and improving corporateinformation technology through the balanced scorecard. Electronic Journalof Information Systems Evaluation, 1(1), 2000.
P. Seddon, S. Staples, R. Patnayakuni, and M. Botwell. Dimensions of infor-mation systems success. Communications of the AIS, 2(20):1–60, 1999.
W. H. DeLone and E.R. McLean. The DeLone and McLean model of in-formation systems success: A ten-year update. Journal of ManagementInformation Systems, 19(4):9–30, 2003.
B. Farbey, F. Land, and D. Targett. A taxonomy of information systemsapplications: the benefits’ evaluation ladder. European Journal of Infor-mation Systems, 4(1):41–50, 1995.
E. Bozdag, R. Ak, and T. Koç. Development of a justification tool for ad-vanced technologies: An example for RFID. In Proceedings of RFID Eura-sia, pages 1–4, 2007.
A. Üstündag and M. Tanyas. Evaluating an RFID investment using fuzzycognitive map. Technical report, Technical University – RFID Research &Test Center, Istanbul, 2005.
J. C. Cox, S.A. Ross, and M. Rubinstein. Option pricing: a simplified ap-proach. Journal of Financial Economics, 7(3):229–263, 19791.
J. Curtin, R.J. Kauffman, and F.J. Riggins. Making the most out of RFIDtechnology: a research agenda for the study of adoption, usage and impactof RFID. Information Technology and Management, 8(2):87–110, 2007.
C. Tellkamp. The Auto-ID calculator: An overview. Technical report, Auto-ID Centre, 2003.
R. Laubacher, S.P. Kothari, T.W. Malone, and B. Subirana. What is RFIDworth to your company? Measuring performance at the activity level. MITCenter for eBusiness Research Brief, 7(2):1–6, 2005.
GS1. Der RFID Kalkulator im Überblick. Technical report, GS1 Germany,2007.
203

H. Lee, B. Peleg, J.R. Paresh, S. Sarma, M. Schoonmaker, and B. Subirana.EPC value model. Technical report, Board of Trustees of Leland StanfordJunior University, 2004.
K. Wolf and C. Holm. Total cost of ownership: Kennzahl oder Konzept?Information Management, 13(2):19–23, 1998.
U. Knebel, M. Leimeister, and H. Krcmar. Wahrgenommene strategischeBedeutung von RFID aus Sicht von IT-Entscheidern in Deutschland. InProceedings of the 8. Internationale Tagung Wirtschaftsinformatik, 2007.
R. Derakhshan, M. Orlowska, and X. Li. RFID data management: Chal-lenges and opportunities. In Proceedings of the IEEE International Con-ference on RFID, 2007.
S. Spiekermann and H. Ziekow. RFID: A 7-point plan to ensure privacy.In Proceedings of the 13th ECIS – European Conference on InformationSystems, 2005.
G.P. Hancke. Practical attacks on proximity identification systems. In Pro-ceedings of the IEEE Symposium on Security and Privacy, pages 328–333,2006.
B. Fabian and O. Günther. Distributed ONS and its impact on privacy.In Proceedings of the IEEE International Conference on Communications,2007.
O. Günther and S. Spiekermann. RFID and the perception of control: Theconsumer’s view. Communications of the ACM (CACM), 48(9), 2005.
E. Bernroider and S. Koch. Empirische Untersuchung der Entscheidungsfind-ung bei der Auswahl betriebswirtschaftlicher Standardsoftware in öster-reichischen Unternehmen. In H.R. Hansen and W.H. Janko, editors,Diskussionspapiere zum Tätigkeitsfeld Informationsverarbeitung und Infor-mationswirtschaft, volume 20, Wien, Austria, 1999.
J.L. Andresen. A Framework for Selecting an IT Evaluation Method – inthe Context of Construction. PhD thesis, Danmarks Tekniske Universitet,Lyngby, Denmark, 2001.
K. Millis and R. Mercken. The use of the balanced scorecard for the evalua-tion of information and communication technology projects. InternationalJournal on Project Management, 22:87–97, 2004.
204
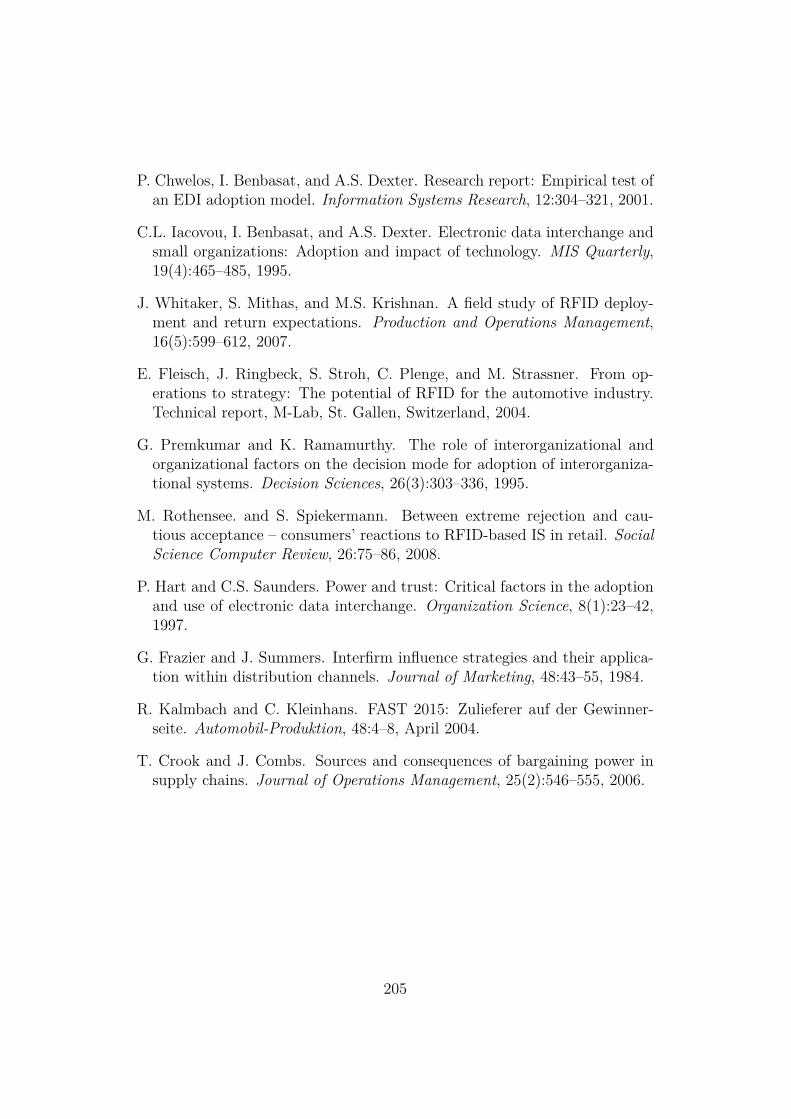
P. Chwelos, I. Benbasat, and A.S. Dexter. Research report: Empirical test ofan EDI adoption model. Information Systems Research, 12:304–321, 2001.
C.L. Iacovou, I. Benbasat, and A.S. Dexter. Electronic data interchange andsmall organizations: Adoption and impact of technology. MIS Quarterly,19(4):465–485, 1995.
J. Whitaker, S. Mithas, and M.S. Krishnan. A field study of RFID deploy-ment and return expectations. Production and Operations Management,16(5):599–612, 2007.
E. Fleisch, J. Ringbeck, S. Stroh, C. Plenge, and M. Strassner. From op-erations to strategy: The potential of RFID for the automotive industry.Technical report, M-Lab, St. Gallen, Switzerland, 2004.
G. Premkumar and K. Ramamurthy. The role of interorganizational andorganizational factors on the decision mode for adoption of interorganiza-tional systems. Decision Sciences, 26(3):303–336, 1995.
M. Rothensee. and S. Spiekermann. Between extreme rejection and cau-tious acceptance – consumers’ reactions to RFID-based IS in retail. SocialScience Computer Review, 26:75–86, 2008.
P. Hart and C.S. Saunders. Power and trust: Critical factors in the adoptionand use of electronic data interchange. Organization Science, 8(1):23–42,1997.
G. Frazier and J. Summers. Interfirm influence strategies and their applica-tion within distribution channels. Journal of Marketing, 48:43–55, 1984.
R. Kalmbach and C. Kleinhans. FAST 2015: Zulieferer auf der Gewinner-seite. Automobil-Produktion, 48:4–8, April 2004.
T. Crook and J. Combs. Sources and consequences of bargaining power insupply chains. Journal of Operations Management, 25(2):546–555, 2006.
205
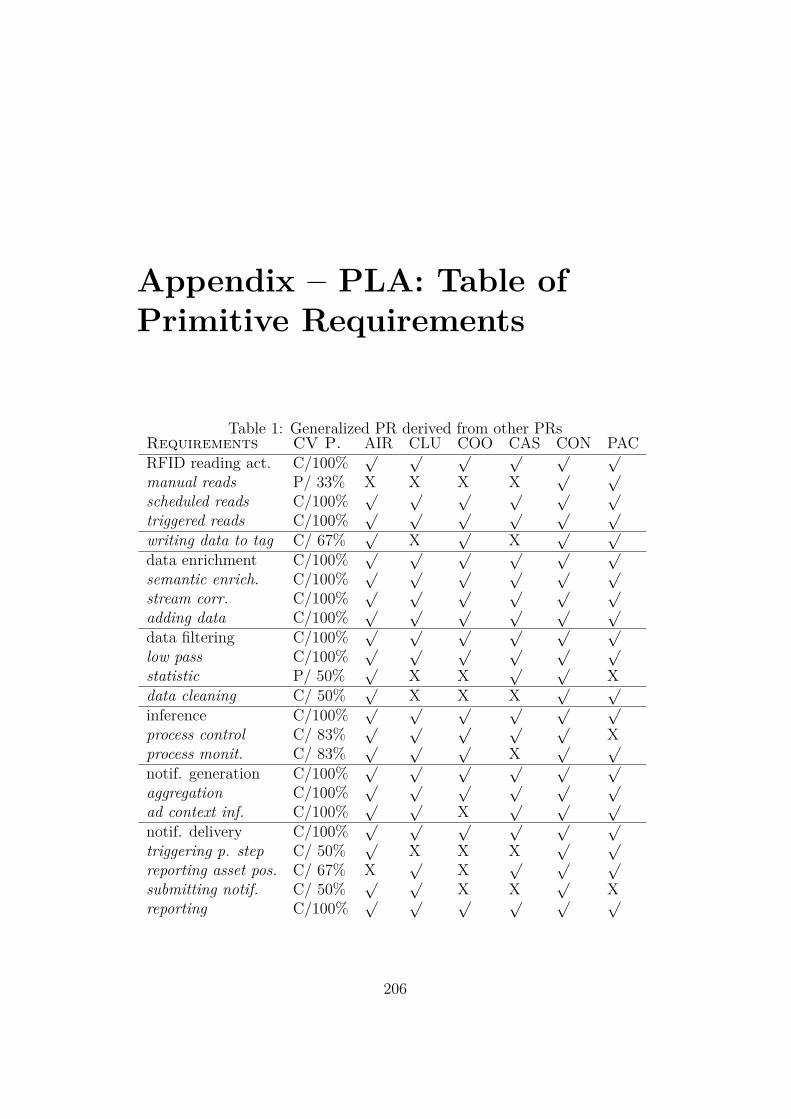
Appendix – PLA: Table ofPrimitive Requirements
Table 1: Generalized PR derived from other PRsRequirements CV P. AIR CLU COO CAS CON PACRFID reading act. C/100%
√ √ √ √ √ √
manual reads P/ 33% X X X X√ √
scheduled reads C/100%√ √ √ √ √ √
triggered reads C/100%√ √ √ √ √ √
writing data to tag C/ 67%√
X√
X√ √
data enrichment C/100%√ √ √ √ √ √
semantic enrich. C/100%√ √ √ √ √ √
stream corr. C/100%√ √ √ √ √ √
adding data C/100%√ √ √ √ √ √
data filtering C/100%√ √ √ √ √ √
low pass C/100%√ √ √ √ √ √
statistic P/ 50%√
X X√ √
Xdata cleaning C/ 50%
√X X X
√ √
inference C/100%√ √ √ √ √ √
process control C/ 83%√ √ √ √ √
Xprocess monit. C/ 83%
√ √ √X
√ √
notif. generation C/100%√ √ √ √ √ √
aggregation C/100%√ √ √ √ √ √
ad context inf. C/100%√ √
X√ √ √
notif. delivery C/100%√ √ √ √ √ √
triggering p. step C/ 50%√
X X X√ √
reporting asset pos. C/ 67% X√
X√ √ √
submitting notif. C/ 50%√ √
X X√
Xreporting C/100%
√ √ √ √ √ √
206
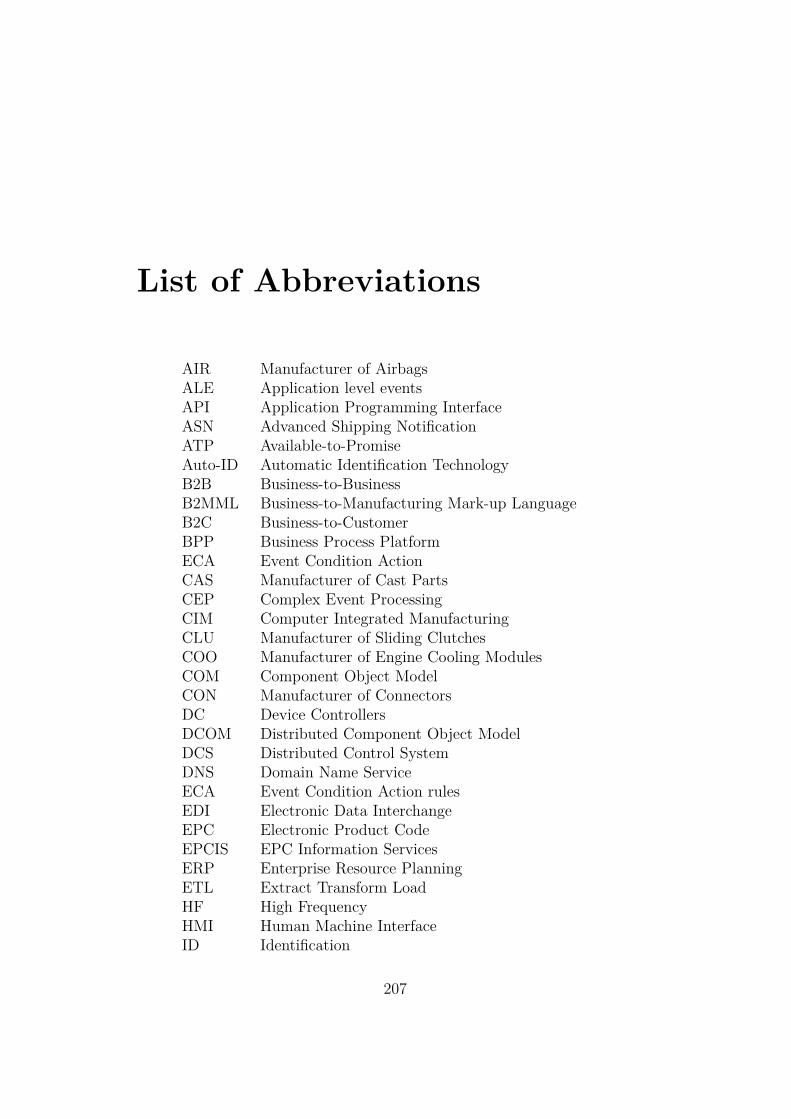
List of Abbreviations
AIR Manufacturer of AirbagsALE Application level eventsAPI Application Programming InterfaceASN Advanced Shipping NotificationATP Available-to-PromiseAuto-ID Automatic Identification TechnologyB2B Business-to-BusinessB2MML Business-to-Manufacturing Mark-up LanguageB2C Business-to-CustomerBPP Business Process PlatformECA Event Condition ActionCAS Manufacturer of Cast PartsCEP Complex Event ProcessingCIM Computer Integrated ManufacturingCLU Manufacturer of Sliding ClutchesCOO Manufacturer of Engine Cooling ModulesCOM Component Object ModelCON Manufacturer of ConnectorsDC Device ControllersDCOM Distributed Component Object ModelDCS Distributed Control SystemDNS Domain Name ServiceECA Event Condition Action rulesEDI Electronic Data InterchangeEPC Electronic Product CodeEPCIS EPC Information ServicesERP Enterprise Resource PlanningETL Extract Transform LoadHF High FrequencyHMI Human Machine InterfaceID Identification
207
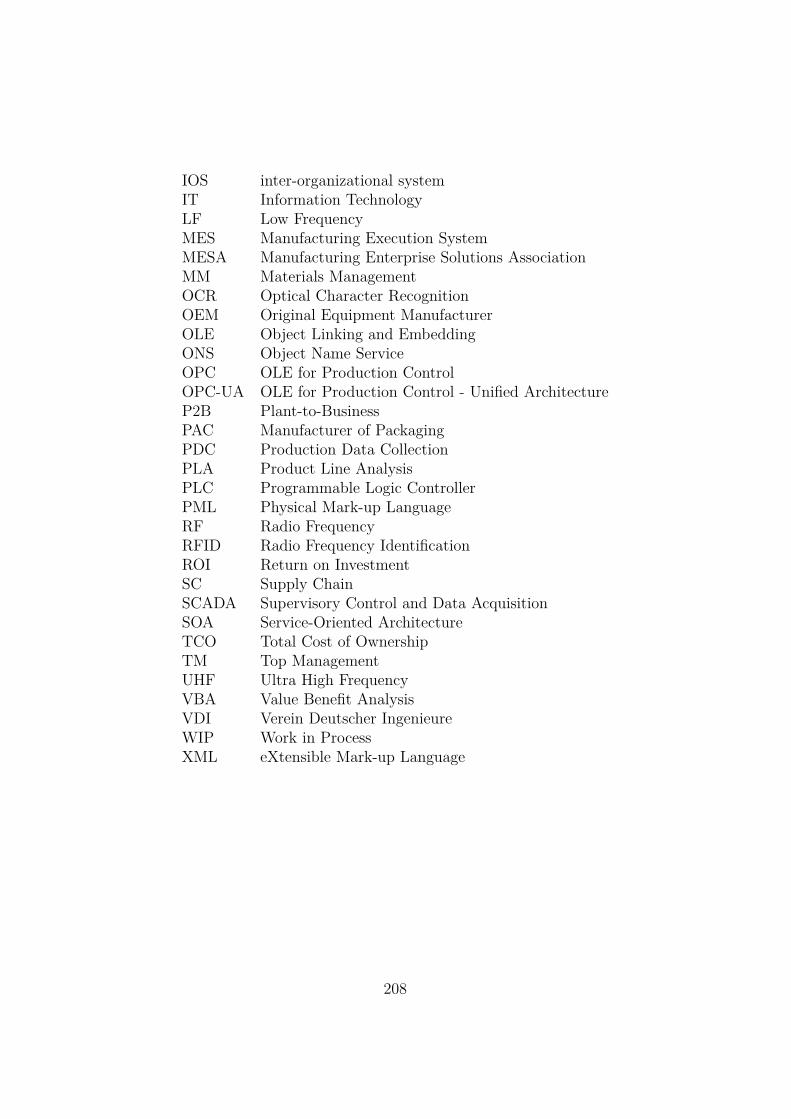
IOS inter-organizational systemIT Information TechnologyLF Low FrequencyMES Manufacturing Execution SystemMESA Manufacturing Enterprise Solutions AssociationMM Materials ManagementOCR Optical Character RecognitionOEM Original Equipment ManufacturerOLE Object Linking and EmbeddingONS Object Name ServiceOPC OLE for Production ControlOPC-UA OLE for Production Control - Unified ArchitectureP2B Plant-to-BusinessPAC Manufacturer of PackagingPDC Production Data CollectionPLA Product Line AnalysisPLC Programmable Logic ControllerPML Physical Mark-up LanguageRF Radio FrequencyRFID Radio Frequency IdentificationROI Return on InvestmentSC Supply ChainSCADA Supervisory Control and Data AcquisitionSOA Service-Oriented ArchitectureTCO Total Cost of OwnershipTM Top ManagementUHF Ultra High FrequencyVBA Value Benefit AnalysisVDI Verein Deutscher IngenieureWIP Work in ProcessXML eXtensible Mark-up Language
208
Acknowledgment
I wish to thank everyone who helped me with my studies and contributed tomy thesis. In particular, I wish to thank and express my deep and sinceregratitude to my supervisor, Professor Oliver Günther, Ph.D., Head of theInstitute of Information Systems, Humboldt-Universität zu Berlin, Germany.He has always fully supported and encouraged me during the more than threeyears of this thesis’s work. He has provided an optimum working environmentfor me at the Institute.
I wish to express sincere thanks to Professor Dr.-Ing. Frank Straube,Head of the Logistics Department at the Institute of Technology and Man-agement, Technical University Berlin, Germany, who has agreed to be mysecond reviewer.
I warmly thank Dr. Jochen Rode from SAP Research Dresden, for hisvaluable advice and ideas. His discussions regarding the work of all casestudies have always been very helpful for this study.
The conducting of five of the six case studies about RFID in manufac-turing has been supported by MPDV Microlab GmbH, Moosbach, Germany.With their support, I was able to approach several of their customers, who areinterested in applying RFID. Here I would especially want to thank JochenSchumacher of MPDVMicrolab GmbH. He established many of the corporatecontacts and contributed to the case studies about RFID.
I would also like to thank the whole team at the Institute of InformationSystems for the great working environment they provided. Here I wouldlike to thank especially my colleague Holger Ziekow. I carried out all of thecase studies together with him and also parts of my research. Furthermore, Iwould also like to thank Hanna Krasnova with whom I conducted my researchon RFID in the automotive industry.
I had the pleasure to supervise and work with several students who didtheir graduation work around the topic of my Ph.D. thesis. Deria Saki, MertSengüner and Matthias Schmidt helped with three case studies about RFIDapplications in manufacturing. Martin Lehman worked on the identificationof functional components and technical services for RFID applications. Helio
209

Pereira helped with the analysis and a market survey about production datacollection systems. Seckin Kara’s master thesis contributed to the analy-sis of intangible aspects of RFID rollouts in manufacturing. Lorenz Weserconducted the ten interviews on which Chapter 7 is based.
I owe my loving thanks to my partner and lecturer Tobias Scheffer forhis constant encouragement, great advice, and loving support. My specialgratitude goes to my parents for inspiring and guiding me on my path tomy Ph.D. They have always been there for me and supported me wheneverpossible.
The work reported here has been supported and funded by SAP ResearchDresden, Germany.
210

Declaration –Selbständigkeitserklärung
Hiermit erkläre ich, Lenka Ivantysynova, an Eides statt, dass ich dievorliegende Dissertation selbstständig verfasst und keine anderen als dieangegebenen Quellen und Hilfsmittel benutzt habe.Sämtliche wissentlich verwendete Textausschnitte, Zitate oder Inhalte an-derer Verfasser wurden ausdrücklich als solche gekennzeichnet.
Lenka Ivantysynova
211