Reynolds Group Holdings...
31
Reynolds Group Holdings Limited 2016 Results February 15, 2017
Transcript of Reynolds Group Holdings...

Reynolds Group Holdings Limited
2016 Results
February 15, 2017

1
This presentation may contain “forward-looking statements” as that term is defined in the Private Securities Litigation Reform Act of 1995. Forward-looking statements
include, without limitation, any statement that may predict, forecast, indicate or imply future results, performance or achievements, and may contain the words “believe”,“anticipate”, “expect”, “estimate”, “intend”, “project”, “plan”, “will likely continue”, “will likely result”, or words or phrases with similar meaning. Forward-lookingstatements involve risks and uncertainties, including, without limitation, economic, competitive, governmental and technological factors outside of the control of
Reynolds Group Holdings Limited (“RGHL”, “Reynolds” or the “Company”), that may cause Reynolds’ business, strategy or actual results to differ materially from theforward-looking statements. Factors that could cause actual results to differ materially from the forward-looking statements include without limitation:
risks related to the future costs of raw materials, energy and freight;
risks related to economic downturns in our target markets;
risks related to changes in consumer lifestyle, eating habits, nutritional preferences and health-related and environmental concerns that may harm our business
and financial performance;
risks related to complying with environmental, health and safety laws or as a result of satisfying any liability or obligation imposed under such laws;
risks related to the impact of a loss of any of our key manufacturing facilities;
risks related to our exposure to environmental liabilities and potential changes in legislation or regulation;
risks related to our dependence on key management and other highly skilled personnel;
risks related to the consolidation of our customer bases, competition and pricing pressure;
risks related to exchange rate fluctuations;
risks related to dependence on the protection of our intellectual property and the development of new products;
risks related to pension plans sponsored by us and others in our control group;
risks related to strategic transactions, including completed and future acquisitions or dispositions;
risks related to our hedging activities which may result in significant losses and in period-to-period earnings volatility;
risks related to our suppliers of raw materials and any interruption in our supply of raw materials;
risks related to our substantial indebtedness and our ability to service our current and future indebtedness;
risks related to increases in interest rates which would increase the cost of servicing our debt;
risks related to restrictive covenants in certain of our outstanding notes and our other indebtedness which could adversely affect our business by limiting ouroperating and strategic flexibility; and
risks related to other factors discussed or referred to in our quarterly reports and our annual report, including in the section entitled “Risk Factors.”
Some financial information in this presentation has been rounded and, as a result, the figures shown as totals in this presentation may vary slightly from the exactarithmetic aggregation of the figures that precede them.
The attached information is not an offer to sell or a solicitation of an offer to purchase any security in the United States or elsewhere and shall not constitute an offer,solicitation or sale in any state or jurisdiction in which, or to any person to whom such an offer, solicitation or sale would be unlawful. No securities may be offered or
sold within the United States or to U.S. persons absent registration or an applicable exemption from registration requirements. Any public offering of securities to bemade in the United States will be made by means of a prospectus that may be obtained from any issuer of such securities and that will contain detailed informationabout us.
Disclaimer

2
Explanatory Note on Non-GAAP Financial Measures
In this presentation, we utilize certain non-GAAP financial measures, including EBITDA, Adjusted EBITDA and Pro Forma Adjusted EBITDA, that in each case are notrecognized under IFRS or U.S. GAAP. These measures are presented as we believe that they and similar measures are widely used in the markets in which we
operate as a means of evaluating a company’s operating performance and financing structure. They may not be comparable to other similarly titled measures of othercompanies and are not measurements under IFRS, U.S. GAAP or other generally accepted accounting principles, nor should they be considered as substitutes for theinformation contained in the financial statements included in this presentation.
EBITDA, a measure used by our management to measure operating performance, is defined as profit (loss) from continuing operations plus income tax, net financialexpenses, depreciation of property, plant and equipment and amortization of intangible assets. EBITDA is not a measure of our financial condition, liquidity or
profitability and should not be considered as a substitute for profit (loss) for the year, operating profit or any other performance measures derived in accordance withIFRS or as a substitute for cash flow from operating activities as a measure of our liquidity in accordance with IFRS.
Adjusted EBITDA is calculated as EBITDA adjusted for particular items relevant to explaining operating performance. These adjustments include significant items ofan unusual nature that cannot be attributed to ordinary business operations, including items such as non-cash pension income or expense, restructuring andredundancy costs and gains and losses in relation to the valuation of derivatives. Pro Forma Adjusted EBITDA is defined as Adjusted EBITDA as adjusted to provide
the full-period effect of implemented cost savings programs, divestments, acquisition synergies and business acquisitions to the extent not reflected in AdjustedEBITDA. Adjusted EBITDA is not a presentation made in accordance with IFRS, is not a measure of financial condition, liquidity or profitability and should not beconsidered as an alternative to profit (loss) for the period determined in accordance with IFRS or operating cash flows determined in accordance with IFRS. The
determination of Pro Forma Adjusted EBITDA contains a number of estimates and assumptions that may prove to be incorrect and differ materially from actual.
Additionally, EBITDA, Adjusted EBITDA and Pro Forma Adjusted EBITDA are not intended to be a measure of free cash flow for management’s discretionary use, as it
does not take into account certain items such as interest and principal payments on our indebtedness, working capital needs, tax payments and capital expenditures.We believe that the inclusion of EBITDA, Adjusted EBITDA and Pro Forma Adjusted EBITDA in this presentation is appropriate to provide additional information toinvestors about our operating performance to provide a measure of operating results unaffected by differences in capital structures, capital investment cycles and ages
of related assets among otherwise comparable companies. Because not all companies calculate EBITDA, Adjusted EBITDA and Pro Forma Adjusted EBITDAidentically, the presentation of these non-GAAP financial measures may not be comparable to other similarly titled measures in other companies.
Disclaimer

3
Presenters Overview
John Rooney Closures
Tom Degnan Chief Executive Officer
John Rooney Evergreen
Allen Hugli Chief Financial Officer
Lance Mitchell Reynolds Consumer ProductsMichael Graham Reynolds Consumer Products
John Rooney Graham Packaging
John McGrath Pactiv FoodserviceJohn McGrath Pactiv Foodservice
4
Reynolds Group Holdings Limited
Tom Degnan

$2,759 $2,640
Q4 2015 Q4 2016
$537$507
Q4 2015 Q4 2016
$2,019 $2,103
2015 2016
$11,178 $10,646
2015 2016
Reynolds Group Revenue and Adjusted EBITDA
Adjusted EBITDA YTD
($ in millions)
5
-5%
Revenue YTD
($ in millions)
+4%
Adjusted EBITDA QTD
($ in millions)
-4%
Revenue QTD
($ in millions)
-6%

6
Evergreen
John Rooney

$1,653 $1,580
2015 2016
$408$382
Q4 2015 Q4 2016
7
Evergreen Revenue
2015 vs. 2016
($ in millions)
Revenue decreased by 4% to $1,580 million in
2016
Decrease primarily driven by:
− Price and product mix declines primarily for
liquid packaging board and paper products
− Lower sales volume from carton packaging
and paper products
Revenue decreased by 6% to $382 million in Q4
2016
Decrease primarily driven by:
− Lower sales volume from all product lines:
paper products, carton packaging and liquid
packaging board
− Price and product mix declines for liquid
packaging board and paper products
-4%
Q4 2015 vs. Q4 2016
($ in millions)
-6%
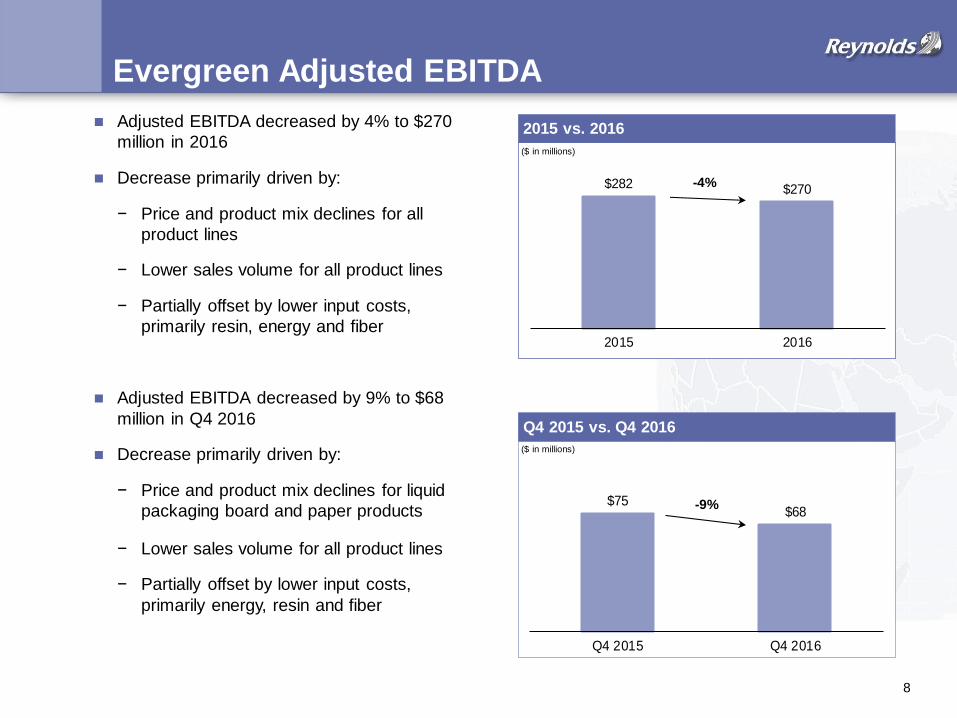
$282 $270
2015 2016
$75$68
Q4 2015 Q4 2016
8
Evergreen Adjusted EBITDA
Q4 2015 vs. Q4 2016
2015 vs. 2016
($ in millions)
($ in millions)
Adjusted EBITDA decreased by 4% to $270
million in 2016
Decrease primarily driven by:
− Price and product mix declines for all
product lines
− Lower sales volume for all product lines
− Partially offset by lower input costs,
primarily resin, energy and fiber
Adjusted EBITDA decreased by 9% to $68
million in Q4 2016
Decrease primarily driven by:
− Price and product mix declines for liquid
packaging board and paper products
− Lower sales volume for all product lines
− Partially offset by lower input costs,
primarily energy, resin and fiber
-4%
-9%

9
Closures
John Rooney

$214 $209
Q4 2015 Q4 2016
$982$928
2015 2016
10
Closures Revenue
Revenue decreased by 5% to $928 million in 2016
Decrease primarily driven by:
− Lower pricing due to the pass-through of lower resin costs to customers
− Lower sales volume in international markets, partially offset by higher sales volume in North America
− Unfavorable foreign currency impact due to the net strengthening of the dollar
Revenue decreased by 2% to $209 million in Q4 2016
Decrease primarily driven by:
− Lower sales volume in international markets, partially offset by higher sales volume in North America
− Unfavorable foreign currency impact due to the net strengthening of the dollar
− Partially offset by favorable product mix
-5%
-2%
Q4 2015 vs. Q4 2016
2015 vs. 2016
($ in millions)
($ in millions)

$27 $27
Q4 2015 Q4 2016
$147$138
2015 2016
11
Closures Adjusted EBITDA
Adjusted EBITDA decreased by 6% to $138 million in 2016
Decrease primarily driven by:
− Unfavorable foreign currency impact due
to the net strengthening of the dollar
− Lower sales volume in international
markets, partially offset by higher sales
volume in North America
− Partially offset by lower resin costs, net of
decreases passed through to customers
Adjusted EBITDA remained flat at $27 million
in Q4 2016
Favorable product mix and lower resin costs, net of decreases passed-through to customers,
Were offset by the following:
− Lower sales volume in international
markets, partially offset by higher sales
volume in North America
− Unfavorable foreign currency impact due
to the net strengthening of the dollar
Q4 2015 vs. Q4 2016
2015 vs. 2016
-6%
($ in millions)
($ in millions)

12
Graham Packaging
John Rooney

$544$506
Q4 2015 Q4 2016
Graham Packaging Revenue
Revenue decreased by 9% to $2,223 million in 2016
Decrease primarily driven by:
− Lower sales volume
− Decline in pricing primarily from lower resin
costs passed through to customers
− Unfavorable foreign currency impact due to the
net strengthening of the dollar
− Partially offset by favorable changes in product
mix
Revenue decreased by 7% to $506 million in
Q4 2016
Decrease primarily driven by:
− Lower sales volume
− Decline in pricing primarily from lower resin
costs passed through to customers
− Unfavorable foreign currency impact due to the
net strengthening of the dollar
13
Q4 2015 vs. Q4 2016
($ in millions)
-7%
2015 vs. 2016
($ in millions)
$2,447$2,223
2015 2016
-9%

$445$421
2015 2016
Graham Packaging Adjusted EBITDA
Adjusted EBITDA decreased by 5% to $421 million in 2016
Decrease primarily driven by:
− Lower sales volume
− Decline in pricing due to contractual price
movements
− Unfavorable foreign currency impact due to
the net strengthening of the dollar
− Partially offset by cost savings initiatives
Adjusted EBITDA decreased by 4% to $94
million in Q4 2016
Decrease primarily driven by:
− Lower sales volume
− Decline in pricing due to contractual price
movements
− Partially offset by cost savings initiatives
$98 $94
Q4 2015 Q4 2016
Q4 2015 vs. Q4 2016
2015 vs. 2016
($ in millions)
-4%
($ in millions)
14
-5%

15
Reynolds Consumer Products
Michael Graham
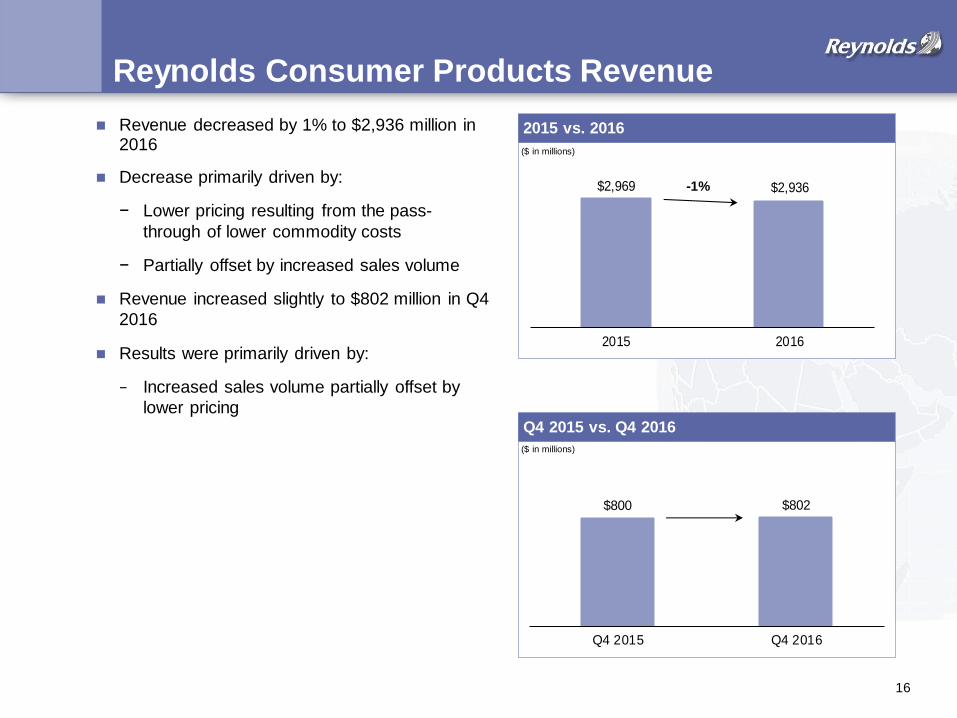
$800 $802
Q4 2015 Q4 2016
$2,969 $2,936
2015 2016
Reynolds Consumer Products Revenue
16
Revenue decreased by 1% to $2,936 million in 2016
Decrease primarily driven by:
− Lower pricing resulting from the pass-
through of lower commodity costs
− Partially offset by increased sales volume
Revenue increased slightly to $802 million in Q4
2016
Results were primarily driven by:
− Increased sales volume partially offset by
lower pricingQ4 2015 vs. Q4 2016
2015 vs. 2016
-1%
($ in millions)
($ in millions)

$581$650
2015 2016
Reynolds Consumer Products Adjusted EBITDA
Adjusted EBITDA increased by 12% to $650
million in 2016
Increase primarily driven by:
− Lower raw material costs and higher sales
volume
− Partially offset by lower pricing, higher
advertising, manufacturing and employee-
related costs
Adjusted EBITDA decreased by 5% to $171
million in Q4 2016
Decrease primarily driven by:
− Higher advertising and employee-related
costs, lower pricing and higher
manufacturing costs
− Partially offset by lower raw material costs
and higher sales volume
17
$180 $171
Q4 2015 Q4 2016
Q4 2015 vs. Q4 2016
2015 vs. 2016
+12%
-5%
($ in millions)
($ in millions)

18
Pactiv Foodservice
John McGrath

Revenue decreased by 5% to $3,748 million in 2016
Decrease primarily driven by:
− Lower pricing as a result of the pass-through
of lower resin costs to customers
− Unfavorable foreign currency impact
− Partially offset by incremental sales volume
driven by growth across the foodservice, food
packaging and retail markets
Revenue decreased by 5% to $928 million in Q4
2016
Decrease primarily driven by:
− Lower pricing as a result of the pass-through
of lower resin costs to customers
− Unfavorable foreign currency impact
− Partially offset by incremental sales volume
driven by growth across the foodservice and
retail markets
$979$928
Q4 2015 Q4 2016
Pactiv Foodservice Revenue
Q4 2015 vs. Q4 2016
2015 vs. 2016
($ in millions)
($ in millions)
19
$3,958$3,748
2015 2016
-5%
-5%
20
Q4 2015 vs. Q4 2016
2015 vs. 2016
($ in millions)
($ in millions)
$164 $159
Q4 2015 Q4 2016
$602$662
2015 2016
+10%
-3%
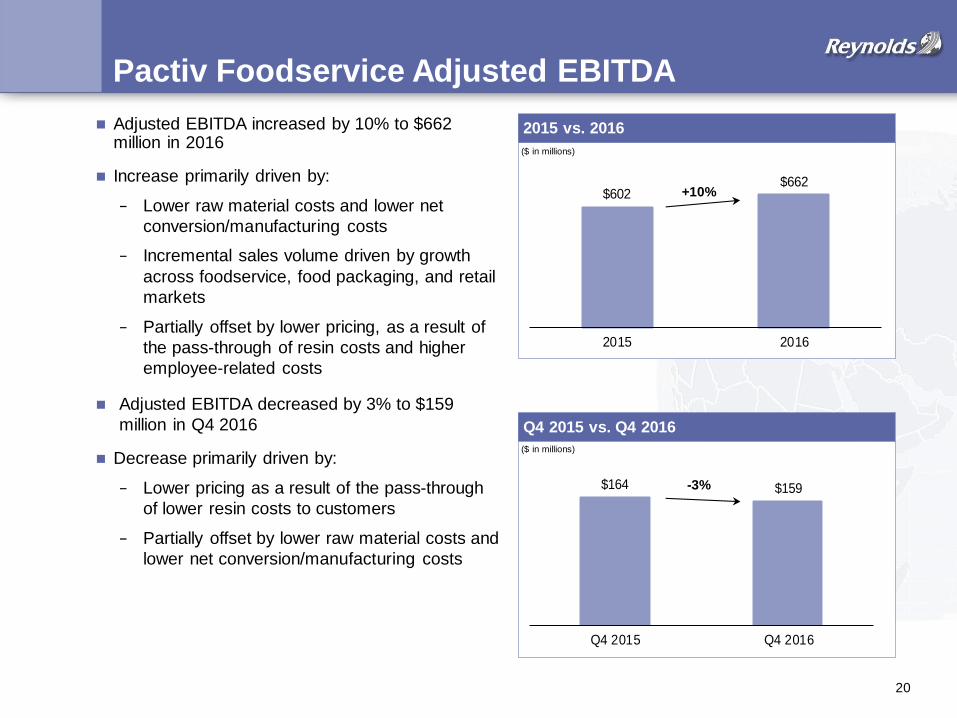
Pactiv Foodservice Adjusted EBITDA
Adjusted EBITDA increased by 10% to $662 million in 2016
Increase primarily driven by:
− Lower raw material costs and lower net
conversion/manufacturing costs
− Incremental sales volume driven by growth
across foodservice, food packaging, and retail
markets
− Partially offset by lower pricing, as a result of
the pass-through of resin costs and higher
employee-related costs
Adjusted EBITDA decreased by 3% to $159
million in Q4 2016
Decrease primarily driven by:
− Lower pricing as a result of the pass-through
of lower resin costs to customers
− Partially offset by lower raw material costs and
lower net conversion/manufacturing costs

21
Reynolds Group Financial Overview
Allen Hugli

$2,019$2,117
2015 2016PF Adjusted
(2)(2)(2)(2)$14(1)
22
$11,178$10,646
2015 2016
Reynolds Group Revenue and Adjusted EBITDA
Adjusted EBITDA
($ in millions)
Revenue
($ in millions)
(1) Annualization impact of cost savings programs.

23
Reynolds Group Capital Expenditures
Capital expenditures decreased from $381
million to $324 million in 2016
Decrease primarily driven by:
− Sale of SIG and the completion of major
projects in 2015.$352
$324
$381
2015 2016Disc. Operations
2015 vs. 2016
($ in millions)
-15%
(1) Represents the SIG segment.
(1)

24
Reynolds Refinancing Activity
The Group has undertaken a number of initiatives this year to reduce gross leverage and interest expense, as well as improve its debt maturity profile.
Through the end of Q4, gross indebtedness has decreased approximately $1.5 billion and the pro forma annual interest expense by approximately $260 million.
Since the end of the year, the initiatives have continued.
In January, the Group repriced its Term Loan for a reduction of 0.25% in the margins in effect at year end.
Today, the Group will redeem the remaining $345 million of 8.250% Senior Notes.

25
Key Investment Highlights
LeadingMarket
Positions
IconicBrands
High Barriers to
Entry
Significant Global Scale
Stable and Diversified Business
Mix
Broadest Product
Lines
Diversified Blue-Chip Global
Customer Base
World Class Manufacturing
Facilities
Ability to Manage Raw
Material Costs
Broad and Deep
Management Team
Significant Free Cash Flow Allows Rapid Deleveraging
26
Appendix

27
Reynolds Group Revenue and Adjusted EBITDA
(In $ millions)
Evergreen Closures
Reynolds
Consumer
Products
Pactiv
Foodservice
Graham
Packaging
Corporate /
Unallocated Total
Total external revenue 1,553 968 2,796 3,414 2,447 - 11,178
Total inter-segment revenue 100 14 173 544 - (831) -
Total segment revenue 1,653 982 2,969 3,958 2,447 (831) 11,178
Adjusted EBITDA 282 147 581 602 445 (38) 2,019
For the year ended ended December 31, 2015
(In $ millions)
Evergreen Closures
Reynolds
Consumer
Products
Pactiv
Foodservice
Graham
Packaging
Corporate /
Unallocated Total
Total external revenue 1,467 912 2,790 3,254 2,223 - 10,646
Total inter-segment revenue 113 16 146 494 - (769) -
Total segment revenue 1,580 928 2,936 3,748 2,223 (769) 10,646
Adjusted EBITDA 270 138 650 662 421 (38) 2,103
For the year ended December 31, 2016

28
EBITDA Reconciliation
($ in millions)
LTM 12/31/16
Total revenue 10,646
Gross profit 2,387
Expenses and other income (1,242)
Earnings before interest and tax ("EBIT") from continuing operations 1,145
Financial income 169
Financial expenses (1,042)
Profit (loss) from continuing operations 272
Income tax (expense) benefit (105)
Profit (loss) from continuing operations 167
Earnings before intrest and tax ("EBIT") from continuing operations 1,145
Depreciation and amortization from continuing operations 707
Earnings before interest, tax, depreciation and amortization ("EBITDA") from continuing operations 1,852

29
Pro Forma Adjusted EBITDA
12/31/2016
Reynolds Group EBITDA( 1) $1,852
Asset impairment charges, net of reversals 45
Non-cash change in multi-employer pension plan withdrawal liability (11)
Non-cash pension expense, net of settlement gain 124
Operational process engineering-related consultancy costs 21
Related party management fee(1)
40
Restructuring costs, net of reversals 49
Unrealized (gain) loss on derivatives (20)
Other 3
Reynolds Group Adjusted EBITDA from continuing operations $2,103
Annualization of cost savings programs 14
Reynolds Group Pro Forma Adjusted EBITDA from continuing operations $2,117
(1) Excludes $7 million of related party management fee presented in discontinued operations.
($ in millions)

30
Capitalization Summary
($ in millions)
Net Multiple
12/31/2016 of EBITDA(2)
Cash(1)
$932
Senior Secured Term Loans $3,578
Senior Secured Notes 6,232
Securitization Facility(2)
407
Other Secured Debt(3)
24
Total Secured Debt $10,241 4.2x
Senior Unsecured Notes 1,145
Total Senior Guaranteed Debt $11,386 4.7x
Pactiv Unsecured Notes 792
Total Senior Debt $12,178 5.1x
Other Debt(4)
1
Total Debt(5)
$12,179 5.1x
Pro Forma Adjusted EBITDA from continuing operations(6)
$2,117bn
(1) Excludes $3 million of cash classified as assets held for sale.
(2) Under the credit agreement, the Securitization Facility is excluded from Total Debt for the purpose of the calculation of the Total Secured Leverage Ratio. All leverage ratios in the table
above are calculated excluding the Securitization Facility.
(3) Consists of local working capital facilities and finance leases.
(4) Related party borrowings.
(5) Excludes derivative liabilities of $23 million.
(6) Adjusted for full period effect of implemented cost savings programs, acquisition synergies and business acquisitions and divestitures to the extent not reflected in Adjusted EBITDA.