Revisiting carrying capacity: Area-based indicators of...
21
Revisiting Carrying Capacity: Area-Based Indicators of Sustainability William E. Rees The University of British Columbia Conventional wisdom suggests that because of technology and trade, human carry- ing capacity is infinitely expandable and therefore virtually irrelevant to demogra- phy and development planning. By contrast, this article argues that ecological car- tying capacity remains the fundamental basis for demographic accounting. A fundamental question for ecological economics is whether remaining stocks of nat- ural capital are adequate to sustain the anticipated load of the human economy into the next century. Since mainstream (neoclassical) models are blind to ecological structure and function, they cannot even properly address this question. The present article therefore assesses the capital stocks, physical flows, and corresponding eco- systems areas required to support the economy using "ecological footprint" anal- ysis. This approach shows that most so-called "advanced" countries are running massive unaccounted ecological deficits with the rest of the planet. Since not all countries can be net importers of carrying capacity, the material standards of the wealthy cannot be extended sustainably to even the present world population using prevailing technology. In this light, sustainability may well depend on such mea- sures as greater emphasis on equity in international relationships, significant adjust- ments to prevailing terms of trade, increasing regional self-reliance, and policies to stimulate a massive increase in the material and energy efficiency of economic activity. Please address correspondenceto Dr. Rees,The University of BritishColumbia, School of Community and Regional Planning, 6333 Memorial Road, Vancouver, BC, Canada V6T IZ2. Population and Environment: A Journal of Interdisciplinary Studies Volume 17, Number 3, January 1996 1996 Human Sciences Press, Inc. 195
Transcript of Revisiting carrying capacity: Area-based indicators of...

Revisiting Carrying Capacity: Area-Based Indicators of Sustainability
William E. Rees The University of British Columbia
Conventional wisdom suggests that because of technology and trade, human carry- ing capacity is infinitely expandable and therefore virtually irrelevant to demogra- phy and development planning. By contrast, this article argues that ecological car- tying capacity remains the fundamental basis for demographic accounting. A fundamental question for ecological economics is whether remaining stocks of nat- ural capital are adequate to sustain the anticipated load of the human economy into the next century. Since mainstream (neoclassical) models are blind to ecological structure and function, they cannot even properly address this question. The present article therefore assesses the capital stocks, physical flows, and corresponding eco- systems areas required to support the economy using "ecological footprint" anal- ysis. This approach shows that most so-called "advanced" countries are running massive unaccounted ecological deficits with the rest of the planet. Since not all countries can be net importers of carrying capacity, the material standards of the wealthy cannot be extended sustainably to even the present world population using prevailing technology. In this light, sustainability may well depend on such mea- sures as greater emphasis on equity in international relationships, significant adjust- ments to prevailing terms of trade, increasing regional self-reliance, and policies to stimulate a massive increase in the material and energy efficiency of economic activity.
Please address correspondence to Dr. Rees, The University of BritishColumbia, School of Community and Regional Planning, 6333 Memorial Road, Vancouver, BC, Canada V6T IZ2.
Population and Environment: A Journal of Interdisciplinary Studies Volume 17, Number 3, January 1996 �9 1996 Human Sciences Press, Inc. 195

196
POPULATION AND ENVIRONMENT
WHY CARRYING CAPACITY?
According to Garrett Hardin (1991), "carrying capacity is the funda- mental basis for demographic accounting." On the other hand, conven- tional economists and planners generally ignore or dismiss the concept when applied to human beings. Their vision of the human economy is one in which "the factors of production are infinitely substitutable for one an- other" and in which "using any resource more intensely guarantees an increase in output" (Kirchner et al., 1985). As Daly (1986) observes, this vision assumes a world "in which carrying capacity is infinitely expand- able" (and therefore irrelevant). Clearly there is great division over the value of carrying capacity concepts in the sustainability debate.
This article sides solidly with Hardin. I start from the premise that despite our increasing technological sophistication, humankind remains in a state of "obligate dependence" on the productivity and life support ser- vices of the ecosphere (Rees, 1990). Thus, from an ecological perspective, adequate land and associated productive natural capital are fundamental to the prospects for continued civilized existence on Earth. However, at present, both the human population and average consumption are increas- ing while the total area of productive land and stocks of natural capital are fixed or in decline. These opposing trends demand a revival of carrying capacity analysis in sustainable development planning. The complete ratio- nale is as follows:
Definitions: Carrying Capacity and Human Load
An environment's carrying capacity is its maximum persistently supportable load (Catton 1986).
For purposes of game and range management, carrying capacity is usu- ally defined as the maximum population of a given species that can be sup- ported indefinitely in a defined habitat without permanently impairing the productivity of that habitat. However, because of our seeming ability to in- crease our own carrying capacity by eliminating competing species, by im- porting locally scarce resources, and through technology, this definition seems irrelevant to humans. Indeed,.trade and technology are often cited as reasons for rejecting the concept of human carrying capacity out of hand.'
'According to orthodox theory, free trade is invariably good, resulting in improved living standards and increased aggregate productivity and efficiency--increased carrying capacity-- through comparative advantage.

197
WILLIAM E. REES
This is an ironic error--shrinking carrying capacity may soon become the single most important issue confronting humanity. The reason for this becomes clearer if we define carrying capacity not as a maximum popula- tion but rather as the maximum "load" that can safely be imposed on the environment by people. Human load is a function not only of population but also of per capita consumption and the latter is increasing even more rapidly than the former due (ironically) to expanding trade and technology. As Catton (1986) observes: "The world is being required to accommodate not just more people, but effectively 'larger' people . . ." For example, in 1790 the estimated average daily energy consumption by Americans was 11,000 kcal. By 1980, this had increased almost twenty-fold to 210,000 kcal/day (Catton 1986). As a result of such trends, load pressure relative to carrying capacity is rising much faster than is implied by mere population increases.
The Ecological Argument
Despite our technological, economic, and cultural achievements, achieving sustainability requires that we understand human beings as eco- logical entities. Indeed, from a functional perspective, the relationship of humankind to the rest of the ecosphere is similar to those of millions of other species with which we share the planet. We depend for both basic needs and the production of artifacts on energy and material resources extracted from nature and all this energy/matter is eventually returned in degraded form to the ecosphere as waste. The major material difference between humans and other species is that in addition to our biological metabolism, the human enterprise is characterized by an industrial metab- olism. In ecological terms, all our toys and tools (the 'capital' of econo- mists) are "the exosomatic equivalent of organs" (Sterrer, 1993) and, like bodily organs, require continuous flows of energy and material to and from "the environment" for their production and operation. It follows that in a finite world:
Economic assessments of the human condition should be based on, or at least informed by, ecological and biophysical analyses. The appropriate ecological analyses focus on the flows of available en- ergy/matter (essergy) particularly from primary producers--green plants and other photosynthesizers--to sequential levels of consumer organ- isms in ecosystems (specifically, humans and their economies) and on the return flows of degraded energy and material (wastes) back to the ecosystem.

198
POPULATION AND ENVIRONMENT
This approach shows that humankind, through the industrial economy, has become the dominant consumer in most of the Earth's major ecosystems. We currently "appropriate" 40% of the net product of terrestrial photo- synthesis (Vitousek et al., 1986) and 25-35% of coastal shelf primary production (Pauly & Christensen, 1995), and these may be unsustainable proportions: At the same time some global waste sinks seem full to over- flowing.
A fundamental question for ecological economics, therefore, is whether the physical output of remaining species populations, ecosystems, and related biophysical processes (i.e., critical self-producing natural capi- tal stocks--see Box 1), and the waste assimilation capacity of the eco- sphere, are adequate to sustain the anticipated load of the human economy into the next century while simultaneously maintaining the general life support functions of the ecosphere. This "fundamental question" is at the heart of ecological carrying capacity but is virtually ignored by mainstream analyses.
Second Law Arguments
A related rationale for revisiting carrying capacity flows from consid- eration of the Second Law of Thermodynamics. In particular, modern for-
Box 1: On Natural Capital Natural capital refers to "a stock [of natural assets] that yields a flow of valuable goods and services into the future." For example, a forest.or a fish stock can provide a flow or harvest that is potentially sustainable year after year. The stock that produces:this flow is ~natural capital ~ and the sustainable flow is "natural:im3ome., Natural capital also providss such services as waste assimilation, erosion and flood control, and protection from ultra-violet radiation (the ozone:layer is a.form of natural capital),.These life support serviCes:::are ialsu counted as natm~al incomc. Since the flow os services f rom ecosystems ot~en requires that. ~ . ~ o n as intact systems, the structure and diversity of the system may be animportant compommt Ofnatural capital;
There are three broad classes:of natural capital: Renewable natural capital, such as living species and r162 andisc!frmaintainingusing solar.energy and photosynthesis, These forms can yield marketable:goods suc~ as w6od fibre, but may a l~ pio~de unaccounted essentialservicas When
natural capitaI ~'!~h::aS fossil fnel .~ ~.inerals, are a~ analogous to.invemorics - any use. implies iiquldatlng .~ of ~ stock. ...........
This a~cle takas Lhe position that since adequate stocks of self-produc/ng :and replenishable natural
Source: Rees (1995), liberally adapted fi'om Costanza and Daly (1992).
2Global fisheries yields have fallen since 1989.

199
WILLIAM E. REES
mulations of the second law suggest that all highly-ordered systems de- velop and grow (increase their internal order) "at the expense of increasing disorder at higher levels in the systems hierarchy" (Schneider & Kay, 1992). In other words, complex dynamic systems remain in a nonequilibrium state through the continuous dissipation of available energy and material (es- sergy) extracted from their host environments. They require a constant in- put of energy/matter to maintain their internal order in the face of sponta- neous entropic decay. Such self-organising nonequilibrium systems are therefore called "dissipative structures."
This extension of the second law is critical to human carrying capac- ity. Consider that:
�9 The human economy is one such highly-ordered, dynamic, far-from- equilibrium dissipative structure. At the same t ime . . .
�9 The economy is an open, growing, subsystem of a materially closed, nongrowing ecosphere (Daly, 1992), and is therefore dependent on the formation of essergy in the ecosphere for its growth and development. 3
This relationship implies that beyond a certain point, the continuous growth of the economy can be purchased only at the expense of increasing disorder or entropy in the ecosphere. This is the point at which consump- tion by the economy exceeds natural income and would be manifested through the continuous depletion of natural capital--reduced biodiversity, air/water/land pollution, deforestation, atmospheric change, etc. In other words, the empirical evidence suggests that the aggregate human load al- ready exceeds, and is steadily eroding, the very carrying capacity upon which the continued humane existence depends. Ultimately this poses the threat of unpredictable ecosystems restructuring (e.g., erratic climate change) leading to resource shortages, increased local strife, and the heightened threat of ecologically induced geopolitical instability.
In this light, the behavior of complex systems and the role of the econ- omy in the global thermodynamic hierarchy should be seen as fundamen- tal to sustainabi!ity, yet both concepts are alien to the dominant develop- ment-oriented institutions in the world today.
Why Economics Cannot Cope
Part of the reason for this perceptual gulf is that many of the questions raised by ecological and thermodynamic considerations are invisible to mainstream approaches. Economic analysis is based on the circular flow of exchange value (money flows) through the economy, not on physical flows
3This input to the economy from nature is the "natural income" referred to in Box 1.

200
POPULATION AND ENVIRONMENT
AVAILABLE ENERGY AND MATERIAL
FIGURE 1. The linear throughput of energy/matter.
POLLUTION AND WASTE
�9 ,.. "\ [" ...-p"
FINA~ ..~" (ESSERGY) PRODUCTS
"~'" I �9
~ DEGR~DgD ~ND .:: ~ D.IS SI, P'AT, E O /"
~ EI~IERGY/M,~TTER
EI~ TRO ~ P Y ~ Goods and Services "'Z------~_~Z~ -~1. .......... LGW
BUSINESSES HOUSEHOLDS
Labour and Investment
The linear throughput of low-entropy energy and matter (upper part of diagram) sustains the economy and drives the circular flows of exchange value (lower part of diagram), yet is invisible to conventional economic analysis.
Source: Rees (1995).
and transformations. Prevailing economic models of growth and sus- tainability thus "lack any representation of the materials, energy sources, physical structures, and time-dependent processes basic to an ecological approach" (Christensen, 1991). Thus while, the second law is arguably the ultimate governor of economic activity, standard models do not recognize the unidirectional and thermodynamically irreversible flux of available en- ergy and matter upon which the economy depends (Figure 1). Similarly, conventional approaches to conservation and sustainability focus mainly on the money values of marketable resource commodities (e.g., timber) and are insensitive to the intangible (but ultimately more valuable) nonmarket ecological functions of the natural capital that produces them (e.g., the forest ecosystem). Box 2 summarizes this problem.

201
W I L L I A M E. REES
Box 2: The Blind Spot in Conventional Analysis
�9 Maimtleam economics approaches tlm issm of adequate capital stocks through monetary analysis. However, money and prices arc cxcessi~ly abstracted from the material wealth they are supposed to rcprescm_ For example:
�9 . Whr t.here arc m a r k ~ f ~ ocol~gicatly significant ~gcxxls and: sa'vice~7.prices do not re~lect the size of the ~ - m ~ m ~ l i ~ mtm'al capital stocks, whether tl~m am critical minimal leve~ below which ~ can no long~ repleoish ttcmsclves (the real mcasme of'biophysical scarcity), the functional roles of sach stocks in rel~ant eco~ls t r o~ their ulfimsm:val~ in sustaining lif~ Meanwhile~.~
�9 �9 Many ecologimI: gcxxls andmo~ Iifc-sUplX~ sc'~ices rcmakn unpdced and tl~tn~fo~ not subj(~--'t to.market si~ or ~latcxI be.havioral change of ony kinr ('I'he ozone lay~ is a case in po~)
�9 Unfo~,rmtP~, c t m ~ t efforts to ' ~ tim externalities," "get t lc prices fight" and othcnd~ r t h r suff~r from major data gaps, the functional wam~rency of natural processes (we:d0n't ~ : t l i e y ' r e Waluable until t h e ' r e gone), and other theoretical problems that oflenl render futile attempts :to quantify; let alone price, many critical ecological goods and services (Vain:mad Bromley 1993). Inshott:~
�9 Standard monetary ~ a~ blind to ocological structm~ and function and arc tlmrdore fucapablc of ind/cating eith~ ~ologically n ~ sca~:ity or incipieot systems dcstabilicltiolL
In this light, economists' lack of concern about carrying capacity would seem to derive, in large part, from conceptual weaknesses in their analytic models. The necessary conditions for ecological sustainability can better be defined through the analysis of physical stocks and flows interpreted in light of appropriate ecological and complex systems theory.
Technology and Trade: No Boon to Carrying Capacity
As previously noted, conventional analysts often argue that trade and technology expand ecological carrying capacity. This is a misconception. Even in the best of circumstances, technological innovation does not in- crease carrying capacity per se but only the efficiency of resource use. In theory, shifting to more energy- and material-efficient technologies should enable a defined environment to support a given population at a higher material standard, or a higher population at the same material standard, thereby seeming to increase carrying capacity. However, in either case, the best we could hope for in an increasingly open global economy would be to maintain total human load constant in the vicinity of carrying capacity-- the latter would still ultimately be limiting.
In practice, we have not done even this well--the steady gains in efficiency throughout the post-war period have been accompanied by steadily increasing per capita and aggregate consumption. It seems that efficiency gains may actually work against conservation through the price and income effects of technological savings.

202
POPULATION AND ENVIRONMENT
As Saunders (1992) notes, this counterintuitive hypothesis has been the focus of considerable controversy. He tested it using neoclassical growth theory and found that energy efficiency gains might well increase aggregate energy consumption by making energy cheaper and by stimulat- ing economic growth, which further "pulls up" energy use. How might this work? If a firm saves money by switching to more energy- and material- efficient manufacturing processes, it will be able to raise wages, increase dividends, or lower prices, which can lead to increased net consumption by workers, shareholders, or consumers respectively. These behavioral re- sponses to changes in prices and income are referred to as the "rebound effect" by economists (Jaccard, 1991). Similarly, technology-induced money savings by individuals are usually redirected to alternative forms of consumption, canceling some or all of the initial potential benefit to the environment (Hannon, 1975). To the extent that such mechanisms contrib- ute to increased aggregate material consumption and accelerated stock de- pletion, they indirectly reduce carrying capacity2
More generally, however, technology can directly reduce carrying ca- pacity while creating the illusion of increasing it! We often use technology to increase the short-term energy and material flux through exploited eco- systems. This seems to enhance systems productivity while actually per- manently eroding the resource base. For example, the effectiveness of electronic fish-finding devices and high-tech catching technology has over- whelmed the reproductive capacity of fish stocks; energy-subsidized inten- sive agriculture may be more productive than low-input practices in the short term, but it also increases the rate of soil and water depletion. The net effect is to create unsustainable dependencies on enhanced material flows (the technologies involved are often based on nonrenewable resources) while reducing Iongterm carrying capacity.
The carrying capacity gains from trade are also illusory. While com- modity trade may release a local population from carrying capacity con- straints in its own home territory, this merely displaces some fraction of that population's environmental load to distant export regions. In effect, local populations import others' "surplus" carrying capacity. The resultant increase in population and resource use in import regions increases the aggregate load of humanity on the ecosphere but there is no net gain in
4Rebound effects can be avoided if adequate stock depletion taxes or marketable re- source quotas are imposed. (Such incentives should be used to stimulate conservation in the first place.) "Ecological taxation" would raise unit resource prices, effectively capturing any efficiency savings and preventing their further circulation in the economy. However, because of reduced material and energy intensity, consumer prices for goods and services would in- crease tess rapidly than resource prices (Rees, 1994a).

203
WILLIAM E. REES
carrying capacity since trade reduces the load-bearing capacity of the ex- port regions. Indeed, like technology, trade may even result in reduced global carrying capacity if access to cheap imports (e.g., food) lowers the incentive for people to conserve their own local natural capital stocks (e.g., agricultural land) and leads to the accelerated depletion of natural capital in distant export regions.
These comments are not to be taken as arguments against technology or trade per se. Rather the point is to emphasize that conventional assump- tions about both should be carefully reexamined in light of carrying capac- ity considerations and that certain conditions must be satisfied before ei- ther can contribute to ecological sustainability.
APPROPRIATED CARRYING CAPACITY AND ECOLOGICAL FOOTPRINTS
We can now redefine human carrying capacity as the maximum rates of resource harvesting and waste generation (the maximum load) that can be sustained indefinitely without progressively impairing the productivity and functional integrity of relevant ecosystems wherever the latter may be located. The size of the corresponding population would be a function of technological sophistication and mean per capita material standards (Rees, 1988). This definition reminds us that regardless of the state of technology, humankind depends on a variety of ecological goods and services pro- vided by nature and that for sustainability, these must be available in in- creasing quantities from somewhere on the planet as population and mean per capita resource consumption increase (see also Overby, 1985).
Now, as noted earlier, a fundamental question for ecological eco- nomics is whether supplies of natural capital will be adequate to meet anticipated demand into the next century. Inverting the standard carrying capacity ratio suggests a powerful way to address this critical issue. Rather than asking what population a particular region can support sustainably, the carrying capacity question becomes: How large an area of productive land is needed to sustain a defined population indefinitely, wherever on Earth that land is located? (Rees, 1992, Rees & Wackernagel, 1994; Wackernagel & Rees, 1995). Since many forms of natural income (resource and service flows) are produced by terrestrial ecosystems and associated water bodies, it should be possible to estimate the area of land/water re- quired to produce sustainably the quantity of any resource or ecological service used by a defined population at a given level of technology. The sum of such calculations for all significant categories of consumption

204
POPULATION AND ENVIRONMENT
would give us a conservative area-based estimate of the natural capital requirements for that population.
A simple mental exercise serves to illustrate the ecological reality be- hind this approach. Imagine what would happen to any modern human settlement or urban region, as defined by its political boundaries or the area of built-up land, if it were enclosed in a glass or plastic hemisphere completely closed to material flows. Clearly the city would cease to func- tion and its inhabitants would perish within a few days. The population and economy contained by the capsule would have been cut off from both vital resources and essential waste sinks leaving it to starve and suffocate at the same time. In other words, the ecosystems contained within our imagi- nary human terrarium would have insufficient carrying capacity to service the ecological load imposed by the contained population.
This mental model illustrates the simple fact is that as a result of high population densities, the enormous increase in per capita energy and mate- rial consumption made possible by (and required by) technology, and uni- versally increasing dependencies on trade, the ecological locations of hu- man settlements no longer coincide with their geographic locations. Twentieth century cities and industrial regions are dependent for survival and growth on a vast and increasingly global hinterland of ecologically productive landscapes. It seems that in purely ecological terms, modern settlements have become the human equivalent of cattle feedlots[
Cities necessarily appropriate the ecological output and life support functions of distant regions all over the world through commercial trade and the natural biogeochemical cycles of energy and material. Indeed, the an- nual flows of natural income required by any defined population can be called its "appropriated carrying capacity." Since for every material flow there must be a corresponding land/ecosystem source or sink, the total area of land/water required to sustain these flows on a continuous basis is the true "ecological footprint" of the referent population on the Earth. (See Box 3 for definitions of these and related indicators.) Calculating its ecological foot- print provides a rough measure of the natural capital requirements of any subject population for comparison with available supply.
"Footprinting" the Human Economy
The first step in calculating the ecological footprint of a study popula- tion is to estimate the per capita land area appropriated (aa) for the produc- tion of each major consumption item 'i.' We do this by dividing average annual consumption of that item ['c,' in kg/capita] by its average annual productivity or yield ['p,' in kg/ha] per hectare :

205
W I L L I A M E. REES
Box 3: A Family of Area-based Sustainability Indicators
�9 Approp r i a t ed C a r r y i n g Capac i ty - The biophysical re~,urce t]ows and waste assimilation capacity appropriated per unit time from global totals by a defined economy or population,
�9 Eco log ica l Footpr in t - The corresponding area of productive land and aquatic ecosystems required to produce tlm resunrccs used~ a n d to assimilate the wastes produced, by a defined population at a specified material standard o f living, wherever on Earth that land may be located.
�9 Personal planetoid - The per capita ecological footprint (EF~T).
�9 Fa i r E a r t h s h a r e - The amount o f ecologlcaUy productive land "available" per capita on Earth, currently about 1.5 hectares (1995). A fair scashare (ecologically productive ocean - coastal shelves upweUings and estuaries - divided by total population) isjust over .5 ha.
�9 Ecological Deficit - The level o f resouree consumption and waste discharge by a defined economy or population in excess o f locaily/regionally sustainable natmal production and assimilative capacity (also, in spatial terms, the difference between that economy/pepulation's ecological footprint and the geographic area it actually occupies)
�9 S u s t a l n a b l ] i t y G a p - A ~ of the decrease in consumption (or the increase in material and economic efficiency) required to eliminate the r deficit. (Can be applied on a regional or global scale.)
aai = ci/Pi
In practice, it is often only possible to estimate average per capita con- sumption by dividing aggregate consumption by the referent population size. Of course, many consumption items (e.g., clothing and furniture) em- body several inputs and we have found it useful to estimate the a areas appropriated by each significant input separately. Ecological footprint cal- culations are therefore both more complicated and more interesting than appears from the basic concept. So far we have estimated the land require- ments to produce 23 categories of consumer goods and services (Wacker- nagel & Rees, 1995).
We then compute the total per capita ecological footprint ('ef') by summing all the ecosystem areas appropriated by individual items in the annual shopping basket of consumption goods and services:
i ~ n
ef = ~ aai i = 1
Thus, the ecological footprint (EFp) of a study population is the per capita footprint multiplied by population size (N):
EFp =' N(ef)

206
POPULATION AND ENVIRONMENT
We account for direct fossil energy consumption and the energy content of consumption items by estimating the area of carbon-sink forest that would be required to sequester the carbon dioxide emissions associated with burning fossil fuels ([carbon emissions/capita]/[assimilation rate/hectare]), on the assumption that atmospheric stability is central to sustainability. (An alternative is to estimate the area of land required to produce the biomass energy equivalent [ethanol]of fossil energy consumption. This produces a larger energy footprint than the carbon assimilation method.)
Every effort is made to avoid double-counting in the case of multiple land uses and where there are data problems or significant uncertainty we err on the side of caution. Also, while we define the footprint comprehen- sively to include the land/water areas required for waste assimilation, our calculations to date do not account for waste emissions other than carbon dioxide. Accounting fully for this ecological function would add consider- ably to the ecosystem area appropriated by economic activity. Together these factors suggest that our ecological footprint calculations to date are more likely to be under-estimates than over-estimates.
Data from my home city, Vancouver, British Columbia, Canada, serve to illustrate application of the concept. Vancouver proper has a population (1991 ) of 472,000 and an area of 114 km 2 (11,400 hectares). However, the average Canadian requires over a hectare (ha) of crop and grazing land under current land management practices to produce his/her high meat protein diet and about .6 ha for wood and paper associated with various other consumption items. In addition, each "occupies" about .2 ha of eco- logically degraded and built-over (e.g., urban) land. Canadians are also among the world's highest fossil energy consumers with an annual carbon emission rate of 4.2 tonnes carbon (15.4 tonnes CO2) per capita (data cor- rected for carbon content of trade goods). Therefore, at a carbon sequester- ing rate of 1.8 tonnes/ha/yr an additional 2.3 ha of middle-aged North temperate forest would be required as a continuous carbon sink to assimi- late the average Canadian's carbon emissions (assuming the need to stabi- lize atmospheric carbon dioxide levels).
Considering only these data, the terrestrial "personal planetoid" of a typical Vancouverite approaches 4.2 ha, or almost three times his/her "fair Earthshare. "s On this basis, the 472,000 people living in Vancouver re- quire, conservatively, 2.0 million ha of land for their exclusive use to main- tain their current consumption patterns (assuming such land is being man- aged sustainably). However, the area of the city is only about 11,400 ha.
SAn additional .74 ha of continental shelf "seascape" is appropriated to produce the average Canadian's annual consumption of 24kg of fish.

207
WILLIAM E. REES
This means that the city population appropriates the productive output of a land area nearly i74 times larger than its political area to support its pre- sent consumer lifestyles2 While this result might seem extraordinary, other researchers have obtained similar results. Folke et al. (1994) report that the aggregate consumption of wood, paper, fiber, and food (including seafood) by the inhabitants of 29 cities in the Baltic Sea drainage basin appropriates an ecosystem area 200 times larger that the area of the cities themselves. (The latter study does not include energy land.)
Many whole developed countries have a similar overwhelming depen- dence on external ecoproductivity. The Netherlands (area: 33,920 sq km) serves to illustrate: We estimate that the people of Holland require a land area more than 14 to 15 times larger than their country to support current domestic consumption of food, forest products, and energy (Figure 2) (Rees & Wackernagel, 1994). The food footprint alone is more than 100,000 square kilometers, based on world average productivities. Indeed, Dutch government data suggest that the Netherlands appropriates 100,000 to 140,000 km 2 of agricultural land, mostly from the third world, for food production (including value-added food products produced in the Nether- lands for export) (RIVM, 1991, cited in Meadows et aL 1992). 7 This "imported" land is five to seven times the area of Holland's domestic arable land.
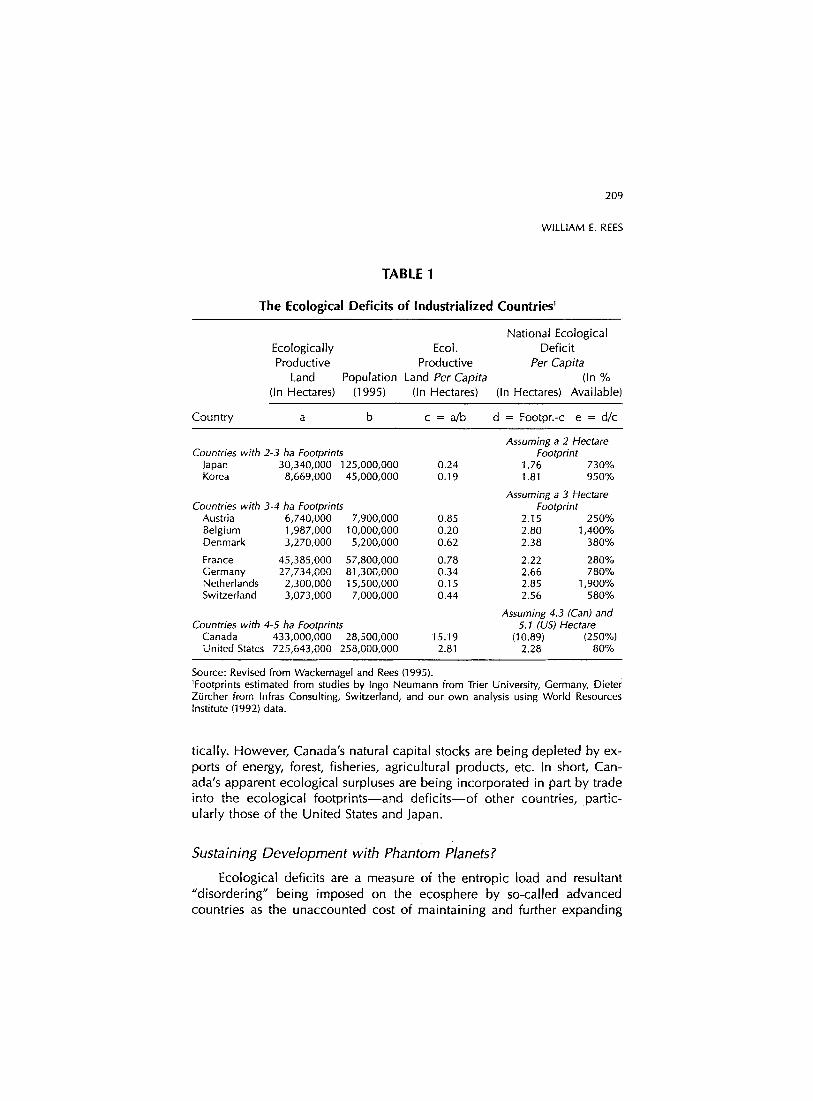
It is worth remembering that the Netherlands, like Japan, is often held up as an economic success story and an example for the developing world to follow. Despite small size, few natural resources, and relatively large populations, both Holland and Japan enjoy high material standards and positive current account and trade balances as measured in monetary terms. However, our analysis of physical flows shows that these and most other so-called "advanced" economies are running massive, unaccounted, ecological deficits with the rest of the planet (Table 1). The last two col- umns in Table 1 represent low estimates of these per capita ecological deficits in a selection of developed countries. Even if their land were twice as productive as world averages, many European countries would still run a deficit more than three times larger than domestic natural income.
These data emphasize that all the countries listed, except for Canada, are over-populated in ecological terms--they could not sustain themselves at current material standards if forced by changing circumstances to live on
~The Vancouver Regional District (metropoliiian area), with 1.6 million inhabitants and a land-base of 2930 km 2, has an ecological footprint of 6,720,000 ha, 23 times its geographic area.
7Most of the imported "food" is fodder for domestic livestock. This is a sufficient "Second Law" explanatior~ of the fact that animal manure represents one of the most pressing waste disposal problems confronting the Netherlands!

208
POPULATION ANO ENVIRONMENT
FIGURE 2. The ecological footprint of the Netherlands.
J
. J
f
~ j j v~
2 )
\
L L
)
-\
? /
/ >
S"~At U
/
F \
l:~x..A~I7 \
~ uX~.at~d ~ - \
( ~ ' - \ j "
\ .
)
\ . ~ / ~ ' ~
T ~
With an area of 33,920 square kilometers and a human population density of 440/km 2, the Netherlands depends on the ecological productivity (carrying capacity) of an area almost 15 times larger than the entire country.
Source: Rees and Wackernagel (1994),
their remaining endowments of domestic natural capital. This is hardly a good model for the rest of the world to follow.
Canada (large area, resource rich, small population) is one of the few developed countries that consumes Jess than its natural income domes-
209
WILLIAM E. REES
TABLE 1
The Ecological Deficits of Industrialized Countries'
Ecologically Ecol. Productive Productive
Land Population Land Per Capita (In Hectares) (1995) (In Hectares)
National Ecological Deficit
Per Capita (In %
(In Hectares) Available)
Country a b c = a/b d = Footpr.-c e = d/c
Countries with 2-3 ha Footprints Japan 30,340,000 125,000,000 0.24 Korea 8,669,000 45,000,000 0.19
Countries with 3-4 ha Footprints Austria 6,740,000 7,900,000 0.85 Belgium 1,987,000 10,000,000 0.20 Denmark 3,270,000 5,200,000 0.62
F rance 45,385,000 57,800,000 0.78 Germany 27,734,000 81,300,000 0.34 Netherlands 2,300,000 15,500,000 0.15 Switzerland 3,073,000 7,000,000 0.44
Countries with 4-5 ha Footprints Canada 433,000,000 28,500,000 15.19 United States 725,643,000 258,000,000 2.81
Assuming a 2 Hectare Footprint
1.76 730% 1.81 95O%
Assuming a 3 Hectare Footprint
2.15 250% 2.80 1,400% 2.38 380%
2.22 280% 2.66 780% 2.85 1,900% 2.56 580%
Assuming 4.3 (Can) and S. 1 (US) Hectare
(10.89) (250%) 2.28 80%
Source: Revised from Wackernagel and Rees (1995). 'Footprints estimated from studies by Ingo Neumann from Trier University, Germany, Dieter Z~Jrcher from Infras Consulting, Switzerland, and our own analysis using World Resources Institute (1992) data.
tically. However, Canada's natural capital stocks are being depleted by ex- ports of energy, forest, fisheries, agricultural products, etc. In short, Can- ada's apparent ecological surpluses are being incorporated in part by trade into the ecological footprints--and deficits--of other countries, partic- ularly those of the United States and Japan.
Sustaining Development with Phantom Planets?
Ecological deficits are a measure of the entropic load and resultant "disordering" being imposed on the ecosphere by so-called advanced countries as the unaccounted cost of maintaining and further expanding

210
POPULATION AND ENVIRONMENT
their wealthy consumer economies. This massive entropic imbalance in- vokes what might be called the first axiom of ecological footprint analysis: On a finite planet, not all countries or regions can be net importers of carrying capacity. This, in turn, has serious implications for global develop- ment trends.
The current objective of international development is to raise the de- veloping world to present first world material standards. To achieve this objective, the Brundtland Commission argued for "more rapid economic growth in both industrial and developing countries" and suggested that "a five to ten fold increase in world industrial output can be anticipated by the time world population stabilizes some time in the next century" (WCED, 1987).
Let us examine this prospect using ecological footprint analysis. If just the present world population of 5.8 billion people were to live at current North American ecological standards (say 4.5 ha/person), a reasonable first approximation of the total productive land requirement would be 26 bil- lion ha (assuming present technology). However, there are only just over 13 billion ha of land on Earth, of which only 8.8 billion are ecologically productive cropland, pasture, or forest (1.5 ha/person). In short, we would need an additional two planet Earths to accommodate the increased eco- logical load of people alive today. If the population were to stabilize at between 10 and 11 billion sometime in the next century, five additional Earths would be needed, all else being equal--and this just to maintain the present rate of ecological decline (Rees & Wackernagel, 1994).
While this may seem to be an astonishing result, empirical evidence suggests that five phantom planets is, in fact, a considerable underestimate (keep in mind that our footprint estimates are conservative). Global and regional-scale ecological change in the form of atmospheric change, ozone depletion, soil loss, ground water depletion, deforestation, fisheries col- lapse, loss of biodiversity, etc., is accelerating. This is direct evidence that aggregate consumption exceeds natural income in certain critical catego- ries and that the carrying capacity of this one Earth is being steadily eroded? In short, the ecological footprint of the present world population/ economy already exceeds the total productive area (or ecological space) available on Earth.
This situation is, of course, largely attributable to consumption by that wealthy quarter of the world's population who use 75% of global re-
8We should remember Liebigs "Law of the Minimum" in this context. The productivity and ultimately the survival of any complex system dependent on numerous essential inputs or sinks is limited by that single variable in least supply.

211
WILLIAM E. REES
sources. The WCED's "five- to ten-fold increase in industrial output" was deemed necessary to address this obvious inequity while accommodating a much larger population. However, since the world is already ecologically full, sustainable growth on this scale using present technology would re- quire at five to ten additional planets.
ADDRESSING THE DOUBLE-BIND OF SUSTAINABILITY
Humankind now seems to be the victim of a global "catch-22" of its own making. More material growth, at least in the poor countries, seems essential for socioeconomic sustainability, yet any global increase in mate- rial throughput is ecologically unsustainable. What does ecological foot- print analysis have to say about this double bind and how we might get out of it? One can draw several conclusions from the above analysis that ad- dress one or both sides of the dilemma:
�9 The wealthy already consume on average three times their fair share of sustainable global output. Since additional material growth in rich countries would appropriate additional carrying capacity further reduc- ing the ecological space available to poor countries, it is both ecologi- cally dangerous and morally questionable. To the extent we can create room for growth, it should be allocated to the third world.
�9 Confidence in the ability of unregulated trade and technology to over- come ecological limits on material growth cannot be justified. Indeed, it is arguable that under prevailing assumptions, expanding trade and dominant technologies are allowing humanity dangerously to overshoot long-term global carrying capacity.
�9 Trade has been a major contributor to increasing gross world product in recent years. However: a) trade is one of the mechanisms by which the rich appropriate carrying capacity and increase their own ecological footprints, and b) to the extent that trade increases total human load on the ecosphere and accelerates the depletion of natural capital, it re- duces the ecological safety net for all and brings us closer to global limits. Global terms of trade must therefore be reexamined to ensure that it is equitable, socially constructive, and confined to true ecological surpluses. At the very least, prices must reflect ecological externalities and the benefits of growth from trade should flow to those who need them most (see Rees, 1994b).
�9 On a finite planet, ecological trade is a zero-sum game there can be no net importation of carrying capacity for the world as a whole. Eco- logical footprint analysis provides a useful tool for the development of regional ecological (i.e., physical) accounts. These would assist coun-
212
POPULATION AND ENVIRONMENT
tries or (bio-)regions to compute their true ecological loads on the eco- sphere and to monitor their ecological/thermodynamic trade balances. Such accounts would also enable the world community to ensure that aggregate global flows do not exceed sustainable natural income (global carrying capacity).
�9 Urbanization, globalization, and trade all reduce the negative feedback on local populations from unsustainable land and resource manage- ment practices. (For example, trade enables us to discount the value of local natural capital and blinds us to the negative consequences of our over-consumption which often accrue in distant export regions.) This provides a further argument to shift the emphasis in development from global economic integration and inter-regional dependency toward in- tra-regional ecological balance and relative self-reliance. (If all regions were in ecological steady-state the aggregate effect would be global stability.) This position is compatible with Daly's and Goodland's (1993) recommended alternative "default position" on international trade, that we should strive "to reduce rather than increase the entanglement be- tween nations."
�9 Ecological footprint analysis supports the argument that to be sustain- able, economic growth must be much less material and energy inten- sive than at present (see, for example, Pearce, 1994). It therefore sup- ports the case for ecological tax reform in aid of resource conservation (von Weizs~icker, 1994). For example, depletion taxes and marketable quotas on natural capital inputs to the economy would: a) stimulate the search for more materially and energy efficient technologies; b) preempt any resultant cost savings, thereby preventing the economic benefits of efficiency gains from being redirected to additional or alternative forms of consumption, and; c) generate an investment fund that could be used to rehabilitate important forms of self-producing natural capital (Rees, 1994a).
�9 Ecological footprint analysis provides a measure of both individual countries' ecological deficits and the global sustainability gap (Box 3). The latter in particular is a measure of the extent to which the human economy must be dematerialized in order to fit within global carrying capacity. The present and related analyses confirm that a "factor-10" reduction in the material and energy intensity per unit of economic ser- vice, as suggested by researchers at the Wuppertal Institute in Germany (Schmidt-Bleek, 1993a;b), is a reasonable if daunting goal. 9
9"Reasonable" because a reduction in throughput of this magnitude seems necessary, "daunting" because a reduction of this magnitude through material efficiency alone seems impossible, at Jeast within in the next few decades. Sustainability may require that competi- tive individualism and the consumer lifestyle give way to cooperative mutualism and an econ- omy of sufficiency.

213
WILLIAM E. REES
CONCLUSION
Appropriated carrying capacity and ecological footprint analysis pro- vide several informative area-based indicators of sustainability. Unfor- tunately, these same indicators reveal that we are presently falling dis- tressingly short of achieving that elusive goal. Such findings do not, however, support a counsel of despair. Rather, ecological footprint analysis raises a cautionary signal, suggests a variety of concrete sustainability guidelines, and supports a broadly-based program of reforms that could redirect us in the direction we all seem to want to go. In short, to the extent that the assumptions and prescriptions of this approach are a better reflec- tion of material reality that those of mainstream models, the present anal- ysis is a good news story. The bad news is that most of the world seems committed as never before to the well-worn expansionist path.
ACKNOWLEDGMENTS
This article is updated and revised from a presentation of the same title to the International Workshop on "Evaluation Criteria for a Sustainable Economy," Institut f~r Verfahrenstechnik, Technische Universit~t Graz, Graz, Austria, 6-7 April, 1994. The author and his students' work on eco- logical footprinting is supported by a Canadian Tri-Council EcoResearch Grant to the University of British Columbia, in which he is a co-investiga- tor.
REFERENCES
Catton, W. (18 August, 1986). Carrying capacity and the limits to freedom. Paper prepared for Social Ecology Session 1, Xl World Congress of Sociology. New Delhi, India.
Christensen, P. (1991). Driving forces, increasing returns, and ecological sustainability. In R. Costanza, (Ed.). Ecological economics: The science and management of sustainability, pp. 75-87. New York: Columbia University Press.
Costanza, R. & Daly, H. (1992). Natural capital and sustainable development. Conservation Biology 1, 37-45.
Daly H. & Goodland, R. (1993). An ecological-economic assessment of deregulation of inter- national commerce under GATT. Discussiondraft. Washington, D.C.: The World Bank.
Daly, H. (1986). Comments on "population growth and economic development." Population and Development Review 12, 583-585.
Daly, H. (1992). Steady-state economics: Concepts, questions, policies. Gala 6, 333-338. Folke, C., Larsson, j., & Sweitzer, J. (1994). Renewable resource appropriation by cities. Paper
presented at "Down To Earth: Practical Applications of Ecological Economics," Third

214
POPULATION AND ENVIRONMENT
International Meeting of the International Society for Ecological Economics, San Jos~, Costa Rica (24-28 October 1994).
Hannon, B. (1975). Energy conservation and the consumer. Science 189, 95-102. Hardin, G. (1991). Paramount positions in ecological economics. In R. Costanza, (Ed.). Eco-
logical economics: The science and management of sustainabili~, pp. 47-57. New York: Columbia University Press.
Jaccard, M. (1991 ). Does the rebound effect offset the electricity savings of powersmart? Dis- cussion Paper for BC Hydro. Vancouver: BC Hydro.
Kirchner, J., Leduc, G., Goodland, R., & Drake. J. (1985). Carrying capacity, population growth, and sustainable development. In D. Mahar (Ed.). Rapid population growth and human carrying capacity: Two perspectives. Staff Working Papers #690, Population and Development Series. Washington, D.C.: The World Bank.
Meadows, D.H., Meadows, D.L., & Randers, J. (1992). Beyond the limits. Toronto: McClel- land and Stewart.
Overby, R. (1985). The urban economic environmental challenge: improvement of human welfare by building and managing urban ecosystems. Paper presented in Hong Kong to the POLMET '85 Urban Environmental Conference. Washington, DC: The World Bank.
Paul,/, D. & Christensen, V. (1995). Primary production required to sustain global fisheries. Nature 374:255-257.
Pearce, D. (1994). Sustainable consumption through economic instruments. Paper prepared for the Government of Norway Symposium on Sustainable Consumption, Oslo, 19-20 January, 1994.
Rees, W. (1992). Ecological footprints and appropriated carrying capacity: What urban eco- nomics leaves out. Environment and Urbanization 4, 2, 121-130.
Rees, W. (1988). A role for environmental assessment in achieving sustainable development. Environ. Impact Assess. Rev. 8, 273-291.
Rees, W. (1990). Sustainable development and the biosphere. Teilhard Studies Number 23. American Teilhard Association for the Study of Man, or: The Ecology of Sustainable De- velopment. The Ecologist 20(1), 18-23.
Rees, W. (1994a). Sustainability, growth, and employment: Toward an ecologically stable, economically secure, and socially satisfying future. Paper prepared for the IISD Employ- ment and Sustainable Development Project. Winnipeg, Manitoba: International Institute for Sustainable Development. (Revised version in Alternatives 21:4 [October/November 1995]).
Rees, W. (1994b). Pressing global limits: Trade as the appropriation of carrying capacity, in T. Schrecker & J. Dalgleish (Eds.). Growth, trade, and environmental values, pp. 29-56. London, Ont: Westminster Institute for Ethics and Human Values.
Rees, W. (1995). Achieving sustainability: Reform or transformation? Journal of Planning Liter- ature 9, 343-361.
Rees, W. & Wackernagel, M. (1994). Ecological footprints and appropriated carrying capacity: Measuring the natural capital requirements of the human economy. In A-M. Jansson, M. Hammer, C. Folke, and R. Costanza (Eds.). Investing in natural capital: The ecological economics approach to sustainability, pp. 362-390. Washington: Island Press.
RIVM (1991). National environmental outlook, 1990-2010. Bilthoven: Rijksinstituut voor Volksgezondheit en Milieuhygiene.
Saunders, H.D. (1992). The Khazzoom-Brookes postulate and neoclassical growth. The En- ergy Journal 13, 4, 131-148.
Schmidt-Bleek, F. (1992a). MIPS--A universal ecological measure. Fresenius Environmental Bulletin 1,306-311.
Schmidt-Bleek, F. (1992b). MIPS revisited. Fresenius Environmental Bulletin 2, 407-412. Schneider, E. & Kay, J. (1992). Life as a manifestation of the second law of thermodynamics.
Preprint from: Advances in Mathemetics and Computers in Medicine. (Waterloo, Ont.: University of Waterloo Faculty of Environmental Studies, Working Paper Series).

215
WILLIAM E. REES
Sterrer, W. (1993). Human economics: A non-human perspective. Ecological Economics 7, 183-202.
Vatn, A. & D. W. Bromley. (1993). Choices without prices without apologies. Journal of Envi- ronmental Economics and Management 26, 129-148.
Vitousek, P., Ehrlich, P., Ehrlich, A., & Matson, R (1986). Human appropriation of the products of photosynthesis. BioScience 36, 368-374.
Wackernagel, M. (1994). The ecological footprint and appropriated carrying capacity: A tool for planning toward sustainability. Unpublished PhD Thesis, University of British Colum- bia School of Community and Regional Planning. Vancouver: UBC/SCARP.
WCED. (1987). Our common future. World Commission on Environment and Development. Oxford: Oxford University Press.
von Weizsacker, Ernst U. (1994). Earth politics. London: Zed Books (see Chapter 11 : Ecologi- cal Tax Reform).
Wackernaget, M. & W. Rees. (1995). Our Ecological Footprint: Reducing Human Impact on the Earth. Gabriola Island, BC and Philadelphia, PA: New Society Publishers.