Revision - WFP Remote Access Secure Services
28
Technical Guidance Sheet No. 9 Last updated: February 2009 1 Emergency Food Security Assessments (EFSAs) Technical guidance sheet n°. 9 Qualitative data collection and analysis for food security assessments Table of Content Part A – HOW TO COLLECT AND ORGANIZE QUALITATIVE DATA................................. 2 1. What are the main methods for collecting qualitative data? ............................................ 2 2. Tools for collecting and storing qualitative data ............................................................... 5 3. Step-by-step guidance on qualitative data collection ....................................................... 8 4. How to organize qualitative data collection.................................................................... 11 Part B – HOW TO ANALYSE QUALITATIVE DATA ........................................................... 14 5. Principles of qualitative data analysis ............................................................................ 14 6. What are the main methods for analysing qualitative data? .......................................... 14 7. Tools for analysing qualitative data ............................................................................... 17 8. Step-by-step guidance on qualitative data analysis ....................................................... 20 9. How to combine qualitative and quantitative approaches .............................................. 21 10. What are the outputs of qualitative data analysis? ........................................................ 23 11. Conclusion ..................................................................................................................... 24
Transcript of Revision - WFP Remote Access Secure Services
Technical Guidance Sheet No. 9 Last updated: February 2009
1
Emergency Food Security Assessments (EFSAs) Technical guidance sheet n°. 9
Qualitative data collection and analysis
for food security assessments
Table of Content
Part A – HOW TO COLLECT AND ORGANIZE QUALITATIVE DATA.................................2
1. What are the main methods for collecting qualitative data? ............................................2
2. Tools for collecting and storing qualitative data ...............................................................5
3. Step-by-step guidance on qualitative data collection.......................................................8
4. How to organize qualitative data collection....................................................................11
Part B – HOW TO ANALYSE QUALITATIVE DATA...........................................................14
5. Principles of qualitative data analysis ............................................................................14
6. What are the main methods for analysing qualitative data? ..........................................14
7. Tools for analysing qualitative data ...............................................................................17
8. Step-by-step guidance on qualitative data analysis.......................................................20
9. How to combine qualitative and quantitative approaches..............................................21
10. What are the outputs of qualitative data analysis? ........................................................23
11. Conclusion.....................................................................................................................24
Technical Guidance Sheet No. 9 Last updated: February 2009
2
Qualitative data collection and analysis for food security assessments
This Technical Guidance Sheet (TGS) is intended to assist staff with little or no experience of collecting and analysing qualitative data for food security assessments. It does not provide guidance on food security analysis itself, but rather on how to use qualitative data for such analysis. TGS No. 8 provides a general introduction to this topic.1
Part A – HOW TO COLLECT AND ORGANIZE QUALITATIVE DATA
Part A provides methods (Section 1), tools (Section 2) and step-by-step guidance (Section 3) for collecting qualitative data. These are followed by an explanation of how to organize qualitative data collection (Section 4). 1. What are the main methods for collecting qualitative data?
Box 1. Definitions • Data: products of a data collection effort; can be quantitative or qualitative (see TGS No. 8). • Approaches: main types of data collection and analysis. Depending on the overarching objective,
they can be qualitative or quantitative. Most rapid and participatory approaches are qualitative. • Methods: how the data are collected, such as through observations, discussions, interviews or
household surveys, or analysed, such as through memoing or coding. Tools: the instruments that assist data collection or analysis, such as questionnaires and recording devices. Most of the qualitative methods described in this TGS for use in a food security assessment produce qualitative data2 (see Box 1 for definitions). There are three main qualitative collection methods: observation, discussion and interview. Each has more than one sub-type (Box 2). The use of more than one method gives greater depth to the information collected and allows for its triangulation and verification. A food security assessment team will typically use a mixture of interview and discussion techniques, combined with direct observation.
Box 2. Main qualitative methods 1. Observation: participant and direct. 2. Discussion: community discussion (CD) and focus group discussion (FGD). 3. Interview: key informant interview (KII) and household structured interview (HHSI)
1 See Technical Guidance Sheet No. 8 Introduction to Qualitative Data and Methods for Collection and Analysis in Food Security Assessments, L. Morinière, WFP Emergency Needs Assessment Service (now Food Security Analysis Service), September 2007. 2 Qualitative methods can also produce quantitative data, which are not discussed in this TGS.
Technical Guidance Sheet No. 9 Last updated: February 2009
3
1.1. Observation Observation uses hearing and seeing to comprehend and interpret the surroundings and people’s behaviours. When this information is recorded, it becomes qualitative data. Recording techniques include those used in interviews – notes, stenography, audio or video – or pictures, photos or drawings. Tools and techniques to capture data are discussed in greater detail in Section 2. Food security assessments draw a lot of insight from direct observation, but there are limitations to this method: • Physical observation is inherently intrusive, and even an assessor on a transect walk in a
cattle camp inevitably affects the behaviour of the elements he/she is observing. • There is a risk of missing important aspects, due to the dynamics of life and livelihoods. • Interpretation may differ from one observer to another. • Not everything can be observed. For example, at certain times, animals may not be
observed because they are in pastures – observers should then look out for other signs such as dung or kraals in and near the village.
• Observers may misinterpret what they see. • There are sampling problems, such as when observers give undue significance to what they
see. • Observation must be triangulated with other sources of information. Direct observation should be as unobtrusive as possible so as not to bias the data. Direct observation begins before the interview or discussion. For example, things seen on the drive into the area or while entering the village on foot provide valuable contextual data. Direct observation techniques are also useful during interactive discussions, such as with focus groups, where the dynamics, response and reactions of respondents can reveal underlying disagreement or conflict. There is a difference between structured and unstructured observation. For example, structured observation includes observing a water point for two hours at the time when most people collect water, and counting the numbers of people, containers and other elements that pass. Unstructured observation is constant, and not limited by timing or the object(s) being observed.
1.2 Discussions Discussions occur when at least two respondents are present; discussion responses are likely to be wider than those from one-on-one interviews. Discussions may be scheduled by appointment or impromptu; in either case, a set of clearly thought out questions in the form of a topical outline or semi-structured questionnaire is extremely useful. In food security assessments, most qualitative data are derived from community and focus group discussions, and can be recorded in a variety of ways.
1.2.1 Community group discussions (CDs) CDs are often held as an entry point early in the first visit to a community. A community group should ideally be a mix of men and women from various sub-groups within the community, such as residents, camp refugees and different ethnic and livelihood groups. The group can be large, but generally only about ten people are called on to contribute verbally to the discussion, with many more onlookers. Although they are called discussions, a CD is often more of an information-sharing event for building a basic understanding of the village. CDs can cover a range of topics. Breadth rather than depth is generally the goal. CDs can provide:

Technical Guidance Sheet No. 9 Last updated: February 2009
4
• data on available resources, changes that have occurred, processes taking place at the community level – impacts on land, water supplies and other natural resources, relief distributions, etc. – and relationships with institutions outside the community, such as government social services, non-governmental organizations (NGOs) and district markets;
• insights into the interactions among different groups within the community – neighbourhoods, marginalized groups, etc.
1.2.2 Focus group discussions (FGDs) A focus group is a more-or-less homogeneous set of people with at least one characteristic in common, such as living in the same neighbourhood or being of the same gender. Focus groups may also be based on less tangible traits, such as social status, the practice of a particular livelihood, or living with the same illness. Because power dynamics within a village or other type of group are divisive, useful information is most likely to surface when people from a similar social position are grouped together. Normally, separate focus groups are organized for women and men, because in many developing countries women are known to speak less freely in front of men; the same may be true of individuals from different social classes, and such dynamics must be evaluated case by case. A focus group should be small enough – typically six to eight individuals – to allow in-depth dialogue. FGDs provide: • data on the situation, and the perspectives of the sub-groups represented; • both quantitative data, such as the landholding of a typical household in the sub-group, and
qualitative data, such as the income sources of a typical household, the underlying causes of food insecurity for the sub-group, and how people in the sub-group expect their situation to evolve in the coming months;
• insight on the views of women or marginalized groups, especially if these groups are not comfortable expressing themselves at, or even attending, large community meetings.
1.3 Interviews In this TGS, the main differences between discussions and interviews are their focus –discussions are normally broader in content, and interviews more focused – and the number of respondents. Qualitative interviews typically involve a small group of people, usually no more than three. Interviews may be unstructured/exploratory, semi-structured or structured; highly structured interviews usually collect quantitative data. A combination of these approaches is often used, for example, semi-structured questioning is combined with exploratory questioning.
1.3.1 Unstructured or exploratory interviews Although the assessor may have some initial guiding questions with a clear purpose or based on core concepts (see Section 2.2), there is no formal structured collection instrument for unstructured interviews, and questions are open-ended.3 The interviewer is also free to move the conversation in any direction of interest that emerges. Consequently, unstructured interviewing is particularly useful for exploring a topic broadly. However, each interview tends to follow its own course, so it usually requires more time to analyse unstructured interview data, especially when synthesizing from several respondents. Unstructured interviews may take from 15 to 45 minutes. It is important to note that unstructured does not mean unplanned. In fact, the more unstructured the discussion, the more planning required to extract useful results from it.
1.3.2 Semi-structured interviews Semi-structured interviews use a prepared list of questions, rather than the list of topics used in unstructured interviews. The questions can be addressed in any order that flows reasonably
3 An open-ended question leaves the answer unbounded and puts no constraints on the length of the response. In a group setting, open-ended questions may lead to a discussion that is similar to brainstorming.
Technical Guidance Sheet No. 9 Last updated: February 2009
5
from the interview. (In an in-depth/structured interview, one question typically leads into the next on the list). The interviewer is free to deviate to explore additional topics, but should always return to complete the core set of questions, so that answers can be compared with those of other respondents. Predetermined questions on areas of interest aim to develop or confirm hypotheses and identify significant factors. Semi-structured interviews normally take between 30 and 60 minutes.
1.3.3 Key informant interviews (KIIs) A KII is commonly semi-structured, or sometimes in-depth, with one or two individuals representing the perspective of part of a community, such as village elders, traders, educators or health officials. These people may be selected by haphazard, convenience, snowball or purposive methods (Box 3).4 Purposive selection involves seeking out people with the knowledge required.
Box 3. Examples of key informant interviews As members of the food security assessment team drive to a sampled village, they meet a fisher returning from a day at sea. The team stops and speaks with him about pre-selected topics. This information proves very useful in guiding the village visit. A team member notes the fisher’s name, occupation and a summary of his responses. The fisher becomes the first qualitative key informant for that village. Later, in the village, a medical worker is sought out and a semi-structured tool helps guide the second KII. A KII typically lasts between 45 and 60 minutes. A semi-structured questionnaire focusing on one aspect of the assessment, such as markets, education or health, is often used.
1.3.4 Household structured interviews (HHSIs) In food security assessments, structured or in-depth interviews usually occur within households unit. Although vast amounts of qualitative information can be gathered from household interviews, the interviews themselves are generally quantitative in nature. Qualitative data are collected to probe respondents’ ideas about an issue of interest. Such in-depth interviews can take up to two hours. For this reason, they are administered to a limited number of respondents. 2. Tools for collecting and storing qualitative data This section presents a basket of qualitative tools, such as recording devices, topical outlines, discussion/interview guides and software. Some tools can be used in both qualitative and quantitative approaches. Annex 2 describes participatory techniques such as quantification, spatial constructs and temporal techniques for food security assessments.
4 See EFSA Handbook, Second Edition, Part III Section 2.7, Sampling, WFP Food Security Analysis Service, 2009.
Technical Guidance Sheet No. 9 Last updated: February 2009
6
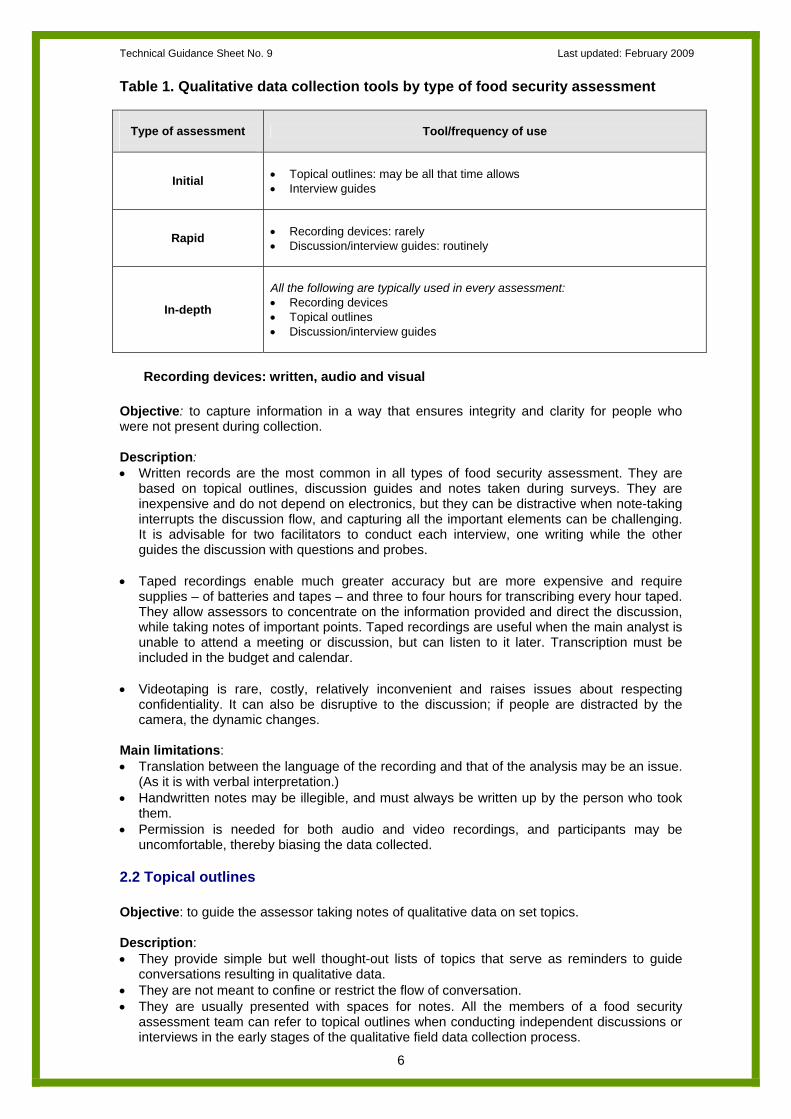
Table 1. Qualitative data collection tools by type of food security assessment
Type of assessment
Tool/frequency of use
Initial
• Topical outlines: may be all that time allows • Interview guides
Rapid
• Recording devices: rarely • Discussion/interview guides: routinely
In-depth
All the following are typically used in every assessment: • Recording devices • Topical outlines • Discussion/interview guides
Recording devices: written, audio and visual Objective: to capture information in a way that ensures integrity and clarity for people who were not present during collection. Description: • Written records are the most common in all types of food security assessment. They are
based on topical outlines, discussion guides and notes taken during surveys. They are inexpensive and do not depend on electronics, but they can be distractive when note-taking interrupts the discussion flow, and capturing all the important elements can be challenging. It is advisable for two facilitators to conduct each interview, one writing while the other guides the discussion with questions and probes.
• Taped recordings enable much greater accuracy but are more expensive and require
supplies – of batteries and tapes – and three to four hours for transcribing every hour taped. They allow assessors to concentrate on the information provided and direct the discussion, while taking notes of important points. Taped recordings are useful when the main analyst is unable to attend a meeting or discussion, but can listen to it later. Transcription must be included in the budget and calendar.
• Videotaping is rare, costly, relatively inconvenient and raises issues about respecting
confidentiality. It can also be disruptive to the discussion; if people are distracted by the camera, the dynamic changes.
Main limitations: • Translation between the language of the recording and that of the analysis may be an issue.
(As it is with verbal interpretation.) • Handwritten notes may be illegible, and must always be written up by the person who took
them. • Permission is needed for both audio and video recordings, and participants may be
uncomfortable, thereby biasing the data collected.
2.2 Topical outlines Objective: to guide the assessor taking notes of qualitative data on set topics. Description: • They provide simple but well thought-out lists of topics that serve as reminders to guide
conversations resulting in qualitative data. • They are not meant to confine or restrict the flow of conversation. • They are usually presented with spaces for notes. All the members of a food security
assessment team can refer to topical outlines when conducting independent discussions or interviews in the early stages of the qualitative field data collection process.
Technical Guidance Sheet No. 9 Last updated: February 2009
7
Topical outlines may be the only tool used in initial emergency food security assessments (EFSAs) with strict time frames. They may not be needed when assessors are experienced and have a solid idea of what information they are seeking, or when time is extremely limited. Limitations: Topical outlines are useful as memory markers but do not provide enough space for recording extensive notes. If not recorded carefully, excellent data may be lost.
2.3 Discussion/interview guides Objective: to guide discussions with carefully prepared questions and to enable structured note-taking of responses and conclusions. Description: • They include series of questions that elicit both factual information and insights into the
background, causes and likely evolution of the food security situation. • They may include open-ended questions, as well as closed questions that elicit specific
data; open-ended questions encourage respondents to provide insights into their own perceptions of the topic.
Limitations: • It is difficult to leave sufficient space on a guide for recording all the key points and
conclusions. • It is difficult to write quickly and legibly when seeking to capture all the points raised. Assessors often take notes and make observations on separate pages, which are stapled into the guide later. As it is difficult to disassociate what is actually said from the assessor’s interpretation and/or conclusions, separate spaces may be provided.
2.4 Qualitative data storage There are two main ways of storing qualitative data: 1. Assessor or analyst narratives: Master copies of the observations and notes taken during or
immediately after qualitative data collection should be stored in labelled envelopes until delivered to the data entry team. These narratives, summarizing conclusions and interpretations, are where all the information represented in the spread sheets is explained.
2. Once entered or formally transcribed, the qualitative data take electronic form, usually in MS
Word or Excel tables, but sometimes in qualitative data software. The data are stored on computer hard drives with back-up copies on flash drives or CDs.
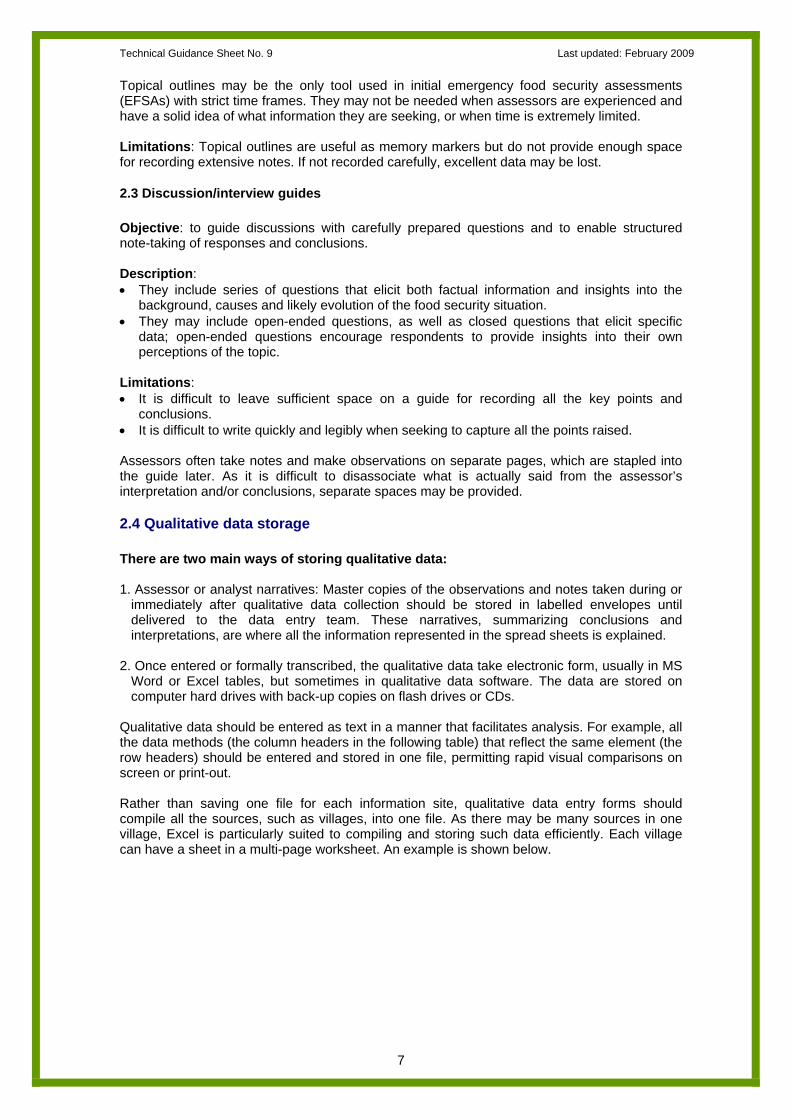
Qualitative data should be entered as text in a manner that facilitates analysis. For example, all the data methods (the column headers in the following table) that reflect the same element (the row headers) should be entered and stored in one file, permitting rapid visual comparisons on screen or print-out. Rather than saving one file for each information site, qualitative data entry forms should compile all the sources, such as villages, into one file. As there may be many sources in one village, Excel is particularly suited to compiling and storing such data efficiently. Each village can have a sheet in a multi-page worksheet. An example is shown below.
Technical Guidance Sheet No. 9 Last updated: February 2009
8
Example of qualitative data storage: triangulation matrix
3. Step-by-step guidance on qualitative data collection
Conducting observations Observation should be made at all levels, irrespective of the type of assessment: • In an initial assessment, observation is possible when security and road conditions make
reaching the site feasible. • In a rapid assessment, observation can play a more important, but not an extended, role. • In an in-depth assessment, observation can be more thorough, such as including a
structured observation module to count the number of buyers at a market during a two-hour period. It can also be better documented.
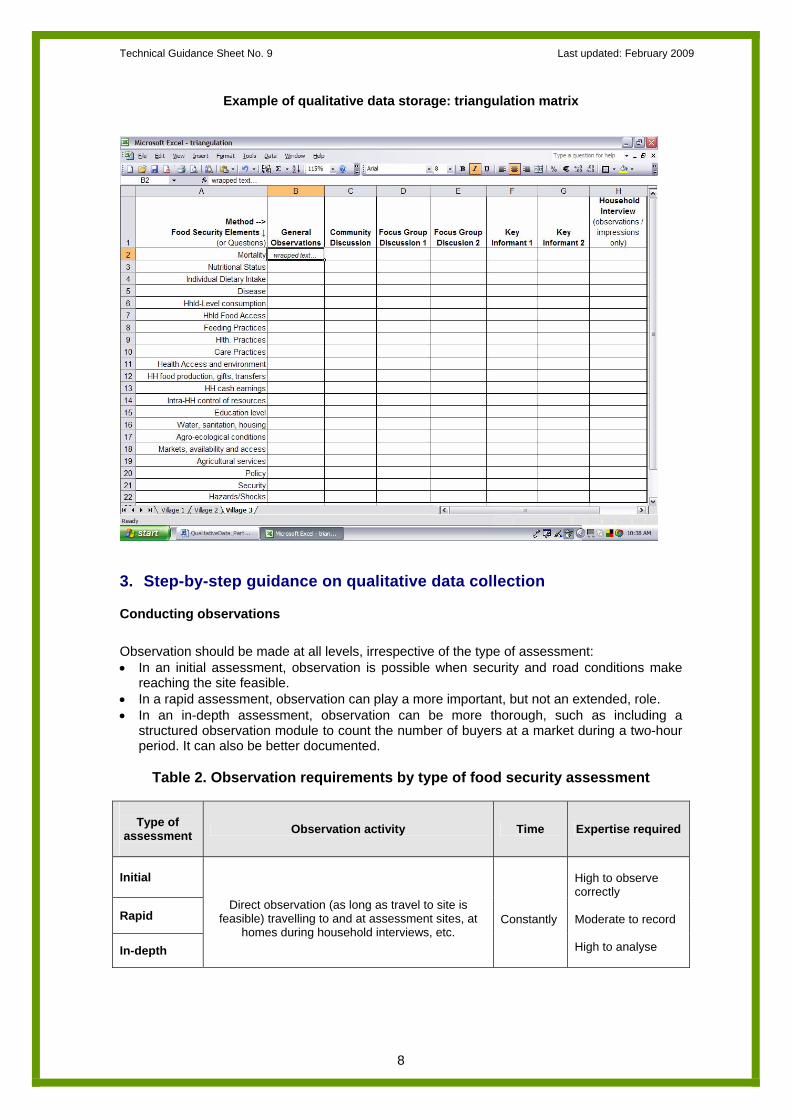
Table 2. Observation requirements by type of food security assessment
Type of
assessment
Observation activity Time Expertise required
Initial
Rapid
In-depth
Direct observation (as long as travel to site is feasible) travelling to and at assessment sites, at
homes during household interviews, etc.
Constantly
High to observe correctly Moderate to record High to analyse
Technical Guidance Sheet No. 9 Last updated: February 2009
9
Every tool or data collection instrument, such as topical outlines, discussion guides and questionnaires, should provide sufficient space for direct observation comments and notes, as these add context to the data and provide the starting point for inquiry and analysis; when they notice something, assessors should ask about it. Data collectors must be encouraged to record their own observations, making sure to differentiate these from respondents’ comments or responses. Direct observation is used for on-the-spot triangulation of the responses, perceptions and explanations given by beneficiaries (see Box 4).
Box 4. Example of direct observation during a focus group discussion
No one in a focus group exploring income-generating activities (IGAs) mentions livestock, but one of the two assessors has observed – before or during the discussion – large numbers of goats and pigs in the village. The facilitator asks the participants about these and learns that livestock is one of the most prominent IGAs.
Conducting community and focus group discussions Annexes 1 and 2 provide tips for facilitators and participatory techniques. The following guidance is merely a starting point and should be adapted to each context and assessment objective: • In an initial assessment, access, security and the need for rapid preliminary estimates of
requirements may limit the number of community or focus group discussions. • In a rapid assessment, one introductory community discussion and two focus group
discussions are normally carried out in each setting – village, camp etc. However, this depends on the type of information sought and the homogeneity of the community in terms of the variables studied.
• In an in-depth assessment, longer, more thorough and/or repeated discussions can provide the basis for developing a household survey, or can be conducted in parallel with or after a survey, to clarify specific issues
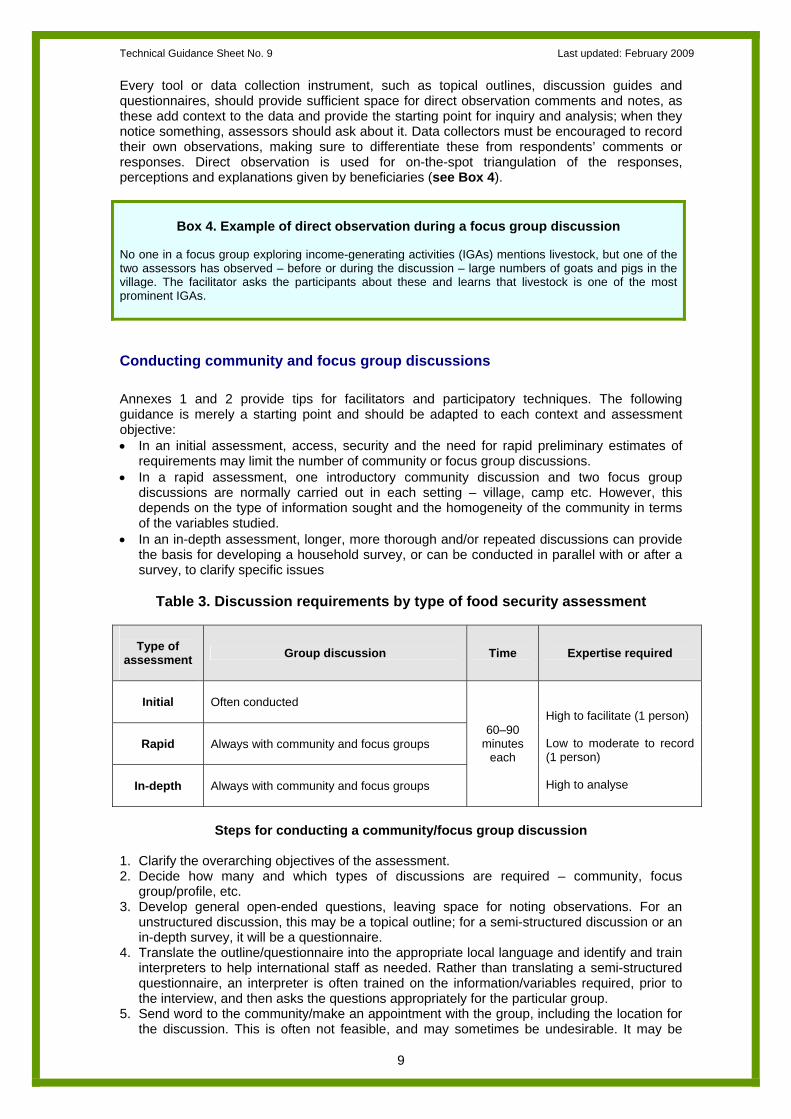
Table 3. Discussion requirements by type of food security assessment
Steps for conducting a community/focus group discussion
1. Clarify the overarching objectives of the assessment. 2. Decide how many and which types of discussions are required – community, focus
group/profile, etc. 3. Develop general open-ended questions, leaving space for noting observations. For an
unstructured discussion, this may be a topical outline; for a semi-structured discussion or an in-depth survey, it will be a questionnaire.
4. Translate the outline/questionnaire into the appropriate local language and identify and train interpreters to help international staff as needed. Rather than translating a semi-structured questionnaire, an interpreter is often trained on the information/variables required, prior to the interview, and then asks the questions appropriately for the particular group.
5. Send word to the community/make an appointment with the group, including the location for the discussion. This is often not feasible, and may sometimes be undesirable. It may be
Type of
assessment
Group discussion Time Expertise required
Initial Often conducted
Rapid Always with community and focus groups
In-depth Always with community and focus groups
60–90 minutes
each
High to facilitate (1 person) Low to moderate to record (1 person) High to analyse
Technical Guidance Sheet No. 9 Last updated: February 2009
10
better to collect information spontaneously, without recruiting respondents in advance, especially in conflict settings.
6. If recording devices are to be used, pre-test them and have supplies ready; ask permission to record.
7. Each team should work in pairs of one facilitator and one recorder/note-taker. 8. The team members should introduce themselves, the project, objectives and rules, such as
"We would appreciate hearing views from women as well as men in this community", etc. 9. Ask the questions, remaining flexible about the flow and order, and returning to questions as
needed. 10. Provide a clear description of what may happen over the next hours/days, including what is
expected from respondents. 11. To the extent possible, provide feedback to the participants; before closing the meeting,
inform them of the debriefing – who will be involved, when, etc. 12. Always invite questions from participants prior to closing the meeting. Every discussion facilitator or interviewer has an inherent bias formed by her/his culture, education and experience. Tips for minimizing this bias and other pitfalls are given in Annex 1.
3.3 Conducting key informant interviews • Initial assessment: Key informant interviews are routine. When the affected site cannot be
reached, key informant interviews can be based on telephone discussions with individuals located in a conflict or natural disaster area or with displaced or other individuals arriving from that area to a capital or nearby city.
• Rapid assessment: Unstructured and semi-structured key informant interviews are normally
carried out, together with some household interviews. • In-depth assessment: Structured household surveys are the main essential feature,
preferably preceded by good qualitative discussions and key informant interviews. A location is unlikely to be visited more than once, so it is important to gather as much information as possible from each visit.
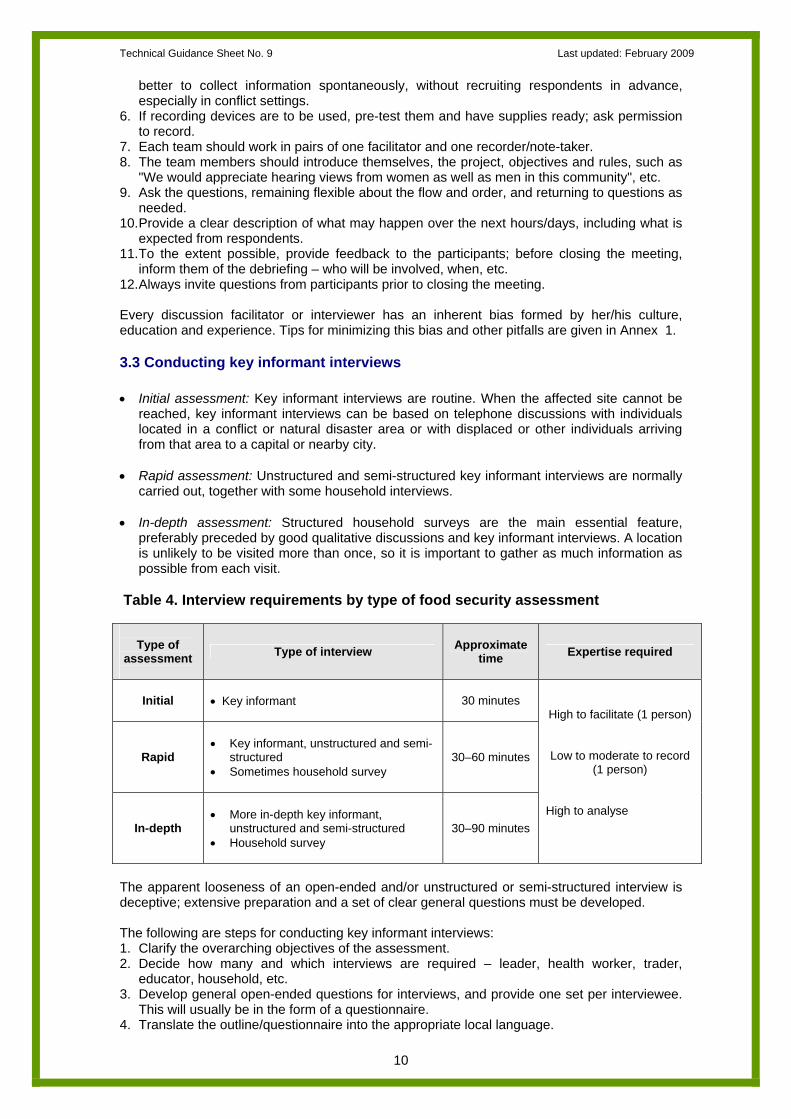
Table 4. Interview requirements by type of food security assessment
The apparent looseness of an open-ended and/or unstructured or semi-structured interview is deceptive; extensive preparation and a set of clear general questions must be developed. The following are steps for conducting key informant interviews: 1. Clarify the overarching objectives of the assessment. 2. Decide how many and which interviews are required – leader, health worker, trader,
educator, household, etc. 3. Develop general open-ended questions for interviews, and provide one set per interviewee.
This will usually be in the form of a questionnaire. 4. Translate the outline/questionnaire into the appropriate local language.
Type of
assessment
Type of interview Approximate time Expertise required
Initial • Key informant
30 minutes
Rapid
• Key informant, unstructured and semi-
structured • Sometimes household survey
30–60 minutes
In-depth
• More in-depth key informant,
unstructured and semi-structured • Household survey
30–90 minutes
High to facilitate (1 person)
Low to moderate to record (1 person)
High to analyse
Technical Guidance Sheet No. 9 Last updated: February 2009
11
5. Make appointment(s) and set location(s) for discussion(s). 6. If recording devices are used, pre-test them and have supplies ready; ask permission to
record. 7. Team members should introduce themselves, the project, objectives and rules guiding the
discussion, such as each respondent speaks in turn going clockwise round the participants. 8. Ensure confidentiality and explain how privacy will be protected, when this is an issue. 9. Tell the interviewee that his/her views are very important, and explain why. 10. Ask the questions, remaining flexible about the flow and order (except in household
interviews) and returning to questions as needed. 11. To the extent possible, provide feedback to the participants; before closing the meeting,
inform them of the debriefing – who will be involved, when, etc. 12. Always invite questions from the respondent(s) prior to interview closure. 4. How to organize qualitative data collection This section addresses administrative matters in organizing qualitative data collection for food security assessments: team composition, timing and sequencing, sampling, choice of informants, generalization, reliability and validity.
4.1 Team composition Data collection teams should be composed of individuals from various disciplines and with various expertise. They should always strive for gender balance. Teams are often asked to collect both qualitative and quantitative data, so experience in both is required. For qualitative data, as a rule of thumb, it is appropriate to arrange for: • one team of two facilitators and two note-takers, or recorders, per site, to collect data at the
site; for some activities, such as community group discussions, the team will stay together; for others, such as focus groups, key informant and in-depth interviews, the team will split into pairs of one facilitator and one note-taker;
• one overall supervisor – often the mission leader/analyst – for the whole assessment; depending on the teams’ experience, a field site supervisor may also be needed, bringing the team size to five people.
Although more teams allow for rapid data collection, in qualitative approaches it is better to use fewer teams, to ensure uniform data quality and comparability. It is recommended that no more than three or four data collection teams be used.5 When only a few teams are used, there is less variability in team members’ judgements regarding respondent selection and data collection.
4.2 Timing and sequencing One site – village, neighbourhood, etc. – per day is often the goal, especially for initial assessments. The actual number depends on the size of the team, the size of the sample, the distances between sites and whether or not a household survey is included. Rapid and in-depth assessments may allow up to two or three days per village if only a few villages are being surveyed. Prior to all survey activities, the team must be introduced to the community, and the community elders/leaders must give permission for the assessment before the team splits up. To set the stage, community group discussions may be conducted with the full assessment team present before all other methods are started. Household interviews, key informant interviews and focus group discussions can then be held simultaneously, depending on the number of enumerators in the team.
5 More teams can be used for household surveys, because the instruments rely on closed, easily interpretable questions, and the selection of respondents follows clear procedures.
Technical Guidance Sheet No. 9 Last updated: February 2009
12
Visits must be held at sensible times of the day. Look for times when people are not likely to be particularly busy.
4.3 Sampling The choice of which villages or communities to study in a food security assessment depends largely on the assessment objectives: • If the objectives centre on evaluating the needs of those affected by a shock, the selection is
likely to be purposive, for example, obtain a list of affected villages and visit them. • If this list is too long for the assessment, a sample should be drawn from the list. Sampling
criteria may include level of shock impact, such as village(s) closest to the epicentre of an earthquake; access, whether a team can reach the village; security, whether it is safe to send a team; and livelihood or ethnic groups, to ensure representation of the variety of groups affected.
• If the assessment covers entire regions or zones, and a list of villages can be established with relative confidence, a rigorous sampling frame may be feasible, sometimes even for a rapid assessment. Sampling above criteria may be applied to stratify the random sample.
Qualitative research does not usually use probability sampling, for reasons related to time, access and lack of data about the population – numbers, location etc. Qualitative data are collected more for enhanced understanding than for strict scientific validity. As opposed to random sampling, which is probability-based, in purposive non-probability sampling, a relatively small number of individuals are selected based on judgement that the combination of respondents represents the population of interest reasonably well.6 Inferences about the wider population rely on the perspectives, opinions and insights of individuals included in the sample. Generalizations and inferences therefore depend on the rigour with which the assessment team chooses the sample and triangulates its findings. Purposive sampling strategies that can be applied in qualitative data collection include: • extreme case sampling: such as seeking out and assessing extremely food-insecure
households; • criteria-based sampling of those with specific characteristics, such as fisher households; • unique case: such as those known to be unusual or non-representative cases; and • snowball or chain referral: when respondents are asked to recommend an
informant/informants they know to hold the same or a different opinion from their own, or to have the same (or different) characteristics.
Selecting sub-sites, or clusters, can be useful when the site is large in terms of population size and/or geographical area. When qualitative and quantitative approaches are combined, sites are often selected using probability sampling techniques for quantitative data collection, with non-probability approaches for qualitative data collection within sites.
4.4 Choice of key informants The choice of informants depends on the type of assessment: • Initial assessments should always strive for a field visit to the affected site, where key
informant interviews are routine. Often, however, the choice of key respondents is limited. When it is impossible to visit the site, assessors may have to rely on telephone conversations with these people, local news and travellers returning from the affected area; each additional source or respondent strengthens triangulation.
• Rapid assessments: Greater care can be given to the choice of informants. During the design phase, criteria for key informants and focus group members can be built into the data collection tools to remind enumerators. There may be sufficient time to announce in advance the team’s arrival at sampled villages, and request the presence of individuals with a particular profile. It is common to have more than one key informant and focus group per site, but this depends entirely on the assessment goals and time.
6 Although not recommended because of the very high bias it entails, individuals can also be selected on the basis of convenience.
Technical Guidance Sheet No. 9 Last updated: February 2009
13
• In-depth assessments: There is generally sufficient time to choose informants carefully and to include a wider array of respondents, thereby gaining a more complete set of qualitative data. Focus group data from a previous initial assessment can often be used to help design a quantitative questionnaire.
4.5 Generalization of findings Generalization or extrapolation of qualitative data is a highly contentious issue. Making inferences about a larger population is often not the main goal of qualitative assessments, nor is it methodologically possible owing to the purposive sampling design. Although the aim is to find a mix of respondents that reflect the situation of the studied group, confidence that data truly represent the average household or the most food-insecure may only be possible after a formal random household survey. Nevertheless, results of qualitative assessments are always generalized. The exercise would be of little use to programme planners if its conclusions were restricted to only those people with whom the team spoke. Important decisions are regularly made on the basis of qualitative and rapid assessments. As far as possible, the sample of respondents should represent the views of the target group. It is also important to recognize and report weaknesses and constraints in the assessment report and to be transparent about the conclusions that are drawn.
4.6 Reliability and validity Reliability refers to the ability to obtain the same results over time, from different sites, populations or assessors. To maximize the reliability of qualitative data collection, it is vital to use carefully designed tools that have been pre-tested, adapted and often translated for the targeted group. It is crucial to be systematic in noting observations, summarizing responses and analysing findings. To ensure that results from different groups can be compared, the use of the same facilitators/assessors is advised. Validity – internal or external – corresponds to the degree to which the data collected truly represent the situation. Threats to internal validity include the instability of field settings, people’s withholding of information for various reasons, the omission of populations from surveys, and assessors’ documentation of false or premature conclusions. Threats to external validity include the use of inappropriate tools, failure to document unique or extraordinary experiences, and relationships with those studied, which may bias results. Observations, discussions and interviews cannot adhere strictly to these requirements, but the recognition of bias can enhance the reliability and validity of the data collected.
Technical Guidance Sheet No. 9 Last updated: February 2009
14
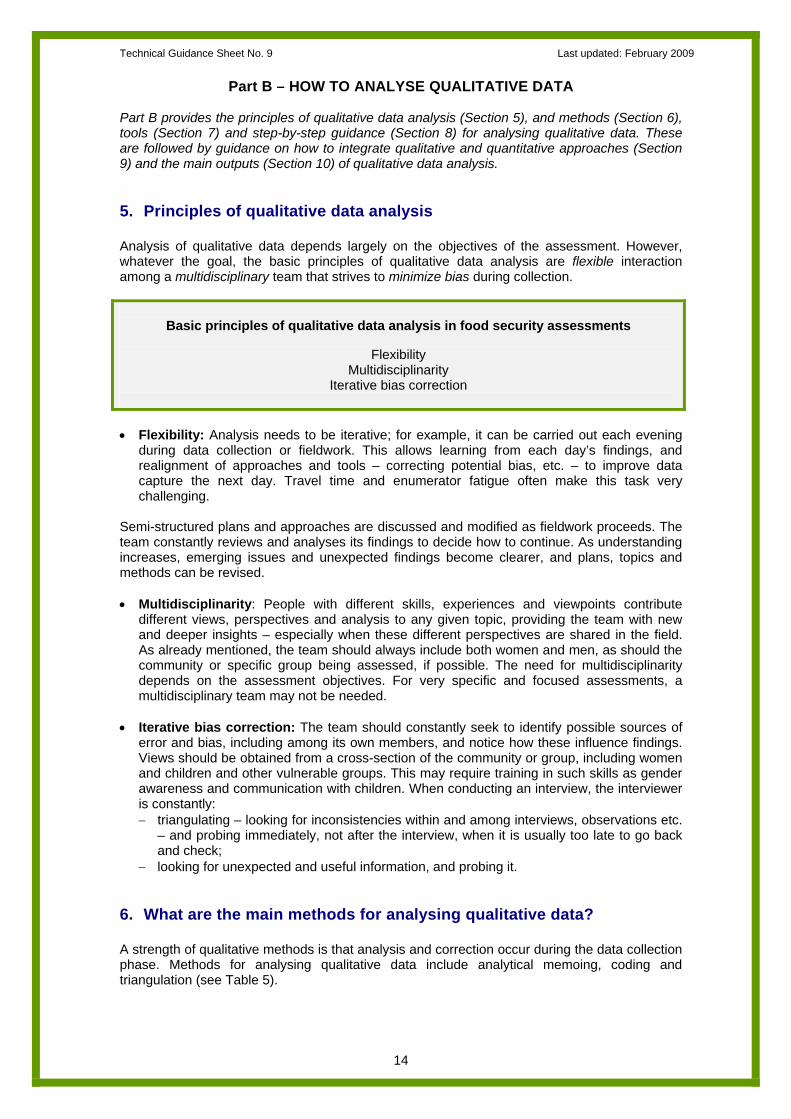
Part B – HOW TO ANALYSE QUALITATIVE DATA Part B provides the principles of qualitative data analysis (Section 5), and methods (Section 6), tools (Section 7) and step-by-step guidance (Section 8) for analysing qualitative data. These are followed by guidance on how to integrate qualitative and quantitative approaches (Section 9) and the main outputs (Section 10) of qualitative data analysis. 5. Principles of qualitative data analysis Analysis of qualitative data depends largely on the objectives of the assessment. However, whatever the goal, the basic principles of qualitative data analysis are flexible interaction among a multidisciplinary team that strives to minimize bias during collection.
Basic principles of qualitative data analysis in food security assessments
Flexibility
Multidisciplinarity Iterative bias correction
• Flexibility: Analysis needs to be iterative; for example, it can be carried out each evening
during data collection or fieldwork. This allows learning from each day’s findings, and realignment of approaches and tools – correcting potential bias, etc. – to improve data capture the next day. Travel time and enumerator fatigue often make this task very challenging.
Semi-structured plans and approaches are discussed and modified as fieldwork proceeds. The team constantly reviews and analyses its findings to decide how to continue. As understanding increases, emerging issues and unexpected findings become clearer, and plans, topics and methods can be revised.
• Multidisciplinarity: People with different skills, experiences and viewpoints contribute
different views, perspectives and analysis to any given topic, providing the team with new and deeper insights – especially when these different perspectives are shared in the field. As already mentioned, the team should always include both women and men, as should the community or specific group being assessed, if possible. The need for multidisciplinarity depends on the assessment objectives. For very specific and focused assessments, a multidisciplinary team may not be needed.
• Iterative bias correction: The team should constantly seek to identify possible sources of
error and bias, including among its own members, and notice how these influence findings. Views should be obtained from a cross-section of the community or group, including women and children and other vulnerable groups. This may require training in such skills as gender awareness and communication with children. When conducting an interview, the interviewer is constantly: − triangulating – looking for inconsistencies within and among interviews, observations etc.
– and probing immediately, not after the interview, when it is usually too late to go back and check;
− looking for unexpected and useful information, and probing it. 6. What are the main methods for analysing qualitative data? A strength of qualitative methods is that analysis and correction occur during the data collection phase. Methods for analysing qualitative data include analytical memoing, coding and triangulation (see Table 5).

Technical Guidance Sheet No. 9 Last updated: February 2009
15
Table 5. Qualitative data analytical methods by type of food security assessment
Any analytical method can be applied to any type of food security assessment, the only differences being in the amount of time required and the quantity or depth of the data processed. Qualitative data can be analysed quantitatively. For example, to find out which words or phrases respondents used most frequently in discussions, key terms can be listed and their frequency of use counted for each respondent. If respondents repeat themselves more often on one subject than another, other sources such as observations and interviews may offer explanations of why certain words or ideas are favoured.
6.1 Memoing Memoing is a simple process for recording the assessors’ analytical thoughts and ideas as they evolve throughout the study. Memos can be extensive marginal notes and comments. They are different from the notes written on discussion or interview guides to help collect and record data. Memos are what the team supervisor(s) and/or main analyst records independently, or following team discussions, each day. Early in the process, memos tend to be general, becoming increasingly focused on core issues as the assessment proceeds. Whether noted on paper or discussed during team meetings, memos detail the logical reasoning that occurs during analysis (see example in Box 5). Narratives are a result of memoing.
Box 5. Example of memoing during a rapid assessment
After a team triangulation session on the first evening of fieldwork, the team leader takes 15 minutes to note the main conclusions of the day. She writes the following three phrases, which evolve each day as details and confidence increase during subsequent sessions: • Shocks seem regular, punctual and widespread – more important than global vulnerability in the
village. • Strong market dynamics indicate that food security may be more a question of food utilization than
availability. • Observations hint at strong problems with water/sanitation infrastructure.
6.2 Coding Coding is a process for categorizing qualitative data. The primary purpose of coding is to describe and classify the information systematically, helping to make causal links and draw solid conclusions. This is different from developing codes for the answers to open-ended questions in quantitative collection. For qualitative data, at least initially, analysts conduct open coding on verbatim transcripts, considering the data in detail while developing initial categories to describe the emerging phenomena. Later, coding becomes more selective and systematic, based on a core concept. Coding can range in complexity from simple coloured sticky tags on a print out, poster board or wall, to highly technical computer-assisted coding of digital audio and video recordings.
Type of
assessment
Memoing (low expertise)
Coding (moderate expertise)
Triangulation (low expertise to use;
high expertise to facilitate)
Initial
Always Rarely Always
Rapid
Always Often Always
In-depth
Always Always Always

Technical Guidance Sheet No. 9 Last updated: February 2009
16
Analysts can use categories developed by the people who conducted the assessment, or develop their own terms based on group interpretation of the data (see Box 6). Software programmes such as Nudist, Atlas-TI or Ethnographer can assist the classification process (see Section 7).
Box 6. Example of coding during a rapid assessment
After day one in the field, the group debriefs to explore the causes of food insecurity. It produces two categories from the discussions and interviews conducted that day: food utilization and food access. After many household interviews on day two, team members agree to arrange their notes, quotes and observations according to the codes: insufficient food portions for children, no village health care and distant markets.
6.3 Triangulation Triangulation is a method of verifying various pieces of information by relating them through space (comparison with other sources) or time (comparison with other years), and providing a full picture for analysts. Triangulation involves comparing answers to similar questions, or reflections on the same concept, from different respondents – at least three – under a variety of circumstances. Comparisons are made iteratively, usually by groups, and follow a systematic approach. There are two main types of triangulation: • cross-checking for accuracy and consistency; • enriching and deepening understanding. Both of these are useful in food security assessments and should occur simultaneously within the same analytical exercise or matrix. Examples of each are provided in Box 7.
Box 7. Two examples of triangulation during a rapid assessment
During an assessment, access to and use of the local markets is found to be an important issue. Example 1: Accuracy • Three informants each say that the market is about 10 km away: they validate each other’s
information, and the assessment team can be fairly sure that the market is indeed 10 km away. • One informant says that the road is dangerous, another says it is fine, and a third has no opinion:
triangulation shows that there is insufficient information on this issue, so probing is needed – for example, by investigating the characteristics of the person who says that the road is dangerous, asking a fourth person’s view, conducting an additional key informant interview with a local trader or sending the team's driver to explore the road while the interviews are being completed.
Example 2: Depth • In a community group discussion, the assessment team learns that the nearest market, on
Wednesdays, is a 10 km trek over a steep hill: first point of view. • In a subsequent focus group discussion with male farmers, the team learns that the market is an
excellent outlet for selling livestock, but is less lucrative for agricultural produce: second point of view. • In a focus group discussion with women only, the team learns that not only is the road difficult but
also many women are exposed to physical abuse on the way to the market and refrain from travelling there: third point of view.
• In a key informant interview with an intermediary/trader who works at the market, it emerges that the quality of the produce from the studied village is not great, which partially explains the difficulty in selling it: fourth point of view.
• In a household interview, a female household head reports that she is of a small minority group that forbids travel and work on Wednesdays, which restricts the use of the market for those sharing her ethnic origin: fifth point of view.
Although no single point of view contradicts another, each contributes useful additional insight, which increases understanding of the dynamics and intricacies of vulnerable groups. When comparing and contrasting these five points of view on local market dynamics during the first evening, the team decides to add an additional focus group and some key informant interviews to solidify the story. Team members also plan to visit the market as they leave the region to add direct observation to the insights.
Technical Guidance Sheet No. 9 Last updated: February 2009
17
7. Tools for analysing qualitative data Qualitative data analysis tools include triangulation matrices and computer software. Tools to help qualitative analysis, ranging from the high-tech to the low-tech (Table 6) are presented in the following sub-sections, with step-by-step guidance for their use. Analysis of the narrative texts prepared by assessors can be added as another source (column) in triangulation matrices, or the narratives can be transcribed and analysed using software. Table 6. Qualitative data analytical tools by type of food security assessment
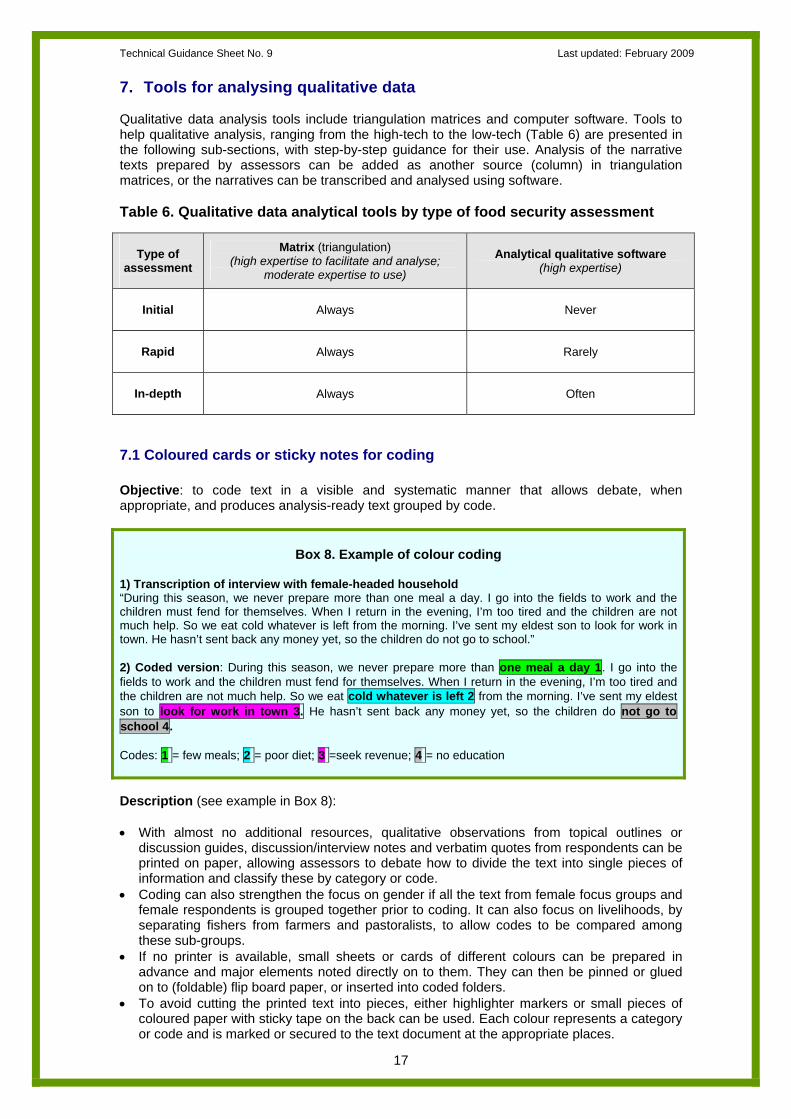
7.1 Coloured cards or sticky notes for coding Objective: to code text in a visible and systematic manner that allows debate, when appropriate, and produces analysis-ready text grouped by code.
Box 8. Example of colour coding
1) Transcription of interview with female-headed household “During this season, we never prepare more than one meal a day. I go into the fields to work and the children must fend for themselves. When I return in the evening, I’m too tired and the children are not much help. So we eat cold whatever is left from the morning. I’ve sent my eldest son to look for work in town. He hasn’t sent back any money yet, so the children do not go to school.” 2) Coded version: During this season, we never prepare more than one meal a day 1. I go into the fields to work and the children must fend for themselves. When I return in the evening, I’m too tired and the children are not much help. So we eat cold whatever is left 2 from the morning. I’ve sent my eldest son to look for work in town 3. He hasn’t sent back any money yet, so the children do not go to school 4. Codes: 1 = few meals; 2 = poor diet; 3 =seek revenue; 4 = no education Description (see example in Box 8): • With almost no additional resources, qualitative observations from topical outlines or
discussion guides, discussion/interview notes and verbatim quotes from respondents can be printed on paper, allowing assessors to debate how to divide the text into single pieces of information and classify these by category or code.
• Coding can also strengthen the focus on gender if all the text from female focus groups and female respondents is grouped together prior to coding. It can also focus on livelihoods, by separating fishers from farmers and pastoralists, to allow codes to be compared among these sub-groups.
• If no printer is available, small sheets or cards of different colours can be prepared in advance and major elements noted directly on to them. They can then be pinned or glued on to (foldable) flip board paper, or inserted into coded folders.
• To avoid cutting the printed text into pieces, either highlighter markers or small pieces of coloured paper with sticky tape on the back can be used. Each colour represents a category or code and is marked or secured to the text document at the appropriate places.
Type of
assessment
Matrix (triangulation) (high expertise to facilitate and analyse;
moderate expertise to use)
Analytical qualitative software (high expertise)
Initial
Always Never
Rapid
Always Rarely
In-depth
Always Often
Technical Guidance Sheet No. 9 Last updated: February 2009
18
• Group analysis is useful; if no computer is available during fieldwork, ways need to be found for making the unfolding analysis visible to a group of people in a format that is mobile and can withstand local travelling conditions.
• Coding must be done systematically on all notes, transcripts, etc. from all the sources of qualitative data, including observations, until trends and patterns can be detected. Trends may be slow to emerge until several sources or sites have been coded.
• A note-taker should develop a coding guide that describes the code names and/or colours used, their meanings, and when each should be used. This guide is a flexible document, which will be enhanced at almost every analysis session.
• Coding can take 20 to 40 minutes per full page of text, depending on how many people are participating in the analysis, their experience and the complexity of the contents.
Limitations: there are few limitations to colour-coding, but it can entail significant efforts when there are many data sources.
7.2 Computer-driven software for coding Objective: to apply codes to text systematically, to produce analysis-ready text identifiable by code. Description: • Software may demand an investment of cost, training and learning that exceeds the
objectives of the food security assessment, but there are a wide variety of automated methods for systematically coding or indexing text that, once mastered, greatly contribute to the rigour of small datasets and improved the analysis of huge datasets.
• Qualitative software does not produce codes for the analysts or assign codes to particular phrases, but it does make coding more systematic, through the use of term searches, and easier to store. It can also produce statistics, such as the frequencies of codes per livelihood or gender of source (see example in Box 9).
• Many software packages are available for use in qualitative data analysis. All require electronic text files. If digital text files are not available, there is no reason for using computer-driven software in qualitative analysis.
• The most common applications include Nudist, Atlas TI and Ethnography.7 Although these can be used in rapid assessments, they may be more useful for in-depth assessments, when there is more time for data collection and analysis.
• Once the software has been mastered, computer-based coding takes roughly as long as paper-based coding – 20 to 40 minutes per page. Once the coding guide has been developed and finalized, however, coding of large qualitative datasets will be significantly quicker using software, because of the ability to search for and jump to specific terms, respondent profiles, etc.
Box 9. Example of software for qualitative data analysis Key words in context (KWIC) analysis is a computer software analysis of text data used in content/secondary data analysis: • A computer program scans the text and indexes all key words. • A key word is any term in the text that is not included in a self-made exception dictionary.
Typically, the analyst sets up an exception dictionary that includes all non-essential words such as is, and, and of.
• All key words are alphabetized and listed with the text that precedes and follows them, so the assessor can see the word in its context in the text. For example, in an analysis of interview text, all uses of the terms hunger, water or market are identified, along with the contexts in which they are used.
7 All these are commercial software products available over the Internet.
Technical Guidance Sheet No. 9 Last updated: February 2009
19
Limitations: • Computer-driven coding requires electronic text files, electricity, hardware, software and
expertise. • The analyst still has to develop and apply codes. • Care is needed when interpreting the results of automated content analyses; the computer
program cannot determine what an individual means by a term or phrase, making it relatively easy to misinterpret a result.
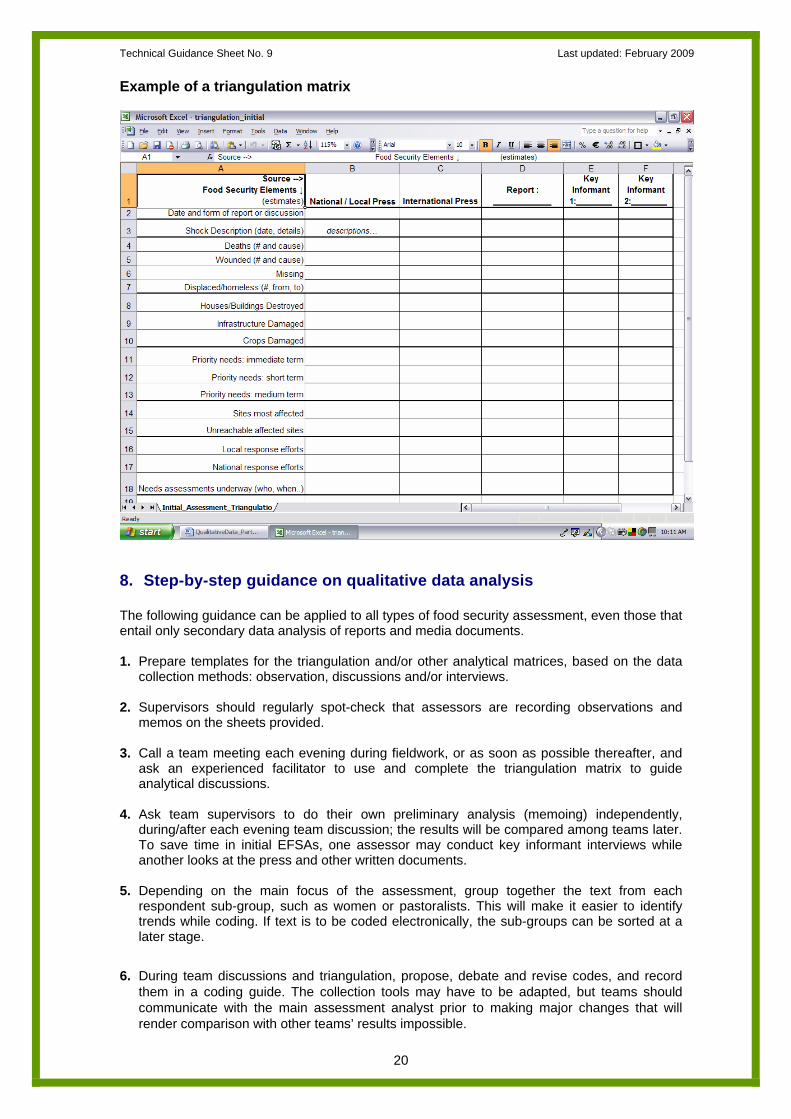
7.3 Triangulation matrices Objective: to summarize and compare qualitative data across sources and themes, to produce a table that facilitates discussion and analysis. Description (see following example): • Matrices facilitate triangulation by enabling easy comparison of many points of view. The
column titles across the top of a triangulation matrix are the methods or sources chosen for data collection: community group discussions, key informant/trader interviews, Interviews of most vulnerable households, etc. The row titles are the themes or specific questions addressed. Key insights are recorded in each cell during evening team debriefings.
• It is not necessary to record quantitative information, or the details of themes noted in
discussion or interview guides. Triangulation matrices are for comparing the perceptions and attitudes that have emerged from the various methods.
• The more specific the row title, the more useful the comparison becomes. For example, the
row title "food access" will not enable meaningful comparisons because elements as different as income, distance to markets or local storage capacity could all be addressed within the same row.
• When there is little time for data collection, few resources or an urgent need for results, as in
an initial assessment, use of a triangulation matrix is essential because it forces the analyst to compare results systematically across rows and columns, thus expediting conclusions.
Limitations: • Triangulation matrices are difficult to manage without a computer. • It is difficult to limit each theme to one printable page.
Technical Guidance Sheet No. 9 Last updated: February 2009
20
Example of a triangulation matrix
8. Step-by-step guidance on qualitative data analysis The following guidance can be applied to all types of food security assessment, even those that entail only secondary data analysis of reports and media documents. 1. Prepare templates for the triangulation and/or other analytical matrices, based on the data
collection methods: observation, discussions and/or interviews. 2. Supervisors should regularly spot-check that assessors are recording observations and
memos on the sheets provided. 3. Call a team meeting each evening during fieldwork, or as soon as possible thereafter, and
ask an experienced facilitator to use and complete the triangulation matrix to guide analytical discussions.
4. Ask team supervisors to do their own preliminary analysis (memoing) independently,
during/after each evening team discussion; the results will be compared among teams later. To save time in initial EFSAs, one assessor may conduct key informant interviews while another looks at the press and other written documents.
5. Depending on the main focus of the assessment, group together the text from each
respondent sub-group, such as women or pastoralists. This will make it easier to identify trends while coding. If text is to be coded electronically, the sub-groups can be sorted at a later stage.
6. During team discussions and triangulation, propose, debate and revise codes, and record them in a coding guide. The collection tools may have to be adapted, but teams should communicate with the main assessment analyst prior to making major changes that will render comparison with other teams’ results impossible.

Technical Guidance Sheet No. 9 Last updated: February 2009
21
7. When transcription is part of the assessment, it should be completed simultaneously to the quantitative data entry. It is useful to have transcribers/data entry agents close to the field, or in constant communication with field agents, for quality assurance.
8. Even if no taping and transcription were planned, qualitative data can be entered alongside quantitative data. The notes taken during focus group discussions are typed into cells of an MS Excel worksheet, clearly showing the gender of the respondent, when applicable, and the site.
9. Organized by assessment objectives, summarize the codes for site, gender, livelihood or other criteria, as appropriate. For example: number of times female sources cited water source contaminated: 11; male sources: 3.
10. Once preliminary statistics and transcriptions/coding results are available for review, hold an analysis meeting for one to three days, with all team supervisors. This engages the supervisors who led the fieldwork in coding and drawing conclusions, and is especially important when the main assessment analyst has not visited all the sites studied. The process of categorizing, coding, triangulating and repeating is the same for both low-tech and high-tech coding techniques.
11. Draw major conclusions for each theme assessed, keeping in mind the assessment’s specific objectives. Distinguish results that are useful for the situation analysis from those relevant to the forecast and response analyses. 8
12. Decide whether to weave the qualitative conclusions throughout the quantitative report, or to produce a stand-alone qualitative document. Direct quotations and anecdotes are important for summarizing what was said or concluded, but make sure that they are truly representative of the target population.
9. How to combine qualitative and quantitative approaches Qualitative and quantitative approaches can be combined in different ways: 1. integration; 2. cross-checking – using one to check or guide the other, confirming, refuting, enriching and
explaining. The exact combination of qualitative and quantitative approaches in a food security assessment depends on the specific objectives of the assessment and the time, skills and resources available. Broadly speaking: • integrating the two approaches can enable better measurement of food insecurity; • cross-checking can result in better analysis. Eventually, the findings from the two approaches should be merged into one set of recommendations to guide decisions and action.
9.1 Integration It is best to integrate quantitative and qualitative approaches during the design phase of an assessment, by reviewing the assessment aims, delineating the questions that need to be answered, and reviewing them, one by one, to decide which approach is most appropriate for each. For example, it is easier to use qualitative approaches to draw up an inventory of shocks or hazards affecting a community’s food security, while household-level diet diversity is best collected from quantitative household surveys.
8 See EFSA Handbook, Second Edition, Part IV Section 3, Conducting a situation analysis, Part IV Section 4, Conducting a forecast analysis, and Part IV Section 5, Conducting a response analysis, WFP Food Security Analysis Service, 2009.
Technical Guidance Sheet No. 9 Last updated: February 2009
22
Some questions need numerical answers, but qualitative and/or participatory approaches may be the best way of deriving these numbers. Some questions cannot be answered by numbers, and require focus group discussions to produce insightful answers. Qualitative analysis does not merely enhance a quantitative assessment. Entire emergency assessments are often based on qualitative information, which can produce results that are as robust as those from quantitative analysis. Steps to ensure integrated qualitative and quantitative data collection: 1. Review the objectives and the questions to be answered by the assessment. 2. For each question, decide whether a quantitative or qualitative approach is preferable and
feasible. 3. Draw up a table of data to be sought from quantitative data collection methods and tools,
and make a bulleted list of explanations and outputs to be sought from qualitative data. 4. Determine the best method for collecting each piece of qualitative data: observation,
discussion or interview. 5. Group the questions by the method chosen; for key informant interviews, sub-divide by
theme. All the data collected are analysed together to the extent possible. Quantitative data are explained and enriched by a thorough review of the qualitative data, which are in turn strengthened by the quantitative data. It is often useful to complete a preliminary quantitative analysis prior to the final qualitative analysis, so that effort can be directed to extracting explanations for the issues emerging from quantitative data. Qualitative analysis is also useful for directing quantitative data collection, by identifying what quantitative information to look for during the assessment. Steps to ensure integrated qualitative and quantitative data analysis: 1. Start with preliminary descriptive statistics from household survey quantitative data. 2. Identify and list issues such as malnutrition rates or food supplies in the market that are, or
were, surprising or hard to understand at first glance. These may include topics that team members repeatedly debated during fieldwork.
3. Review the qualitative data with particular attention to memos and codes that may clarify the quantitative data or points of contention.
4. In the report, include qualitative explanations for each quantitative conclusion. 5. Insert qualitative case studies and/or text boxes and quotes to enhance understanding.
9.2 Cross-checking While triangulation compares findings across sources, cross-checking is the systematic comparison of qualitative with quantitative findings. Cross-checking involves: • examining: using quantitative approaches to test the hypotheses derived from qualitative
approaches; • explaining: using qualitative approaches to explain unanticipated results from quantitative
data; • confirming or refuting: using qualitative approaches to verify or challenge quantitative
results; • enriching: using qualitative approaches to identify issues or obtain information on variables
that did not emerge during quantitative surveys.
Technical Guidance Sheet No. 9 Last updated: February 2009
23
10. What are the outputs of qualitative data analysis?
Qualitative data analysis outputs
1) Interim outputs: Situation (descriptive and exploratory) analysis, forecast and response analyses.
2) Final output: Food security assessment report, with quantitative data integrated or as a stand-alone document. Qualitative data analysis feeds the situation analysis, which includes descriptive and exploratory (causal) analysis of the data, and the forecast and response analyses, which assess risk scenarios and response options and make recommendations for appropriate interventions.
10.1 Outputs for situation analysis During situation analysis, the results of the qualitative data collection are used to describe people’s experiences, perceptions and practices. As well as providing the basic information needed to satisfy the assessment objectives – who is at risk, how many, etc. – descriptive analysis based on qualitative data identifies links, patterns and common themes, and arranges the factual information.
10.1.1 Case studies Case studies are analyses of a specific household type or context, such as a village or zone, and may be a product of situation analysis. There is no single way of conducting a case study, and a combination of methods, such as unstructured interviewing together with direct observation, can be used.
10.1.2 Content/secondary data analysis Secondary data analysis can involve literature reviews and analysis of quantitative data obtained from other sources. When possible, literature reviews should precede the assessment fieldwork. Literature reviews are qualitative in nature, even when highly structured, such as when they report the number of sources reporting village X as highly affected by drought. They involve analysing existing reports for trends, themes or events, and the sample analysed is almost always biased by the availability of reports to the reviewers. Typically, literature reviewers look for patterns in the text.9 They may also summarize descriptive information or transform it into quantitative information, and literature review is often used to set up coding categories. Data from newspapers, magazines, books, websites, memos, transcripts of conversations, annual reports, matrices, case studies, interviews and so on are organized into topics before being summarized. Content/secondary data analysis can be very broad and it is important to select and document data sources carefully to minimize bias.
9 For example, inductive analysis of qualitative data allows themes, patterns or categories to emerge from the data rather than deciding them prior to data collection and analysis, as in coding prior to an assessment, for example.
Technical Guidance Sheet No. 9 Last updated: February 2009
24
10.2 Outputs for forecast and response analyses Forecast and response analyses draw on situation analysis and use qualitative – and when available, quantitative – data to portray current risk levels, predict future trends and propose appropriate interventions that may stabilize or improve the food security of the studied population. Forecasting requires that questions regarding trends or expected shocks are included in the topical outlines and discussion/interview guides or questionnaires. Response analysis necessitates a solid understanding of the causes of present or future food insecurity – in terms of whether availability, access, utilization or health care is most likely to drive the situation – as well as of how households may have reacted to the same shocks in the past, the variety of interventions that could be implemented, how these might be packaged, and the implications of each. Strong expertise is required to conduct forecast and response analyses. To obtain good qualitative data for forecast and response analyses, it is vital that the elements outlined in the previous two paragraphs be built into the data collection process during the design phase, based on the specific assessment objectives. If these questions are not considered until after the fieldwork has been completed, it is unlikely that their answers will provide useful insight. 11. Conclusion Qualitative data collection and analysis make a huge contribution to food security assessments. Alone, they can answer key questions about who needs assistance and why. When reinforced by quantitative approaches, they become an even stronger tool for decision-making. There are many methods that assist in collecting, organizing and analysing qualitative data. Most of these require strong expertise. Qualitative data collection and analysis skills are becoming more and more accessible, including through recently developed training modules.10 On-the job learning with qualified mentors enables the best field exposure and builds experience. Rather than seeking to master every aspects of qualitative assessment, it is important to join multidisciplinary assessment teams that have complementary skills.
10 WFP’s training modules for emergency food security assessments include online distance learning.

Technical Guidance Sheet No. 9 Last updated: February 2009
25
References Carvalho, S. and White, H. 1997. Combining the Quantitative and Qualitative Approaches to Poverty Measurement and Analysis. World Bank Technical Paper No. 366. Washington, DC, World Bank. Center for Refugee and Disaster Studies. 2000. Training in Qualitative Research Methods for PVOs and NGOs (& Counterparts). Baltimore, John Hopkins University School of Public Health. Emerson, R.M. 2001. Contemporary Field Research: Perspectives and Formulations. Prospect Heights, USA, Waveland Press. Kennedy, E. 2003. Keynote Paper: qualitative measures of food insecurity and hunger. FAO Conference on Measurement and Assessment of Food Deprivation and Undernutrition Proceedings of the International Scientific Symposium, Rome, FAO. Shensel, S.L., Shensel, J. and Lecompte, M. 1999. Essential Ethnographic Methods: Observations, Interviews and Questionnaires. Ethnographers Toolkit. Altamira Press. WFP. How to Consolidate, Process and Analyze Qualitative and Quantitative Data. Rome, WFP Office of Monitoring and Evaluation.
Technical Guidance Sheet No. 9 Last updated: February 2009
26
Annex 1 Tips for facilitators during qualitative data collection in food security assessments At all costs, do not: • ask leading questions: "Don’t you think that….?"; • forget to follow-up on vague issues; • redirect or interrupt the flow, of fail to recognize interviewees’ reactions to the interviewer –
body, dress, social status, etc.; • use non-verbal clues to indicate the "right" answer, such as nods; and • state personal opinions on an issue. Other hints for facilitating discussions and interviews: • Always start with small talk to make respondents/interviewees comfortable. • Start by defining appropriate domains of culture: "What issues are people concerned with in
this village?". • Avoid asking questions that are hard to understand, or in ways that halt conversation. • Make sure that questions use terms/phrases that the respondent will understand –
appropriate to her/his culture, education, gender, etc. • Always ask for clarification of vague terms and facts, and the local meanings of slang terms
used by respondents. • Keep questions as short as possible. • Avoid questions that yield yes/no answers. • Avoid double-barrelled questions: "How often do you eat maize and rice?". • Avoid negatively worded questions: "Don't you agree that …..?". • Follow a rational order of questions in discussions and interviews. Typically this order should
move from the past to the present, from simple to complex, from concrete to abstract, and from low to high levels of threat. Domains should be grouped together – all nutrition questions together, all food access questions together, etc.
• Avoid complicated series of instructions: "From this list, circle the names of four preferred foods and put them in order from most to least preferred”.
• Avoid strong and culturally embedded associations: Nazi, Mother Theresa, etc. • Do not repeat as a statement something that was mentioned tentatively: "We live on the
edge of town", "Oh, so you live in a rural area?". • Do not finish respondents’ sentences for them. • Use probes such as neutral agreement, repeat what has been said in a question, ask "Could
you tell me a little bit more about..?". • Ask for narratives about experiences and opinions.
Technical Guidance Sheet No. 9 Last updated: February 2009
27
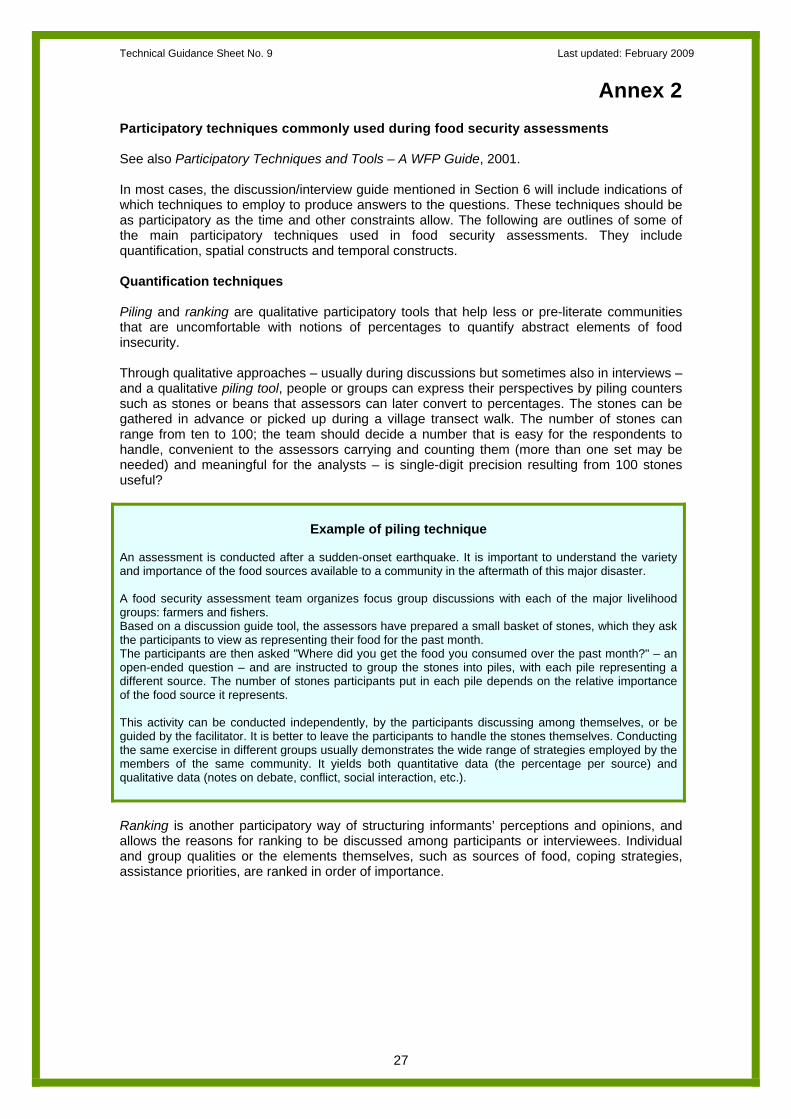
Annex 2 Participatory techniques commonly used during food security assessments See also Participatory Techniques and Tools – A WFP Guide, 2001. In most cases, the discussion/interview guide mentioned in Section 6 will include indications of which techniques to employ to produce answers to the questions. These techniques should be as participatory as the time and other constraints allow. The following are outlines of some of the main participatory techniques used in food security assessments. They include quantification, spatial constructs and temporal constructs. Quantification techniques Piling and ranking are qualitative participatory tools that help less or pre-literate communities that are uncomfortable with notions of percentages to quantify abstract elements of food insecurity. Through qualitative approaches – usually during discussions but sometimes also in interviews – and a qualitative piling tool, people or groups can express their perspectives by piling counters such as stones or beans that assessors can later convert to percentages. The stones can be gathered in advance or picked up during a village transect walk. The number of stones can range from ten to 100; the team should decide a number that is easy for the respondents to handle, convenient to the assessors carrying and counting them (more than one set may be needed) and meaningful for the analysts – is single-digit precision resulting from 100 stones useful?
Example of piling technique
An assessment is conducted after a sudden-onset earthquake. It is important to understand the variety and importance of the food sources available to a community in the aftermath of this major disaster. A food security assessment team organizes focus group discussions with each of the major livelihood groups: farmers and fishers. Based on a discussion guide tool, the assessors have prepared a small basket of stones, which they ask the participants to view as representing their food for the past month. The participants are then asked "Where did you get the food you consumed over the past month?" – an open-ended question – and are instructed to group the stones into piles, with each pile representing a different source. The number of stones participants put in each pile depends on the relative importance of the food source it represents. This activity can be conducted independently, by the participants discussing among themselves, or be guided by the facilitator. It is better to leave the participants to handle the stones themselves. Conducting the same exercise in different groups usually demonstrates the wide range of strategies employed by the members of the same community. It yields both quantitative data (the percentage per source) and qualitative data (notes on debate, conflict, social interaction, etc.). Ranking is another participatory way of structuring informants’ perceptions and opinions, and allows the reasons for ranking to be discussed among participants or interviewees. Individual and group qualities or the elements themselves, such as sources of food, coping strategies, assistance priorities, are ranked in order of importance.
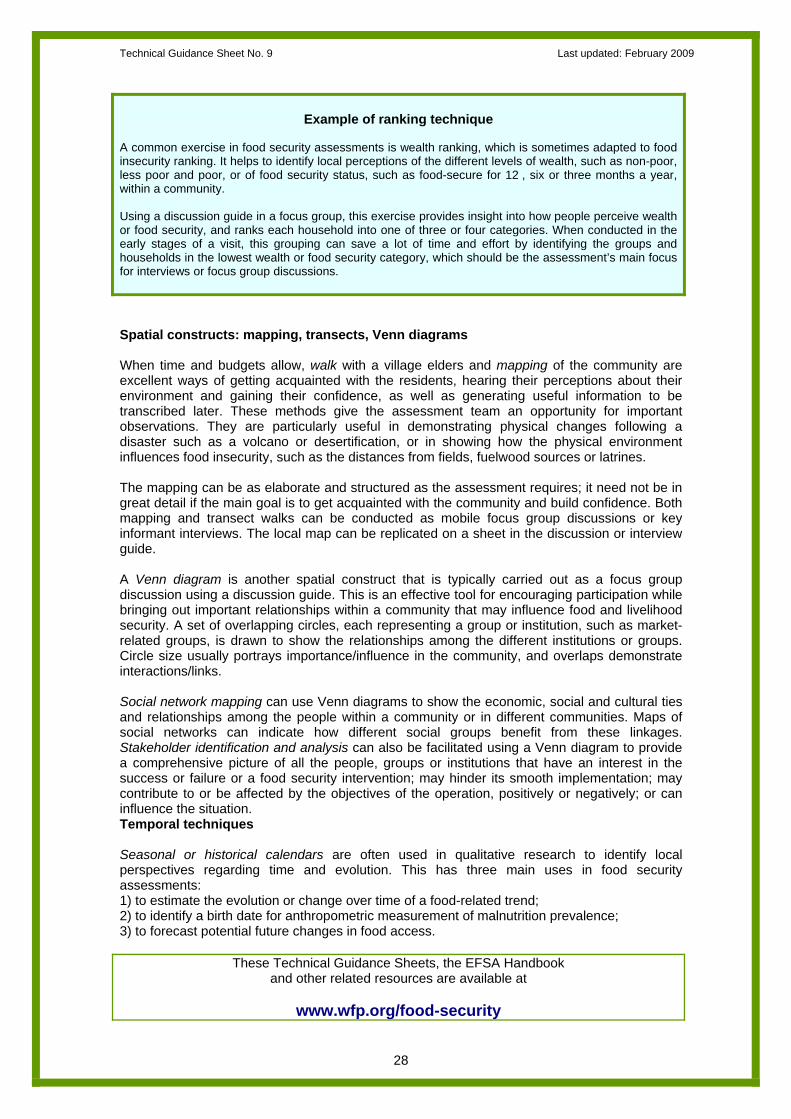
Technical Guidance Sheet No. 9 Last updated: February 2009
28
Example of ranking technique A common exercise in food security assessments is wealth ranking, which is sometimes adapted to food insecurity ranking. It helps to identify local perceptions of the different levels of wealth, such as non-poor, less poor and poor, or of food security status, such as food-secure for 12 , six or three months a year, within a community. Using a discussion guide in a focus group, this exercise provides insight into how people perceive wealth or food security, and ranks each household into one of three or four categories. When conducted in the early stages of a visit, this grouping can save a lot of time and effort by identifying the groups and households in the lowest wealth or food security category, which should be the assessment’s main focus for interviews or focus group discussions. Spatial constructs: mapping, transects, Venn diagrams When time and budgets allow, walk with a village elders and mapping of the community are excellent ways of getting acquainted with the residents, hearing their perceptions about their environment and gaining their confidence, as well as generating useful information to be transcribed later. These methods give the assessment team an opportunity for important observations. They are particularly useful in demonstrating physical changes following a disaster such as a volcano or desertification, or in showing how the physical environment influences food insecurity, such as the distances from fields, fuelwood sources or latrines. The mapping can be as elaborate and structured as the assessment requires; it need not be in great detail if the main goal is to get acquainted with the community and build confidence. Both mapping and transect walks can be conducted as mobile focus group discussions or key informant interviews. The local map can be replicated on a sheet in the discussion or interview guide. A Venn diagram is another spatial construct that is typically carried out as a focus group discussion using a discussion guide. This is an effective tool for encouraging participation while bringing out important relationships within a community that may influence food and livelihood security. A set of overlapping circles, each representing a group or institution, such as market-related groups, is drawn to show the relationships among the different institutions or groups. Circle size usually portrays importance/influence in the community, and overlaps demonstrate interactions/links. Social network mapping can use Venn diagrams to show the economic, social and cultural ties and relationships among the people within a community or in different communities. Maps of social networks can indicate how different social groups benefit from these linkages. Stakeholder identification and analysis can also be facilitated using a Venn diagram to provide a comprehensive picture of all the people, groups or institutions that have an interest in the success or failure or a food security intervention; may hinder its smooth implementation; may contribute to or be affected by the objectives of the operation, positively or negatively; or can influence the situation. Temporal techniques Seasonal or historical calendars are often used in qualitative research to identify local perspectives regarding time and evolution. This has three main uses in food security assessments: 1) to estimate the evolution or change over time of a food-related trend; 2) to identify a birth date for anthropometric measurement of malnutrition prevalence; 3) to forecast potential future changes in food access.
These Technical Guidance Sheets, the EFSA Handbook and other related resources are available at
www.wfp.org/food-security