Cambodia Food Market Analysis and Survey Report - WFP Remote
42
2010 Prepared by Haitham El‐Noush (independent analyst) and World Food Programme Cambodia Country Office VAM Unit Cambodia Food Market Analysis and Survey Report
Transcript of Cambodia Food Market Analysis and Survey Report - WFP Remote

2010
Prepared by Haitham El‐Noush (independent analyst)
and World Food Programme Cambodia Country Office VAM Unit
Cambodia Food Market Analysis and Survey Report
2
Table of Contents Executive summary ....................................................................................................................................... 3
1 Background ....................................................................................................................................... 4
1.1 Objective ....................................................................................................................................... 4
1.2 Methodology and sampling framework........................................................................................ 5
1.3 Household food security in Cambodia .......................................................................................... 7
2 Macroeconomic factors and national‐level food availability ......................................................... 10
2.1 Macroeconomic factors .............................................................................................................. 10
2.2 Food availability .......................................................................................................................... 11
3 Domestic Cambodian food markets ............................................................................................... 13
3.1 Market structure and conduct .................................................................................................... 13
3.2 Market integration ...................................................................................................................... 14
4 Food price patterns ......................................................................................................................... 16
4.1 Price volatility .............................................................................................................................. 16
4.2 Price seasonality ......................................................................................................................... 18
5 Household food access ................................................................................................................... 19
5.1 Dependency on food markets and physical access .................................................................... 20
5.2 Household food purchasing power ............................................................................................. 21
6 Market response capacity ............................................................................................................... 23
6.1 Response to increased demand .................................................................................................. 23
6.2 Constraint in increasing sales ...................................................................................................... 25
7 Limitations ....................................................................................................................................... 27
8 Conclusion and recommendations ................................................................................................. 27
Annex .......................................................................................................................................................... 31

3
Executive summary This report is an assessment of rural food markets in Cambodia as part of a feasibility study for cash and voucher programmes in Cambodia. Secondary analysis of is complemented by primary data analysis based on a market survey conducted in August/September 2010.
The results from both the secondary analysis of relevant government and WFP data and primary data based on the trader/market survey are used to answer the following key questions from the WFP Cash and Vouchers Manual to determine the feasibility of cash and voucher programmes from a market perspective:
Are markets functioning and physically accessible by targeted households?
• Market conduct in terms of price setting behavior and level of competition clearly show that markets are functioning at all levels. Of the 48 trader surveys conducted, the vast majority – 43 traders – responded that prices are determined by supply costs, an indication that prices are not fixed and individual traders do not have sufficient market share to engage in monopolistic behavior.
• Market performance in terms of price behavior show that apart from the price hike during the food price crisis of 2008, prices are stable and follow a regular seasonal pattern.
• The Cambodia Comprehensive Food Security and Vulnerability Survey (CFSVA) reported that the distance from the market is a serious concern for many rural households. This report found that when large markets are far away, village shops and mobile traders sufficiently mitigate the negative impact by playing a crucial role as substitute markets in rural villages.
Is appropriate food available in sufficient quantities and at reasonable prices?
• Food availability of the main staple – rice – is sufficient at the national level. Total paddy rice production in Cambodia has been steadily increasing since 2005 – driven by greater cultivated/harvested area and higher yields – and reached a high of 7.6 million metric tonnes in the 2009/10 season. Surplus milled rice was also at an all‐time peak in 2009/10 with 2.2 million metric tonnes.
• The seasonal crop calendar influences the price of the main stable – rice – significantly. The price of rice is highest immediately before the main wet season harvest which typically starts in November. The price drops when the main wet season harvest commences as rice supply increases, and gradually rises throughout the year.
• The market assessment found that key food items (i.e. rice, meat, fish and vegetable oil) are available at the provincial, district and commune markets year‐round. In the village shops, vegetables are usually available but meat and fish are usually available when the distance to the nearest district or commune market is significant.
Are food markets sufficiently integrated so that food will flow to deficit/target zones?
• The correlation coefficients between rice prices monitored by the Ministry of Agriculture, Forestry and Fisheries (MAFF) in nine different markets across Cambodia show that there is

4
an extremely high degree of integration between all markets. Key informant interviews during the market survey confirmed this as rice traders in the district, commune and village markets were frequently buying and selling rice across provincial and district borders.
Are the food markets sufficiently competitive?
• When traders were asked what the biggest constraint they faced in increasing sales, 65 percent responded that it was due to lack of demand and 21 percent said it was because of the high level of competition in the market. This result was consistent across market types and food items.
• 90 percent of traders responded that prices are determined by supply costs which indicate that prices in food markets in Cambodia are rarely fixed as individual traders do not have sufficient market power and that there is healthy competition in food markets.
Will traders respond adequately to any increase in effective demand based on their storage capacities, supply sources, required quality and preference of customers, and access to credit?
• 87.5 percent of traders said they have the capacity to deliver if customer demand significantly increased; of the traders who said they have the capacity to deliver, 98 percent said they would be able to deliver within a week.
• 90 percent of surveyed traders said they provide credit to customers and 67 percent said they get supplies on credit from their suppliers.
• 83 percent of surveyed traders said they currently have enough storage space to meet a twofold increase in demand.
Is it unlikely that cash/vouchers will contribute to rising purchase prices?
• It is unlikely that a cash/voucher programme will contribute to rising prices as 92 percent of all traders responded that a twofold increase in the number of customers in the market would have no effect on the price.
This report finds favorable evidence for a cash/voucher programme from a market perspective in the surveyed provinces in Cambodia. Given the market conditions, constraints and capacity, it is possible for WFP Cambodia to opt for cash/vouchers modalities in transferring resources in these provinces.
1 Background
1.1 Objective This market assessment has been carried out as part of a feasibility study for the take home ration (THR) cash scholarship programme that the WFP Cambodia Country Office is planning to implement in the 2011‐12 school year. The cash scholarship pilot will involve the World Bank conducting an evaluation of the impact of cash versus food assistance in school feeding programmes. The results from this market assessment will be used to develop the Cash Scholarship Concept Note, which will be included in the 2011‐16 WFP Cambodia Country Programme.

5
The main objective of this assessment is to establish the feasibility of cash and voucher programmes from a market perspective by investigating the following questions1:
• Are markets functioning and physically accessible by targeted households?
• Is appropriate food available in sufficient quantities and at reasonable prices?
• Are food markets sufficiently integrated so that food will flow to deficit/target zones?
• Are the food markets sufficiently competitive?
• Will traders respond adequately to any increase in effective demand based on their storage capacities, supply sources, required quality and preference of customers, and access to credit?
• Is it unlikely that cash/vouchers will contribute to rising purchase prices?
Additionally, this assessment aims to contribute to the understanding of the linkages between markets, food security and household livelihoods in Cambodia.
1.2 Methodology and sampling framework The market survey component of the assessment was determined to be necessary to sufficiently answer the questions stated above in the objective for two reasons. First, the price information from the secondary data sources available are from provincial and district markets, while commune markets and village shops are key destinations for food purchase for rural households, especially for the rural poor. Second, secondary analysis did not provide direct answers to some of the questions, in particular trader response capacity, physical accessibility and market response to cash/voucher schemes.
This report combined both primary and secondary data. Secondary data was used to collect information regarding macro level indicators including rice production and availability, inflation and prices.
Secondary data
Secondary data analysis was primarily based on the following sources: retail prices of food items were obtained from WFP’s monthly food price and wage monitoring system; wholesale prices of food items were obtained from the Cambodia Agricultural Market Information System (CAMIS) of the Ministry of Agriculture, Forestry and Fisheries (MAFF); and the consumer price index and its components were obtained from the National Institute of Statistics (NIS).
The wholesale prices from CAMIS are converted into real prices using the consumer price index (CPI) from NIS. The official CPI figures are collected only from Phnom Penh, the capital city as the collection of commodity basket prices from several other provinces was discontinued in 2008. However, as the market integration analysis shows, markets in Cambodia are highly integrated and therefore justify using the Phnom Penh CPI to calculate real prices for prices from markets outside of Phnom Penh in the absence of a true national CPI.
1 Cash and Vouchers Manual, WFP (2009)
6
Retail prices are used in this report to calculate the terms of trade (ToT) a proxy indicator for household purchasing power and therefore nominal prices are used. Retail prices are not used for additional analysis as sufficient historical data is not available.
Primary data
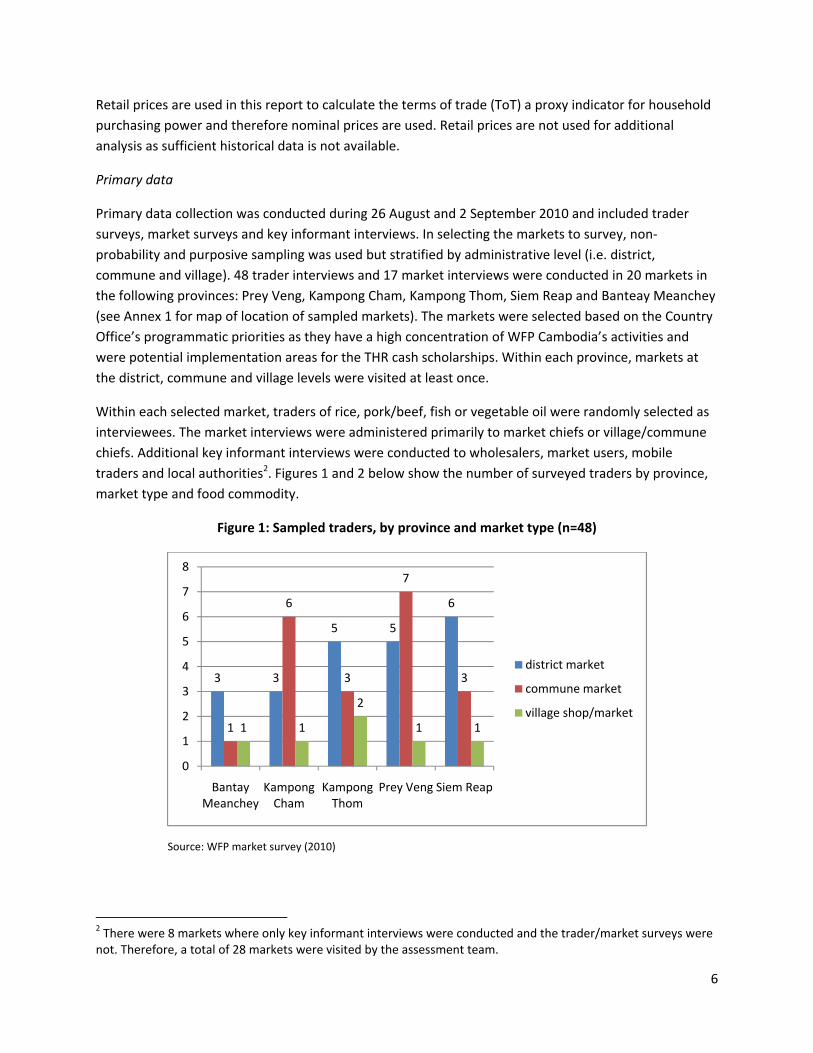
Primary data collection was conducted during 26 August and 2 September 2010 and included trader surveys, market surveys and key informant interviews. In selecting the markets to survey, non‐probability and purposive sampling was used but stratified by administrative level (i.e. district, commune and village). 48 trader interviews and 17 market interviews were conducted in 20 markets in the following provinces: Prey Veng, Kampong Cham, Kampong Thom, Siem Reap and Banteay Meanchey (see Annex 1 for map of location of sampled markets). The markets were selected based on the Country Office’s programmatic priorities as they have a high concentration of WFP Cambodia’s activities and were potential implementation areas for the THR cash scholarships. Within each province, markets at the district, commune and village levels were visited at least once.
Within each selected market, traders of rice, pork/beef, fish or vegetable oil were randomly selected as interviewees. The market interviews were administered primarily to market chiefs or village/commune chiefs. Additional key informant interviews were conducted to wholesalers, market users, mobile traders and local authorities2. Figures 1 and 2 below show the number of surveyed traders by province, market type and food commodity.
Figure 1: Sampled traders, by province and market type (n=48)
Source: WFP market survey (2010)
2 There were 8 markets where only key informant interviews were conducted and the trader/market surveys were not. Therefore, a total of 28 markets were visited by the assessment team.
3 3
5 5
6
1
6
3
7
3
1 1
2
1 1
0
1
2
3
4
5
6
7
8
Bantay Meanchey
Kampong Cham
Kampong Thom
Prey Veng Siem Reap
district market
commune market
village shop/market

7
Figure 2: Sampled traders, by traded food item (n=48)
Source: WFP market survey (2010)
1.3 Household food security in Cambodia The Cambodia Socio‐Economic Survey found that 30.1% of Cambodians still live below the poverty line and 18% below the food poverty line in 20073. Food insecurity is endemic as IFPRI identifies Cambodia as one of 29 countries worldwide where food insecurity is “most severe and persistent”4. The 2008 Cambodia Comprehensive Food Security and Vulnerability Analysis (CFSVA) estimates that 11.1% of the population is food insecure in May 2008 and that this figure is projected to rise to 18.3% during the lean season of the same year (August – November)5. Map 1 below shows the prevalence of those considered to be food‐insecure in May 2008 by agroecological zone.
3 World Bank, Cambodia: Poverty Profile and Trend in Cambodia (2009) 4 International Food Policy Research Institute (IFPRI): 2010 Global Hunger Index 5 Estimated using the food consumption score.
19
1311
2 21
02468101214161820
trader surveyed

8
Map 1: Prevalence of food insecurity by ecological zone (CFSVA 2008)
Also, Cambodia is among the 36 countries with the highest burden of child undernutrition in the world. Among children under five, 39.5% are chronically malnourished (stunted), 28.8% underweight and 8.9% acutely malnourished (wasted)6. The prevalence of anemia among children under five is 62%7.
The 5 provinces where the market assessment was carried out are located in the Plains zone (Prey Veng and Kampong Cham) and the Tonle Sap zone (Kampong Thom, Siem Reap, Banteay Meanchey). These agroecological zones have a high prevalence of food‐insecurity, with 16% of the population of the Plains zone and 23% of the Tonle Sap zone estimated to be food‐insecure during the lean season.
The 2007 Integrated Food Security Phase Classification (IPC) report identified 22 of 24 provinces8 in Cambodia as chronically food insecure (Phase 2 in the IPC scale). Of the five provinces surveyed as part of this market assessment, Prey Veng, Kampong Thom and Siem Reap were classified as “high chronically food insecure”, while Kampong Cham and Banteay Meanchey were classified as “low chronically food insecure”.
Food insecurity in Cambodia is predominantly a rural phenomenon as the majority of the population makes a living as small‐holding farmers who rely on agricultural production. The CFSVA found that farmers are becoming increasingly dependent on food sources other than their own production as three out of four households now have at least one member earning cash income. Income opportunities exist in agriculture, construction and the garment industry as well as through sales of agricultural products
6 Cambodia Anthropometric Survey (2008) 7 Cambodia Demographic and Health Survey (2005) 8 Phnom Penh and Battambang were classified as generally food secure.

9
and self employment. The CFSVA reports that the most vulnerable households are those who are unable to supplement their incomes from agricultural activities with sustained employment. Food insecure households tend to rely on agriculture alone or on casual labour activities. They have a higher percentage of only one family‐member working for cash income (42%). They have less access to land and relatively smaller land holdings. They are often highly indebted and have fewer productive assets.
The CFSVA identified five underlying causes of food insecurity in Cambodia: unequal access to land, small land plots, remoteness from markets, high food prices and natural hazards.
• Land is not equally distributed in Cambodia – 10 percent of the farmers with the smallest land holdings own less than 1 percent of total farmed land while 10 percent of farmers with the largest land holdings own 44 percent. The average dimension of farms is about 1.5 hectares (CFSVA and World Bank Poverty Assessment9). The World Bank estimated that in the rural areas, 45 percent of all households own land smaller than 1 ha and 20 percent do not own any land. In Cambodia, one hectare of land is considered as the threshold to meet the milled rice requirements of the average household (five members). Therefore, 65 percent of rural households do not produce any or enough rice to be self‐sustainable throughout the year.
• At the national level, 1 out of 4 households were able to save part of the crop production for the next year. This figure showed significant variability across ecological zones – in the Tonle Sap zone, 30 percent of households could save part of their crop production for the following year, whereas in the Plains zone it was 22 percent.
• The distance from the market is an underlying cause of food insecurity in rural areas as only one out of five villages had a (main) market while households are increasingly relying on markets to access food. Urban households are almost totally dependent on the market and more than 50 percent of rural households rely on markets as their main source of food. Physical and economic access to markets in rural areas will be closely looked at in this assessment.
• Studies show that among the poorest wealth quintile in rural areas, disproportionate amount of household expenditure is devoted to acquire food10. Irregularities in market prices of staple food items have a large impact of the food security situation of the rural poor in Cambodia.
• Finally, Cambodia has the highest risk of flooding in the region, with 12.2 percent of Cambodia’s population (1.7 million people) exposed to flooding, according to the Asia‐Pacific Disaster Report 2010. This is in line with the 2003 study by the NCDM and WFP which highlights that 292
9 World Bank, Cambodia: Halving Poverty by 2015 (2006) 10 The Food Insecurity Assessment in Cambodia (NIS/FAO, 2007) report that for the lowest income quintile, 85% of total consumption is food consumption, while the figure is 60.5% for the highest income quintile. The Poverty Profile and Trend in Cambodia (World Bank, 2009) reports that for the lowest income quintile, 70% of total consumption is food consumption, while the figure is 48% for the highest income quintile.

10
communes out of a total of 1,621 communes in Cambodia are prone to drought and around 260 communes are prone to flood.
2 Macroeconomic factors and nationallevel food availability
2.1 Macroeconomic factors After contracting by an estimated 1.5% in 2009 as a result of the impact of the global recession on garment exports, foreign investment and tourism, Cambodia’s real GDP is expected to grow 4.1% in 2010 and 5.1% in 2011. Private consumption is expected to recover in 2010‐11 as personal disposable income will increase as agricultural commodities sell for higher prices and garment factories begin to hire again. In 2009, the contracting economy, rising unemployment and a decline in global commodity prices caused consumer prices to decrease by an average of 0.7%, but in 2010 prices will increase by around 4%. In February 2010, inflation accelerated to 7.3% but has stabilized since. According to the Economist Intelligence Unit, inflation will average 5.6% in 2011 and 5.3% in 2012 as economic growth recovers and demand‐side pressures re‐emerge. The riel is expected to remain under downward pressure in the following two years due to the persistence of a large current account deficit. A weak riel against the US dollar could contribute to inflationary pressures by raising prices for imported goods and services in local‐currency terms. The Figure 3 below shows the relative changes of the consumer price index (CPI) and some of its components since 2007. The values of all items are near 100 in January 2007 as the base period for the index is October‐December 2006. The rise in consumer prices during the 2008 food price crisis is evident – especially the exceptional rise in rice prices.
Figure 3: Trend of CPI, FPI11 and other components
Source: National Institute of Statistics
11 The Food Price Index (FPI) is the food and non‐alcoholic beverage component of the CPI.
507090
110130150170190210230
Jan‐07
Apr‐07
Jul‐0
7
Oct‐07
Jan‐08
Apr‐08
Jul‐0
8
Oct‐08
Jan‐09
Apr‐09
Jul‐0
9
Oct‐09
Jan‐10
Apr‐10
Jul‐1
0
Inde
x (Base year: O
ct ‐Dec 200
6)
CPI FPI Rice Pork Gasoline
11
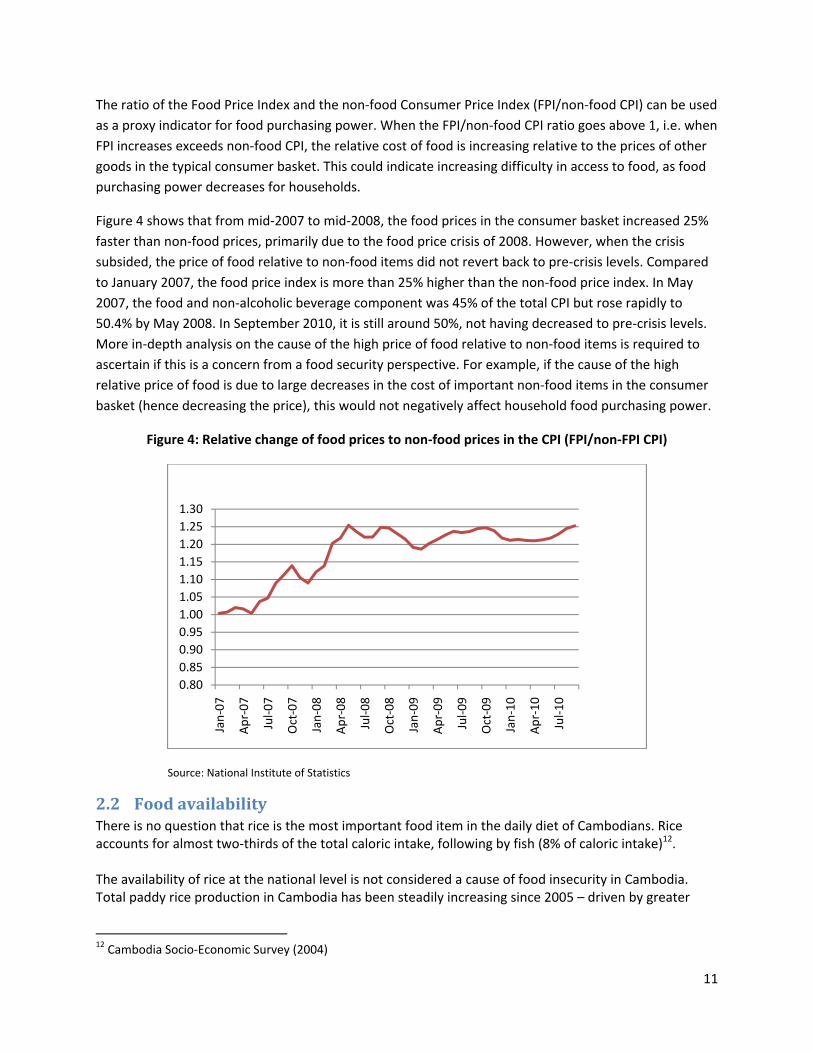
The ratio of the Food Price Index and the non‐food Consumer Price Index (FPI/non‐food CPI) can be used as a proxy indicator for food purchasing power. When the FPI/non‐food CPI ratio goes above 1, i.e. when FPI increases exceeds non‐food CPI, the relative cost of food is increasing relative to the prices of other goods in the typical consumer basket. This could indicate increasing difficulty in access to food, as food purchasing power decreases for households.
Figure 4 shows that from mid‐2007 to mid‐2008, the food prices in the consumer basket increased 25% faster than non‐food prices, primarily due to the food price crisis of 2008. However, when the crisis subsided, the price of food relative to non‐food items did not revert back to pre‐crisis levels. Compared to January 2007, the food price index is more than 25% higher than the non‐food price index. In May 2007, the food and non‐alcoholic beverage component was 45% of the total CPI but rose rapidly to 50.4% by May 2008. In September 2010, it is still around 50%, not having decreased to pre‐crisis levels. More in‐depth analysis on the cause of the high price of food relative to non‐food items is required to ascertain if this is a concern from a food security perspective. For example, if the cause of the high relative price of food is due to large decreases in the cost of important non‐food items in the consumer basket (hence decreasing the price), this would not negatively affect household food purchasing power.
Figure 4: Relative change of food prices to non‐food prices in the CPI (FPI/non‐FPI CPI)
Source: National Institute of Statistics
2.2 Food availability There is no question that rice is the most important food item in the daily diet of Cambodians. Rice accounts for almost two‐thirds of the total caloric intake, following by fish (8% of caloric intake)12. The availability of rice at the national level is not considered a cause of food insecurity in Cambodia. Total paddy rice production in Cambodia has been steadily increasing since 2005 – driven by greater
12 Cambodia Socio‐Economic Survey (2004)
0.800.850.900.951.001.051.101.151.201.251.30
Jan‐07
Apr‐07
Jul‐0
7
Oct‐07
Jan‐08
Apr‐08
Jul‐0
8
Oct‐08
Jan‐09
Apr‐09
Jul‐0
9
Oct‐09
Jan‐10
Apr‐10
Jul‐1
0

12
cultivated/harvested area and higher yields – and is expected to reach a high of 7.9 million metric tonnes in the 2010/11 harvest season. Surplus milled rice was at an all‐time peak in 2009/10 with 2.2 million metric tonnes13 and is expected to be higher in the 2010/11 season (Figure 5). Advances in productivity – which increase total yield – are a result of improvements made in farming practices, seed quality, and fertilizer application, as well as the provision of agricultural extension services and technical assistance by NGOs and other development partners.
Figure 5: Paddy rice production and surplus milled rice
Source: Ministry of Agriculture, Forestry and Fisheries
Assuming favorable weather during the remaining cultivation period, the Ministry of Agriculture, Forestry and Fisheries projects that the country will be able to increase its combined wet and dry season paddy rice production by over 0.3 million metric tonnes to reach 7.9 million metric tonnes in 2010/11.
Exports of Cambodian milled rice seem to be growing rapidly but not at a level that will significantly affect overall availability. The Ministry of Commerce reported 107,291 metric tonnes of exported milled rice during the first half of 2010, up from just 4,369 metric tonnes recorded during the first half of 2009. However, some argue that the increase is due to the fact that trade is being increasingly conducted through formal channels. In any case, credit provided to rice millers, greater confidence from investors and the Cambodian government’s promotion of the sector are thought to have contributed to the recorded increase in rice exports.
13 After accounting for post‐harvest losses, seed usage, weight loss in conversion to milled rice and domestic consumption.
2.2
2.3
2.4
2.5
2.6
2.7
2.8
2.9
0
1
2
3
4
5
6
7
8
9
2005/06 2006/07 2007/08 2008/09 2009/10 2010/11*
metric tonn
es per hectare
metric toon
es
Millions
Total paddy rice production Surplus milled rice Yield

3 Dom
3.1 MaThe rice vfarmer, paown harveproductiotraders anfarm‐gate
Key informcredit repimmediatchain, andintermedi
Of the 48 determineand 2 respmarket tymarket tyfunctioninshare to e
mestic Ca
arket struvalue chain froaddy collectoested rice andon system andnd millers dure prices.
mant interviepayment for fetely after the d, therefore diaries can rea
trader surveyed by supply ponded that ype and food ypes and foodng and compeengage in mo
Source: WFP
dist
comm
village sh
ambodian
cture and om the produor/trader, mild sell the restd lack of orgaring paddy sa
ews during theertilizer and fharvest and ado not capturach 10 to 15 p
ys conductedcosts, 3 respoprices are fixeitem, supply d items (Figuretitive as pricnopolistic be
Figure 6:
P market survey
1
1
0%
trict market
une market
hop/market
n food mar
conduct ucer to consuler, wholesalet to paddy conized rice proles at the end
e assessmentfuel purchaseat a low pricere high cash repercent of the
d, the vast maonded that aled by severalcost is the moes 6 and 7). Tces are not fixhavior.
Price determ
(2010)
1
1
1
2
2
6
% 20% 40%
rkets
mer involveser/retailer anllectors, tradoducer associd of the harve
t highlight thaes – and lack oe. Farmers reeturns on thee market price
ajority – 43 trall the traders wholesalers ost importanThis is one indxed and indivi
mination, by m
20
17
6
60% 80% 100
the followingnd consumer. ers or millersiations lead toest (typically
at financial neof storage facpresent the leir productione (UNDP, 200
aders – respoof the food itin the market factor in pridication that fidual traders
market type (
0%
fixed bwholemarke
All trarange
Depencosts
g typical interFarmers cons. The small‐sco low bargainDecember –
eeds after thecilities also leaowest link onn, while the m04).
onded that prtem in the maet. When disagice determinafood marketsdo not have s
n=48)
by several esalers on the et
aders together of prices
nding on suppl
rmediaries: sume part of cale househoning power agFebruary) for
e harvest – mad farmers ton the marketimark‐up earne
rices are arket fix priceggregated byation for all s are well‐sufficient ma
fix a
ly
13
f their old gainst r low
mainly o sell ng ed by
es, y
rket

An interesboth as sewith histowomen wmatting sp
3.2 MaThe correFisheries of integraevidencedseasonal s
14 Excerpt f
Source: WFP
sting fact thaellers and buyorical practicewho take chargpread upon t
arket integlation coeffic(MAFF) in nination betweend by the high shocks.
from The Custo
Veg
Fresh/sm
Figure 7: Pri
P market survey
t the assessmyers. Of the ses according tge of trade...Mthe ground. Ea
gration cients betweene different mn all markets co‐movemen
oms of Cambo
1
1
2
0%
getable oil
Pork
moked fish
Beef
Rice
ice determina
(2010)
ment team oburveyed tradto the followiMarket is helach has an al
en rice prices markets acros(Table 1). Fignt in price fluc
dia by Zhou Da
2
1
1
1
4
1
20% 40% 6
ation, by foo
bserved was ters, 94 perceng excerpt frld every day fllotted place…
monitored bys Cambodia sgure 8 also shctuations – b
aguan circa 13
17
10
11
60% 80% 100
d commodity
hat women dnt were womom the 14th cfrom six o'cloc…"14.
y the Ministryshow that theows the high oth during se
00 AD.
0%
fixed bwholemarke
All trarange
Depencosts
y (n=48)
dominate tradmen. This seemcentury: "In Cck...they displ
y of Agricultuere is an extreintegration o
easonal fluctu
by several esalers on the et
aders together of prices
nding on suppl
de in food mams to be in linCambodia it islay their good
ure, Forestry aemely high deof rice marketuations and no
fix a
ly
14
arkets ne s the ds on
and egree ts on‐

15
Table 1: Correlation coefficients of mixed rice prices in major rice markets (2005‐Sep 2010)
Kampong Chhnang
Kampong Cham Takeo Siem Reap
Prey Veng
Phnom Penh Kampot
Battam‐bang
Banteay Meanchey
K. Chhnang 1.00 0.97 0.95 0.97 0.97 0.97 0.97 0.90 0.95K. Cham 1.00 0.98 0.98 0.99 0.97 0.98 0.95 0.91Takeo 1.00 0.98 0.99 0.96 0.97 0.89 0.90Siem Reap 1.00 0.98 0.96 0.98 0.91 0.93Prey Veng 1.00 0.97 0.99 0.92 0.93Phnom Penh 1.00 0.97 0.92 0.92Kampot 1.00 0.91 0.96Battambang 1.00 0.82Banteay M. 1.00Source: Cambodia Agricultural Market Information System, Ministry of Agriculture, Forestry and Fisheries
Figure 8: Wholesale price of mixed rice in nine different markets across Cambodia (2005‐10)
Source: Cambodia Agricultural Market Information System, Ministry of Agriculture, Forestry and Fisheries
To take into account of the fact that the correlation coefficients between rice markets that include the period of the food price crisis in 2008 may skew the coefficients upward, the table below presents the correlation coefficients between the same markets during the past two years (2009 – present), which are considered normal years in terms of price fluctuations. Even for the post‐crisis period, it is evident that rice markets are highly integrated (Table 2). The lowest level of integration is between Battambang and a few markets (Kampong Chhnang, Phnom Penh and Banteay Meanchey).
0
500
1,000
1,500
2,000
2,500
Jan '05
Apr '05
Jul '05
Oct '05
Jan '06
Apr '06
Jul '06
Oct '06
Jan '07
Apr '07
Jul '07
Oct '07
Jan '08
Apr '08
Jul '08
Oct '08
Jan '09
Apr '09
Jul '09
Oct '09
Jan '10
Apr '10
Jul'10
Oct'10
Kampong Chhnang
Kampong Cham
Takeo
Siem Reap
Prey Veng
Phnom Penh
Kampot
Battambang
Banteay Meanchey

16
Table 2: Correlation coefficients of mixed rice prices in major rice markets (2009‐Sep 2010) Kampong
Chhnang Kampong Cham Takeo Siem Reap
Prey Veng
Phnom Penh Kampot
Battam‐bang
Banteay Meanchey
K. Chhnang 1.00 0.81 0.67 0.84 0.75 0.74 0.82 0.57 0.82K. Cham 1.00 0.94 0.96 0.98 0.84 0.97 0.83 0.70Takeo 1.00 0.88 0.97 0.87 0.88 0.77 0.65Siem Reap 1.00 0.93 0.78 0.94 0.81 0.72Prey Veng 1.00 0.84 0.96 0.81 0.72Phnom Penh 1.00 0.81 0.56 0.80Kampot 1.00 0.80 0.79Battambang 1.00 0.48Banteay M. 1.00Source: Cambodia Agricultural Market Information System, Ministry of Agriculture, Forestry and Fisheries
4 Food price patterns The wholesale price of mixed rice collected by the Cambodia Agricultural Marketing Information System (CAMIS) of the Ministry of Agriculture, Forestry and Fisheries is used to analyze price trends and patterns across markets in Cambodia. The CPI was used to calculate real prices.
4.1 Price volatility Figure 9 shows the trend of real rice prices. Two key patterns emerge which will be further investigated in this report. First, in 2008, prices do not follow the normal seasonal fluctuations and in May 2008 the price of rice is 58.2 percent higher than in May 2007. Second, the price of rice is typically at its lowest during the early months of the year and peak towards the end of the year. In a normal year, the price of rice can be expected to hit a peak immediately before the main wet season harvest which begins in November. The months preceding the main wet season harvest – when the price of rice is typically at its annual high – coincides with the lean season when the rice stocks from rice production are depleted and households depend more on the market for rice (see Appendix 6 for the seasonal crop calendar).
Figure 9: Real rice prices, 2005‐2010
Source: Cambodia Agricultural Market Information System, Ministry of Agriculture, Forestry and Fisheries
800900
1,0001,1001,2001,3001,4001,5001,6001,7001,800
Jan Feb Mar Apr May Jun Jul Aug Sep Oct Nov Dec
riel/kg
2005
2006
2007
2008
2009
2010

17
A comparison between the nominal and real prices show that after the food price crisis of 2008, the nominal price of rice did not revert back to pre‐crisis levels, but the real price data shows that most of this was due to inflation. Hence, the real price of rice did revert back to pre‐crisis levels (Figure 10).
Figure 10: Nominal and real wholesale price of mixed rice and CPI
Source: Cambodia Agricultural Market Information System, Ministry of Agriculture, Forestry and Fisheries
The 12‐month centered moving average of real rice prices can be interpreted as showing the non‐seasonal price volatility and it confirms that the dramatic rise and fall of rice prices during 2008 were not seasonal but due to the food price crisis – a non‐seasonal price shock (Figure 11).
Figure 11: 12‐month centered moving average of real rice prices
Source: Cambodia Agricultural Market Information System, Ministry of Agriculture, Forestry and Fisheries
0
20
40
60
80
100
120
140
160
0
500
1,000
1,500
2,000
2,500
Jan '05
Apr '05
Jul '05
Oct '05
Jan '06
Apr '06
Jul '06
Oct '06
Jan '07
Apr '07
Jul '07
Oct '07
Jan '08
Apr '08
Jul '08
Oct '08
Jan '09
Apr '09
Jul '09
Oct '09
Jan '10
Apr '10
Jul'10
Oct'10 CP
I ind
ex (b
ase=Oct‐Dec 200
6)
riel/kg
wholesale real prices wholesale nominal prices CPI
0
200
400
600
800
1,000
1,200
1,400
1,600
Jan '05
Apr '05
Jul '05
Oct '05
Jan '06
Apr '06
Jul '06
Oct '06
Jan '07
Apr '07
Jul '07
Oct '07
Jan '08
Apr '08
Jul '08
Oct '08
Jan '09
Apr '09
Jul '09
Oct '09
Jan '10
Apr '10
Jul'10
Oct'10
riel/kg
CMA (12 months)
18
Although traders were asked as part of the survey their opinion of how prices of the food items they were selling would evolve in the next year, the majority of traders responded that they did not know.
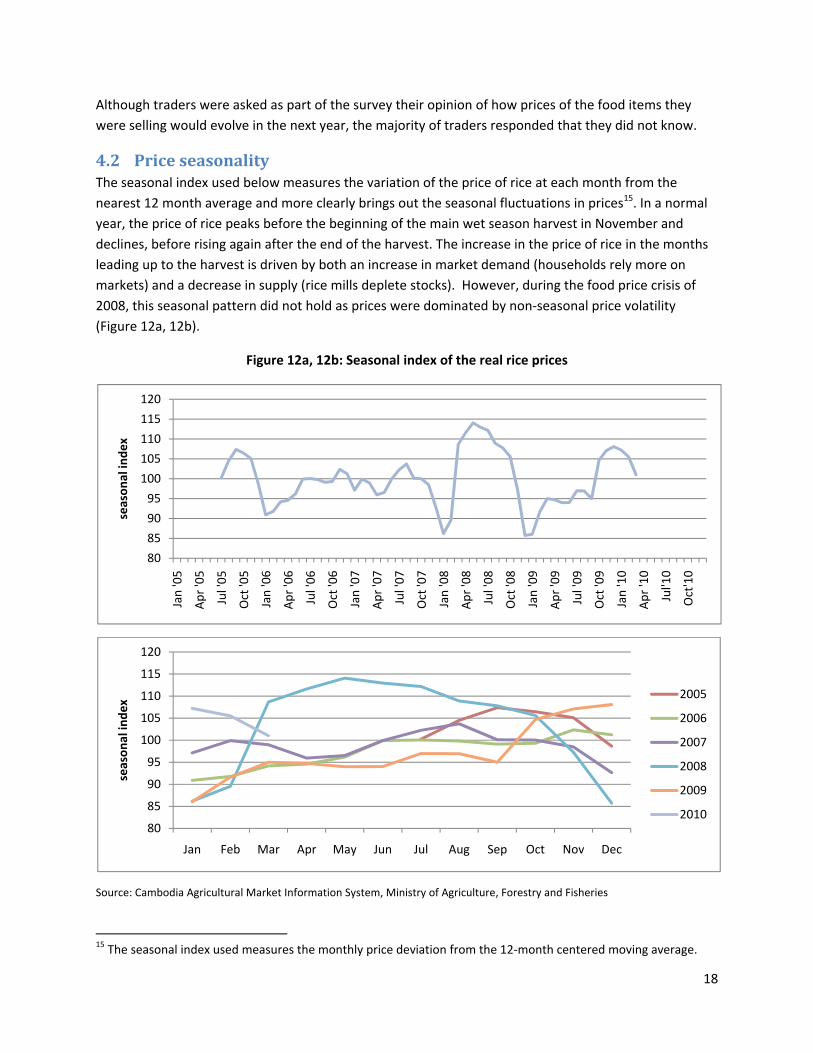
4.2 Price seasonality The seasonal index used below measures the variation of the price of rice at each month from the nearest 12 month average and more clearly brings out the seasonal fluctuations in prices15. In a normal year, the price of rice peaks before the beginning of the main wet season harvest in November and declines, before rising again after the end of the harvest. The increase in the price of rice in the months leading up to the harvest is driven by both an increase in market demand (households rely more on markets) and a decrease in supply (rice mills deplete stocks). However, during the food price crisis of 2008, this seasonal pattern did not hold as prices were dominated by non‐seasonal price volatility (Figure 12a, 12b).
Figure 12a, 12b: Seasonal index of the real rice prices
Source: Cambodia Agricultural Market Information System, Ministry of Agriculture, Forestry and Fisheries
15 The seasonal index used measures the monthly price deviation from the 12‐month centered moving average.
80
85
90
95
100
105
110
115
120
Jan '05
Apr '05
Jul '05
Oct '05
Jan '06
Apr '06
Jul '06
Oct '06
Jan '07
Apr '07
Jul '07
Oct '07
Jan '08
Apr '08
Jul '08
Oct '08
Jan '09
Apr '09
Jul '09
Oct '09
Jan '10
Apr '10
Jul'10
Oct'10
season
al inde
x
80
85
90
95
100
105
110
115
120
Jan Feb Mar Apr May Jun Jul Aug Sep Oct Nov Dec
season
al inde
x 2005
2006
2007
2008
2009
2010

19
The price differential of the annual minimum and maximum prices of rice is 19.4 percent for 2005 – 2010, excluding 2008 (Table 3; see Annex 2 for covariance of prices within year). The retail price of rice also shows similar patterns with wide within‐year price differentials, implying that degree of household access to rice varies by the season. For 2010, the price differential is expected to be higher than 12.2% as the price of rice was continuing to rise and most likely not reached its peak at the time this report was written.
Table 3: Variation of rice prices with‐year (2005‐2010)
2005 2006 2007 2008 2009 2010*average price 1,007.8 906.9 1,123.1 1,451.4 1,121.0 1,214.4standard deviation 30.9 54.3 96.1 202.6 91.6 55.8cov within year 0.031 0.060 0.086 0.140 0.082 0.046min 9254 845.4 976.2 1080.9 1037.1 1150.4max 1047.7 998.4 1257.7 1668.6 1293.5 1290.8percentage diff 13.2% 18.1% 28.8% 54.4% 24.7% 12.2%
Source: Cambodia Agricultural Market Information System, Ministry of Agriculture, Forestry and Fisheries
5 Household food access In Cambodia, one hectare of land is considered as the threshold to meet the milled rice requirements of a family of five. Yet in rural areas, 20 percent are landless, 20 percent of households own plots that are smaller than 0.5 hectares, and 25 percent have plot sizing between 0.5 and 1 hectare. Therefore, only 35 percent of rural households have enough land to produce enough rice to support their households’ food consumption needs throughout the year, 45 percent of rural households are subsistence farmers, and 20 are landless and hence most likely obtain their income from daily unskilled labour. The CFSVA reports that the landless and those that lease the land they cultivate are more likely to be food insecure compared to land owners16 and also that the size of farmed land was a significant factor in determining food insecurity17.
The high proportion of landless households and subsistence farmer households is in line with various reports that show that most households in Cambodia depend heavily on market purchases of basic food items to ensure adequate food security. A closer look at the trends and behavior of prices, and in particular the price of rice, is crucial to understand household purchasing power dynamics. Increases in the price of basic food commodities imply that households must spend even a greater share of their resources of food and increases the likelihood of engaging in negative coping strategies if basic food consumption needs are not met.
16 The lack of property title is higher among the poor and borderline food consumption households (51 percent on average) than among acceptable food consumption households (38 percent). 17 The poor and borderline consumption groups had a significantly higher proportion of households cultivating small plots of 0.5 to one ha (54 percent and 50 percent, respectively). Landowners with more than three ha are significantly (p<0.05) associated with the acceptable food consumption group (28 percent) compared to the poor and borderline food consumption groups.

20
5.1 Dependency on food markets and physical access While urban households are almost totally dependent on the market, more than 50 percent of rural households also rely on markets as their main source of food according to the 2008 CFSVA. For rural households 65% of food commodities are purchased in markets and for urban households 93% is purchased. This indicates a high level of dependency on food markets for food consumption in both rural and urban areas18.
However, the CFSVA also reported that the distance from the market is a serious concern for many rural households: only one out of five villages had a market within the village and more than 40% of the surveyed villages reported that the market is “far away”. In the CFSVA, “distance to market” was taken to be the distance to the closest commune, district or provincial market, not the small village shops.
There are four levels of markets in Cambodia, which correspond to the administrative levels – provincial, district, commune and village markets. The provincial markets are large, roofed markets located in each of the provincial capitals. Most food and non‐food items can be found in these markets. District markets are located in the district center and are usually roofed. Most food items and a wide variety of non‐food items are sold. Commune markets are located in commune centers and are usually more than twenty shops located alongside the main road. In many cases, there is a small, roofed area which has stalls for more traders. Village markets are usually a cluster of small shops within a village – usually selling vegetable oil, toiletries, snacks, oftentimes vegetables and eggs, and sometime meat and fish.
Based on key informant interviews during the market assessment, in the five provinces surveyed, each village typically had at least two small village shops. The food items that the village shops carried seemed to depend on the distance of the village to the nearest market (i.e. commune, district or province market). If the distance to the larger markets was close, the village shops would typically carry vegetable oil, snacks, toiletries and sometimes vegetables. However, if the distance to the larger markets was significant, the village shops would carry additional food items such as eggs, fish, meat, and in a few instances even rice.
Also, qualitative interviews with key informants suggest that mobile traders – traders selling items on the back of their motorcycles – are quite common in the villages, especially if the village shops do not carry certain items, such as vegetables or meat. Their prices were similar to village shop prices (typically, 10‐15% higher than district market). Many fish and pork traders in the commune markets said that if they were not able to finish sales by the afternoon, they would travel to households in the villages and sell from their motorcycles.
Although a more extensive assessment with a larger sample covering more areas would be necessary, based on key informant interviews in the five surveyed provinces, the high dependency of rural families
18 The degree of dependency on the (casual) labour market was also an indicator of food insecurity. The CFSVA found that the construction and casual labour livelihood groups have the highest proportion of households that are food insecure: ‘farmer and other’ with 25 percent, ‘casual labour’ with 18 percent, ‘farmer and construction’ with 17 percent, ‘farmer and casual labour’ with 14 percent.

21
on food markets but the lack of physical access to larger markets is reconciled by the role of village shops and mobile traders in rural villages.
5.2 Household food purchasing power WFP Cambodia’s market surveillance system monitors the price of food commodities and wage rates of unskilled laborers on a monthly basis (Annex 4). Its objective is to detect changes and identify trends in the food purchasing power of vulnerable households in Cambodia. The retail price of the following food commodities are collected from 10 urban and 10 rural markets: rice, smoked fish, beef, pork and vegetable oil. The daily wages of unskilled workers engaged in the following activities are also monitored: rice and non‐rice farming, construction, motor‐taxi driving and factory work. The retail prices of rice follow the pattern observed in the previous section, where (i) there was a clear non‐seasonal shock in 2008 and (ii) prices are lowest during the main wet season harvest (beginning of the calendar year) and peak before the start of the harvest in November (Figure 13).
Figure 13: Nominal retail rice prices
Source: Cambodia Food Price and Wage Bulletin, WFP Cambodia
The daily wage of unskilled labour seems to be demand‐driven, where demand is high during the rice planting and harvesting periods – June to July and December to January, respectively (Annex 6) – which subsequently increases the wage rate. However, consistent reporting of official monthly or quarterly wage data is not available and WFP’s wage collection has not been conducted long enough for in‐depth trend analysis.
0
500
1,000
1,500
2,000
2,500
Jan Feb Mar Apr May Jun Jul Aug Sep Oct Nov Dec
Riel/kg 2010
2009
2008
2007

22
Figure 14: Daily wage of unskilled labour (nominal)
Source: Cambodia Food Price and Wage Bulletin, WFP Cambodia
The wage rates of unskilled labor and price of rice are used to compute the changes in the terms of trade (ToT) for vulnerable households. The “terms of trade” is a proxy measure of the purchasing power of vulnerable households as it calculates how many kilogrammes of rice can be purchased with daily wages. The terms of trade for unskilled labor and rice, for example, is calculated by dividing the daily wage rate by the price of rice. The WFP market surveillance data suggest that the terms of trade are in line with the seasonal rice price fluctuations and the seasonal calendar (Figure 15). The terms of trade are the lowest during the year during the lean season when the price of rice is the highest. The lean season, which typically starts in August, ends in November when the main wet season rice harvest starts. The terms of trade rise when the main harvest begins when the price of rice decreases and the unskilled labour demand in rural areas increase; and the terms of trade seem to peak during the early months of the rainy season when the price of rice is still sufficiently low and the unskilled labour demand in rural areas is high due to the planting season19.
19 The sudden increase and subsequent decrease in the terms of trade during February/March 2009 is probably due to problems with the wage data collection.
0
2,000
4,000
6,000
8,000
10,000
12,000
14,000
Jan Feb Mar Apr May Jun Jul Aug Sep Oct Nov Dec
Riel/day 2010
2009
2008

23
Figure 15: Terms of trade of unskilled labour and rice
Source: Cambodia Food Price and Wage Bulletin, WFP Cambodia
6 Market response capacity The primary purpose of this market assessment is to ascertain the suitability of a cash transfer programme in rural Cambodia. The section will directly address (i) whether food markets in Cambodia are competitive, (ii) if traders in food markets can respond adequately to an increase in demand, and (iii) whether a cash injection into households would contribute to rising prices. All analyses are disaggregated by province, food commodity and market type.
6.1 Response to increased demand The high level of competition in food markets are evidenced by the fact that in the survey 92 percent of all traders responded that a twofold increase in the number of customers in the market would have no effect on the price. This confirms the fact that 90 percent of the traders determine prices based on supply costs and therefore changes in customer number (i.e. increased demand) would not affect prices. The finding was consistent when disaggregating by markets, food commodities, and provinces (Figures 16, 18).
An exception to this competitive behavior was the price of meat – especially pork – during the Khmer New Year and Phum Ben festivals as traders reported that every year the increase in demand resulted in higher prices. However, this is due to increased demand in the entire country and not just for a particular trader or market.
0.0
1.0
2.0
3.0
4.0
5.0
6.0
7.0
8.0
Jan Feb Mar Apr May Jun Jul Aug Sep Oct Nov Dec
Kg of rice pe
r daily wage
2010
2009
2008

F
Figu
Figure 16: Effe
Source: WFP
ure 17: Effect
Source: WFP
dist
comm
village sh
vegetab
ect of more c
P market survey
t of more cus
P market survey
0%
trict market
mune market
hop/market
0%
rice
le oil
pork
customers in
(2010)
stomers in ma
(2010)
% 20%
16
20% 40%
market on pr
arket on pric
20
19
5
40% 60%
12
6
11
% 60%
rice of traded
e of traded it
2
1
1
80% 100
1
3
80% 100
d item, by ma
tem, by food
0%
no cha
increa
0%
no cha
increa
arket type
commodity
ange
se
ange
se
24

AdditionaCambodia
• 87sith
• 94sc
• 90ge
• 83in
The result
It is notewThailand, large majothat the d
6.2 CoWhen trarespondecompetitipoint to fa
Figure 18: Ef
Source: WFP
ally, the followa can adequat
7.5 percent ognificantly inhey would be
4 percent of scheme in coll
0 percent of set supplies on
3 percent of sncrease in dem
ts are consist
worthy that atraders wereority of the pdebtor will cro
onstraint inders were askd that it was on in the maavorable con
Bantay M
Kampo
Kampo
P
S
ffect of more
P market survey
wing results frtely respond
of the traders creased; of th able to deliv
surveyed tradaboration wit
surveyed tradn credit from
surveyed tradmand.
ent when dis
t the district e much more opulation areoss the borde
n increasiked what thedue to lack orket. This resditions for a c
0%
Meanchey
ong Cham
ong Thom
Prey Veng
Siem Reap
e customers i
(2010)
rom the surveto a significa
said they havhe traders whver within a w
ders indicatedth WFP.
ders said theytheir supplie
ders said they
aggregating b
and communreluctant to pe migrants woer into Thailan
ing sales e biggest consf demand anult was consicash or vouch
7
20% 4
n market on
ey further cont increase in
ve the capaciho said they hweek.
d that they w
y provide creders.
y currently ha
by market typ
ne markets in provide crediorkers on thend and not re
straint they fad 21 percent stent across mher based inte
5
10
13
9
40% 60%
price of trad
nfirm that tran demand:
ty to deliver ihave the capa
ould be willin
dit to custom
ave enough st
pe, province a
Banteay Meat to custome cassava planeturn.
aced in increasaid it was bemarket typeserventions as
3
1
80% 100
ed item, by p
aders in food
if customer dacity to delive
ng to participa
ers and 67 pe
torage space
and food com
anchey near trs due to the ntations and (
asing sales, 65ecause of thes and food ites they (i) conf
0%
no cha
increa
province
markets in
demand er, 98 percent
ate in a vouch
ercent said th
to meet a tw
mmodity.
the border wfact that (i) a(ii) there is a r
5 percent e high level ofms. The resufirm that trad
ange
ase
25
t said
her
hey
wofold
ith a risk
f lts ers

can accomis high.
If the vast(Section 6the value
S
S
mmodate an i
t majority of t6.1) and if thechain proble
Fig
Source: WFP ma
Figur
Source: WFP ma
distr
commu
village sh
vege
increase in de
traders repore biggest consm in rural foo
gure 19: Bigge
arket survey (201
re 20: Biggest
arket survey (201
1
0%
rict market
une market
op/market
2
0%
pork
rice
etable oil
emand and (i
rted that theystraint traderod markets se
est constrain
10)
t constraint i
10)
1 2 13
15
3
% 20% 40%
2
7
6
14
20% 40%
i) imply that c
y can easily res face in increeems to be pu
nt in increasin
n increasing
3 3
4
3
% 60% 80%
1
5
4
3
60% 80%
competition a
espond to a sieasing sales isurchasing pow
ng sales, by m
sales, by foo
4
3
1
% 100%
1
100%
Lowof
Lowsalpri
Lacpu
Higin t
Ot
amongst trad
ignificant incrs lack of demwer and not p
market type
d commodity
Low or irregulproduce
Low profit maprice, high pur
Lack of demanpurchasing po
High level of cthe market
Other
w or irregular qproduce
w profit margies price, high pce)
ck of demand (rchasing powe
gh level of comthe market
her
ders in the ma
rease in demaand (Section productive po
y
ar quantity of
rgin (low salesrchase price)
nd (low wer)
ompetition in
quantity
n (low purchase
(low er)
mpetition
26
arket
and 6.2), ower.
s

27
Traders noted that competition was not only high within the market, but across different markets as well. In particular, the assessment found that numerous traders in the commune markets stated that increasing numbers of village shops (including village shops expanding the food items they carry) and mobile traders operating in villages were diverting their customers.
Few traders mentioned that security concerns were a constraint to sales increase. However, traders in markets near the Thai border seemed to be more susceptible to security risks. For example, at Boeng Trakuon Commune market (5 minutes from the Thai border), a trader commented that during politically unstable periods with Thailand she reduces her stock so that she will not risk losing assets if she has to abandon her shop and retreat from the border. At the time of the interview, she had recently reduced her stock due to the perceived potential Cambodian‐Thai conflict regarding Preah Vihear temple.
7 Limitations The survey for this assessment was conducted in five provinces in Cambodia. The provinces visited were selected based on WFP’s programmatic priorities. Markets within the five provinces were selected based on non‐probability and purposive sampling. Therefore, the conclusions based on primary data collection cannot be generalized to all provinces.
However, the results of the survey within each of the five provinces and across the five provinces show little difference. Therefore, the assessment team believes that the results from the primary data can be generalized to provinces with similar features with regard to physical accessibility, market catchment and farming activities (i.e. Kampong Speu, Pursat and Kampong Chhnang).
Primary data collection was conducted in late August and early September, which coincides with the lean season in Cambodia. Although the conclusions drawn from the primary analysis is not expected to change if conducted during the non‐lean season, seasonality must be taken into consideration when interpreting results.
Data collection for secondary data – primarily food commodity wholesale price data from the Ministry of Agriculture (MAFF) and consumer price index data from the National Institute of Statistics (NIS) – is also limited in terms of geography. Mixed rice wholesale prices from MAFF, which were used to conduct most of the price analyses in this report is limited to nine provinces (Kampong Chhnang, Kampong Cham, Takeo, Siem Reap, Prey Veng, Phnom Penh, Kampot, Battambang and Banteay Meanchey).
The consumer price index reported by NIS is based on consumer prices from only Phnom Penh. Since the market integration analysis clearly shows the high level of integration across provinces, the consumer price index can be applied to the nine provinces that the market integration analysis was conducted.
8 Conclusion and recommendations Based on observations and findings on trader behavior, market structure and price behavior, one can conclude that the surveyed markets are functioning. In addition, sufficient food is available on local markets and at macro level, markets (including village shops) are physically accessible, prices follow a

28
predictable seasonal pattern with the exception of the 2008 food price crisis, markets are competitive and integrated, there are no major constraints to market functioning and trade, and traders will be able to sufficiently respond to increase in effective demand on their storage capacities, supply sources, and access to credit. The results are presented below by answering each of the key questions posed at the beginning of this report:
Are markets functioning and physically accessible by targeted households?
• Market conduct in terms of price setting behavior and level of competition clearly show that markets are functioning at all levels. Of the 48 trader surveys conducted, the vast majority – 43 traders – responded that prices are determined by supply costs, an indication that prices are not fixed and individual traders do not have sufficient market share to engage in monopolistic behavior.
• Market performance in terms of price behavior show that apart from the price hike during the food price crisis of 2008, prices are stable and follow a regular seasonal pattern.
• The Cambodia Comprehensive Food Security and Vulnerability Survey (CFSVA) reported that the distance from the market is a serious concern for many rural households. However, this report found that when large markets are far away, village shops and mobile traders play a crucial role in rural villages:
• The market assessment found that a village typically has at least two shops. The further the distance between the village and large markets (i.e. provincial, district or commune markets), village shops would carry a wider range of items.
• The market assessment found that mobile traders – traders selling items on the back of their motorcycles – are quite common in the villages, especially if the village shops do not carry certain items, such as vegetables or meat.
Is appropriate food available in sufficient quantities and at reasonable prices?
• Food availability of the main staple – rice – is sufficient at the national level. Total paddy rice production in Cambodia has been steadily increasing since 2005 – driven by greater cultivated/harvested area and higher yields – and reached a high of 7.6 million metric tonnes in the 2009/10 season. Surplus milled rice was also at an all‐time peak in 2009/10 with 2.2 million metric tonnes.
• The seasonal crop calendar influences the price of the main stable – rice – significantly. The price of rice is highest immediately before the main wet season harvest which typically starts in November. The price drops when the main wet season harvest commences as rice supply increases, and gradually rises throughout the year.
• The market assessment found that key food items (i.e. rice, meat, fish and vegetable oil) are available at the provincial, district and commune markets year‐round. In the village shops, vegetables are usually available but meat and fish are usually available when the distance to the nearest district or commune market is significant.
Are food markets sufficiently integrated so that food will flow to deficit/target zones?

29
• The correlation coefficients between rice prices monitored by the Ministry of Agriculture, Forestry and Fisheries (MAFF) in nine different markets across Cambodia show that there is an extremely high degree of integration between all markets. Key informant interviews during the market survey confirmed this as rice traders in the district, commune and village markets were frequently buying and selling rice across provincial and district borders.
Are the food markets sufficiently competitive?
• When traders were asked what the biggest constraint they faced in increasing sales, 65 percent responded that it was due to lack of demand and 21 percent said it was because of the high level of competition in the market. This result was consistent across market types and food items.
• 90 percent of traders responded that prices are determined by supply costs which indicate that prices in food markets in Cambodia are rarely fixed as individual traders do not have sufficient market power and that there is healthy competition in food markets.
Will traders respond adequately to any increase in effective demand based on their storage capacities, supply sources, required quality and preference of customers, and access to credit?
• 87.5 percent of traders said they have the capacity to deliver if customer demand significantly increased; of the traders who said they have the capacity to deliver, 98 percent said they would be able to deliver within a week.
• 90 percent of surveyed traders said they provide credit to customers and 67 percent said they get supplies on credit from their suppliers.
• 83 percent of surveyed traders said they currently have enough storage space to meet a twofold increase in demand.
Is it unlikely that cash/vouchers will contribute to rising purchase prices?
• It is unlikely that a cash/voucher programme will contribute to rising prices as 92 percent of all traders responded that a twofold increase in the number of customers in the market would have no effect on the price.
Based on the above, implementing a cash and vouchers programme in the surveyed provinces is appropriate from a market perspective20. Given the market conditions, constraints and capacity, it is possible for WFP Cambodia to opt for cash/vouchers modalities in transferring resources in these provinces.
In order to monitor food availability and traders and prices behaviour, WFP should have a better understanding of rice production forecasts and paddy rice border‐trade. In order to continually inform
20 The conclusion in this report that cash and voucher programmes are feasible and appropriate is strictly from a market perspective. From a programmatic point of view, in‐kind transfers can be more appropriate to achieve specific nutrition objectives. Also, the conclusions assume that prices will be relatively stable and therefore in‐kind transfer could be more appropriate during times of extremely volatile price movements.

30
market‐based interventions in Cambodia with up to date data and information, this market assessment should be looked at together with the price and wage monitoring bulletin. The latter can also trigger new market assessments in case of significant changes to the indicators discussed in this report.

31
Annex Annex 1: Map of sampled markets for assessment
Annex 2: Covariance of rice prices within calendar year
Source: WFP market survey (2010)
0.00
0.02
0.04
0.06
0.08
0.10
0.12
0.14
0.16
2005 2006 2007 2008 2009 2010*
cov within year
32
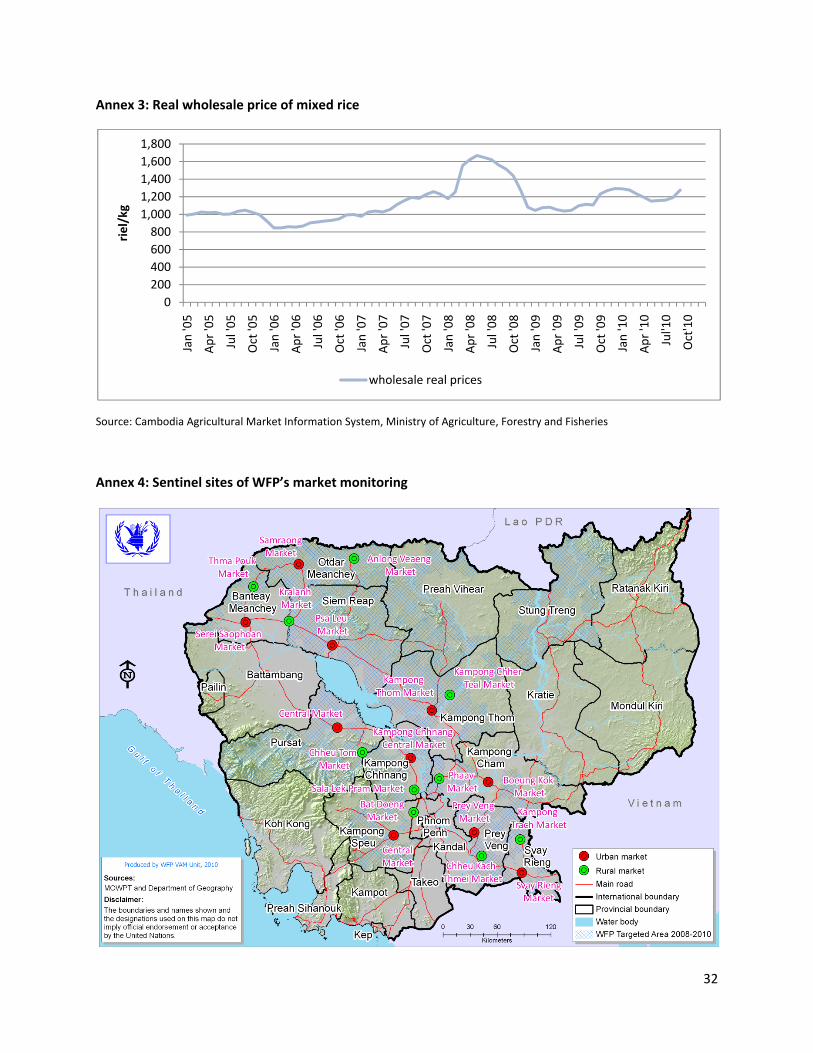
Annex 3: Real wholesale price of mixed rice
Source: Cambodia Agricultural Market Information System, Ministry of Agriculture, Forestry and Fisheries
Annex 4: Sentinel sites of WFP’s market monitoring
0200400600800
1,0001,2001,4001,6001,800
Jan '05
Apr '05
Jul '05
Oct '05
Jan '06
Apr '06
Jul '06
Oct '06
Jan '07
Apr '07
Jul '07
Oct '07
Jan '08
Apr '08
Jul '08
Oct '08
Jan '09
Apr '09
Jul '09
Oct '09
Jan '10
Apr '10
Jul'10
Oct'10
riel/kg
wholesale real prices
33
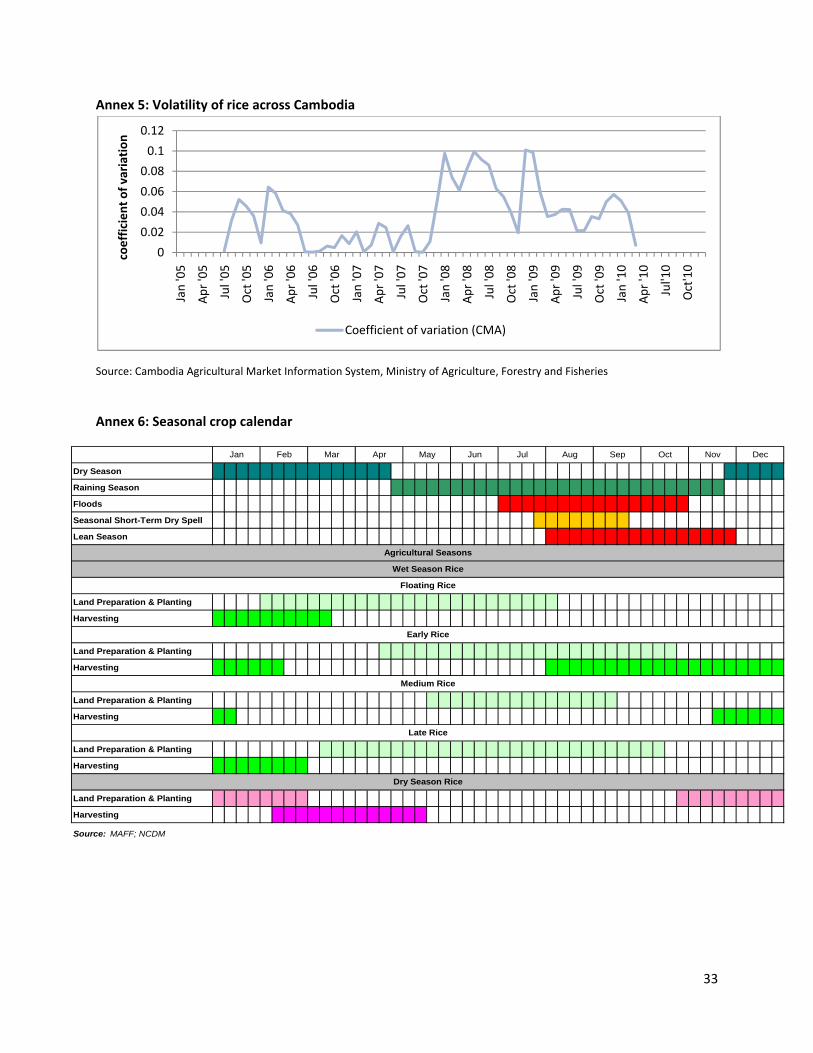
Annex 5: Volatility of rice across Cambodia
Source: Cambodia Agricultural Market Information System, Ministry of Agriculture, Forestry and Fisheries
Annex 6: Seasonal crop calendar
0
0.02
0.04
0.06
0.08
0.1
0.12
Jan '05
Apr '05
Jul '05
Oct '05
Jan '06
Apr '06
Jul '06
Oct '06
Jan '07
Apr '07
Jul '07
Oct '07
Jan '08
Apr '08
Jul '08
Oct '08
Jan '09
Apr '09
Jul '09
Oct '09
Jan '10
Apr '10
Jul'10
Oct'10
coefficient of variation
Coefficient of variation (CMA)
Dry Season
Raining Season
Floods
Seasonal Short-Term Dry Spell
Lean Season
Land Preparation & Planting
Harvesting
Land Preparation & Planting
Harvesting
Land Preparation & Planting
Harvesting
Land Preparation & Planting
Harvesting
Land Preparation & Planting
Harvesting
Source: MAFF; NCDM
Floating Rice
Early Rice
AugJan Feb Mar Apr
Agricultural Seasons
Wet Season Rice
Dry Season Rice
Sep Oct Nov DecMay Jun Jul
Medium Rice
Late Rice

34
Annex 7: Assessment team and schedule <Assessment team>
Provinces Assessment team Prey Veng, Kampong Cham, Kampong Thom Haitham El‐Noush, John Jeong, Yav Long, Chiv
Heng Siem Reap, Banteay Meanchey Haitham El‐Noush, John Jeong, Yav Long,
Sokrathna Pheng <Assessment schedule>
Date Markets visited 26 August 2010 Rakchey market (commune), Prey Veng
Trea market (district), Prey Veng 27 August 2010 Peanea market (commune), Prey Veng
Tanal market (village shop), Prey Veng Khna market (commune), Kampong Cham
28 August 2010 Khor market (commune), Kampong Cham Phaav market (district), Kampong Cham Romdual market (village shop), Kampong Cham
30 August 2010 Kampong Chher Teal market (district), Kampong Thom Krava market (commune), Kampong Thom Cheaung Deaung market (village shop), Kampong Thom
31 August 2010 Stoung market (district), Kampong Thom Kandual market (village shop), Kampong Thom Prey Lean market (commune), Siem Reap
1 September 2010 Cha Chhuk market (district), Siem Reap Srei Snam market (district), Siem Reap Khna market (village shop), Siem Reap
2 September 2010 Boeung Trakuon market (commune), Banteay Meanchey Chamkar Ko market (village shop), Banteay Meanchey Khum Snual market (district), Banteay Meanchey
Annex 8: Questionnaires Both market and trader questionnaires were adapted from the market section of the Emergency Food Security Assessment (EFSA) and Comprehensive Food Security and Vulnerability Assessment (CFSVA) questionnaires. It was field tested twice in Boeung Keng Kang market in Phnom Penh. The questionnaire was translated from English into Khmer by the Cambodia CO national VAM officer (both market and trader questionnaires attached below).
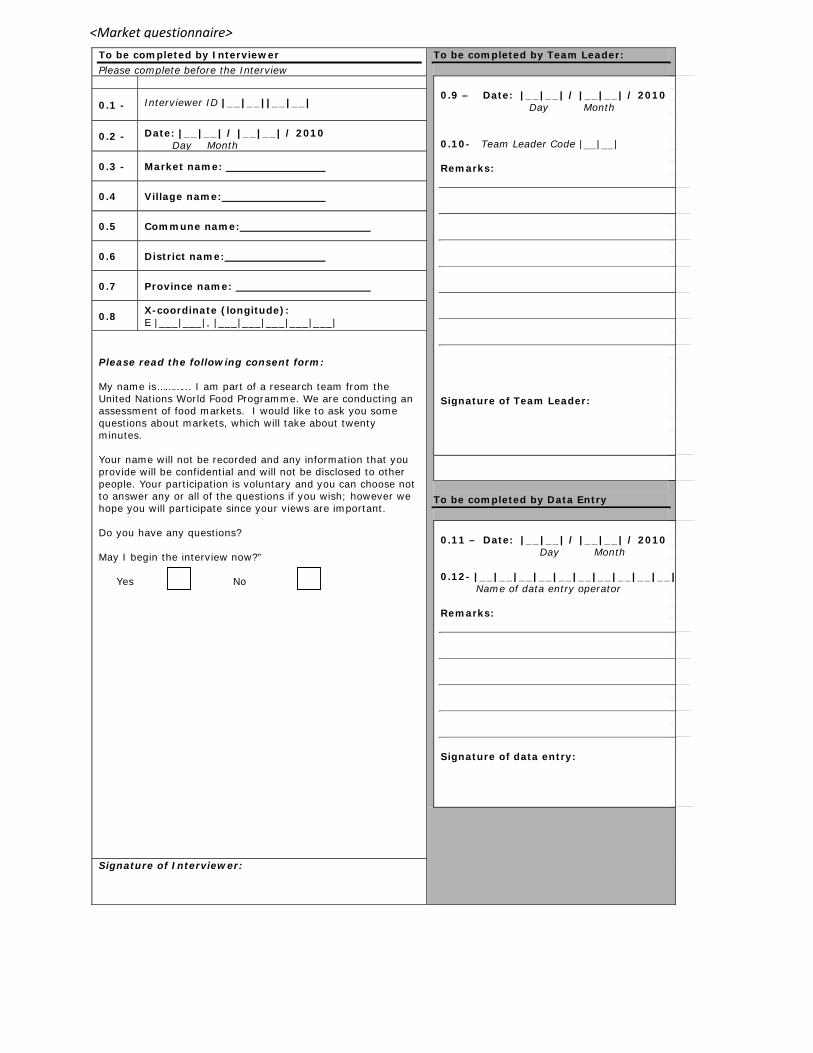
To be completed by Interviewer
Please complete before the Interview
To be completed by Team Leader:
0.9 – Date: |__|__| / |__|__| / 2010 Day Month 0.10- Team Leader Code |__|__| Remarks: Signature of Team Leader:
To be completed by Data Entry
0.11 – Date: |__|__| / |__|__| / 2010 Day Month 0.12- |__|__|__|__|__|__|__|__|__|__| Name of data entry operator Remarks: Signature of data entry:
0.1 - Interviewer ID |__|__||__|__|
0.2 - Date: |__|__| / |__|__| / 2010 Day Month
0.3 - Market name:
0.4 Village name:
0.5 Commune name:
0.6 District name:
0.7 Province name:
0.8 X-coordinate (longitude): E |___|___|, |___|___|___|___|___|
Please read the following consent form: My name is………... I am part of a research team from the United Nations World Food Programme. We are conducting an assessment of food markets. I would like to ask you some questions about markets, which will take about twenty minutes. Your name will not be recorded and any information that you provide will be confidential and will not be disclosed to other people. Your participation is voluntary and you can choose not to answer any or all of the questions if you wish; however we hope you will participate since your views are important. Do you have any questions? May I begin the interview now?” Yes No
Signature of Interviewer:
<Market questionnaire>

SECTION 1 – MARKET AVAILABILITY AND SEASONNALITY
1.a. Is this item normally traded in the
market during this period of
the year? 1 = Yes 2 = No
99 = No answer
1.b. Is this item currently available in the market? 1= Yes 2 = No 99 = no answer
1.c. Compared to the same period one year ago, are market supply and demand low, normal, or high? 1 = Low 2 = Normal 3 = High 99 = no answer
1.d. During which season the item has the highest/lowest availability on the market? 1= Wet season 2= Dry season 99= no answer 88= n/a same throughout the year
What is the current retail price of the item?
What are the changes in prices of the items
compared to the same period one year ago?
1 = Increased 2 = decreased
3 = stayed the same 99 = no answer
Supply
Demand Highest availability
Lowest availability
Units 1.e. Price in kilogram in local currency 88= not available in market 99 = no answer
Units 1.f. Price in kilogram in local currency 88= not available in market 99 = no answer
1.01 Rice [______] [______] [_____] [_____] [______] [______] [______] [______]
1.02 Vegetable Oil [______] [______] [_____] [_____] [______] [______] [______] [______]
1.03 Smoked Fish [______] [______] [_____] [_____] [______] [______] [______] [______]
1.04 Beef [______] [______] [_____] [_____] [______] [______] [______] [______]
1.05 Pork [______] [______] [_____] [_____] [______] [______] [______] [______]
1.06 Fresh Fish [______] [______] [_____] [_____] [______] [______] [______] [______]
1.07 [______] [______] [_____] [_____] [______] [______] [______] [______]
1.08 [______] [______] [_____] [_____] [______] [______] [______] [______]
1.09 [______] [______] [_____] [_____] [______] [______] [______] [______]
1.10 [______] [______] [_____] [_____] [______] [______] [______] [______]
1.11 [______] [______] [_____] [_____] [______] [______] [______] [______]
1.12 [______] [______] [_____] [_____] [______] [______] [______] [______]
1.13 [______] [______] [_____] [_____] [______] [______] [______] [______]
1.14 [______] [______] [_____] [_____] [______] [______] [______] [______]
Item Code
Item
In case the village market not sufficient in meeting the demand (mobile trader use included)
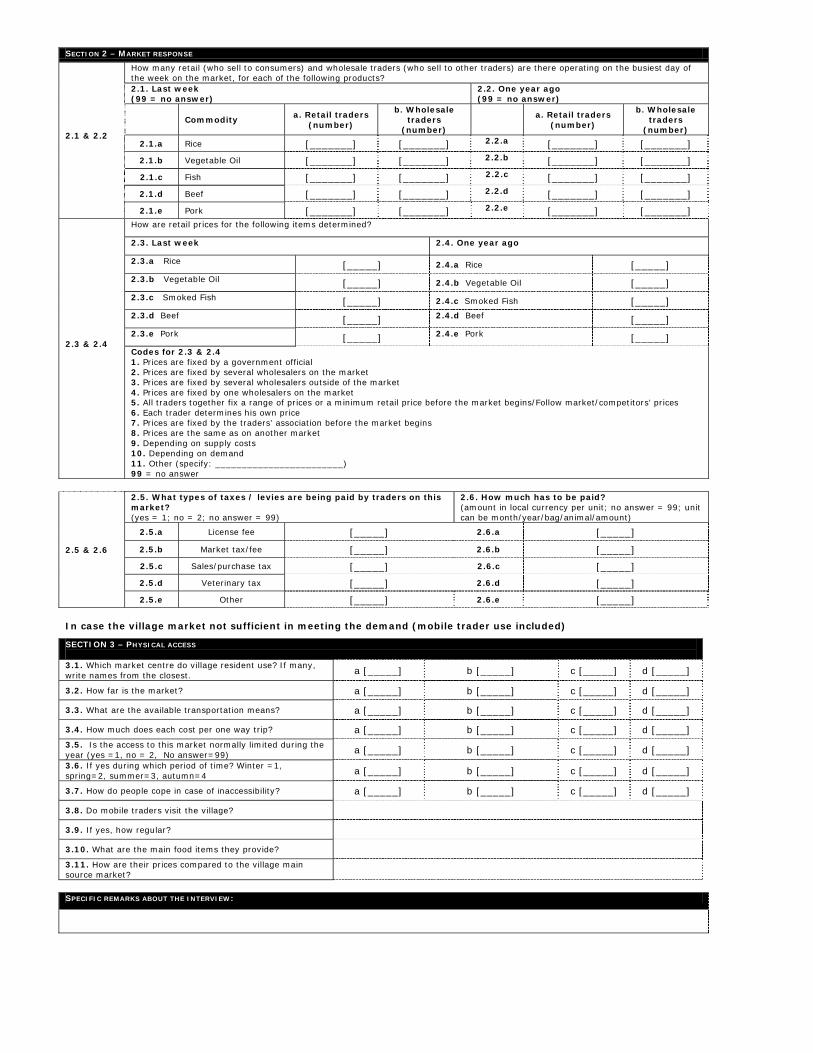
SECTION 2 – MARKET RESPONSE
2.1 & 2.2
How many retail (who sell to consumers) and wholesale traders (who sell to other traders) are there operating on the busiest day of the week on the market, for each of the following products? 2.1. Last week (99 = no answer)
2.2. One year ago (99 = no answer)
Commodity a. Retail traders
(number)
b. Wholesale traders
(number)
a. Retail traders
(number)
b. Wholesale traders
(number)
2.1.a Rice [_______] [_______] 2.2.a [_______] [_______]
2.1.b Vegetable Oil [_______] [_______] 2.2.b [_______] [_______]
2.1.c Fish [_______] [_______] 2.2.c [_______] [_______]
2.1.d Beef [_______] [_______] 2.2.d [_______] [_______]
2.1.e Pork [_______] [_______] 2.2.e [_______] [_______]
2.3 & 2.4
How are retail prices for the following items determined?
2.3. Last week 2.4. One year ago
2.3.a Rice [_____] 2.4.a Rice [_____] 2.3.b Vegetable Oil [_____] 2.4.b Vegetable Oil [_____] 2.3.c Smoked Fish [_____] 2.4.c Smoked Fish [_____] 2.3.d Beef [_____] 2.4.d Beef [_____] 2.3.e Pork [_____] 2.4.e Pork [_____] Codes for 2.3 & 2.4 1. Prices are fixed by a government official 2. Prices are fixed by several wholesalers on the market 3. Prices are fixed by several wholesalers outside of the market 4. Prices are fixed by one wholesalers on the market 5. All traders together fix a range of prices or a minimum retail price before the market begins/Follow market/competitors’ prices 6. Each trader determines his own price 7. Prices are fixed by the traders’ association before the market begins 8. Prices are the same as on another market 9. Depending on supply costs 10. Depending on demand 11. Other (specify: ________________________) 99 = no answer
2.5 & 2.6
2.5. What types of taxes / levies are being paid by traders on this market? (yes = 1; no = 2; no answer = 99)
2.6. How much has to be paid? (amount in local currency per unit; no answer = 99; unit can be month/year/bag/animal/amount)
2.5.a License fee [_____] 2.6.a [_____]
2.5.b Market tax/fee [_____] 2.6.b [_____]
2.5.c Sales/purchase tax [_____] 2.6.c [_____]
2.5.d Veterinary tax [_____] 2.6.d [_____]
2.5.e Other [_____] 2.6.e [_____]
SECTION 3 – PHYSICAL ACCESS 3.1. Which market centre do village resident use? If many, write names from the closest. a [_____] b [_____] c [_____] d [_____]
3.2. How far is the market? a [_____] b [_____] c [_____] d [_____]
3.3. What are the available transportation means? a [_____] b [_____] c [_____] d [_____]
3.4. How much does each cost per one way trip? a [_____] b [_____] c [_____] d [_____] 3.5. Is the access to this market normally limited during the year (yes =1, no = 2, No answer=99) a [_____] b [_____] c [_____] d [_____]
3.6. If yes during which period of time? Winter =1, spring=2, summer=3, autumn=4 a [_____] b [_____] c [_____] d [_____]
3.7. How do people cope in case of inaccessibility? a [_____] b [_____] c [_____] d [_____]
3.8. Do mobile traders visit the village?
3.9. If yes, how regular?
3.10. What are the main food items they provide? 3.11. How are their prices compared to the village main source market?
SPECIFIC REMARKS ABOUT THE INTERVIEW:

38
To be completed by Interviewer
Please complete before the Interview
To be completed by Team Leader:
0.7 – Date: |__|__| / |__|__| / 2010 Day Month 0.8- Team Leader Code |__|__| Remarks: Signature of Team Leader:
To be completed by Data Entry
0.9 – Date: |__|__| / |__|__| / 2010 Day Month 0.10- |__|__|__|__|__|__|__|__|__|__| Name of data entry operator Remarks: Signature of data entry:
0.1 - Interviewer ID |__|__||__|__|
0.2 - Date: |__|__| / |__|__| / 2010 Day Month
0.3 - Market name:
0.4 Village name:
0.5 Commune name:
0.6 District name:
0.7 Province name:
Please read the following consent form: My name is………... I am part of a research team from the United Nations World Food Programme. We are conducting an assessment of food markets. I would like to ask you some questions about markets, which will take about thirty (30) minutes. Your name will not be recorded and any information that you provide will be confidential and will not be disclosed to other people. Your participation is voluntary and you can choose not to answer any or all of the questions if you wish; however we hope you will participate since your views are important. Do you have any questions? May I begin the interview now?” Yes No
Signature of Interviewer:
<Trader questionnaire>

39
Section 1: General characteristics of the trader
1.1 Trader gender [circle one of the numbers
1 Man 2 Woman
1.2 When did you start your trading business? [circle one of the numbers]
1 Less than 1 year ago 2 Between 1-3 years ago 3 More than 3 years ago 99 No answer
1.3 In what type of main trading activity are you involved? [circle one of the numbers]
1 Purchase from traders, sell to consumers (=retailing) 2 Purchase from traders, sell to traders (=wholesaling) 3 Purchase from farmers, sell to traders (=collecting) 4 Other (specify: ) 99 No answer
1.4
Please indicate the most important commodity traded normally by you? [circle three of the numbers, at least one]
1 Rice 2 Vegetable Oil 3 Smoked Fish 4 Beef 5 Pork 99 No answer
[The interviewer should focus on the selected commodity above for the remainder of the interview see
1.5 ] Section 2: Volumes and flows
2.1
Please provide an estimate of the average number of clients to whom you sold the selected commodity during the last week. [check the box]
a. % Men b. % Women
1 . Less than 10
2 . 10 - 20
3 . 20 - 50
4 . More than 50
99 No answer
2.2
Please indicate if this number (see 2.1) is higher, lower or the same level compared to one year ago? [check the box]
1 . Higher
2 . Lower
3 . Same level
99 No answer
2.3
Please indicate if your daily sales of the selected commodity has increased, decreased or stayed the same compared to one year ago during the same period? [check only one box]
1 . Increased
2 . Decreased
3 . No change (please skip to question 2.6)
99 No answer (please skip to question 2.6)
2.4
Please provide the three most important reasons, from the list of options, for the above change? [Please rank 3 reasons from the most important = 1 to the least important =3]
88 Not applicable (if 2.3 = no change or no answer)
1. Better harvest than last year
2 . Worse harvest than last year
3 . More food aid distribution
4 . Less food aid distribution
5 . More demand from other districts
6 . Less demand from other districts
7 . More supply coming from other districts
8. Less supply coming from other districts
9. More demand from consumers in district
10 Less demand from consumers in district
11 Increase in number of traders in the same market
12 Decrease in number of traders in the same market
13 Less capital/credit available for trade
12 More capital/credit available for trade
14 Other (specify: )
99 No answer

40
2.5
If the sales volume is lower (see 2.3), please indicate when the trader expects that sales will recover to the normal level and how they expect this recover (main reason)? [check only one box]
a. When? b. Provide the main reason
88 Not applicable
1 Within one week
2 Within one week to one month
3 Within one month to one year
4 Longer than one year or never
99 No answer
2.6 Where do you usually get supply from? (Check all that apply)
88 Not applicable
1 Own Production
2 Wholesaler in same Market
3 Wholesaler in District/Province
4 Pays for a carrier to bring items
5 Other ------------------------
99 No answer
2.7 How often do you get supplies of main commodities? (Check only one)
88 Not applicable
1 Several times a week
2 Once a week
3 Twice a month
4 Once a month
5 Other ------------------------
99 No answer
2.8
Have there been any changes (e.g. break in supply line, increased supply prices, vary qualities) in your supply over the last year?
1 Yes
If yes, please explain:
2 No
99 No answer
2.9
When do you face supply problems (e.g. break in supply line, increased supply prices, vary qualities)? (Check all that apply)
How does this affect purchase and sale prices?
88 Not applicable
1 Wet season (May-November)
2 Dry season (December-April)
99 No answer
2.10 How do you see supply situation in the coming 12 months? (Circle only one)
1 = Remains the same 2 = Improve 3 = Worsen
Please provide the main reason
Section 3: Constraints and response capacity Analysis Plan, section ‘Market response’ topic 3 & 4 [Questions 3.2-3.4 of this section should only be discussed with the trader IF the selected commodity is an essential food item. If the selected commodity for this interview is a cash crop/product, please pose question 3.1 and proceed to the following section.]
3.1
What are the three most important constraints preventing you to double your turnover of the selected commodity? [Please rank 3 reasons from the most important = 1 to the least important = 3]
1 Lack of own capital
2 Lack of credit / credit is too expensive
3 Supply shortages
4 Low or irregular quantity of produce
5 Lack of means of transport
6 Destruction of road infrastructure / transport cost too high
7 Lack/destruction of storage
8 Low profit margin (low sales price, high purchase price)
9 Lack of demand (low purchasing power)
10 High level of competition in the market
11 Government would not allow me / taxes too high
12 Too much food assistance
13 Other(specify: )

41
3.2
In your opinion, would the sale price of the selected commodity decrease, remain the same or increase if there will be many more customers on this market? [check only one box]
1 . No change a. Provide the main reason:
2 . Decrease
3 . Increase
99 No answer
3.3
If the trader expects an upward pressure on prices (3.2), would this be temporary (until supply has increased) or sustained (for the period of the demand increase)? [check only one box]
88 Not applicable (if 3.2 = no change, decrease or no answer)
a. Provide the main raison:
1 . Temporary
2 . Sustained
99 No answer
3.4
Assume that demand from your (existing or new) clients for the selected commodity would increase, would you have the capacity to deliver? [check only one box]
1 . No a. Provide the main reason:
2 . Yes
99 No answer
3.5 If yes in (3.4), in what time frame? [check only one box]
1 Within a week a. Provide the main reason:
2 Within two weeks
3 Within a month
4 After more than one month
99 No answer
3.6 Have you participated in a voucher project?
1 . No
2 . Yes
99 No answer
Please provide any concerns you have
3.7 Are you willing to participate in a voucher project?
1 No 2 Yes
99 No answer
3.8 Du you own mobile phone? 1 No 2 Yes
3.9 Do you use the mobile phone in trade? 1 No 2 Yes
3.10 Do you use the mobile phone in financial transactions?
1 No 2 Yes
3.11 Du you have bank account? 1 No 2 Yes
Section 4: Credit and stocks strategy
4.1 Do you provide credit to some of your clients? [circle one of the numbers]
1 = yes
2 = no
99 = no answer
4.2
If 4.1 = yes, what share of your total sales is currently in credit? [insert a percentage for credit and one for cash, it should add up to 100%]
Credit:
[____]% of sales
Cash: [____]% of sales
888 = not applicable
999 = no answer
4.3
Have there been any changes in the number of people who have been requesting credit compared to last year during the same period? [circle one of the numbers]
1 = yes,
less people
2 = yes, more people
3 = no, same
number
999 = no answer
4.4 Do you get supplies on credit? [circle one of the numbers]
1 = yes
2 = no
99 = no answer
4.5 Where are the commodities stored? (Circle all that apply)
1- In the same store 2- In additional warehouse 3- In a collective warehouse 4-
Other (specify)
999 = no answer
4.6 What is your storage capacity? (measure in any one option)
MT_______ Bags_______ Square
meter______
999 = no answer
4.7 How long do you store main commodities traded by you?
[_______]weeks
999 = no answer
4.8 Do you have available storage space to meet increased demand by double?
1 = Yes 2 = No
999 = no answer

42
Section 5: Prices and price prospects
5.1 & 5.2
How are retail prices for the following items determined on the market? 5.1 Last week 5.2 One year ago 5.1.a Rice [_____] 5.2.a Rice [_____] 5.1.b Vegetable Oil [_____] 5.2.b Vegetable Oil [_____] 5.1.c Smoked Fish [_____] 5.2.c Smoked Fish [_____] 5.1.d Beef [_____] 5.2.d Beef [_____] 5.1.e Pork [_____] 5.2.e Pork [_____] Codes for 6.1 1. Prices are fixed by a government official 2. Prices are fixed by several wholesalers on the market 3. Prices are fixed by several wholesalers outside of the market 4. Prices are fixed by one wholesalers on the market 5. All traders together fix a range of prices or a minimum retail price before the market begins/Follow market/competitors’ prices 6. Each trader determines his own price 7. Prices are fixed by the traders’ association before the market begins 8. Prices are the same as on another market 9. Depending on supply costs 10. Depending on demand 11. Other (specify: ________________________) 99 = no answer
5.3 & 5.4
What are the current retail prices for the following items? 5.3 Last week 5.4 One year ago 5.3.a Rice (kg) [_____] 5.4.a Rice (kg) [_____] 5.3.b Vegetable Oil (ltr) [_____] 5.4.b Vegetable Oil (ltr) [_____] 5.3.c Smoked Fish (kg) [_____] 5.4.c Smoked Fish (kg) [_____]
5.3.d Beef (kg) [_____] 5.4.d Beef (kg) [_____] 5.3.e Pork (kg) [_____] 5.4.e Pork (kg) [_____]
5.5
In your opinion how will the sales price of the selected commodity evolve in the coming year (12 months)? [check only one box]
Please provide the main reason 1. Increase by less than 50% 2. Increase by more than 50% 3. No change 4. Decrease by less than 50% 5. Decrease by more than 50%
.99 No answer
5.6
If there will be an increase or a decrease in sales prices (see 5.5), what are the three main reasons? [Please rank 3 reasons from the most important = 1 to the least important = 3]
1. Lean season or bad harvest 2. Good harvest 3. More inflows from surplus zones 4. Less inflows from surplus zones 5. More outflows 6. Less outflows 7. More food assistance .8 Less food assistance .9 More cash distribution
10 Less cash distribution 11 Increased demand 12 Decreased demand 13 Other (specify: )
99 No answer
Specific remarks about the interview: