Revision Guide Business - Anforme few businesses still use catalogues and mail-order, like Cotton...
27
-
Upload
truongnguyet -
Category
Documents
-
view
214 -
download
1
Transcript of Revision Guide Business - Anforme few businesses still use catalogues and mail-order, like Cotton...


Revision GuideAS A Level
Business
Alan Hewison
Editor: Nancy Wall

© Anforme Ltd 2016ISBN 978-1-78014-024-7
Images supplied by Shutterstock.com
Anforme Ltd, Stocksfield Hall, Stocksfield, Northumberland NE43 7TN.
Typeset by George Wishart & Associates, Whitley Bay.Printed by Potts Print (UK) Ltd.
Alan Hewison is an experienced teacher and has been a senior examiner of economics
and business for many years. He has been involved with the development of some of
the new economics and business courses and has written several other revision guides and
textbooks.
Nancy Wall was a teacher for the first half of her career. Since 1991 she has worked in
curriculum development, with a particular interest in teaching strategies and classroom
resource development. She is currently reviews editor of ‘Teaching Business and
Economics’, the magazine of the Economics, Business and Enterprise Association. She has
long experience of writing and editing resources for students.

Theme 1 Marketing and people1.1 Meeting customer needs1.1.1 The market . . . . . . . . . . . . . . . . . . . . . . . . . . . . . . . . . . . . . . . . . . . . . . . . . . . . . . . . . . . . . . . . 11.1.2 Market research . . . . . . . . . . . . . . . . . . . . . . . . . . . . . . . . . . . . . . . . . . . . . . . . . . . . . . . . . . . . 61.1.3 Market positioning . . . . . . . . . . . . . . . . . . . . . . . . . . . . . . . . . . . . . . . . . . . . . . . . . . . . . . . . . . 91.2 Market1.2.1 Demand . . . . . . . . . . . . . . . . . . . . . . . . . . . . . . . . . . . . . . . . . . . . . . . . . . . . . . . . . . . . . . . . . . 121.2.2 Supply . . . . . . . . . . . . . . . . . . . . . . . . . . . . . . . . . . . . . . . . . . . . . . . . . . . . . . . . . . . . . . . . . . . 141.2.3 Markets . . . . . . . . . . . . . . . . . . . . . . . . . . . . . . . . . . . . . . . . . . . . . . . . . . . . . . . . . . . . . . . . . . 151.2.4 Price elasticity of demand . . . . . . . . . . . . . . . . . . . . . . . . . . . . . . . . . . . . . . . . . . . . . . . . . . . . 181.2.5 Income elasticity of demand . . . . . . . . . . . . . . . . . . . . . . . . . . . . . . . . . . . . . . . . . . . . . . . . . . . 211.3 Marketing mix and strategy1.3.1 Product or service design . . . . . . . . . . . . . . . . . . . . . . . . . . . . . . . . . . . . . . . . . . . . . . . . . . . . . 231.3.2 Branding and promotion . . . . . . . . . . . . . . . . . . . . . . . . . . . . . . . . . . . . . . . . . . . . . . . . . . . . . . 241.3.3 Pricing strategies . . . . . . . . . . . . . . . . . . . . . . . . . . . . . . . . . . . . . . . . . . . . . . . . . . . . . . . . . . . 281.3.4 Distribution . . . . . . . . . . . . . . . . . . . . . . . . . . . . . . . . . . . . . . . . . . . . . . . . . . . . . . . . . . . . . . . 311.3.5 Marketing strategy . . . . . . . . . . . . . . . . . . . . . . . . . . . . . . . . . . . . . . . . . . . . . . . . . . . . . . . . . . 331.4 Managing people1.4.1 Approaches to staffing . . . . . . . . . . . . . . . . . . . . . . . . . . . . . . . . . . . . . . . . . . . . . . . . . . . . . . . 381.4.2 Recruitment, selection and training . . . . . . . . . . . . . . . . . . . . . . . . . . . . . . . . . . . . . . . . . . . . . 411.4.3 Organisational design . . . . . . . . . . . . . . . . . . . . . . . . . . . . . . . . . . . . . . . . . . . . . . . . . . . . . . . . 431.4.4 Motivation in theory and practice . . . . . . . . . . . . . . . . . . . . . . . . . . . . . . . . . . . . . . . . . . . . . . 461.4.5 Leadership . . . . . . . . . . . . . . . . . . . . . . . . . . . . . . . . . . . . . . . . . . . . . . . . . . . . . . . . . . . . . . . . 501.5 Entrepreneurs and leaders1.5.1 Role of an entrepreneur . . . . . . . . . . . . . . . . . . . . . . . . . . . . . . . . . . . . . . . . . . . . . . . . . . . . . . 531.5.2 Entrepreneurial motives and characteristics . . . . . . . . . . . . . . . . . . . . . . . . . . . . . . . . . . . . . . . 551.5.3 Business objectives . . . . . . . . . . . . . . . . . . . . . . . . . . . . . . . . . . . . . . . . . . . . . . . . . . . . . . . . . . 571.5.4 Forms of business . . . . . . . . . . . . . . . . . . . . . . . . . . . . . . . . . . . . . . . . . . . . . . . . . . . . . . . . . . . 591.5.5 Business choices . . . . . . . . . . . . . . . . . . . . . . . . . . . . . . . . . . . . . . . . . . . . . . . . . . . . . . . . . . . . 621.5.6 Moving from entrepreneur to leader . . . . . . . . . . . . . . . . . . . . . . . . . . . . . . . . . . . . . . . . . . . . 63
Theme 2 Managing business activities2.1 Raising finance2.1.1 Internal finance . . . . . . . . . . . . . . . . . . . . . . . . . . . . . . . . . . . . . . . . . . . . . . . . . . . . . . . . . . . . 642.1.2 External finance . . . . . . . . . . . . . . . . . . . . . . . . . . . . . . . . . . . . . . . . . . . . . . . . . . . . . . . . . . . . 652.1.3 Liability . . . . . . . . . . . . . . . . . . . . . . . . . . . . . . . . . . . . . . . . . . . . . . . . . . . . . . . . . . . . . . . . . . 672.1.4 Planning . . . . . . . . . . . . . . . . . . . . . . . . . . . . . . . . . . . . . . . . . . . . . . . . . . . . . . . . . . . . . . . . . . 692.2 Financial planning2.2.1 Sales forecasts . . . . . . . . . . . . . . . . . . . . . . . . . . . . . . . . . . . . . . . . . . . . . . . . . . . . . . . . . . . . . 732.2.2 Sales, revenue and costs . . . . . . . . . . . . . . . . . . . . . . . . . . . . . . . . . . . . . . . . . . . . . . . . . . . . . . 742.2.3 Break-even . . . . . . . . . . . . . . . . . . . . . . . . . . . . . . . . . . . . . . . . . . . . . . . . . . . . . . . . . . . . . . . . 752.2.4 Budgets . . . . . . . . . . . . . . . . . . . . . . . . . . . . . . . . . . . . . . . . . . . . . . . . . . . . . . . . . . . . . . . . . . 772.3 Managing finance2.3.1 Profit . . . . . . . . . . . . . . . . . . . . . . . . . . . . . . . . . . . . . . . . . . . . . . . . . . . . . . . . . . . . . . . . . . . . 812.3.2 Liquidity . . . . . . . . . . . . . . . . . . . . . . . . . . . . . . . . . . . . . . . . . . . . . . . . . . . . . . . . . . . . . . . . . . 852.3.3 Business failure . . . . . . . . . . . . . . . . . . . . . . . . . . . . . . . . . . . . . . . . . . . . . . . . . . . . . . . . . . . . 892.4 Resource management2.4.1 Production, productivity and efficiency . . . . . . . . . . . . . . . . . . . . . . . . . . . . . . . . . . . . . . . . . . 912.4.2 Capacity utilisation . . . . . . . . . . . . . . . . . . . . . . . . . . . . . . . . . . . . . . . . . . . . . . . . . . . . . . . . . . 952.4.3 Stock control . . . . . . . . . . . . . . . . . . . . . . . . . . . . . . . . . . . . . . . . . . . . . . . . . . . . . . . . . . . . . . 972.4.4 Quality management . . . . . . . . . . . . . . . . . . . . . . . . . . . . . . . . . . . . . . . . . . . . . . . . . . . . . . . . 1002.5 External influences2.5.1 Economic influences . . . . . . . . . . . . . . . . . . . . . . . . . . . . . . . . . . . . . . . . . . . . . . . . . . . . . . . . . 1032.5.2 Legislation . . . . . . . . . . . . . . . . . . . . . . . . . . . . . . . . . . . . . . . . . . . . . . . . . . . . . . . . . . . . . . . . 1092.5.3 Competition and market size . . . . . . . . . . . . . . . . . . . . . . . . . . . . . . . . . . . . . . . . . . . . . . . . . . 112
Answers . . . . . . . . . . . . . . . . . . . . . . . . . . . . . . . . . . . . . . . . . . . . . . . . . . . . . . . . . . . . . . . . . . . . . . . . . . . . . . . . 114
Glossary . . . . . . . . . . . . . . . . . . . . . . . . . . . . . . . . . . . . . . . . . . . . . . . . . . . . . . . . . . . . . . . . . . . . . . . . . . . . . . . . 115
Index . . . . . . . . . . . . . . . . . . . . . . . . . . . . . . . . . . . . . . . . . . . . . . . . . . . . . . . . . . . . . . . . . . . . . . . . Inside back cover
Contents
iii

Almost all of the questions in the exam will require you to use your knowledge of the subject. You will haveto think about a real world situation and apply what you have learnt. Take a look at the assessmentobjectives for Edexcel’s A level Business…
AO1 Demonstrate knowledge of terms, concepts, theories, methods and models to show an understanding of how individuals and organisations are affected by and respond to business issues 20-22%
AO2 Apply knowledge and understanding to various business contexts to show how economic agents are affected by and respond to issues 22-24%
AO3 Analyse issues within business, showing an understanding of the impact on individuals and organisations of external and internal influences 28-30%
AO4 Evaluate qualitative and quantitative evidence to make informed judgements and propose evidence-based solutions to business issues 26-28%
These assessment objectives give you a good idea of what examiners are looking for. An answer consistingsolely of bits and pieces of information that you revised in the last few weeks before the exam will not geta good mark.
Quantitative skillsThe specification requires you to show evidence of quantitative skills. This means that you will be requiredto use diagrams and calculations as well as interpreting numerical and graphical data. A full list can befound in Appendix 3 of the specification.
Command words – these are important and tell you what to do with the question.
What is meant by? – (2 marks) – these are definitions and you must learn them!
Using the data – (4 marks) – this means that there will be a question testing your quantitative skills whichmight be a diagram or a calculation.
Explain – (4 marks) tell the examiner what could or will happen as a result of the specific situation appearingin the question. Use the jargon – the technical words you have learnt.
Assess – (8 & 10 marks) – tell the examiner what the advantages and disadvantages of something are,explain the significance of cause and effect. Then draw a conclusion or judgement and support it withappropriate argument, using any evidence you have been given or can remember.
Evaluate – (20 marks) – Involves the same skills as ‘Assess’ but requires you to go into greater depth anddetail, these questions appear at the end of the papers.
Don’t forget to refer to the context. This is all about your relating your answer to the question. Answersthat are textbook perfect, but could be about any business or situation, lack context and will not reach thehigher levels of the mark scheme.
This book helps you to be ready for this by reminding you to revise relevant earlier work. It also cross-references some ideas, in case you need to revise something crucial to what you are reading now. Makingthese links will help you.
Remember to…� Read the evidence carefully.� Look for the ‘command’ words.� Try to use the proper terms and concepts.� Use the context of the question in your answer.� If it says assess or evaluate, make sure that you do! Too many candidates throw marks away each year
by not doing this.
Good luck everyone.
Using this book

1.1.1 The market
A market is any medium in which buyers and sellers interact and agree to trade at a price.
Markets are not necessarily found in specific locations. Many markets are virtual; buyers and sellers interactbut do not meet face to face. A few businesses still use catalogues and mail-order, like Cotton Traders.
A competitive market:
� creates a space where businesses can sell their products to customers and customers can see what is onoffer.
� provides valuable signals to businesses, showing what price they can get and how much they can sell.
� determines what actually gets produced in an economy.
� provides signals for businesses that show them the opportunities available.
Mass markets and niche markets
Markets are immensely varied in nature. Old fashioned outdoor markets have existed for thousands ofyears, selling fresh food of all kinds – the one in Cambridge hasn’t changed much since the town wasestablished. At the other extreme are global markets, relying on on-line or telephone communication.
Niche markets can develop where a business identifies a small market with specific needs forspecialised products or services. For example, there is a niche market for soap products that do noecological damage.
A mass market is a very large market where most people will tend to buy the same or similarproducts. Mass marketing involves each business in providing a standardised product, aimed at alarge group of consumers with the same needs and preferences. Think of laundry detergents.
A mass market A niche market
� Involves a large proportion of the population. � Is much smaller than a mass market.
� Is the largest group of consumers for a � Has a specialised or specific type of product or service within the market. product or service.
� Customer preferences tend to be similar for � Is identified with a particular marketlarge groups of people. segment.
� The product or service is usually standardised � Prices tend to be high and there is often and heavily promoted. a close link between buyer and seller.
� The product will be widely available and � Promotion is likely to be specifically well-known. targeted at the niche customer.
� Compared to mass market products, sales will be relatively low.
Many markets have both mass market producers and niche producers. For example, Primark and H&M aimat the mass market for inexpensive clothes, while the various fashion designers cater for niche markets,consisting of small numbers of wealthy buyers who want to wear distinctive clothes that few others canafford.
1
Competitivemarkets
Standardisedproducts
Theme 1: Marketing and people
Meeting customer needs1.1

Think!Describe two other products or markets where both mass and niche production occurs.
Mass market Niche market
Advantages � Mass producers have many customers, � Less competition in some markets.a standardised product and high sales
� Meeting customer needs may berevenues.
easier; they get exactly what they� They can use their profits to expand want.
output further, increasing market � Increased loyalty and repeat
share.purchases.
� Mass production usually means lower � May be more flexible; may respond
production costs so lower prices.quickly to changes in the market.
Disadvantages � Competition may be stiff. � There is little room for expansion.
� Being price competitive reduces � Vulnerable to economic downturnsprofit margins. and changes in consumer tastes.
� High advertising and promotional � Successful niche producers can becosts may reduce profitability. taken over by bigger businesses.
eCommerce or etailing has opened up many new niche markets. Some businesses might have been unawareof potential niche customers and even if aware, unsure how to reach them. Now, on-line selling strategiesaimed at global niches can make business in small markets very profitable.
Market size and market share
Market size can be measured either by value (sales revenue) or volume – the actual number ofitems sold.
Businesses that want to make a profit enter promising markets and sell to as many customers as they can.If they are meeting a need and their products are either better or cheaper than competing products, theywill become increasingly successful and will grow in size (probably both in volume and value terms). Ofcourse businesses can succeed without increasing volume, just by improving the product and chargingmore.
Profits can be used to increase market share, by:
� attracting more customers with keen prices.
� developing their products so that they are perceived as superior to competing products.
� offering services that are attractive – including good customer service that enhances their reputations.
Market share means, literally, the amount sold by a single business as a percentage of the totalmarket for the product concerned.
When a market is growing, all businesses within it can grow and maintain their market share. If the marketis more or less fixed in size (e.g. the market for bread) then individual businesses that want to grow will haveto work out how to expand their market share.
Business growth often involves developing a distinctive product that acquires a reputation for quality orgood value. One way of doing this is to give the product a brand name that will encourage customers tochoose it over the competing products in the market. Brands are covered in more detail on pages 24-28.
Revision Guide to AS and A Level Business
2
eCommerce
Market share

Dynamic markets
Some markets are quite stable and change little over time. The market for Kelloggs cornflakes has changedvery little, although there are far more competing products than there were when they were invented in1894. Market size and market share do not change much and there is little innovation. Other markets arefar more dynamic, subject to rapid and continuous changes.
Dynamic markets are constantly changing. Buyers may choose to buy less of one product andmore of another. This may be due to rising incomes, fashions, fads or the arrival of a superiorcompeting product offered by another business and giving better value for money. Sellers find salesrising or falling, depending on what else is available in the market or what technological changesare occurring. There may be shocks – weather events or new discoveries that alter the marketdramatically.
All businesses must adapt to the changing nature of their markets. If they do not, they are likely to get leftbehind and lose competitiveness. Ultimately falling sales will cause businesses to exit the market.
� New businesses emerge when new technologies or design techniques make it possible to invent newproducts or cheaper substitutes.
� Sellers respond to buyers’ changing needs by improving existing products and services or introducing newones. For example, demographic factors can cause needs to change.
� Sellers also respond to other sellers’ changes in order to stay competitive.
� Some businesses expand by diversifying – adding to their product ranges to meet needs in new ordifferent markets.
Some markets are more dynamic than others. Most high-tech products have rapidly changing markets.New ways of distributing products can also have a significant impact.
Think!There used to be a mass market for CDs. This market has shrunk very far and very fast. Explain howmusic streaming has affected a range of markets in recent years. Alternatively, use a flow chart tohelp explain your answer.
Online retailing
Online retailing is growing fast. During 2015 it increased by 18% in the UK, and by 13% in the USA. Itaffects most European economies as well.
� Many businesses, both new and established, offer consumers access to a huge range of goods andservices. This growth would have been impossible without new technologies and the digital economy.
� Some products have become cheaper because they are distributed more efficiently on-line than viatraditional retail outlets.
� Many on-line retailers look for profits by cutting costs and operating efficiently rather than raising prices(Amazon is a good example.)
� Information is easier to obtain through price comparison sites and consumer publications, or just bydoing a thorough web search. Sometimes these expose potentially bad deals.
� By giving access to markets and providing numerous channels that connect buyers and producers allover the globe, online retailing has transformed the retail and the business world.
The digital economy includes all those areas of the economy that are affected by the developmentof computer hardware and software, ICT networks (including social media) and online marketing. Inshort, it means everything that is affected by digital technologies.
Revision Guide to AS and A Level Business
3
Marketchange
Adaptation
The digitaleconomy

New technologies and innovations of all kinds lead to new and improved products.
Consumerdemand
InnovationGovernmentintervention
Competition
Market forces
Competition
4
Revision Guide to AS and A Level Business
How markets change
� Changes in supply and demand generate market forces that affect both buyers and sellers. Businessesare constantly trying new ways to attract customers.
� Buyers are constantly looking for the best bargain – the product or service that gives them the most bangfor their bucks.
� These pressures affect business to business trading (B2B) as well as consumers and retailers.
Many factors drive change in the market.
� Consumers’ needs and preferences change over time and in response to social trends.
� New technologies and innovations of all kinds lead to new and improved products.
� Governments intervene, creating rules and regulations that affect markets.
� Competition drives businesses forward as they try to at least maintain sales levels and market share.
Forces for change
Innovation and market growth
Innovation means bringing a new idea into being and using it, either to:
� create a new product or improve an older one.
� or find new and cheaper or better ways of making a product and bringing it to the market.
Businesses do this to gain sales or to reduce costs and always hope to grow the business. New or improvedproducts can appeal to consumers and increase sales but they can also create whole new markets that growrapidly.

Lower prices
Better quality
More choiceCompetition
Innovation
Greater efficiency
Process innovation
Marketing
Efficiency
5
Revision Guide to AS and A Level Business
Product innovation occurs when new technologies make it possible to create completely newproducts or to improve the quality of existing ones.
Process innovation means using new technologies to improve production methods, so that costsare reduced. The change is often invisible to consumers, who may only notice a resulting price cut.Price cuts can create a larger market. Some businesses will innovate to cut costs and make moreprofit, keeping prices the same.
Process innovations change the way things are produced; they also affect many other areas such asdistribution channels, stock control systems and supply chains. (A supply chain is the sequence of processesthat eventually leads to a finished product.) Many businesses have to innovate to survive in a competitivemarket.
Adapting to change
Businesses must keep in close touch with their markets if they wish to survive. Successful businesses needa range of tactics and strategies to deal with the changes in the market. A new, successful competitor inthe market might cause established businesses to:
� cut prices or improve quality, or
� diversify into different markets, or both.
Developing market research efforts, spending more on research and development (R&D), investing ininnovative design and vigorous marketing may all have a part to play in adapting to change.
Marketing is the action or process of promoting and selling products or services, including marketresearch and advertising. It is how the business connects to its customers.
How competition affects markets
Competition affects many businesses and if it intensifies, they must act. Rival businesses compete for marketshare but all businesses compete for consumers’ spending as they make choices about what to buy. Marketorientation is an essential element for many businesses: they must use their market research efforts to gaina very clear understanding of both customer preferences and competing products. (More on marketorientation on page 6.)
� In a competitive market businesses compete with each other to make sales to customers. The need tocut costs makes them more efficient; they can cut prices and consumers benefit.
� Competition also benefits customers by giving them more choice, innovative products and improvementsin quality and reliability.
� As efficiency increases, the economy grows. Productivity increases and businesses become morecompetitive internationally. Exports rise and growth is assured. (If you need to revise productivity, go topage 92.)
Businesses that can adapt quickly will develop acompetitive advantage and flourish in dynamicmarkets. Those that cannot keep up will seesales falling and begin to make losses. In timethey will reduce production and eventually exitthe market. (More on competitive advantage onpages 10-11.)
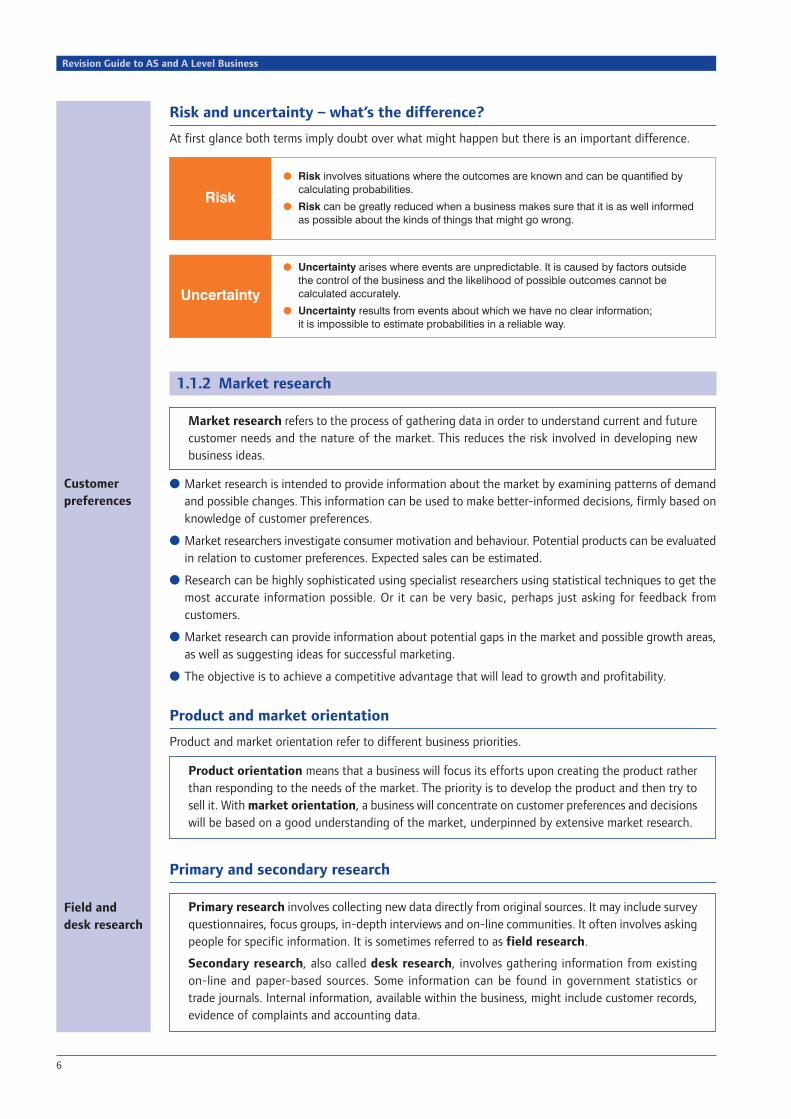
Risk and uncertainty – what’s the difference?
At first glance both terms imply doubt over what might happen but there is an important difference.
1.1.2 Market research
Market research refers to the process of gathering data in order to understand current and futurecustomer needs and the nature of the market. This reduces the risk involved in developing newbusiness ideas.
� Market research is intended to provide information about the market by examining patterns of demandand possible changes. This information can be used to make better-informed decisions, firmly based onknowledge of customer preferences.
� Market researchers investigate consumer motivation and behaviour. Potential products can be evaluatedin relation to customer preferences. Expected sales can be estimated.
� Research can be highly sophisticated using specialist researchers using statistical techniques to get themost accurate information possible. Or it can be very basic, perhaps just asking for feedback fromcustomers.
� Market research can provide information about potential gaps in the market and possible growth areas,as well as suggesting ideas for successful marketing.
� The objective is to achieve a competitive advantage that will lead to growth and profitability.
Product and market orientation
Product and market orientation refer to different business priorities.
Product orientation means that a business will focus its efforts upon creating the product ratherthan responding to the needs of the market. The priority is to develop the product and then try tosell it. With market orientation, a business will concentrate on customer preferences and decisionswill be based on a good understanding of the market, underpinned by extensive market research.
Primary and secondary research
Primary research involves collecting new data directly from original sources. It may include surveyquestionnaires, focus groups, in-depth interviews and on-line communities. It often involves askingpeople for specific information. It is sometimes referred to as field research.
Secondary research, also called desk research, involves gathering information from existing on-line and paper-based sources. Some information can be found in government statistics or trade journals. Internal information, available within the business, might include customer records,evidence of complaints and accounting data.
Revision Guide to AS and A Level Business
6
Customerpreferences
Field anddesk research
� Risk involves situations where the outcomes are known and can be quantified bycalculating probabilities.
� Risk can be greatly reduced when a business makes sure that it is as well informedas possible about the kinds of things that might go wrong.
Risk
� Uncertainty arises where events are unpredictable. It is caused by factors outsidethe control of the business and the likelihood of possible outcomes cannot becalculated accurately.
� Uncertainty results from events about which we have no clear information; it is impossible to estimate probabilities in a reliable way.
Uncertainty

Primary research Secondary research
Advantages � Can be designed to meet exact � Hard work already done by needs. someone else.
� Information is relevant and up to � Easy and cheap to collect.date.
Disadvantages � Can be expensive and time � May not fit the exact needs of theconsuming. business.
� Care must be taken to avoid errors. � May be out of date or inaccurate.
Uses of market research include:
� understanding the market and customer preferences.
� finding out about competing products.
� quantifying potential demand and likely sales levels.
� working out a price level that will attract purchasers and cover costs of production.
� judging the success or otherwise of individual products and services.
� increasing profit and reducing the risk of losses.
� developing and maintaining a competitive advantage.
Quantitative and Qualitative research
Quantitative research involves the analysis of numerical data, and generates estimates of futuresales levels. For example, a cruise operator might want data on the growth of passenger numbersover the past five years. Quantitative research may use sampling and questionnaires to get therequired data.
Qualitative research is directed towards discovering customers’ genuine opinions of the variousproducts available. The focus is on attitudes and reactions to specific products. Online communitiesmay be good sources of information but focus groups can be important too. The objective is tounderstand customer behaviour.
Sampling and bias
Gathering data from individuals is expensive so surveys often involve sampling. This means consulting agroup of people that will be representative of the target market. The sample size must be large enough toreflect variations in individual responses reasonably accurately. It must include a range of people fromspecific groups, balanced according to gender, age, perhaps also income, location and so on. If the sampleis too small, bias may occur and information will be inaccurate.
Bias can occur if the sample includes a disproportionate number of people from a particular marketsegment.
Limitations of market research
� Market research can only give accurate results if the questions that are asked are well designed and donot lead the interviewee in a particular direction.
� Samples must be big enough to be representative of the target market but not so big that they becomevery costly.
Revision Guide to AS and A Level Business
7
Competitiveadvantage
Sample size

� The sample must not be biased in terms of representation and should be relevant to the marketconcerned.
� Market research is particularly tricky in foreign markets; businesses need well-trained local people tohelp them and this can be costly.
� Some markets are so dynamic that market research data is out of date before it can be put to use.
� It may be necessary for all departments to have an understanding of market research so that itsimplications are fully understood.
Use of ICT to support market research
� Primary research can be obtained from digital communities created on Facebook or Twitter. Sometimesproduct-specific on-line communities are created in order to provide information and promote theproduct.
� Online surveys and questionnaires can be useful although care must be taken to avoid bias.
� Businesses can create databases using on-line information gathered during the purchase process. Thisgenerates valuable information on customer behaviour and preferences.
� It also allows the business to keep in touch with existing customers, those likely to have brand loyalties.Feedback from customers is often valuable.
� Supermarkets’ loyalty cards provide substantial information about customer habits.
Market segmentation
It is unlikely that one product will satisfy all consumers in the market.
� Markets are split up into groups of consumers that have similar wants and needs.
� Each group of consumers forms a target market and is identified by the process of market segmentation.
Market segmentation refers to the way markets can be divided up into segments, each of whichhas different customer preferences. Product specifications and marketing strategies can be designedto fit the preferences of each market segment.
Markets can be segmented by socio-economic grouping, income, age and gender, size and composition ofcustomer households, ethnicity and/or religion, educational background of customers, or hobbies andinterests.
Think!Think of three different market segments that you yourself might be said to belong to. For eachsegment, identify a product that you possess. Or if you prefer, do this for someone you know well.Lastly, think about whether you might move out of one market segment and into another, and thinkabout the likely cause for this. If you can, identify market segments that to some extent reflect yourpersonal values, your lifestyle and your career plans.
� Segmentation means that a business can design products to meet the needs of groups with distinctivepreferences.
� Some market segments will be associated with niche markets where there is usually less competition; itmay be possible to charge a premium price.
� Within market segments, individuals are likely to get exactly what they want. This may enhance brandloyalty and lead to repeat purchases.
Revision Guide to AS and A Level Business
8
Onlinesurveys
Niche markets

But…
� Producing for specific market segments can raise production costs and prices.
� Ideally, the business will want to identify a market segment that has not previously been catered for,which then grows quickly. But selling in a whole range of markets may be costly.
� Targeting a mass market and cutting costs by focusing on a single standardised product may be moreprofitable.
1.1.3 Market positioning
Market positioning examines customers’ views on individual products or brands, in relation toeach other. This may involve variations in price or quality, style or technical features. Market researchcan reveal customer perceptions of a range of competing products.
� Market positioning helps businesses to design a product that fits the preferences of a target market,preferably one that is not particularly well catered for by other suppliers.
� Consumers in different market segments will prioritise different features. If a business can find and targeta gap in the market and design its product for the neglected market segment, it will face relatively littlecompetition.
� Businesses can choose whether to follow the competition with a similar (me-too) product or to create adifferent image for their product. A business that has found a gap in the market differentiates itsproduct so as to fill that gap.
� Alternatively, it may pay to follow the market leader and stay in the mass market. Samsung createdsmartphones that were, in many ways, similar to Apple iPhones but rather cheaper. Miele did well bytrading on the strength of its performance and reliability, charging more but achieving a strong reputationfor its white goods.
Product differentiation occurs when each business creates a distinctive product. This may involvegiving it unique features in order to attract customers, or it may involve changing perceptions as tothe function of the product. Branding may be an important part of this.
A distinctive product may secure brand loyalty andthere may be few reasons to change. Alternatively,some businesses reposition their products in orderto give them a new lease of life. (Think of extensionstrategies, page 34.)
ExampleFor a long time, elderly men in Ireland werethe main drinkers of Guinness. Inevitablysales were falling. The company decided toreposition the drink; quality was improvedand the serving temperature reduced.Marketing was aimed at younger people and women. The new approach was startedin the Irish market, and worked. So thecompany decided to promote Guinness inBritain. That worked too. Now there is anIrish pub somewhere to be found in mostcities, all over the world. A product whichwas once flagging looks safe for the future.
Revision Guide to AS and A Level Business
9
Targetmarkets
Productdifferentiation
Repositioning

Market mapping
A market map is a tool that plots brands in the market according to how they meet customers’needs. It illustrates the way a business may position its individual products effectively within thewider market.
On a market map, the grid shows two market features, such as price and quality (as in the diagram) or priceand customer age. Individual brands or businesses are placed on the grid to show potential niches or gapsin the market. It helps to position products in relation to each other.
Market mapping can help in the design of a product or product range. The objective is to create a productthat will either appeal to many customers in a mass market or meet very specific preferences in a nichemarket. Price and product features will both be important. The end result will be a differentiated product.
Advantages of market mapping Disadvantages of market mapping
Enables a business to spot gaps in the market. Can be hard to categorise some products and services.
Can help a business to differentiate its product Identifying a gap does not mean there is afrom the competition. need for a product to fill it. More research
must be done, to establish profit potential.
Competitive advantage, adding value and differentiating products
Competitive advantage means having an edge over rival products. It may be based on low costsand keen prices, or an innovative design feature, or a reputation for reliability or good customerservice. Product differentiation often plays a part in this.
In the business world, everyone is working to achieve a competitive advantage. Without this, sales will falland losses will rise. An obvious solution is to cut costs, improve efficiency and compete on price to attractcustomers. For example, the business can:
� invest in new technologies, with appropriate training schemes.
� improve relationships with employees and suppliers.
� improve the product itself and its image by changing the marketing strategy.
Revision Guide to AS and A Level Business
10
Gaps in themarket
Efficiency
High Quality
Low Quality
Low Prices High Prices

Value for money may be based on a low price or a reputation for quality. Adding value may achieve qualityby making the product more useful, reliable or desirable. Businesses can:
� introduce completely new products or re-design existing ones.
� target product reliability or customer service with staff training.
� produce a consistently reliable branded product that will sell for more than an anonymous, basic onewould.
Adding value is when a business increases the worth customers place on a product by improvingit or creating a fresh image. This allows them to charge more. It is the difference between the sellingprice and the costs involved in production or delivery of a service.
Businesses that enhance their competitive advantage by cutting prices or adding value to the productare likely to be able to sell more. Sometimes adding more value allows them to raise prices too. Making aproduct or service distinctive can help:
� A brand image may become associated with technical excellence or appealing design features.
� Competitive advantage applies to services as well as manufactures. It is easy to see how better stafftraining might improve the services offered in a hotel or a fitness centre.
Product differentiation means that each product is carefully designed to be in some way a little differentfrom competing products. Some products will suit a mass market but many will be designed precisely tomatch the needs of a particular market segment. Branding may help to generate customer loyalty.
Individual businesses may differentiate within their own product range but they will be especially carefulto distinguish their products from those of other businesses. Each business hopes to cater for as manydifferent market segments as possible. Unique selling points (USPs) can be important – these are featuresthat no competing product can match.
ExampleStarbucks designed a brand that created a distinctive context for coffee drinkers. In fact, theybrought coffee shops back into fashion, actually changing the culture by encouraging customers tomeet friends in their shops. They helped to grow the market for coffee shops generally and maywell have played a part in the closure of many pubs.
Although Starbucks has imitators, their USP still helps to keep customers loyal.
Competitive advantage, adding value, market segmentation and product differentiation are all very closelylinked. To achieve a competitive advantage:
� businesses can add value, using their resources to improve or market a product.
� find the market segments where their products will sell best.
� create further added value by differentiating their products to suit as many potential customers aspossible.
� strive to use their resources efficiently, so as to keep costs and prices down, adding a further competitiveadvantage.
Product differentiation can be achieved in very many ways. Design, quality, reliability and customer servicecan all be important. Businesses may find that changing fashions, or the activities of competing companies,have taken demand away from them. Having distinctive product ranges, with a reputation for giving valuefor money, can ensure survival if they can also adapt swiftly to change.
Try thisWhat happens if a competing company comes up with a much better product? What will the rest ofthe businesses in the industry have to do to survive? You may find it helps to consider a particularmarket, e.g. sources of recorded music or a product you think of for yourself.
Revision Guide to AS and A Level Business
11
Adding value
Adapting tocompetition

Market1.2
Price
QuantityQ1
P1
P2
Q2
Demand
Inverserelationship
12
Markets can be real or virtual, small or global. Their key characteristic is that buyers and sellers followingtheir own interests create market forces that determine both the price and quantity sold of a good or service.
� Buyers – are all those people or organisations that want to purchase something; they create the demandfor goods and services.
� Sellers – are all those people or organisations that want to sell something; they create the supply ofgoods and services.
1.2.1 Demand
Demand refers to the amount of a product that customers will want and be able to buy at a rangeof different prices. If the is price is high, quantity demanded will be lower and vice versa.
Market demand is the total of all individual demands for a product. (NB demand must be effective; acustomer may want something but unless she or he can pay for it at the asking price, there will be no sale.)
Price and demand
Price and quantity demanded are inversely related. This means that if the price goes up, the quantitydemanded will go down and vice versa.
As price (P) rises↑, quantity demanded (Q) falls↓.
As price (P) falls↓, quantity demanded (Q) rises↑.
The demand curve
A demand curve is a graphical representation of the relationship between quantity demanded andprice for a product or service. Note that the curve is often shown as a straight line.
Figure 1: The demand curve
The diagram shows a demand curve; as theprice rises from P1 to P2, quantity demandedfalls from Q1 to Q2.
A change in price causes a movement along the demand curve. Lower prices mean that consumers wantto buy more of the product; higher prices mean the opposite, consumers buy less of the product.
Factors leading to a change in demand
A range of other factors may cause a change in quantity demanded, besides price. Something can happento make consumers want more or less of a good even though the price remains the same. This means

Price
Quantity0
When there isa decrease inquantity demanded,the demand curvewill shift to the left
When there is anincrease in quantitydemanded, thedemand curve willshift to the right
Substitutes are products that are similar, so if the price of a substitute increases,the demand for the original product increases. If the price of a substitutedecreases, the demand for the original product decreases.
Change in the price of a substitute
Complements are products that are normally consumed together. If the price ofa complement decreases, demand for the original product will increase. If theprice of a complement increases, the demand for the original product willdecrease.
Change in the price of
a complement
If consumer incomes rise, demand for most goods and services will rise too. If incomes decrease, so too will the quantity demanded.
Change in consumerincomes
Fashions and fads come and go. If the preference for a particular productincreases, then more will be demanded, if the preference decreases less will bedemanded.
Fashions,tastes and
preferences
Advertising can make us all buy more of something i.e.lead to an increase indemand. Branding does the same, a strong brand will increase demand.
Advertisingand branding
As population increases or decreases so too does the demand for most goodsand services. In addition, if the structure of the population changes so doesdemand for certain goods and services, e.g. a growing number of older peoplewill increase the demand for care homes.
Demographics
External shocks can be extreme, such as terrorist attacks that decrease thedemand for air travel or they may take the form of a report claiming that darkchocolate is good for you which increases demand.
Externalshocks
The time of year has an impact on the amount demanded, think of warm clothesin winter. It can apply to short periods of time, such as an increased demand forsunscreen and tourist attractions in mid-summer.
Seasonality
A shift in thedemand curve
Substitutes
Tastes
13
Revision Guide to AS and A Level Business
that there is a shift in the demand curve. If, at a certain price, consumers want less of the product, the curve will shift to the left. If they want more, the curve will shift to the right. You can see how this worksin Figure 2. The reasons for a shift are set out below.
Figure 2: Increases and decreases in demand

1.2.2 Supply
Supply – the amount of a good or service that producers are willing and able to provide, at a rangeof different price levels.
Market supply refers to the total output of all individual suppliers of a particular good or service. Producersmake decisions as to how much they are willing and able to supply at any given price. This will be based onthe cost of inputs and the amount of profit they are likely to make, together with any other objectives theymay have.
Price and supply
There is a relationship between price and quantity supplied. This is a positive relationship: as one changesso does the other but in the same direction.
As price (P) rises↑, quantity supplied (Q) rises↑.
As price (P) falls↓, quantity supplied (Q) falls↓.
The supply curve
A supply curve shows the relationship between the price and the quantity of a product thatproducers want to create and sell. It shows the total amount supplied to the market by all producers,at a range of different prices. As with demand, the curve is often shown as a straight line.
Figure 3: The supply curve
Figure 3 shows a supply curve; as the pricerises from P1 to P2, quantity supplied risesfrom Q1 to Q2. A change in price causes amovement along the supply curve. Lowerprices mean that producers are less inclined toproduce for this market; higher prices meanbigger profits and an incentive to produce andsell more.
Factors leading to a change in supply
Figure 4: Increases and decreases in supply
A range of other factors, besides price, willcause a change in quantity supplied. Some -thing happens to make producers supply moreor less of a good even though the priceremains the same. This is a shift in the supplycurve. The most common cause for this, set outbelow, is a change in costs of production,which can happen for many reasons.
Revision Guide to AS and A Level Business
14
Price andquantity
Costs
PriceS
Quantity
P2
P1
Q1 Q2
Price
Quantity
When there is decrease inquantity supplied, the supply
curve will shift to the left
When there is increase inquantity supplied, the supplycurve will shift to the right

WATCH OUT!
How to get the demand and supply curves the right way round!!
Every year some exam candidates get their curves mixed up. Remember them this way…
Demand starts with a D – the demand curve slopes Down from L to R.
SUPply has the word UP in it – the Supply curve slopes UP from L to R.
1.2.3 Markets
The interaction of supply and demand
� When the demand and supply curves are brought together on the same diagram there is a point at whichthe curves cross each other.
� This is the equilibrium point, at which thequantity demanded is the same as thequantity supplied.
� The price at this point is the equilibriumprice where there will be no unsold productsand customers will be able to buy all theydemand at that price. We say, the marketclears.
� Price and quantity are determined by theinteraction of supply and demand – i.e. bymarket forces. In market economies withstrong competition, prices are the signals thattell suppliers when consumers want more orless of their product.
Revision Guide to AS and A Level Business
15
Technology
Shocks
Equilibriumprice
An increase in input costs means it is less profitable to produce at that price andso less is supplied. But if costs decrease, producers respond by increasingoutput. The supply curve shifts to the right.
Changes in the costs ofproduction
Technological progress allows businesses to produce a given item at a lowercost. This will increase the amount supplied at that price; the supply curve shiftsto the right.
The introduction ofnew technology
An increase in the tax on a product means that the price to the customer rises.The supply curve shifts to the left because at any level of output, the price will behigher.
Indirecttaxes
Subsidies are payments to producers that encourage them to produce more.The product can then be sold at a lower price; the amount supplied willincrease.
Governmentsubsidies
The supply of some goods is dependent on events beyond the producer’scontrol, for example, the supply of wheat depends on the amount of wheatharvested.
Externalshocks
Price and quantity are determined by the interaction of supply and demand.

Figure 5: Equilibrium price and quantity
Figure 5 shows that the equilibrium price is£50 and quantity is 400. Sales revenue will be£20,000. If demand increases for some reasonand the demand curve shifts to the right,suppliers (businesses) will do their best toexpand output to meet the demand.
Equilibrium price – the price at which the amount supplied is exactly equal to the amountdemanded. The market clears. There are no surpluses or shortages, i.e. no unsold products left onthe shelves (excess supply) and no customers who fail to get what they want at that price (excessdemand).
Some markets rarely remain in equilibrium for long. Something usually happens that alters the factors leadingto a change in demand or supply. This means that one of the curves will shift, leading to a new equilibriumprice and quantity. If demand increases, suppliers will increase output as fast as they can to meet the demand.
How demand and supply diagrams show market change
Figure 6: Changes in demand
� The increase in demand in Figure 6 shows thedemand curve shifting to the right as morewill be demanded at every price. Equilibriumprice and quantity both increase. This mightbe caused by a change in tastes or a fall in the price of a substitute (a competingproduct).
� A fall in demand, perhaps caused by a fall in incomes, shifts the demand curve to theleft as less will be wanted at every price.Equilibrium price and quantity both decrease.
� In both of the diagrams there has been a shiftof the demand curve that causes a movementalong the supply curve.
Revision Guide to AS and A Level Business
16
Marketclearing
Shifts in thedemand curve
Equilibrium
Pri
ce £
Quantity (units)
0 200 400 600 8000
10
20
30
40
50
60
70
80
90
100Supply
Demand
PriceSupply
Quantity
P2
P1
Q1 Q2
NewDemand
Demand
Increase in DemandPrice
Supply
Quantity
P1
P2
Q2 Q1
NewDemand
Demand
Fall in Demand
A fall in demand shifts the demand curve to the left as lesswill be wanted at every price.

Q0
P S
D
Q1
P1
Q0
P S
D
Q1
P1
D1
Q0
P S
D
Q1
P1
D1
P2
Q2
Changes in supply
Figure 7: Changes in supply
� The increase in supply shows the supply curve shifting to the right as more will be produced at everyprice. Equilibrium price falls and equilibrium quantity increases. This may have been caused by technologydevelopments that reduce production costs.
� A fall in supply shifts the supply curve to the left as less will be produced at every price. Equilibrium pricerises and quantity sold decreases. This could be caused by higher input prices, leading to increasedproduction costs.
� In both of the diagrams there has been a shift of the supply curve that causes a movement along thedemand curve.
Sample scenarioStudents will be required to draw demand and supply (market) diagrams to demonstrate the interactionbetween supply and demand and to show what happens if there is a shift of either curve.
ExampleIn November 2015 a health report suggested a link between eating bacon and an increased chance ofgetting bowel cancer. Draw a diagram showing the market for bacon following this announcement.
Step 1 – Draw a basic D&S diagram Step 2 – Decide which curve is affected and add to the diagram
Step 3 – Show new equilibrium price Step 4 – Provide a written explanationand quantity
Consumers are worried about the health risks ineating bacon and may reduce the quantity theyconsume. There has been a change in tastes andless is now demanded by consumers at each andevery price. The demand curve shifts to the left creating a new equilibrium. Price falls fromP1 to P2 and quantity demanded falls from Q1
to Q2.
Revision Guide to AS and A Level Business
17
Shifts in thesupply curve
A movementalong thedemand curve
Usingdiagrams
Price Supply
Quantity
P2
P1
Q1 Q2
NewSupply
Demand
Increase in Supply Fall in SupplyPrice Supply
Quantity
P2
P1
Q1Q2
NewSupply
Demand

WATCH OUT!
1.2.4 Price elasticity of demand (PED)
Elasticity measures responsiveness to change. Price elasticity of demand measures the extentto which a change in price leads to a change in quantity demanded (a change in sales levels).
We know that a change in price will lead to a change in quantity demanded. PED is used to tell us by howmuch the quantity demanded will change, showing the consequences of the price change.
Calculating price elasticity of demand
To compare changes we need to look at the percentage changes in both price and quantity.
We can then use a formula to work out PED, which will give us a numerical answer.
PED =% change in quantity demanded
% change in price
Example: A holiday company reduced the price of a package holiday from £500 to £450 and found that salesincreased from 10 holidays a week to 12.
PED =% change in quantity demanded
�20%
= -2% change in price -10%
This tells us the degree of elasticity. We then refer to a good or a service as being price elastic or priceinelastic.
Interpretation of numerical values of price elasticity of demand
Price elasticity What happens What it means Numerical value
Price elastic A price change causes a % change in Q is Beyond -1proportionately bigger greater than the % change in quantity change in Pdemanded
Unit price elasticity A price change causes % change in Q is -1the same proportional the same as the % change in quantity change in Pdemanded
Price inelastic A price change causes % change in Q is Between 0 and -1a proportionately smaller smaller than the % change in quantity change in Pdemanded
In our example above, the answer of -2 means that the demand for those package holidays is price elastic.
Price elasticities are always negative. Remember to include the minus sign.
The factors influencing price elasticity of demand
� Number and closeness of substitutes – the more substitutes a product has, the more price elastic itwill be. For example, when several different airlines fly the same routes, they are close substitutes andif any one of them raises its prices, it is liable to lose many customers; demand will be price elastic.Whereas if there is only one airline going to a specific destination and the substitute is a long trainjourney, demand will probably be price inelastic.
Revision Guide to AS and A Level Business
18
Price elasticor inelastic
Substitutes

� Luxury or necessity – luxuries tend to be more price elastic and necessities tend to be more priceinelastic. (Unless the luxury in question is a status symbol, in which case cutting the price may make itsay less about your status).
� Proportion of income spent on a good – if toothpaste increases in price by 20% most people will stillbuy it; sales will hardly change because toothpaste is price inelastic. But if the cost of foreign holidaysrises by 20%, sales are likely to drop significantly. Holidays are much more price elastic.
� Time scale – In the short term some products will be more price inelastic than in the long term. The mainreason for this is that people take time to adjust to new prices, especially in relation to consumer durableslike central heating boilers and washing machines. They won’t switch to a cheaper product until they needto replace the existing product.
The significance of price elasticity of demand for business
� In a highly competitive market, many rival suppliers offer similar or standardised products and demandfor any one of them will be price elastic. Most businesses in this situation will not consider a priceincrease, because sales and revenue would fall. Non-essential products may, similarly, be price elastic justbecause customers can choose to do without them.
Businesses selling products that are price elastic will do all they can to control costs in order to stayprofitable. They may also try to differentiate their products, creating strong brand images if they can,developing USPs, all of which will make demand less price elastic.
� When there are few close substitutes, demand tends to be less price-sensitive. In niche marketswhere there are few suppliers, successful differentiation can distance one brand from its substitutes.Businesses that are confident that demand for their products is price inelastic can expect a price increaseto lead to a relatively small fall in demand. A higher price can increase both sales revenue and profit. This is attractive; so many businesses will try to make their products distinctly different from rivalsubstitutes.
Businesses are in a stronger position when demand for their product is price inelastic. They can usemarket research to target specific groups of customers with product features that appeal. They will try toselect a market position for their products where demand is as price-inelastic as possible. When they succeedin this, the way is open for price and profit increases.
So businesses need to know the value of PED for each of their products, so they can tell what willhappen to demand if they change the prices of their products. They may use market research findings tohelp them. Of course people with experience in the markets where they sell can be very good at decidingon a price without actually knowing the formula for PED. But they have to guess and mistakes can be veryexpensive.
Calculating and interpreting the link between price elasticity of demand and total revenue
Total revenue or TR is the amount of income generated by the sales of a business. It is calculated bymultiplying the price of a product (P) by the quantity sold (Q).
Total Revenue = Price x Quantity or TR = P x Q
Price changes affect total revenue. The outcome differs according to whether demand is price elastic or priceinelastic.
� Figure 8 (overleaf) shows an inelastic demand curve (with a very steep gradient). The price cut reducestotal revenue. You can see that the loss of revenue due to the fall in price is much bigger than theincrease in revenue due to the increased quantity sold.
� Figure 9 shows an elastic demand curve, i.e. one with a very gentle slope. A cut in price will have adramatic effect on the quantity sold, just what you would expect if demand is elastic.
Revision Guide to AS and A Level Business
19
Luxuries
Time lags
Differentiation
Total revenue

Price
0Quantity
P2
Q2Q1
P1 E
N
D
Price
0Quantity
P2
Q2Q1
P1E
ND
Figure 8: Price cut with inelastic demand Figure 9: Price cut with elastic demand
With an inelastic demand curve, any given change in price will cause a relatively small change in quantitydemanded. With an elastic demand curve, nearer to the horizontal, there is a much bigger change indemand. Sales revenue is price x quantity, or P x Q on the diagrams. Revenue received has shrunk wheredemand is price inelastic and price is cut. By contrast, a price cut would increase sales revenue if demandis price elastic.
When a supplier puts a price up there are two effects on revenue. The higher price increases the revenue perunit but also reduces the number of units sold. If demand is price inelastic, quantity changes less than price.
ExampleIn 2011, Netflix in the USA decided to change its prices for DVDs and streaming services. The cost of subscribing to both went up from $10 to $16. Subscriber numbers fell from 25 million to 24 million. Subscribers made a big fuss on Twitter. They were not pleased.
Calculating1. Calculate the price elasticity of demand for Netflix products in the USA.
2. Which of the above diagrams (Figures 8 or 9) best describes what happened?
3. Explain the likely causes of this outcome, and its consequences for Netflix.
4. Explain when it might be a good idea for a business to cut its prices. Use an example. You couldexplain, with reference to price elasticity of demand, what might be the best course of action fora market greengrocer with a lot of perishable fruit on his stall towards the end of the day.
(Answers on page 114)
Businesses that have differentiated their products and have strong brands that foster brand loyalty cankeep in close touch with their markets. This will give them the information they need to decide whether toraise prices. The key factor is whether the available substitutes will attract large numbers ofcustomers after a price rise. Careful market research will provide useful information on this. Businessesoperating in niche markets often face less competition from substitute products so demand is less priceelastic than it is in mass markets.
If demand is price elastic: If demand is price inelastic:
Increasing price would decrease TR (P� TR�) Increasing price would increase TR (P� TR�)
Reducing price would increase TR (P� TR�) Reducing price would decrease TR (P� TR �)
The government understands PED very well; that’s why it puts indirect taxes on price inelastic goods, suchas alcohol, cigarettes and petrol and not on price elastic goods!
High price elasticity goes together with being in a highly competitive market. Where there are manycompeting businesses, there will be plenty of good substitutes around. A price increase will probably drive
Revision Guide to AS and A Level Business
20
Price changesand salesrevenue
Competingsubstitutes

WATCH OUT!
customers away. An obvious answer would be to cut costs and increase efficiency. This would be one wayto maintain competitive advantage.
From the customers’ point of view, competitive markets and price elastic demand force businesses to keepcosts and prices down to the minimum possible and this is good for their standard of living.
1.2.5 Income elasticity of demand (YED)
Very often, a change in income will bring about a change in quantity demanded. But by how much willquantity demanded change? This is what YED is all about. Businesses need to be aware of how changes inincome will affect their markets. Notice, Y always stands for income.
Income elasticity of demand measures the responsiveness of quantity demanded to a change inincome.
Calculation of income elasticity of demand
The formula used is similar to PED:
YED =% change in quantity demanded
% change in income
This will give a numerical answer, a precise figure that tells us whether the good or service is income elasticor income inelastic.
CalculatingAdjusted for inflation, national income in the UK grew by 2.6% in 2014. According to the Societyof Motor Manufacturers and Traders, new car sales in the UK grew by 9.4%. Calculate the incomeelasticity of demand for cars in that year. (Answer on page 114)
Interpreting numerical values for price elasticity of demand
YED What happens What it means Numerical value
Income elastic An income change causes % change in Q is Greater than 1a proportionately bigger greater than the % change in quantity change in Ydemanded
Unitary income elasticity An income change causes % change in Q is 1the same proportional the same as the % change in quantity change in Ydemanded
Income inelastic An income change causes % change in Q is Between 0 and 1a proportionately smaller smaller than the % change in quantity change in Ydemanded
Unfortunately YED is a little more complicated than PED.
For most products and services, as incomes rise, quantity demanded also rises and vice versa. Theseare called normal goods. They have a positive YED value.
There are some products and services that do not behave like this. As incomes rise, quantitydemanded falls and vice versa. These are called inferior goods. They have a negative YED value.
Revision Guide to AS and A Level Business
21
Competitiveadvantage
Income elastic
Incomeinelastic

Type of good Incomes rise � Incomes fall �
Normal Quantity demanded � Quantity demanded �
Inferior Quantity demanded � Quantity demanded �
An inferior good is a substitute for something more expensive. It may be of poorer quality or it may just bedifferent and less appealing.
� Days out in Brighton are an inferior good because if Londoner’s incomes fall (as they did in the recessionfollowing the financial crisis in 2008-9), they are less likely to take holidays abroad and more likely totake day trips to Brighton. (Brighton tourist attractions did well during the recession.)
� If their incomes then rise again, they are likely to return to buying the normal goods they bought before.
The factors influencing income elasticity of demand
� The main factor that affects the degree of income elasticity is whether the product or service is a luxuryor a necessity.
� Luxuries are income elastic and have high positive YED values e.g. cruises or designer goods.
� Necessities are income inelastic and have a low positive YED value e.g. baked beans and soap.
The significance of income elasticity of demand to businesses
� Incomes tend to change relatively slowly. Changes in individual incomes will have little effect on YED. Itis when incomes change en masse that it begins to affect a business.
� Businesses may need to react to changes in incomes and plan accordingly. The usual cause of this is achange in the economy e.g. recession.
� Recession creates problems because many people will face falling incomes; sellers of luxury goods willhave to find ways of coping with falling sales. By contrast sellers of inferior goods will see rising salesand adjust their production accordingly.
� Businesses selling inferior products and services tend to do well during a recession when incomes fall andconsumer confidence is low. Halfords saw an increase in sales during the recession 2008-12, as moremotorists did their own maintenance or bought a bike to commute and save money.
� Businesses selling luxury income elastic goods tend to do well when the economy is growing and manypeople have rising incomes.
Think!Comment on the likely YED for branded trainers, white sliced bread, exotic holidays, yachts, scissors,cheap perfume, bikes and beauty treatments. Say whether YED will be positive or negative and rankthem from highest to lowest YED.
Revision Guide to AS and A Level Business
22
Inferior goodsand services
Recession