Revised State Template for the ... - Education Weekblogs.edweek.org/edweek/campaign-k-12/Vermont...
128
Revised State Template for the Consolidated State Plan The Elementary and Secondary Education Act of 1965, as amended by the Every Student Succeeds Act U.S. Department of Education Issued: March 2017 OMB Number: XX Expiration Date:
Transcript of Revised State Template for the ... - Education Weekblogs.edweek.org/edweek/campaign-k-12/Vermont...
Revised State Template for the
Consolidated State Plan
The Elementary and Secondary Education Act of 1965, as
amended by the Every Student Succeeds Act
U.S. Department of Education
Issued: March 2017
OMB Number: XX
Expiration Date:

2
Introduction Section 8302 of the Elementary and Secondary Education Act of 1965 (ESEA), as amended by the Every
Student Succeeds Act (ESSA),1 requires the Secretary to establish procedures and criteria under which,
after consultation with the Governor, a State educational agency (SEA) may submit a consolidated State
plan designed to simplify the application requirements and reduce burden for SEAs. ESEA section 8302
also requires the Secretary to establish the descriptions, information, assurances, and other material
required to be included in a consolidated State plan. Even though an SEA submits only the required
information in its consolidated State plan, an SEA must still meet all ESEA requirements for each
included program. In its consolidated State plan, each SEA may, but is not required to, include
supplemental information such as its overall vision for improving outcomes for all students and its efforts
to consult with and engage stakeholders when developing its consolidated State plan.
Completing and Submitting a Consolidated State Plan Each SEA must address all of the requirements identified below for the programs that it chooses to
include in its consolidated State plan. An SEA must use this template or a format that includes the
required elements and that the State has developed working with the Council of Chief State School
Officers (CCSSO).
Each SEA must submit to the U.S. Department of Education (Department) its consolidated State plan by
one of the following two deadlines of the SEA’s choice:
April 3, 2017; or
September 18, 2017.
Any plan that is received after April 3, but on or before September 18, 2017, will be considered to be
submitted on September 18, 2017.
Alternative Template If an SEA does not use this template, it must:
1) Include the information on the Cover Sheet;
2) Include a table of contents or guide that clearly indicates where the SEA has addressed each
requirement in its consolidated State plan;
3) Indicate that the SEA worked through CCSSO in developing its own template; and
4) Include the required information regarding equitable access to, and participation in, the programs
included in its consolidated State plan as required by section 427 of the General Education
Provisions Act. See Appendix B.
Individual Program State Plan An SEA may submit an individual program State plan that meets all applicable statutory and regulatory
requirements for any program that it chooses not to include in a consolidated State plan. If an SEA
intends to submit an individual program plan for any program, the SEA must submit the individual
program plan by one of the dates above, in concert with its consolidated State plan, if applicable.
Consultation Under ESEA section 8540, each SEA must consult in a timely and meaningful manner with the Governor,
or appropriate officials from the Governor’s office, including during the development and prior to
submission of its consolidated State plan to the Department. A Governor shall have 30 days prior to the
1 Unless otherwise indicated, citations to the ESEA refer to the ESEA, as amended by the ESSA.
3
SEA submitting the consolidated State plan to the Secretary to sign the consolidated State plan. If the
Governor has not signed the plan within 30 days of delivery by the SEA, the SEA shall submit the plan to
the Department without such signature.
Assurances In order to receive fiscal year (FY) 2017 ESEA funds on July 1, 2017, for the programs that may be
included in a consolidated State plan, and consistent with ESEA section 8302, each SEA must also submit
a comprehensive set of assurances to the Department at a date and time established by the Secretary. In
the near future, the Department will publish an information collection request that details these
assurances.
For Further Information: If you have any questions, please contact your Program Officer at
OSS.[State]@ed.gov (e.g., [email protected]).
4
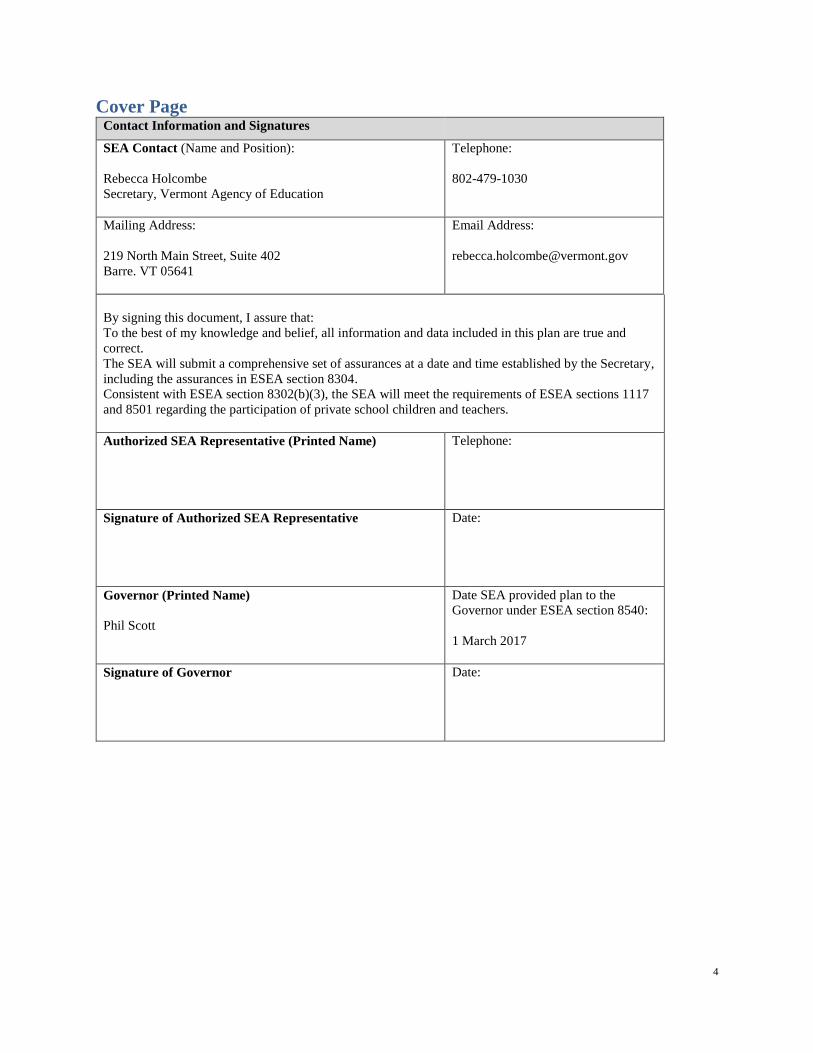
Cover Page Contact Information and Signatures
SEA Contact (Name and Position):
Rebecca Holcombe
Secretary, Vermont Agency of Education
Telephone:
802-479-1030
Mailing Address:
219 North Main Street, Suite 402
Barre. VT 05641
Email Address:
By signing this document, I assure that:
To the best of my knowledge and belief, all information and data included in this plan are true and
correct.
The SEA will submit a comprehensive set of assurances at a date and time established by the Secretary,
including the assurances in ESEA section 8304.
Consistent with ESEA section 8302(b)(3), the SEA will meet the requirements of ESEA sections 1117
and 8501 regarding the participation of private school children and teachers.
Authorized SEA Representative (Printed Name)
Telephone:
Signature of Authorized SEA Representative
Date:
Governor (Printed Name)
Phil Scott
Date SEA provided plan to the
Governor under ESEA section 8540:
1 March 2017
Signature of Governor
Date:
5
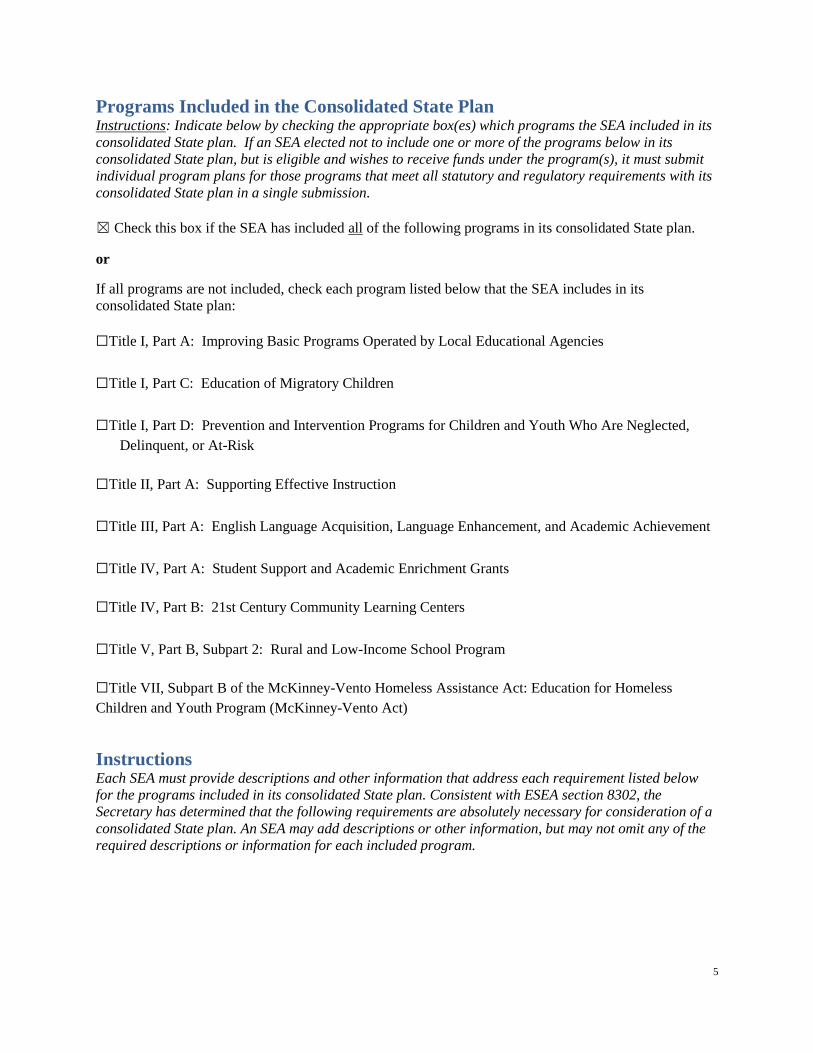
Programs Included in the Consolidated State Plan Instructions: Indicate below by checking the appropriate box(es) which programs the SEA included in its
consolidated State plan. If an SEA elected not to include one or more of the programs below in its
consolidated State plan, but is eligible and wishes to receive funds under the program(s), it must submit
individual program plans for those programs that meet all statutory and regulatory requirements with its
consolidated State plan in a single submission.
☒ Check this box if the SEA has included all of the following programs in its consolidated State plan.
or
If all programs are not included, check each program listed below that the SEA includes in its
consolidated State plan:
☐ Title I, Part A: Improving Basic Programs Operated by Local Educational Agencies
☐ Title I, Part C: Education of Migratory Children
☐ Title I, Part D: Prevention and Intervention Programs for Children and Youth Who Are Neglected,
Delinquent, or At-Risk
☐ Title II, Part A: Supporting Effective Instruction
☐ Title III, Part A: English Language Acquisition, Language Enhancement, and Academic Achievement
☐ Title IV, Part A: Student Support and Academic Enrichment Grants
☐ Title IV, Part B: 21st Century Community Learning Centers
☐ Title V, Part B, Subpart 2: Rural and Low-Income School Program
☐ Title VII, Subpart B of the McKinney-Vento Homeless Assistance Act: Education for Homeless
Children and Youth Program (McKinney-Vento Act)
Instructions Each SEA must provide descriptions and other information that address each requirement listed below
for the programs included in its consolidated State plan. Consistent with ESEA section 8302, the
Secretary has determined that the following requirements are absolutely necessary for consideration of a
consolidated State plan. An SEA may add descriptions or other information, but may not omit any of the
required descriptions or information for each included program.
6
The Vermont Agency of Education has reordered our state plan to accommodate and facilitate ease of
review. The Vermont State Plan as presented to the public is available be following this link.
A. Title I, Part A: Improving Basic Programs Operated by Local
Educational Agencies (LEAs)
1. Challenging State Academic Standards and Assessments (ESEA section 1111(b)(1) and
(2) and 34 CFR §§ 200.1−200.8.)2
Standards
Vermont’s Education Quality Standards specify seven Curriculum Content Areas and the
Transferable Skills that are critical for student success (2120.5). The Vermont Agency of
Education (VT-AOE) considered whether or not an assessment was necessary for each of these
areas. Stakeholder input expressed a strong preference for focusing on fewer areas to reduce the
need for additional state testing. The result is that four of seven areas have assessment measures
designed to satisfy ESSA requirements, with the remaining areas being assessed through the
qualitative component of our Education Quality Reviews. English language arts, math and
science are described below; physical education is addressed later in our description of a 5th
indicator.
1) English Language Arts (ELA)
Adopted Standards:
ESSA requires that states select challenging career and college ready standards in English-
Language Arts/Reading. In 2010, the Vermont State Board of Education adopted the Common
Core State Standards as our definition of what students in each grade level should know and be
able to do in the Education Quality Standards (EQS) curriculum area of literacy. These
standards have been used to satisfy federal expectations under No Child Left Behind, and
maintaining these as Vermont’s standards provides for continuity in schools.
Under section 1111(b)(1)(B) of ESSA, the state has the option to select alternate standards for
students with significant disabilities. Vermont has opted not to pursue this option, as we seek to
provide all students with access to a rich educational experience. Individual determinations for
how best to meet these students’ specific learning needs is delegated to local IEP teams, which
collaboratively set learning targets that are aligned to the grade-level general education
curriculum. This process includes students (where appropriate) and their families, in
consultation with school-based educators. This decision is supported by past practice in
Vermont.
2 The Secretary anticipates collecting relevant information consistent with the assessment peer review process in 34 CFR §
200.2(d). An SEA need not submit any information regarding challenging State academic standards and assessments at this time.
7
Assessment:
ESSA requires that states select assessments that measure the full breadth of adopted standards
and meet technical requirements for validity and reliability for students in grades 3-8 and in
grades 9-12.
Vermont intends to meet this requirement for 99% of students by using the computer adaptive
Smarter Balanced Assessment for reading in grades 3 through 9. This test has been used for two
years in Vermont and has been submitted to the federal peer review process. All studies of the
Smarter Balanced Assessment have demonstrated that it is a valid and reliable tool for assessing
the Common Core State Standards. The assessment includes reports to parents and schools that
clearly articulate student performance on the assessment. Data can be disaggregated and used
for accountability purposes.
For the 1% of students with the most severe cognitive disabilities, Vermont will continue using
the Dynamic Learning Map (DLM) that is developed and used by a multi-state consortium. The
assessment is given in reading/language arts and mathematics. The DLM assessment has been
created to align with the state’s common core standards in reading/language arts and
mathematics. It has been peer reviewed and has been shown to meet the technical qualities of
assessment.
2) Mathematics
Adopted Standards:
ESSA requires that states select challenging career and college ready standards in Mathematics.
In 2010, the Vermont State Board of Education adopted the Common Core State Standards as
our definition of what students in each grade level should know and be able to do in the
Education Quality Standards curriculum area of mathematical content and practices. These
standards have been used to satisfy federal expectations under No Child Left Behind, and
maintaining these as Vermont’s standards provides for continuity in schools.
Under section 1111(b)(1)(B) of ESSA, the state has the option to select alternate standards for
students with significant disabilities. Vermont has opted not to pursue this option, as we seek to
provide all students with access to a rich educational experience. Individual determinations for
how best to meet these students’ specific learning needs is delegated to local IEP teams to
collaboratively set learning targets that are aligned to the grade level general education
curriculum. This process includes students (where appropriate) and their families, in
consultation with school-based educators. This decision is supported by past practice in
Vermont.
Assessment:
ESSA requires that states select assessments that measure the full breadth of adopted standards
and meet technical requirements for validity and reliability for students in grades 3-8 and
grades 9-12.
8
Vermont intends to meet this requirement by using the computer adaptive Smarter Balanced
Assessment for reading in grades 3 through 9. This test has been used for two years in Vermont
and has been submitted to the federal peer review process. All studies of Smarter Balanced
Assessment have demonstrated that it is a valid and reliable tool for assessing the Common
Core State Standards.
Under section 1111(b)(2)(C)(iii) of ESSA, the state has the option to allow students in grade 8 to
take the end of course exam for the advanced mathematics course they are taking, rather than
taking the 8th grade assessment. As Vermont has opted to only assess mathematics once in high
school, no end of course assessments exist; therefore, this option is not available in Vermont.
The assessment includes reports to parents and schools that clearly articulate student
performance on the assessment. Data can be disaggregated and used for accountability
purposes.
3) Science
Adopted Standards:
ESSA requires that states select challenging career and college ready standards in science. In
2013, the Vermont State Board of Education adopted the Next Generation Science Standards
(NGSS) as our definition of what students in each grade level should know and be able to do in
the Education Quality Standards curriculum area of scientific inquiry and content knowledge.
These standards have been used to satisfy federal expectations under No Child Left Behind and
maintaining these as Vermont’s standards provides for continuity in schools.
Under section 1111(b)(1)(B) of ESSA, the state has the option to select alternate standards for
students with significant disabilities. Vermont has opted not to pursue this option, as we seek to
provide all students with access to a rich educational experience. Individual determinations for
how best to meet these students’ specific learning needs are delegated to local IEP teams to
collaboratively set learning targets that are aligned to the grade level general education
curriculum. This process includes students (where appropriate) and their families, in
consultation with school-based educators. This decision is supported by past practice in
Vermont.
Assessment:
ESSA requires that states select assessments that measure the full breadth of adopted standards
and meet technical requirements for validity and reliability for students in three grade levels-
elementary, middle, and high school.
For at least 99% of students, Vermont intends to meet this requirement by using a new science
assessment that is under development with a consortium of other states. We intend for this test
to be administered via computer to students in 5th, 8th, and 11th grades and eventually include
simulations or performance tasks that will allow for the assessment of the full breadth of the
NGSS standards. We have released a Request for Proposals (RFP) to identify the vendor who
will be our partner in this work and are assessing proposals that have been submitted. As the
9
assessment is developed, it will be peer-reviewed to ensure it meets standards of technical
quality. The assessment includes reports to parents and schools that clearly articulate student
performance. Data can be disaggregated and used for accountability purposes.
For the less than 1% of students who require an alternate assessment due to extreme cognitive
disabilities, Vermont will use the New England Common Assessment Program (NECAP)
alternate assessment until the state moves to an NGSS aligned assessment for science. The
current peer-reviewed assessment is aligned to state science standards and has been shown to
meet the technical qualities of assessment. In seeking a new vendor for this assessment, the state
intends to make its determination based on the same criteria.
2. Eighth Grade Math Exception (ESEA section 1111(b)(2)(C) and 34 CFR § 200.5(b)(4)):
i. Does the State administer an end-of-course mathematics assessment to meet the
requirements under section 1111(b)(2)(B)(v)(I)(bb) of the ESEA?
□ Yes
□ No
ii. If a State responds “yes” to question 2(i), does the State wish to exempt an
eighth-grade student who takes the high school mathematics course associated
with the end-of-course assessment from the mathematics assessment typically
administered in eighth grade under section 1111(b)(2)(B)(v)(I)(aa) of the ESEA
and ensure that:
a. The student instead takes the end-of-course mathematics assessment the
State administers to high school students under section
1111(b)(2)(B)(v)(I)(bb) of the ESEA;
b. The student’s performance on the high school assessment is used in the
year in which the student takes the assessment for purposes of measuring
academic achievement under section 1111(c)(4)(B)(i) of the ESEA and
participation in assessments under section 1111(c)(4)(E) of the ESEA;
c. In high school:
1. The student takes a State-administered end-of-course assessment
or nationally recognized high school academic assessment as
defined in 34 CFR § 200.3(d) in mathematics that is more
advanced than the assessment the State administers under section
1111(b)(2)(B)(v)(I)(bb) of the ESEA;
2. The State provides for appropriate accommodations consistent
with 34 CFR § 200.6(b) and (f); and
3. The student’s performance on the more advanced mathematics
assessment is used for purposes of measuring academic
achievement under section 1111(c)(4)(B)(i) of the ESEA and
participation in assessments under section 1111(c)(4)(E) of the
ESEA.
□ Yes
□ No
iii. If a State responds “yes” to question 2(ii), consistent with 34 CFR § 200.5(b)(4),
describe, with regard to this exception, its strategies to provide all students in the
State the opportunity to be prepared for and to take advanced mathematics
coursework in middle school.
10
Click here to enter text.
3. Native Language Assessments (ESEA section 1111(b)(2)(F) and 34 CFR §
200.6(f)(2)(ii)):
i. Provide its definition for “languages other than English that are present to a
significant extent in the participating student population,” and identify the
specific languages that meet that definition.
Click here to enter text.
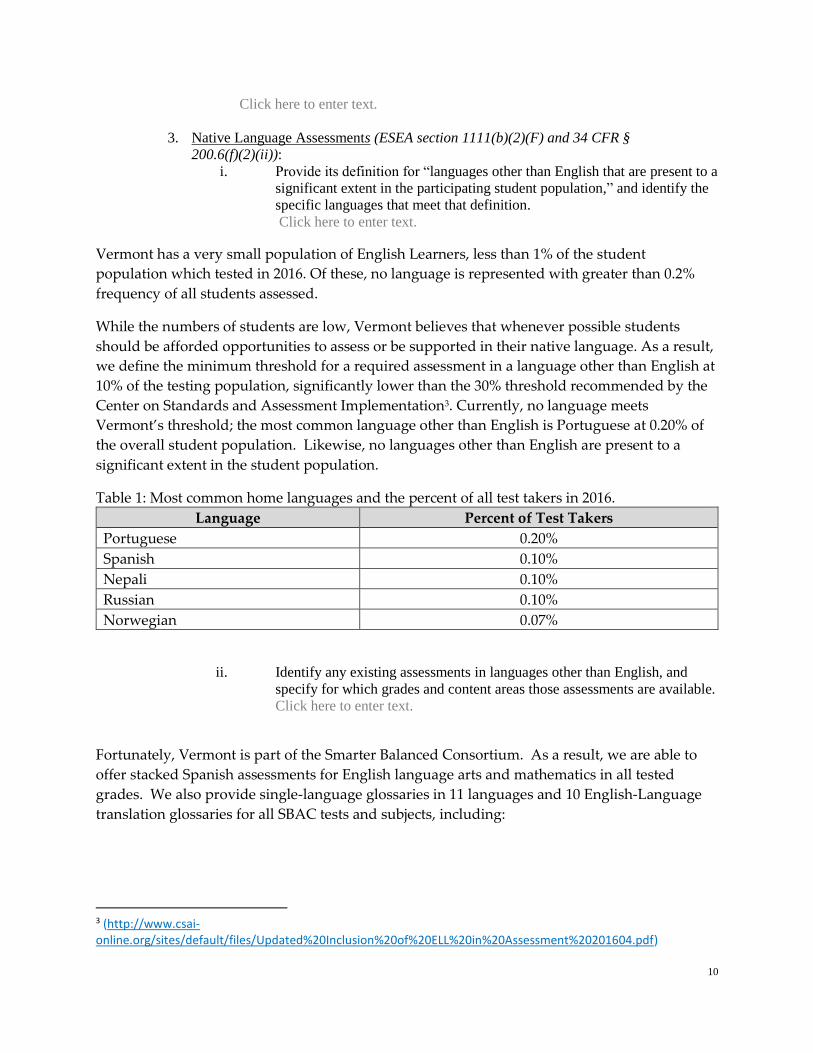
Vermont has a very small population of English Learners, less than 1% of the student
population which tested in 2016. Of these, no language is represented with greater than 0.2%
frequency of all students assessed.
While the numbers of students are low, Vermont believes that whenever possible students
should be afforded opportunities to assess or be supported in their native language. As a result,
we define the minimum threshold for a required assessment in a language other than English at
10% of the testing population, significantly lower than the 30% threshold recommended by the
Center on Standards and Assessment Implementation3. Currently, no language meets
Vermont’s threshold; the most common language other than English is Portuguese at 0.20% of
the overall student population. Likewise, no languages other than English are present to a
significant extent in the student population.
Table 1: Most common home languages and the percent of all test takers in 2016.
Language Percent of Test Takers
Portuguese 0.20%
Spanish 0.10%
Nepali 0.10%
Russian 0.10%
Norwegian 0.07%
ii. Identify any existing assessments in languages other than English, and
specify for which grades and content areas those assessments are available.
Click here to enter text.
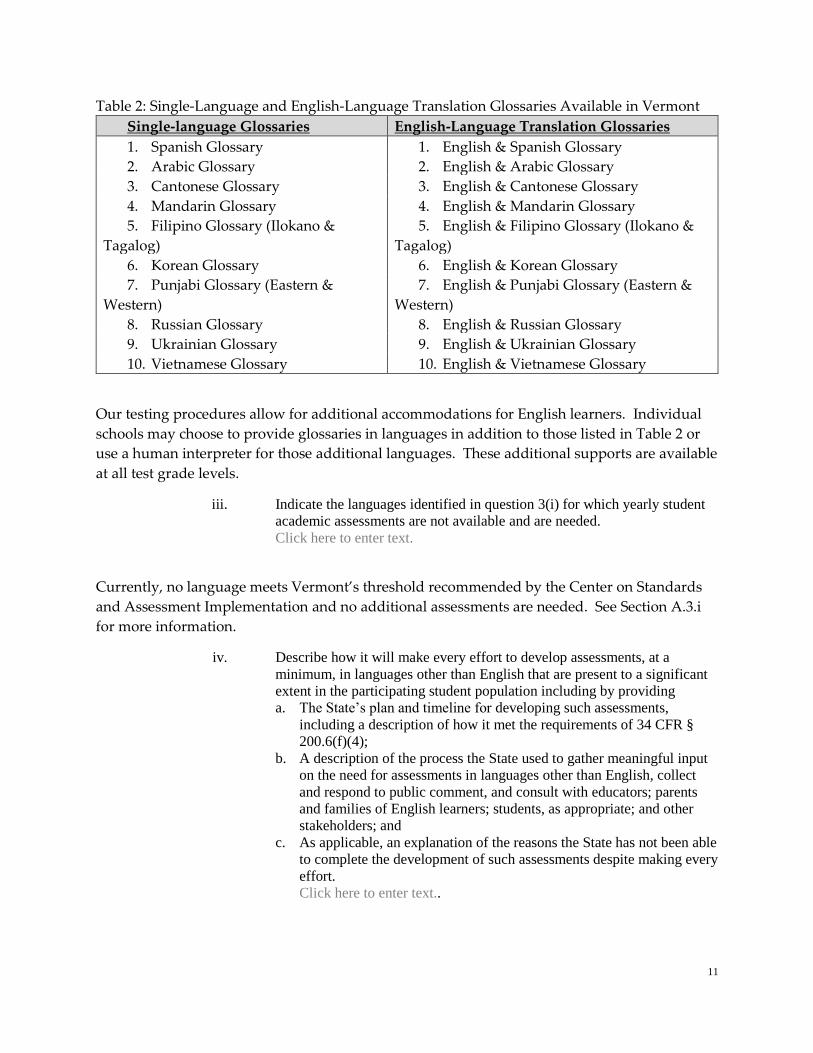
Fortunately, Vermont is part of the Smarter Balanced Consortium. As a result, we are able to
offer stacked Spanish assessments for English language arts and mathematics in all tested
grades. We also provide single-language glossaries in 11 languages and 10 English-Language
translation glossaries for all SBAC tests and subjects, including:
3 (http://www.csai-online.org/sites/default/files/Updated%20Inclusion%20of%20ELL%20in%20Assessment%20201604.pdf)
11
Table 2: Single-Language and English-Language Translation Glossaries Available in Vermont
Single-language Glossaries English-Language Translation Glossaries
1. Spanish Glossary 1. English & Spanish Glossary
2. Arabic Glossary 2. English & Arabic Glossary
3. Cantonese Glossary 3. English & Cantonese Glossary
4. Mandarin Glossary 4. English & Mandarin Glossary
5. Filipino Glossary (Ilokano &
Tagalog)
5. English & Filipino Glossary (Ilokano &
Tagalog)
6. Korean Glossary 6. English & Korean Glossary
7. Punjabi Glossary (Eastern &
Western)
7. English & Punjabi Glossary (Eastern &
Western)
8. Russian Glossary 8. English & Russian Glossary
9. Ukrainian Glossary 9. English & Ukrainian Glossary
10. Vietnamese Glossary 10. English & Vietnamese Glossary
Our testing procedures allow for additional accommodations for English learners. Individual
schools may choose to provide glossaries in languages in addition to those listed in Table 2 or
use a human interpreter for those additional languages. These additional supports are available
at all test grade levels.
iii. Indicate the languages identified in question 3(i) for which yearly student
academic assessments are not available and are needed.
Click here to enter text.
Currently, no language meets Vermont’s threshold recommended by the Center on Standards
and Assessment Implementation and no additional assessments are needed. See Section A.3.i
for more information.
iv. Describe how it will make every effort to develop assessments, at a
minimum, in languages other than English that are present to a significant
extent in the participating student population including by providing
a. The State’s plan and timeline for developing such assessments,
including a description of how it met the requirements of 34 CFR §
200.6(f)(4);
b. A description of the process the State used to gather meaningful input
on the need for assessments in languages other than English, collect
and respond to public comment, and consult with educators; parents
and families of English learners; students, as appropriate; and other
stakeholders; and
c. As applicable, an explanation of the reasons the State has not been able
to complete the development of such assessments despite making every
effort.
Click here to enter text..
12
Currently, no language meets Vermont’s threshold recommended by the Center on Standards
and Assessment Implementation and no additional assessments are needed. As a result, no
assessments in languages other than English need to be developed. Should the percent of
students speaking a language other than English exceed 10% and be a language for which we
do not already have an assessment, VT-AOE will work with our assessment vendors to produce
assessments in students’ native language as expeditiously as possible.
4. Statewide Accountability System and School Support and Improvement Activities (ESEA
section 1111(c) and (d)):
i. Subgroups (ESEA section 1111(c)(2)):
a. List each major racial and ethnic group the State includes as a
subgroup of students, consistent with ESEA section 1111(c)(2)(B).
Click here to enter text.
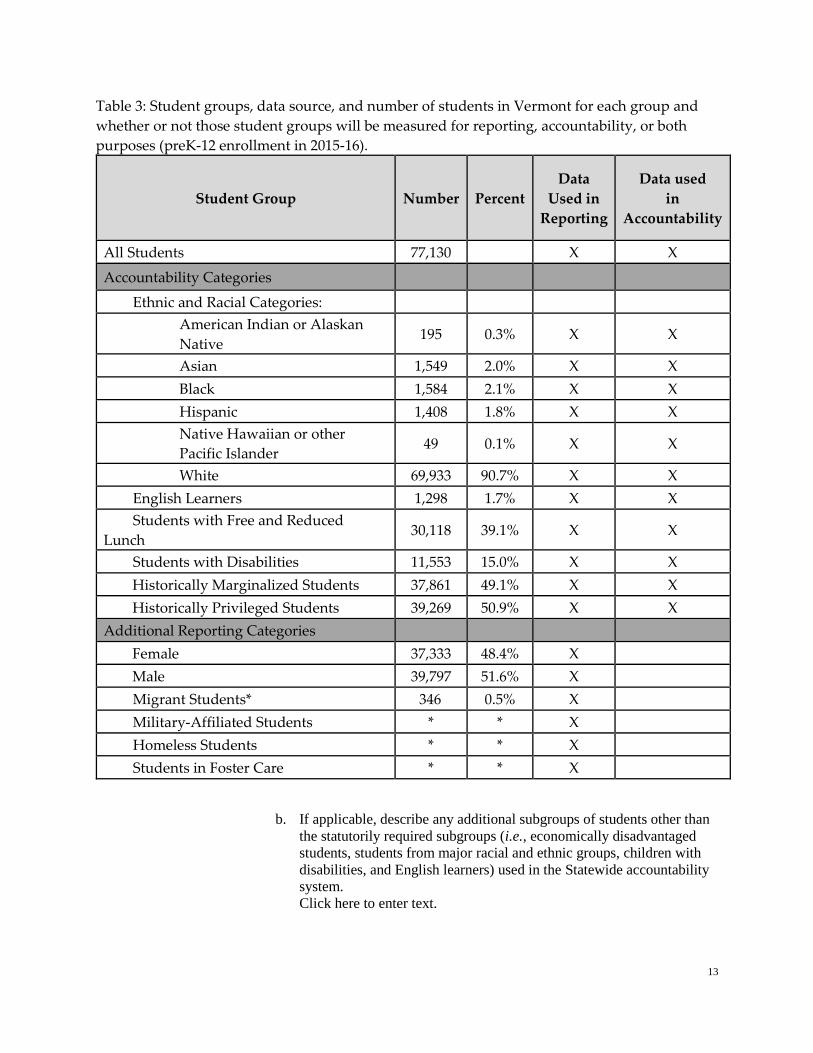
Student Groups
ESSA requires that Vermont track the performance of several student groups. In some cases, the
information on the performance of these student groups must be used for reporting. In other
cases, the data must be used for reporting and to make accountability determinations about
schools.
A cornerstone of Vermont education has long been a commitment to equitable outcomes for all
students. By disaggregating the data for different student groups, we better understand if all
students are experiencing school in the same way or if some students are not being served as
well as others. It is the examination of this data which helps us to guide and shape our
improvement efforts as we seek ever more equitable outcomes.
13
Table 3: Student groups, data source, and number of students in Vermont for each group and
whether or not those student groups will be measured for reporting, accountability, or both
purposes (preK-12 enrollment in 2015-16).
Student Group Number Percent
Data
Used in
Reporting
Data used
in
Accountability
All Students 77,130 X X
Accountability Categories
Ethnic and Racial Categories:
American Indian or Alaskan
Native 195 0.3% X X
Asian 1,549 2.0% X X
Black 1,584 2.1% X X
Hispanic 1,408 1.8% X X
Native Hawaiian or other
Pacific Islander 49 0.1% X X
White 69,933 90.7% X X
English Learners 1,298 1.7% X X
Students with Free and Reduced
Lunch 30,118 39.1% X X
Students with Disabilities 11,553 15.0% X X
Historically Marginalized Students 37,861 49.1% X X
Historically Privileged Students 39,269 50.9% X X
Additional Reporting Categories
Female 37,333 48.4% X
Male 39,797 51.6% X
Migrant Students* 346 0.5% X
Military-Affiliated Students * * X
Homeless Students * * X
Students in Foster Care * * X
b. If applicable, describe any additional subgroups of students other than
the statutorily required subgroups (i.e., economically disadvantaged
students, students from major racial and ethnic groups, children with
disabilities, and English learners) used in the Statewide accountability
system.
Click here to enter text.
14
Vermont has opted to include two additional groups to the required student groups:
Historically Marginalized Students and Historically Privileged Students. Historically
Marginalized Students are those students who have been historically underserved by
educational institutions for any one, or more than one, characteristic including ethnic and racial
minorities, English Learners, students with Free and Reduced Lunch, students with disabilities,
and students who are migrant, foster, or homeless. Historically Privileged Students are those
students who have none of the characteristics that are associated with being underserved.
We have opted to include these two additional groups primarily to increase transparency
around student performance. Vermont’s small schools and relatively low levels of diversity
often mean that student groups are too small to show data which might point to inequities in
experience. By creating a larger group that accounts for many characteristics, we will be able to
share with the public more information about equitable learning experiences in Vermont.
The Historically Marginalized Student group will not take the place of any single disaggregated
group. For example, if a school had sufficient numbers of students who receive free and
reduced lunch, have disabilities, and are Black, the school would receive data for each of the
specific student groups and the Historically Marginalized Student group. However, if a school
had students of the same groups in numbers too small to be individually reported, there is
higher likelihood that taken together these students could be represented in publically reported
data for the aggregated group. As with all data, school systems would have access to their
unsuppressed data for planning purposes.
c. Does the State intend to include in the English learner subgroup the
results of students previously identified as English learners on the State
assessments required under ESEA section 1111(b)(2)(B)(v)(I) for
purposes of State accountability (ESEA section 1111(b)(3)(B))? Note
that a student’s results may be included in the English learner subgroup
for not more than four years after the student ceases to be identified as
an English learner.
□ Yes
X No
d. If applicable, choose one of the following options for recently arrived
English learners in the State:
☒ Applying the exception under ESEA section 1111(b)(3)(A)(i); or
☐ Applying the exception under ESEA section 1111(b)(3)(A)(ii); or
☐ Applying the exception under ESEA section 1111(b)(3)(A)(i) or
under ESEA section 1111(b)(3)(A)(ii). If this option is selected,
describe how the State will choose which exception applies to a
recently arrived English learner.
Click here to enter text.
ii. Minimum N-Size (ESEA section 1111(c)(3)(A)):
15
a. Provide the minimum number of students that the State determines are
necessary to be included to carry out the requirements of any
provisions under Title I, Part A of the ESEA that require
disaggregation of information by each subgroup of students for
accountability purposes.
Click here to enter text.
Vermont is a very small state with very small schools. As a result, data suppression to protect
student privacy and to ensure reliability of results is a frequent issue.
Virtually none of the student characteristics of concern under ESSA can be reported at the
school level. In fact, we are not able to report data for the vast majority of our schools in any
disaggregated field (highest is male/female and then students qualifying for free and reduced
lunch (FRL)). As a state, we can see that the persistent achievement gaps reported nationally
occur in Vermont as well. However, unlike larger schools in other parts of the nation, the small
size of our school units prohibits the release of data to hold schools accountable for results.
Likewise, we are troubled by producing accountability determinations on a number deemed too
small to be reliable. As a result, Vermont has set the “minimum-N” to 25 unique students,
identified over three consecutive years, for accountability purposes. This would likely mean
that schools would need to have roughly 8 students per year in any given group of students
being analyzed to produce accountability data. The minimum N of 25 will be applied to all
students and student groups in a consistent manner.
A Second Tier of Accountability
In order to bring more schools into the state’s accountability system, Vermont proposes to
initiate additional school accountability at the Supervisory Union/Supervisory District (SU/SD)
level. Vermont’s Supervisory Union/Supervisory District are akin to school districts in other
states. They have superintendents and central office staff who support the principals and
teachers in their jurisdictions. However, it is important to note that even our SU/SDs are small:
the smallest includes a single school with 183 students, the largest has just over 4,000 students
and 5 schools. Vermont has none of the larger urban or county districts typical of many states.
Our largest Supervisory Union/Supervisory District would be considered a moderate-sized high
school in most states.
While the size of our schools is a factor in this decision, it is not the sole reason for this
determination. Vermont prides itself on local control and the ability of local groups to identify,
name, and solve the problems which face their communities. As a state, we have been moving
to explicitly build preK-12 pathways that support student learning at all levels. By examining
the systemic student achievement for the entire Supervisory Union/Supervisory District, we
seek to build a deep commitment to support efforts on behalf of all of our students in a manner
that showcases the strong commitment to community and neighbors that Vermonters are
rightfully proud of.
By examining at the Supervisory Union/Supervisory District level, we will be able to produce
accountability results for 98% of communities in Vermont in the first year of accountability for
16
the “all student group.” More importantly, by initiating analysis at the SU/SD level, we will be
able to see the performance of student groups where they would have otherwise been
suppressed. At the Supervisory Union/Supervisory District, we will be able to report and hold
systems accountable for students on free and reduced lunch (73%), students with disabilities
(17%), students learning English (<1%). We will still rarely report data for students of racial
minority groups including students who are American Indian (0%), Asian (<1%), Black (<1%),
Hispanic, (<1%), Native Hawaiian or Pacific Islander <1%, and white (98%). However, by
including the previously discussed Historically Marginalized Student group, we are able to
hold 81% of school systems accountable for students who have one or more characteristic
commonly associated with negative educational outcomes.
b. Describe how the minimum number of students is statistically sound.
Click here to enter text.
We weighed the relative benefits of a larger or smaller N-size, understanding that a higher N
would allow for greater statistical reliability while limiting the number of schools in Vermont
that were able to report out their accountability data. Conversely, a smaller N-size would allow
for greater accountability at the school level, at the cost of statistical reliability.
Ultimately, we are proposing an N-size that allows for a high level of reliability, while
maintaining some ability to report out accountability data in a single year. We believe that an
N-size smaller than 25 as proposed would lead to misinterpretations of the data caused by a
small number of outlier results.
An N size of 25 is sufficiently statistically sound for making accountability determinations at the
school and LEA level. In all statistical analysis, the larger the sample size the greater the
reliability. By selecting a minimum of N, Vermont has done so to increase the likelihood that
differences between schools are due to actual difference in school quality rather than differences
in cohorts or individual teachers. In most cases, a minimum N will be achieved by a single
school over multiple years thereby reducing the effect of any particular cohort of students. In
larger schools, the larger cohorts will also have multiple teachers as our teacher-to-student ratio
is currently 1:7.
Current school configurations suggest that with an N-size of 25, the vast majority of Vermont’s
schools will not have large enough student enrollment to produce data for accountability in a
single year. In the first year of accountability, only 42% percent of elementary schools and 67%
of our secondary schools will have sufficient numbers of students to be held accountable for
results for the “all students” group. In looking at student groups, almost no schools will be held
accountable for any of the ethnic and racial categories at either the elementary or secondary
level in the first year. Only one school (secondary) will be held accountable for English
Learners. For students qualifying for free and reduced lunch, approximately 10% of elementary
schools will be held accountable, while 37% of secondary schools will. For students with
disabilities, approximately 1% of elementary schools will be held accountable for student results

17
compared to 12.5% of secondary schools. Racial and ethnic groups are not large in Vermont
(≈10%) and less than 1% of elementary and secondary schools will be held accountable for the
performance of any non-white student group.
c. Describe how the minimum number of students was determined by the
State, including how the State collaborated with teachers, principals,
other school leaders, parents, and other stakeholders when determining
such minimum number.
Click here to enter text.
The additional information below focuses on public involvement in this discussion.
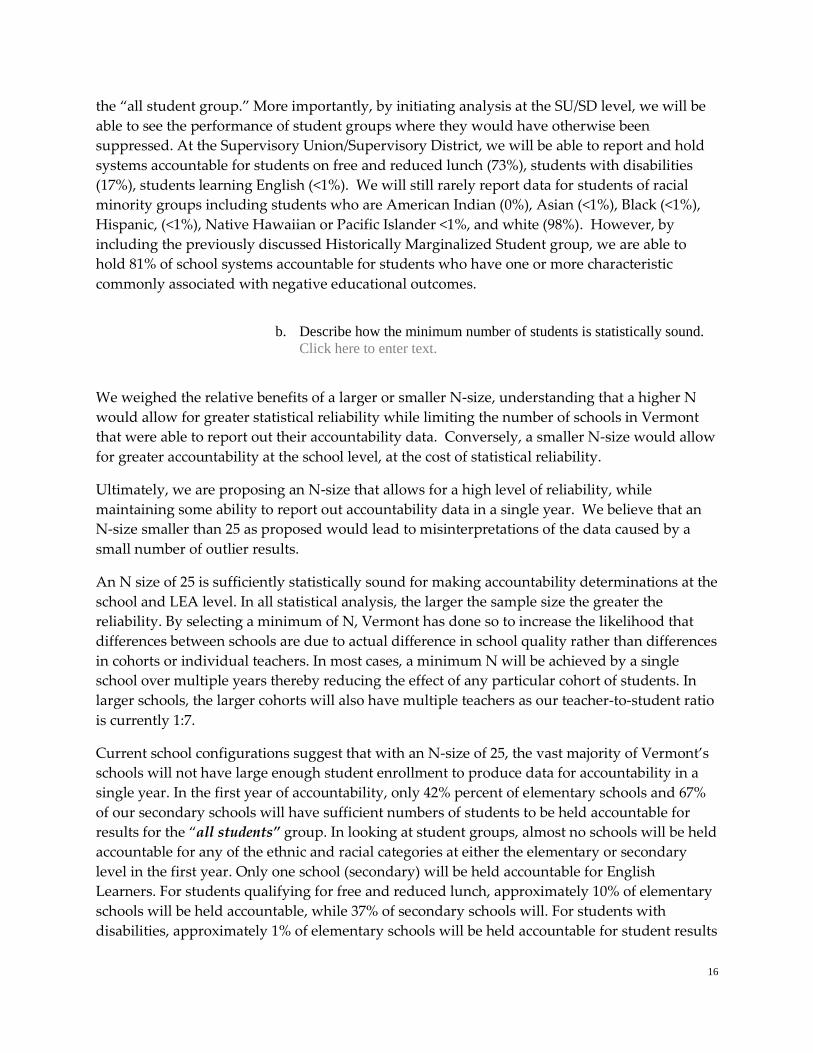
Table 4: Number and percent of schools with grades 3-6 able to annually report data and
participate in the accountability system with a minimum N of 25.
Grades 3-6
Schools with No
Accountability
Determination
N<25
Schools with
Accountability
Determination
N≥25
# % # %
All Students 121 57.9% 89 42.1%
Accountability Categories
Ethnic and Racial Categories:
American Indian or Alaskan Native 210 100.0% 0 0.0%
Asian 210 100.0% 0 0.0%
Black 210 99.9% 0 0.1%
Hispanic 210 100.0% 0 0.0%
Native Hawaiian or other Pacific Islander 210 100.0% 0 0.0%
White 129 61.4% 82 38.6%
English Learners 210 100.0% 0 0.0%
Students with Free and Reduced Lunch 187 89.1% 23 10.9%
Students with Disabilities 208 99.1% 2 0.9%
Historically Marginalized Students 177 84.1% 33 15.9%
Historically Privileged Students 180 85.7% 30 14.3%
Additional Reporting Categories
Female N/A N/A N/A N/A
Male N/A N/A N/A N/A
Migrant Students N/A N/A N/A N/A
Military-Affiliated Students N/A N/A N/A N/A
Homeless Students N/A N/A N/A N/A
Students in Foster Care N/A N/A N/A N/A
* These student classifications have not been previously reported and we do not have data to
present at this time.
18
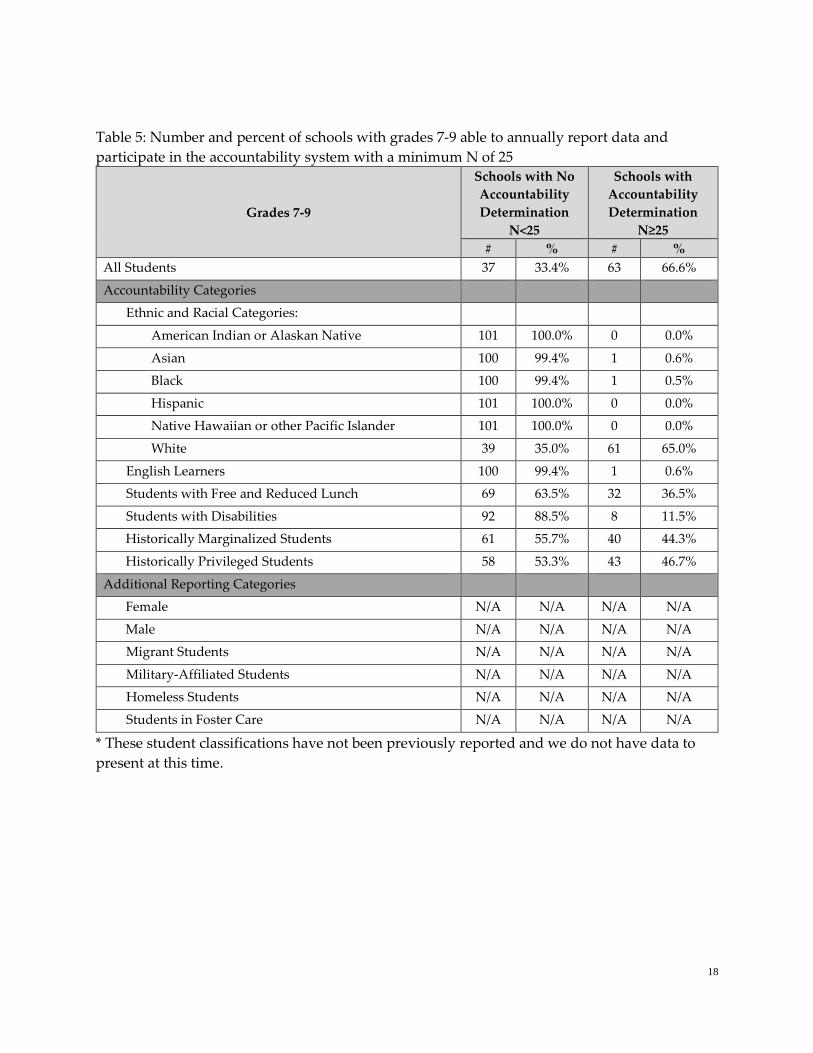
Table 5: Number and percent of schools with grades 7-9 able to annually report data and
participate in the accountability system with a minimum N of 25
Grades 7-9
Schools with No
Accountability
Determination
N<25
Schools with
Accountability
Determination
N≥25
# % # %
All Students 37 33.4% 63 66.6%
Accountability Categories
Ethnic and Racial Categories:
American Indian or Alaskan Native 101 100.0% 0 0.0%
Asian 100 99.4% 1 0.6%
Black 100 99.4% 1 0.5%
Hispanic 101 100.0% 0 0.0%
Native Hawaiian or other Pacific Islander 101 100.0% 0 0.0%
White 39 35.0% 61 65.0%
English Learners 100 99.4% 1 0.6%
Students with Free and Reduced Lunch 69 63.5% 32 36.5%
Students with Disabilities 92 88.5% 8 11.5%
Historically Marginalized Students 61 55.7% 40 44.3%
Historically Privileged Students 58 53.3% 43 46.7%
Additional Reporting Categories
Female N/A N/A N/A N/A
Male N/A N/A N/A N/A
Migrant Students N/A N/A N/A N/A
Military-Affiliated Students N/A N/A N/A N/A
Homeless Students N/A N/A N/A N/A
Students in Foster Care N/A N/A N/A N/A
* These student classifications have not been previously reported and we do not have data to
present at this time.

19
Table 6: Number and percent of Supervisory Union/Supervisory Districts able to annually
report data and participate in the accountability system with a minimum N of 25.
Student Subgroup
Schools with No
Accountability
Determination
N<25
Schools with
Accountability
Determination
N≥25
# % # %
All Students 1 1.7% 58 98.3%
Accountability Categories
Ethnic and Racial Categories:
American Indian or Alaskan Native 59 100.0% 0 0.0%
Asian 58 98.3% 1 1.7%
Black 58 98.3% 1 1.7%
Hispanic 59 100.0% 0 0.0%
Native Hawaiian or other Pacific Islander 59 100.0% 0 0.0%
White 1 1.7% 58 98.3%
English Learners 58 98.3% 1 0.7%
Students with Free and Reduced Lunch 16 27.1% 43 72.9%
Students with Disabilities 49 83.1% 10 16.9%
Historically Marginalized Students 11 18.6% 48 81.4%
Historically Privileged Students 14 23.7% 45 76.3%
Additional Reporting Categories
Female N/A N/A N/A N/A
Male N/A N/A N/A N/A
Migrant Students N/A N/A N/A N/A
Military-Affiliated Students N/A N/A N/A N/A
* These student classifications have not been previously reported and we do not have data to
present at this time.
Three Year Accountability
After three years, Vermont will be able to provide accountability data at the school level for
86.5% of elementary and nearly 100% of secondary communities.

20
Table 7: Number and percent of schools with grades 3-6 able to triennially report data and
participate in the accountability system with a minimum N of 25.
Grades 3-6
Schools with No
Accountability
Determination
N<25
Schools with
Accountability
Determination
N≥25
# % # %
All Students 29 13.5% 186 86.5%
Accountability Categories
Ethnic and Racial Categories:
American Indian or Alaskan Native 15 100.0% 0 0.0%
Asian 68 96.1% 3 3.9%
Black 79 97.5% 2 2.5%
Hispanic 106 100.0% 0 0.0%
Native Hawaiian or other Pacific Islander 10 100.0% 0 0.0%
White 10 14.0% 184 86.0%
English Learners 61 94.9% 3 5.1%
Students with Free and Reduced Lunch 106 49.7% 107 50.3%
Students with Disabilities 184 87.4% 27 12.6%
Historically Marginalized Students 88 41.1% 126 58.9%
Historically Privileged Students 97 45.3% 117 54.7%
Additional Reporting Categories
Female N/A N/A N/A N/A
Male N/A N/A N/A N/A
Migrant Students N/A N/A N/A N/A
Military-Affiliated Students N/A N/A N/A N/A
Homeless Students N/A N/A N/A N/A
Students in Foster Care N/A N/A N/A N/A
* These student classifications have not been previously reported and we do not have data to
present at this time.

21
Table 8: Number and percent of schools with grades 7-9 able to triennially report data and
participate in the accountability system with a minimum N of 25.
Grade 7-9
Schools with No
Accountability
Determination
N<25
Schools with
Accountability
Determination
N≥25
# % # %
All Students 4 0.1% 100 99.9%
Accountability Categories
Ethnic and Racial Categories:
American Indian or Alaskan Native 16 93.9% 1 6.1%
Asian 46 90.1% 5 9.9%
Black 54 94.7% 3 5.3%
Hispanic 64 99.0% 1 1.0%
Native Hawaiian or other Pacific Islander 8 100.0% 0 0.0%
White 4 3.9% 102 96.1%
English Learners 38 93.4% 3 6.6%
Students with Free and Reduced Lunch 30 28.8% 73 71.2%
Students with Disabilities 58 57.0% 44 43.0%
Historically Marginalized Students 22 21.0% 81 79.0%
Historically Privileged Students 28 27.2% 75 72.8%
Additional Reporting Categories
Female N/A N/A N/A N/A
Male N/A N/A N/A N/A
Migrant Students N/A N/A N/A N/A
Military-Affiliated Students N/A N/A N/A N/A
Homeless Students N/A N/A N/A N/A
Students in Foster Care N/A N/A N/A N/A
* These student classifications have not been previously reported and we do not have data to
present at this time.
22
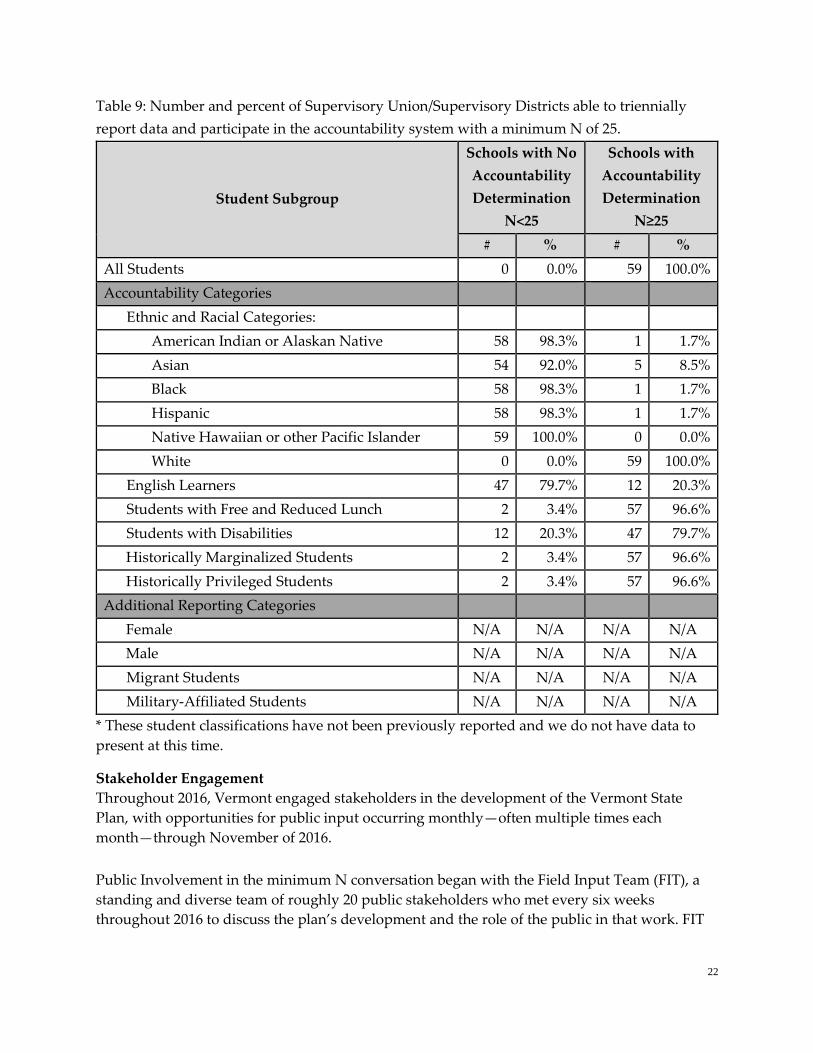
Table 9: Number and percent of Supervisory Union/Supervisory Districts able to triennially
report data and participate in the accountability system with a minimum N of 25.
Student Subgroup
Schools with No
Accountability
Determination
N<25
Schools with
Accountability
Determination
N≥25
# % # %
All Students 0 0.0% 59 100.0%
Accountability Categories
Ethnic and Racial Categories:
American Indian or Alaskan Native 58 98.3% 1 1.7%
Asian 54 92.0% 5 8.5%
Black 58 98.3% 1 1.7%
Hispanic 58 98.3% 1 1.7%
Native Hawaiian or other Pacific Islander 59 100.0% 0 0.0%
White 0 0.0% 59 100.0%
English Learners 47 79.7% 12 20.3%
Students with Free and Reduced Lunch 2 3.4% 57 96.6%
Students with Disabilities 12 20.3% 47 79.7%
Historically Marginalized Students 2 3.4% 57 96.6%
Historically Privileged Students 2 3.4% 57 96.6%
Additional Reporting Categories
Female N/A N/A N/A N/A
Male N/A N/A N/A N/A
Migrant Students N/A N/A N/A N/A
Military-Affiliated Students N/A N/A N/A N/A
* These student classifications have not been previously reported and we do not have data to
present at this time.
Stakeholder Engagement
Throughout 2016, Vermont engaged stakeholders in the development of the Vermont State
Plan, with opportunities for public input occurring monthly—often multiple times each
month—through November of 2016.
Public Involvement in the minimum N conversation began with the Field Input Team (FIT), a
standing and diverse team of roughly 20 public stakeholders who met every six weeks
throughout 2016 to discuss the plan’s development and the role of the public in that work. FIT
23
recommendations led to further public input that included additional stakeholders suggested
by FIT members, and confirmed (and often expanded upon) by the VT-AOE.
FIT members included, but were not limited to, participants representing the following groups:
• Title Community of Practitioners
• Community leaders and advocates
• English Learner educators
• Institutions of higher education
• Vermont Association for School Business Officials
• Vermont Curriculum Leaders’ Association
• Vermont National Education Association (including Special Educators)
• Vermont Principals’ Association
• Vermont State Board of Education
• Vermont State Legislature
• Vermont Superintendents’ Association
FIT meetings were held on February 29, April 18, May 31, July 11, August 22, and November 14,
all in 2016.
On May 31, the question of Vermont’s minimum N-size, for accountability purposes, was
presented to FIT. FIT recommended that the Agency take this question out for additional public
input.
On June 16, the Agency convened an input session specifically around the topic of N size. It
was attended by roughly 20 people consisting of a mix of educators and non-educators,
including teachers, administrators, policy-makers, and community stakeholders. The group
members split their recommendations between high to low N sizes, but consistently expressed a
desire for the VT-AOE to adopt a solution that would protect student privacy while ensuring
that Vermont’s exceptionally small minority student groups wouldn’t slip through our
accountability system unnoticed.
Based on this input, the VT-AOE developed the proposal described above. It was shared with
the public for additional input, in draft form, at the following events and meetings:
Public Input Retreat at Jay Peak Resort (10-11 August 2016—roughly 135 attendees)
NAACP Rutland chapter meeting (February 1, 2017—roughly 20 attendees)
Input from these meetings was used to revise the proposal, and to clarify the text framing this
proposal in the public comment version of the Vermont State Plan.
The public comment version of the plan was published on the VT-AOE’s website on January 11,
2017. The plan was divided up into sections allowing readers to comment on each section
individually. N-size was featured in a dedicated plan section. 16 people responded
24
anonymously with comments, with input being relatively evenly split between people
supporting the proposal, people who felt that the proposed N-size was too high, and people
who felt that it was too low. And, again, the driving desire expressed in the comments was that
Vermont’s N-size solution allow historically underserved students in the state to be represented
in the accountability system. Vermont used this feedback to help frame a communications plan
for this proposal that will be a part of the implementation phase of this plan, upon approval.
d. Describe how the State ensures that the minimum number is sufficient
to not reveal any personally identifiable information.4
Click here to enter text.
As a small state with small schools, Vermont has always had a challenge when balancing the
need to protect student privacy with the need to be transparent and support public
accountability efforts.
Vermont has long recognized its responsibility to protect individual students’ data privacy
within an accountability framework when disseminating information to the public about
Vermont schools and students. In 2008, the Vermont State Board of Education approved a
policy (The Data Suppression Policy for Student Information) that formalized the VT-AOE
practices of suppressing data when cell values linked to sensitive data (e.g. FRL, IEP status or
Assessment outcome data) fell below 11.
This policy has evolved over time and reflects guidance issued by Institute of Educational
Sciences (IES) (https://nces.ed.gov/pubs2017/2017147.pdf ) and is currently practiced as follows:
Cell suppression is applied whenever cell values reflecting sensitive data (e.g. FRL or
IEP status or Assessment outcome data) fall below 11 or, when cross-tabulated or cross-
referenced with other publicly reported data, could be used to back-calculate the
suppressed cell value.
Additional complementary suppression is also applied if the data product which
contains the sensitive data include column or row totals which would facilitate back-
calculation of a single suppressed cell. Complementary suppression is a practice by
which the second and or third lowest cell values (until the threshold of 11 is met) must
also be suppressed so as to prevent back calculation and reidentification of a suppressed
cell value
4 Consistent with ESEA section1111(i), information collected or disseminated under ESEA section 1111 shall be collected and
disseminated in a manner that protects the privacy of individuals consistent with section 444 of the General Education Provisions
Act (20 U.S.C. 1232g, commonly known as the “Family Educational Rights and Privacy Act of 1974”). When selecting a
minimum n-size for reporting, States should consult the Institute for Education Sciences report “Best Practices for Determining
Subgroup Size in Accountability Systems While Protecting Personally Identifiable Student Information” to identify appropriate
statistical disclosure limitation strategies for protecting student privacy.

25
These data protection practices apply to all reports which are generated by the Vermont Agency
of Education and/or by VT-AOE’s contractors and/or by third parties working on VT-AOE’s
behalf.
For the purposes of this policy
“Personally identifiable information” is information which alone or in combination
with other information is linked, or is linkable, to a specific student and which would
thereby allow a reasonable person in the school or its community, who does not have
personal knowledge of the relevant circumstances, to identify the student with
reasonable certainty.
“Sensitive information” is any information which is protected under federal and/or
state statute.
“Suppression” is a disclosure limitation method which involves removing data (e.g.,
from a cell or a row in a table) to prevent the identification of individuals in small
groups or those with unique characteristics. See pages 6-7 of this document:
http://ptac.ed.gov/sites/default/files/data_deidentification_terms.pdf
“Confidential information” is any information which is both “sensitive information”
and “personally identifiable information.”
e. If the State’s minimum number of students for purposes of reporting is
lower than the minimum number of students for accountability
purposes, provide the State’s minimum number of students for
purposes of reporting.
Click here to enter text.
For the purposes of annually reporting, the state’s minimum number of students is 11. This
number for reporting is reflects guidelines issued by IES and referenced in Section A.4.ii.d.
iii. Establishment of Long-Term Goals (ESEA section 1111(c)(4)(A)):
Long Term Goals Overview
ESSA requires that states establish long term goals for each measure. Vermont has selected
long-term goals based on input from stakeholders and our aspirations for our students.
Vermont stands behind high standards and expectations for students. We want all students to
achieve the same level of proficiency, the same positive outcomes, and the greatest
opportunities for success. Setting high standards and then failing to meet them is not equivalent
to being a failing school. Rather, schools that have yet to meet the extremely high standards we
have set for our students simply have room to grow. The Agency of Education, our school
systems, and our public are committed to moving from a language that focuses on schools as
“failing to meet” targets to one that focuses on continuous improvement for all.
26
Long Term Goals
Long term goals are set in relation to the standards we hold for ourselves and our students.
Generally, the long-term goal is a “Bull’s Eye.” These goals are intended to be aspirational, and
we hope to achieve them within 3 accountability cycles or 9 years.
a. Academic Achievement. (ESEA section 1111(c)(4)(A)(i)(I)(aa))
1. Describe the long-term goals for improved academic
achievement, as measured by proficiency on the annual
statewide reading/language arts and mathematics assessments,
for all students and for each subgroup of students, including: (1)
the timeline for meeting the long-term goals, for which the term
must be the same multi-year length of time for all students and
for each subgroup of students in the State, and (2) how the long-
term goals are ambitious.
Click here to enter text.
In describing our long term goals, we begin first by providing a picture of where our school
level performance is currently and, then, describing our long term goal.
Vermont intends to meet this requirement for 99% of students by using the computer adaptive
Smarter Balanced Assessment for English language arts and mathematics in grades 3 through 9.
This test has been used for two years in Vermont and has been submitted to the federal Peer
Review process. All studies of Smarter Balanced Assessment have demonstrated that it is a
valid and reliable tool for assessing the Common Core State Standards. The assessment includes
reports to parents and schools that clearly articulate student performance on the assessment.
Data can be disaggregated and used for accountability purposes.
For the 1% of students with the most severe cognitive disabilities, Vermont will continue using
the Dynamic Learning Map (DLM) that is developed and used by a multi-state consortium. The
assessment is given in reading/language arts and mathematics. The DLM assessment has been
created to align with the state’s common core standards in reading/language arts and
mathematics. It has been peer reviewed, and has been shown to meet the technical qualities of
assessment.
In 2015, current ELA and mathematics performance levels for all students in the State of
Vermont on the Smarter Balanced Assessment are as follows:
27
Table 10: Current ELA SBAC Performance Levels
English
Language Arts
Number of
Test Takers
State Average
Scale Score
State
Performance
Level
Number of Schools
in Each Level
Grade 03 6,089 2,438
19 44 58 43
Grade 04 5,867 2,477
27 51 47 43
Grade 05 6,043 2,515
14 40 71 40
Grade 06 5,953 2,539
11 49 59 25
Grade 07 5,834 2,562
9 36 39 13
Grade 08 5,916 2,580
11 26 45 24
Grade 09 TBD TBD TBD TBD TBD TBD TBD
Table 11: Current Mathematics SBAC Performance Levels
Mathematics Number of
Test Takers
State Average
Scale Score
State
Performance
Level
Number of Schools
in Each Level
Grade 03 6,106 2,442
22 42 69 31
Grade 04 5,867 2,482
23 70 49 26
Grade 05 6,065 2,509
50 66 34 15
Grade 06 5,969 2,522
54 58 20 13
Grade 07 5,844 2,548
31 39 25 9
Grade 08 5,914 2,564
36 32 25 13
Grade 09 TBD TBD TBD TBD TBD TBD TBD
Vermont’s long-term goal is that by 2025, 100% of our schools will show an average scale score
that is at the mid-point of the proficiency range for each grade level they serve for both English
language arts and mathematics (Bull’s Eye). This goal applies to all subgroups of students in
both ELA and mathematics. Such a goal establishes high expectations for all students and
unites the community behind all students improving their performance. Additional tables,
including tables for student groups, can be found in Tables 38 and 39 of Appendix A. At this

28
time, the vast majority of schools are not performing at this level making this an ambitious and
important goal.
2. Provide the measurements of interim progress toward meeting the long-term goals for academic achievement in Appendix A.
Tables showing the measurements of interim progress towards meeting the long-term goals are
provided in Table 38 and 39 of Appendix A.
3. Describe how the long-term goals and measurements of interim progress toward the long-term goals for academic achievement take into account the improvement necessary to make significant progress in closing statewide proficiency gaps. Click here to enter text.
Similar to other states, Vermont has struggled to meet the needs of vulnerable populations. We
have set interim targets for all students and for each sub-group that allow for meaningful
growth and improvement in reducing achievement gaps.
The state-identified goals and targets represent the growth that the state is asking each school to
make to achieve our shared goals. School systems will examine their local data to determine
their annual interim targets and will be report these targets to the state. Local systems will
identify their commitments to:
1. Exceed the state-specified goal: based on local commitments and efforts, school systems
may seek to exceed the state specified goal.
2. Meet the state specified goal: meet but not exceed the goal.
3. Maintenance of the state-specified goal: for any school currently performing above the
long-term goal, that school may establish a unique improvement goal to maintain its
current performance level.
Establishing a series of state-specified goals as a common point of reference gives local
education systems a shared reference point in establishing local continuous improvement goals.
The VT-AOE is then able to support LEAs in implementing their continuous improvement
plans through specific technical assistance and networking of schools and LEAs with similar
goals. Schools identified for Comprehensive and Targeted Supports will receive more state
assistance, but all schools will receive cyclical evaluations within Vermont’s Education Quality
Review framework to ensure that continuous improvement efforts are aligned with state and
locally-identified goals and targets.
b. Graduation Rate. (ESEA section 1111(c)(4)(A)(i)(I)(bb))
29
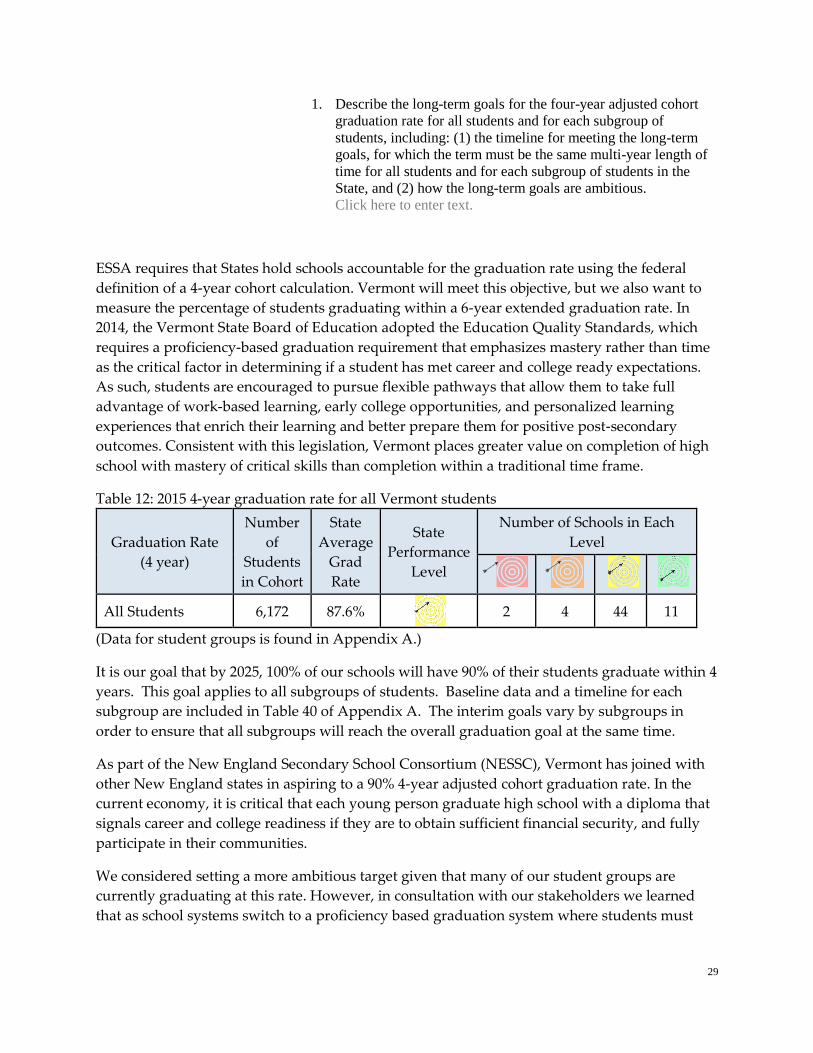
1. Describe the long-term goals for the four-year adjusted cohort
graduation rate for all students and for each subgroup of
students, including: (1) the timeline for meeting the long-term
goals, for which the term must be the same multi-year length of
time for all students and for each subgroup of students in the
State, and (2) how the long-term goals are ambitious.
Click here to enter text.
ESSA requires that States hold schools accountable for the graduation rate using the federal
definition of a 4-year cohort calculation. Vermont will meet this objective, but we also want to
measure the percentage of students graduating within a 6-year extended graduation rate. In
2014, the Vermont State Board of Education adopted the Education Quality Standards, which
requires a proficiency-based graduation requirement that emphasizes mastery rather than time
as the critical factor in determining if a student has met career and college ready expectations.
As such, students are encouraged to pursue flexible pathways that allow them to take full
advantage of work-based learning, early college opportunities, and personalized learning
experiences that enrich their learning and better prepare them for positive post-secondary
outcomes. Consistent with this legislation, Vermont places greater value on completion of high
school with mastery of critical skills than completion within a traditional time frame.
Table 12: 2015 4-year graduation rate for all Vermont students
Graduation Rate
(4 year)
Number
of
Students
in Cohort
State
Average
Grad
Rate
State
Performance
Level
Number of Schools in Each
Level
All Students 6,172 87.6%
2 4 44 11
(Data for student groups is found in Appendix A.)
It is our goal that by 2025, 100% of our schools will have 90% of their students graduate within 4
years. This goal applies to all subgroups of students. Baseline data and a timeline for each
subgroup are included in Table 40 of Appendix A. The interim goals vary by subgroups in
order to ensure that all subgroups will reach the overall graduation goal at the same time.
As part of the New England Secondary School Consortium (NESSC), Vermont has joined with
other New England states in aspiring to a 90% 4-year adjusted cohort graduation rate. In the
current economy, it is critical that each young person graduate high school with a diploma that
signals career and college readiness if they are to obtain sufficient financial security, and fully
participate in their communities.
We considered setting a more ambitious target given that many of our student groups are
currently graduating at this rate. However, in consultation with our stakeholders we learned
that as school systems switch to a proficiency based graduation system where students must
30
fully demonstrate their skill in key learning areas this would create a disincentive to insuring
that students are not artificially promoted if their skills have not met standards.
2. If applicable, describe the long-term goals for each extended-
year adjusted cohort graduation rate, including (1) the timeline
for meeting the long-term goals, for which the term must be the
same multi-year length of time for all students and for each
subgroup of students in the State; (2) how the long-term goals
are ambitious; and (3) how the long-term goals are more rigorous
than the long-term goal set for the four-year adjusted cohort
graduation rate.
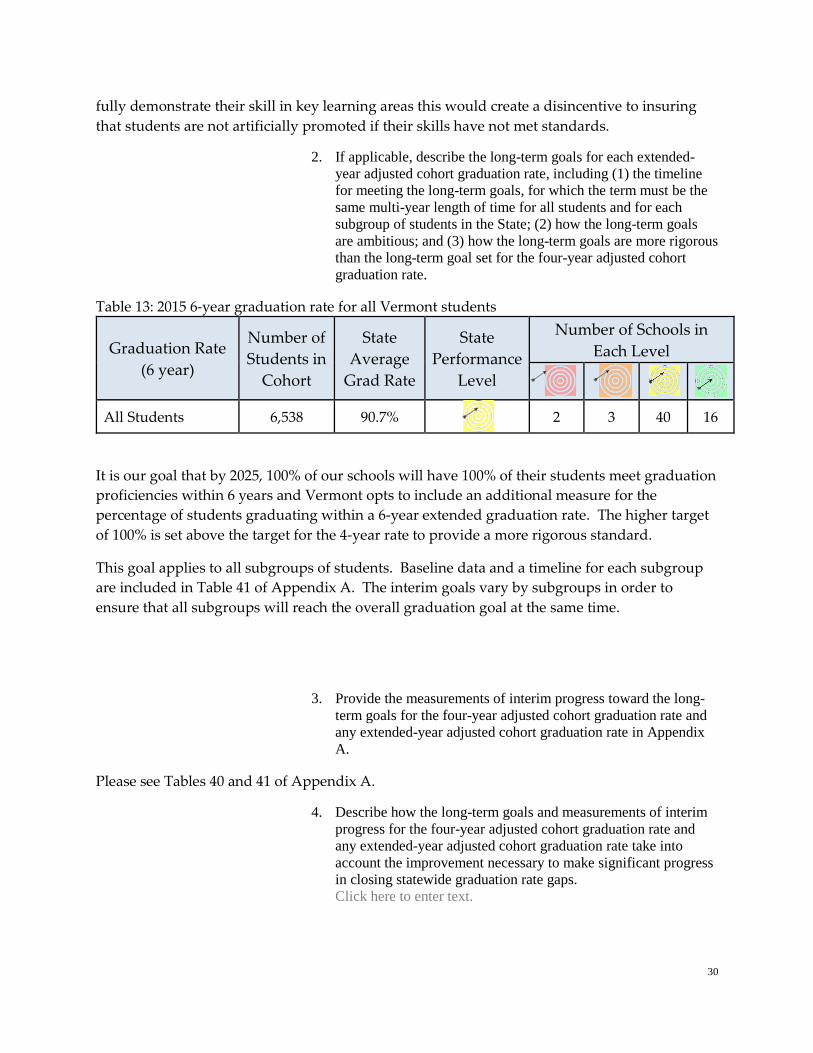
Table 13: 2015 6-year graduation rate for all Vermont students
Graduation Rate
(6 year)
Number of
Students in
Cohort
State
Average
Grad Rate
State
Performance
Level
Number of Schools in
Each Level
All Students 6,538 90.7%
2 3 40 16
It is our goal that by 2025, 100% of our schools will have 100% of their students meet graduation
proficiencies within 6 years and Vermont opts to include an additional measure for the
percentage of students graduating within a 6-year extended graduation rate. The higher target
of 100% is set above the target for the 4-year rate to provide a more rigorous standard.
This goal applies to all subgroups of students. Baseline data and a timeline for each subgroup
are included in Table 41 of Appendix A. The interim goals vary by subgroups in order to
ensure that all subgroups will reach the overall graduation goal at the same time.
3. Provide the measurements of interim progress toward the long-
term goals for the four-year adjusted cohort graduation rate and
any extended-year adjusted cohort graduation rate in Appendix
A.
Please see Tables 40 and 41 of Appendix A.
4. Describe how the long-term goals and measurements of interim
progress for the four-year adjusted cohort graduation rate and
any extended-year adjusted cohort graduation rate take into
account the improvement necessary to make significant progress
in closing statewide graduation rate gaps.
Click here to enter text.
31
Establishing a series of state-specified goals as a common point of reference gives local
education systems a shared reference point in establishing local continuous improvement goals.
The VT-AOE is then able to support LEAs in implementing their continuous improvement
plans through specific technical assistance and networking of schools and LEAs with similar
goals. Schools identified for Comprehensive and Targeted Supports will receive more state
assistance, but all schools will receive cyclical evaluations within Vermont’s Education Quality
Review framework to ensure that continuous improvement efforts are aligned with state and
locally-identified goals and targets.
The interim goals vary by subgroups in order to ensure that all subgroups will reach the overall
graduation goal at the same time.
c. English Language Proficiency. (ESEA section 1111(c)(4)(A)(ii))
1. Describe the long-term goals for English learners for increases in
the percentage of such students making progress in achieving
English language proficiency, as measured by the statewide
English language proficiency assessment, including: (1) the
State-determined timeline for such students to achieve English
language proficiency and (2) how the long-term goals are
ambitious.
Click here to enter text.
All other assessments and accountability measures are administered to every student in the
same grade level, regardless of the student groups to which they belong. This measure is
different. Beginning with ESSA, schools are required to examine both the rate at which students
who are English learners gain proficiency and whether or not they have met progress targets
along the way to proficiency. This used to be done under the Title III accountability system, but
is now embedded within the Title I accountability system.
Long Term Goal and Interim Target:
Vermont’s ambitious long-term goal is that by 2025, 100% of our schools will have 100% of
students attain English Proficiency within the time frame defined when they are first identified
as learners of English.
Gaining English Proficiency:
ESSA allows states to identify specific student characteristics to associate with the length of time
students have to gain proficiency. Vermont considered several characteristics with our
stakeholder groups and ultimately determined that the most significant determinant of how
long it takes to learn English is the students initial level of English proficiency. As a result,
students who enter school with the lowest level of proficiency in English will have the most
time to become proficient. This measure seeks to determine if students are gaining proficiency
as measured by the ACCESS 2.0 assessment in time to enjoy the full benefits of their educational
experience.
32
The timeline for students to gain proficiency is as follows:
Students identified as Level 1 using ACCESS would have 6-years to attain proficiency;
Students identified as Level 2 using ACCESS would have 5-years to attain proficiency;
Students identified as Level 3 using ACCESS would have 4-years to attain proficiency;
Students identified as Level 4 using ACCESS would have 3-years to attain proficiency;
Students identified as Level 5 using ACCESS would have 2 years to attain proficiency.
Students identified as Level 6 using ACCESS have already demonstrated proficiency in
their use of the English language and are considered English Proficient.
Current Performance:
The current Vermont framework in place during NCLB does not mandate a minimum or
maximum number of years for students to become proficient. We expect that this new proposal,
which accounts for entry level proficiency in determining goals for attaining full proficiency as
measured by ACCESS, will provide a better scaffolding for the provision of ELP supports, and
will lead to improved student and SU/SD performance on this measure.
Because Vermont does not currently assign time frames associated with ELP acquisition,
current school and state performance levels in the table below cannot be calculated.
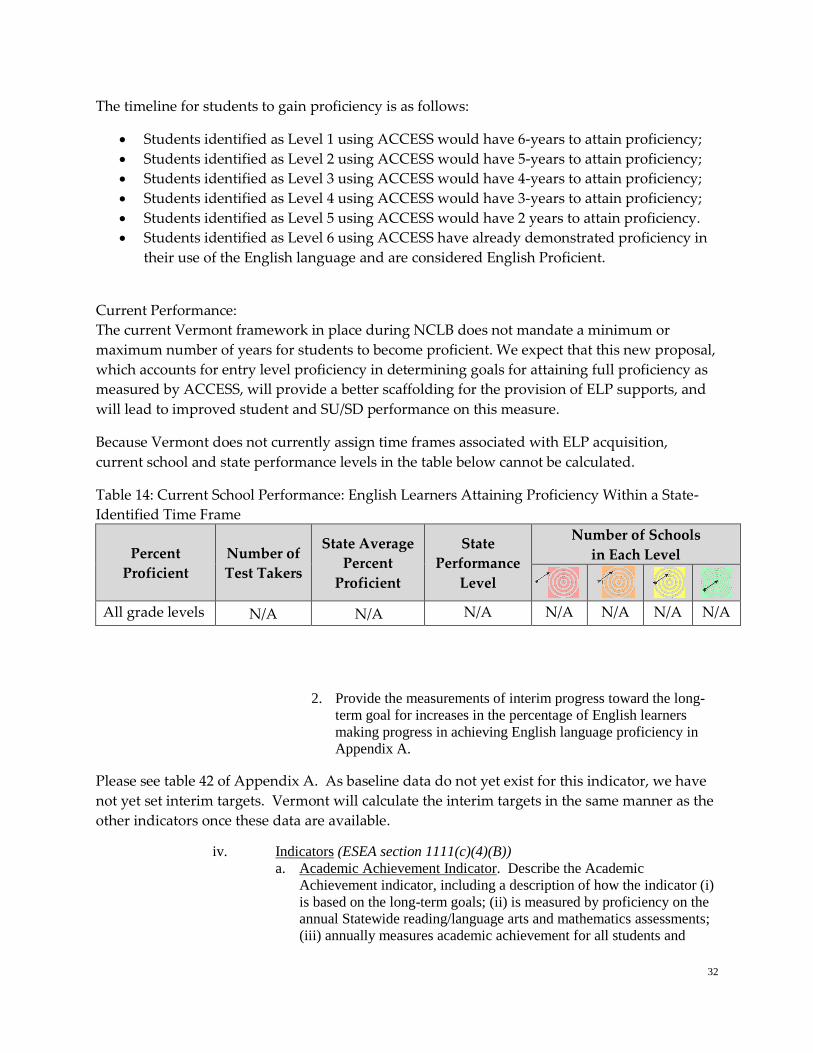
Table 14: Current School Performance: English Learners Attaining Proficiency Within a State-
Identified Time Frame
Percent
Proficient
Number of
Test Takers
State Average
Percent
Proficient
State
Performance
Level
Number of Schools
in Each Level
All grade levels N/A N/A N/A N/A N/A N/A N/A
2. Provide the measurements of interim progress toward the long-
term goal for increases in the percentage of English learners
making progress in achieving English language proficiency in
Appendix A.
Please see table 42 of Appendix A. As baseline data do not yet exist for this indicator, we have
not yet set interim targets. Vermont will calculate the interim targets in the same manner as the
other indicators once these data are available.
iv. Indicators (ESEA section 1111(c)(4)(B))
a. Academic Achievement Indicator. Describe the Academic
Achievement indicator, including a description of how the indicator (i)
is based on the long-term goals; (ii) is measured by proficiency on the
annual Statewide reading/language arts and mathematics assessments;
(iii) annually measures academic achievement for all students and
33
separately for each subgroup of students; and (iv) at the State’s
discretion, for each public high school in the State, includes a measure
of student growth, as measured by the annual Statewide
reading/language arts and mathematics assessments.
Click here to enter text.
In all cases, unless specifically mentioned, scores are averaged using a simple mean. When
combining multiple grade levels, the scores are averaged with equivalent weights. When
required to merge data over three years, we follow the same process of simple averages.
Levels of Performance Overview
This Levels of Performance overview applies to all of Vermont’s identified performance
indicators, within our accountability model.
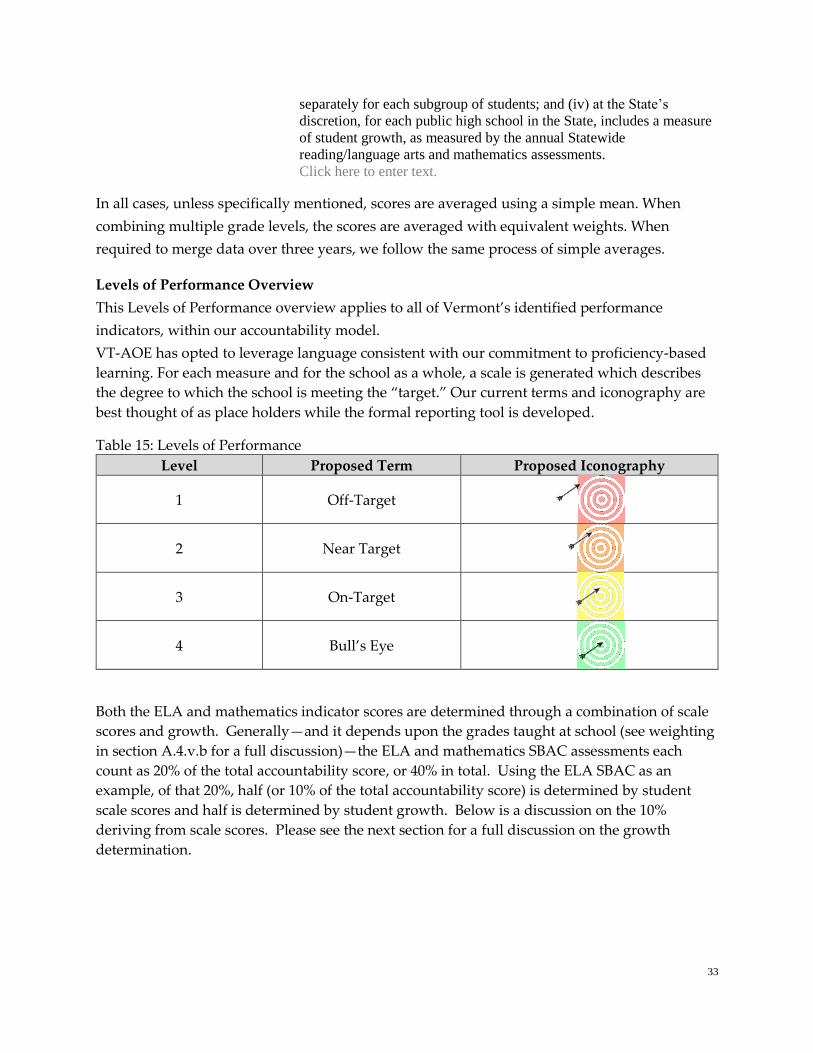
VT-AOE has opted to leverage language consistent with our commitment to proficiency-based
learning. For each measure and for the school as a whole, a scale is generated which describes
the degree to which the school is meeting the “target.” Our current terms and iconography are
best thought of as place holders while the formal reporting tool is developed.
Table 15: Levels of Performance
Level Proposed Term Proposed Iconography
1 Off-Target
2 Near Target
3 On-Target
4 Bull’s Eye
Both the ELA and mathematics indicator scores are determined through a combination of scale
scores and growth. Generally—and it depends upon the grades taught at school (see weighting
in section A.4.v.b for a full discussion)—the ELA and mathematics SBAC assessments each
count as 20% of the total accountability score, or 40% in total. Using the ELA SBAC as an
example, of that 20%, half (or 10% of the total accountability score) is determined by student
scale scores and half is determined by student growth. Below is a discussion on the 10%
deriving from scale scores. Please see the next section for a full discussion on the growth
determination.
34
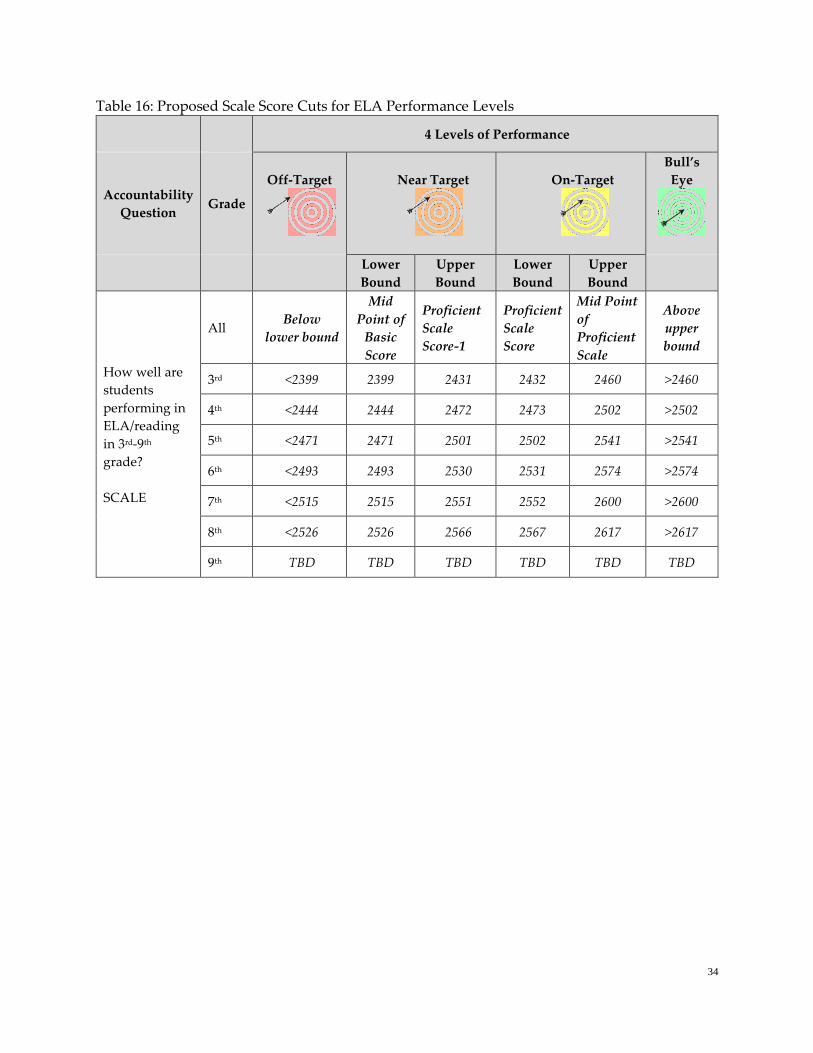
Table 16: Proposed Scale Score Cuts for ELA Performance Levels
4 Levels of Performance
Accountability
Question Grade
Off-Target
Near Target
On-Target
Bull’s
Eye
Lower
Bound
Upper
Bound
Lower
Bound
Upper
Bound
How well are
students
performing in
ELA/reading
in 3rd-9th
grade?
SCALE
All Below
lower bound
Mid
Point of
Basic
Score
Proficient
Scale
Score-1
Proficient
Scale
Score
Mid Point
of
Proficient
Scale
Above
upper
bound
3rd <2399 2399 2431 2432 2460 >2460
4th <2444 2444 2472 2473 2502 >2502
5th <2471 2471 2501 2502 2541 >2541
6th <2493 2493 2530 2531 2574 >2574
7th <2515 2515 2551 2552 2600 >2600
8th <2526 2526 2566 2567 2617 >2617
9th TBD TBD TBD TBD TBD TBD
35
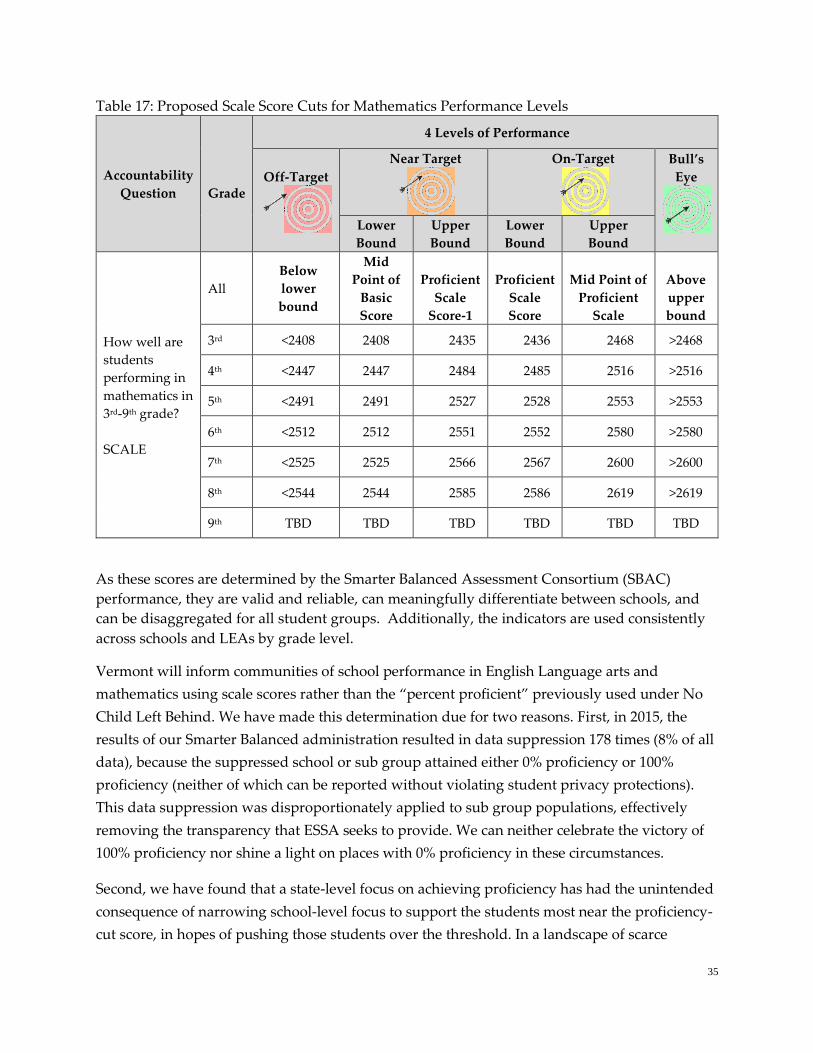
Table 17: Proposed Scale Score Cuts for Mathematics Performance Levels
Accountability
Question
Grade
4 Levels of Performance
Off-Target
Near Target
On-Target
Bull’s
Eye
Lower
Bound
Upper
Bound
Lower
Bound
Upper
Bound
How well are
students
performing in
mathematics in
3rd-9th grade?
SCALE
All
Below
lower
bound
Mid
Point of
Basic
Score
Proficient
Scale
Score-1
Proficient
Scale
Score
Mid Point of
Proficient
Scale
Above
upper
bound
3rd <2408 2408 2435 2436 2468 >2468
4th <2447 2447 2484 2485 2516 >2516
5th <2491 2491 2527 2528 2553 >2553
6th <2512 2512 2551 2552 2580 >2580
7th <2525 2525 2566 2567 2600 >2600
8th <2544 2544 2585 2586 2619 >2619
9th TBD TBD TBD TBD TBD TBD
As these scores are determined by the Smarter Balanced Assessment Consortium (SBAC)
performance, they are valid and reliable, can meaningfully differentiate between schools, and
can be disaggregated for all student groups. Additionally, the indicators are used consistently
across schools and LEAs by grade level.
Vermont will inform communities of school performance in English Language arts and
mathematics using scale scores rather than the “percent proficient” previously used under No
Child Left Behind. We have made this determination due for two reasons. First, in 2015, the
results of our Smarter Balanced administration resulted in data suppression 178 times (8% of all
data), because the suppressed school or sub group attained either 0% proficiency or 100%
proficiency (neither of which can be reported without violating student privacy protections).
This data suppression was disproportionately applied to sub group populations, effectively
removing the transparency that ESSA seeks to provide. We can neither celebrate the victory of
100% proficiency nor shine a light on places with 0% proficiency in these circumstances.
Second, we have found that a state-level focus on achieving proficiency has had the unintended
consequence of narrowing school-level focus to support the students most near the proficiency-
cut score, in hopes of pushing those students over the threshold. In a landscape of scarce
36
resources, this strategy has made sense to many well-meaning educators, but it is not the
desired goal of the accountability efforts.
Vermont will use scale scores with a reference to the proficiency cut score to communicate
school level performance to parents. By choosing this approach we will be able to report all
scores for all groups meeting the minimum N without fear of revealing personally identifiable
information. In addition, it will rightfully focus schools on improving the educational outcomes
of all students, so that gains made by students will be “counted” whether or not they cross an
arbitrary line of proficiency
Vermont agrees that full participation in assessments is critical for making informed decisions.
We will hold all schools to a 95% participation rate for all students and student groups. Please
see Section A.4.vii.
This proposal reinforces expectations established in the Education Quality Standards and state
law requiring that students are assessed annually. Vermont is also currently adopting
proficiency based learning, which emphasizes that scores are for the learning demonstrated and
not ancillary behaviors. By having participation named as a key variable and not hidden within
a larger equation or weighting conversation we operate in parallel to that effort.
b. Indicator for Public Elementary and Secondary Schools that are Not
High Schools (Other Academic Indicator). Describe the Other
Academic indicator, including how it annually measures the
performance for all students and separately for each subgroup of
students. If the Other Academic indicator is not a measure of student
growth, the description must include a demonstration that the indicator
is a valid and reliable statewide academic indicator that allows for
meaningful differentiation in school performance.
Click here to enter text.
Growth Score:
Vermont intends to measure student growth in both English language arts and mathematics
using the Student Growth Percentile (SGP) method. This method requires three consecutive
years of data, making it a valid measurement for 5th-9th grades. We plan to use the baseline data
from Spring 2016 as the first year of data for determining the growth calculation, so that the first
year of growth scores will be available following assessments administered in Spring 2018.
We have selected this model because it is capable of providing a measure of individual student
growth as well as capturing movement toward a particular criterion-based attainment level,
while avoiding erroneous causal inferences that other models (e.g. value added models) have
made in the past (Betebenner, 20095). SGPs provide a means of illustrating a student’s change in
5 Betebenner, D. W. (2009). Norm- and Criterion-Referenced Student Growth. Educational Measurement: Issues and Practice, 28(4), 42–51. https://doi.org/10.1111/j.1745-3992.2009.00161.x
37
performance over time compared with students who share similar characteristics and who have
performed in similar ways in the past (i.e. a student’s academic peer group). They can be used
with criterion-based reference points to predict the amount of growth students would need to
attain in order to reach particular criteria levels in the future while still providing room for
recognizing the growth students have made relative to their academic peers. In general, SGPs
work as follows:
A student's current level of achievement is compared to that student's previous level of
achievement in order to normatively determine the rate of achievement growth. The resultant
percentile reflects the likelihood of a student achieving a certain outcome, given the student's
prior achievement. The relationship between prior and current achievement scores for cohorts
of students in the norm group can be used to generate growth trajectories based on historical
and anticipated rates of growth to predict the likelihood of future achievement for students
statewide (Betebenner, 2008, 2009) and may thereby enable assumptions regarding growth over
time. (Kannan, 2016, p. 106)
Our intention is to model growth rates for Vermont and all of our schools, including high
schools, using data gleaned in three assessments (2015, 2016, and 2017) to model the data.
Following the analysis, we will convene stakeholders to review the data and assist in
identifying the cut scores for the four levels of performance. We anticipate having this
accomplished by December of 2017 and will provide an update to USED and stakeholders
regarding the determination made at that point.
6 Kannan, P. (2016). Vertical Articulation of Cut Scores Across the Grades: Current Practices and Methodological Implications in the Light of the Next Generation of K–12 Assessments (ETS Research Report Series). DOI: 10.1002/ets2.12115: Educational Testing Service. Retrieved from http://onlinelibrary.wiley.com/doi/10.1002/ets2.12115/abstract
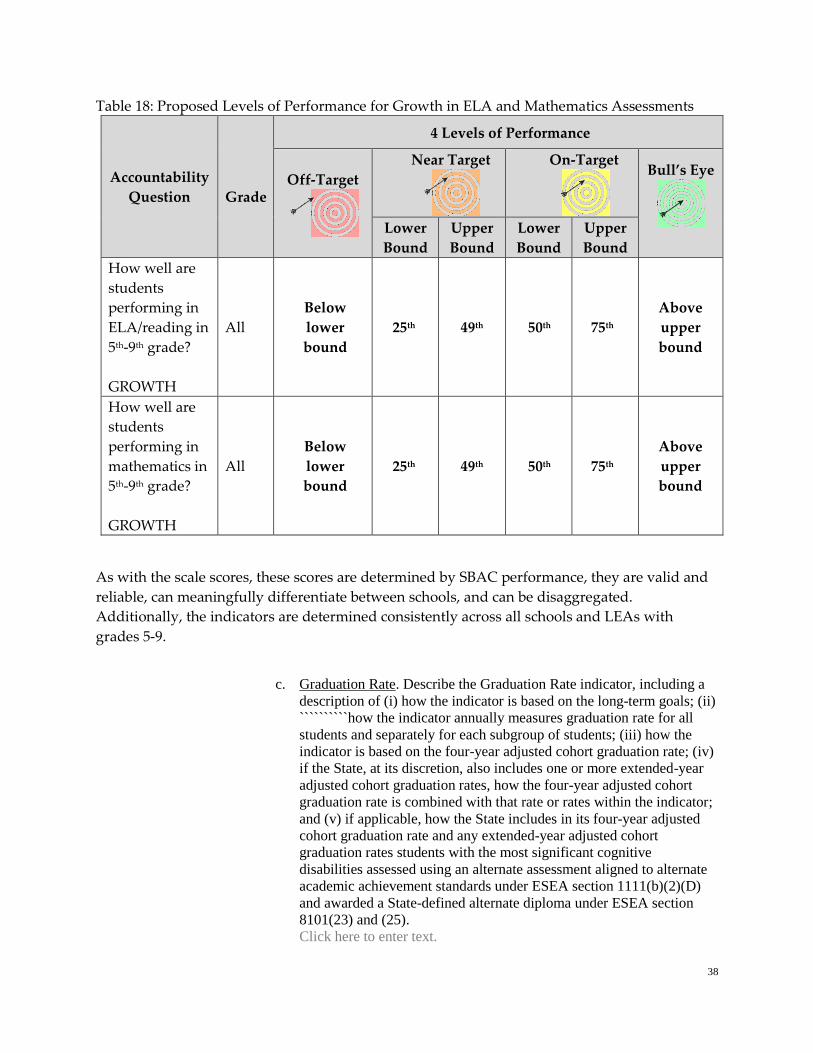
38
Table 18: Proposed Levels of Performance for Growth in ELA and Mathematics Assessments
As with the scale scores, these scores are determined by SBAC performance, they are valid and
reliable, can meaningfully differentiate between schools, and can be disaggregated.
Additionally, the indicators are determined consistently across all schools and LEAs with
grades 5-9.
c. Graduation Rate. Describe the Graduation Rate indicator, including a
description of (i) how the indicator is based on the long-term goals; (ii)
``````````how the indicator annually measures graduation rate for all
students and separately for each subgroup of students; (iii) how the
indicator is based on the four-year adjusted cohort graduation rate; (iv)
if the State, at its discretion, also includes one or more extended-year
adjusted cohort graduation rates, how the four-year adjusted cohort
graduation rate is combined with that rate or rates within the indicator;
and (v) if applicable, how the State includes in its four-year adjusted
cohort graduation rate and any extended-year adjusted cohort
graduation rates students with the most significant cognitive
disabilities assessed using an alternate assessment aligned to alternate
academic achievement standards under ESEA section 1111(b)(2)(D)
and awarded a State-defined alternate diploma under ESEA section
8101(23) and (25).
Click here to enter text.
Accountability
Question
Grade
4 Levels of Performance
Off-Target
Near Target
On-Target
Bull’s Eye
Lower
Bound
Upper
Bound
Lower
Bound
Upper
Bound
How well are
students
performing in
ELA/reading in
5th-9th grade?
GROWTH
All
Below
lower
bound
25th 49th 50th 75th
Above
upper
bound
How well are
students
performing in
mathematics in
5th-9th grade?
GROWTH
All
Below
lower
bound
25th 49th 50th 75th
Above
upper
bound
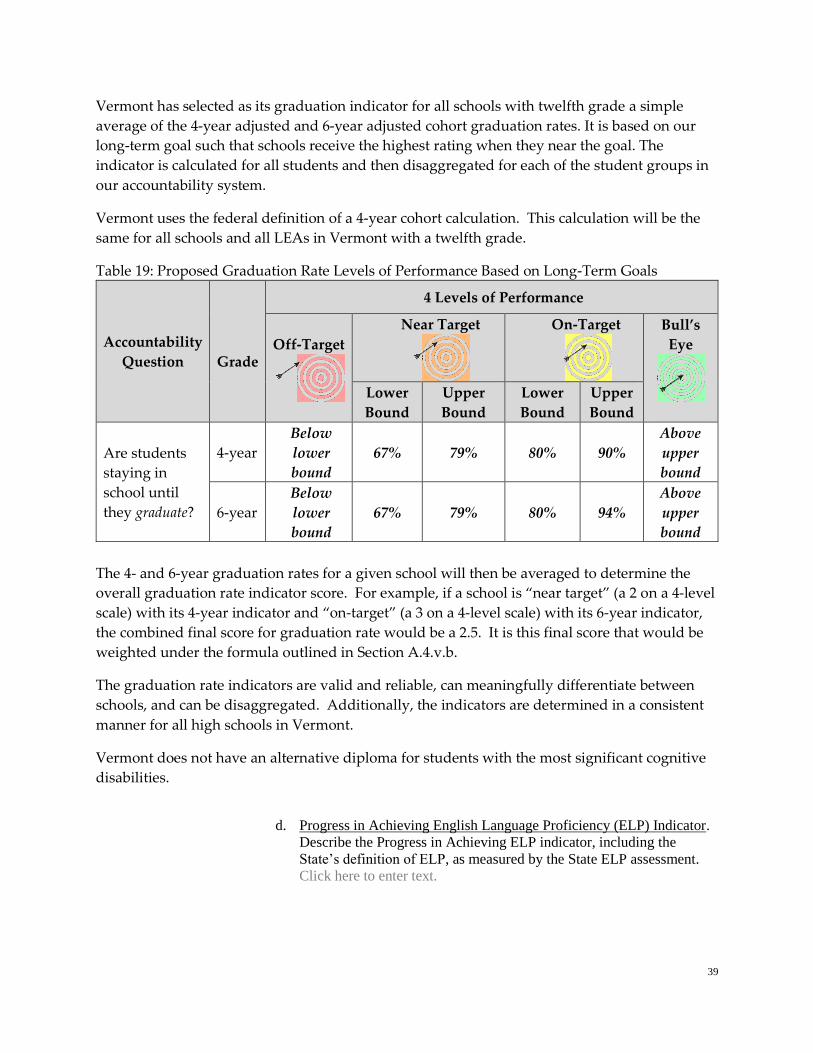
39
Vermont has selected as its graduation indicator for all schools with twelfth grade a simple
average of the 4-year adjusted and 6-year adjusted cohort graduation rates. It is based on our
long-term goal such that schools receive the highest rating when they near the goal. The
indicator is calculated for all students and then disaggregated for each of the student groups in
our accountability system.
Vermont uses the federal definition of a 4-year cohort calculation. This calculation will be the
same for all schools and all LEAs in Vermont with a twelfth grade.
Table 19: Proposed Graduation Rate Levels of Performance Based on Long-Term Goals
Accountability
Question
Grade
4 Levels of Performance
Off-Target
Near Target
On-Target
Bull’s
Eye
Lower
Bound
Upper
Bound
Lower
Bound
Upper
Bound
Are students
staying in
school until
they graduate?
4-year
Below
lower
bound
67% 79% 80% 90%
Above
upper
bound
6-year
Below
lower
bound
67% 79% 80% 94%
Above
upper
bound
The 4- and 6-year graduation rates for a given school will then be averaged to determine the
overall graduation rate indicator score. For example, if a school is “near target” (a 2 on a 4-level
scale) with its 4-year indicator and “on-target” (a 3 on a 4-level scale) with its 6-year indicator,
the combined final score for graduation rate would be a 2.5. It is this final score that would be
weighted under the formula outlined in Section A.4.v.b.
The graduation rate indicators are valid and reliable, can meaningfully differentiate between
schools, and can be disaggregated. Additionally, the indicators are determined in a consistent
manner for all high schools in Vermont.
Vermont does not have an alternative diploma for students with the most significant cognitive
disabilities.
d. Progress in Achieving English Language Proficiency (ELP) Indicator.
Describe the Progress in Achieving ELP indicator, including the
State’s definition of ELP, as measured by the State ELP assessment.
Click here to enter text.
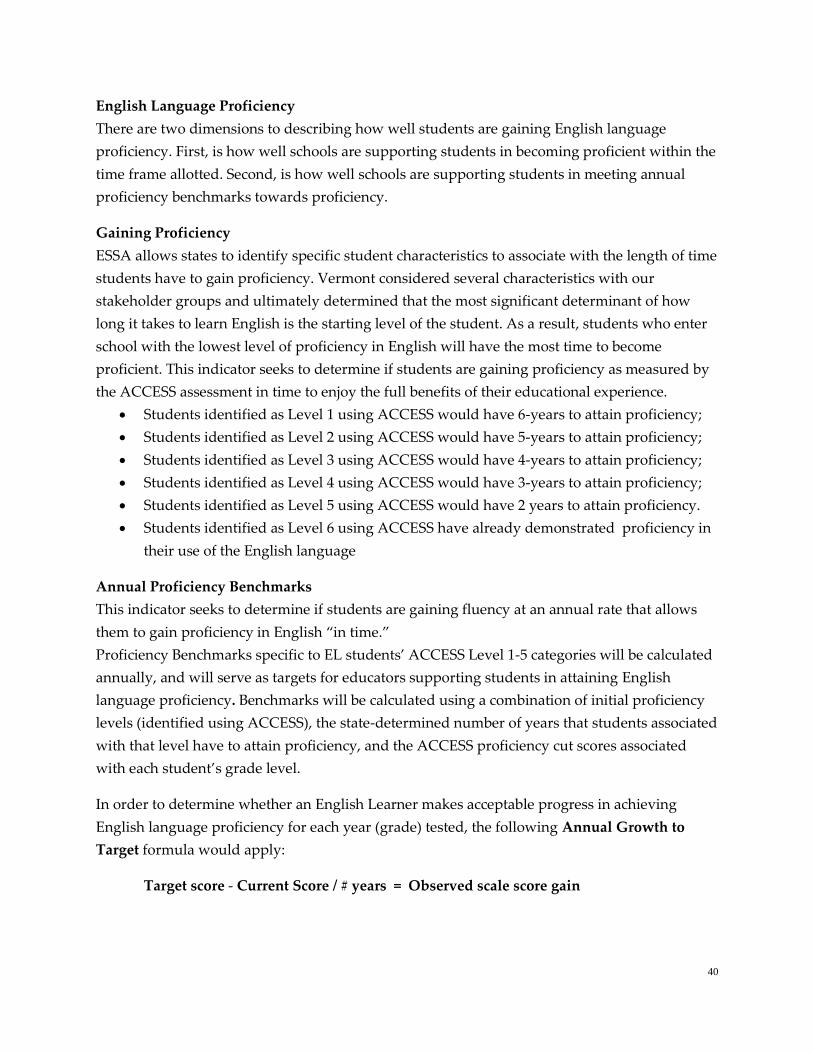
40
English Language Proficiency
There are two dimensions to describing how well students are gaining English language
proficiency. First, is how well schools are supporting students in becoming proficient within the
time frame allotted. Second, is how well schools are supporting students in meeting annual
proficiency benchmarks towards proficiency.
Gaining Proficiency
ESSA allows states to identify specific student characteristics to associate with the length of time
students have to gain proficiency. Vermont considered several characteristics with our
stakeholder groups and ultimately determined that the most significant determinant of how
long it takes to learn English is the starting level of the student. As a result, students who enter
school with the lowest level of proficiency in English will have the most time to become
proficient. This indicator seeks to determine if students are gaining proficiency as measured by
the ACCESS assessment in time to enjoy the full benefits of their educational experience.
Students identified as Level 1 using ACCESS would have 6-years to attain proficiency;
Students identified as Level 2 using ACCESS would have 5-years to attain proficiency;
Students identified as Level 3 using ACCESS would have 4-years to attain proficiency;
Students identified as Level 4 using ACCESS would have 3-years to attain proficiency;
Students identified as Level 5 using ACCESS would have 2 years to attain proficiency.
Students identified as Level 6 using ACCESS have already demonstrated proficiency in
their use of the English language
Annual Proficiency Benchmarks
This indicator seeks to determine if students are gaining fluency at an annual rate that allows
them to gain proficiency in English “in time.”
Proficiency Benchmarks specific to EL students’ ACCESS Level 1-5 categories will be calculated
annually, and will serve as targets for educators supporting students in attaining English
language proficiency. Benchmarks will be calculated using a combination of initial proficiency
levels (identified using ACCESS), the state-determined number of years that students associated
with that level have to attain proficiency, and the ACCESS proficiency cut scores associated
with each student’s grade level.
In order to determine whether an English Learner makes acceptable progress in achieving
English language proficiency for each year (grade) tested, the following Annual Growth to
Target formula would apply:
Target score - Current Score / # years = Observed scale score gain
41
Target Score = overall proficient scale score for attainment in X years, based on
initial proficiency level
Current Score = overall scale score
Years = # years that remain to attain proficiency in pre-determined time frame.
The expected growth target(s) would be reset every year until proficiency is attained and
would be unique to each student. If a student does not attain proficiency within the time frame
identified for them, based on their initial performance on the ACCESS assessment, the “Years”
variable in the above equation would be set as “1”.
As these scores are determined by ACCESS performance, they are valid and reliable, can
meaningfully differentiate between schools, and can be disaggregated. Additionally, the
indicators are determined consistently across schools and LEAs.
e. School Quality or Student Success Indicator(s). Describe each School
Quality or Student Success Indicator, including, for each such
indicator: (i) how it allows for meaningful differentiation in school
performance; (ii) that it is valid, reliable, comparable, and statewide
(for the grade span(s) to which it applies); and (iii) of how each such
indicator annually measures performance for all students and
separately for each subgroup of students. For any School Quality or
Student Success indicator that does not apply to all grade spans, the
description must include the grade spans to which it does apply.
Click here to enter text.
To reflect a broad range of measures of school performance, Vermont has elected to propose
four “fifth” indicators for inclusion in our accountability system:
Science
Physical Education
Career and college readiness
Post-secondary outcomes
Each of these proposed indicators will be used for all schools in the grade span for which they
apply and are calculated consistently across these schools.
“Fifth” Indicator 1: How well are student performing in science?
ESSA does not require that schools be held accountable for student outcomes in science.
Vermont has elected to include science performance in our accountability plan. We have made
this determination in response to stakeholder input which asked that if students are required to
sit for assessments, those assessments ought to provide data that informs the assessment of
school quality. Additionally, by including more indicators than are required to assess standards
implementation under Education Quality Standards, we remind all schools of the value that we

42
place on all subjects and hope to avoid an over-narrowing of instruction to only literacy and
mathematics.
Average Scale Score:
Consistent with our assessment of English-Language Arts and Mathematics, we intend to
measure performance against scale scores.
Levels of Performance:
As previously stated, all indicators will be linked to a 4-level label to describe performance. The
currently proposed scale score cuts link directly to the current NECAP performance levels.
While the new science test is not yet created, the Agency is providing data, in Table 17,
reflecting continued use of the current New England Common Assessment Program assessment
(NECAP-Science). This table will be replaced to reflect the new, NGSS-aligned assessment and
submitted to USED and stakeholders prior to the field-test in 2018.
Table 20: Proposed Scale Score Cuts for Science Performance Levels
Accountability
Question
Grade
4 Levels of Performance
Off-
Target
1
Near Target
2
On-Target
3
Bull’s
Eye
4
Lower
Bound
Upper
Bound
Lower
Bound
Upper
Bound
How well are
students
performing in
Science?
SCALE
All
Below
lower
bound
Mid
Point
of
Basic
Score
Proficient
Scale
Score-1
Proficient
Scale
Score
Mid Point
of
Proficient
Scale
Above
upper
bound
4th <433 433 439 440 471 >471
8th <834 834 839 840 867 >867
11th <1134 1134 1139 1140 1166 >1166
Current Performance:
In 2015, current performance levels for all students in the State of Vermont on the NECAP
Science assessment are as follows:
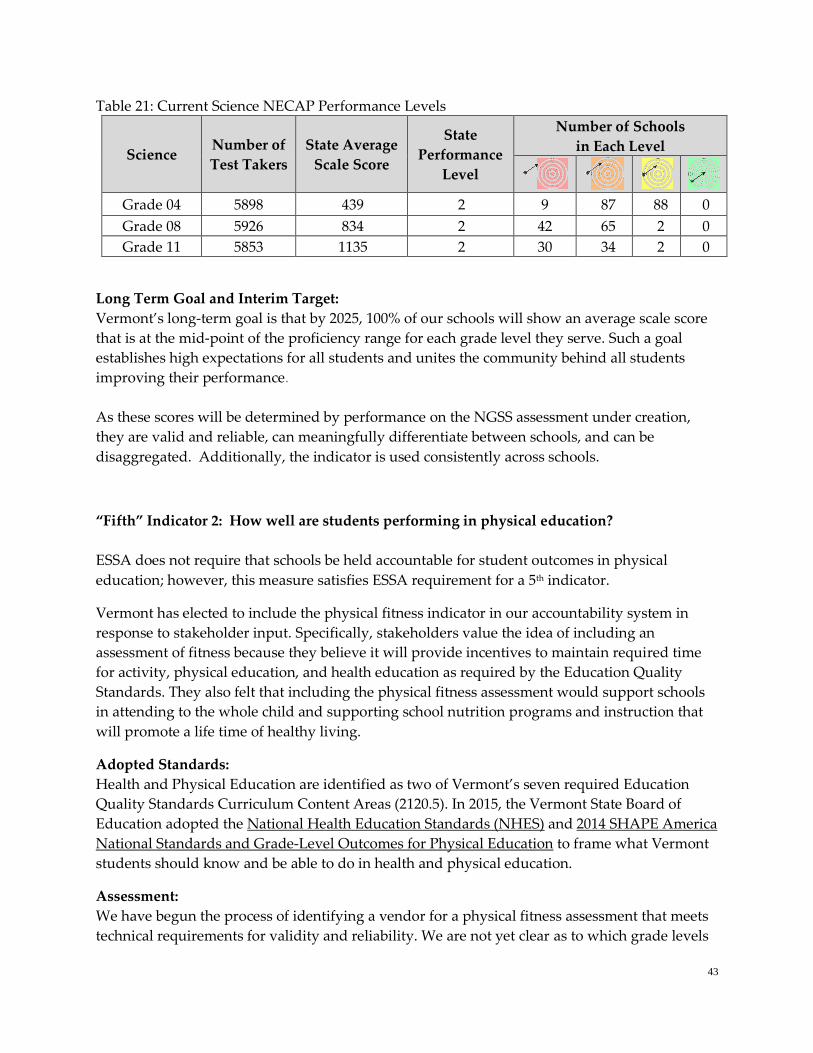
43
Table 21: Current Science NECAP Performance Levels
Science Number of
Test Takers
State Average
Scale Score
State
Performance
Level
Number of Schools
in Each Level
Grade 04 5898 439 2 9 87 88 0
Grade 08 5926 834 2 42 65 2 0
Grade 11 5853 1135 2 30 34 2 0
Long Term Goal and Interim Target:
Vermont’s long-term goal is that by 2025, 100% of our schools will show an average scale score
that is at the mid-point of the proficiency range for each grade level they serve. Such a goal
establishes high expectations for all students and unites the community behind all students
improving their performance.
As these scores will be determined by performance on the NGSS assessment under creation,
they are valid and reliable, can meaningfully differentiate between schools, and can be
disaggregated. Additionally, the indicator is used consistently across schools.
“Fifth” Indicator 2: How well are students performing in physical education?
ESSA does not require that schools be held accountable for student outcomes in physical
education; however, this measure satisfies ESSA requirement for a 5th indicator.
Vermont has elected to include the physical fitness indicator in our accountability system in
response to stakeholder input. Specifically, stakeholders value the idea of including an
assessment of fitness because they believe it will provide incentives to maintain required time
for activity, physical education, and health education as required by the Education Quality
Standards. They also felt that including the physical fitness assessment would support schools
in attending to the whole child and supporting school nutrition programs and instruction that
will promote a life time of healthy living.
Adopted Standards:
Health and Physical Education are identified as two of Vermont’s seven required Education
Quality Standards Curriculum Content Areas (2120.5). In 2015, the Vermont State Board of
Education adopted the National Health Education Standards (NHES) and 2014 SHAPE America
National Standards and Grade-Level Outcomes for Physical Education to frame what Vermont
students should know and be able to do in health and physical education.
Assessment:
We have begun the process of identifying a vendor for a physical fitness assessment that meets
technical requirements for validity and reliability. We are not yet clear as to which grade levels
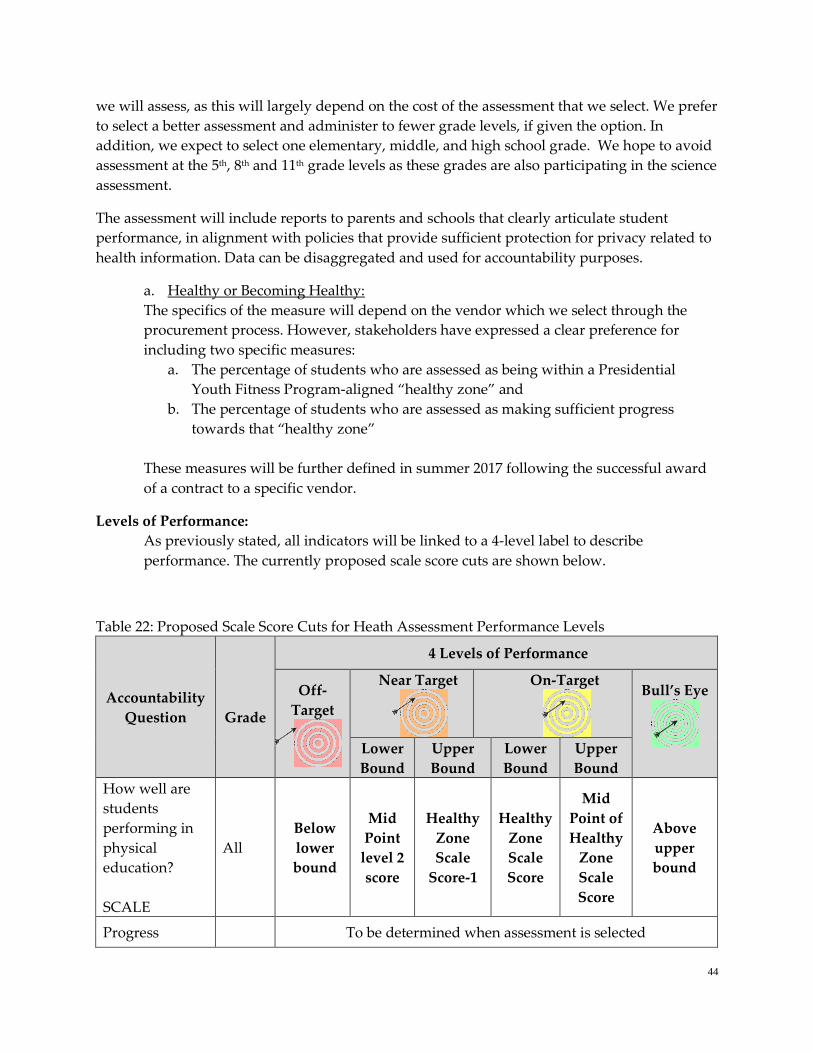
44
we will assess, as this will largely depend on the cost of the assessment that we select. We prefer
to select a better assessment and administer to fewer grade levels, if given the option. In
addition, we expect to select one elementary, middle, and high school grade. We hope to avoid
assessment at the 5th, 8th and 11th grade levels as these grades are also participating in the science
assessment.
The assessment will include reports to parents and schools that clearly articulate student
performance, in alignment with policies that provide sufficient protection for privacy related to
health information. Data can be disaggregated and used for accountability purposes.
a. Healthy or Becoming Healthy:
The specifics of the measure will depend on the vendor which we select through the
procurement process. However, stakeholders have expressed a clear preference for
including two specific measures:
a. The percentage of students who are assessed as being within a Presidential
Youth Fitness Program-aligned “healthy zone” and
b. The percentage of students who are assessed as making sufficient progress
towards that “healthy zone”
These measures will be further defined in summer 2017 following the successful award
of a contract to a specific vendor.
Levels of Performance:
As previously stated, all indicators will be linked to a 4-level label to describe
performance. The currently proposed scale score cuts are shown below.
Table 22: Proposed Scale Score Cuts for Heath Assessment Performance Levels
Accountability
Question
Grade
4 Levels of Performance
Off-
Target
Near Target
On-Target
Bull’s Eye
Lower
Bound
Upper
Bound
Lower
Bound
Upper
Bound
How well are
students
performing in
physical
education?
SCALE
All
Below
lower
bound
Mid
Point
level 2
score
Healthy
Zone
Scale
Score-1
Healthy
Zone
Scale
Score
Mid
Point of
Healthy
Zone
Scale
Score
Above
upper
bound
Progress To be determined when assessment is selected
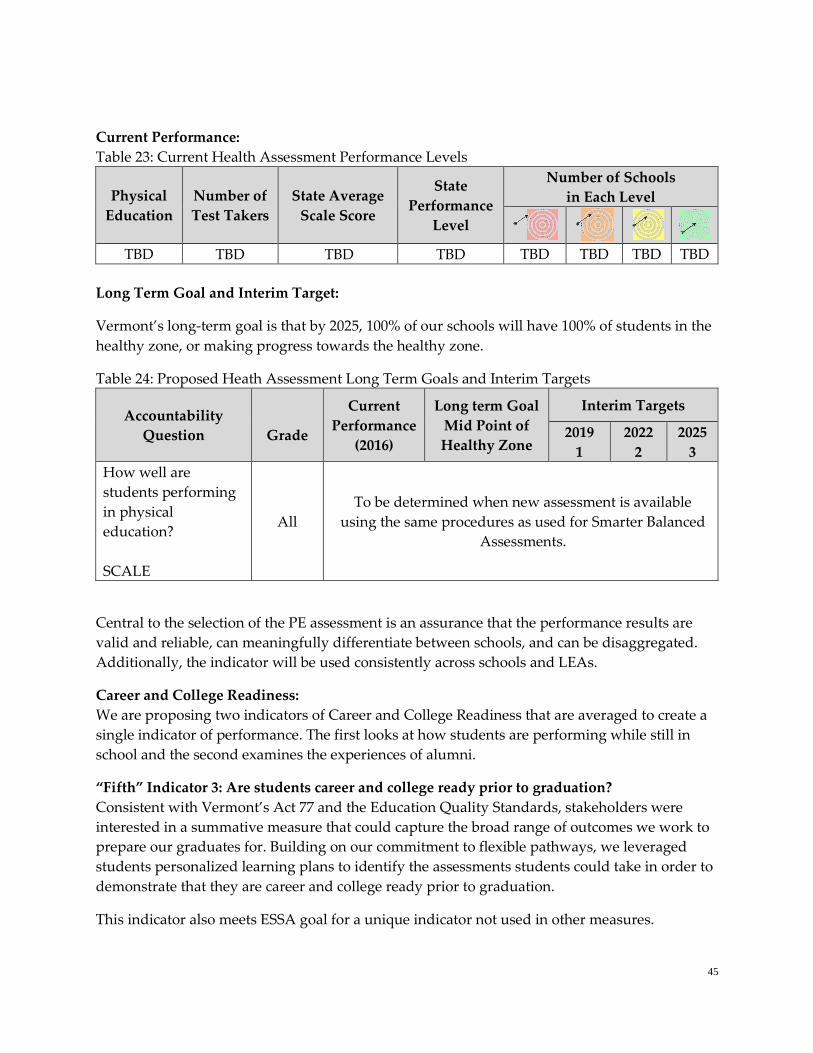
45
Current Performance:
Table 23: Current Health Assessment Performance Levels
Physical
Education
Number of
Test Takers
State Average
Scale Score
State
Performance
Level
Number of Schools
in Each Level
TBD TBD TBD TBD TBD TBD TBD TBD
Long Term Goal and Interim Target:
Vermont’s long-term goal is that by 2025, 100% of our schools will have 100% of students in the
healthy zone, or making progress towards the healthy zone.
Table 24: Proposed Heath Assessment Long Term Goals and Interim Targets
Accountability
Question
Grade
Current
Performance
(2016)
Long term Goal
Mid Point of
Healthy Zone
Interim Targets
2019
1
2022
2
2025
3
How well are
students performing
in physical
education?
SCALE
All
To be determined when new assessment is available
using the same procedures as used for Smarter Balanced
Assessments.
Central to the selection of the PE assessment is an assurance that the performance results are
valid and reliable, can meaningfully differentiate between schools, and can be disaggregated.
Additionally, the indicator will be used consistently across schools and LEAs.
Career and College Readiness:
We are proposing two indicators of Career and College Readiness that are averaged to create a
single indicator of performance. The first looks at how students are performing while still in
school and the second examines the experiences of alumni.
“Fifth” Indicator 3: Are students career and college ready prior to graduation?
Consistent with Vermont’s Act 77 and the Education Quality Standards, stakeholders were
interested in a summative measure that could capture the broad range of outcomes we work to
prepare our graduates for. Building on our commitment to flexible pathways, we leveraged
students personalized learning plans to identify the assessments students could take in order to
demonstrate that they are career and college ready prior to graduation.
This indicator also meets ESSA goal for a unique indicator not used in other measures.
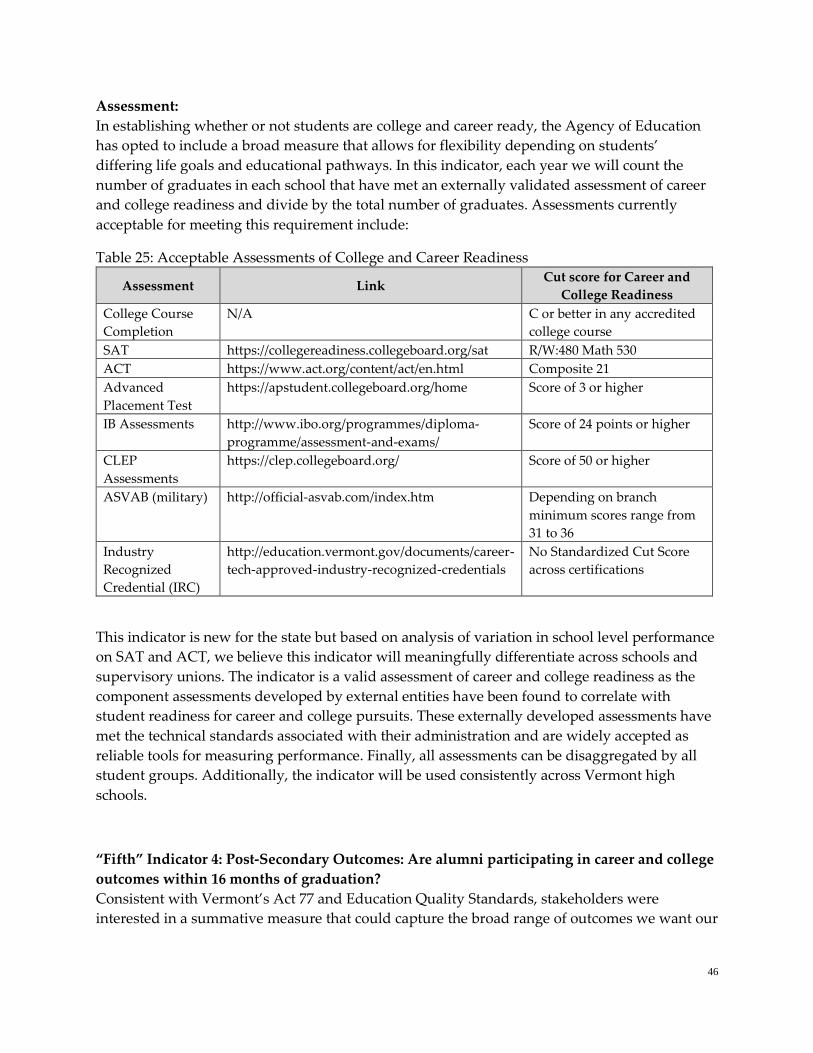
46
Assessment:
In establishing whether or not students are college and career ready, the Agency of Education
has opted to include a broad measure that allows for flexibility depending on students’
differing life goals and educational pathways. In this indicator, each year we will count the
number of graduates in each school that have met an externally validated assessment of career
and college readiness and divide by the total number of graduates. Assessments currently
acceptable for meeting this requirement include:
Table 25: Acceptable Assessments of College and Career Readiness
Assessment Link Cut score for Career and
College Readiness
College Course
Completion
N/A C or better in any accredited
college course
SAT https://collegereadiness.collegeboard.org/sat R/W:480 Math 530
ACT https://www.act.org/content/act/en.html Composite 21
Advanced
Placement Test
https://apstudent.collegeboard.org/home Score of 3 or higher
IB Assessments http://www.ibo.org/programmes/diploma-
programme/assessment-and-exams/
Score of 24 points or higher
CLEP
Assessments
https://clep.collegeboard.org/ Score of 50 or higher
ASVAB (military) http://official-asvab.com/index.htm Depending on branch
minimum scores range from
31 to 36
Industry
Recognized
Credential (IRC)
http://education.vermont.gov/documents/career-
tech-approved-industry-recognized-credentials
No Standardized Cut Score
across certifications
This indicator is new for the state but based on analysis of variation in school level performance
on SAT and ACT, we believe this indicator will meaningfully differentiate across schools and
supervisory unions. The indicator is a valid assessment of career and college readiness as the
component assessments developed by external entities have been found to correlate with
student readiness for career and college pursuits. These externally developed assessments have
met the technical standards associated with their administration and are widely accepted as
reliable tools for measuring performance. Finally, all assessments can be disaggregated by all
student groups. Additionally, the indicator will be used consistently across Vermont high
schools.
“Fifth” Indicator 4: Post-Secondary Outcomes: Are alumni participating in career and college
outcomes within 16 months of graduation?
Consistent with Vermont’s Act 77 and Education Quality Standards, stakeholders were
interested in a summative measure that could capture the broad range of outcomes we want our
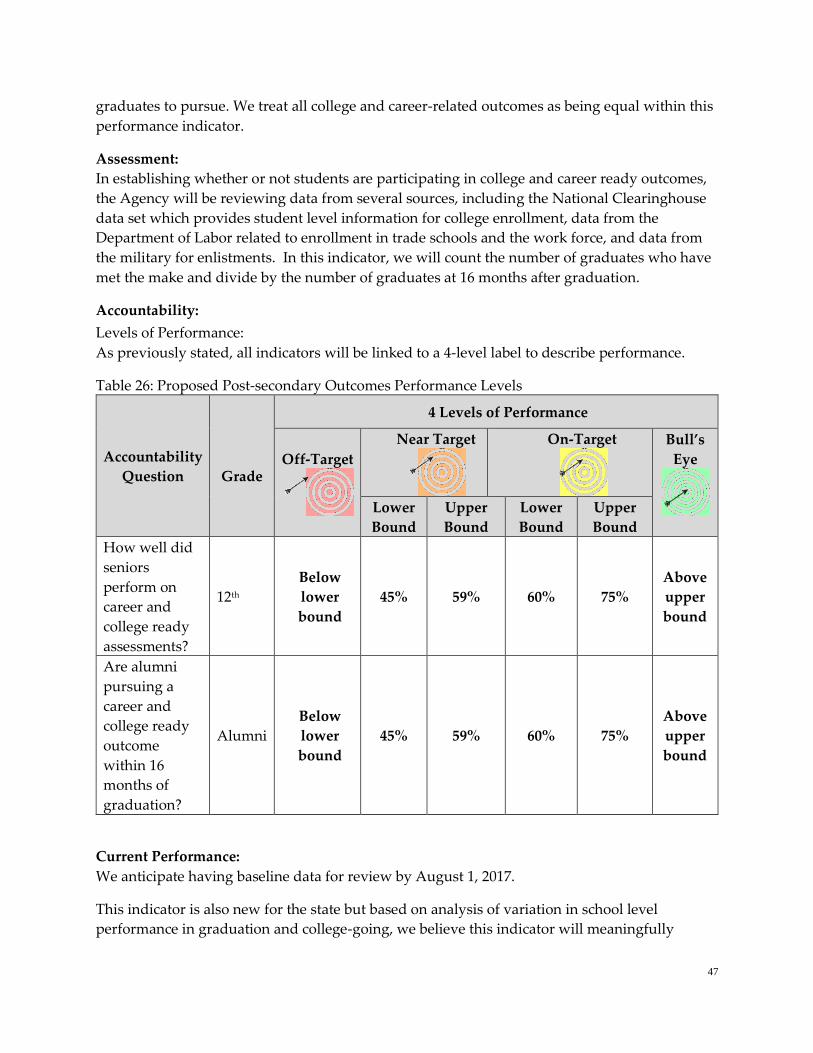
47
graduates to pursue. We treat all college and career-related outcomes as being equal within this
performance indicator.
Assessment:
In establishing whether or not students are participating in college and career ready outcomes,
the Agency will be reviewing data from several sources, including the National Clearinghouse
data set which provides student level information for college enrollment, data from the
Department of Labor related to enrollment in trade schools and the work force, and data from
the military for enlistments. In this indicator, we will count the number of graduates who have
met the make and divide by the number of graduates at 16 months after graduation.
Accountability:
Levels of Performance:
As previously stated, all indicators will be linked to a 4-level label to describe performance.
Table 26: Proposed Post-secondary Outcomes Performance Levels
Accountability
Question
Grade
4 Levels of Performance
Off-Target
Near Target
On-Target
Bull’s
Eye
Lower
Bound
Upper
Bound
Lower
Bound
Upper
Bound
How well did
seniors
perform on
career and
college ready
assessments?
12th
Below
lower
bound
45% 59% 60% 75%
Above
upper
bound
Are alumni
pursuing a
career and
college ready
outcome
within 16
months of
graduation?
Alumni
Below
lower
bound
45% 59% 60% 75%
Above
upper
bound
Current Performance:
We anticipate having baseline data for review by August 1, 2017.
This indicator is also new for the state but based on analysis of variation in school level
performance in graduation and college-going, we believe this indicator will meaningfully
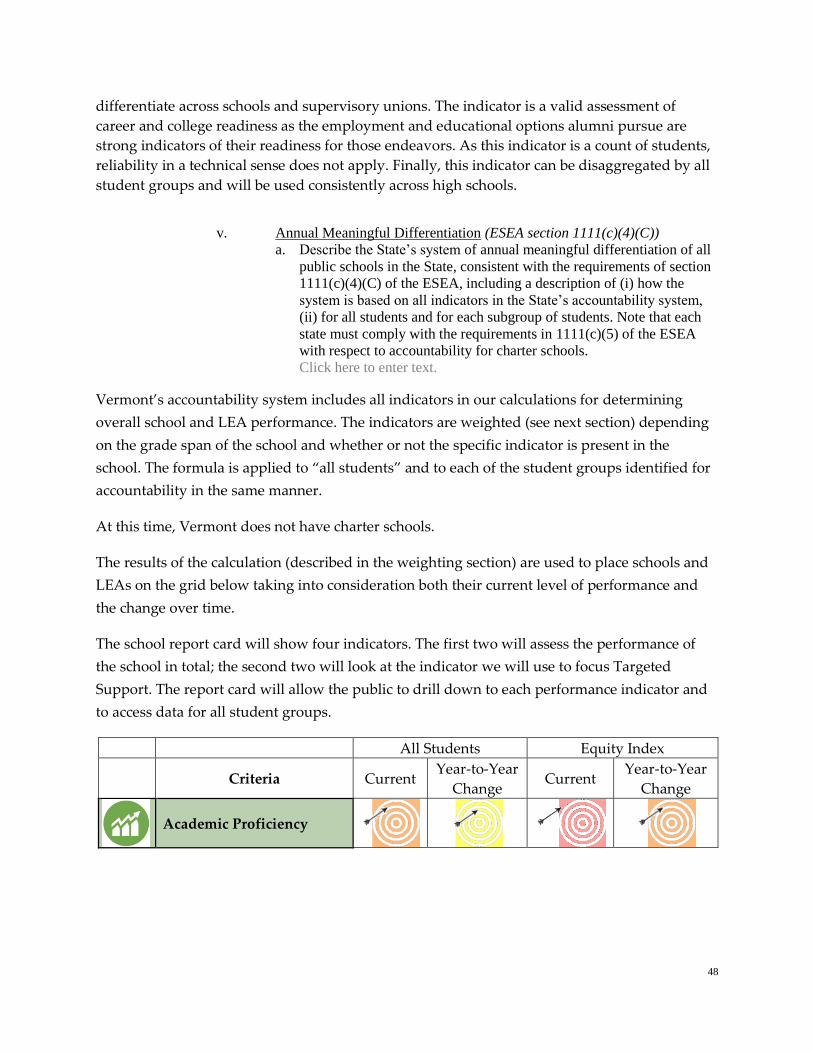
48
differentiate across schools and supervisory unions. The indicator is a valid assessment of
career and college readiness as the employment and educational options alumni pursue are
strong indicators of their readiness for those endeavors. As this indicator is a count of students,
reliability in a technical sense does not apply. Finally, this indicator can be disaggregated by all
student groups and will be used consistently across high schools.
v. Annual Meaningful Differentiation (ESEA section 1111(c)(4)(C))
a. Describe the State’s system of annual meaningful differentiation of all
public schools in the State, consistent with the requirements of section
1111(c)(4)(C) of the ESEA, including a description of (i) how the
system is based on all indicators in the State’s accountability system,
(ii) for all students and for each subgroup of students. Note that each
state must comply with the requirements in 1111(c)(5) of the ESEA
with respect to accountability for charter schools.
Click here to enter text.
Vermont’s accountability system includes all indicators in our calculations for determining
overall school and LEA performance. The indicators are weighted (see next section) depending
on the grade span of the school and whether or not the specific indicator is present in the
school. The formula is applied to “all students” and to each of the student groups identified for
accountability in the same manner.
At this time, Vermont does not have charter schools.
The results of the calculation (described in the weighting section) are used to place schools and
LEAs on the grid below taking into consideration both their current level of performance and
the change over time.
The school report card will show four indicators. The first two will assess the performance of
the school in total; the second two will look at the indicator we will use to focus Targeted
Support. The report card will allow the public to drill down to each performance indicator and
to access data for all student groups.
All Students Equity Index
Criteria Current Year-to-Year
Change Current
Year-to-Year
Change
Academic Proficiency
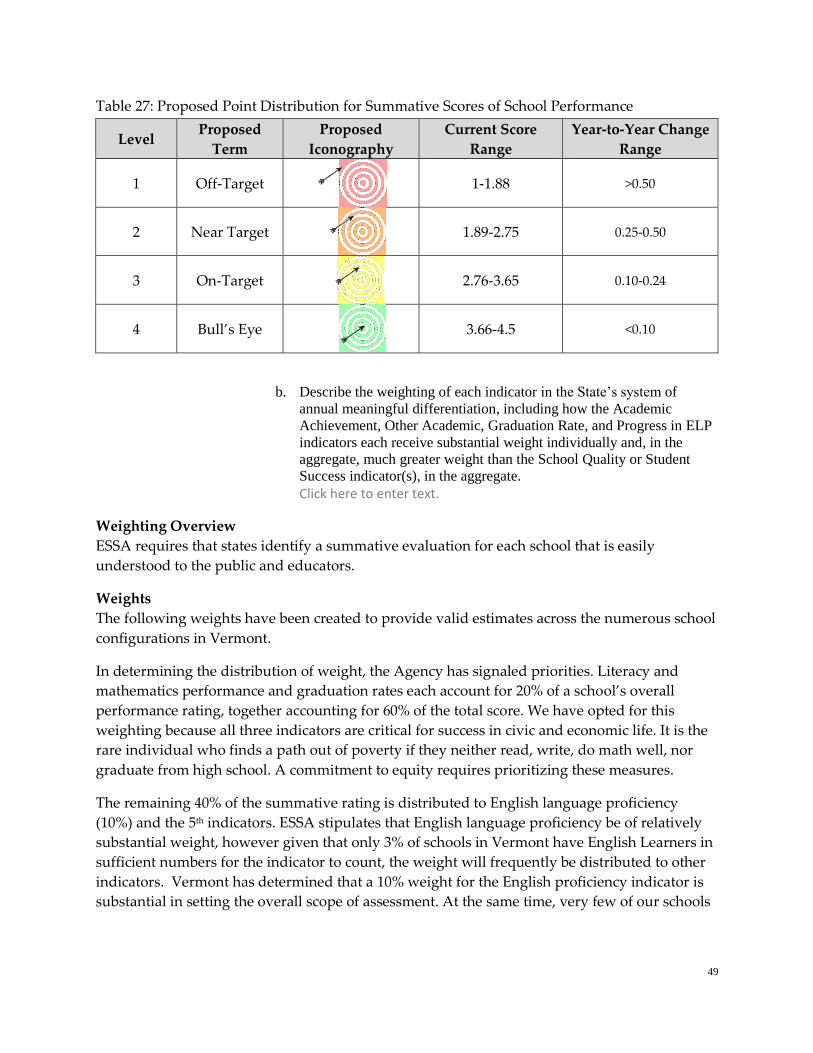
49
Table 27: Proposed Point Distribution for Summative Scores of School Performance
Level Proposed
Term
Proposed
Iconography
Current Score
Range
Year-to-Year Change
Range
1 Off-Target
1-1.88 >0.50
2 Near Target
1.89-2.75 0.25-0.50
3 On-Target
2.76-3.65 0.10-0.24
4 Bull’s Eye
3.66-4.5 <0.10
b. Describe the weighting of each indicator in the State’s system of
annual meaningful differentiation, including how the Academic
Achievement, Other Academic, Graduation Rate, and Progress in ELP
indicators each receive substantial weight individually and, in the
aggregate, much greater weight than the School Quality or Student
Success indicator(s), in the aggregate.
Click here to enter text.
Weighting Overview
ESSA requires that states identify a summative evaluation for each school that is easily
understood to the public and educators.
Weights
The following weights have been created to provide valid estimates across the numerous school
configurations in Vermont.
In determining the distribution of weight, the Agency has signaled priorities. Literacy and
mathematics performance and graduation rates each account for 20% of a school’s overall
performance rating, together accounting for 60% of the total score. We have opted for this
weighting because all three indicators are critical for success in civic and economic life. It is the
rare individual who finds a path out of poverty if they neither read, write, do math well, nor
graduate from high school. A commitment to equity requires prioritizing these measures.
The remaining 40% of the summative rating is distributed to English language proficiency
(10%) and the 5th indicators. ESSA stipulates that English language proficiency be of relatively
substantial weight, however given that only 3% of schools in Vermont have English Learners in
sufficient numbers for the indicator to count, the weight will frequently be distributed to other
indicators. Vermont has determined that a 10% weight for the English proficiency indicator is
substantial in setting the overall scope of assessment. At the same time, very few of our schools
50
have sufficient numbers of English Learners to give this indicator value; in 97% of cases, this
value will not be populated and the weight will be distributed to other indicators.
Missing Measures
Because of the many school configurations and the relative scarcity of English Learners, the
Agency of Education has described how weights will be shifted for schools with different grade
configurations and the relative scarcity of English learners. In general, when an indicator is not
available (e.g. a school with no high school grades would not have Career and College
Readiness indicators), the resulting weight will be redistributed to the remaining indicators to
maintain the remaining indicators’ relative comparative value.
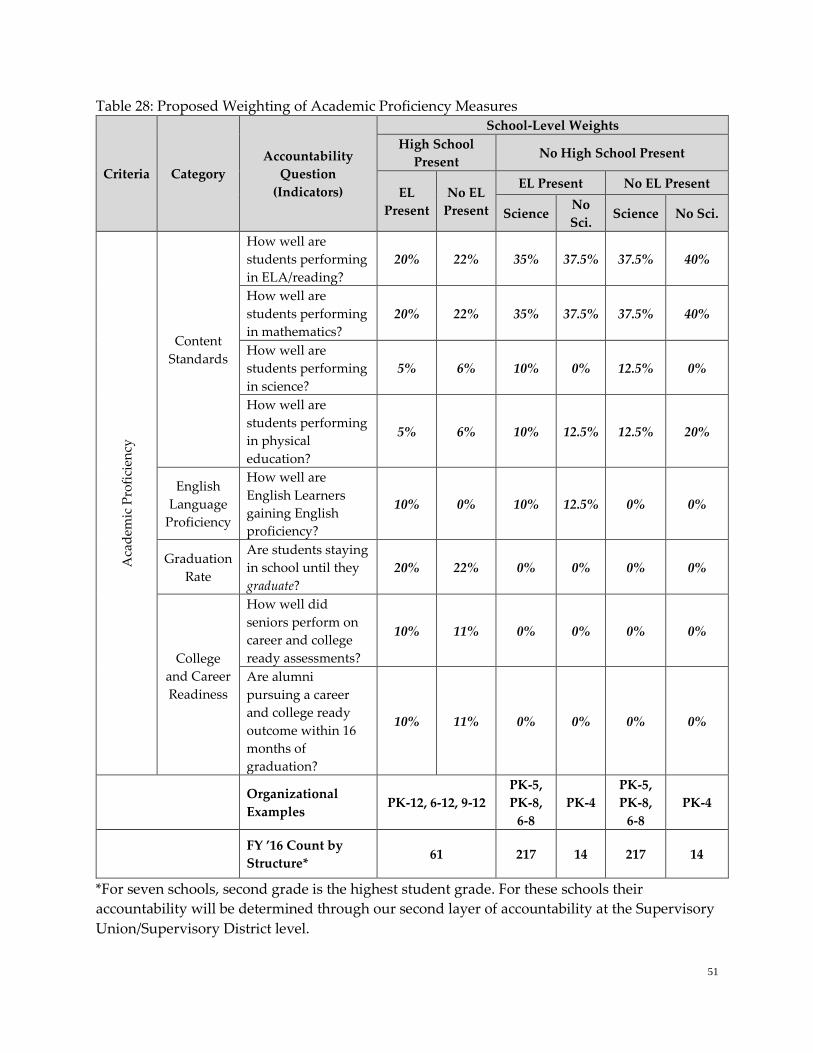
51
Table 28: Proposed Weighting of Academic Proficiency Measures
*For seven schools, second grade is the highest student grade. For these schools their
accountability will be determined through our second layer of accountability at the Supervisory
Union/Supervisory District level.
Criteria Category
Accountability
Question
(Indicators)
School-Level Weights
High School
Present No High School Present
EL
Present
No EL
Present
EL Present No EL Present
Science No
Sci. Science No Sci.
Aca
dem
ic P
rofi
cien
cy
Content
Standards
How well are
students performing
in ELA/reading?
20% 22% 35% 37.5% 37.5% 40%
How well are
students performing
in mathematics?
20% 22% 35% 37.5% 37.5% 40%
How well are
students performing
in science?
5% 6% 10% 0% 12.5% 0%
How well are
students performing
in physical
education?
5% 6% 10% 12.5% 12.5% 20%
English
Language
Proficiency
How well are
English Learners
gaining English
proficiency?
10% 0% 10% 12.5% 0% 0%
Graduation
Rate
Are students staying
in school until they
graduate?
20% 22% 0% 0% 0% 0%
College
and Career
Readiness
How well did
seniors perform on
career and college
ready assessments?
10% 11% 0% 0% 0% 0%
Are alumni
pursuing a career
and college ready
outcome within 16
months of
graduation?
10% 11% 0% 0% 0% 0%
Organizational
Examples PK-12, 6-12, 9-12
PK-5,
PK-8,
6-8
PK-4
PK-5,
PK-8,
6-8
PK-4
FY ’16 Count by
Structure* 61 217 14 217 14

52
Because not all indicators are available in each year, the weights used to make accountability
determinations will vary in the first year of implementation. Table 46 shows the weights that
will be used in 2017-18 to make initial determinations.
Table 29: Proposed 2017-18 Weights
c. If the States uses a different methodology for annual meaningful
differentiation than the one described in 4.v.a. above for schools for
Criteria Category Accountability Question
(Indicators)
School-Level Weights
High School Present
e.g., PK-12; 6-12; 9-12
N=61
No High School
Present
e.g., PK-4, PK-8, PK-
5
N=231
EL
Present
No EL
Present
EL
Present
No EL
Present
Aca
dem
ic P
rofi
cien
cy
Content
Standards
How well are students
performing in
ELA/reading?
30% 35% 40% 50%
How well are students
performing in
mathematics?
30% 35% 40% 50%
How well are students
performing in science? Piloting
How well are students
performing in physical
education?
Piloting
English
Language
Proficiency
How well are English
Learners gaining
English proficiency?
15% 0% 20% 0%
Graduation
Rate
Are students staying in
school until they
graduate?
25% 30% 0% 0%
College
and Career
Readiness
How well did seniors
perform on career and
college ready
assessments?
Piloting
Are alumni pursuing a
career and college
ready outcome within
16 months of
graduation?
Piloting
53
which an accountability determination cannot be made (e.g., P-2
schools), describe the different methodology, indicating the type(s) of
schools to which it applies.
Click here to enter text.
Small Schools
ESSA requires that states establish alternative protocols for assessing student performance
when the number of students falls below minimum numbers required for assessment. This
describes many schools in Vermont. By introducing our second tier of accountability at the
Supervisory Union/Supervisory District level, we will be able to work with these leadership
teams to identify which schools, including those too small to display through the previously-
described model, are contributing to the overall performance of the system and which require
Comprehensive or Target Supports.
Special Populations Schools
ESSA requires that states establish alternative protocols for assessing student performance
when a public school exists for a specific population: for example, students receiving
programming in non-traditional educational settings, students attending juvenile rehabilitation
centers, students enrolled in state public schools for the blind, or schools exclusively serving
recently arrived English learners. Currently Vermont does not have schools that meet these
descriptions; however, all Vermont students who attend these types of independent institutions
outside of Vermont must take Vermont’s state assessments, and their data is linked back to the
Supervisory Union/Supervisory District that pays their educational tuition. By creating the
second tier of accountability at the SU/SD level, Vermont is able to include a larger number of
these students when making accountability determinations.
Newly Opened Schools
ESSA requires that states establish alternative protocols for assessing student performance
when a new public school opens. Currently, Vermont is experiencing declining enrollment in
virtually all of our communities; opening large numbers of new schools due to increasing
student enrollment is not a situation that we anticipate facing. A more likely experience in
Vermont will be the merging of two existing schools into a new school with combined
populations. In these circumstances, the standing of a new school within an accountability
system is based on a weighted formula. For example, if 56% of the new school’s students had
attended a Priority 1 school, and 44% had attended a Priority 2 school, the new school would be
a Priority 1 school. (Please see the following section for a full discussion on priority schools)
vi. Identification of Schools (ESEA section 1111(c)(4)(D))
a. Comprehensive Support and Improvement Schools. Describe the
State’s methodology for identifying not less than the lowest-
performing five percent of all schools receiving Title I, Part A funds in
the State for comprehensive support and improvement.
Click here to enter text.
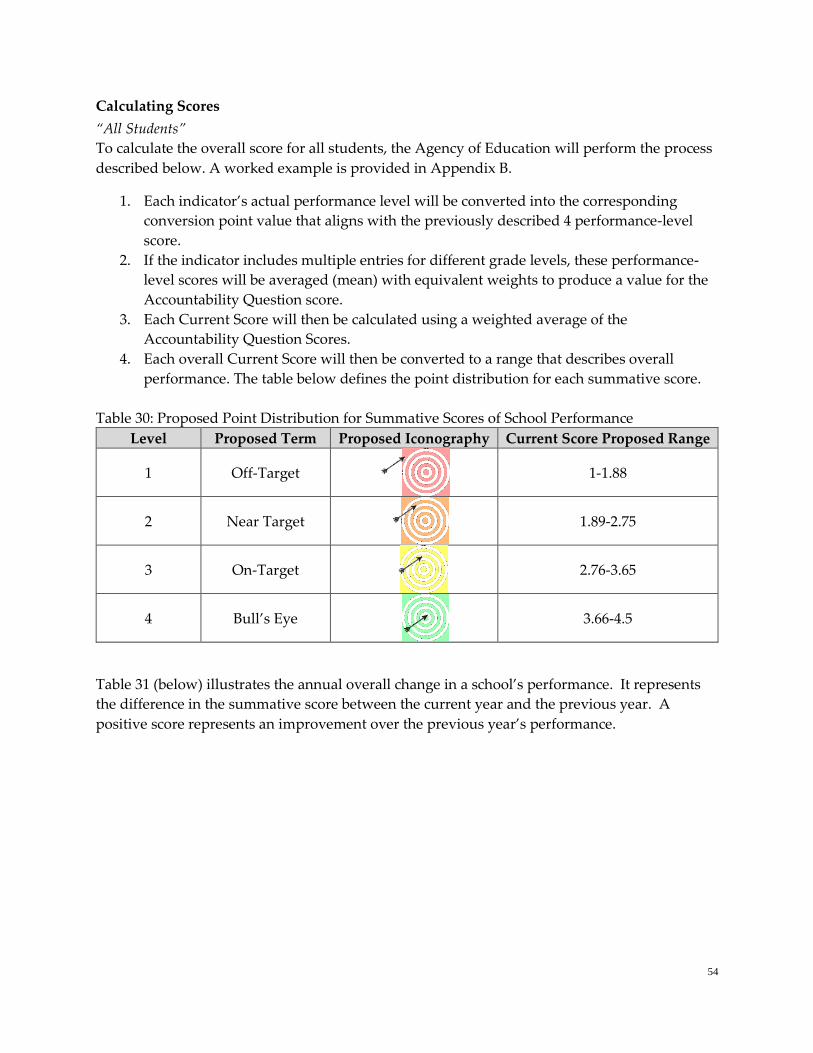
54
Calculating Scores
“All Students”
To calculate the overall score for all students, the Agency of Education will perform the process
described below. A worked example is provided in Appendix B.
1. Each indicator’s actual performance level will be converted into the corresponding
conversion point value that aligns with the previously described 4 performance-level
score.
2. If the indicator includes multiple entries for different grade levels, these performance-
level scores will be averaged (mean) with equivalent weights to produce a value for the
Accountability Question score.
3. Each Current Score will then be calculated using a weighted average of the
Accountability Question Scores.
4. Each overall Current Score will then be converted to a range that describes overall
performance. The table below defines the point distribution for each summative score.
Table 30: Proposed Point Distribution for Summative Scores of School Performance
Level Proposed Term Proposed Iconography Current Score Proposed Range
1 Off-Target
1-1.88
2 Near Target
1.89-2.75
3 On-Target
2.76-3.65
4 Bull’s Eye
3.66-4.5
Table 31 (below) illustrates the annual overall change in a school’s performance. It represents
the difference in the summative score between the current year and the previous year. A
positive score represents an improvement over the previous year’s performance.
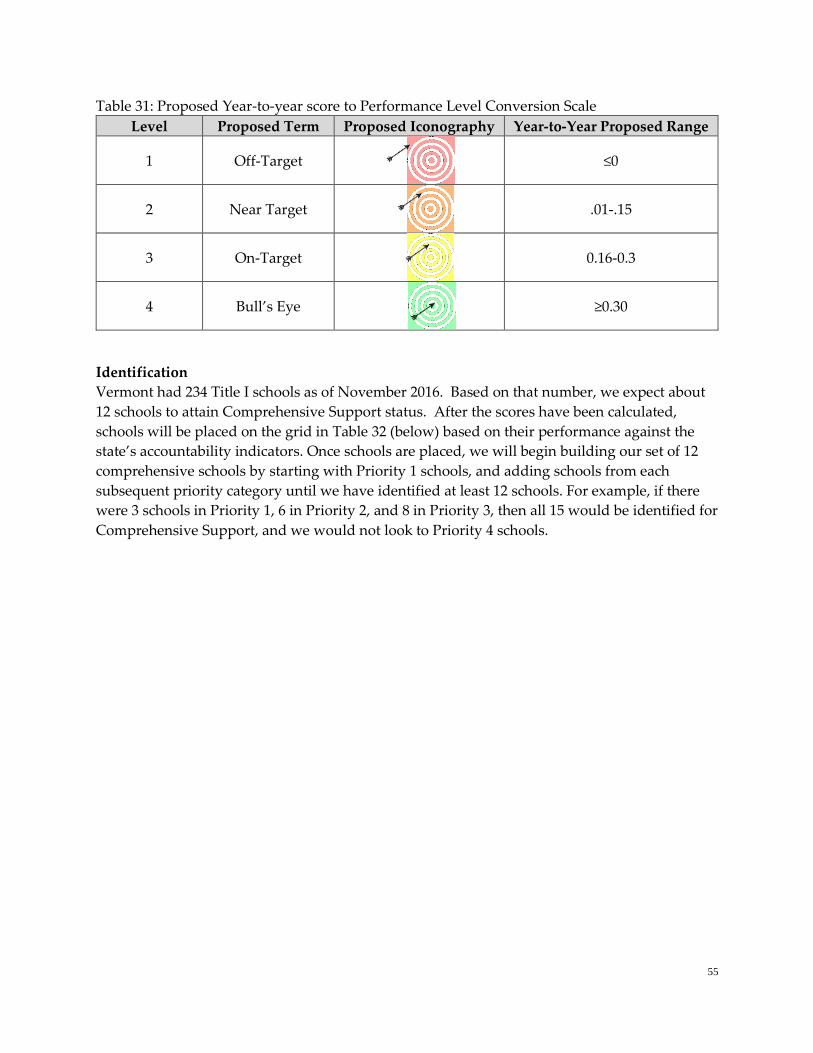
55
Table 31: Proposed Year-to-year score to Performance Level Conversion Scale
Level Proposed Term Proposed Iconography Year-to-Year Proposed Range
1 Off-Target
≤0
2 Near Target
.01-.15
3 On-Target
0.16-0.3
4 Bull’s Eye
≥0.30
Identification
Vermont had 234 Title I schools as of November 2016. Based on that number, we expect about
12 schools to attain Comprehensive Support status. After the scores have been calculated,
schools will be placed on the grid in Table 32 (below) based on their performance against the
state’s accountability indicators. Once schools are placed, we will begin building our set of 12
comprehensive schools by starting with Priority 1 schools, and adding schools from each
subsequent priority category until we have identified at least 12 schools. For example, if there
were 3 schools in Priority 1, 6 in Priority 2, and 8 in Priority 3, then all 15 would be identified for
Comprehensive Support, and we would not look to Priority 4 schools.
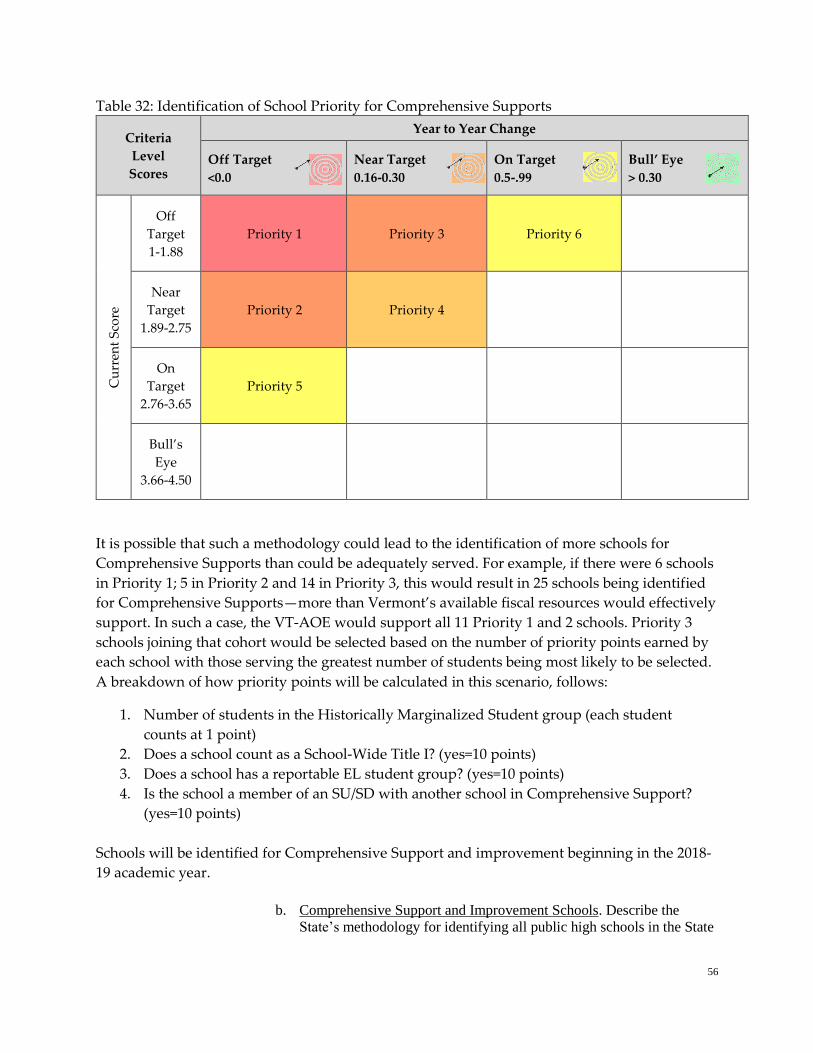
56
Table 32: Identification of School Priority for Comprehensive Supports
Criteria
Level
Scores
Year to Year Change
Off Target
<0.0
Near Target
0.16-0.30
On Target
0.5-.99
Bull’ Eye
> 0.30
Cu
rren
t S
core
Off
Target
1-1.88
Priority 1 Priority 3 Priority 6
Near
Target
1.89-2.75
Priority 2 Priority 4
On
Target
2.76-3.65
Priority 5
Bull’s
Eye
3.66-4.50
It is possible that such a methodology could lead to the identification of more schools for
Comprehensive Supports than could be adequately served. For example, if there were 6 schools
in Priority 1; 5 in Priority 2 and 14 in Priority 3, this would result in 25 schools being identified
for Comprehensive Supports—more than Vermont’s available fiscal resources would effectively
support. In such a case, the VT-AOE would support all 11 Priority 1 and 2 schools. Priority 3
schools joining that cohort would be selected based on the number of priority points earned by
each school with those serving the greatest number of students being most likely to be selected.
A breakdown of how priority points will be calculated in this scenario, follows:
1. Number of students in the Historically Marginalized Student group (each student
counts at 1 point)
2. Does a school count as a School-Wide Title I? (yes=10 points)
3. Does a school has a reportable EL student group? (yes=10 points)
4. Is the school a member of an SU/SD with another school in Comprehensive Support?
(yes=10 points)
Schools will be identified for Comprehensive Support and improvement beginning in the 2018-
19 academic year.
b. Comprehensive Support and Improvement Schools. Describe the
State’s methodology for identifying all public high schools in the State
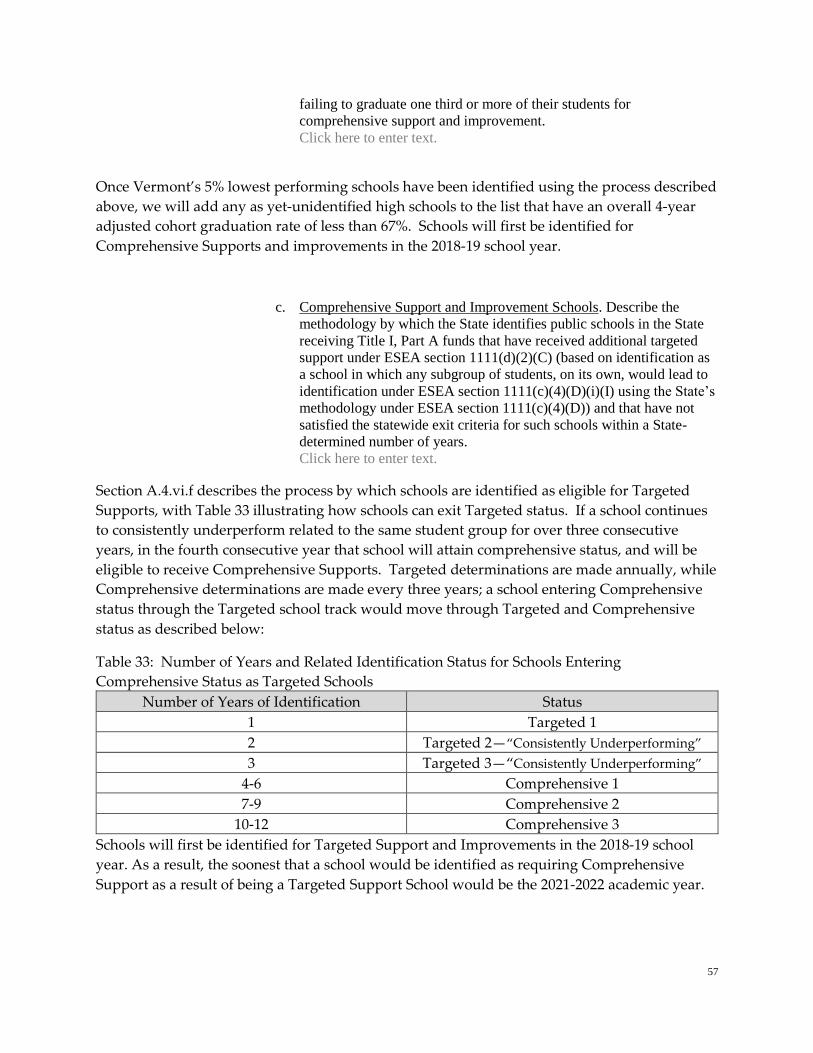
57
failing to graduate one third or more of their students for
comprehensive support and improvement.
Click here to enter text.
Once Vermont’s 5% lowest performing schools have been identified using the process described
above, we will add any as yet-unidentified high schools to the list that have an overall 4-year
adjusted cohort graduation rate of less than 67%. Schools will first be identified for
Comprehensive Supports and improvements in the 2018-19 school year.
c. Comprehensive Support and Improvement Schools. Describe the
methodology by which the State identifies public schools in the State
receiving Title I, Part A funds that have received additional targeted
support under ESEA section 1111(d)(2)(C) (based on identification as
a school in which any subgroup of students, on its own, would lead to
identification under ESEA section 1111(c)(4)(D)(i)(I) using the State’s
methodology under ESEA section 1111(c)(4)(D)) and that have not
satisfied the statewide exit criteria for such schools within a State-
determined number of years.
Click here to enter text.
Section A.4.vi.f describes the process by which schools are identified as eligible for Targeted
Supports, with Table 33 illustrating how schools can exit Targeted status. If a school continues
to consistently underperform related to the same student group for over three consecutive
years, in the fourth consecutive year that school will attain comprehensive status, and will be
eligible to receive Comprehensive Supports. Targeted determinations are made annually, while
Comprehensive determinations are made every three years; a school entering Comprehensive
status through the Targeted school track would move through Targeted and Comprehensive
status as described below:
Table 33: Number of Years and Related Identification Status for Schools Entering
Comprehensive Status as Targeted Schools
Number of Years of Identification Status
1 Targeted 1
2 Targeted 2—“Consistently Underperforming”
3 Targeted 3—“Consistently Underperforming”
4-6 Comprehensive 1
7-9 Comprehensive 2
10-12 Comprehensive 3
Schools will first be identified for Targeted Support and Improvements in the 2018-19 school
year. As a result, the soonest that a school would be identified as requiring Comprehensive
Support as a result of being a Targeted Support School would be the 2021-2022 academic year.
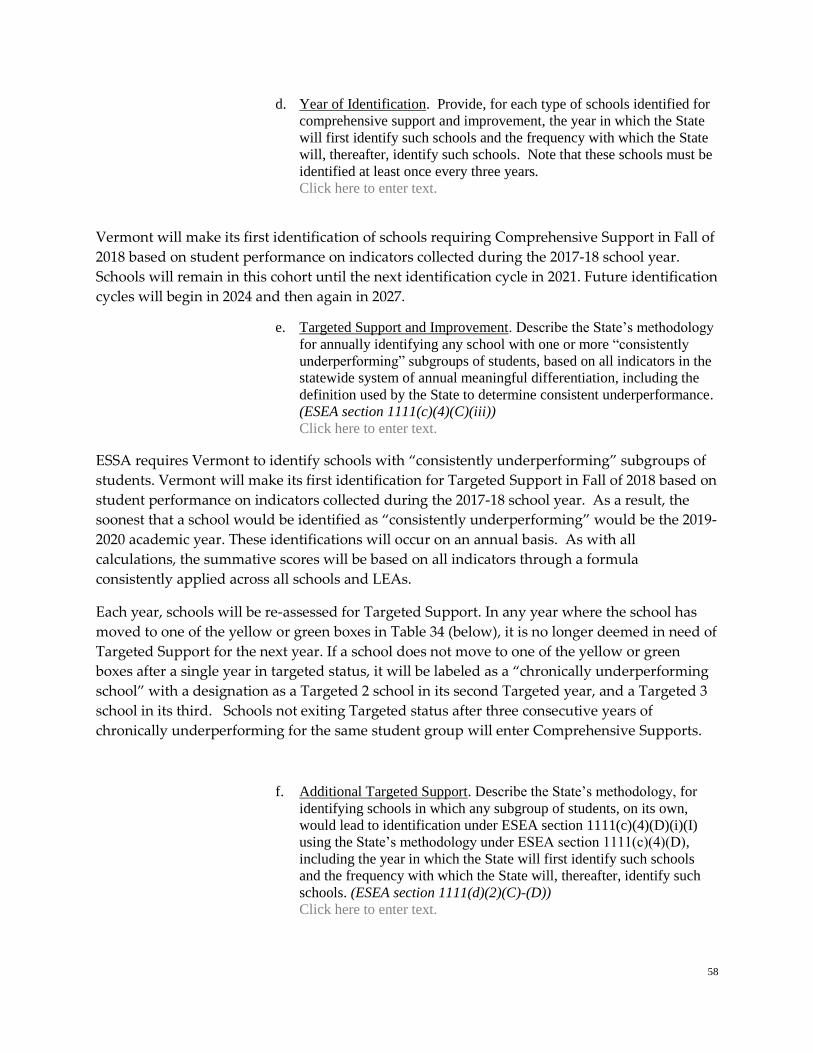
58
d. Year of Identification. Provide, for each type of schools identified for
comprehensive support and improvement, the year in which the State
will first identify such schools and the frequency with which the State
will, thereafter, identify such schools. Note that these schools must be
identified at least once every three years.
Click here to enter text.
Vermont will make its first identification of schools requiring Comprehensive Support in Fall of
2018 based on student performance on indicators collected during the 2017-18 school year.
Schools will remain in this cohort until the next identification cycle in 2021. Future identification
cycles will begin in 2024 and then again in 2027.
e. Targeted Support and Improvement. Describe the State’s methodology
for annually identifying any school with one or more “consistently
underperforming” subgroups of students, based on all indicators in the
statewide system of annual meaningful differentiation, including the
definition used by the State to determine consistent underperformance.
(ESEA section 1111(c)(4)(C)(iii))
Click here to enter text.
ESSA requires Vermont to identify schools with “consistently underperforming” subgroups of
students. Vermont will make its first identification for Targeted Support in Fall of 2018 based on
student performance on indicators collected during the 2017-18 school year. As a result, the
soonest that a school would be identified as “consistently underperforming” would be the 2019-
2020 academic year. These identifications will occur on an annual basis. As with all
calculations, the summative scores will be based on all indicators through a formula
consistently applied across all schools and LEAs.
Each year, schools will be re-assessed for Targeted Support. In any year where the school has
moved to one of the yellow or green boxes in Table 34 (below), it is no longer deemed in need of
Targeted Support for the next year. If a school does not move to one of the yellow or green
boxes after a single year in targeted status, it will be labeled as a “chronically underperforming
school” with a designation as a Targeted 2 school in its second Targeted year, and a Targeted 3
school in its third. Schools not exiting Targeted status after three consecutive years of
chronically underperforming for the same student group will enter Comprehensive Supports.
f. Additional Targeted Support. Describe the State’s methodology, for
identifying schools in which any subgroup of students, on its own,
would lead to identification under ESEA section 1111(c)(4)(D)(i)(I)
using the State’s methodology under ESEA section 1111(c)(4)(D),
including the year in which the State will first identify such schools
and the frequency with which the State will, thereafter, identify such
schools. (ESEA section 1111(d)(2)(C)-(D))
Click here to enter text.
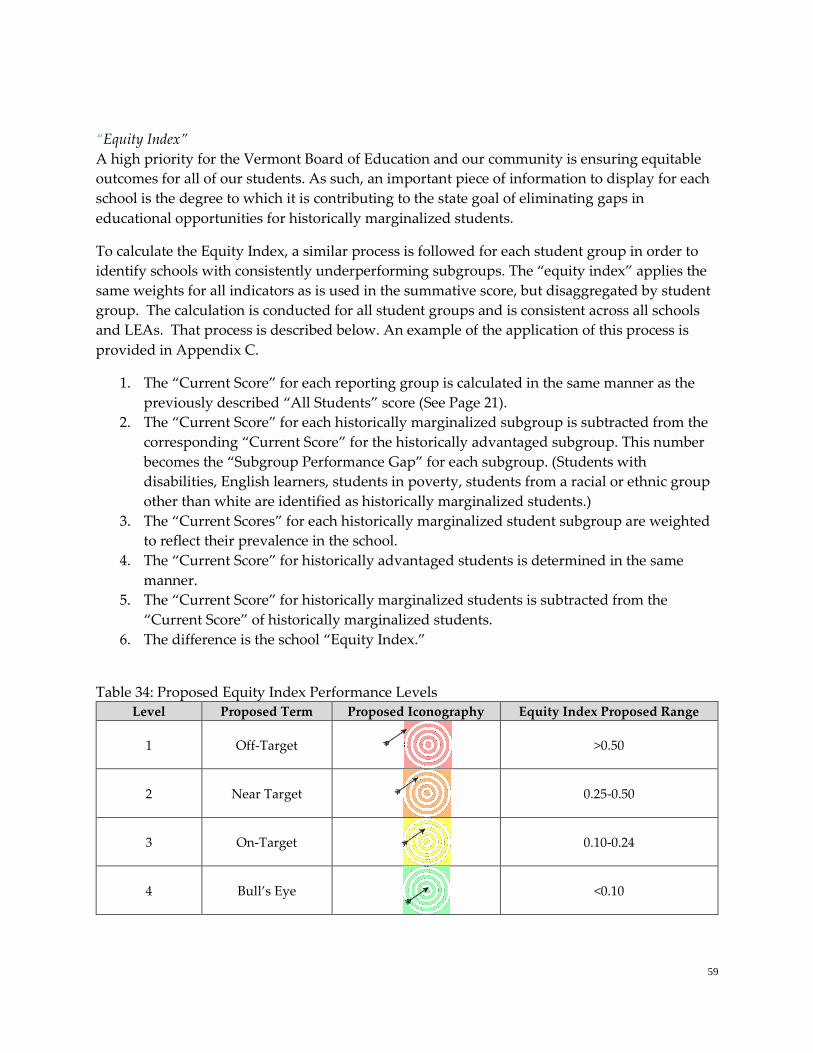
59
“Equity Index”
A high priority for the Vermont Board of Education and our community is ensuring equitable
outcomes for all of our students. As such, an important piece of information to display for each
school is the degree to which it is contributing to the state goal of eliminating gaps in
educational opportunities for historically marginalized students.
To calculate the Equity Index, a similar process is followed for each student group in order to
identify schools with consistently underperforming subgroups. The “equity index” applies the
same weights for all indicators as is used in the summative score, but disaggregated by student
group. The calculation is conducted for all student groups and is consistent across all schools
and LEAs. That process is described below. An example of the application of this process is
provided in Appendix C.
1. The “Current Score” for each reporting group is calculated in the same manner as the
previously described “All Students” score (See Page 21).
2. The “Current Score” for each historically marginalized subgroup is subtracted from the
corresponding “Current Score” for the historically advantaged subgroup. This number
becomes the “Subgroup Performance Gap” for each subgroup. (Students with
disabilities, English learners, students in poverty, students from a racial or ethnic group
other than white are identified as historically marginalized students.)
3. The “Current Scores” for each historically marginalized student subgroup are weighted
to reflect their prevalence in the school.
4. The “Current Score” for historically advantaged students is determined in the same
manner.
5. The “Current Score” for historically marginalized students is subtracted from the
“Current Score” of historically marginalized students.
6. The difference is the school “Equity Index.”
Table 34: Proposed Equity Index Performance Levels
Level Proposed Term Proposed Iconography Equity Index Proposed Range
1 Off-Target
>0.50
2 Near Target
0.25-0.50
3 On-Target
0.10-0.24
4 Bull’s Eye
<0.10

60
Year-to-Year Score
The “Year-to-Year Score” is simply the aggregate change this year from last year for either the
current score earned by “All Students” or as part of the Equity Index. It is our hope that all
schools will show improvement each and every year; however, we recognize that this may not
always be possible.
Calculating Scores
Year-to-Year scores will be calculated by subtracting last year’s score from the corresponding
score for this year. A negative number will appear when the performance in the more recent
year is lower than the prior year.
Table 35: Identification of Targeted Status
Criteria Level
Scores
Year-to-Year Change
Off Target
<0.0
Near Target
0.0-0.10
On Target
0.11-.20
Bull’ Eye
> .20
Eq
uit
y G
ap
Off Target
>.50 Targeted 1 Targeted 3
Near
Target
.24-.50
Targeted 2
On Target
0.10-.25
Bull’s Eye
<0.10
Vermont’s proposal is to replicate the assignment of schools based on the magnitude of their
Equity Score, and the degree to which the gap between student groups is closing.
Schools will be categorized within the grid in Table 35 (above). Once schools are categorized,
we will apply the label of “Targeted Support” to all schools in Targeted 1-3. These schools will
be required to leverage federal dollars on activities that promote equity gap reductions.
g. Additional Statewide Categories of Schools. If the State chooses, at its
discretion, to include additional statewide categories of schools,
describe those categories.
Click here to enter text.
Vermont is not electing to include additional statewide categories of schools at this time.
vii. Annual Measurement of Achievement (ESEA section 1111(c)(4)(E)(iii)):
Describe how the State factors the requirement for 95 percent student
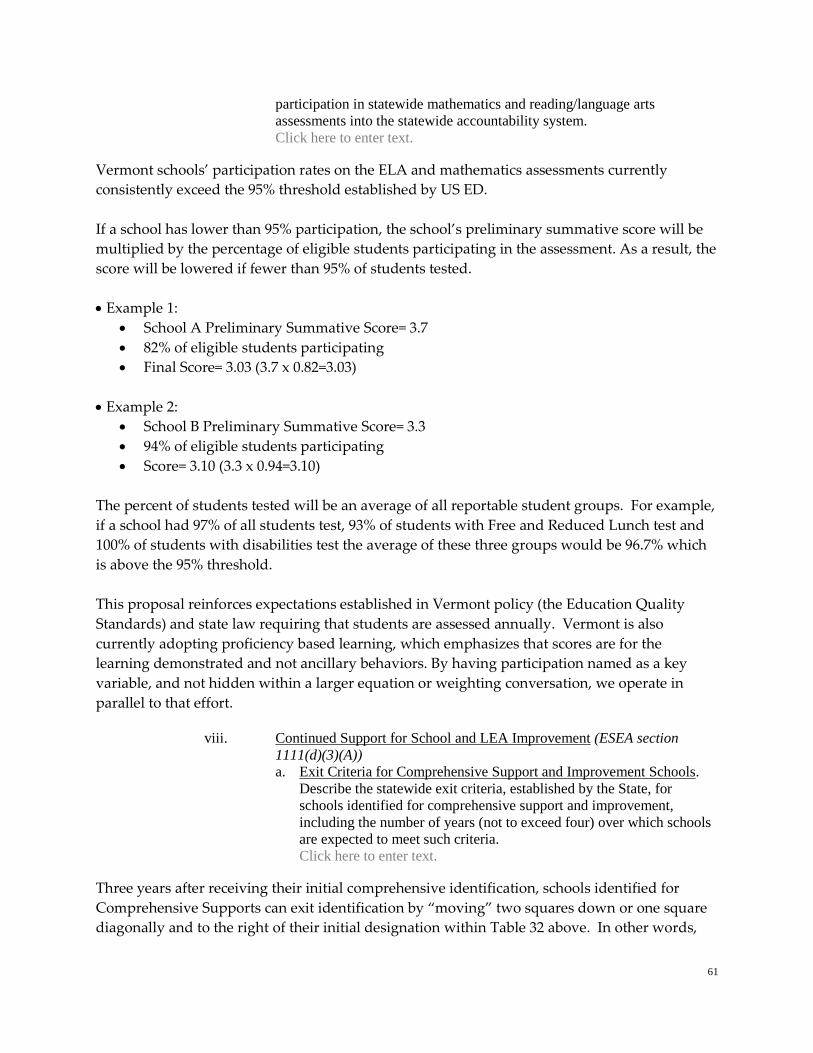
61
participation in statewide mathematics and reading/language arts
assessments into the statewide accountability system.
Click here to enter text.
Vermont schools’ participation rates on the ELA and mathematics assessments currently
consistently exceed the 95% threshold established by US ED.
If a school has lower than 95% participation, the school’s preliminary summative score will be
multiplied by the percentage of eligible students participating in the assessment. As a result, the
score will be lowered if fewer than 95% of students tested.
Example 1:
School A Preliminary Summative Score= 3.7
82% of eligible students participating
Final Score= 3.03 (3.7 x 0.82=3.03)
Example 2:
School B Preliminary Summative Score= 3.3
94% of eligible students participating
Score= 3.10 (3.3 x 0.94=3.10)
The percent of students tested will be an average of all reportable student groups. For example,
if a school had 97% of all students test, 93% of students with Free and Reduced Lunch test and
100% of students with disabilities test the average of these three groups would be 96.7% which
is above the 95% threshold.
This proposal reinforces expectations established in Vermont policy (the Education Quality
Standards) and state law requiring that students are assessed annually. Vermont is also
currently adopting proficiency based learning, which emphasizes that scores are for the
learning demonstrated and not ancillary behaviors. By having participation named as a key
variable, and not hidden within a larger equation or weighting conversation, we operate in
parallel to that effort.
viii. Continued Support for School and LEA Improvement (ESEA section
1111(d)(3)(A))
a. Exit Criteria for Comprehensive Support and Improvement Schools.
Describe the statewide exit criteria, established by the State, for
schools identified for comprehensive support and improvement,
including the number of years (not to exceed four) over which schools
are expected to meet such criteria.
Click here to enter text.
Three years after receiving their initial comprehensive identification, schools identified for
Comprehensive Supports can exit identification by “moving” two squares down or one square
diagonally and to the right of their initial designation within Table 32 above. In other words,
62
their annual performance has improved by two level or their performance has improved by one
level and they also have significant positive improvement in scores over time. For example, a
school that began as Priority 1 could exit Comprehensive Supports if it falls in Priority 5 or
Priority 4 in the subsequent year of review. However, while the schools in this scenario would
be improving, it is also possible that other schools in Vermont would be improving at the same
time and that a school that would otherwise exit Comprehensive Supports might still find itself
in the bottom 5% of schools in the state. In this scenario, an SU/SD may opt to continue their
identification status as a Comprehensive Support 1 school and participate in the state’s financial
support and technical assistance or they may opt to exit identification entirely.
This model ensures that a school exists Comprehensive Supports and improvements based on
demonstrating improved student performance, as measured by the year-to-year change in the
matrix in section A.4.vi.a above.
If a school does not meet the exit criteria, additional technical support and monitoring occurs.
b. Exit Criteria for Schools Receiving Additional Targeted Support.
Describe the statewide exit criteria, established by the State, for
schools receiving additional targeted support under ESEA section
1111(d)(2)(C), including the number of years over which schools are
expected to meet such criteria.
Click here to enter text.
Each year, schools will be re-assessed for Targeted Support. In any year where the school has
moved to one of the yellow or green boxes, it is no longer deemed in need of Targeted Support
for the next year.
If a school exits targeted status related to one subgroup, but retains targeted status for others, its
targeted label will continue to scale up (Targeted 2, Targeted 3, Comprehensive). If a school
exits Targeted Supports for all student groups and then is identified for targeted status the
following year for a new student group, it will enter Targeted Supports again as a Targeted 1
school. If a school exits targeted status for some subgroups and retains Targeted Supports for
other subgroups that were identified after the school first acquired targeted status, its label will
reflect the greatest number of years that it has been identified for underserving any remaining
student group. An example is provided below:
Year 1: School is identified for underserving Students with Disabilities
a. Status: Targeted 1 School (SWD)
Year 2: School is identified for underserving Students with Disabilities and English
Learners
a. Status: Targeted 2 School (SWD, EL)
Year 3: School is identified for underserving English Learners
a. Status: Targeted 2 School (EL)
63
This model ensures that a school exits target supports and improvements based on
demonstrating narrowed equity gaps and improved overall student performance, as measured
by the year-to-year change in the matrix in section A.4.vi.e above.
c. More Rigorous Interventions. Describe the more rigorous
interventions required for schools identified for comprehensive support
and improvement that fail to meet the State’s exit criteria within a
State-determined number of years consistent with section
1111(d)(3)(A)(i)(I) of the ESEA.
Click here to enter text.
The most rigorous interventions, required for schools in years 7, 8, and 9 of Comprehensive
Supports are drawn from current Vermont statute and reflect Vermont’s interest in tailoring a
solution to the needs of the challenge at hand while also having several intensive intervention
options available to implement as is necessary.
Schools not exiting Comprehensive Support after their second three-year identification period
will face state-determined action(s) drawn from the list cited in 16 V.S.A. 165(b).
1. Continue technical assistance;
2. Adjust Supervisory Union/Supervisory District boundaries or responsibilities of the
superintendency;
3. Assume administrative control only to the extent necessary to correct deficiencies; or
4. Close the school and require that the school district pay tuition to another public school
or an approved independent school pursuant to chapter 21 of this title.
d. Resource Allocation Review. Describe how the State will periodically
review resource allocation to support school improvement in each LEA
in the State serving a significant number or percentage of schools
identified for comprehensive or targeted support and improvement.
Vermont is currently developing a Uniform Chart of Accounts and financial data
reporting/collection system for use by all LEAs. When completed, this system will standardize
the process for collecting and disaggregating per pupil expenditure data in compliance with the
data collection requirements associated with ESSA. The project was started in 2014 in response
to Vermont’s Act 153; this ESSA requirement also reflects Vermont statutory requirements and
our state’s understanding of high quality practice around data collection and reporting.
Although the Uniform Chart of Accounts is currently under development, progress towards
completion has been complicated by the implementation of Vermont’s Act 46, an Act providing
Vermont’s LEAs with several merger options in the interest of reducing the expenses associated
with our smallest education systems. Vermont’s LEAs are currently in the process of weighing
their consolidation options, proposing consolidations, and making the transition into new,
merged systems. This merger activity will mean that many currently existing LEAs will no
longer exist post-consolidation. Any new districts forming through this process will not have
64
per pupil expenditures to report until they begin operating. Additionally, there is usually a
one-year transition for the former district to dissolve and the new district to be fully
operational.
The number of transitions occurring at this time are making launching an LEA-level data
collection system highly impractical. Vermont does not have the resources to create and then
overhaul a data collection system over a short period of time, given that the content of the data
collection system is dependent on the finalization of LEA structures post Act-46
implementation. Because of this, the VT-AOE needs to implement its Uniform Chart of
Accounts beginning in Academic Year 2019-20, after the LEA consolidation process described in
Act 46 is anticipated to have concluded.
Having said this, the unique nature of Vermont schools renders the likelihood of usable data to
be quite small. In analyzing our data, we find that approximately 150 of 305 schools will have
data to analyze. This is because 65 schools are smaller than the 100 student threshold and
another 70 are the only school of their configuration in their grade span which excludes them
from the requirement. In fact, 11 of our roughly 60 LEAs will have no schools with data and on
the other end of the spectrum only 4 of the LEAs would have every school included in the
data. Vermont applauds the goal of insuring that all students have equitable funding; this has
long been our value. We support the effort to wisely allocate resources and given the current
constraints we are prepared to meet this requirement in the future.
e. Technical Assistance. Describe the technical assistance the State will
provide to each LEA in the State serving a significant number or
percentage of schools identified for comprehensive or targeted support
and improvement.
Click here to enter text.
Continuous Improvement Overview
Under Vermont’s Education Quality Standards, all of the state’s schools and school systems are
in an iterative cycle of continuous improvement. In meeting the requirements of ESSA, we have
built upon our longstanding practice and commitment to the differentiation of school and
SU/SD supports to reflect the identified needs of those institutions’ most vulnerable student
populations.
The VT-AOE Education Quality Assurance Team has developed an Education Quality and
Continuous Improvement Framework containing resources for identifying and selecting
evidence-based interventions. Additionally, this team will support SU/SDs—who will in turn
support schools—through the Continuous Improvement Plan (CIP) development,
implementation, and review and revision process and will follow VT-AOE established CIP
monitoring and evaluation protocols for all interim and long-term goals.
Overview of Comprehensive and Targeted School Supports
Vermont’s Education Quality and Continuous Improvement Framework is designed, first and
foremost, to ensure equitable opportunities for high-quality education. With this goal in mind,

65
the state has chosen to prioritize work with schools identified as being in need of
Comprehensive Supports. School and SU/SD-specific goals for this work will be identified by
data-rich comprehensive needs assessments and will reflect, in part, the requirements of
Vermont’s Education Quality Standards. This work will also be done in partnership with our
local-level colleagues. By assisting SU/SDs with needs assessments, helping them to seize
opportunities for high leverage interventions, and building these collaborations within efficient
improvement science cycles, Vermont seeks to build capacity at the local level and to empower
schools to improve in ways that are specific to the needs reflected through their identifications.
The table of school supports described below aligns with current Vermont policy and practice
by bolstering a continuous improvement cycle with VT-AOE technical assistance. In response to
the requirements of ESSA and the Education Quality Standards, the proposed model now
includes a more involved approach to aiding schools through their continuous improvement
processes with levels of support increasing over cumulative years of identification. This model
also describes increasing levels of accountability for improvement with Agency staff conducting
both remote and onsite monitoring of CIP implementation.
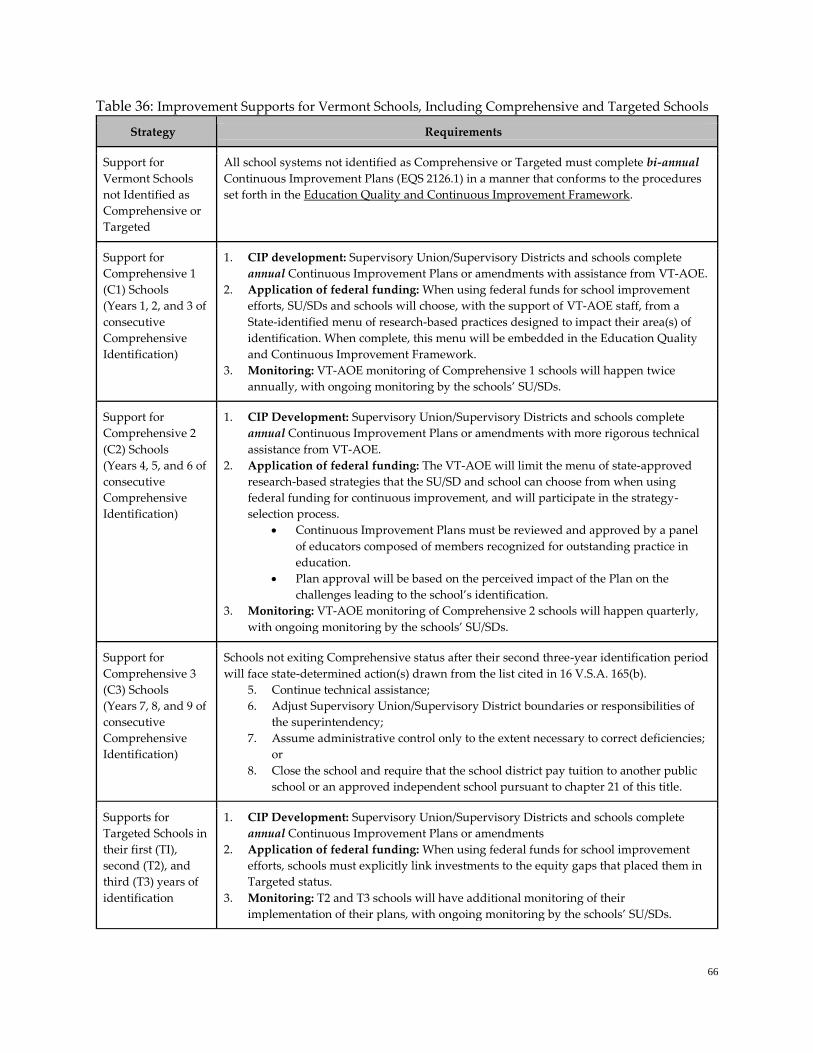
66
Table 36: Improvement Supports for Vermont Schools, Including Comprehensive and Targeted Schools
Strategy Requirements
Support for
Vermont Schools
not Identified as
Comprehensive or
Targeted
All school systems not identified as Comprehensive or Targeted must complete bi-annual
Continuous Improvement Plans (EQS 2126.1) in a manner that conforms to the procedures
set forth in the Education Quality and Continuous Improvement Framework.
Support for
Comprehensive 1
(C1) Schools
(Years 1, 2, and 3 of
consecutive
Comprehensive
Identification)
1. CIP development: Supervisory Union/Supervisory Districts and schools complete
annual Continuous Improvement Plans or amendments with assistance from VT-AOE.
2. Application of federal funding: When using federal funds for school improvement
efforts, SU/SDs and schools will choose, with the support of VT-AOE staff, from a
State-identified menu of research-based practices designed to impact their area(s) of
identification. When complete, this menu will be embedded in the Education Quality
and Continuous Improvement Framework.
3. Monitoring: VT-AOE monitoring of Comprehensive 1 schools will happen twice
annually, with ongoing monitoring by the schools’ SU/SDs.
Support for
Comprehensive 2
(C2) Schools
(Years 4, 5, and 6 of
consecutive
Comprehensive
Identification)
1. CIP Development: Supervisory Union/Supervisory Districts and schools complete
annual Continuous Improvement Plans or amendments with more rigorous technical
assistance from VT-AOE.
2. Application of federal funding: The VT-AOE will limit the menu of state-approved
research-based strategies that the SU/SD and school can choose from when using
federal funding for continuous improvement, and will participate in the strategy-
selection process.
Continuous Improvement Plans must be reviewed and approved by a panel
of educators composed of members recognized for outstanding practice in
education.
Plan approval will be based on the perceived impact of the Plan on the
challenges leading to the school’s identification.
3. Monitoring: VT-AOE monitoring of Comprehensive 2 schools will happen quarterly,
with ongoing monitoring by the schools’ SU/SDs.
Support for
Comprehensive 3
(C3) Schools
(Years 7, 8, and 9 of
consecutive
Comprehensive
Identification)
Schools not exiting Comprehensive status after their second three-year identification period
will face state-determined action(s) drawn from the list cited in 16 V.S.A. 165(b).
5. Continue technical assistance;
6. Adjust Supervisory Union/Supervisory District boundaries or responsibilities of
the superintendency;
7. Assume administrative control only to the extent necessary to correct deficiencies;
or
8. Close the school and require that the school district pay tuition to another public
school or an approved independent school pursuant to chapter 21 of this title.
Supports for
Targeted Schools in
their first (TI),
second (T2), and
third (T3) years of
identification
1. CIP Development: Supervisory Union/Supervisory Districts and schools complete
annual Continuous Improvement Plans or amendments
2. Application of federal funding: When using federal funds for school improvement
efforts, schools must explicitly link investments to the equity gaps that placed them in
Targeted status.
3. Monitoring: T2 and T3 schools will have additional monitoring of their
implementation of their plans, with ongoing monitoring by the schools’ SU/SDs.
67
f. Additional Optional Action. If applicable, describe the action the State
will take to initiate additional improvement in any LEA with a
significant number or percentage of schools that are consistently
identified by the State for comprehensive support and improvement
and are not meeting exit criteria established by the State or in any LEA
with a significant number or percentage of schools implementing
targeted support and improvement plans.
Click here to enter text.
VT-AOE anticipates that due to regional differences within the state, certain LEAs are more
likely to have multiple schools in need of Comprehensive and Targeted Supports. As we expect
schools to be concentrated in a few LEAs, this will allow the VT-AOE to invest in capacity
building at the LEA level to a greater extent than if school are dispersed across the state. Unlike
other states, the LEAs we are referencing frequently only have a single school at each grade
span. As a result, we anticipate a focused investment across the LEA to have a substantive
impact across the entire LEA.
5. Disproportionate Rates of Access to Educators (ESEA section 1111(g)(1)(B)): Describe
how low-income and minority children enrolled in schools assisted under Title I, Part A
are not served at disproportionate rates by ineffective, out-of-field, or inexperienced
teachers, and the measures the SEA agency will use to evaluate and publicly report the
progress of the State educational agency with respect to such description.7
Click here to enter text.
As indicated in Table 37, low income and minority students in Vermont schools are currently
not being disproportionately served by ineffective, out-of-field, or inexperienced teachers:
7 Consistent with ESEA section 1111(g)(1)(B), this description should not be construed as requiring a State to develop or
implement a teacher, principal or other school leader evaluation system.
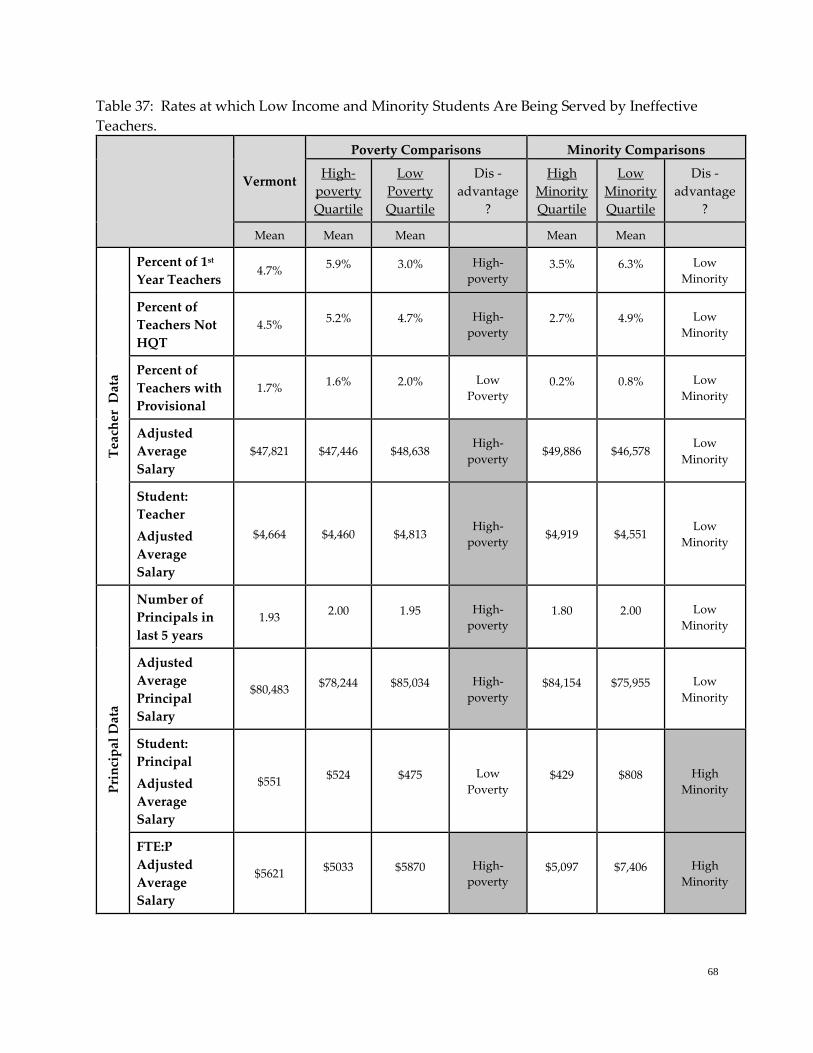
68
Table 37: Rates at which Low Income and Minority Students Are Being Served by Ineffective
Teachers.
Vermont
Poverty Comparisons Minority Comparisons
High-
poverty
Quartile
Low
Poverty
Quartile
Dis -
advantage
?
High
Minority
Quartile
Low
Minority
Quartile
Dis -
advantage
?
Mean Mean Mean Mean Mean
Tea
cher
D
ata
Percent of 1st
Year Teachers 4.7%
5.9% 3.0% High-
poverty 3.5% 6.3% Low
Minority
Percent of
Teachers Not
HQT
4.5% 5.2% 4.7% High-
poverty 2.7% 4.9% Low
Minority
Percent of
Teachers with
Provisional
1.7% 1.6% 2.0% Low
Poverty 0.2% 0.8% Low
Minority
Adjusted
Average
Salary
$47,821 $47,446 $48,638 High-
poverty $49,886 $46,578
Low
Minority
Student:
Teacher
Adjusted
Average
Salary
$4,664 $4,460 $4,813 High-
poverty $4,919 $4,551
Low
Minority
Pri
nci
pal
Dat
a
Number of
Principals in
last 5 years
1.93 2.00 1.95 High-
poverty 1.80 2.00 Low
Minority
Adjusted
Average
Principal
Salary
$80,483 $78,244 $85,034 High-
poverty $84,154 $75,955 Low
Minority
Student:
Principal
Adjusted
Average
Salary
$551 $524 $475 Low
Poverty $429 $808 High
Minority
FTE:P
Adjusted
Average
Salary
$5621 $5033 $5870 High-
poverty $5,097 $7,406 High
Minority
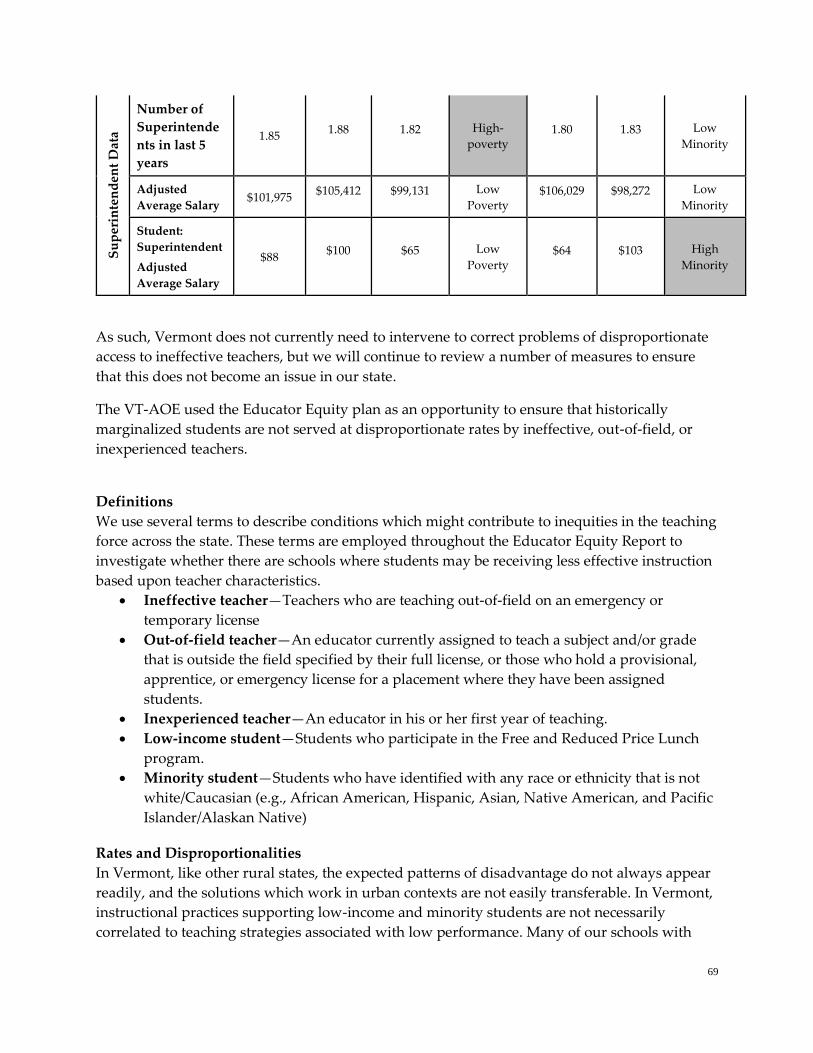
69
Su
per
inte
nd
ent
Dat
a
Number of
Superintende
nts in last 5
years
1.85 1.88 1.82 High-
poverty 1.80 1.83 Low
Minority
Adjusted
Average Salary $101,975
$105,412 $99,131 Low
Poverty $106,029 $98,272 Low
Minority
Student:
Superintendent
Adjusted
Average Salary
$88 $100 $65 Low
Poverty $64 $103 High
Minority
As such, Vermont does not currently need to intervene to correct problems of disproportionate
access to ineffective teachers, but we will continue to review a number of measures to ensure
that this does not become an issue in our state.
The VT-AOE used the Educator Equity plan as an opportunity to ensure that historically
marginalized students are not served at disproportionate rates by ineffective, out-of-field, or
inexperienced teachers.
Definitions
We use several terms to describe conditions which might contribute to inequities in the teaching
force across the state. These terms are employed throughout the Educator Equity Report to
investigate whether there are schools where students may be receiving less effective instruction
based upon teacher characteristics.
Ineffective teacher—Teachers who are teaching out-of-field on an emergency or
temporary license
Out-of-field teacher—An educator currently assigned to teach a subject and/or grade
that is outside the field specified by their full license, or those who hold a provisional,
apprentice, or emergency license for a placement where they have been assigned
students.
Inexperienced teacher—An educator in his or her first year of teaching.
Low-income student—Students who participate in the Free and Reduced Price Lunch
program.
Minority student—Students who have identified with any race or ethnicity that is not
white/Caucasian (e.g., African American, Hispanic, Asian, Native American, and Pacific
Islander/Alaskan Native)
Rates and Disproportionalities
In Vermont, like other rural states, the expected patterns of disadvantage do not always appear
readily, and the solutions which work in urban contexts are not easily transferable. In Vermont,
instructional practices supporting low-income and minority students are not necessarily
correlated to teaching strategies associated with low performance. Many of our schools with
70
high percentages of minority students relative to state averages enjoy teachers with
proportionally higher experience who are not teaching out-of-field. Only in schools that are
both rural and poor do teaching characteristics associated with limited effectiveness begin to
surface and, then, only marginally.
The educator characteristics Vermont is proposing to report are:
Percentage of teachers in a school in their first year of teaching (experience indicator)
Percentage of teachers in a school on a provisional or emergency license (out-of-field
indicator)
Percentage of teachers in a school new to their Supervisory Union/Supervisory District
These data are attempts to ensure that disadvantaged students are not taught
disproportionately by teachers on a provisional or emergency license or who are new to the
profession or the school. Research suggests that new educators and those teaching outside of
their endorsement area lead to less effective student outcomes. If these characteristics cluster
around individual schools, that would be evidence of educator inequity. These are data already
being collected at the State as part of the educator equity plan. Additionally, rule 2121.2 of the
Education Quality Standards requires staff to be properly licensed and prepared for their
teaching assignment.
Though the data suggest that educator equity and mobility is a limited challenge across the
state, our goal is the reduction of disproportionate rates by ineffective, out-of-field, or
inexperienced teachers compared to non-low-income and non-minority students enrolled in
schools not receiving funds under Title I, Part A.
6. School Conditions (ESEA section 1111(g)(1)(C)): Describe how the SEA agency will
support LEAs receiving assistance under Title I, Part A to improve school conditions for
student learning, including through reducing: (i) incidences of bullying and harassment;
(ii) the overuse of discipline practices that remove students from the classroom; and (iii)
the use of aversive behavioral interventions that compromise student health and safety.
Click here to enter text.
The academic indicators proposed in this plan—indicators tied to ELA and Math performance,
Science, PE, Career and College Readiness, Post-Secondary Outcomes, and Graduation Rate—
are a critical part of Vermont’s larger accountability system. But Vermont will also include
other categories of performance measures its accountability framework—measures that would
be challenging to use as a differentiation tool, but which represent ideas and goals that the state
feels a need to support.
One of those categories of performance measures, Safe and Healthy Schools, will include school
climate data. Local education systems who can link improved student academic outcomes to
addressing bullying and harassment challenges will be encouraged to invest Title I, Part A
71
funding in interventions that will correct those problems, with school climate as a focus of that
federally-funded work.
Vermont has long been actively working to reduce hazing, harassment and bullying in schools.
EQS 2122.1 requires that each school maintain a safe, orderly, civil, flexible, and positive
learning environment, which is free from hazing, harassment, and bullying and based on
sound instructional and classroom management practices and clear discipline and attendance
policies that are consistently and effectively enforced. Towards that end, we have established a
statewide advisory council to address matters related to hazing, harassment, and bullying and
required that each local LEA designate individuals in schools that respond to complaints made
by victims, bystanders or advocates when incidents occur. Most schools participate in formal
school climate programs like PBiS, SWIFT, or other programs to reduce negative school
interactions and promote positive learning for all.
Another Safe and Healthy Schools indicator will examine the rate of exclusionary discipline in
education systems. This measure is specifically designed to frame data-supported
conversations about exclusionary discipline, as applied to all students, with an emphasis on
their disproportionate application to Historically Disadvantaged Students. Within Vermont’s
continuous improvement framework, the VT-AOE will support LEAs and schools in identifying
alternatives to these disciplinary measures, with an emphasis on ensuring that students stay on
a school campus and have access to classroom supports, even when disciplinary action is
warranted.
Vermont does not support the use of aversive behavioral interventions that compromise
student health and safety in schools. The state has two ways to address this through its school
improvement work—examining underlying causes contributing to any reported cases of
aversive behavioral interventions and utilizing widespread preventative programs (like Positive
Behavioral Interventions and Supports—or PBIS) to minimize the risk of these interventions
occurring. If the need for preventing or finding alternatives to aversive behavioral
interventions doesn’t arise through examining data on reported incidents, it may come through
as a result of reviewing school climate survey data. In that case, addressing this problem would
become a part of a school or LEA’s continuous improvement work and could be supported with
Title funding and related VT-AOE monitoring supports, if it could be linked to improving
students’ academic outcomes.
7. School Transitions (ESEA section 1111(g)(1)(D)): Describe how the State will support
LEAs receiving assistance under Title I, Part A in meeting the needs of students at all
levels of schooling (particularly students in the middle grades and high school), including
how the State will work with such LEAs to provide effective transitions of students to
middle grades and high school to decrease the risk of students dropping out.
Click here to enter text.
72
Vermont has a relatively small number of public schools, compared to other states, but there’s a
lot of organizational variety within those schools, including the grades that various Vermont
schools serve. Examples include schools serving K-12 students, K-2, K-8, 6-8, 5-8, and 7-12, with
schools serving different but overlapping grades (K-2, K-6) sometimes being housed within the
same LEA.
Because of the organizational complexity that this creates, conversations about student
transitions and graduation and dropout rates between schools have to be specifically tailored to
the needs and circumstances of each LEA. Fortunately, Vermont has a continuous
improvement framework that supports customized supports for LEAs and which specifically
incorporates performance measures that would inform this conversation.
The current continuous improvement framework in Vermont revolves around examining
systemic efficacy at every level: LEA, school, and classroom. It was developed on the back of a
longstanding MTSS framework that included numerous culture and climate indicators,
graduation indicators, and an indicator about supporting students transitioning from school to
school within an LEA. Vermont’s current continuous improvement model, which is framed by
the Education Quality Review (EQR) process, feeds similar data sets into school and LEA-level
conversations related to transitions and dropout: it currently includes data around graduation
rates and will include climate data once Vermont identifies a statewide climate survey (a project
that is currently in progress, with an anticipated 2017-18 pilot date).
These data would be discussed and drilled into as a part of the local-level conversations that
make EQRs such an effective school improvement tool. Those conversations begin with a data-
driven comprehensive needs assessment of the LEA under review and its schools, and include
VT-AOE staff, as well as local-level school and LEA staff, community members, and
students. Through these conversations, the graduation rate data that will be a part of our
federally-required school accountability work will be examined more closely—if dropout rate
and supporting student transitions are identified through the needs assessment and subsequent
conversations as high-priority challenges, then LEAs and schools will address those challenges
through their state-mandated improvement plans. Implementation of those plans would be
monitored over time by VT-AOE staff.
Local education systems who can link improved student academic outcomes to addressing
challenges stemming from school transitions will be encouraged to invest Title I, Part A funding
in evidence based interventions that will correct those problems. The VT-AOE will review the
use of that funding through its continuous improvement model, which includes monitoring and
evaluation of the use of Title funds within local-level continuous improvement efforts.
Vermont State Board Rule 4500, The Use of Restraint and Seclusion in Vermont Schools, has
been in effect since August, 2011. The purposes of Rule 4500 are to (a) create and maintain a
positive and safe learning environment in schools, (b) promote positive behavioral
interventions and supports in schools, and (c) ensure that students are not subjected to
inappropriate use of restraint or seclusion. Rule 4500 is based upon Federal guidance and
73
Vermont has consistently ranked among the states receiving the highest ratings for the breadth
and depth to which this rule provides safeguards for Vermont students. The report “How Safe
is the Schoolhouse? An Analysis of State Seclusion and Restraint Laws and Policies,” published
by Jessica Butler ([email protected]) in July 2015 includes Vermont as one of 23 states that provide
meaningful protection by law for all children regarding restraint and seclusion. The report also
indicates that Vermont is one of 18 states that limits the use of restraint to emergency threats of
physical harm for all children.
Under Rule 4500, the superintendent of a LEA must report the use of a restraint or seclusion to
the Secretary of the Agency of Education within 3 school days of receipt of a report that
includes any of the following:
– (a) The intervention results in death or injury (to the student or staff) that
requires outside medical attention
– (b) The intervention was administered in violation of Rule 4500
– (c) The intervention lasted for a duration of more than 30 minutes
Relatively few instances occur each year, but all are investigated and VT AOE track data to
ensure that LEAs with repetitive reports receive technical assistance and training in de-
escalation strategies.
B. Title I, Part C: Education of Migratory Children 1. Supporting Needs of Migratory Children (ESEA section 1304(b)(1)): Describe how, in
planning, implementing, and evaluating programs and projects assisted under Title I, Part
C, the State and its local operating agencies will ensure that the unique educational needs
of migratory children, including preschool migratory children and migratory children
who have dropped out of school, are identified and addressed through:
i. The full range of services that are available for migratory children from
appropriate local, State, and Federal educational programs;
ii. Joint planning among local, State, and Federal educational programs
serving migratory children, including language instruction educational
programs under Title III, Part A;
iii. The integration of services available under Title I, Part C with services
provided by those other programs; and
iv. Measurable program objectives and outcomes.
Click here to enter text.
Consistent with Vermont’s overall commitment to equity for all students, Vermont takes
meeting the needs of migratory children seriously. Essential to this process is collaboration with
other agencies supporting Vermont’s migrant population. The process of identification,
enrollment, and determination of “priority for services” is outlined below. This process is a
continuation of current practice.
The primary goal of the Vermont Migrant Education Program (VMEP) Identification and
Recruitment is to find and enroll every migratory child and youth in the state under the age of
74
22 who has moved with a family member, a guardian, or independently in order to seek or
obtain temporary or seasonal work in qualifying agricultural activities. To achieve this goal, VT-
AOE partners with the University of Vermont Extension Program.
The Vermont Migrant Education Program recognizes that positive relationships between
parents, students, and schools are essential to the success of every child’s academic life.
Furthermore, the VMEP recognizes that youth who are not formally enrolled in an academic
institution yet lack a high school diploma or its equivalent are also entitled to receive quality
educational opportunities. UVM Extension MEP Recruitment staff support this philosophy and
recognize that without an efficient, comprehensive, and multi-tiered statewide recruitment
plan, necessary educational services will not reach eligible migratory students. UVM Extension
MEP Recruitment staff form the essential bridge of the program by locating eligible migrant
families and individuals so they can receive the supplemental educational support and services
VMEP offers.
UVM Extension MEP Recruitment staff works closely with Supervisory Union/Supervisory
Districts, local schools, teachers, Vermont Adult Learning, parents, social service agencies, and
the agricultural community to identify and recruit eligible migratory children and youth
following the requirements in MEP legislation, regulations, and guidance. Statewide
recruitment is carried out by a creative combination of staff arrangements; part-time seasonal
staff, part-time year round staff, and a part-time State Identification and Recruitment Program
Coordinator. The state is divided into five designated recruitment areas: the 3 higher density
farming regions (Franklin and Addison County and the Northeast Kingdom) are covered by
part-time year round staff while the 2 remaining regions are covered by part-time seasonal staff.
Recruiters are expected to visit each school and farm in their regions at least annually. Farms
that have an historically high turnover rate will be visited by recruiters more frequently. In
addition, all schools disseminate an agricultural employment survey with school registration
packets and those are then sent to UVM Extension to follow up on students potentially eligible
for VMEP. The goal of Vermont’s identification & recruitment program is to assure timely and
accurate identification and recruitment of all eligible migratory students.
The recruiter completes a Certificate of Eligibility (COE) for the student once identified. The
COE is checked for accuracy and eligibility by the State Identification & Recruitment Program
Coordinator, reviewed by the VMEP Data Technician, and, finally, reviewed and signed by the
State Director of VMEP. VMEP enters student information into the MIS2000 data system.
Student COE information is checked against current information in that system and also in the
national Migrant Student Records Exchange Initiative (MSIX) database. To ensure the accuracy
of student data, each year a residency check is completed and a minimum of 10% of new COEs
are selected for prospective re-interviews. Every 3 years, the State completes an intensive re-
interview process to determine the accuracy of our recruitment system.
Assessing migrant student needs begins at identification and recruitment when the recruiters
complete either an Out-of-School Youth Profile or an In-School Youth Profile. Both profiles are
75
modeled after the profile developed by the Out of School Youth (OSY) Consortium – a multi-
state consortium funded to identify the needs of migrant out-of-school youth and to develop
appropriate services for that population. The profiles contain information such as last grade
completed, health issues, social issues, home language, and other data informing staff of the
unique needs of each student. In addition, families and school staff are interviewed to
determine needs and barriers that must be addressed so that each student can succeed
academically. When available, state and local assessment data is used to further pinpoint
students’ academic needs.
The state needs assessment is a formal process directed by the Office of Migrant Education
guidance that includes a committee comprised of people familiar with the migrant population
in Vermont. The needs assessment includes an examination of efficacy in meeting individual
student progress to determine effective programming, along with an analysis of various
demographic data.
Vermont’s service delivery plan focuses on our three groups of students with unique needs:
migrant pre-school students, migrant in-school students, and migrant out-of-school youth. Pre-
school students benefit from Vermont’s newly implemented law, Act 166, subsidizing high-
quality pre-school program to all 3 and 4 year olds and 5 year olds not yet in kindergarten. Our
first goal is to enroll migrant preschoolers into those programs. Program mentors and teachers
work with the families and schools to eliminate barriers to attendance. For our migrant families
those barriers most commonly involve addressing transportation and home language barriers.
For our migrant children under 3 years old, mentors and teachers work with the families using
a research-based family literacy program.
Vermont’s in-school migrant students benefit from a comprehensive continuum of services
offered in the school and community. VMEP’s first goal with in-school students is to assure that
they are accessing all the services the school has to offer. Those services include Title I support,
Title III and federally required ELL services, afterschool and summer learning programs,
extracurricular activities, and other academic and social supports. VMEP’s mentor/teachers
work with both the families and schools to meet individual student needs and to enable the
students to meet State academic achievement goals, including assisting secondary students in
accruing credit towards high school graduation. If needed, the program will provide additional
tutoring to assure student success. All enrolled preschool and in-school students receive all the
benefits of federal child nutrition programs as a directly certified student.
Vermont’s out-of-school migrant population presents the hardest challenges. Most have left
school to work and many were disengaged from school when they did attend. VMEP hires
tutors to assess the student’s academic and English language acquisition needs. They then
create and implement an educational plan. Some students receive individual tutoring each
week while others attend classes jointly offered by VMEP and Vermont Adult Learning.
Resources and tools developed by Vermont participation in the OSY Consortium are used to
meet previously identified student needs.
76
VMEP is currently engaged in completing the work on our comprehensive needs assessment
and service delivery plan. The plan will identify measurable program objectives and strategies
to be adopted based on the needs summarized above.
Please see Appendix D. This is a draft of the assessment and plan; the final version will be
completed in late spring 2017, with objectives incorporated into the final version of the Vermont
state plan.
2. Promote Coordination of Services (ESEA section 1304(b)(3)): Describe how the State
will use Title I, Part C funds received under this part to promote interstate and intrastate
coordination of services for migratory children, including how the State will provide for
educational continuity through the timely transfer of pertinent school records, including
information on health, when children move from one school to another, whether or not
such move occurs during the regular school year.
Click here to enter text.
Educational continuity is the highest priority for Vermont’s migratory students. Once a student
or family is located, the first goal is to ensure that the family’s children are enrolled in school. If
needed, migrant staff will accompany the family to the appropriate school to register the
children. Record transfer, health information including immunization records, and other
requests from the school registrar is of secondary importance to enrollment. VMEP staff work
with schools within the state to ensure all records are transferred in a timely manner. This is
especially important for students experiencing homelessness, those in the process of or have
been identified for special education services, and English learners. VMEP staff meet regionally
each month to discuss common students following a case study design.
Through Vermont’s participation in two Migrant Education Program consortia, staff have
developed strong relationships with state leadership and program staff from other states. This is
especially true within the New England region where students tend to be transitory across state
lines. As soon as VMEP staff identify where a student resided previously, that state is contacted
for all appropriate student information.
VMEP uses the MSIX to determine where a student previously attended school as well as other
pertinent information. That information is passed along to the current school to make sure the
student records are transferred in a timely manner. If leaving Vermont, a student or his or her
family can inform VMEP of an impending move, allowing the VMEP staff to expedite the
transition to the new school and minimize a student’s time out of school.
VMEP recognizes that parents play a central role in the academic success of their children. As
such, parent input into the design and implementation of the program is extremely important.
Mentor/teachers are in frequent contact with parents to ascertain both a student’s needs and to
determine if the supports provided are helpful to the student’s success. Parents are asked to

77
complete a parent survey (currently available in English and Spanish) annually, in which they
are able to comment on the services they received and suggest improvements to the program.
Additionally, VMEP has implemented regional, day-long, family events at least twice a year.
These events include family learning activities, student activities, and time reserved for a parent
meeting. The parents select a topic of interest (that typically originates with a parent suggestion)
and then spend time in a facilitated discussion on the planning and implementation of the
VMEP. From the participating parents, representatives are nominated to represent the region in
the annual statewide parent advisory meeting.
The agenda for the state-wide meeting includes team building activities and, most importantly,
an opportunity for parents to register their thoughts on strengths and limitations of the VMEP’s
services for students. For example, the measureable program objectives and strategies will be
presented to parents at the advisory council. Parents provide feedback. The feedback guides
modifications to program objectives and strategies.
The VMEP In-School Coordinator’s job description includes organizing the regional meetings,
the annual meeting, and the responsibility for meeting the parent advisory council
requirements of MEP under ESSA.
3. Use of Funds (ESEA section 1304(b)(4)): Describe the State’s priorities for the use of
Title I, Part C funds, and how such priorities relate to the State’s assessment of needs for
services in the State.
Click here to enter text.
VMEP is currently engaged in completing a comprehensive needs assessment and service
delivery plan. In the summer of 2016, VMEP contracted with META Associates to facilitate the
comprehensive needs assessment following the guidance set forth by the Office of Migrant
Education. A needs assessment committee was chosen, met, and reviewed the following data:
Student demographics including recent changes
State assessment data for participating migrant students
Parent survey results
Staff survey results
Out of school youth performance and survey data
Concerns expressed from committee members
The needs assessment process initially identified the following challenges for migrant students
in Vermont.
A low percentage of migratory students is proficient in reading and English language
arts as measured by the State assessment. Additionally, there is a significant
achievement gap between the performance of migratory students and non-migratory
students in Vermont.
78
A low percentage of migratory students is proficient in mathematics as measured by the
State assessment. Additionally, there is a significant achievement gap between the
performance of migratory students and non-migratory students in Vermont.
VMEP is not currently assessing the ELA and mathematics skills of out-of-school youth.
Migrant children under age 5 do not have consistent and sufficient early education due
to lack of transportation, parental work schedules, limited of English proficiency, and
limited access to available and appropriate PK programs.
Parents who are migratory lack abundant strategies to support their pre-school and in-
school children’s academic success.
Secondary students who are both migratory and OSY struggle to attain their educational
goals.
OSY who have limited English proficiency have commensurate limited access to
education and other associated services, resources, and opportunities.
Under ESSA, students are identified as “priority for service” if they have made a qualifying
move within the previous one-year period and are failing—or most at-risk of failing—to meet
the challenging State academic standards or who have dropped out of school. To identify these
students, a monthly list of all students who have a qualifying move within the previous twelve
months is created from our MIS2000 database. All students who are currently out-of-school will
be priority for service students. From the remaining names on the list, mentor/teachers are
asked to identify which students are failing or at risk of failing by one or more of the following
criteria:
Scoring below proficient on the ELA, mathematics, or science state assessments
Scoring below proficient on a valid local assessment in literacy or math
Retention at any time in the last 3 years
Previously dropped out of school
Performing below grade level in literacy or math according to the classroom teacher
Receiving one or more “D’s” or below on the last student report card
Missing 10 or more days of school since the beginning of the school year.
The responsibility of documenting priority for services determination ultimately falls to the
State Director of Migrant Education, who uses the monthly list to prioritize services, beginning
with out-of-school youth. The remainder of the list is sent to the mentor/teachers to make
determinations based on the criteria listed above. After the initial determination is made, the
VMEP program manager makes a final determination of priority status.
Priority for Service (PFS) students receive services immediately. Currently, VMEP has sufficient
funds to serve all students, but PFS receive further support—more time, more services, more
supplies—as needed to succeed academically or, in the case of a secondary student, to stay in
school and progress to graduation.
VMEP is a year-round program. Each month, the State Director sends the Program Coordinator
and the regional mentor/teachers the list of eligible students, the list of students needing PFS
79
determinations, and the list of students currently designated as PFS. The reports are run at the
beginning of every month and made available to the Program Coordinator at that time. As
Vermont moves to the MIS2000 web-based platform, field staff will receive training on how to
create and run a report themselves, allowing a timely list of all currently eligible students with
the PFS determination. VMEP’s goal is to move to a system where information about our
students is available immediately to all full and part-time staff that work with our students.
80
C. Title I, Part D: Prevention and Intervention Programs for Children and
Youth who are Neglected, Delinquent, or At-Risk 1. Transitions Between Correctional Facilities and Local Programs (ESEA section
1414(a)(1)(B)): Provide a plan for assisting in the transition of children and youth
between correctional facilities and locally operated programs.
Click here to enter text.
Vermont has only two correctional facilities that serve eligible delinquent youth. Our adult
correctional system has one educational program – the Community High School of Vermont
serving students aged 18 and up who do not yet have a high school diploma. There is one
facility for delinquent youth under the age of 18. This program maintains the student’s
enrollment in their home high school and offers a full range of classes so that students may
continue their progression toward a high school diploma. The numbers of eligible students in
both programs are low and has been declining over time, especially in the adult correctional
facility. Both facilities offer transition counseling as part of the educational services offered to
students. The counseling focuses on successful transition to their home high school, post-
secondary courses, appropriate vocational programs, job-training, other educational programs,
and employment.
2. Program Objectives and Outcomes (ESEA section 1414(a)(2)(A)): Describe the program
objectives and outcomes established by the State that will be used to assess the
effectiveness of the Title I, Part D program in improving the academic, career, and
technical skills of children in the program.
Click here to enter text.
Vermont Agency of Education’s Title I, Part D program has two goals for youth in neglected or
delinquent facilities:
1. Provide educational and support services for youth in neglected or delinquent
programs so that they will achieve proficiency on the state assessments and progress
towards a high school diploma.
2. Provide youth in institutions for neglected or delinquent programs with services to
make a successful transition from institutionalization to further schooling or
employment.
These goals will be achieved by:
1. Each student will be evaluated upon entry using student’s records and a range of
assessment designed to determine proficiency in math and literacy including their
current status on progress towards a high school diploma.
2. Each student will have an individual educational plan based on their needs that
includes both educational and other needed supports.
3. While in the institutions, students will achieve the goals of their plans and work
towards a high school diploma (including if appropriate, successfully transitioning
back to their home school).
81
D. Title II, Part A: Supporting Effective Instruction 1. Use of Funds (ESEA section 2101(d)(2)(A) and (D)): Describe how the State educational
agency will use Title II, Part A funds received under Title II, Part A for State-level
activities described in section 2101(c), including how the activities are expected to
improve student achievement.
Click here to enter text.
The Education Quality Standards are built on the premise of continuous improvement for all
schools. It follows, then, that we should expect the same for our educators. As required by
statute, four percent of the Title IIA monies will be used to fulfill the VT-AOE’s responsibility to
provide proper and efficient administration and monitoring of the programs carried out under
the Title. Vermont is fortunate to have an experienced Title IIA administrator who will continue
to guide and support SU/SDs on how to most effectively use local funds, with evidence-based
approaches to improving teacher effectiveness. To ensure that SU/SDs are developing,
implementing, and evaluating investment plans that meet the academic and non-academic
needs of all students, Vermont will utilize a continuous improvement planning cycle to provide
differentiated technical assistance, progress monitoring, compliance review, and corrective
action in support of evidence-based practice.
Consistent with our dedication to equity for all students, the State will employ SU/SD level
funding to provide ongoing support for teachers on identifying and providing high quality
instruction to students with specific learning needs. The supports will include, but not be
limited to:
Alignment of efforts to standards including the Vermont Professional Learning
Standards, Education Quality Standards, and the Core Teaching and Leadership
Standards for Vermont Educators.
Collaborative (cross-agency) collection of data to inform continuous improvement,
starting with a comprehensive needs assessment to determine the specific and
contextual needs within an SU/SD. Data will be used to determine the most effective
path to narrowing gaps in achievement.
A determination of which evidence-based activities, strategies, and interventions are
most likely to have a measurable impact on student achievement. Funding decisions will
be determined by the SU/SD’s identified needs, and the presence of evidence-based
actionable plans likely to have a positive impact on student learning.
Collection, analysis, and presentation of evidence to support requests for the
continuation of funding of subsequent investments.
Institution of a systemic process for the collection of evidentiary practices across the
state to extend, expand, and refine state-wide use of the evidence-based levels
Development of a state-wide Community of Practice (in alignment with other state-wide
professional learning networks such as the VT-Professional Learning Network) to
support the dissemination of information about teaching strategies and interventions
that are having a measurable impact on students.
2. Use of Funds to Improve Equitable Access to Teachers in Title I, Part A Schools (ESEA
section 2101(d)(2)(E)): If an SEA plans to use Title II, Part A funds to improve equitable
82
access to effective teachers, consistent with ESEA section 1111(g)(1)(B), describe how
such funds will be used for this purpose.
Click here to enter text.
We do not intend to use our Title II, Part A funds for equitable access to effective teachers. In
Vermont, access to effective teachers is not correlated to student characteristics. For further
information, please refer to the Vermont Educator Equity Report or Section A.5 of this plan.
3. System of Certification and Licensing (ESEA section 2101(d)(2)(B)): Describe the State’s
system of certification and licensing of teachers, principals, or other school leaders.
Click here to enter text.
The Vermont Agency of Education (VT-AOE) is proud of the relationship it has developed with
the field to coordinate teacher licensing. Initial licensing is largely the result of alignment
between the VT-AOE and state-accredited teacher education programs. Licensing renewal
involves collaboration between the VT-AOE, the Vermont Standards Board for Professional
Educators (VSBPE), and local and regional standards boards across the state. While this
cooperation is essential to the quality and success of the licensure program, the responsibility
for validation of educators’ credentials rests solely with the VT-AOE.
The VT-AOE ensures that all teachers and paraprofessionals working in a program supported
with funds under part 1111(g)(2)(J) meet applicable State certification and licensure
requirements, including any requirements for certification obtained through alternative routes.
Vermont will continue to follow the licensing pathways established and defined by VSBPE
under Rule 5300. Educators can earn a license through a traditional educator preparation
program, the NASDTEC Interstate Agreement, or alternate routes.
Current Licensing requirements reflect the importance of providing a quality education for all
of Vermont’s students. The Vermont Standards Board of Professional Educators has the
statutory responsibility for the development of rules regarding the licensure of Vermont
educators. In 2016, the VSBPE went through the Legislative Committee on Administrative Rules
for revisions of current rules. This process includes stakeholder input/comment. The VSBPE will
continue with rule revisions based on changing educational landscape and research on educator
effectiveness. This dedication to reflecting current high quality practice affirms Vermont’s
commitment to the quality education of all students in the state and reflects a continuation of
current practice.
4. Improving Skills of Educators (ESEA section 2101(d)(2)(J)): Describe how the SEA will
improve the skills of teachers, principals, or other school leaders in order to enable them
to identify students with specific learning needs, particularly children with disabilities,
English learners, students who are gifted and talented, and students with low literacy
levels, and provide instruction based on the needs of such students.
Click here to enter text.
As provided by the statute, Vermont will reserve an additional three percent of Title IIA funds
to provide high quality, professional learning for principals and other school leaders through
the creation and implementation of a Vermont Leader’s Professional Learning
83
Academy/Institute. By supporting the use of robust and actionable data to provide professional
learning for principals and other school leaders, the Vermont Agency of Education will build
state-wide communities of practice to engage in high quality professional learning with clearly
articulated and measurable outcomes.
The Academy will be aimed at improving student outcomes in low-performing schools.
Consistent with research on the impact of highly effective school leaders on student
performance, the Academy will aim to increase the capacity of school leaders to recruit, retain,
and support effective educators. Specifically, the Academy will:
Concentrate on improving the capacity of school leaders, primarily those leading schools
identified for Comprehensive or Targeted Supports.
Employ a curriculum informed by input from stakeholders (state accountability data
and evidence collected from the Education Quality Review process) and aligned with
Standards including Vermont’s Professional Learning Standards, Education Quality
Standards, and the Core Teaching and Leadership Standards for Vermont Educators.
Develop outcome-oriented performance metrics that will be utilized to measure the
impact of the professional learning in areas such as standards-based, data-driven, and
differentiated instruction, equitable access to high quality instruction, cultural
competence, subject and content-specific issues, and the effective leveraging of resources
to address equity and excellence.
Utilize the VT-AOE Leadership Team model as the foundational forum for ongoing
conversation and review of the initiative to support evidence gathering.
Minimize duplication of effort by collaborating with other professional learning
providers in the development and implementation stages of the professional learning.
5. Data and Consultation (ESEA section 2101(d)(2)(K)): Describe how the State will use
data and ongoing consultation as described in ESEA section 2102(d)(3) to continually
update and improve the activities supported under Title II, Part A.
Click here to enter text.
The Vermont VT-AOE will use our continuous improvement model to gather and evaluate data
to update and improve activities supported under Title II, Part A. For a thorough examination
of our continuous improvement model, please see Section A.4.viii.e above.
In addition to the continuous improvement process, VT-AOE convenes the Committee of
Practitioners quarterly to consider the efficacy of the activities supported under Title II, Part A.
6. Teacher Preparation (ESEA section 2101(d)(2)(M)): Describe the actions the State may
take to improve preparation programs and strengthen support for teachers, principals, or
other school leaders based on the needs of the State, as identified by the SEA.
Click here to enter text.
On behalf of VSBPE, the Vermont Agency of Education operates the Results Oriented Program
Approval (ROPA) process to facilitate the recommendation of Level I licensure to Vermont–
based educator preparation programs. Preparation programs must demonstrate that their
84
candidates meet the requisite standards for professional practice and that the institution
allocates sufficient resources and support to ensure the long-term success of the program.
Among these standards is the educator preparation program requirement of demonstrating that
candidates for licensure understand individual differences and diverse cultures, providing a
variety of high-quality field experiences with a diverse population of students and educators,
and recruiting, admitting, supporting, and retaining candidates, faculty, and cooperating
teachers from diverse backgrounds.
These standards provide ROPA review teams with a mechanism to evaluate institutional
commitment to preparing candidates to meet the needs of diverse learners and cultures, and to
ensure that our most disadvantaged students have educational professionals who are trained to
meet their personalized needs. Continued use of the ROPA standards and review process will
constitute a continuation of practice. Improving preparation programs with a focus on
addressing the needs of all students, including Historically Marginalized Students will ensure
that all students are taught by qualified teachers according to accepted standards of practice.
The ROPA process is reviewed annually and revised based on changes in Vermont policy and
practice for Teacher Preparation. This will largely be a continuation of current strategy, with the
addition of an evaluation process beginning in 2017. Vermont will continue to use Title IIA
funds to support part of the work of the pre-service education quality coordinator. This position
works with the field to establish professional standards and competencies for all educational
endorsement areas offered in the State, and works with the educator preparation programs in
the state to align their coursework with these competencies. The position also aides in the five-
year review of educator preparation programs. Through this position, we can align educator
standards, student learning goals, and policy decisions, ensuring that graduates are familiar
with state priorities and well-prepared to teach in Vermont schools.
85
E. Title III, Part A, Subpart 1: English Language Acquisition and
Language Enhancement 1. Entrance and Exit Procedures (ESEA section 3113(b)(2)): Describe how the SEA will
establish and implement, with timely and meaningful consultation with LEAs
representing the geographic diversity of the State, standardized, statewide entrance and
exit procedures, including an assurance that all students who may be English learners are
assessed for such status within 30 days of enrollment in a school in the State.
Click here to enter text.
Students who are English Learners are an expanding population in Vermont. They are among
the most vulnerable students, a valuable cultural and linguistic asset, and an important source
of population growth to meet Vermont’s economic challenges. This section of the state plan
addresses the identification, entrance, and exit procedures for English Learners in Vermont.
How English learners fit into the broader school accountability system is addressed in greater
detail in the Accountability section of the state plan. Though there are some updates to the
assessments being used for identification and exiting of services, conceptually, this is a
continuation of current practice.
Vermont is a member of the WIDA state assessment consortium that has been actively involved
in the collaborative work to develop a “common definition of English learner.” This work,
encapsulated in CCSSO’s Moving Toward a More Common Definition of English Learner, has
guided the standardization and strengthening of Vermont’s entrance and exit procedures. The
VT-AOE also met with roughly 15 representatives from across the state’s EL educator
community during a public input session on August 11, 2017. The subject of entrance and exit
criteria was raised then, and the outcome of that discussion—that entrance criteria should be
relatively simple and standardized, and that exit criteria should be simple, and should possibly
include locally-identified data points—informed the decision that the VT-AOE is proposing.
The VT-AOE plans to host additional consultations with SU/SDs to share the guidance learned
through WIDA collaboration.
Vermont’s standardized entrance procedures Vermont’s standardized entrance procedure includes two parts, identification and classification.
For identification, the VT-AOE requires all schools in Vermont use the home language survey
form to determine potential English Learners. Typically, SU/SDs administer the survey to
parents/guardians at the time of a student’s initial school enrollment; in any case, all students
who may be English Learners will be assessed to determine their EL status within 30 days of
enrollment in a Vermont public school. Based on survey responses and, when additional
clarification is needed, a follow-up parent interview, an English learner professional evaluates
whether further screening/assessment of the student’s English language proficiency is required.
After a student has been identified as a potential English learner, Vermont uses a screener to
confirm whether a student should be classified as an EL and, if so, to determine the student’s
current level of English proficiency. Previously there were multiple screeners used by SU/SDs
86
across the state; however, beginning in the 2017-18 school year, all Vermont schools will begin
using the WIDA Screener for initial classification/placement purposes. The screener was
developed through an enhanced assessment grant to the WIDA “ASSETS” project and is more
valid and reliable for classifying initial listening, speaking, reading, and writing skills than the
screeners currently allowed. Moving to a single screener will also create consistency in
eligibility determinations across Supervisory Union/Supervisory Districts.
Description of Vermont’s standardized exit procedures Once identified, English learners take an English language proficiency assessment annually to
gauge their progress toward achieving proficiency. Proficient scores in numerous domains are
required to exit services. For a more in-depth discussion of the how targets are set for English
learners, please see the Accountability section of the state plan. Starting in school year 2015-
2016, Vermont transitioned to the ACCESS 2.0 online assessment of English language
proficiency for ELs in Grades 1-12. Kindergarten students still take a paper form of the ACCESS
test. Students with severe cognitive disabilities take the ACCESS Alternate Assessment.
Consistent with guidance from WIDA, Vermont requires a composite proficiency level score of
5.0 on the ACCESS 2.0 assessment, plus a minimum score of 4.0 or higher on the reading and
writing domains of the test to exit supports. Kindergarten students are required to be assessed
again in Grade 1 before they can exit.
Currently, Vermont uses only the state English language proficiency assessment for purposes of
exit from EL status. The State does not include performance on an academic content assessment
as an exit criterion from EL status. The legislation allows for consideration of other measures,
and the WIDA Consortium is helping states calibrate EL proficiency scores with scores on state
content assessments, including the SBAC. In the future, we will monitor these developments
and consult to the field to see if pursuit of a multiple measure determination of proficiency is
desired and possible. If the field and data trend in this direction, we would consider a revision
of our state plan. For now, however, we will continue to use only ACCESS to make
determinations of English language proficiency.
With these resources and supports, the VT-AOE will share proposed changes to state-wide
entrance procedures and exit criteria with Title III Directors, EL teachers, and other
stakeholders. Additionally, we intend to seek input during face-to-face meetings and explore
formation of continued communities of practice.
2. SEA Support for English Learner Progress (ESEA section 3113(b)(6)): Describe how the
SEA will assist eligible entities in meeting:
i. The State-designed long-term goals established under ESEA section
1111(c)(4)(A)(ii), including measurements of interim progress towards
meeting such goals, based on the State’s English language proficiency
assessments under ESEA section 1111(b)(2)(G); and
87
ii. The challenging State academic standards.
Click here to enter text.
The VT-AOE will follow the continuous improvement process outlined in Section A.4.viii.e to
help eligible entities meet state long-term and interim targets and challenging academic
standards. In this process, a VT-AOE developed needed assessment, and federal accountability
data (including ELP data and the performance of ELs against statewide assessments and other
measures of academic performance described in this plan) will drive continuous improvement
planning. Equity gaps identified with the help of this data will result in the development of
action plan components supporting ELs. These plan components will be required to include
tangible goals, measures, and improvement strategies related to their identified problems of
practice.
The VT-AOE will support these efforts through some combination of monitoring, evaluation,
and the provision of technical assistance, with the specific supports varying from school to
school and LEA to LEA, in accordance with each educational systems’ needs. LEAs receiving
Comprehensive or Targeted Supports will garner greater support to meet their goals. However,
the VT-AOE will monitor the progress of all LEAs in meeting their goals.
3. Monitoring and Technical Assistance (ESEA section 3113(b)(8)): Describe:
i. How the SEA will monitor the progress of each eligible entity receiving a
Title III, Part A subgrant in helping English learners achieve English
proficiency; and
ii. The steps the SEA will take to further assist eligible entities if the
strategies funded under Title III, Part A are not effective, such as providing
technical assistance and modifying such strategies.
Click here to enter text.
Since accountability for English Learners’ performance on English language proficiency
assessments has shifted from Title III to Title I under ESSA, the VT-AOE is developing a more
integrated, collaborative approach to monitoring the progress of Title III subgrantees in helping
ELs achieve proficiency. Title III and Title I staff are working together to plan and better
coordinate protocols used to monitor LEAs’ progress, including:
Design of Consolidated Federal Program application as basis for review and approval of
grants
Use of State-level indicators for progress in achieving ELP and proficiency on academic
content assessments
Local collection and reporting of EL longitudinal student performance data as part of
continuous improvement
Desk audits and on-site program reviews of LEA Title III plans, implementation, and
evaluation of evidence-based strategies, LIEPs, and participation of ELs in academic
programs
88
As outlined in the continuous improvement section, the VT-AOE will monitor LEAs progress in
meeting their continuous improvement goals. Those LEAs not making progress or showing
improvement in targeted areas will receive tiered supports determined by their vicinity to their
goals. Those schools with greater needs will be eligible for greater supports. Schools not
meeting their goals for multiple years might be eligible for supports that include more
coordination with the VT-AOE in the construction of the continuous improvement plans, more
technical assistance in determining and enacting interventions, and more monitoring of an
LEAs success in meeting their goals. Tiered supports include technical assistance in conducting
needs assessments or developing continuous improvement plans and participation in
networked improvement communities with other schools in need of similar Targeted Supports.
When VT-AOE individual staff members and/or teams monitor and find evidence that Title III-
funded LEAs are not meeting long-term goals for ELs’ progress in achieving proficiency, they
will provide evidence-based, differentiated technical assistance, resources, and professional
learning opportunities based on a continuous improvement framework. The VT-AOE’s efforts
to better connect and coordinate the work of the teams that monitor, lead continuous
improvement planning, and provide technical assistance should ultimately lead to stronger
support for LEAs in improving language instruction educational programs and academic
outcomes for English Learners.
89
F. Title IV, Part A: Student Support and Academic Enrichment Grants 1. Use of Funds (ESEA section 4103(c)(2)(A)): Describe how the SEA will use funds
received under Title IV, Part A, Subpart 1 for State-level activities.
Click here to enter text.
Title IV provides states with funds for well-rounded educational opportunities. ESSA outlines
numerous permitted activities for the funds. The vast majority of the funds must be used for
allocations to SU/SDs; however, the state can reserve limited funds for monitoring, training, and
technical assistance with the grants. As these are an expansion of funds, this constitutes a
proposed change in practice.
Vermont is planning to use its limited state level funds for Title IV to support Supervisory
Union/Supervisory District Title IV Coordinators. The VT-AOE will reserve funds at the state
level to ensure there is support and appropriate allocation of local funds before engaging in
other statewide activities. These funds will be used to hire a full-time employee to monitor and
provide technical assistance to Supervisory Union/Supervisory Districts receiving Title IV, Part
A money through the formula grant, as well as institute an in-house advisory group of VT-AOE
staff whose work intersects with Title IV, Part A. This group of staff members will ensure that
school systems know the different agency and state level programs available to them to support
the goals of Title IV at the local level. Housing coordination with one individual streamlines
communication within the VT-AOE and creates transparency and confidence for Supervisory
Union/Supervisory Districts.
The Title IV, Part A coordinator will continue to engage with the consolidated federal programs
team and the Education Quality staff. This coordinator will have a greater focus on
Comprehensive School Supports allowing 21st Century Learning grants to provide wrap-around
services for those receiving schools, while augmenting existing implementation of
comprehensive improvement plans.
Title IV, Part A will be used to grant funds to schools eligible for Comprehensive Support in
accordance with their continuous improvement plans and in coordination with the Education
Quality team. The Title IV, Part A coordinator will continue working closely with the Education
Quality staff in order to ensure efficient use of funds at the SU/SD and school level.
Ninety-five percent of the funds must be used for allocations to LEAs; however, the state can
reserve one percent for administration and an additional 4% of the funds for state activities
including monitoring, training, and technical assistance. As these are an expansion of funds,
this constitutes a proposed change in practice for LEAs.
The Title IV, Part A coordinator will be a member of the Consolidated Federal Programs team
and work closely with the Education Quality staff. The funds will be part of the Consolidated
Federal Program application in order to make it easier to braid Title IV, Part A funds with the
other ESSA funds to achieve local and state goals.
90
2. Awarding Subgrants (ESEA section 4103(c)(2)(B)): Describe how the SEA will ensure
that awards made to LEAs under Title IV, Part A, Subpart 1 are in amounts that are
consistent with ESEA section 4105(a)(2).
Click here to enter text.
The VT-AOE has determined the Title IV, Part A funds will be distributed as a formula grant to
allow access to all LEAs seeking these funds. The VT-AOE’s Fiscal Team creates spreadsheets
with the allocation formulas built in for all formula grants. A preliminary spreadsheet with the
Title IV, Part A formula detailed in ESSA (section 4105) has been created and tested using a
sample allocation. The formula used includes the SEA portion for administration and state
activities and then follows section 4105 for allocations to each LEA (none receiving less than the
$10,000 minimum).
91
G. Title IV, Part B: 21st Century Community Learning Centers A. Use of Funds (ESEA section 4203(a)(2)): Describe how the SEA will use funds received under
the 21st Century Community Learning Centers program, including funds reserved for State-level
activities.
Click here to enter text.
Vermont’s Title IV part B program (21CCLC) is designed to align and support the state level
strategies for all students articulated in this state plan and in Vermont’s Education Quality
Standards. Funds are intentionally integrated into local level needs assessment planning,
continuous improvement activity, and school-wide strategies. Program access and design in
funded programs include services that support the state, school, and community goals for
youth including those designated as migrant, homeschooled, homeless, those in Title I
caseloads, and English Language Learners including meaningful and equitable consultation for
private school students in individually funded communities.
At the Vermont Agency of Education, the Title IV part B 21CCLC program is part of team
focused on personalized learning and flexible pathways and works with program managers
across the Agency including, but not limited to, School Improvement, Title I, Title IIA, Title II,
Title III, Title IV Part A, Special Education, and the fiscal monitoring team. Regular
communication and collaboration occurs among these state programs which results in strategic
and programmatic cohesion around planning, goals, technical assistance, and professional
development. Systemic inter-agency collaborative strategies achieved that support state goals
include:
Significant annual use of Title I funds for academic tutoring and academic afterschool
and summer programming
Use of federal child nutrition programs in all funded sites, including snack and meal
programs
Use of the PBIS and other evidence based behavior systems in afterschool programs
Aligned monitoring and cross team membership on site-visit teams
Supporting technical assistance around inclusion (there is parity for percentages of
afterschool regular attendees on an IEP)
Funding integration and RFP alignment around personalization, proficiency based
learning, and the Vermont Educator Quality Standards
Fiscal and programmatic monitoring alignment to support compliance and healthy
financial structures at the 21c grantee level
The 21CCLC program will continuously improve each year in its efforts to support all students
in communities where funds are awarded. Based on a system and evaluation design created
around principles of access, equity, and quality, in particular for communities with the most
need, current 21CCLC systems’ components will improve learning from the last thirteen years
of operation. The items below all support state goals and at the same time are targeted to the
particular needs of Title IV part B funds:
92
The current statewide evaluation plan has four major goal areas, fifteen indicators, and
fifty-one measures that are tracked. This plan drives all activity and action and is used
for continuous improvement and as a driver for change system-wide. Grantees may
adopt the statewide plan and merge it with locally designed evaluation activities.
Statewide Evaluation will be improved to continually assess not only baseline program,
academic and social indicators tied to need, but over time may embed emerging
indicators related to items including personalization, transferable skills, and proficiency
based models when these systems come to fuller fruition in Vermont, in particular for
youth in secondary schools that receive 21c funding.
Technical Assistance and Professional Development systems will continue to support
the evaluation areas as well, with an on-going analysis if more expansive readiness and
support activities are needed for identified stages of program development. The
program’s current practice of focusing resources on supporting quality and effective
leadership at the project and site level will guide action with considerations analyzed for
investments in more intensive, embedded and sustained methodologies.
Vermont’s robust monitoring, and reporting system will be continued and enhanced
annually. Multiple monitoring activities will occur during the performance period for
each grantee, based on a risk assessment of need, and covering a broad spectrum of
inquiry. The current process is intentionally aligned to the statewide evaluation plan
components and additional legal requirements covering nineteen areas, (e.g. evaluation,
safety, facilities, programming, staffing, sustainability and budgeting). State follow-up
occurs and is documented until all defined areas of concern are addressed. Annual
reporting and tracking follows a similar design and framework.
Administrative and statewide activity funds will be allocated and used for the activities above
as allowable by statute.
B. Awarding Subgrants (ESEA section 4203(a)(4)): Describe the procedures and criteria the SEA
will use for reviewing applications and awarding 21st Century Community Learning Centers
funds to eligible entities on a competitive basis, which shall include procedures and criteria that
take into consideration the likelihood that a proposed community learning center will help
participating students meet the challenging State academic standards and any local academic
standards.
The 21st Century Community Learning Center program annually or semi-annually releases
applications six months prior to the applicant due date. The grant application is produced and
reviewed annually including where statewide goals are articulated as well as addressing all of
the areas required within the 21st Century Community Learning Center program statute. Awards
are awarded for 5 years for no less than $50,000 provided that funds are available and
performance objectives met. The applicant ‘bidder’ meetings and the technical assistance period
starts four months before the due date. The consistency with system level expectations noted
above is intentionally embedded in the meetings, technical assistance, and resources for both
93
applicants and panelists. A letter of intent is due three months before the due date. After the
applications are received, a team of independent panelists are trained, who then independently
review the applications and provide scores and comments, which at the end of the process are
shared with all applicants. This panel may consist of individuals with diverse expertise including
educational and non-educational organizations, experts in non-profit management, including
principals, retired 21st Century directors, site coordinators, private-sector individuals involved in
education, and state agency personnel with relevant experience. Conditions for funding and
scores are fully documented.
Panelist responsibilities include:
Participation in a panelist training to understand roles, expectations, and rules
Reading, scoring, and commenting on individual applications
Participation in face to face full panel day(s) to make final applicant decisions
Making decisions on whether to fund, fund with conditions, or do not fund applications
Setting conditions for funding
Providing process feedback to the Agency of Education
Eligibility will guide initial priority as articulated in the Title IV Part B legislation in section
4203(a) (3). Competitive priority will include but not be limited to indicators of need including
high poverty and will compliment but not duplicate the indicators used to determine
comprehensive and targeted schools. Regular and on-going objective assessments of the
application process will take place to ascertain if substantial progress towards state goals is being
met and if any adaptations need to be made. The application process as a whole is designed to
assure that grantees can meet and be held accountable to both local and statewide goals.
94
H. Title V, Part B, Subpart 2: Rural and Low-Income School Program a. Outcomes and Objectives (ESEA section 5223(b)(1)): Provide information on program
objectives and outcomes for activities under Title V, Part B, Subpart 2, including how the
SEA will use funds to help all students meet the challenging State academic standards.
Click here to enter text.
Vermont will use the Rural and Low-Income School Program grants to assist rural districts in
meeting the goals of increased student academic achievement and to reduce the achievement
gap. The eligible districts will be encouraged to braid the RLIS funds with other ESEA funds to
address the needs identified through their comprehensive needs assessment. Each application
will be granted and monitored based on the range of allowable activities and the extent that the
activity is likely to meet the identified needs and meet the stated goals.
b. Technical Assistance (ESEA section 5223(b)(3)): Describe how the SEA will provide
technical assistance to eligible LEAs to help such agencies implement the activities
described in ESEA section 5222.
Click here to enter text.
Once the list of eligible districts is identified, the VT-AOE will provide a training—in person or
by webinar—to those districts. This program is new to Vermont in the 2017-18 school year and,
as such, the districts will be unfamiliar with the allowable uses, how to effectively braid the
funds with other sources, and reporting requirements. The VT-AOE will work with the eligible
districts on their application and then provide ongoing technical assistance throughout the year.
The Title V Coordinator is part of the Agency’s Consolidated Federal Programs team, allowing
full access to the expertise of the team regarding use of funds. The coordinator will use that
expertise to train the eligible districts.
95
I. Education for Homeless Children and Youth program, McKinney-
Vento Homeless Assistance Act, Title VII, Subtitle B a. Student Identification (722(g)(1)(B) of the McKinney-Vento Act): Describe the
procedures the SEA will use to identify homeless children and youth in the State and to
assess their needs.
Click here to enter text.
Title IX outlines the supports Vermont is responsible to meet to support children and youth
experiencing homelessness. Consistent with Vermont’s overall commitment to equity for all
students, Vermont takes meeting this responsibility seriously. Essential to this process is
collaboration with other agencies supporting Vermont’s homeless population.
McKinney-Vento exists to ensure school entrance and supports for students experiencing
homelessness. SU/SD-level liaisons receive training in identification of students potentially
experiencing homelessness.
Under the Vermont process, each SU/SD must name a Homeless Liaison in the SU/SD’s
Consolidated Federal Program application. Once identified, the liaison participates in trainings
that are staggered throughout the year (in person and via the National Association for the
Education of Homeless Children and Youth’s (NCHE) webinars). These trainings are intended
to assist Homeless Liaisons in understanding the McKinney-Vento definition of homelessness
and how to assess students’ needs. There are numerous ways in which children who are
experiencing homelessness can be identified in Vermont. The redundancies are intentional to
minimize the chances that students would be missed. Identification strategies include:
Homeless families and unaccompanied youth self-identify as homeless to school staff.
Schools identify potential homeless families through their registration process and make
a referral to the SU/SD’s Homeless Liaison.
Teachers, counselors, after-school providers, school nutrition, and other school staff
identify potential homeless families and unaccompanied youth and make a referral to
the SU/SD’s Homeless Liaison.
Community partners (housing providers, social service agencies, pediatricians, faith-
based organizations, etc.) refer homeless families and unaccompanied youth to the
SU/SD’s Homeless Liaison.
Liaisons post informational posters in places where homeless families and
unaccompanied youth will likely see them. The posters include the Homeless Liaison’s
contact information.
Once a student is identified and is enrolled in school, a needs assessment closely follows.
Parents/guardians and unaccompanied youth are informed of supports available to them under
McKinney-Vento and school staff assess academic and social/emotional needs and arrange
additional supports for students when needed. Homeless liaisons identify individual student
needs to determine the services the SU/SD will provide to homeless students. Those identified
services are then used to create investments in the CFP application. b. Dispute Resolution (722(g)(1)(C) of the McKinney-Vento Act): Describe procedures for
the prompt resolution of disputes regarding the educational placement of homeless
96
children and youth.
Click here to enter text.
The VT-AOE has established an SU/SD-level dispute resolution process so all SU/SDs are
consistent and timely with their response to disputes. The process begins with the State Director
informing and training SU/SD Homeless Liaisons of their responsibility to inform homeless
families and unaccompanied youth of their right to appeal decisions related to eligibility and
school placement.
Students and their families are given information regarding their rights based on their homeless
status. The State Director’s contact information is given to parents/guardians and
unaccompanied youth; they are encouraged to call if they have questions or concerns about the
dispute process. If the family or unaccompanied youth is not satisfied with the outcome of the
SU/SD-level dispute process, they can make an appeal to the VT-AOE. In the event of an appeal,
the VT-AOE employs an established appeal procedure that clearly defines the process and
timelines for each step. See Appendix E for a more detailed discussion of the appeals process.
The State Director, the Vermont Secretary of Education or designee, and the VT-AOE legal staff
work as a team to resolve McKinney-Vento disputes in a timely manner.
Homeless families and unaccompanied youth are enrolled (or stay enrolled) in the school where
placement is desired and provided the services they are entitled to under the McKinney-Vento
Act until the dispute process on the SU/SD or VT-AOE (if applicable) level is complete.
c. Support for School Personnel (722(g)(1)(D) of the McKinney-Vento Act): Describe
programs for school personnel (including the LEA liaisons for homeless children and
youth, principals and other school leaders, attendance officers, teachers, enrollment
personnel, and specialized instructional support personnel) to heighten the awareness of
such school personnel of the specific needs of homeless children and youth, including
runaway and homeless children and youth.
Click here to enter text.
In addition to the regular trainings referenced above, there are several additional supports
available to SU/SD homeless liaisons. Liaisons have both the responsibility to work with the
homeless population in the SU/SD and to work with other educators to create a supportive
environment where students experiencing homelessness have access to a high quality
education.
Homeless liaisons regularly receive technical assistance from the State Director of
Homeless Education via email and phone.
Homeless liaisons can access the National Center for Homeless Education (NCHE)
helpline if there is an immediate need for technical assistance and the State Director is
not available.
The VT-AOE maintains a listserv for the SU/SD Homeless Liaisons and the State
Director sends out reminders and resources on a regular basis.
o The State Director provides targeted technical assistance during the McKinney-
Vento grantee and Consolidated Federal Programs monitoring processes.
97
o The State Director notifies the SU/SD Homeless Liaisons of the requirement to
train school staff, especially registrars, on the McKinney-Vento Act, and ensures
SU/SD Homeless Liaisons have the resources they need to do so.
o The VT-AOE offers in-person training to the SU/SD Homeless Liaisons at least
once a year (more if time and resources allow). Topics are chosen by the liaisons
based on perceived need.
o All SU/SD Homeless Liaisons are trained in the process to direct certify students
experiencing homelessness for programs covered under the Child Nutrition Act.
o The State Director and SU/SD Homeless Liaisons participate in the NCHE
webinars and other state and local training opportunities focused on supporting
homeless children and youth. Liaisons also use these webinars and other NCHE
resources when they train school staff.
o The State Director encourages the Homeless Liaisons to attend the NCHE’s
annual conference and provides technical assistance on the sources of funds that
may be used to attend.
In addition to those supports provided to the homeless liaisons, SU/SD Title I coordinators also
have access to trainings offered by the State Director on the homeless education set-aside
requirement.
It is an absolute requirement in the CFP application to set aside Title I funds for the needs of
homeless students. An application will not be approved without at least a minimum set-aside.
The CFP application includes a set of McKinney-Vento assurances for SU/SDs and participating
schools that they agree to upon submission of the application.
d. Access to Services (722(g)(1)(F) of the McKinney-Vento Act): Describe procedures that
ensure that:
i. Homeless children have access to public preschool programs, administered by
the SEA or LEA, as provided to other children in the State;
ii. Homeless youth and youth separated from public schools are identified and
accorded equal access to appropriate secondary education and support services,
including by identifying and removing barriers that prevent youth described in
this clause from receiving appropriate credit for full or partial coursework
satisfactorily completed while attending a prior school, in accordance with State,
local, and school policies; and
iii. Homeless children and youth who meet the relevant eligibility criteria do not face
barriers to accessing academic and extracurricular activities, including magnet
school, summer school, career and technical education, advanced placement,
online learning, and charter school programs, if such programs are available at
the State and local levels.
Click here to enter text.
By State law, Vermont’s public education system includes universal preschool for all 3 and 4
year olds and 5 year olds not yet enrolled in kindergarten. If a family loses their housing, the
homeless liaison follows the same process for preschool students as they would for K-12
students. Preschool students are immediately enrolled in the school determined to be in their
98
best interest to attend and SU/SD Homeless Liaisons ensure that preschool students have access
to the supports they are entitled to under McKinney-Vento. The VT-AOE will provide technical
assistance on how best to serve homeless preschoolers.
The SU/SD Homeless Liaison and appropriate school staff have the responsibility to ensure
homeless students have equal access to academic programs and extracurricular activities by
assessing and then addressing the individual student’s needs. They work closely with other
federally funded programs like Title I, 21st Century, and locally supported academic and
extracurricular program staff to enroll homeless students. If extracurricular activities include
fee, uniform, or other requirements, the Homeless Liaison or designated staff person ensures
the student has access to financial and other supports needed to meet the
enrollment/registration requirements. Often community programs provide students the
supports they require for full participation and to remove barriers.
The SU/SD Homeless Liaisons also work closely with the school nutrition staff to ensure that
homeless students have access to free meals upon enrollment. Homeless students are
automatically eligible (directly certified) for free meals and are not required to complete
paperwork or produce income documentation. Some schools are food pantry satellite locations
and will ensure homeless students and their families have access to food to take home with
them. The State Director works closely with the VT-AOE child nutrition staff to ensure the
programs they coordinate are aware of this entitlement.
Secondary youth experiencing homelessness are identified in the same manner as described
above; however, for youth separated from the public school system there are additional
considerations in the identification process, including:
● The VT-AOE actively partners with statewide community organizations serving
youth experiencing or at risk of experiencing homelessness. These include the Runaway
and Homeless Youth Act and the U.S. Department of Housing and Urban Development
funded programs. Other statewide partners include the Vermont Department of
Children and Families, Vermont Coalition to End Homelessness, the Vermont Migrant
Education Program, and the Vermont Network against Domestic and Sexual Violence.
● The State Director ensures that SU/SD Homeless Liaisons are familiar with
locally affiliated programs.
● The SU/SD Homeless Liaisons partner with the locally affiliated programs
mentioned above and other local programs: pediatricians, law enforcement, faith-based
organizations and food shelves, and other programs serving children and youth who
may be disenfranchised from school. These local social service programs encourage
youth to re-enroll in school and the Homeless Liaisons make sure they have the support
they need to attend and participate in school.
The SU/SD Homeless Liaison works closely with the appropriate school system staff to make
sure secondary students experiencing homelessness have equal access to education and support
services. They support each student individually to meet their unique needs and make sure
there are no barriers to full participation in school, credit accrual, or graduation. If needed, Title
99
I set-aside funds are used to remove barriers. For homeless students who have been enrolled in
multiple high schools, tracking credit accumulation can be a major impediment to graduation.
As outlined in Vermont’s Education Quality Standards and supported by Act 77, Vermont high
schools have moved toward a proficiency model for high school graduation. Students in schools
need to demonstrate proficiency in order to complete individual classes and, ultimately, earn a
diploma. As such, schools do not issue Carnegie credits and the accumulation of such credits do
not lead to graduation; instead, schools acknowledge the proficiencies a student has
demonstrated at previous schools in the accumulation of proficiencies leading to graduation.
Ultimately, the school granting the diploma determines that a student has met sufficient
proficiencies for graduation.
e. Strategies to Address Other Problems (722(g)(1)(H) of the McKinney-Vento Act): Provide
strategies to address other problems with respect to the education of homeless children
and youth, including problems resulting from enrollment delays that are caused by—
i. requirements of immunization and other required health records;
ii. residency requirements;
iii. lack of birth certificates, school records, or other documentation;
iv. guardianship issues; or
v. uniform or dress code requirements.
Click here to enter text.
The policy in Vermont is that students will be enrolled immediately. After enrollment, the LEA
Homeless Liaison and/or the school social worker or registrar will work with the family on
obtaining enrollment requirements/documents. They are empowered to take the steps
necessary to ensure a student experiencing homelessness receives the support necessary to fully
participate in school. When needed, technical assistance is available from the VT-AOE.
f. Policies to Remove Barriers (722(g)(1)(I) of the McKinney-Vento Act): Demonstrate that
the SEA and LEAs in the State have developed, and shall review and revise, policies to
remove barriers to the identification of homeless children and youth, and the enrollment
and retention of homeless children and youth in schools in the State, including barriers to
enrollment and retention due to outstanding fees or fines, or absences.
Click here to enter text.
It is the State’s priority to ensure that homeless children and youth are enrolled in school
immediately and that enrollment delays are minimized. To achieve this goal, the VT-AOE
assists SU/SD Homeless Liaisons. Homeless Liaisons are proactive and try to reduce the number
of problems by ensuring staff are regularly trained on McKinney-Vento requirements. Most
schools provide registration materials that include housing questions that cue the registrars and
school secretaries that the family or unaccompanied youth is experiencing homelessness. If the
family or unaccompanied youth indicates on the paperwork or verbally that they may be
homeless, the registrar immediately enrolls the family and makes a referral to the Homeless
Liaison. The VT-AOE works closely with the State Department for Children and Families (DCF).
If DCF suspects that a family is homeless and not attending school, they will notify the SU/SD
Homeless Liaison or the State Director and the family will be contacted.
100
When problems arise, the Homeless Liaison works quickly to resolve them. If there is an issue
of enrollment, the liaison works with the school administrator and registrar to enroll the student
as quickly as possible. If transportation is an issue, the Homeless Liaison works with the
previous SU/SD attended to ensure that transportation or the cost of transportation is not as
barrier to school attendance. If homeless families or unaccompanied youth lack typical
enrollment documentation requirements such as health records, guardianship paperwork, birth
certificates, and other required documents, the Homeless Liaison or other designated staff
determine what is absolutely necessary and works with the family or unaccompanied youth to
help obtain them. These activities occur after the student is enrolled and attending school. If the
family or unaccompanied youth need financial support to obtain the required documents,
school staff work with the Title I Coordinator or use other funding to help pay those fees.
If a homeless child or youth needs academic support, they are enrolled in Title I or other
academic supports including afterschool and summer programming. If social-emotional
support is needed, the school counselor and/or nurse is connected to work with the student.
Homeless Liaisons and other key staff check in regularly on homeless students and touch base
with teachers and families about supports needed to attend and participate in school. Supports
may include transportation, school supplies, tutoring, afterschool programming, credit accrual
support, and social services referrals. If a student disengages with the school, the Homeless
Liaison and school staff contact the family or unaccompanied youth to offer supports to get the
student back in school. School staff also partner with community organizations who provide the
supports the family or unaccompanied youth might need reengage in school.
g. Assistance from Counselors (722(g)(1)(K)): A description of how youths described in
section 725(2) will receive assistance from counselors to advise such youths, and
prepare and improve the readiness of such youths for college. Click here to enter text.
Secondary youth that are McKinney-Vento eligible work with school guidance counselors on
post-secondary options – including college. Whenever possible, students will be enrolled in
college readiness programs like Gear-Up and Talent Search.
101
Appendix A: Measurements of interim progress
Instructions: Each SEA must include the measurements of interim progress toward meeting the long-term
goals for academic achievement, graduation rates, and English language proficiency, set forth in the
State’s response to Title I, Part A question 4.iii, for all students and separately for each subgroup of
students, including those listed in response to question 4.i.a. of this document. For academic achievement
and graduation rates, the State’s measurements of interim progress must take into account the
improvement necessary on such measures to make significant progress in closing statewide proficiency
and graduation rate gaps.
Interim Targets Overview ESSA requires that states establish interim targets for each measure. Interim targets are set
locally and at the state level in a staged approach. First, the state establishes a statewide interim
target in relation to the accountability cycles we have established for the Comprehensive
Support cycles. This state-wide target is designed to track our performance towards the long-
term goal and to hold ourselves responsible for making strategic efforts today. The process for
setting the interim target for each measure and student group is the same:
1. Calculate the difference between current school performance and the long-term target
2. Divide the difference by the number of accountability cycles remaining until the goal
needs to be met.
3. Establish the school’s next interim target by adding the value of #2 to the value of the
school’s current performance.
A. Academic Achievement

102
Table 38: ELA Performance Charts for Student Groups
Accountability
Question
Grade
Current
Performance
(2016)
Long term Goal
Mid Point of Proficient
Scale
Interim Targets
2019
1
2022
2
2025
3
How well are
students
performing in
ELA/ reading
in 3rd-9th
grade?
SCALE
All Students
3rd 2438 2460 2445 2453 2460
4th 2477 2502 2485 2494 2502
5th 2515 2541 2524 2532 2541
6th 2539 2574 2551 2562 2574
7th 2562 2600 2575 2587 2600
8th 2580 2617 2592 2605 2617
9th TBD
American Indian or Alaskan Native
3rd 2415 2460 2430 2445 2460
4th 2432 2502 2455 2479 2502
5th 2496 2541 2511 2526 2541
6th 2526 2574 2542 2558 2574
7th 2530 2600 2553 2577 2600
8th 2535 2617 2562 2590 2617
9th TBD
Asian
3rd 2453 2460 2455 2458 2460
4th 2496 2502 2498 2500 2502
5th 2528 2541 2532 2537 2541
6th 2553 2574 2560 2567 2574
7th 2577 2600 2585 2592 2600
8th 2597 2617 2604 2610 2617
9th TBD
African-American
3rd 2407 2460 2425 2442 2460
4th 2445 2502 2464 2483 2502
5th 2475 2541 2497 2519 2541
6th 2495 2574 2521 2548 2574
7th 2512 2600 2541 2571 2600
8th 2545 2617 2569 2593 2617
9th TBD
Hispanic
3rd 2425 2460 2437 2448 2460
4th 2456 2502 2471 2487 2502
5th 2510 2541 2520 2531 2541
6th 2548 2574 2557 2565 2574
7th 2548 2600 2565 2583 2600
8th 2596 2617 2603 2610 2617
9th TBD
Native Hawaiian or Pacific Islander
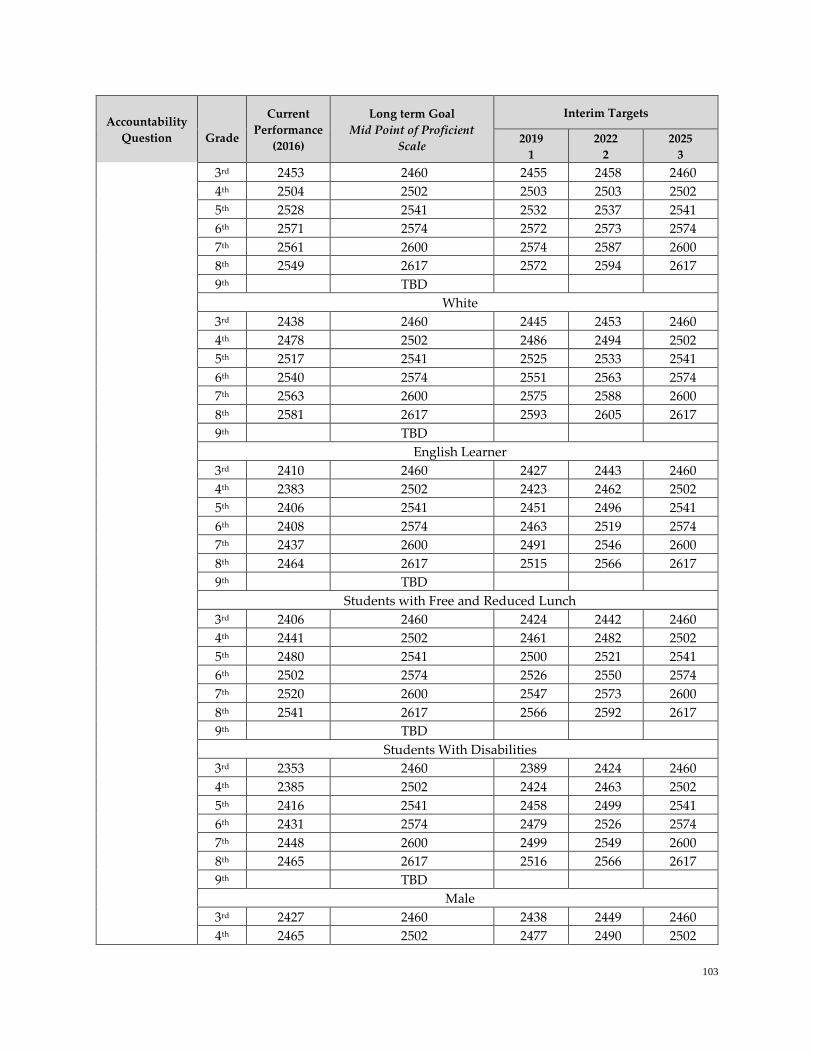
103
Accountability
Question
Grade
Current
Performance
(2016)
Long term Goal
Mid Point of Proficient
Scale
Interim Targets
2019
1
2022
2
2025
3
3rd 2453 2460 2455 2458 2460
4th 2504 2502 2503 2503 2502
5th 2528 2541 2532 2537 2541
6th 2571 2574 2572 2573 2574
7th 2561 2600 2574 2587 2600
8th 2549 2617 2572 2594 2617
9th TBD
White
3rd 2438 2460 2445 2453 2460
4th 2478 2502 2486 2494 2502
5th 2517 2541 2525 2533 2541
6th 2540 2574 2551 2563 2574
7th 2563 2600 2575 2588 2600
8th 2581 2617 2593 2605 2617
9th TBD
English Learner
3rd 2410 2460 2427 2443 2460
4th 2383 2502 2423 2462 2502
5th 2406 2541 2451 2496 2541
6th 2408 2574 2463 2519 2574
7th 2437 2600 2491 2546 2600
8th 2464 2617 2515 2566 2617
9th TBD
Students with Free and Reduced Lunch
3rd 2406 2460 2424 2442 2460
4th 2441 2502 2461 2482 2502
5th 2480 2541 2500 2521 2541
6th 2502 2574 2526 2550 2574
7th 2520 2600 2547 2573 2600
8th 2541 2617 2566 2592 2617
9th TBD
Students With Disabilities
3rd 2353 2460 2389 2424 2460
4th 2385 2502 2424 2463 2502
5th 2416 2541 2458 2499 2541
6th 2431 2574 2479 2526 2574
7th 2448 2600 2499 2549 2600
8th 2465 2617 2516 2566 2617
9th TBD
Male
3rd 2427 2460 2438 2449 2460
4th 2465 2502 2477 2490 2502
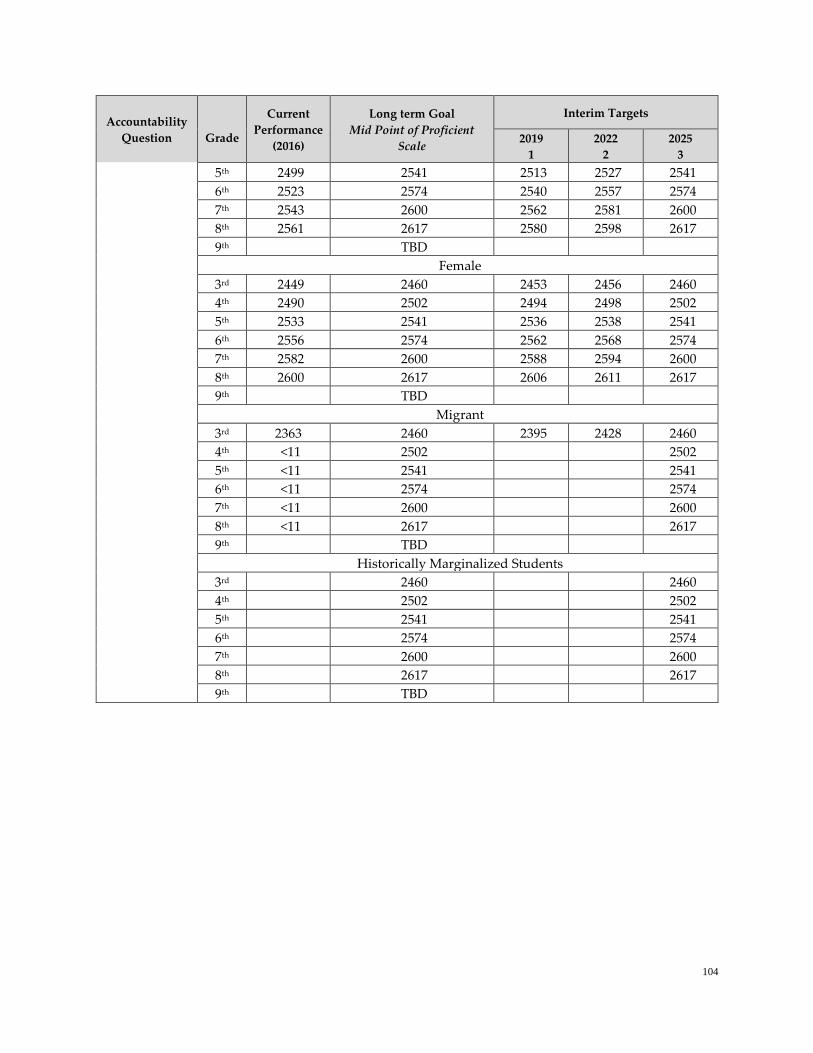
104
Accountability
Question
Grade
Current
Performance
(2016)
Long term Goal
Mid Point of Proficient
Scale
Interim Targets
2019
1
2022
2
2025
3
5th 2499 2541 2513 2527 2541
6th 2523 2574 2540 2557 2574
7th 2543 2600 2562 2581 2600
8th 2561 2617 2580 2598 2617
9th TBD
Female
3rd 2449 2460 2453 2456 2460
4th 2490 2502 2494 2498 2502
5th 2533 2541 2536 2538 2541
6th 2556 2574 2562 2568 2574
7th 2582 2600 2588 2594 2600
8th 2600 2617 2606 2611 2617
9th TBD
Migrant
3rd 2363 2460 2395 2428 2460
4th <11 2502 2502
5th <11 2541 2541
6th <11 2574 2574
7th <11 2600 2600
8th <11 2617 2617
9th TBD
Historically Marginalized Students
3rd 2460 2460
4th 2502 2502
5th 2541 2541
6th 2574 2574
7th 2600 2600
8th 2617 2617
9th TBD
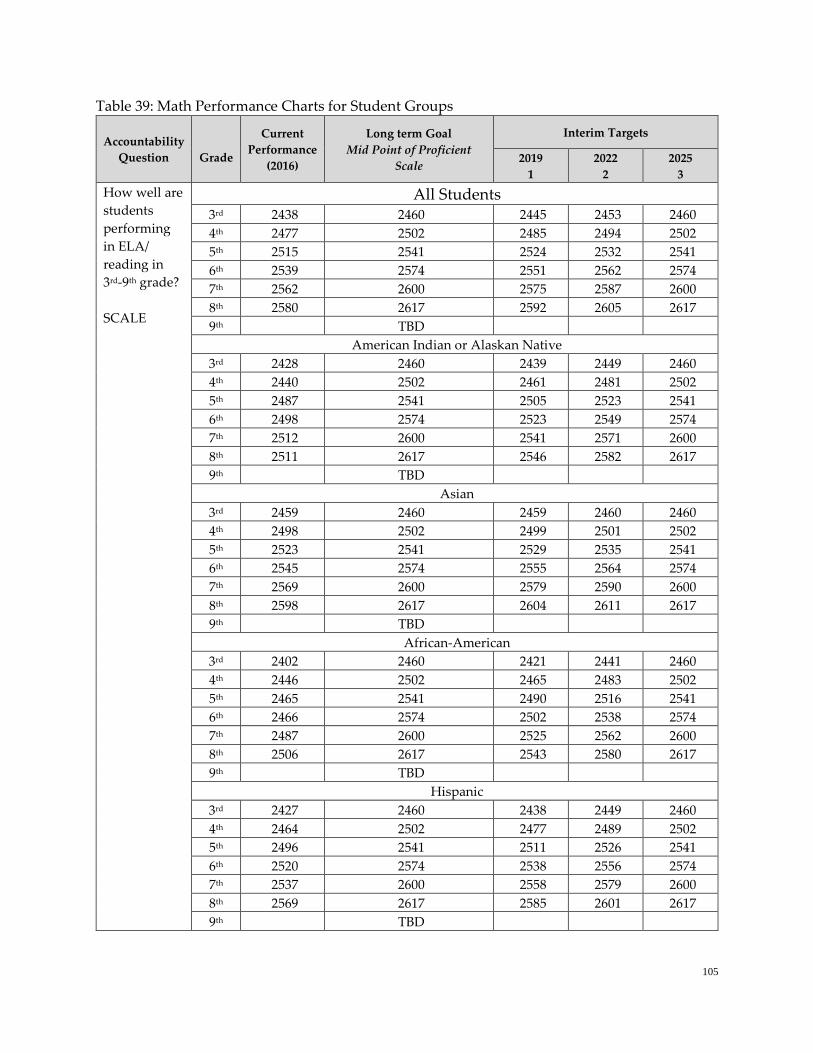
105
Table 39: Math Performance Charts for Student Groups
Accountability
Question
Grade
Current
Performance
(2016)
Long term Goal
Mid Point of Proficient
Scale
Interim Targets
2019
1
2022
2
2025
3
How well are
students
performing
in ELA/
reading in
3rd-9th grade?
SCALE
All Students 3rd 2438 2460 2445 2453 2460
4th 2477 2502 2485 2494 2502
5th 2515 2541 2524 2532 2541
6th 2539 2574 2551 2562 2574
7th 2562 2600 2575 2587 2600
8th 2580 2617 2592 2605 2617
9th TBD
American Indian or Alaskan Native
3rd 2428 2460 2439 2449 2460
4th 2440 2502 2461 2481 2502
5th 2487 2541 2505 2523 2541
6th 2498 2574 2523 2549 2574
7th 2512 2600 2541 2571 2600
8th 2511 2617 2546 2582 2617
9th TBD
Asian
3rd 2459 2460 2459 2460 2460
4th 2498 2502 2499 2501 2502
5th 2523 2541 2529 2535 2541
6th 2545 2574 2555 2564 2574
7th 2569 2600 2579 2590 2600
8th 2598 2617 2604 2611 2617
9th TBD
African-American
3rd 2402 2460 2421 2441 2460
4th 2446 2502 2465 2483 2502
5th 2465 2541 2490 2516 2541
6th 2466 2574 2502 2538 2574
7th 2487 2600 2525 2562 2600
8th 2506 2617 2543 2580 2617
9th TBD
Hispanic
3rd 2427 2460 2438 2449 2460
4th 2464 2502 2477 2489 2502
5th 2496 2541 2511 2526 2541
6th 2520 2574 2538 2556 2574
7th 2537 2600 2558 2579 2600
8th 2569 2617 2585 2601 2617
9th TBD
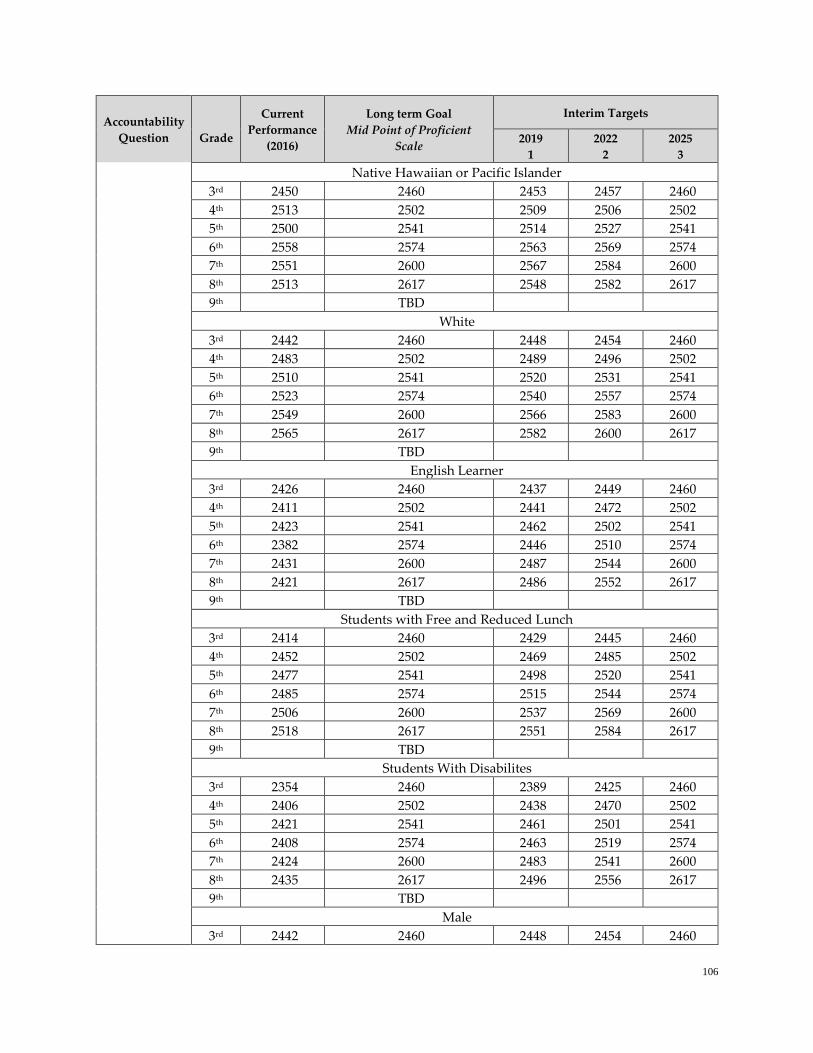
106
Accountability
Question
Grade
Current
Performance
(2016)
Long term Goal
Mid Point of Proficient
Scale
Interim Targets
2019
1
2022
2
2025
3
Native Hawaiian or Pacific Islander
3rd 2450 2460 2453 2457 2460
4th 2513 2502 2509 2506 2502
5th 2500 2541 2514 2527 2541
6th 2558 2574 2563 2569 2574
7th 2551 2600 2567 2584 2600
8th 2513 2617 2548 2582 2617
9th TBD
White
3rd 2442 2460 2448 2454 2460
4th 2483 2502 2489 2496 2502
5th 2510 2541 2520 2531 2541
6th 2523 2574 2540 2557 2574
7th 2549 2600 2566 2583 2600
8th 2565 2617 2582 2600 2617
9th TBD
English Learner
3rd 2426 2460 2437 2449 2460
4th 2411 2502 2441 2472 2502
5th 2423 2541 2462 2502 2541
6th 2382 2574 2446 2510 2574
7th 2431 2600 2487 2544 2600
8th 2421 2617 2486 2552 2617
9th TBD
Students with Free and Reduced Lunch
3rd 2414 2460 2429 2445 2460
4th 2452 2502 2469 2485 2502
5th 2477 2541 2498 2520 2541
6th 2485 2574 2515 2544 2574
7th 2506 2600 2537 2569 2600
8th 2518 2617 2551 2584 2617
9th TBD
Students With Disabilites
3rd 2354 2460 2389 2425 2460
4th 2406 2502 2438 2470 2502
5th 2421 2541 2461 2501 2541
6th 2408 2574 2463 2519 2574
7th 2424 2600 2483 2541 2600
8th 2435 2617 2496 2556 2617
9th TBD
Male
3rd 2442 2460 2448 2454 2460
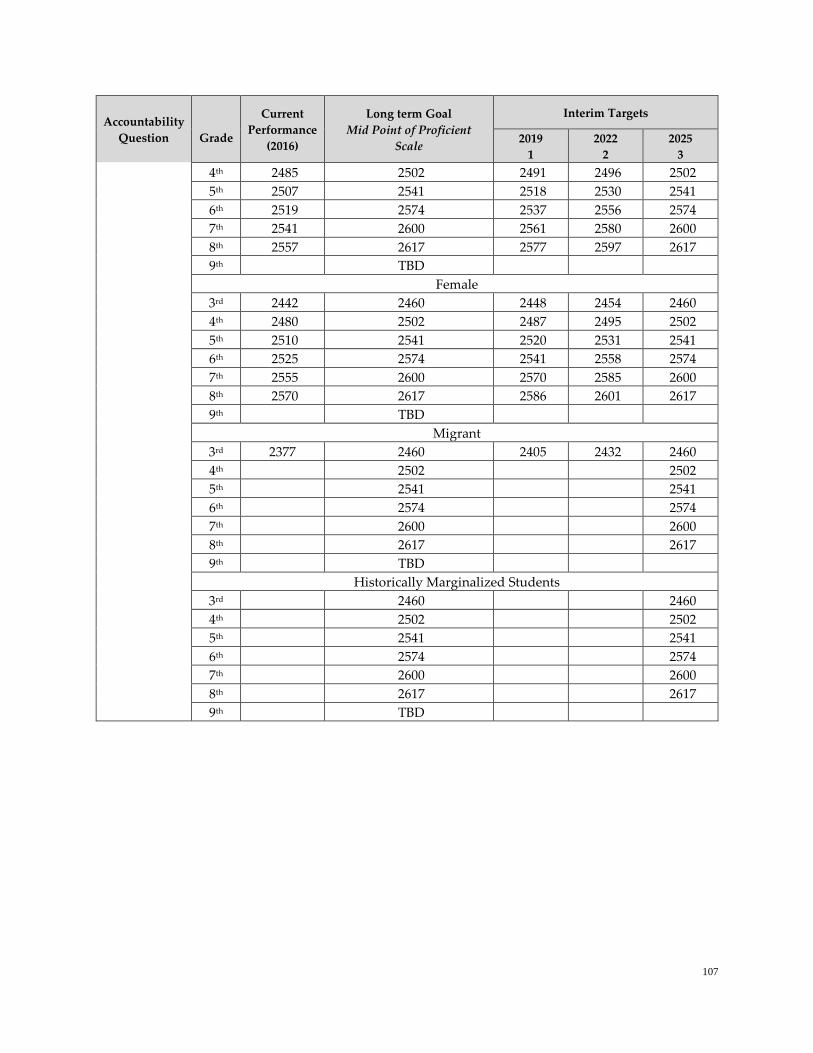
107
Accountability
Question
Grade
Current
Performance
(2016)
Long term Goal
Mid Point of Proficient
Scale
Interim Targets
2019
1
2022
2
2025
3
4th 2485 2502 2491 2496 2502
5th 2507 2541 2518 2530 2541
6th 2519 2574 2537 2556 2574
7th 2541 2600 2561 2580 2600
8th 2557 2617 2577 2597 2617
9th TBD
Female
3rd 2442 2460 2448 2454 2460
4th 2480 2502 2487 2495 2502
5th 2510 2541 2520 2531 2541
6th 2525 2574 2541 2558 2574
7th 2555 2600 2570 2585 2600
8th 2570 2617 2586 2601 2617
9th TBD
Migrant
3rd 2377 2460 2405 2432 2460
4th 2502 2502
5th 2541 2541
6th 2574 2574
7th 2600 2600
8th 2617 2617
9th TBD
Historically Marginalized Students
3rd 2460 2460
4th 2502 2502
5th 2541 2541
6th 2574 2574
7th 2600 2600
8th 2617 2617
9th TBD
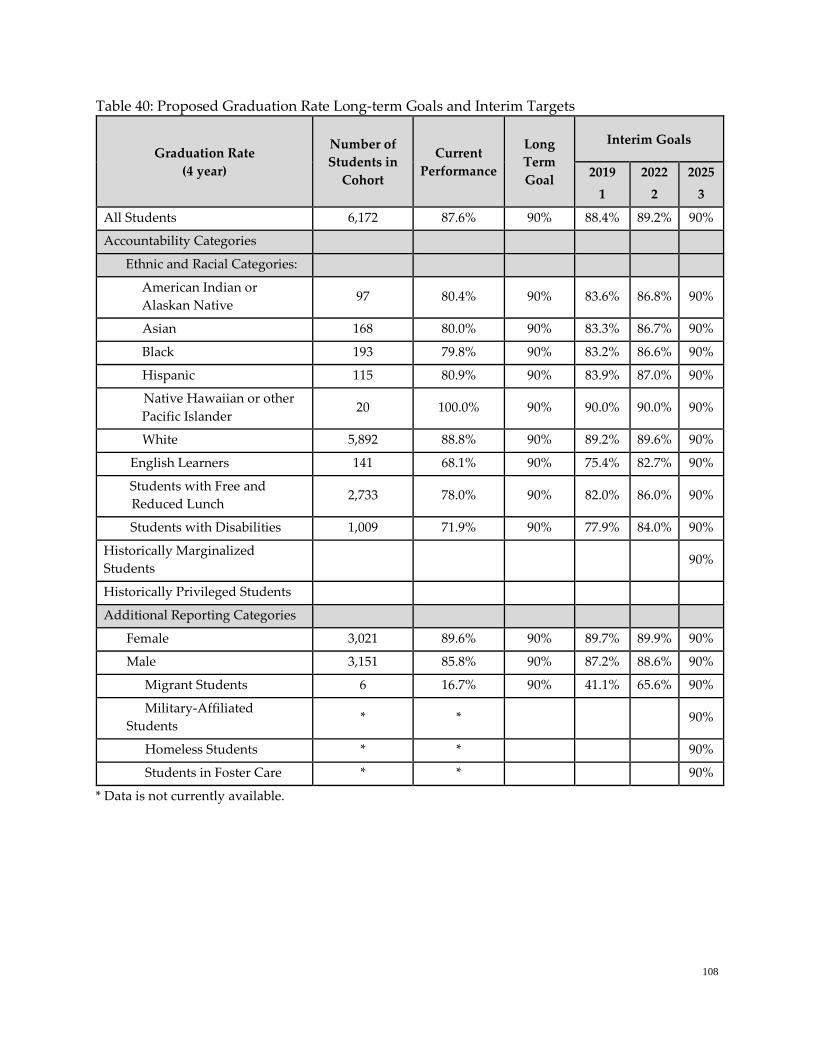
108
Table 40: Proposed Graduation Rate Long-term Goals and Interim Targets
Graduation Rate
(4 year)
Number of
Students in
Cohort
Current
Performance
Long
Term
Goal
Interim Goals
2019
1
2022
2
2025
3
All Students 6,172 87.6% 90% 88.4% 89.2% 90%
Accountability Categories
Ethnic and Racial Categories:
American Indian or
Alaskan Native 97 80.4% 90% 83.6% 86.8% 90%
Asian 168 80.0% 90% 83.3% 86.7% 90%
Black 193 79.8% 90% 83.2% 86.6% 90%
Hispanic 115 80.9% 90% 83.9% 87.0% 90%
Native Hawaiian or other
Pacific Islander 20 100.0% 90% 90.0% 90.0% 90%
White 5,892 88.8% 90% 89.2% 89.6% 90%
English Learners 141 68.1% 90% 75.4% 82.7% 90%
Students with Free and
Reduced Lunch 2,733 78.0% 90% 82.0% 86.0% 90%
Students with Disabilities 1,009 71.9% 90% 77.9% 84.0% 90%
Historically Marginalized
Students 90%
Historically Privileged Students
Additional Reporting Categories
Female 3,021 89.6% 90% 89.7% 89.9% 90%
Male 3,151 85.8% 90% 87.2% 88.6% 90%
Migrant Students 6 16.7% 90% 41.1% 65.6% 90%
Military-Affiliated
Students * * 90%
Homeless Students * * 90%
Students in Foster Care * * 90%
* Data is not currently available.
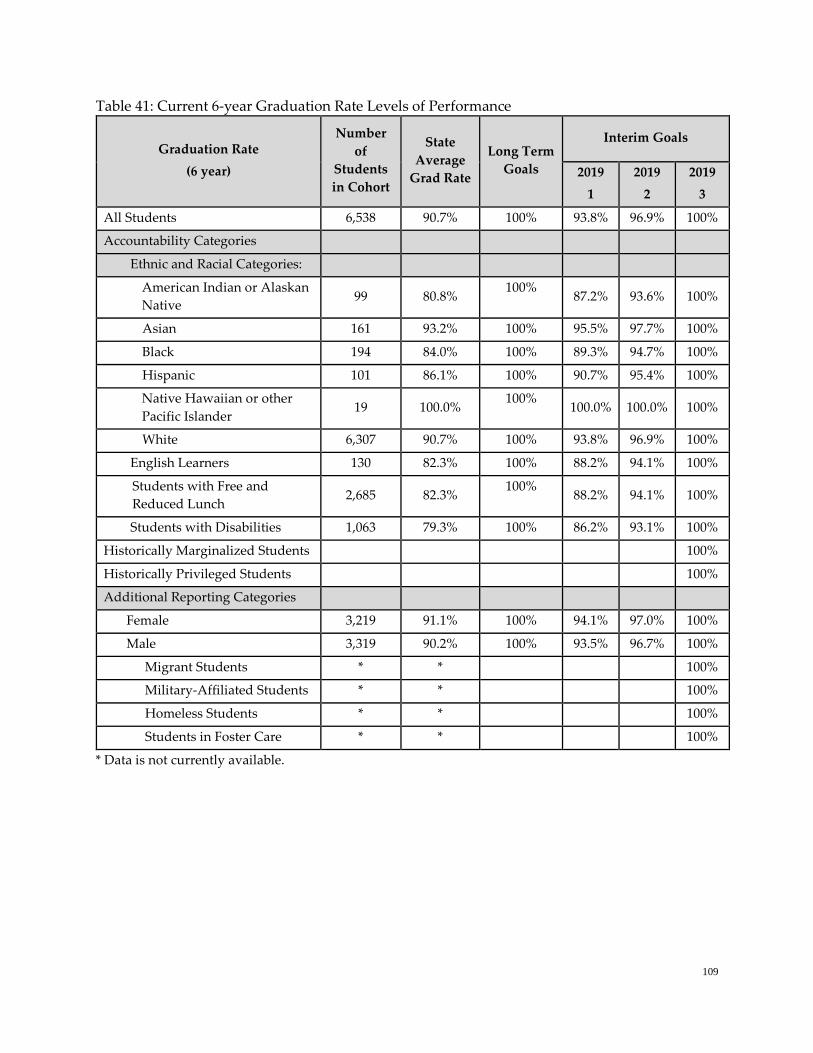
109
Table 41: Current 6-year Graduation Rate Levels of Performance
Graduation Rate
(6 year)
Number
of
Students
in Cohort
State
Average
Grad Rate
Long Term
Goals
Interim Goals
2019
1
2019
2
2019
3
All Students 6,538 90.7% 100% 93.8% 96.9% 100%
Accountability Categories
Ethnic and Racial Categories:
American Indian or Alaskan
Native 99 80.8%
100% 87.2% 93.6% 100%
Asian 161 93.2% 100% 95.5% 97.7% 100%
Black 194 84.0% 100% 89.3% 94.7% 100%
Hispanic 101 86.1% 100% 90.7% 95.4% 100%
Native Hawaiian or other
Pacific Islander 19 100.0%
100% 100.0% 100.0% 100%
White 6,307 90.7% 100% 93.8% 96.9% 100%
English Learners 130 82.3% 100% 88.2% 94.1% 100%
Students with Free and
Reduced Lunch 2,685 82.3%
100% 88.2% 94.1% 100%
Students with Disabilities 1,063 79.3% 100% 86.2% 93.1% 100%
Historically Marginalized Students 100%
Historically Privileged Students 100%
Additional Reporting Categories
Female 3,219 91.1% 100% 94.1% 97.0% 100%
Male 3,319 90.2% 100% 93.5% 96.7% 100%
Migrant Students * * 100%
Military-Affiliated Students * * 100%
Homeless Students * * 100%
Students in Foster Care * * 100%
* Data is not currently available.
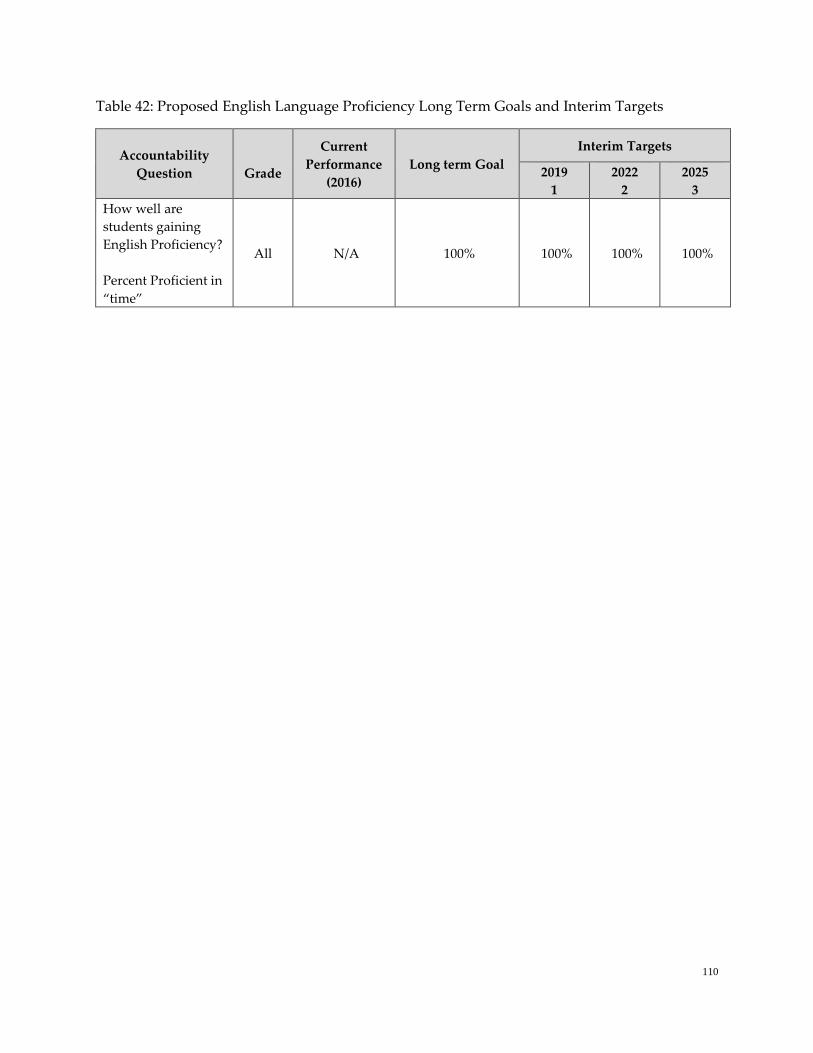
110
Table 42: Proposed English Language Proficiency Long Term Goals and Interim Targets
Accountability
Question
Grade
Current
Performance
(2016)
Long term Goal
Interim Targets
2019
1
2022
2
2025
3
How well are
students gaining
English Proficiency?
Percent Proficient in
“time”
All N/A 100% 100% 100% 100%

Appendix B
A school and/or SU/SD summary composite score for each Criteria is calculated by first converting the actual school-level performance (F) into the 4-Level
Performance score. These Indicator 4-Level Performance Scores are then averaged to create an Indicator Summary (H). Indicator Summary Scores are then
averaged again to create an Accountability Question Summary Score (I). The Accountability Question Summary Scores are then combined with a weighted
average to produce the Criteria Current Score (K). Finally, the prior year’s Current Score is subtracted from the current year current score to calculate the change
from year-to-year.
Table 43: Worked Example of Calculating Score
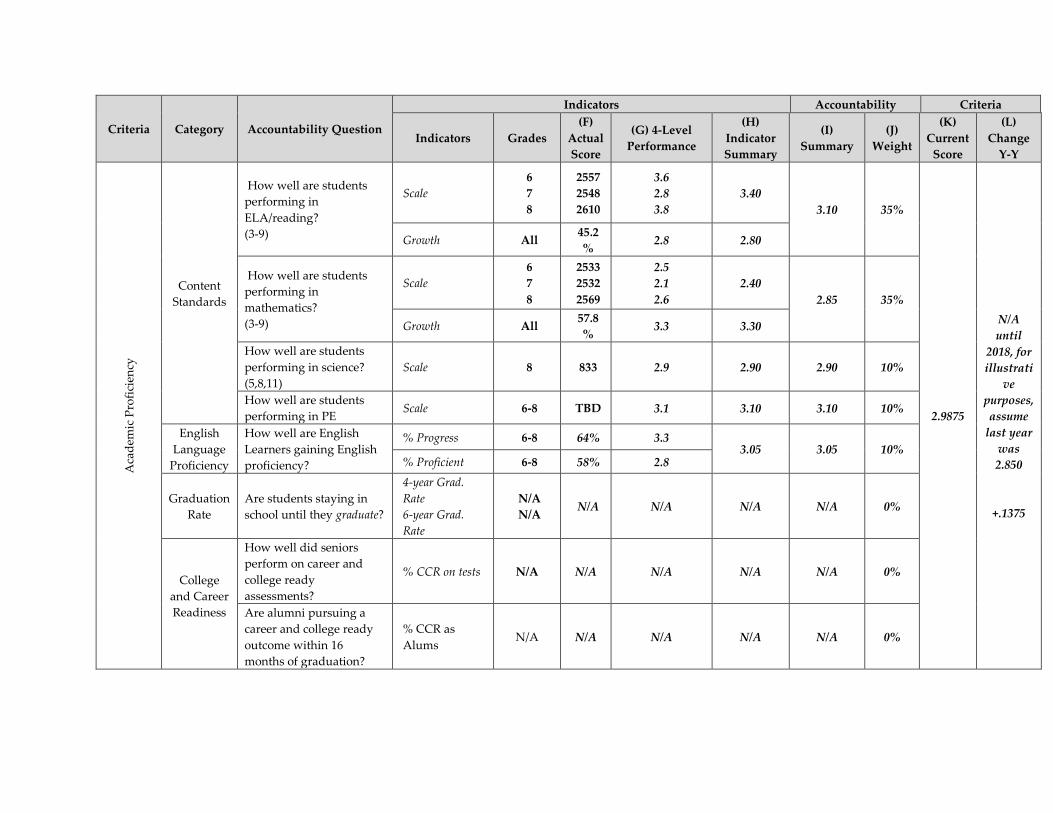
Criteria Category Accountability Question
Indicators Accountability Criteria
Indicators Grades
(F)
Actual
Score
(G) 4-Level
Performance
(H)
Indicator
Summary
(I)
Summary
(J)
Weight
(K)
Current
Score
(L)
Change
Y-Y
Aca
dem
ic P
rofi
cien
cy
Content
Standards
How well are students
performing in
ELA/reading?
(3-9)
Scale
6
7
8
2557
2548
2610
3.6
2.8
3.8
3.40
3.10 35%
2.9875
N/A
until
2018, for
illustrati
ve
purposes,
assume
last year
was
2.850
+.1375
Growth All 45.2
% 2.8 2.80
How well are students
performing in
mathematics?
(3-9)
Scale
6
7
8
2533
2532
2569
2.5
2.1
2.6
2.40
2.85 35%
Growth All 57.8
% 3.3 3.30
How well are students
performing in science?
(5,8,11)
Scale 8 833 2.9 2.90 2.90 10%
How well are students
performing in PE Scale 6-8 TBD 3.1 3.10 3.10 10%
English
Language
Proficiency
How well are English
Learners gaining English
proficiency?
% Progress 6-8 64% 3.3 3.05 3.05 10%
% Proficient 6-8 58% 2.8
Graduation
Rate
Are students staying in
school until they graduate?
4-year Grad.
Rate
6-year Grad.
Rate
N/A
N/A N/A N/A N/A N/A 0%
College
and Career
Readiness
How well did seniors
perform on career and
college ready
assessments?
% CCR on tests N/A N/A N/A N/A N/A 0%
Are alumni pursuing a
career and college ready
outcome within 16
months of graduation?
% CCR as
Alums N/A N/A N/A N/A N/A 0%
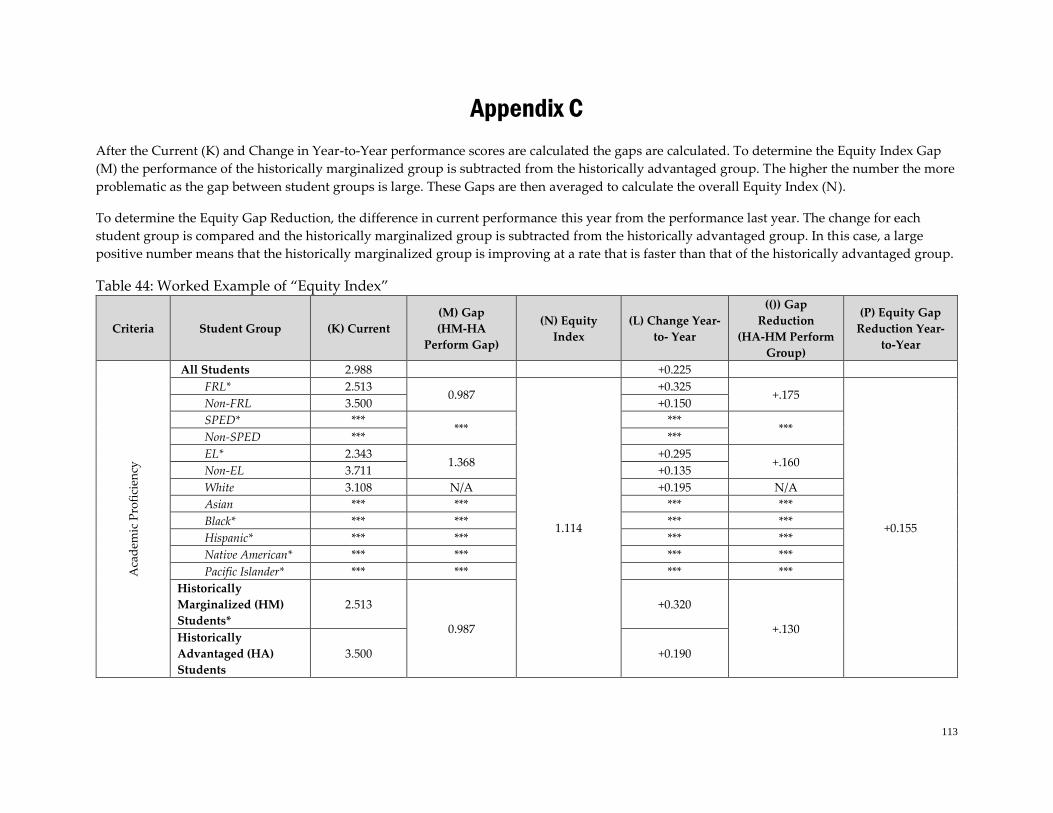
113
Appendix C
After the Current (K) and Change in Year-to-Year performance scores are calculated the gaps are calculated. To determine the Equity Index Gap
(M) the performance of the historically marginalized group is subtracted from the historically advantaged group. The higher the number the more
problematic as the gap between student groups is large. These Gaps are then averaged to calculate the overall Equity Index (N).
To determine the Equity Gap Reduction, the difference in current performance this year from the performance last year. The change for each
student group is compared and the historically marginalized group is subtracted from the historically advantaged group. In this case, a large
positive number means that the historically marginalized group is improving at a rate that is faster than that of the historically advantaged group.
Table 44: Worked Example of “Equity Index”
Criteria Student Group (K) Current
(M) Gap
(HM-HA
Perform Gap)
(N) Equity
Index
(L) Change Year-
to- Year
(()) Gap
Reduction
(HA-HM Perform
Group)
(P) Equity Gap
Reduction Year-
to-Year
Aca
dem
ic P
rofi
cien
cy
All Students 2.988 +0.225
FRL* 2.513 0.987
1.114
+0.325 +.175
+0.155
Non-FRL 3.500 +0.150
SPED* *** ***
*** ***
Non-SPED *** ***
EL* 2.343 1.368
+0.295 +.160
Non-EL 3.711 +0.135
White 3.108 N/A +0.195 N/A
Asian *** *** *** ***
Black* *** *** *** ***
Hispanic* *** *** *** ***
Native American* *** *** *** ***
Pacific Islander* *** *** *** ***
Historically
Marginalized (HM)
Students*
2.513
0.987
+0.320
+.130 Historically
Advantaged (HA)
Students
3.500 +0.190
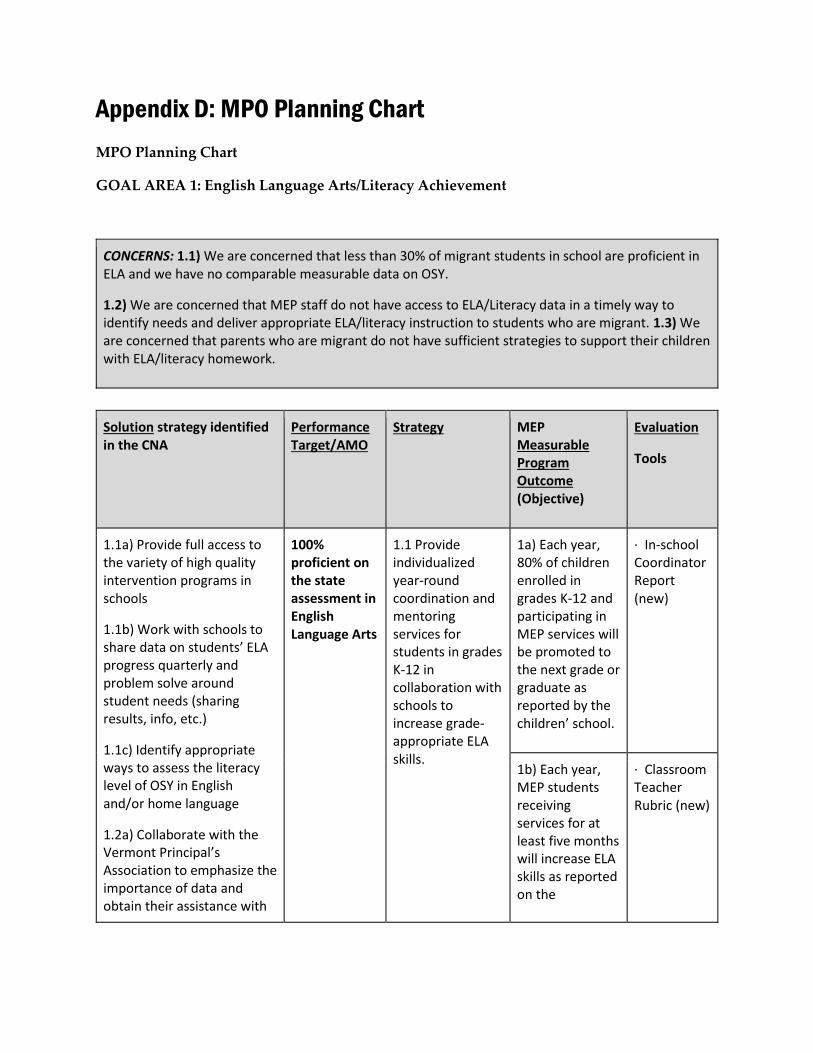
Appendix D: MPO Planning Chart
MPO Planning Chart
GOAL AREA 1: English Language Arts/Literacy Achievement
CONCERNS: 1.1) We are concerned that less than 30% of migrant students in school are proficient in ELA and we have no comparable measurable data on OSY.
1.2) We are concerned that MEP staff do not have access to ELA/Literacy data in a timely way to identify needs and deliver appropriate ELA/literacy instruction to students who are migrant. 1.3) We are concerned that parents who are migrant do not have sufficient strategies to support their children with ELA/literacy homework.
Solution strategy identified in the CNA
Performance Target/AMO
Strategy MEP Measurable Program Outcome (Objective)
Evaluation
Tools
1.1a) Provide full access to the variety of high quality intervention programs in schools
1.1b) Work with schools to share data on students’ ELA progress quarterly and problem solve around student needs (sharing results, info, etc.)
1.1c) Identify appropriate ways to assess the literacy level of OSY in English and/or home language
1.2a) Collaborate with the Vermont Principal’s Association to emphasize the importance of data and obtain their assistance with
100% proficient on the state assessment in English Language Arts
1.1 Provide individualized year-round coordination and mentoring services for students in grades K-12 in collaboration with schools to increase grade-appropriate ELA skills.
1a) Each year, 80% of children enrolled in grades K-12 and participating in MEP services will be promoted to the next grade or graduate as reported by the children’ school.
· In-school Coordinator Report (new)
1b) Each year, MEP students receiving services for at least five months will increase ELA skills as reported on the
· Classroom Teacher Rubric (new)
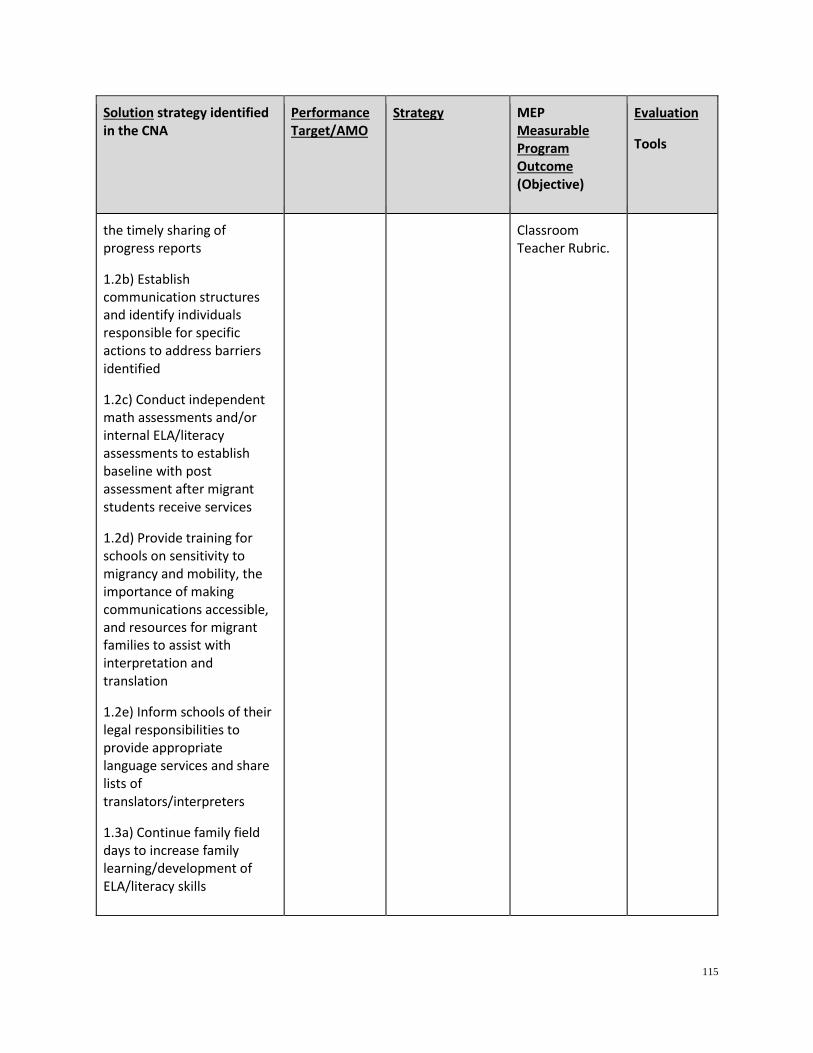
115
Solution strategy identified in the CNA
Performance Target/AMO
Strategy MEP Measurable Program Outcome (Objective)
Evaluation
Tools
the timely sharing of progress reports
1.2b) Establish communication structures and identify individuals responsible for specific actions to address barriers identified
1.2c) Conduct independent math assessments and/or internal ELA/literacy assessments to establish baseline with post assessment after migrant students receive services
1.2d) Provide training for schools on sensitivity to migrancy and mobility, the importance of making communications accessible, and resources for migrant families to assist with interpretation and translation
1.2e) Inform schools of their legal responsibilities to provide appropriate language services and share lists of translators/interpreters
1.3a) Continue family field days to increase family learning/development of ELA/literacy skills
Classroom Teacher Rubric.
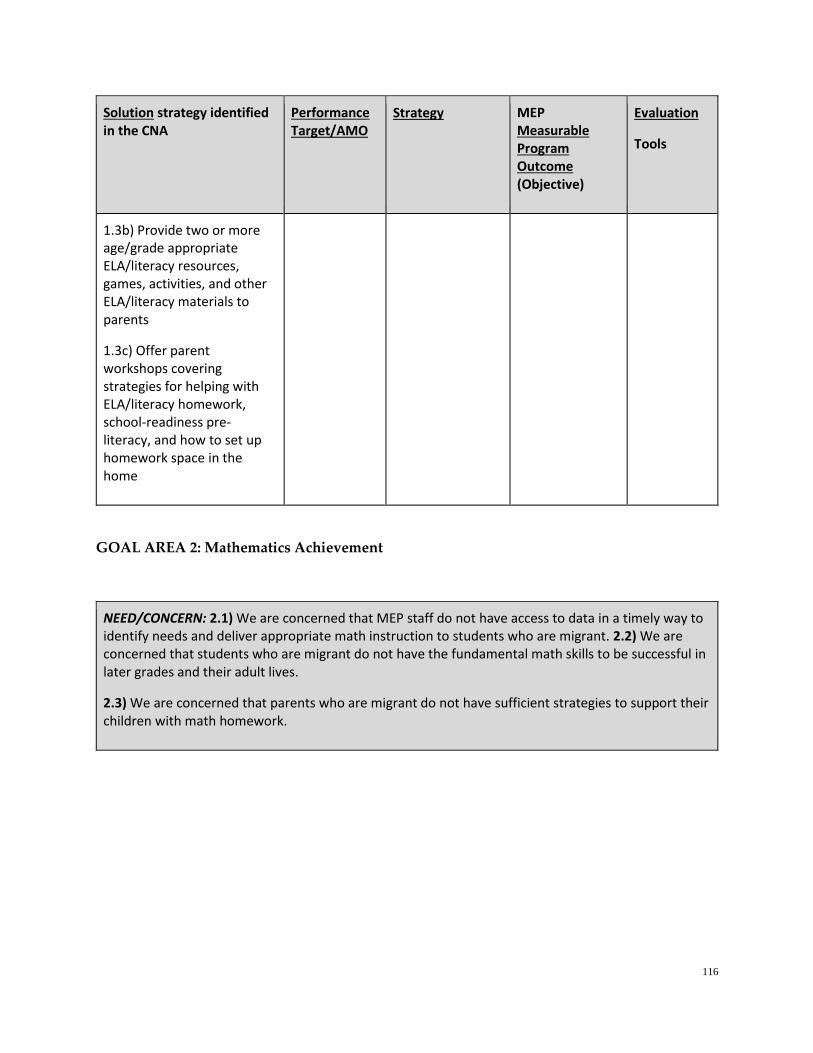
116
Solution strategy identified in the CNA
Performance Target/AMO
Strategy MEP Measurable Program Outcome (Objective)
Evaluation
Tools
1.3b) Provide two or more age/grade appropriate ELA/literacy resources, games, activities, and other ELA/literacy materials to parents
1.3c) Offer parent workshops covering strategies for helping with ELA/literacy homework, school-readiness pre-literacy, and how to set up homework space in the home
GOAL AREA 2: Mathematics Achievement
NEED/CONCERN: 2.1) We are concerned that MEP staff do not have access to data in a timely way to identify needs and deliver appropriate math instruction to students who are migrant. 2.2) We are concerned that students who are migrant do not have the fundamental math skills to be successful in later grades and their adult lives.
2.3) We are concerned that parents who are migrant do not have sufficient strategies to support their children with math homework.
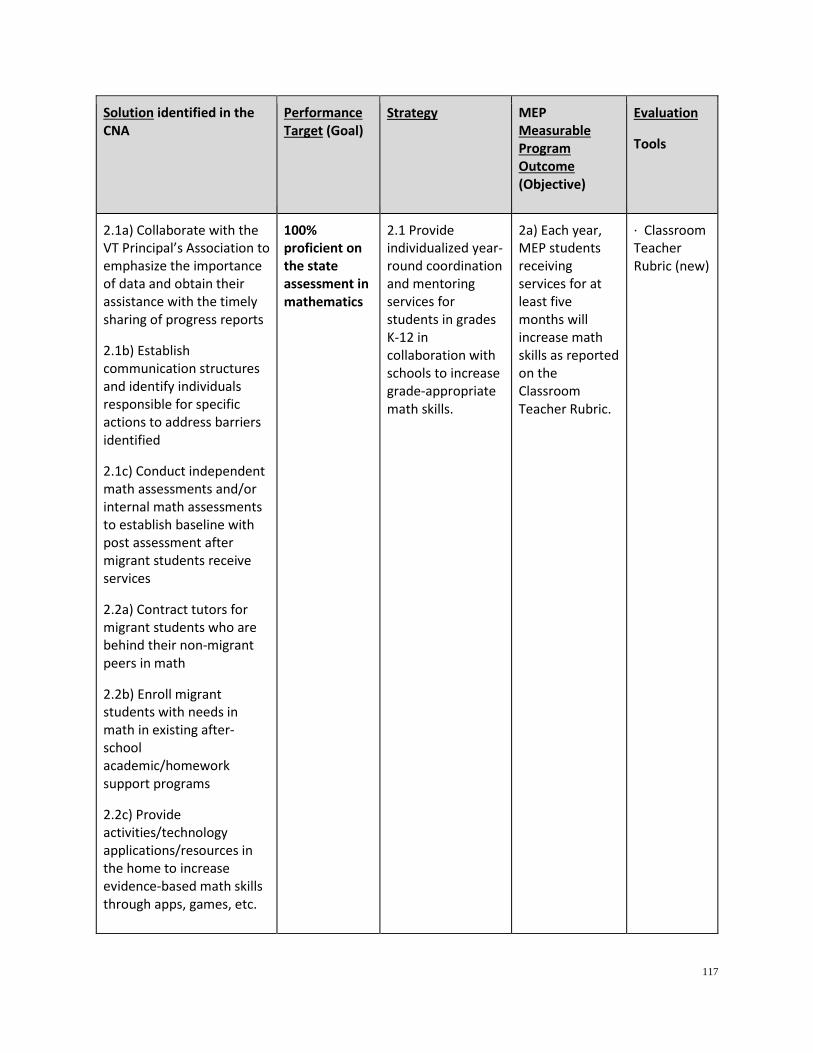
117
Solution identified in the CNA
Performance Target (Goal)
Strategy MEP Measurable Program Outcome (Objective)
Evaluation
Tools
2.1a) Collaborate with the VT Principal’s Association to emphasize the importance of data and obtain their assistance with the timely sharing of progress reports
2.1b) Establish communication structures and identify individuals responsible for specific actions to address barriers identified
2.1c) Conduct independent math assessments and/or internal math assessments to establish baseline with post assessment after migrant students receive services
2.2a) Contract tutors for migrant students who are behind their non-migrant peers in math
2.2b) Enroll migrant students with needs in math in existing after-school academic/homework support programs
2.2c) Provide activities/technology applications/resources in the home to increase evidence-based math skills through apps, games, etc.
100% proficient on the state assessment in mathematics
2.1 Provide individualized year-round coordination and mentoring services for students in grades K-12 in collaboration with schools to increase grade-appropriate math skills.
2a) Each year, MEP students receiving services for at least five months will increase math skills as reported on the Classroom Teacher Rubric.
· Classroom Teacher Rubric (new)
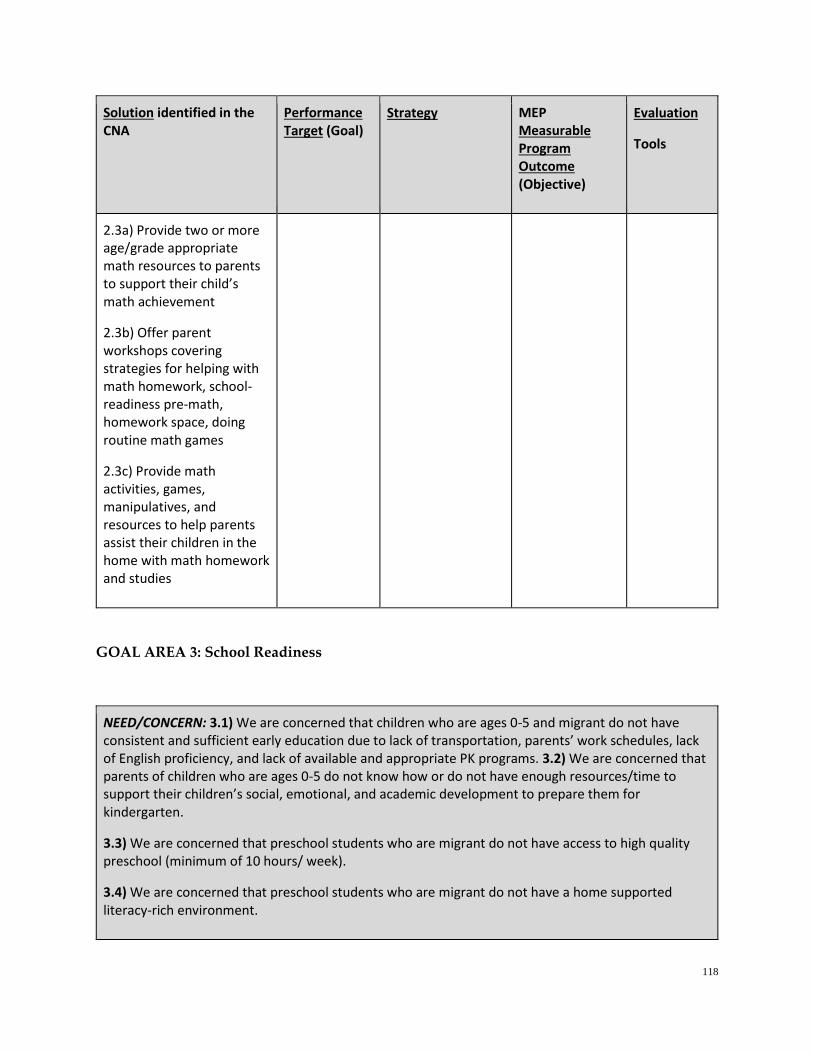
118
Solution identified in the CNA
Performance Target (Goal)
Strategy MEP Measurable Program Outcome (Objective)
Evaluation
Tools
2.3a) Provide two or more age/grade appropriate math resources to parents to support their child’s math achievement
2.3b) Offer parent workshops covering strategies for helping with math homework, school-readiness pre-math, homework space, doing routine math games
2.3c) Provide math activities, games, manipulatives, and resources to help parents assist their children in the home with math homework and studies
GOAL AREA 3: School Readiness
NEED/CONCERN: 3.1) We are concerned that children who are ages 0-5 and migrant do not have consistent and sufficient early education due to lack of transportation, parents’ work schedules, lack of English proficiency, and lack of available and appropriate PK programs. 3.2) We are concerned that parents of children who are ages 0-5 do not know how or do not have enough resources/time to support their children’s social, emotional, and academic development to prepare them for kindergarten.
3.3) We are concerned that preschool students who are migrant do not have access to high quality preschool (minimum of 10 hours/ week).
3.4) We are concerned that preschool students who are migrant do not have a home supported literacy-rich environment.
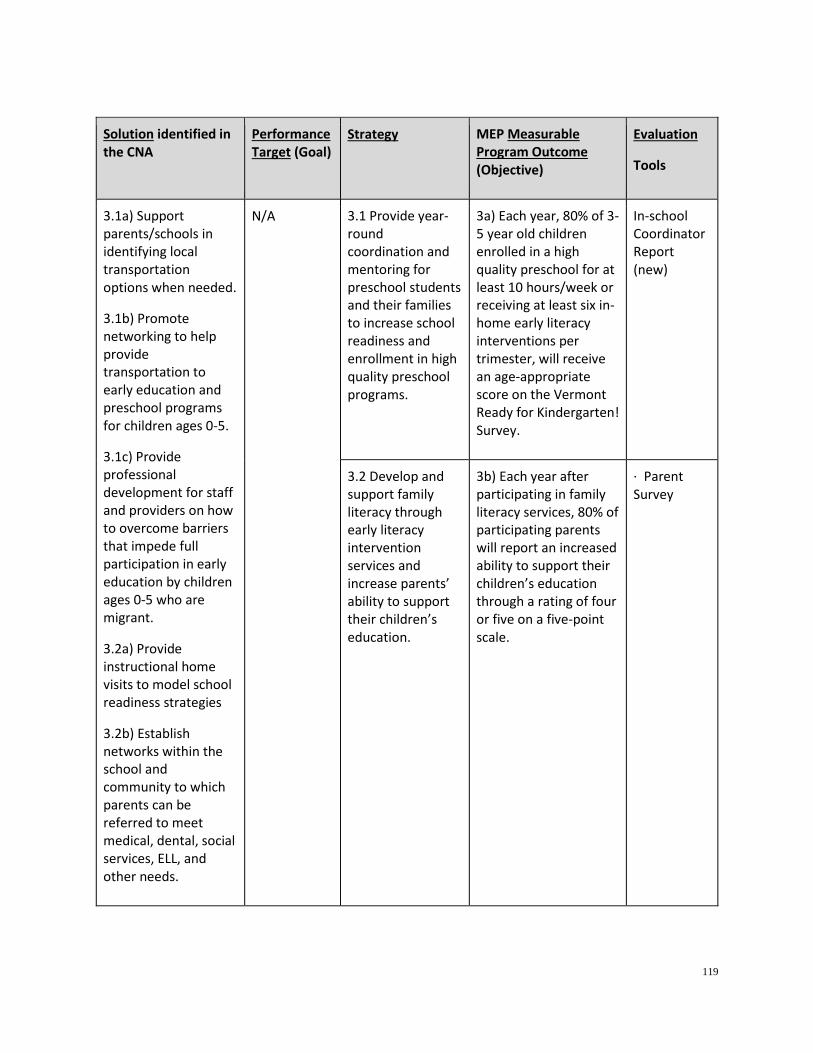
119
Solution identified in the CNA
Performance Target (Goal)
Strategy MEP Measurable Program Outcome (Objective)
Evaluation
Tools
3.1a) Support parents/schools in identifying local transportation options when needed.
3.1b) Promote networking to help provide transportation to early education and preschool programs for children ages 0-5.
3.1c) Provide professional development for staff and providers on how to overcome barriers that impede full participation in early education by children ages 0-5 who are migrant.
3.2a) Provide instructional home visits to model school readiness strategies
3.2b) Establish networks within the school and community to which parents can be referred to meet medical, dental, social services, ELL, and other needs.
N/A 3.1 Provide year-round coordination and mentoring for preschool students and their families to increase school readiness and enrollment in high quality preschool programs.
3a) Each year, 80% of 3-5 year old children enrolled in a high quality preschool for at least 10 hours/week or receiving at least six in-home early literacy interventions per trimester, will receive an age-appropriate score on the Vermont Ready for Kindergarten! Survey.
In-school Coordinator Report (new)
3.2 Develop and support family literacy through early literacy intervention services and increase parents’ ability to support their children’s education.
3b) Each year after participating in family literacy services, 80% of participating parents will report an increased ability to support their children’s education through a rating of four or five on a five-point scale.
· Parent Survey
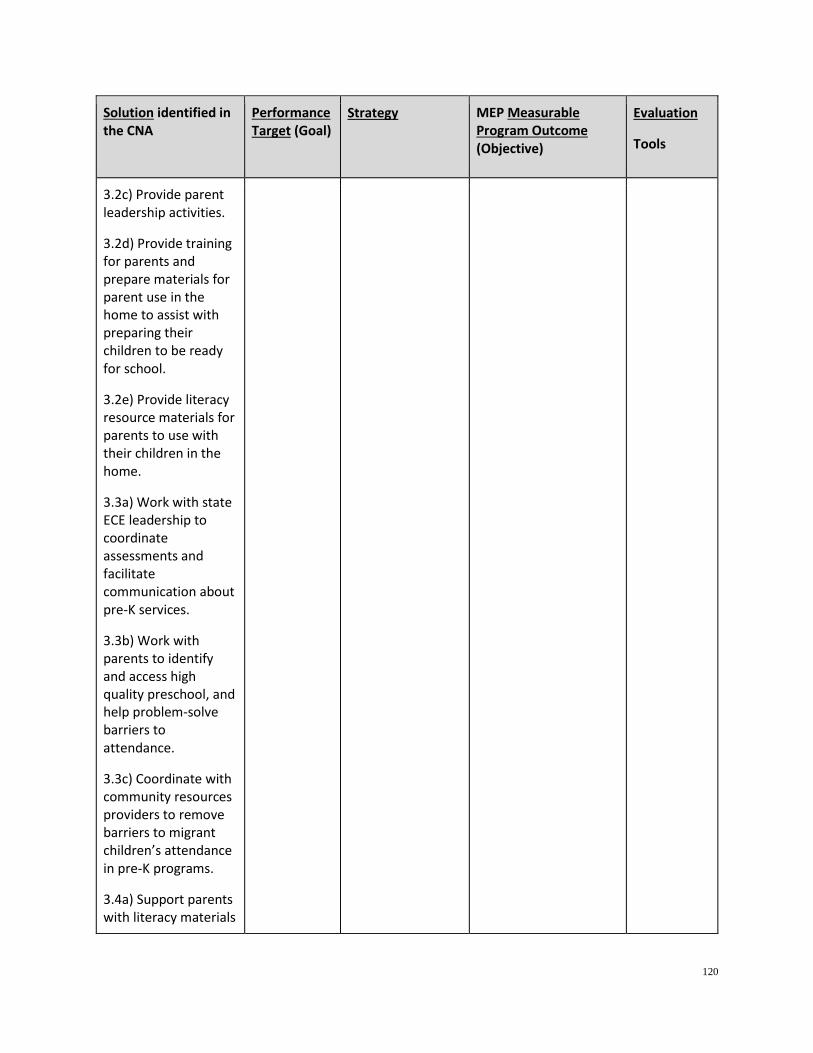
120
Solution identified in the CNA
Performance Target (Goal)
Strategy MEP Measurable Program Outcome (Objective)
Evaluation
Tools
3.2c) Provide parent leadership activities.
3.2d) Provide training for parents and prepare materials for parent use in the home to assist with preparing their children to be ready for school.
3.2e) Provide literacy resource materials for parents to use with their children in the home.
3.3a) Work with state ECE leadership to coordinate assessments and facilitate communication about pre-K services.
3.3b) Work with parents to identify and access high quality preschool, and help problem-solve barriers to attendance.
3.3c) Coordinate with community resources providers to remove barriers to migrant children’s attendance in pre-K programs.
3.4a) Support parents with literacy materials

121
Solution identified in the CNA
Performance Target (Goal)
Strategy MEP Measurable Program Outcome (Objective)
Evaluation
Tools
including books to read to their children
3.4b) Provide family literacy home visits to model activities that parents can do with their children
3.4c) Sponsor parent events that promote pre-literacy strategies and activities to do in the home.
GOAL AREA 4: High School Graduation and Out-of-School Youth
NEED/CONCERN: 4.1) We are concerned that over 50% of OSY have not attended school beyond 8th grade and have limited literacy. 4.2) We are concerned that H.S. students who are migrant and OSY are not able to attain their educational goals. 4.3) We are concerned that secondary-aged students exhibit many characteristics associated with at-risk for H.S. dropout. 4.4) We are concerned that OSY are limited in English proficiency which may limit their access to education and other services, resources, and opportunities. 4.5) We are concerned that schools are not assessing OSY readiness for a high school programs. 4.6) We are concerned that OSY do not have access to, or skills to use, computers and the Internet.
Solution identified in the CNA
Performance Target (Goal)
Strategy MEP Measurable Program Outcome (Objective)
Evaluation
Tools
4.1a) Develop research/evidence-based literacy instruction for OSY
Number of 12th grade migrant students is less than 30. Number of
4.1 Provide secondary-aged migrant students with individualized year-round guidance,
4a) Each year, 80% of MEP students in grades 9-12 will be on track toward graduation as measured by a PLP
· Coordinator report (new)
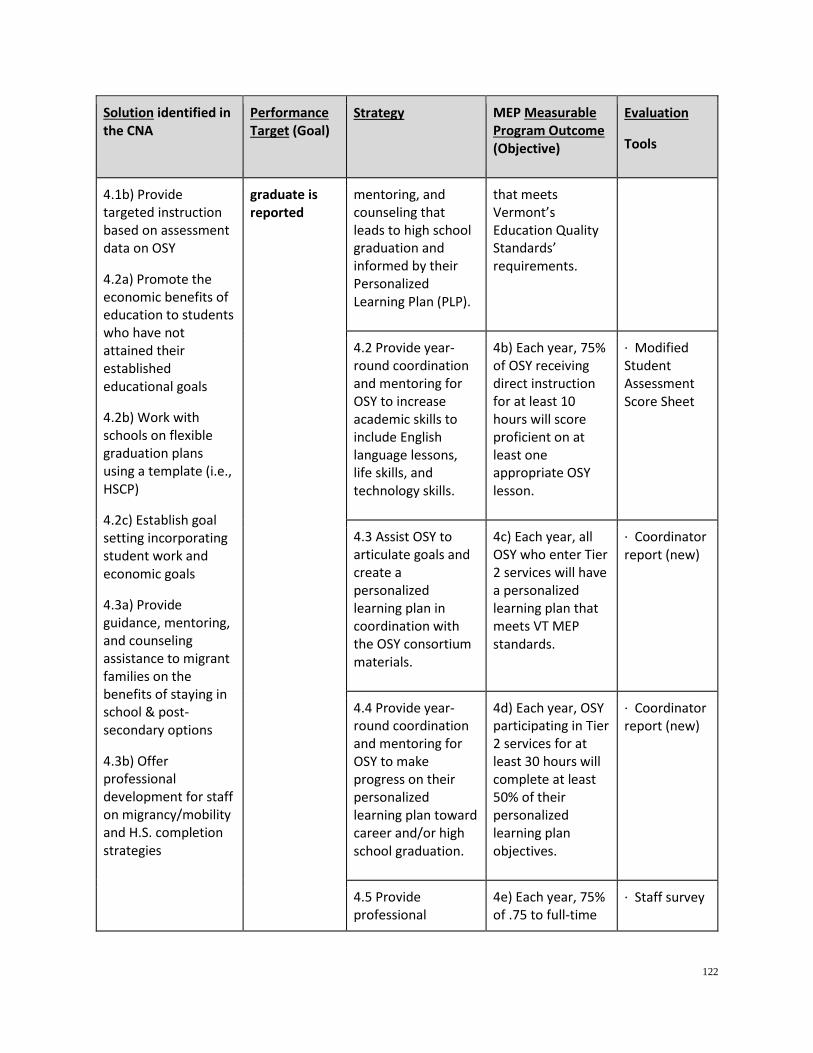
122
Solution identified in the CNA
Performance Target (Goal)
Strategy MEP Measurable Program Outcome (Objective)
Evaluation
Tools
4.1b) Provide targeted instruction based on assessment data on OSY
4.2a) Promote the economic benefits of education to students who have not attained their established educational goals
4.2b) Work with schools on flexible graduation plans using a template (i.e., HSCP)
4.2c) Establish goal setting incorporating student work and economic goals
4.3a) Provide guidance, mentoring, and counseling assistance to migrant families on the benefits of staying in school & post-secondary options
4.3b) Offer professional development for staff on migrancy/mobility and H.S. completion strategies
graduate is reported
mentoring, and counseling that leads to high school graduation and informed by their Personalized Learning Plan (PLP).
that meets Vermont’s Education Quality Standards’ requirements.
4.2 Provide year-round coordination and mentoring for OSY to increase academic skills to include English language lessons, life skills, and technology skills.
4b) Each year, 75% of OSY receiving direct instruction for at least 10 hours will score proficient on at least one appropriate OSY lesson.
· Modified Student Assessment Score Sheet
4.3 Assist OSY to articulate goals and create a personalized learning plan in coordination with the OSY consortium materials.
4c) Each year, all OSY who enter Tier 2 services will have a personalized learning plan that meets VT MEP standards.
· Coordinator report (new)
4.4 Provide year-round coordination and mentoring for OSY to make progress on their personalized learning plan toward career and/or high school graduation.
4d) Each year, OSY participating in Tier 2 services for at least 30 hours will complete at least 50% of their personalized learning plan objectives.
· Coordinator report (new)
4.5 Provide professional
4e) Each year, 75% of .75 to full-time
· Staff survey
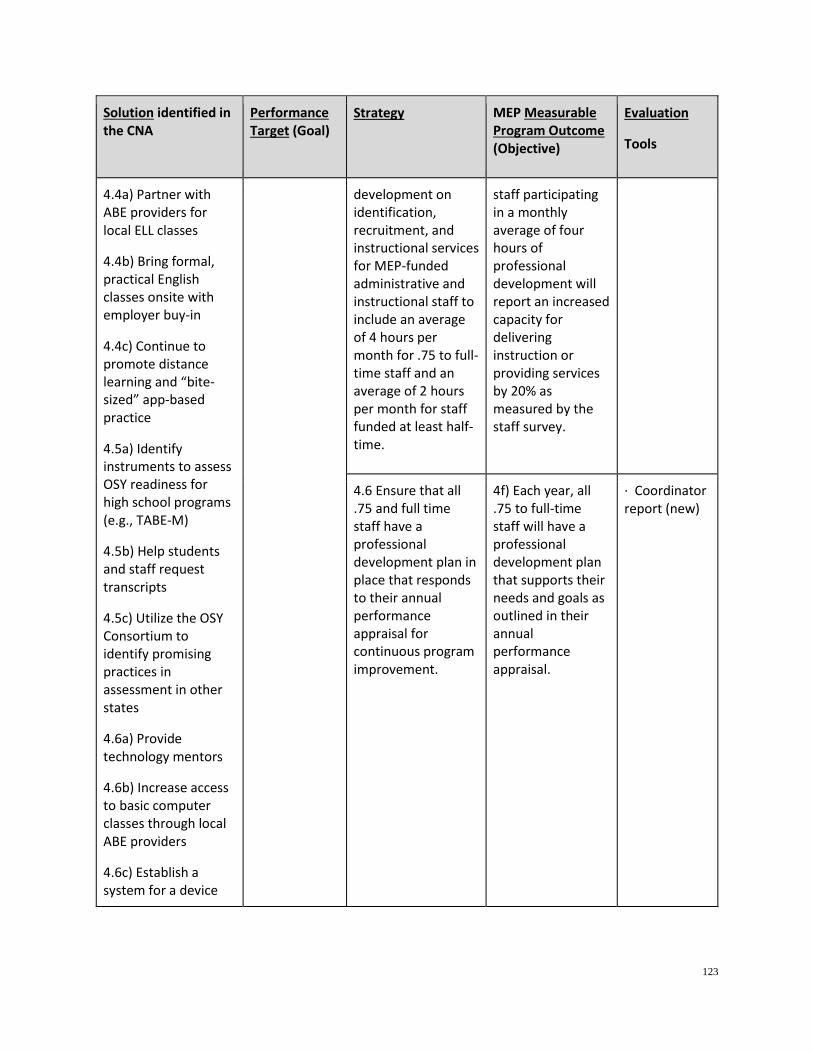
123
Solution identified in the CNA
Performance Target (Goal)
Strategy MEP Measurable Program Outcome (Objective)
Evaluation
Tools
4.4a) Partner with ABE providers for local ELL classes
4.4b) Bring formal, practical English classes onsite with employer buy-in
4.4c) Continue to promote distance learning and “bite-sized” app-based practice
4.5a) Identify instruments to assess OSY readiness for high school programs (e.g., TABE-M)
4.5b) Help students and staff request transcripts
4.5c) Utilize the OSY Consortium to identify promising practices in assessment in other states
4.6a) Provide technology mentors
4.6b) Increase access to basic computer classes through local ABE providers
4.6c) Establish a system for a device
development on identification, recruitment, and instructional services for MEP-funded administrative and instructional staff to include an average of 4 hours per month for .75 to full-time staff and an average of 2 hours per month for staff funded at least half-time.
staff participating in a monthly average of four hours of professional development will report an increased capacity for delivering instruction or providing services by 20% as measured by the staff survey.
4.6 Ensure that all .75 and full time staff have a professional development plan in place that responds to their annual performance appraisal for continuous program improvement.
4f) Each year, all .75 to full-time staff will have a professional development plan that supports their needs and goals as outlined in their annual performance appraisal.
· Coordinator report (new)
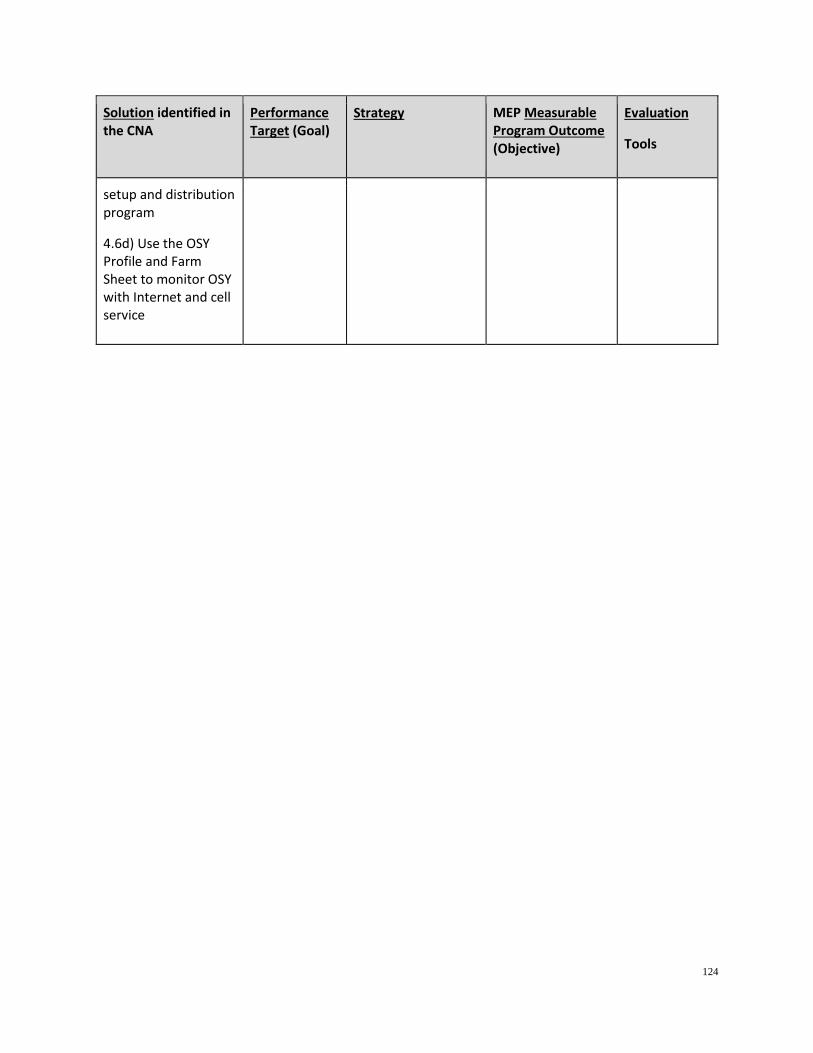
124
Solution identified in the CNA
Performance Target (Goal)
Strategy MEP Measurable Program Outcome (Objective)
Evaluation
Tools
setup and distribution program
4.6d) Use the OSY Profile and Farm Sheet to monitor OSY with Internet and cell service
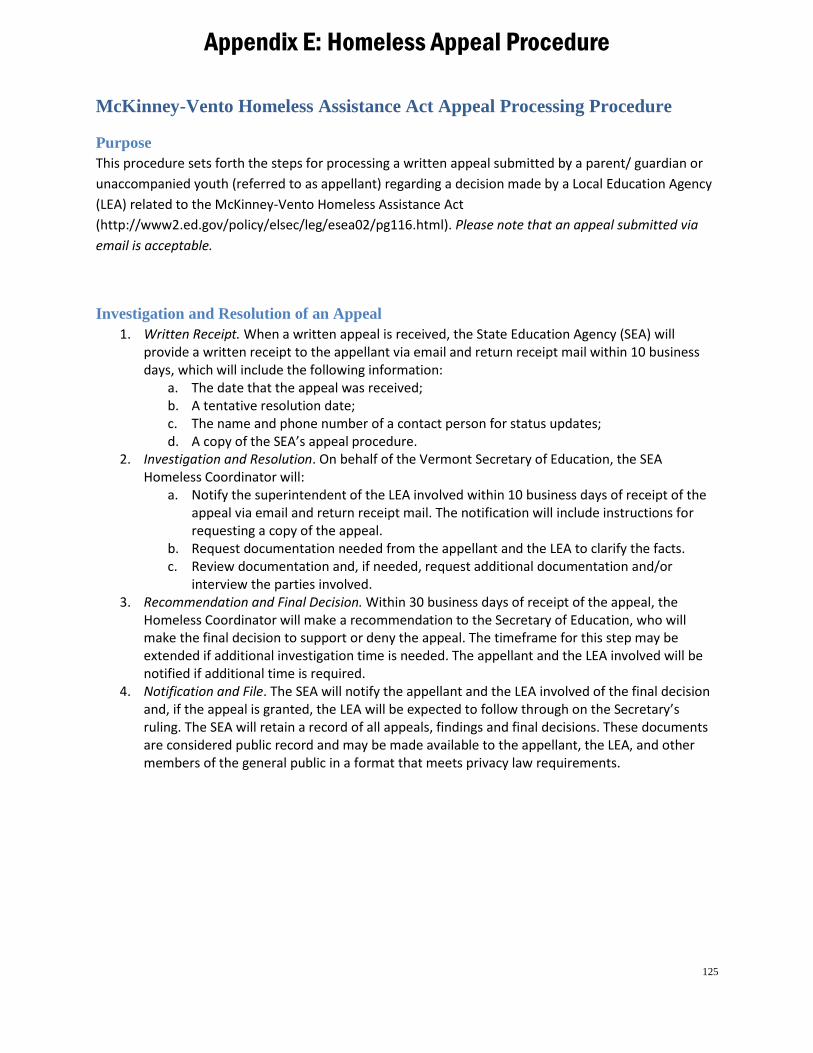
125
Appendix E: Homeless Appeal Procedure
McKinney-Vento Homeless Assistance Act Appeal Processing Procedure
Purpose
This procedure sets forth the steps for processing a written appeal submitted by a parent/ guardian or
unaccompanied youth (referred to as appellant) regarding a decision made by a Local Education Agency
(LEA) related to the McKinney-Vento Homeless Assistance Act
(http://www2.ed.gov/policy/elsec/leg/esea02/pg116.html). Please note that an appeal submitted via
email is acceptable.
Investigation and Resolution of an Appeal
1. Written Receipt. When a written appeal is received, the State Education Agency (SEA) will provide a written receipt to the appellant via email and return receipt mail within 10 business days, which will include the following information:
a. The date that the appeal was received; b. A tentative resolution date; c. The name and phone number of a contact person for status updates; d. A copy of the SEA’s appeal procedure.
2. Investigation and Resolution. On behalf of the Vermont Secretary of Education, the SEA Homeless Coordinator will:
a. Notify the superintendent of the LEA involved within 10 business days of receipt of the appeal via email and return receipt mail. The notification will include instructions for requesting a copy of the appeal.
b. Request documentation needed from the appellant and the LEA to clarify the facts. c. Review documentation and, if needed, request additional documentation and/or
interview the parties involved. 3. Recommendation and Final Decision. Within 30 business days of receipt of the appeal, the
Homeless Coordinator will make a recommendation to the Secretary of Education, who will make the final decision to support or deny the appeal. The timeframe for this step may be extended if additional investigation time is needed. The appellant and the LEA involved will be notified if additional time is required.
4. Notification and File. The SEA will notify the appellant and the LEA involved of the final decision and, if the appeal is granted, the LEA will be expected to follow through on the Secretary’s ruling. The SEA will retain a record of all appeals, findings and final decisions. These documents are considered public record and may be made available to the appellant, the LEA, and other members of the general public in a format that meets privacy law requirements.
126
Appendix B
OMB Control No. 1894-0005 (Exp. 03/31/2017)
NOTICE TO ALL APPLICANT
The purpose of this enclosure is to inform you about a new provision in the Department of
Education's General Education Provisions Act (GEPA) that applies to applicants for new grant awards under Department programs. This provision is
Section 427 of GEPA, enacted as part of the Improving America's Schools Act of 1994 (Public Law
(P.L.) 103-382).
To Whom Does This Provision Apply?
Section 427 of GEPA affects applicants for new grant awards under this program. ALL APPLICANTS FOR NEW AWARDS MUST INCLUDE INFORMATION IN THEIR APPLICATIONS TO ADDRESS THIS NEW PROVISION IN ORDER TO RECEIVE FUNDING UNDER THIS PROGRAM.
(If this program is a State-formula grant program, a State needs to provide this description only for projects or activities that it carries out with funds reserved for State-level uses. In addition, local school districts or other eligible applicants that apply to the State for funding need to provide this description in their applications to the State for funding. The State would be responsible for ensuring that the school district or other local entity has submitted a sufficient section 427 statement as described below.)
What Does This Provision Require?
Section 427 requires each applicant for funds (other than an individual person) to include in its application a description of the steps the applicant proposes to take to ensure equitable access to, and participation in, its Federally-assisted program for students, teachers, and other program beneficiaries with special needs. This provision allows applicants discretion in developing the required description. The statute highlights six types of barriers that can impede equitable access or participation: gender, race, national origin, color, disability, or age. Based on local circumstances, you should determine whether these or other barriers may prevent your students, teachers, etc. from such access or participation in, the Federally-funded project or activity. The description in your application of steps to be taken to overcome these barriers need not be lengthy; you may provide a clear and succinct description of how you plan to address those barriers
that are applicable to your circumstances. In addition, the information may be provided in a single narrative, or, if appropriate, may be discussed in connection with related topics in the application.
Section 427 is not intended to duplicate the requirements of civil rights statutes, but rather to ensure that, in designing their projects, applicants for Federal funds address equity concerns that may affect the ability of certain potential beneficiaries to fully participate in the project and to achieve to high standards. Consistent with program requirements and its approved application, an applicant may use the Federal funds awarded to it to eliminate barriers it identifies.
What are Examples of How an Applicant Might Satisfy the Requirement of This Provision?
The following examples may help illustrate how an applicant may comply with Section 427.
(1) An applicant that proposes to carry out an adult literacy project serving, among others, adults with limited English proficiency, might describe in its application how it intends to distribute a brochure about the proposed project to such potential participants in their native language.
(2) An applicant that proposes to develop instructional materials for classroom use might describe how it will make the materials available on audio tape or in braille for students who are blind.
(3) An applicant that proposes to carry out a model science program for secondary students and is concerned that girls may be less likely than boys to enroll in the course, might indicate how it intends to conduct "outreach" efforts to girls, to encourage their enrollment.
(4) An applicant that proposes a project to increase school safety might describe the special efforts it will take to address concern of lesbian, gay, bisexual, and transgender students, and efforts to reach out to and involve the families of LGBT students
We recognize that many applicants may already be implementing effective steps to ensure equity of
127
access and participation in their grant programs, and we appreciate your cooperation in responding to the requirements of this provision.
128
Estimated Burden Statement for GEPA Requirements
According to the Paperwork Reduction Act of 1995, no persons are required to respond to a collection of information
unless such collection displays a valid OMB control number. Public reporting burden for this collection of
information is estimated to average 1.5 hours per response, including time for reviewing instructions, searching
existing data sources, gathering and maintaining the data needed, and completing and reviewing the collection of
information. The obligation to respond to this collection is required to obtain or retain benefit (Public Law
103-382. Send comments regarding the burden estimate or any other aspect of this collection of information,
including suggestions for reducing this burden, to the U.S. Department of Education, 400 Maryland Ave., SW,
Washington, DC 20210-4537 or email [email protected] and reference the OMB Control Number 1894-0005.