Revamp Title Page Inc. Partners Farmland
81
1 1 Revamp Title Page U.S. Farmland Sector Primer June 2021 This Primer was produced by Green Street’s Advisory Group and commissioned by Farmland Partners. This is not a Research Report. Please see the last slide for additional disclosure. Farmland Partners Inc.
Transcript of Revamp Title Page Inc. Partners Farmland

1
1
Revamp Title Page
U.S. Farmland Sector Primer
June 2021This Primer was produced by Green Street’s Advisory Group and commissioned by Farmland Partners. This is not a Research Report. Please see the last slide for additional disclosure.
Farmlan
d Part
ners
Inc.
2
Section
Table ofContents
Page
II. Farmland Investment Rationale 5
III. Understanding Farmland –Macro Demand Drivers
27
V. Land Lease Investment Attributes 51
I. Executive Summary 3
VI. Relative Valuation Considerations 65
IV. Understanding Farmland –Income Characteristics
41
VII. Appendix 77Farm
land P
artne
rs Inc
.

3
Executive SummarySection I
Farmlan
d Part
ners
Inc.
4This Primer was produced by Green Street’s Advisory Group and commissioned by Farmland Partners.
This is not a Research Report. Please see the last slide for additional disclosure.
www.greenstreet.com
Executive SummaryInvestment Rationale
• U.S. Farmland is one of the largest commercial real estate sectors (~$2.5 trillion) and remains under allocated among institutional real estate investors. The sector has delivered steady returns through cycles that are best viewed over long time horizons.
• Farmland broadly consists of row crops (e.g., corn) and permanent crops (e.g., fruits). Row crops tend to generate more predictable cash flows compared to permanent crops which are more prone to various production risks.
• Farmland as an investment vehicle offers unique attributes compared to traditional real estate, including lower risk of obsolescence, lower fungibility risk, and lower capex burden. Farmland is also a “zero-vacancy” sector.
Demand Drivers
• Agriculture has benefited from tremendous innovation (i.e., productivity gains) over the years, but no fundamental disruptions in the way food is produced; land is still the essential component for food production.
• Demand for food in the U.S. and globally is increasing at a steady pace. Agriculture is an industry essential to U.S. food security, muting long-term demand risk.
• Population growth has vastly outpaced the growth in available arable land worldwide, leading to a shrinking stock of available agricultural land per capita.
• Farmland’s attractive supply/demand dynamic can offer a combination of income stability and growth prospects to landowners through cycles. U.S. agriculture is competitive on the global stage and is well-positioned to capture incremental growth.
Investment Attributes
• Commodity prices are volatile, but income from farm operations has shown to be relatively steady and stable over time.
• Farmers’ income is a function of both price and productivity. Steady and growing yields from best-in-class U.S. farming operations has helped balance the fluctuation in commodity prices (which reflects short-term imbalances in supply and demand of a certain commodity).
• The U.S. government deems the agriculture sector so essential to a functioning society that it provides support mechanisms to farmers, which provides another layer of income stability.
• Landowners can structure land leases that exhibit even less volatility than farmers’ income from operations, but traditional real estate investors must challenge their conventional wisdom when assessing term and credit of these land lease investments.
• Farmland investments offer initial yields at the lower range of traditional real estate sectors, but historically superior NOI growth and lower cap-ex spending have proven to be the true drivers of total return outperformance over time.
Source: Green Street Advisory Group
Farmlan
d Part
ners
Inc.
5
Farmland Investment RationaleSection II
Farmlan
d Part
ners
Inc.
6This Primer was produced by Green Street’s Advisory Group and commissioned by Farmland Partners.
This is not a Research Report. Please see the last slide for additional disclosure.
www.greenstreet.comSource: Green Street Advisory Group
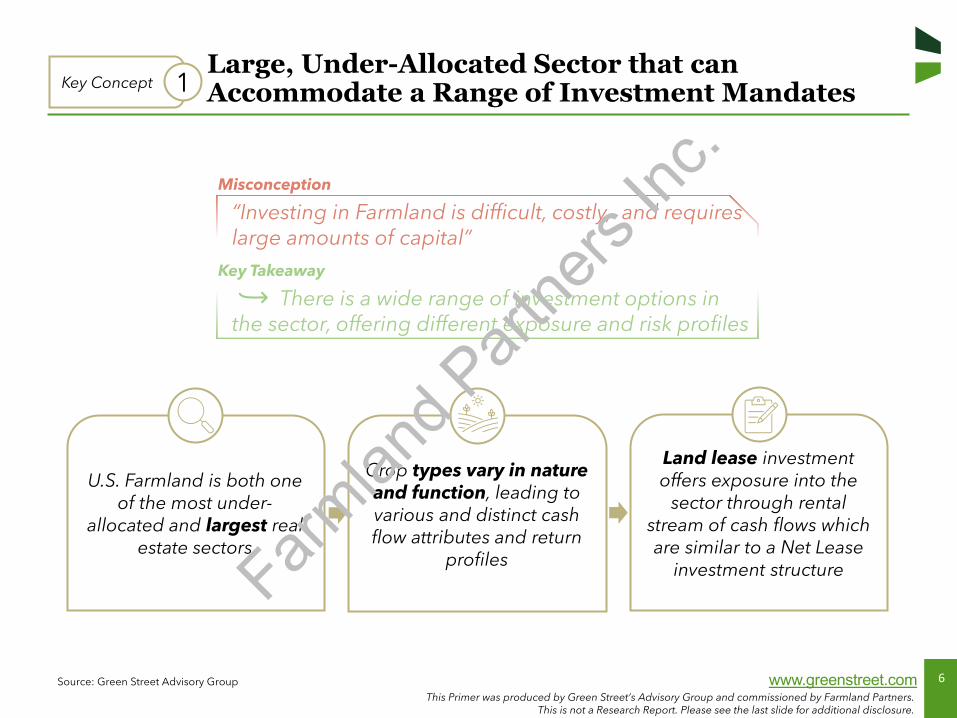
“Investing in Farmland is difficult, costly, and requires large amounts of capital”
Misconception
Large, Under-Allocated Sector that can Accommodate a Range of Investment MandatesKey Concept 1
Key Takeaway
There is a wide range of investment options in the sector, offering different exposure and risk profiles
U.S. Farmland is both one of the most under-
allocated and largest real estate sectors
Crop types vary in nature and function, leading to various and distinct cash flow attributes and return
profiles
Land lease investment offers exposure into the
sector through rental stream of cash flows which are similar to a Net Lease
investment structure Farmlan
d Part
ners
Inc.
7This Primer was produced by Green Street’s Advisory Group and commissioned by Farmland Partners.
This is not a Research Report. Please see the last slide for additional disclosure.
www.greenstreet.com
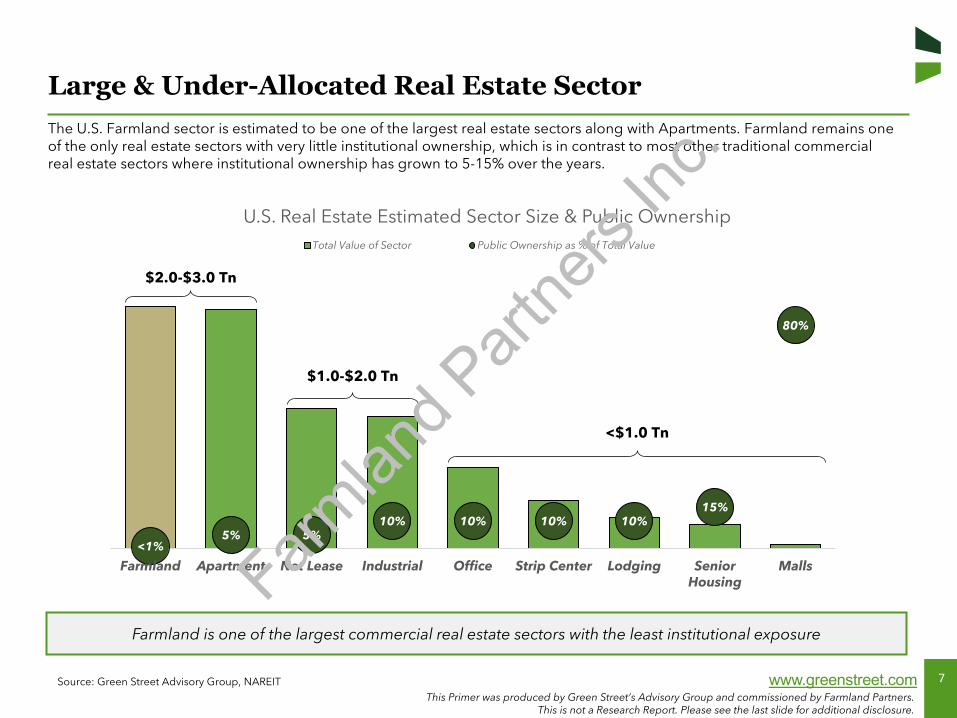
Large & Under-Allocated Real Estate SectorThe U.S. Farmland sector is estimated to be one of the largest real estate sectors along with Apartments. Farmland remains one of the only real estate sectors with very little institutional ownership, which is in contrast to most other traditional commercial real estate sectors where institutional ownership has grown to 5-15% over the years.
Source: Green Street Advisory Group, NAREIT
Farmland is one of the largest commercial real estate sectors with the least institutional exposure
<1%5% 5%
10% 10% 10% 10%15%
80%
0.0%
10.0%
20.0%
30.0%
40.0%
50.0%
60.0%
70.0%
80.0%
90.0%
100.0%
Farmland Apartment Net Lease Industrial Office Strip Center Lodging SeniorHousing
Malls
U.S. Real Estate Estimated Sector Size & Public OwnershipTotal Value of Sector Public Ownership as % of Total Value
$2.0-$3.0 Tn
<$1.0 Tn
$1.0-$2.0 Tn
Farmlan
d Part
ners
Inc.
8This Primer was produced by Green Street’s Advisory Group and commissioned by Farmland Partners.
This is not a Research Report. Please see the last slide for additional disclosure.
www.greenstreet.com
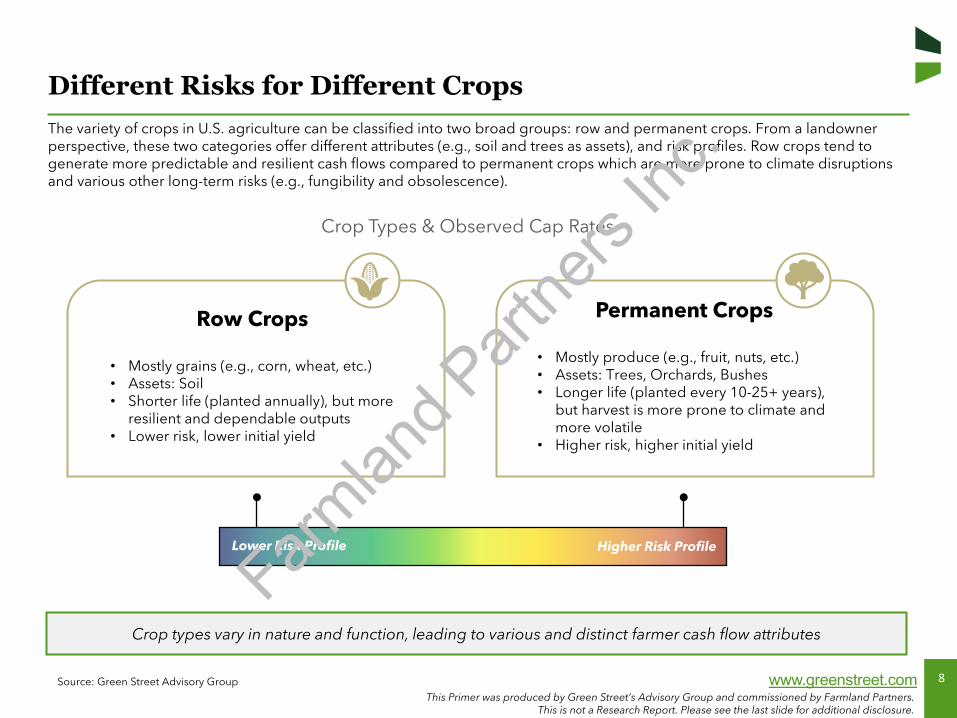
Different Risks for Different CropsThe variety of crops in U.S. agriculture can be classified into two broad groups: row and permanent crops. From a landowner perspective, these two categories offer different attributes (e.g., soil and trees as assets), and risk profiles. Row crops tend to generate more predictable and resilient cash flows compared to permanent crops which are more prone to climate disruptions and various other long-term risks (e.g., fungibility and obsolescence).
Source: Green Street Advisory Group
Row Crops
• Mostly grains (e.g., corn, wheat, etc.)• Assets: Soil• Shorter life (planted annually), but more
resilient and dependable outputs• Lower risk, lower initial yield
Crop types vary in nature and function, leading to various and distinct farmer cash flow attributes
Crop Types & Observed Cap Rates
Higher Risk ProfileLower Risk Profile
Permanent Crops
• Mostly produce (e.g., fruit, nuts, etc.)• Assets: Trees, Orchards, Bushes• Longer life (planted every 10-25+ years),
but harvest is more prone to climate and more volatile
• Higher risk, higher initial yield
Farmlan
d Part
ners
Inc.

9This Primer was produced by Green Street’s Advisory Group and commissioned by Farmland Partners.
This is not a Research Report. Please see the last slide for additional disclosure.
www.greenstreet.comSource: Green Street Advisory Group
“Investing in Farmland is risky and volatile”
Misconception
Steady Returns Through CyclesKey Concept 2
Key Takeaway
U.S. Farmland has delivered steady returns through cycles, uncorrelated with other asset classes
U.S. Farmland has delivered attractive relative returns over long holding
periods, and strong outperformance during
recessionary environments
U.S. Farmland performance has exhibited less volatility
than equities and the broader commercial real
estate industry
U.S. Farmland performance has been uncorrelated to most
other financial investment vehiclesFarm
land P
artne
rs Inc
.

10This Primer was produced by Green Street’s Advisory Group and commissioned by Farmland Partners.
This is not a Research Report. Please see the last slide for additional disclosure.
www.greenstreet.com
5.5%
11.2% 11.2%
16.3%
10.0% 9.6%
7.3%
5.8%
10.6%
4.9%5.5% 5.9%
5-Year 15-Year 25-Year
Annualized Total Returns(as of 3/31/2021)
NCREIF Farmland Index S&P 500 NAREIT Major Sector Average* Bloomberg Barclays U.S. Corp Bond Index
Long-Term OutperformanceU.S. Farmland has a strong track record of delivering attractive returns over long holding periods, especially periods marked bydeep recessionary environments. The NCREIF Farmland Index consists of a ~$13 billion pool of individual farmland properties acquired in the private market for investment purposes and is the leading proxy for institutional farmland returns.
Source: Green Street Advisory Group, NCREIF Farmland Index, Bloomberg, NAREIT
U.S. Farmland has delivered steady returns through cycles that are best viewed over long time horizons
*Core sector weights: apartment (25%), industrial (25%), office (25%), and retail (25%)
NCREIF reports Farmland data on an unleveraged basis, while NAREIT measures performance of the REITs on a leveraged basis; please see additional notes on data
sources and comparability issues in the appendix
Farmlan
d Part
ners
Inc.

11This Primer was produced by Green Street’s Advisory Group and commissioned by Farmland Partners.
This is not a Research Report. Please see the last slide for additional disclosure.
www.greenstreet.com
Low Volatility Through CyclesOver the last 30 years, Farmland has delivered steady returns while exhibiting less volatility than equities and the broader commercial real estate industry. This is reflected in a higher Sharpe ratio relative to the S&P and NAREIT index, which is indicative of higher excess return per unit of risk. Farmland has presented investors the opportunity to diversify their portfolio while reducing overall risk.
Source: Green Street Advisory Group, NCREIF Farmland Index, Bloomberg, NAREIT
Farmland’s steady returns during recessions have led to overall superior risk-adjusted returns
1. Standard deviation and sharpe ratio calculated with Q1 year-over-year total return data for the 25-year period from 1997-2021
0
500
1000
1500
2000
1994 1999 2004 2009 2014 2019
Indexed Total Returns(1994=100)
RecessionNCREIF Farmland IndexS&P 500Bloomberg Barclays U.S. Corp Bond IndexNAREIT Major Sector Average
5.8% 7.5%
21.9%
30.9%
BloombergBarclays
U.S. CorpBond Index
NCREIFFarmland
Index
S&P 500 NAREITMajorSector
Average
Standard Deviation1
1.2
0.60.4 0.4
NCREIFFarmland
Index
BloombergBarclays
U.S. CorpBond Index
S&P 500 NAREITMajorSector
Average
Sharpe Ratio1
Farmlan
d Part
ners
Inc.
12This Primer was produced by Green Street’s Advisory Group and commissioned by Farmland Partners.
This is not a Research Report. Please see the last slide for additional disclosure.
www.greenstreet.com
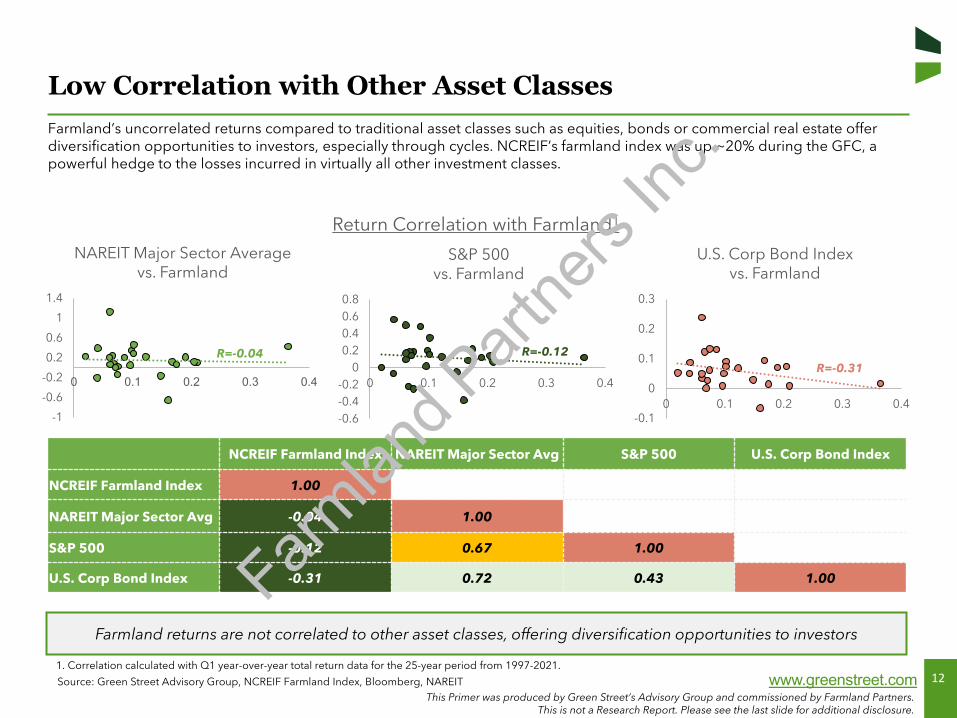
Low Correlation with Other Asset ClassesFarmland’s uncorrelated returns compared to traditional asset classes such as equities, bonds or commercial real estate offerdiversification opportunities to investors, especially through cycles. NCREIF’s farmland index was up ~20% during the GFC, a powerful hedge to the losses incurred in virtually all other investment classes.
Source: Green Street Advisory Group, NCREIF Farmland Index, Bloomberg, NAREIT
Farmland returns are not correlated to other asset classes, offering diversification opportunities to investors
-0.1
0
0.1
0.2
0.3
0 0.1 0.2 0.3 0.4
U.S. Corp Bond Indexvs. Farmland
-0.6-0.4-0.2
00.20.40.60.8
0 0.1 0.2 0.3 0.4
S&P 500vs. Farmland
-1
-0.6
-0.2
0.2
0.6
1
1.4
0 0.1 0.2 0.3 0.4
NAREIT Major Sector Averagevs. Farmland
NCREIF Farmland Index NAREIT Major Sector Avg S&P 500 U.S. Corp Bond Index
NCREIF Farmland Index 1.00
NAREIT Major Sector Avg -0.04 1.00
S&P 500 -0.12 0.67 1.00
U.S. Corp Bond Index -0.31 0.72 0.43 1.00
Return Correlation with Farmland1
R=-0.04 R=-0.12R=-0.31
1. Correlation calculated with Q1 year-over-year total return data for the 25-year period from 1997-2021.
Farmlan
d Part
ners
Inc.
13This Primer was produced by Green Street’s Advisory Group and commissioned by Farmland Partners.
This is not a Research Report. Please see the last slide for additional disclosure.
www.greenstreet.comSource: Green Street Advisory Group
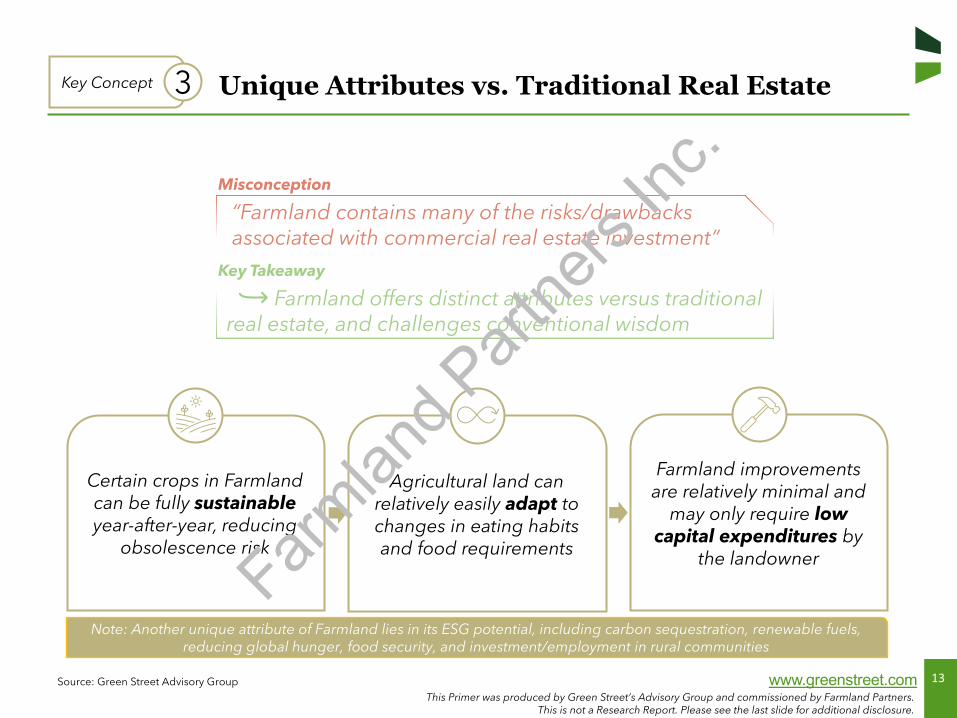
“Farmland contains many of the risks/drawbacks associated with commercial real estate investment”
Misconception
Unique Attributes vs. Traditional Real EstateKey Concept 3
Key Takeaway
Farmland offers distinct attributes versus traditional real estate, and challenges conventional wisdom
Certain crops in Farmland can be fully sustainable year-after-year, reducing
obsolescence risk
Agricultural land can relatively easily adapt to changes in eating habits and food requirements
Farmland improvements are relatively minimal and
may only require low capital expenditures by
the landowner
Note: Another unique attribute of Farmland lies in its ESG potential, including carbon sequestration, renewable fuels, reducing global hunger, food security, and investment/employment in rural communities
Farmlan
d Part
ners
Inc.
14This Primer was produced by Green Street’s Advisory Group and commissioned by Farmland Partners.
This is not a Research Report. Please see the last slide for additional disclosure.
www.greenstreet.com
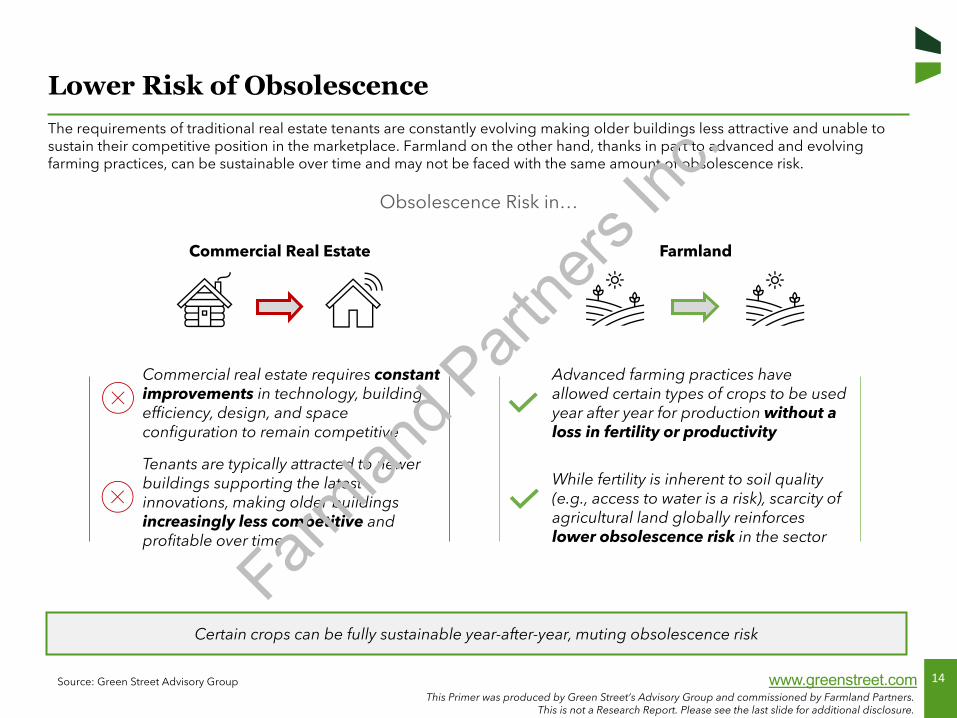
Lower Risk of ObsolescenceThe requirements of traditional real estate tenants are constantly evolving making older buildings less attractive and unable tosustain their competitive position in the marketplace. Farmland on the other hand, thanks in part to advanced and evolving farming practices, can be sustainable over time and may not be faced with the same amount of obsolescence risk.
Source: Green Street Advisory Group
Certain crops can be fully sustainable year-after-year, muting obsolescence risk
Commercial real estate requires constant improvements in technology, building efficiency, design, and space configuration to remain competitive
Tenants are typically attracted to newer buildings supporting the latest innovations, making older buildings increasingly less competitive and profitable over time
Advanced farming practices have allowed certain types of crops to be used year after year for production without a loss in fertility or productivity
Obsolescence Risk in…
Commercial Real Estate Farmland
While fertility is inherent to soil quality (e.g., access to water is a risk), scarcity of agricultural land globally reinforces lower obsolescence risk in the sector
Farmlan
d Part
ners
Inc.
15This Primer was produced by Green Street’s Advisory Group and commissioned by Farmland Partners.
This is not a Research Report. Please see the last slide for additional disclosure.
www.greenstreet.com
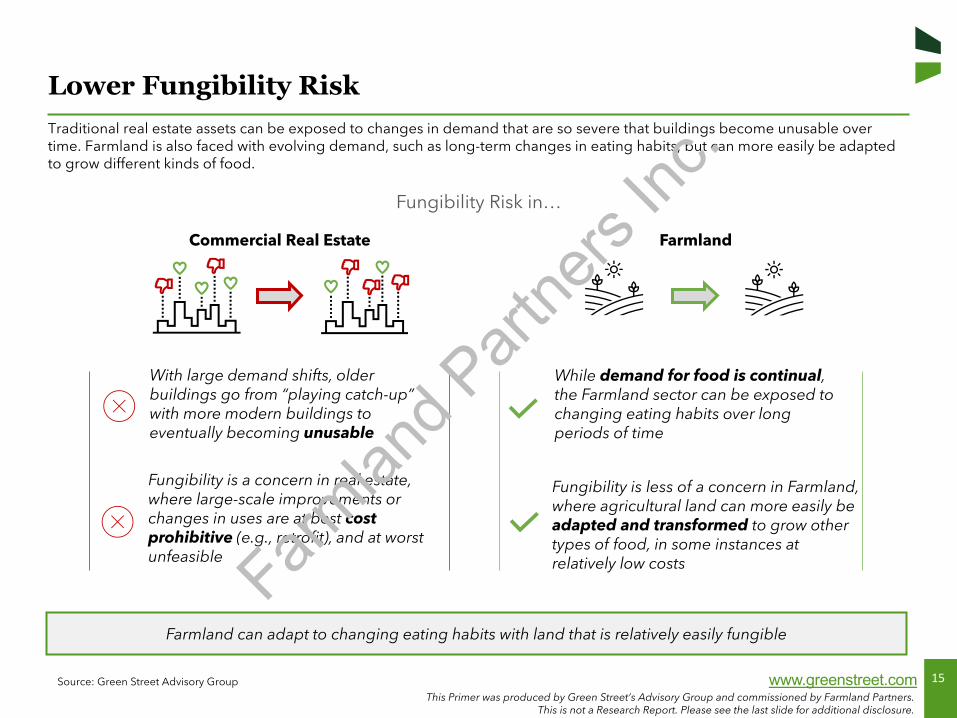
Lower Fungibility RiskTraditional real estate assets can be exposed to changes in demand that are so severe that buildings become unusable over time. Farmland is also faced with evolving demand, such as long-term changes in eating habits, but can more easily be adapted to grow different kinds of food.
Source: Green Street Advisory Group
Farmland can adapt to changing eating habits with land that is relatively easily fungible
With large demand shifts, older buildings go from “playing catch-up” with more modern buildings to eventually becoming unusable
Fungibility is a concern in real estate, where large-scale improvements or changes in uses are at best cost prohibitive (e.g., retrofit), and at worst unfeasible
While demand for food is continual, the Farmland sector can be exposed to changing eating habits over long periods of time
Fungibility is less of a concern in Farmland, where agricultural land can more easily be adapted and transformed to grow other types of food, in some instances at relatively low costs
Fungibility Risk in…
Commercial Real Estate Farmland
Farmlan
d Part
ners
Inc.
16This Primer was produced by Green Street’s Advisory Group and commissioned by Farmland Partners.
This is not a Research Report. Please see the last slide for additional disclosure.
www.greenstreet.com
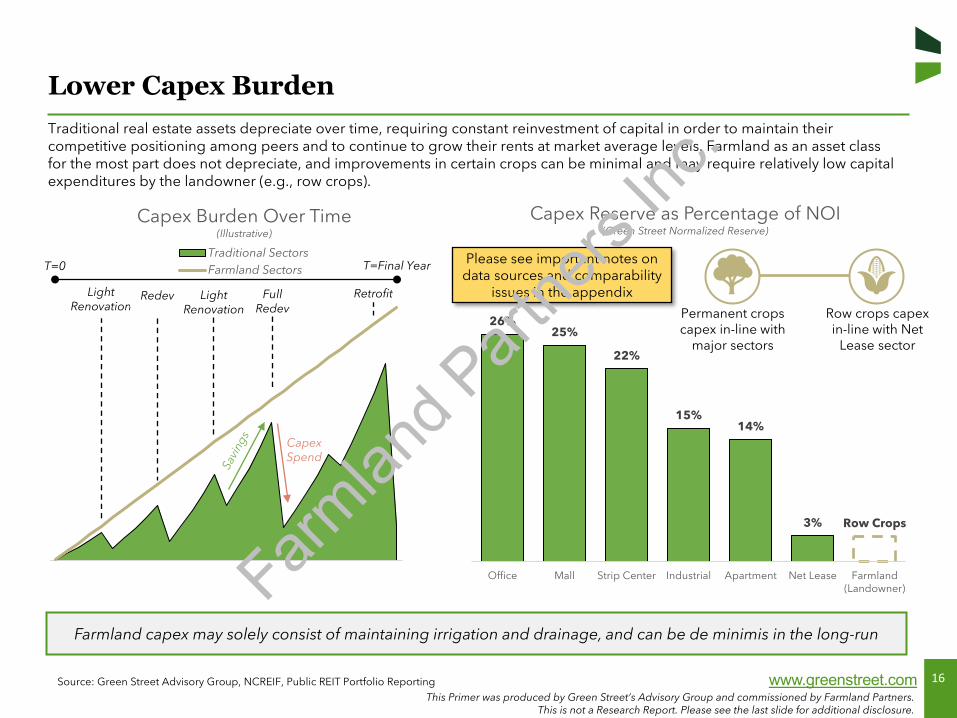
Lower Capex BurdenTraditional real estate assets depreciate over time, requiring constant reinvestment of capital in order to maintain their competitive positioning among peers and to continue to grow their rents at market average levels. Farmland as an asset class for the most part does not depreciate, and improvements in certain crops can be minimal and may require relatively low capital expenditures by the landowner (e.g., row crops).
Source: Green Street Advisory Group, NCREIF, Public REIT Portfolio Reporting
Farmland capex may solely consist of maintaining irrigation and drainage, and can be de minimis in the long-run
Capex Burden Over Time(Illustrative)
Traditional SectorsFarmland Sectors T=Final Year
Light Renovation
Full Redev
Capex Spend
T=0
26%25%
22%
15%14%
3% Row Crops
Office Mall Strip Center Industrial Apartment Net Lease Farmland(Landowner)
Capex Reserve as Percentage of NOI(Green Street Normalized Reserve)
Light Renovation
Redev Retrofit
Permanent crops capex in-line with
major sectors
Row crops capex in-line with Net
Lease sector
Please see important notes on data sources and comparability
issues in the appendix
Farmlan
d Part
ners
Inc.

17This Primer was produced by Green Street’s Advisory Group and commissioned by Farmland Partners.
This is not a Research Report. Please see the last slide for additional disclosure.
www.greenstreet.comSource: Green Street Advisory Group
“Demand growth in Farmland is sluggish”
Misconception
Attractive Supply and Demand DynamicsKey Concept 4
Key Takeaway
The combination of stable demand and shrinking supply has bolstered Farmland returns
As a basic need of humans and an essential
industry, food and agriculture have benefited from sustained demand
growth over the years
Sustained demand in the sector is combined with
shrinking supply of available agricultural land
both domestically and on a global basis
Farmland returns are part income, part appreciation,
providing an interesting combination of safety and
growth prospectsFarmlan
d Part
ners
Inc.
18This Primer was produced by Green Street’s Advisory Group and commissioned by Farmland Partners.
This is not a Research Report. Please see the last slide for additional disclosure.
www.greenstreet.com
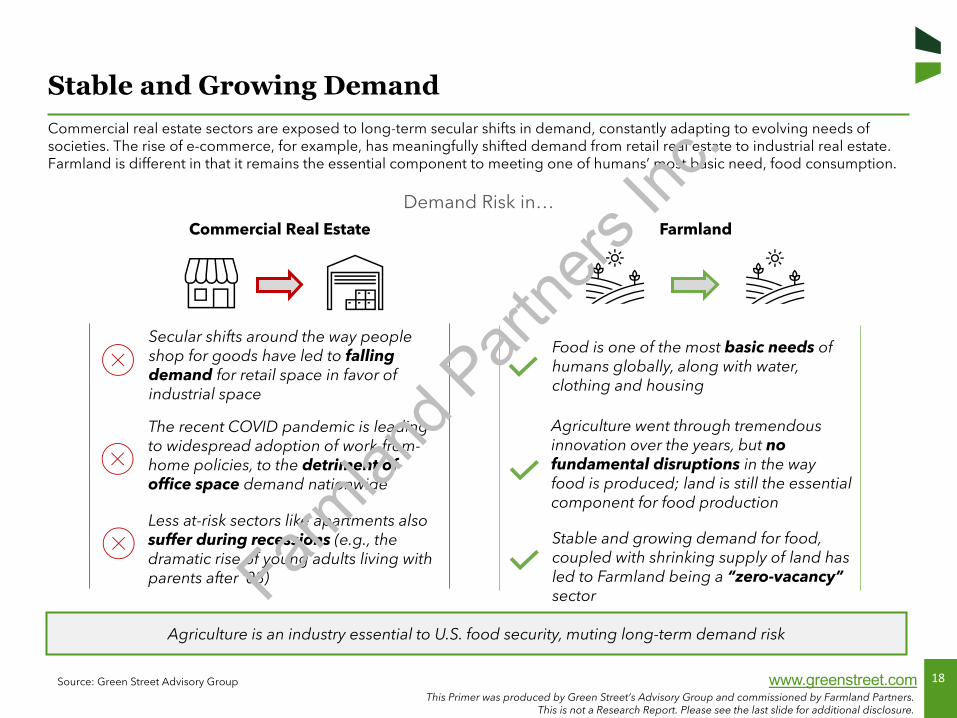
Stable and Growing Demand Commercial real estate sectors are exposed to long-term secular shifts in demand, constantly adapting to evolving needs of societies. The rise of e-commerce, for example, has meaningfully shifted demand from retail real estate to industrial real estate. Farmland is different in that it remains the essential component to meeting one of humans’ most basic need, food consumption.
Source: Green Street Advisory Group
Agriculture is an industry essential to U.S. food security, muting long-term demand risk
Secular shifts around the way people shop for goods have led to falling demand for retail space in favor of industrial space
The recent COVID pandemic is leading to widespread adoption of work-from-home policies, to the detriment of office space demand nationwide
Less at-risk sectors like apartments also suffer during recessions (e.g., the dramatic rise of young adults living with parents after ’08)
Food is one of the most basic needs of humans globally, along with water, clothing and housing
Agriculture went through tremendous innovation over the years, but no fundamental disruptions in the way food is produced; land is still the essential component for food production
Stable and growing demand for food, coupled with shrinking supply of land has led to Farmland being a “zero-vacancy” sector
Demand Risk in…Commercial Real Estate Farmland
Farmlan
d Part
ners
Inc.
19This Primer was produced by Green Street’s Advisory Group and commissioned by Farmland Partners.
This is not a Research Report. Please see the last slide for additional disclosure.
www.greenstreet.com
-3.0%
-2.5%
-2.0%
-1.5%
-1.0%
-0.5%
0.0%
1990 1995 2000 2005 2010 2015
Shrinking Supply in U.S. Agriculture(% Change of Arable Land Per Capita)
0.0%
0.5%
1.0%
1.5%
2.0%
2.5%
2001 2006 2011 2016 2021
Supply Growth in Traditional Real Estate(% Growth per Year)
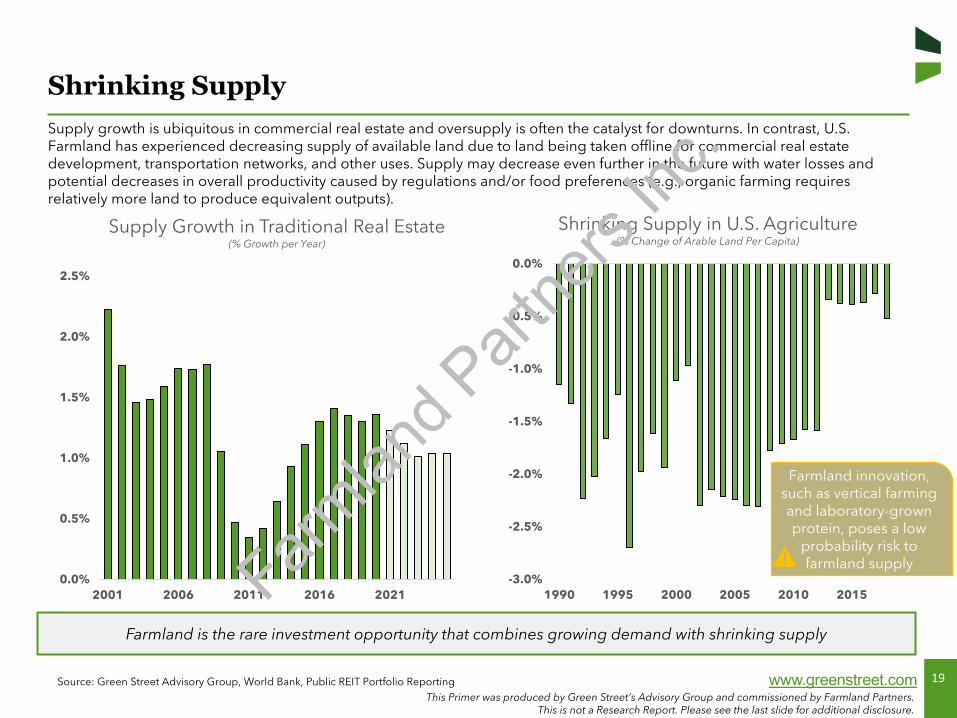
Shrinking SupplySupply growth is ubiquitous in commercial real estate and oversupply is often the catalyst for downturns. In contrast, U.S. Farmland has experienced decreasing supply of available land due to land being taken offline for commercial real estate development, transportation networks, and other uses. Supply may decrease even further in the future with water losses and potential decreases in overall productivity caused by regulations and/or food preferences (e.g., organic farming requires relatively more land to produce equivalent outputs).
Source: Green Street Advisory Group, World Bank, Public REIT Portfolio Reporting
Farmland is the rare investment opportunity that combines growing demand with shrinking supply
Farmland innovation, such as vertical farming and laboratory-grown protein, poses a low
probability risk to farmland supplyFarm
land P
artne
rs Inc
.
20This Primer was produced by Green Street’s Advisory Group and commissioned by Farmland Partners.
This is not a Research Report. Please see the last slide for additional disclosure.
www.greenstreet.com
-5%
0%
5%
10%
15%
20%
25%
30%
35%
1991 1996 2001 2006 2011 2016 2021*
NCREIF Farmland Index Total Returns
Income Return Capital Return
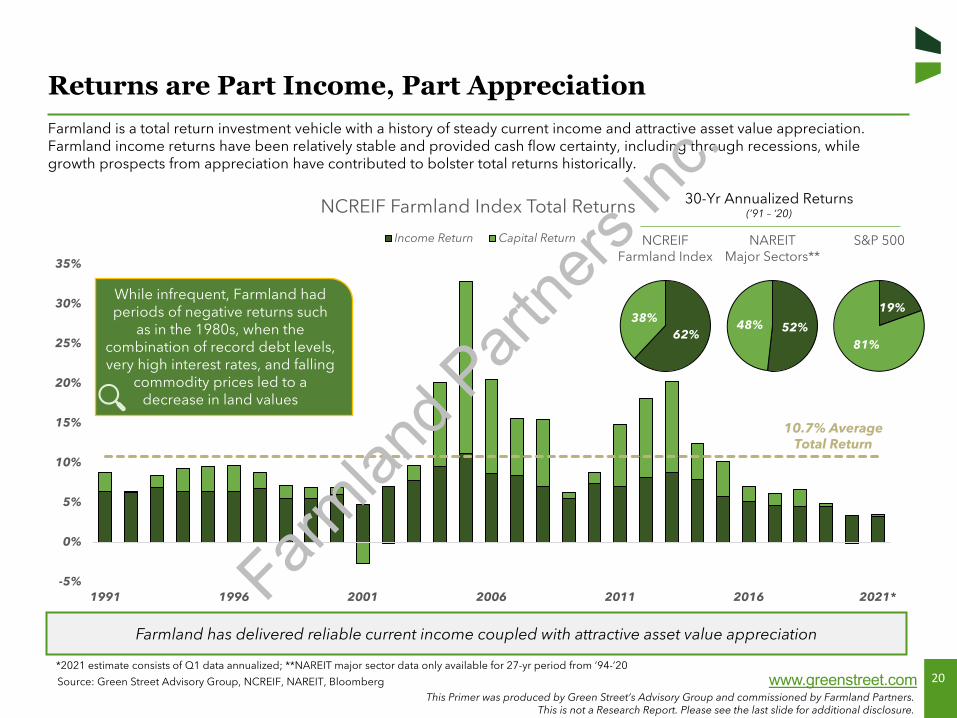
Returns are Part Income, Part AppreciationFarmland is a total return investment vehicle with a history of steady current income and attractive asset value appreciation. Farmland income returns have been relatively stable and provided cash flow certainty, including through recessions, while growth prospects from appreciation have contributed to bolster total returns historically.
Source: Green Street Advisory Group, NCREIF, NAREIT, Bloomberg
Farmland has delivered reliable current income coupled with attractive asset value appreciation
10.7% Average Total Return
While infrequent, Farmland had periods of negative returns such
as in the 1980s, when the combination of record debt levels, very high interest rates, and falling
commodity prices led to a decrease in land values
30-Yr Annualized Returns(’91 – ’20)
52%48%
NAREITMajor Sectors**
19%
81%
S&P 500
62%38%
NCREIFFarmland Index
*2021 estimate consists of Q1 data annualized; **NAREIT major sector data only available for 27-yr period from ’94-’20
Farmlan
d Part
ners
Inc.
21This Primer was produced by Green Street’s Advisory Group and commissioned by Farmland Partners.
This is not a Research Report. Please see the last slide for additional disclosure.
www.greenstreet.comSource: Green Street Advisory Group
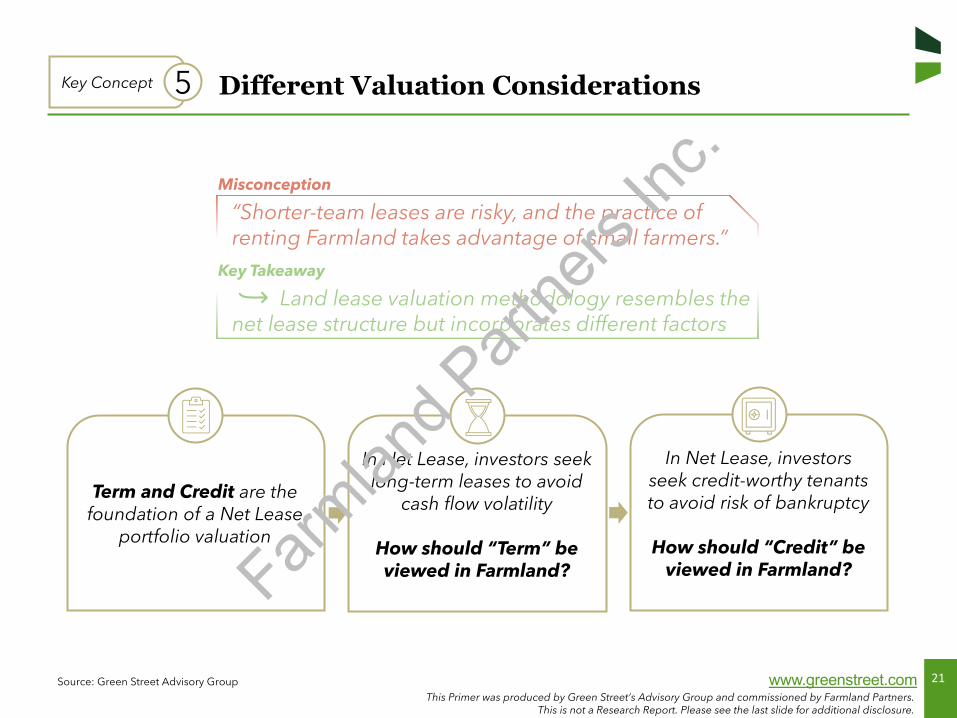
Different Valuation ConsiderationsKey Concept 5
Term and Credit are the foundation of a Net Lease
portfolio valuation
In Net Lease, investors seek long-term leases to avoid
cash flow volatility
How should “Term” be viewed in Farmland?
In Net Lease, investors seek credit-worthy tenants to avoid risk of bankruptcy
How should “Credit” be viewed in Farmland?
“Shorter-team leases are risky, and the practice of renting Farmland takes advantage of small farmers.”
Misconception
Key Takeaway
Land lease valuation methodology resembles the net lease structure but incorporates different factors
Farmlan
d Part
ners
Inc.
22This Primer was produced by Green Street’s Advisory Group and commissioned by Farmland Partners.
This is not a Research Report. Please see the last slide for additional disclosure.
www.greenstreet.com
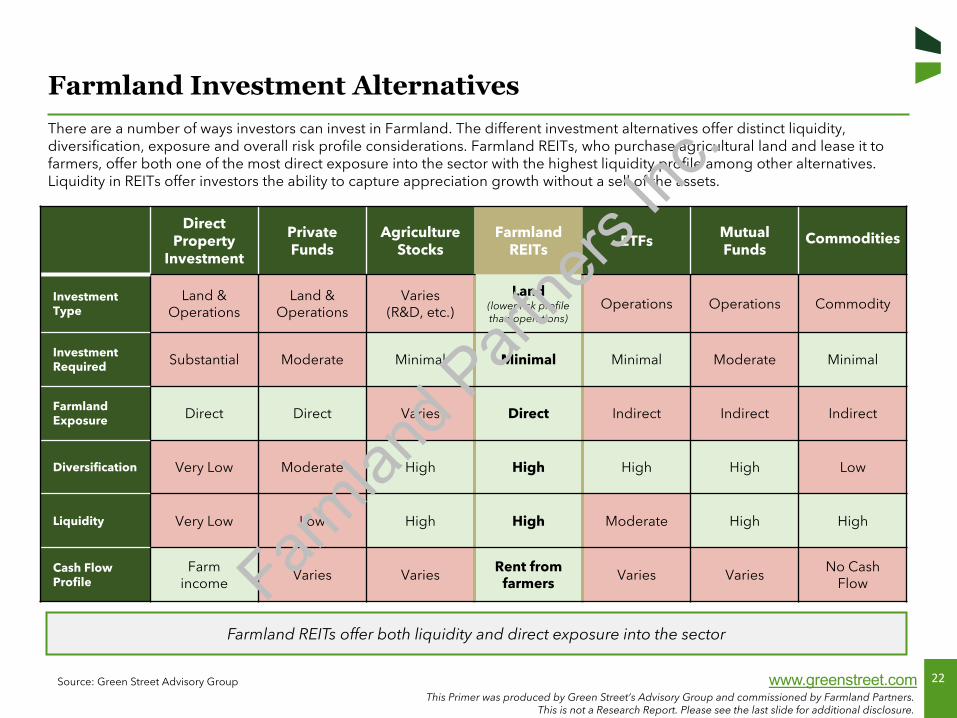
Farmland Investment AlternativesThere are a number of ways investors can invest in Farmland. The different investment alternatives offer distinct liquidity, diversification, exposure and overall risk profile considerations. Farmland REITs, who purchase agricultural land and lease it to farmers, offer both one of the most direct exposure into the sector with the highest liquidity profile among other alternatives.Liquidity in REITs offer investors the ability to capture appreciation growth without a sell of the assets.
Source: Green Street Advisory Group
Farmland REITs offer both liquidity and direct exposure into the sector
Direct Property
Investment
Private Funds
Agriculture Stocks
Farmland REITs ETFs Mutual
Funds
Investment Type
Land & Operations
Land & Operations
Varies (R&D, etc.)
Land(lower risk profile than operations)
Operations Operations Commodity
Investment Required Substantial Moderate Minimal Minimal Minimal Moderate Minimal
Farmland Exposure Direct Direct Varies Direct Indirect Indirect Indirect
Diversification Very Low Moderate High High High High Low
Liquidity Very Low Low High High Moderate High High
Cash Flow Profile
Farm income
Varies VariesRent from
farmers Varies VariesNo Cash
Flow
Commodities
Farmlan
d Part
ners
Inc.

23This Primer was produced by Green Street’s Advisory Group and commissioned by Farmland Partners.
This is not a Research Report. Please see the last slide for additional disclosure.
www.greenstreet.com
Term ConsiderationsLong-term leases in the Net Lease sector are a prerequisite to achieve dependable long-term cash flows, especially in a sector prone to disruptions (e.g., retail). As a “zero-vacancy” sector, cash flow interruption in Farmland is less of a concern, especially since the demand for high-quality institutional properties has resulted in a “natural selection” of better skilled farmers operating the assets. Shorter-term leases in the sector can prove an effective tool to maximize cash flows over time.
Source: Green Street Advisory Group
In a “zero-vacancy” sector such as Farmland, shorter-term leases can serve to maximize rent obligations
Investment Goals
TermNet-Lease Farmland
Investment Hurdles
Investor Requirements
Investment Goals
Investment Hurdles
Investor Requirements
Provide long-term, stable and growing cash flows
Cash flow interruption, or growth disruption, from risk of property sitting vacant between tenants
Long-term leases (~10-20 years) to achieve dependable and consistent cash flows
Short-term leases (~3 years) can serve as an effective tool to achieve frequent repricing of rent
Provide long-term, stable and growing cash flows
As a “zero-vacancy” sector, cash flow interruption is less of a concern than cash flow maximization
Farmlan
d Part
ners
Inc.
24This Primer was produced by Green Street’s Advisory Group and commissioned by Farmland Partners.
This is not a Research Report. Please see the last slide for additional disclosure.
www.greenstreet.com
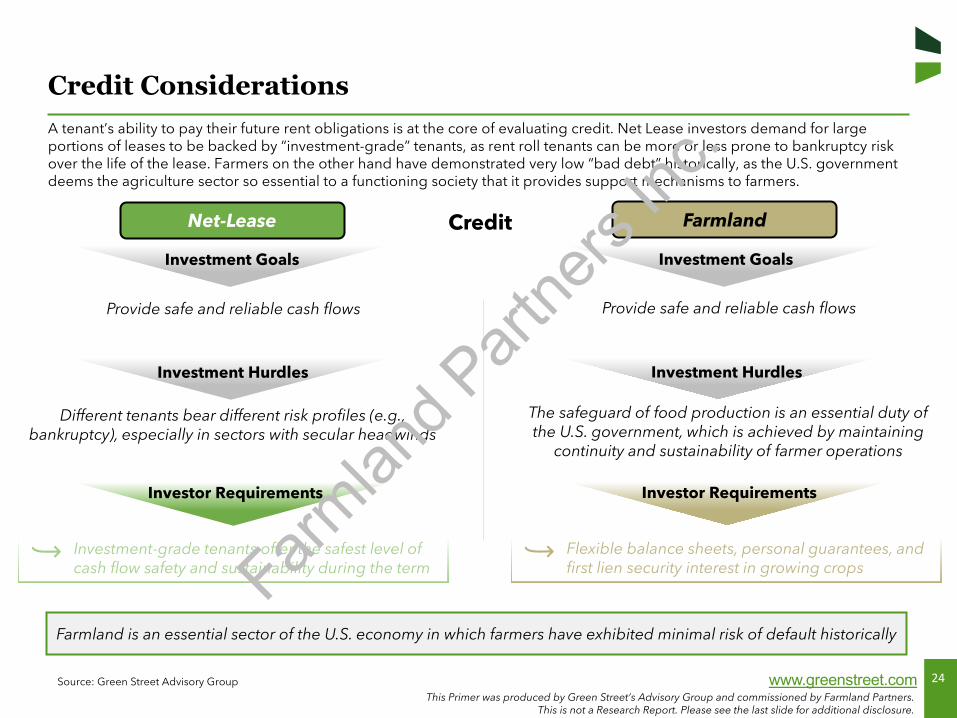
Credit ConsiderationsA tenant’s ability to pay their future rent obligations is at the core of evaluating credit. Net Lease investors demand for large portions of leases to be backed by “investment-grade” tenants, as rent roll tenants can be more or less prone to bankruptcy risk over the life of the lease. Farmers on the other hand have demonstrated very low “bad debt” historically, as the U.S. governmentdeems the agriculture sector so essential to a functioning society that it provides support mechanisms to farmers.
Source: Green Street Advisory Group
Farmland is an essential sector of the U.S. economy in which farmers have exhibited minimal risk of default historically
Investment Goals
CreditNet-Lease Farmland
Investment Hurdles
Investor Requirements
Investment Goals
Investment Hurdles
Investor Requirements
Provide safe and reliable cash flows
Different tenants bear different risk profiles (e.g., bankruptcy), especially in sectors with secular headwinds
Investment-grade tenants offer the safest level of cash flow safety and sustainability during the term
Flexible balance sheets, personal guarantees, and first lien security interest in growing crops
Provide safe and reliable cash flows
The safeguard of food production is an essential duty of the U.S. government, which is achieved by maintaining
continuity and sustainability of farmer operations
Farmlan
d Part
ners
Inc.
25This Primer was produced by Green Street’s Advisory Group and commissioned by Farmland Partners.
This is not a Research Report. Please see the last slide for additional disclosure.
www.greenstreet.com
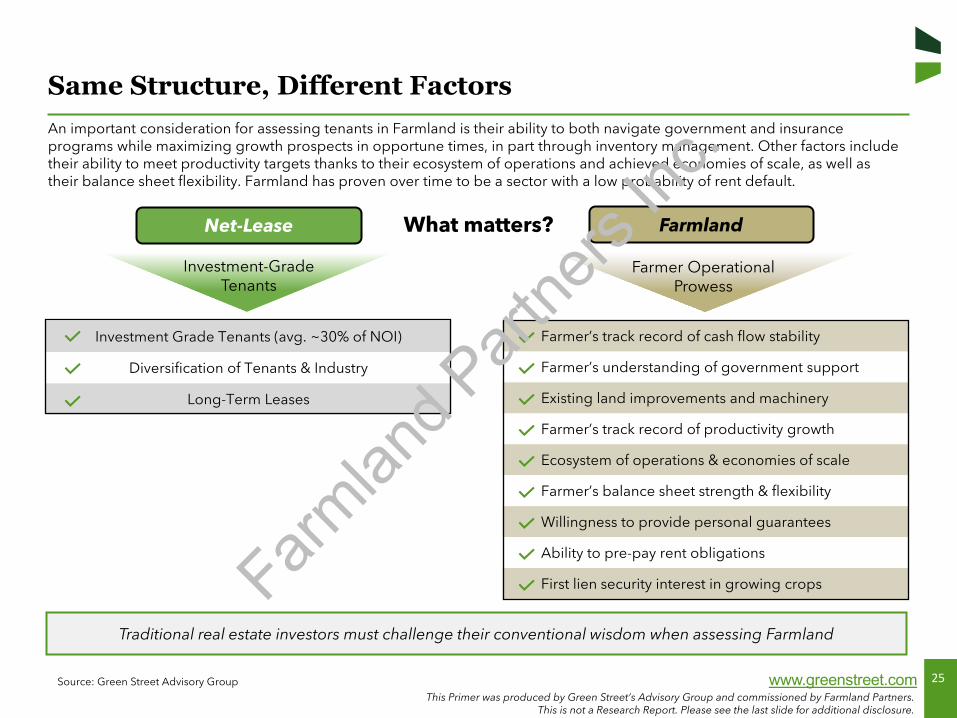
Farmer’s track record of cash flow stability
Farmer’s understanding of government support
Existing land improvements and machinery
Farmer’s track record of productivity growth
Ecosystem of operations & economies of scale
Farmer’s balance sheet strength & flexibility
Willingness to provide personal guarantees
Ability to pre-pay rent obligations
First lien security interest in growing crops
Same Structure, Different FactorsAn important consideration for assessing tenants in Farmland is their ability to both navigate government and insurance programs while maximizing growth prospects in opportune times, in part through inventory management. Other factors include their ability to meet productivity targets thanks to their ecosystem of operations and achieved economies of scale, as well as their balance sheet flexibility. Farmland has proven over time to be a sector with a low probability of rent default.
Source: Green Street Advisory Group
Farmer OperationalProwess
Investment-GradeTenants
Investment Grade Tenants (avg. ~30% of NOI)
Diversification of Tenants & Industry
Long-Term Leases
What matters?Net-Lease Farmland
Traditional real estate investors must challenge their conventional wisdom when assessing Farmland
Farmlan
d Part
ners
Inc.
26This Primer was produced by Green Street’s Advisory Group and commissioned by Farmland Partners.
This is not a Research Report. Please see the last slide for additional disclosure.
www.greenstreet.com
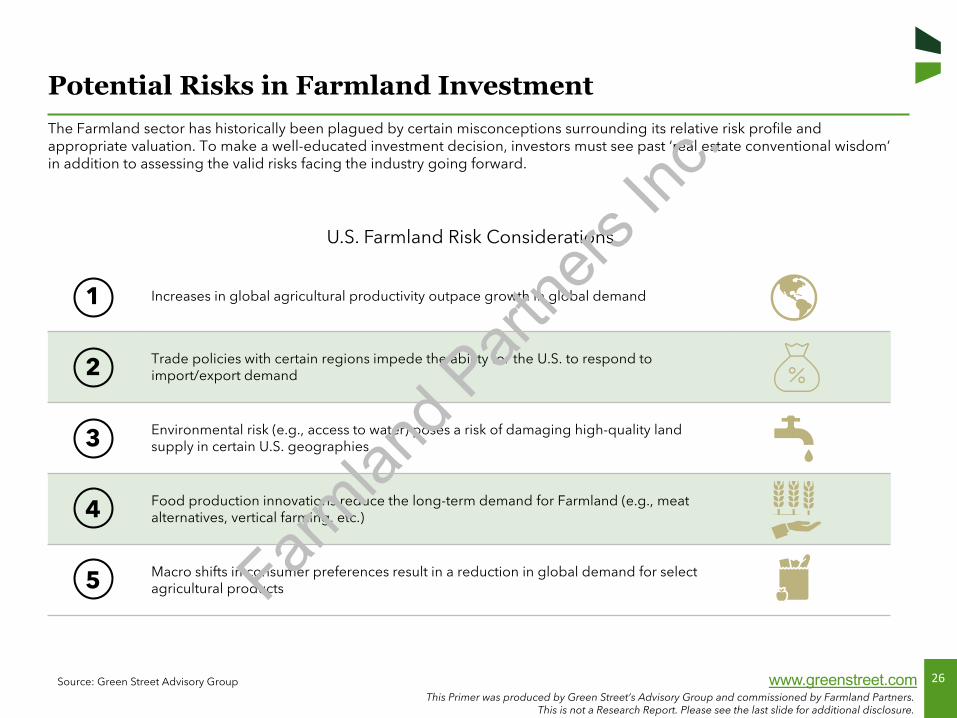
1 Increases in global agricultural productivity outpace growth in global demand
2 Trade policies with certain regions impede the ability for the U.S. to respond to import/export demand
3 Environmental risk (e.g., access to water) poses a risk of damaging high-quality land supply in certain U.S. geographies
4 Food production innovations reduce the long-term demand for Farmland (e.g., meat alternatives, vertical farming, etc.)
5 Macro shifts in consumer preferences result in a reduction in global demand for select agricultural products
Potential Risks in Farmland InvestmentThe Farmland sector has historically been plagued by certain misconceptions surrounding its relative risk profile and appropriate valuation. To make a well-educated investment decision, investors must see past ‘real estate conventional wisdom’ in addition to assessing the valid risks facing the industry going forward.
Source: Green Street Advisory Group
U.S. Farmland Risk Considerations
Farmlan
d Part
ners
Inc.

27
Understanding Farmland -Macro Demand Drivers
Section III
Farmlan
d Part
ners
Inc.

28This Primer was produced by Green Street’s Advisory Group and commissioned by Farmland Partners.
This is not a Research Report. Please see the last slide for additional disclosure.
www.greenstreet.com
Macro Demand Drivers: Introduction
Source: Green Street Advisory Group
Demand for food in the U.S. and globally is increasing at a steady pace, while available agricultural land per capita is shrinking
Farmland Supply/Demand Dynamic Outlook is Favorable
Most of the growing population stems from less developed countries, where both caloric intake and import dependence are on the rise
U.S. Farmland Is Well Positioned to Capture Incremental Demand
Farmland’s attractive supply/demand dynamic can offer a combination of income stability and growth prospects to landowners through cycles
Growing wealth and changing eating habits are also bolstering demand. Food is a basic necessity that provides downside protection to the sector
U.S. agriculture is one of the most productive in the world, averaging outputs that are 2.0x that of other developed countries on a per unit of land basis
High productivity means better cost efficiency. The U.S. is very competitiveon a global scale and is a net exporter of corn and soybeans
The U.S. superior yields, stemming from good soil, technology advancements, and best-in-class farming operations, is well positioned to capitalize on domestic and global growth
Farmlan
d Part
ners
Inc.

29This Primer was produced by Green Street’s Advisory Group and commissioned by Farmland Partners.
This is not a Research Report. Please see the last slide for additional disclosure.
www.greenstreet.com
U.S. Agriculture Regional LandscapeThe U.S. is one of the most productive and valuable agricultural regions in the world with an estimated $2.7 trillion1 in Farmland spread throughout nine economic regions. Farmland has historically been owned and operated by family farms, but changing demographics coupled with farmers and other landowners’ increasing desires to free up some of their capital base have created an opportunity for outside investors.
Source: Green Street Advisory Group, ERS USDA, FAO
Agriculture in the U.S.
1. Total value does not include Alaska or Hawaii.
The bulk of U.S. agriculture value is concentrated in the Central and West Coast/Florida regions
Region % of Cropland
% of Production
Value
Heartland 27% 23%
Northern Great Plains 17% 6%
Prairie Gateway 17% 12%
Northern Crescent 9% 15%
Fruitful Rim 8% 22%
Southern Seaboard 6% 9%
Eastern Uplands 6% 5%
Mississippi Portal 5% 4%
Basin and Range 4% 4%Farmlan
d Part
ners
Inc.
30This Primer was produced by Green Street’s Advisory Group and commissioned by Farmland Partners.
This is not a Research Report. Please see the last slide for additional disclosure.
www.greenstreet.com
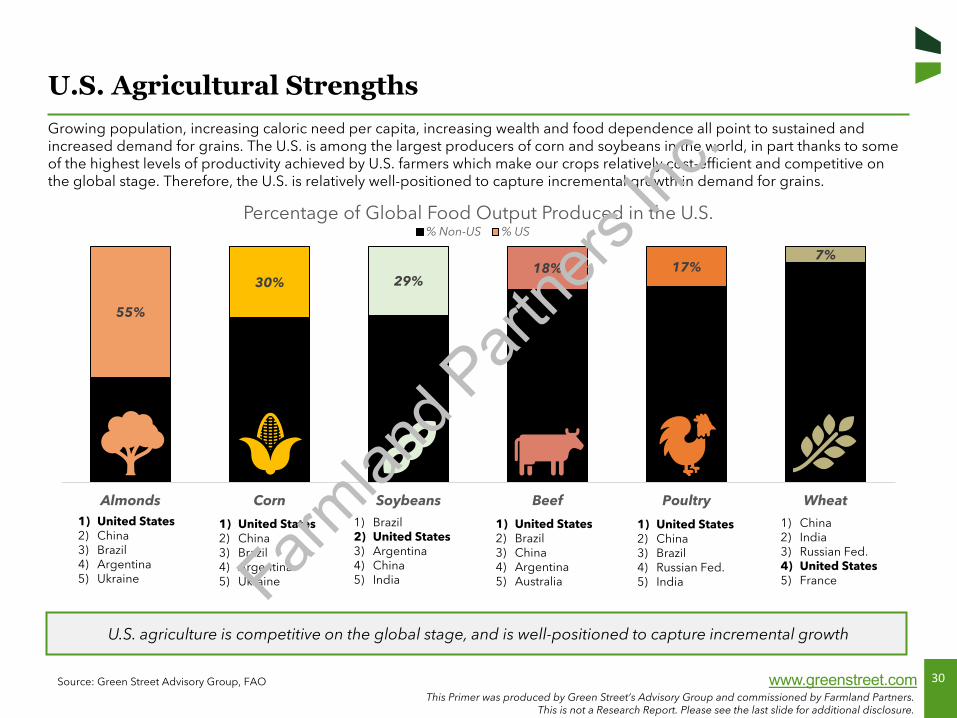
55%
30% 29%18% 17%
7%
Almonds Corn Soybeans Beef Poultry Wheat
Percentage of Global Food Output Produced in the U.S. % Non-US % US
U.S. Agricultural StrengthsGrowing population, increasing caloric need per capita, increasing wealth and food dependence all point to sustained and increased demand for grains. The U.S. is among the largest producers of corn and soybeans in the world, in part thanks to some of the highest levels of productivity achieved by U.S. farmers which make our crops relatively cost-efficient and competitive onthe global stage. Therefore, the U.S. is relatively well-positioned to capture incremental growth in demand for grains.
Source: Green Street Advisory Group, FAO
U.S. agriculture is competitive on the global stage, and is well-positioned to capture incremental growth
1) United States2) China3) Brazil4) Argentina5) Ukraine
1) Brazil2) United States3) Argentina4) China5) India
1) China2) India3) Russian Fed.4) United States5) France
1) United States2) Brazil3) China4) Argentina5) Australia
1) United States2) China3) Brazil4) Russian Fed.5) India
1) United States2) China3) Brazil4) Argentina5) Ukraine Farm
land P
artne
rs Inc
.
31This Primer was produced by Green Street’s Advisory Group and commissioned by Farmland Partners.
This is not a Research Report. Please see the last slide for additional disclosure.
www.greenstreet.com
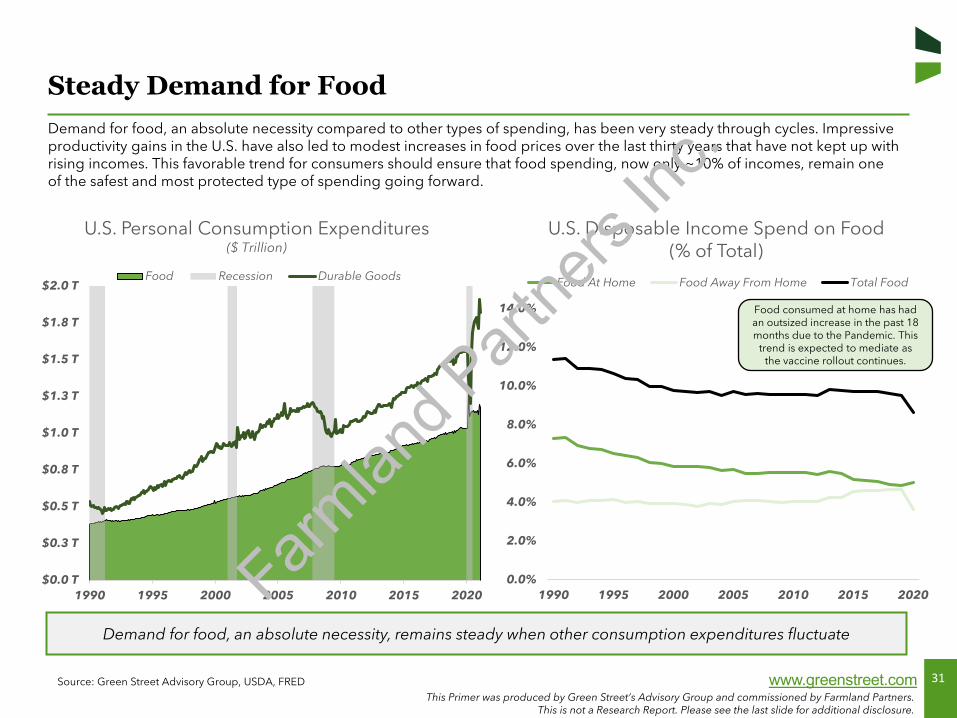
0.0%
2.0%
4.0%
6.0%
8.0%
10.0%
12.0%
14.0%
1990 1995 2000 2005 2010 2015 2020
U.S. Disposable Income Spend on Food(% of Total)
Food At Home Food Away From Home Total Food
Steady Demand for FoodDemand for food, an absolute necessity compared to other types of spending, has been very steady through cycles. Impressive productivity gains in the U.S. have also led to modest increases in food prices over the last thirty years that have not kept up with rising incomes. This favorable trend for consumers should ensure that food spending, now only ~10% of incomes, remain one of the safest and most protected type of spending going forward.
Source: Green Street Advisory Group, USDA, FRED
Demand for food, an absolute necessity, remains steady when other consumption expenditures fluctuate
$0.0 T
$0.3 T
$0.5 T
$0.8 T
$1.0 T
$1.3 T
$1.5 T
$1.8 T
$2.0 T
1990 1995 2000 2005 2010 2015 2020
U.S. Personal Consumption Expenditures($ Trillion)
Food Recession Durable Goods
Food consumed at home has had an outsized increase in the past 18 months due to the Pandemic. This
trend is expected to mediate as the vaccine rollout continues.
Farmlan
d Part
ners
Inc.
32This Primer was produced by Green Street’s Advisory Group and commissioned by Farmland Partners.
This is not a Research Report. Please see the last slide for additional disclosure.
www.greenstreet.com
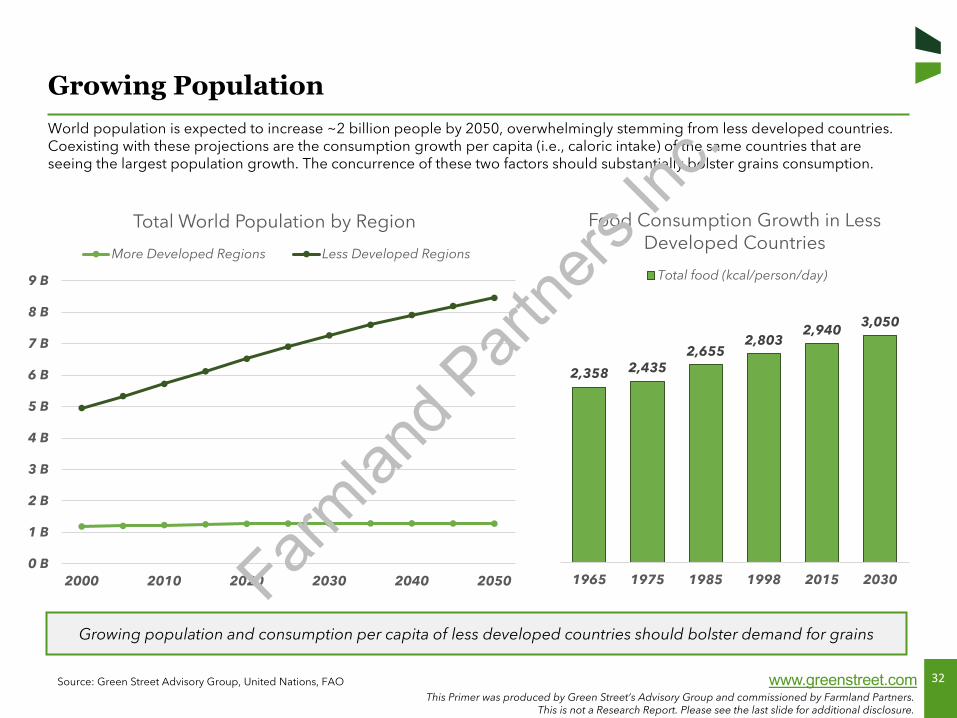
Growing PopulationWorld population is expected to increase ~2 billion people by 2050, overwhelmingly stemming from less developed countries. Coexisting with these projections are the consumption growth per capita (i.e., caloric intake) of the same countries that areseeing the largest population growth. The concurrence of these two factors should substantially bolster grains consumption.
Source: Green Street Advisory Group, United Nations, FAO
Growing population and consumption per capita of less developed countries should bolster demand for grains
0 B
1 B
2 B
3 B
4 B
5 B
6 B
7 B
8 B
9 B
2000 2010 2020 2030 2040 2050
Total World Population by Region
More Developed Regions Less Developed Regions
2,358 2,4352,655
2,8032,940
3,050
1965 1975 1985 1998 2015 2030
Food Consumption Growth in Less Developed Countries
Total food (kcal/person/day)
Farmlan
d Part
ners
Inc.
33This Primer was produced by Green Street’s Advisory Group and commissioned by Farmland Partners.
This is not a Research Report. Please see the last slide for additional disclosure.
www.greenstreet.com
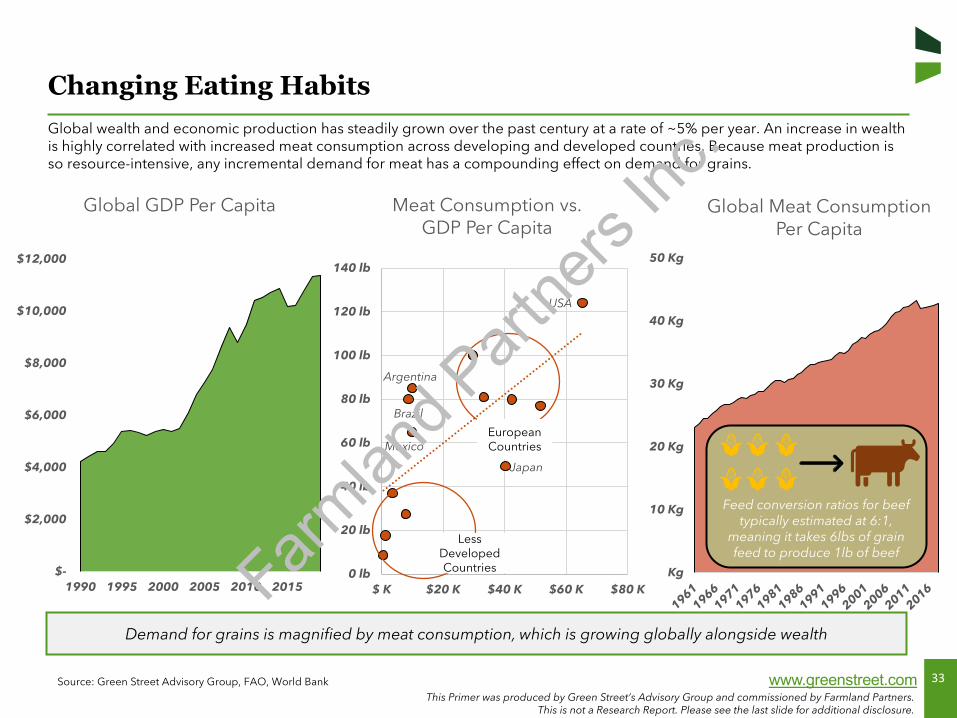
Changing Eating HabitsGlobal wealth and economic production has steadily grown over the past century at a rate of ~5% per year. An increase in wealth is highly correlated with increased meat consumption across developing and developed countries. Because meat production is so resource-intensive, any incremental demand for meat has a compounding effect on demand for grains.
Source: Green Street Advisory Group, FAO, World Bank
Demand for grains is magnified by meat consumption, which is growing globally alongside wealth
$-
$2,000
$4,000
$6,000
$8,000
$10,000
$12,000
1990 1995 2000 2005 2010 2015
Global GDP Per Capita
Kg
10 Kg
20 Kg
30 Kg
40 Kg
50 Kg
Global Meat Consumption Per Capita
Feed conversion ratios for beef typically estimated at 6:1,
meaning it takes 6lbs of grain feed to produce 1lb of beef
Argentina
Brazil
Japan
Mexico
USA
0 lb
20 lb
40 lb
60 lb
80 lb
100 lb
120 lb
140 lb
$ K $20 K $40 K $60 K $80 K
Meat Consumption vs.GDP Per Capita
Less Developed Countries
EuropeanCountries
Farmlan
d Part
ners
Inc.
34This Primer was produced by Green Street’s Advisory Group and commissioned by Farmland Partners.
This is not a Research Report. Please see the last slide for additional disclosure.
www.greenstreet.com
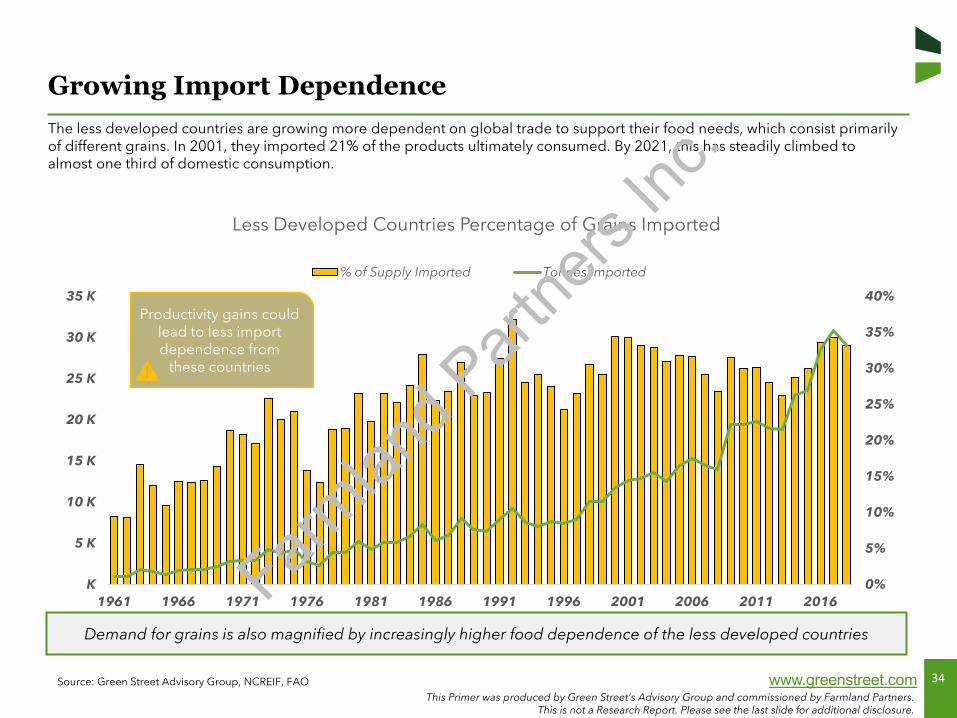
Growing Import DependenceThe less developed countries are growing more dependent on global trade to support their food needs, which consist primarily of different grains. In 2001, they imported 21% of the products ultimately consumed. By 2021, this has steadily climbed to almost one third of domestic consumption.
Source: Green Street Advisory Group, NCREIF, FAO
Demand for grains is also magnified by increasingly higher food dependence of the less developed countries
0%
5%
10%
15%
20%
25%
30%
35%
40%
K
5 K
10 K
15 K
20 K
25 K
30 K
35 K
1961 1966 1971 1976 1981 1986 1991 1996 2001 2006 2011 2016
Less Developed Countries Percentage of Grains Imported
% of Supply Imported Tonnes Imported
Productivity gains could lead to less import dependence from
these countries
Farmlan
d Part
ners
Inc.

35This Primer was produced by Green Street’s Advisory Group and commissioned by Farmland Partners.
This is not a Research Report. Please see the last slide for additional disclosure.
www.greenstreet.com
Global Food DependenceFood is a major element of trade around the world. Certain countries like the U.S. are net exporters of food, as they benefit from land that is naturally conducive to agriculture (soil type, climate, etc.) and advanced transportation networks, along with employing advanced agricultural techniques. The growing population and demand in less developed countries is not met with adequate supply locally, leading to a number of these countries relying on import of food from countries like the U.S.
Source: Green Street Advisory Group, UN’s Food & Agriculture Organization Global Perspectives Studies, FAO
The less developed countries, needing more and more grains, are relying on other countries to feed their population
Food Dependence(Trade as a share of domestic food supply)
Net importer
Net exporter0% 20% >50%
1.2
0.5
0.3
0.1
0.1
0.1
Australia
United States
Brazil
Least developedcountries
India
China
Arable Land Per Capita (Hectares) Import/Export is a
function of food dependence but also
trade policies and other regulations
Farmlan
d Part
ners
Inc.
36This Primer was produced by Green Street’s Advisory Group and commissioned by Farmland Partners.
This is not a Research Report. Please see the last slide for additional disclosure.
www.greenstreet.com
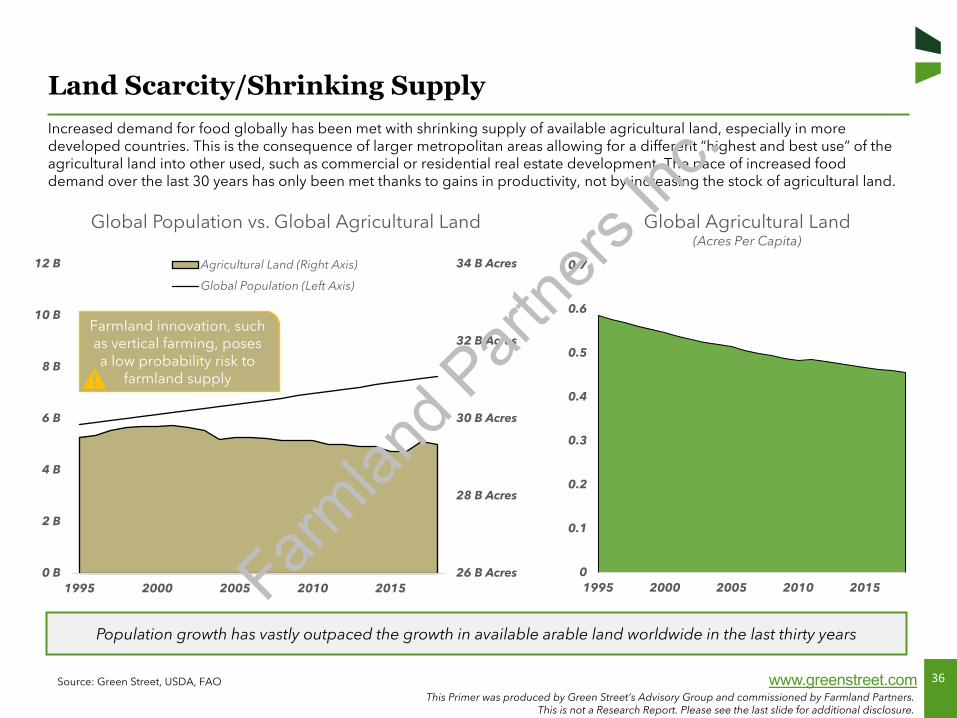
Land Scarcity/Shrinking SupplyIncreased demand for food globally has been met with shrinking supply of available agricultural land, especially in more developed countries. This is the consequence of larger metropolitan areas allowing for a different “highest and best use” of theagricultural land into other used, such as commercial or residential real estate development. The pace of increased food demand over the last 30 years has only been met thanks to gains in productivity, not by increasing the stock of agricultural land.
Source: Green Street, USDA, FAO
Population growth has vastly outpaced the growth in available arable land worldwide in the last thirty years
26 B Acres
28 B Acres
30 B Acres
32 B Acres
34 B Acres
0 B
2 B
4 B
6 B
8 B
10 B
12 B
1995 2000 2005 2010 2015
Global Population vs. Global Agricultural Land
Agricultural Land (Right Axis)
Global Population (Left Axis)
0
0.1
0.2
0.3
0.4
0.5
0.6
0.7
1995 2000 2005 2010 2015
Global Agricultural Land (Acres Per Capita)
Farmland innovation, such as vertical farming, poses a low probability risk to
farmland supply
Farmlan
d Part
ners
Inc.
37This Primer was produced by Green Street’s Advisory Group and commissioned by Farmland Partners.
This is not a Research Report. Please see the last slide for additional disclosure.
www.greenstreet.com
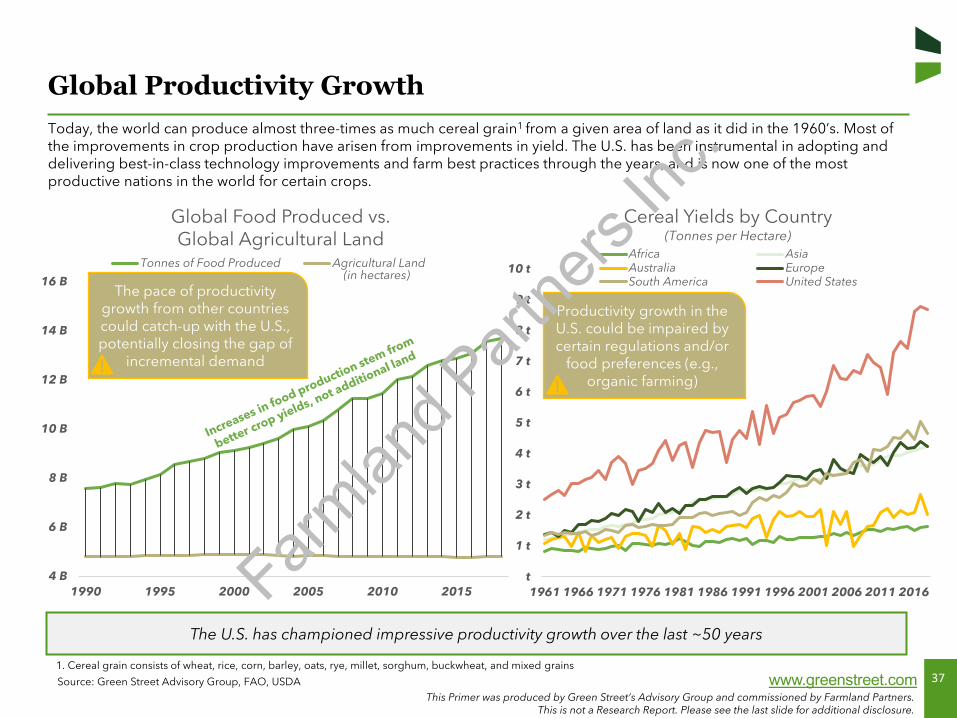
Global Productivity GrowthToday, the world can produce almost three-times as much cereal grain1 from a given area of land as it did in the 1960’s. Most of the improvements in crop production have arisen from improvements in yield. The U.S. has been instrumental in adopting and delivering best-in-class technology improvements and farm best practices through the years, and is now one of the most productive nations in the world for certain crops.
Source: Green Street Advisory Group, FAO, USDA
The U.S. has championed impressive productivity growth over the last ~50 years
4 B
6 B
8 B
10 B
12 B
14 B
16 B
1990 1995 2000 2005 2010 2015
Global Food Produced vs.Global Agricultural Land
Tonnes of Food Produced Agricultural Land
t
1 t
2 t
3 t
4 t
5 t
6 t
7 t
8 t
9 t
10 t
1961 1966 1971 1976 1981 1986 1991 1996 2001 2006 2011 2016
Cereal Yields by Country(Tonnes per Hectare)
Africa AsiaAustralia EuropeSouth America United States
1. Cereal grain consists of wheat, rice, corn, barley, oats, rye, millet, sorghum, buckwheat, and mixed grains
The pace of productivity growth from other countries could catch-up with the U.S., potentially closing the gap of
incremental demand
(in hectares)
Productivity growth in the U.S. could be impaired by certain regulations and/or
food preferences (e.g., organic farming)
Farmlan
d Part
ners
Inc.
38This Primer was produced by Green Street’s Advisory Group and commissioned by Farmland Partners.
This is not a Research Report. Please see the last slide for additional disclosure.
www.greenstreet.com
Geography Best-in-Class Operations
Technological Improvements
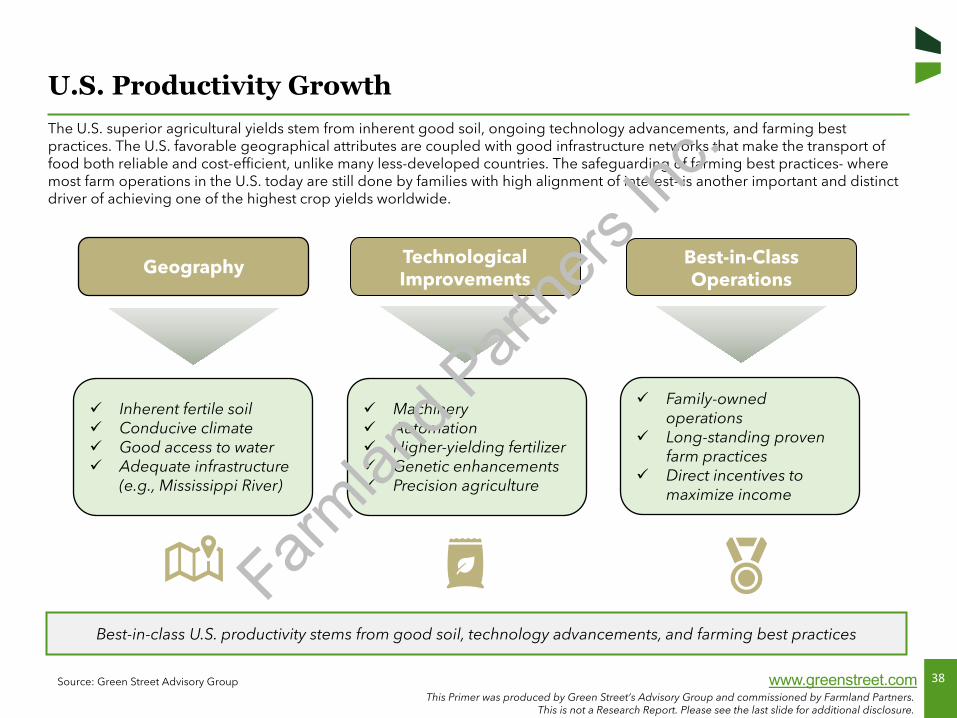
U.S. Productivity GrowthThe U.S. superior agricultural yields stem from inherent good soil, ongoing technology advancements, and farming best practices. The U.S. favorable geographical attributes are coupled with good infrastructure networks that make the transport of food both reliable and cost-efficient, unlike many less-developed countries. The safeguarding of farming best practices- where most farm operations in the U.S. today are still done by families with high alignment of interest- is another important and distinct driver of achieving one of the highest crop yields worldwide.
Source: Green Street Advisory Group
Best-in-class U.S. productivity stems from good soil, technology advancements, and farming best practices
Inherent fertile soil Conducive climate Good access to water Adequate infrastructure
(e.g., Mississippi River)
Machinery Automation Higher-yielding fertilizer Genetic enhancements Precision agriculture
Family-owned operations
Long-standing proven farm practices
Direct incentives to maximize income
Farmlan
d Part
ners
Inc.
39This Primer was produced by Green Street’s Advisory Group and commissioned by Farmland Partners.
This is not a Research Report. Please see the last slide for additional disclosure.
www.greenstreet.com
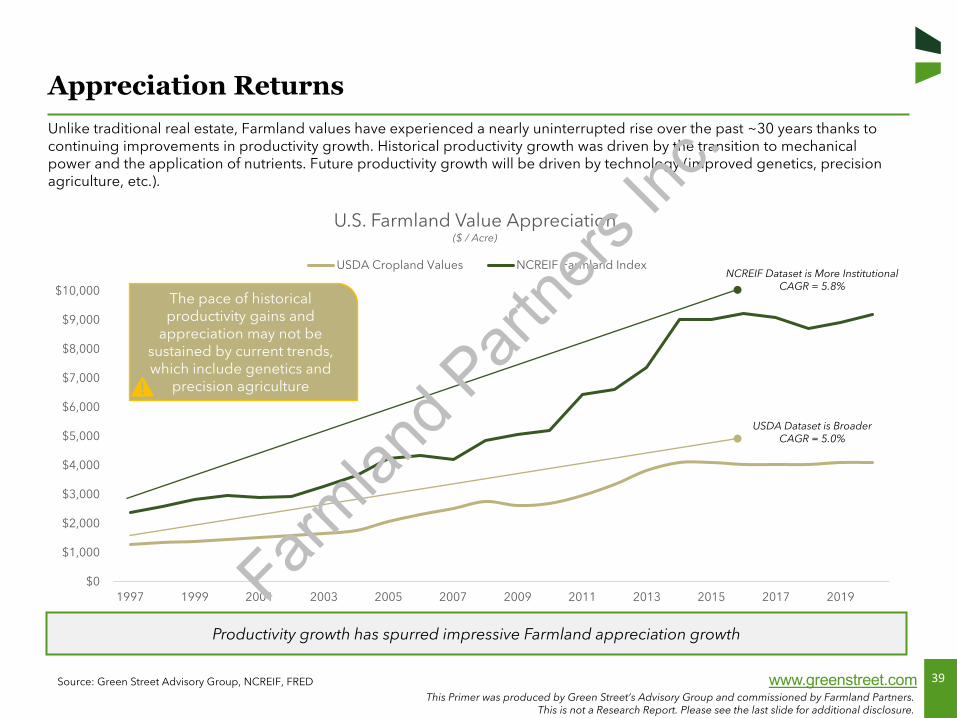
Appreciation ReturnsUnlike traditional real estate, Farmland values have experienced a nearly uninterrupted rise over the past ~30 years thanks to continuing improvements in productivity growth. Historical productivity growth was driven by the transition to mechanical power and the application of nutrients. Future productivity growth will be driven by technology (improved genetics, precisionagriculture, etc.).
Source: Green Street Advisory Group, NCREIF, FRED
Productivity growth has spurred impressive Farmland appreciation growth
$0
$1,000
$2,000
$3,000
$4,000
$5,000
$6,000
$7,000
$8,000
$9,000
$10,000
1997 1999 2001 2003 2005 2007 2009 2011 2013 2015 2017 2019
U.S. Farmland Value Appreciation($ / Acre)
USDA Cropland Values NCREIF Farmland Index
USDA Dataset is Broader CAGR = 5.0%
NCREIF Dataset is More InstitutionalCAGR = 5.8%
The pace of historical productivity gains and
appreciation may not be sustained by current trends, which include genetics and
precision agriculture
Farmlan
d Part
ners
Inc.
40This Primer was produced by Green Street’s Advisory Group and commissioned by Farmland Partners.
This is not a Research Report. Please see the last slide for additional disclosure.
www.greenstreet.com
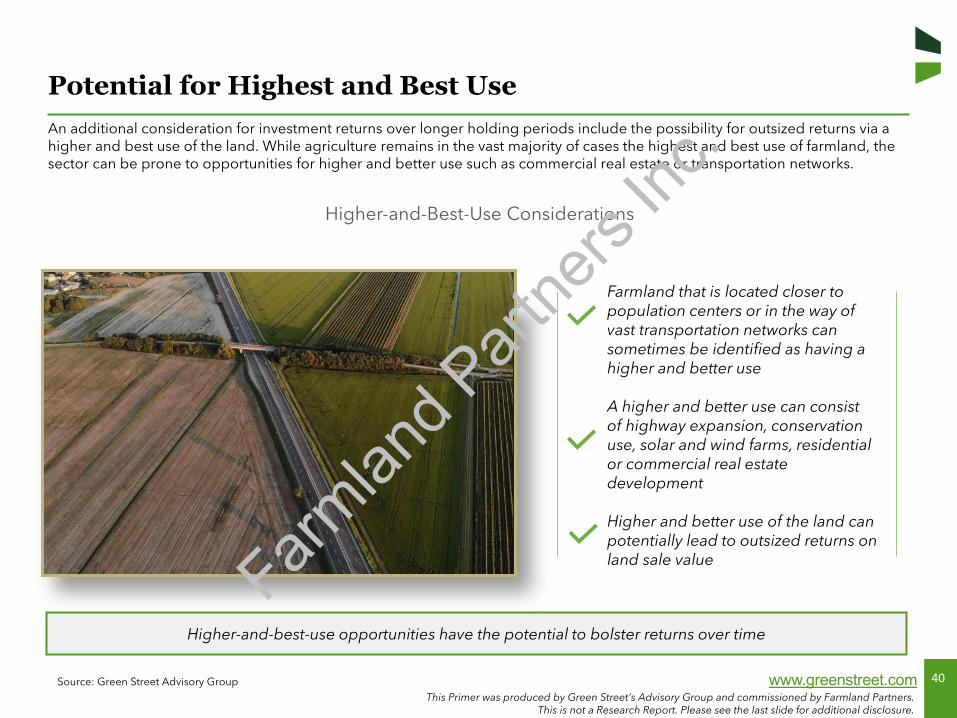
Potential for Highest and Best UseAn additional consideration for investment returns over longer holding periods include the possibility for outsized returns via a higher and best use of the land. While agriculture remains in the vast majority of cases the highest and best use of farmland, the sector can be prone to opportunities for higher and better use such as commercial real estate or transportation networks.
Source: Green Street Advisory Group
Higher-and-best-use opportunities have the potential to bolster returns over time
Farmland that is located closer to population centers or in the way of vast transportation networks can sometimes be identified as having a higher and better use
A higher and better use can consist of highway expansion, conservation use, solar and wind farms, residential or commercial real estate development
Higher and better use of the land can potentially lead to outsized returns on land sale value
Higher-and-Best-Use Considerations
Farmlan
d Part
ners
Inc.
41
Understanding FarmlandIncome Characteristics
Section IV
Farmlan
d Part
ners
Inc.
42This Primer was produced by Green Street’s Advisory Group and commissioned by Farmland Partners.
This is not a Research Report. Please see the last slide for additional disclosure.
www.greenstreet.com
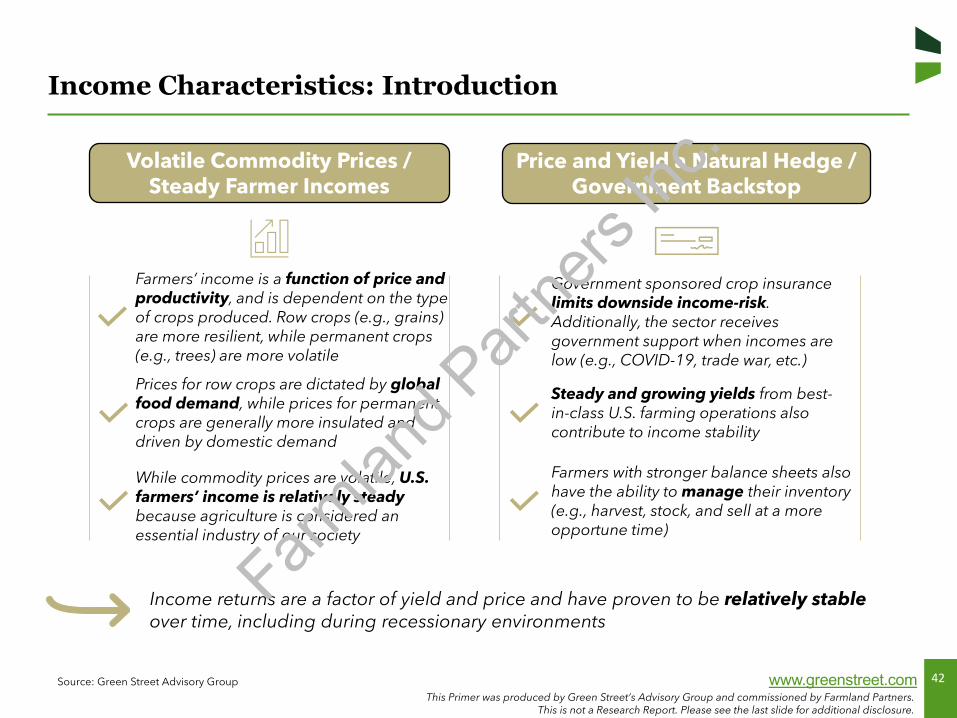
Income Characteristics: Introduction
Source: Green Street Advisory Group
Farmers’ income is a function of price and productivity, and is dependent on the type of crops produced. Row crops (e.g., grains) are more resilient, while permanent crops (e.g., trees) are more volatile
Volatile Commodity Prices / Steady Farmer Incomes
Prices for row crops are dictated by global food demand, while prices for permanent crops are generally more insulated and driven by domestic demand
Price and Yield a Natural Hedge / Government Backstop
Income returns are a factor of yield and price and have proven to be relatively stable over time, including during recessionary environments
While commodity prices are volatile, U.S. farmers’ income is relatively steadybecause agriculture is considered an essential industry of our society
Government sponsored crop insurance limits downside income-risk. Additionally, the sector receives government support when incomes are low (e.g., COVID-19, trade war, etc.)
Steady and growing yields from best-in-class U.S. farming operations also contribute to income stability
Farmers with stronger balance sheets also have the ability to manage their inventory (e.g., harvest, stock, and sell at a more opportune time)
Farmlan
d Part
ners
Inc.

43This Primer was produced by Green Street’s Advisory Group and commissioned by Farmland Partners.
This is not a Research Report. Please see the last slide for additional disclosure.
www.greenstreet.com
Spread to InflationHistorically, most years have seen farmland income returns between 4-8%. However, today’s low yields on financial assets across the board has pulled farmland income returns below 4% for the first time, still offering a positive spread to inflation.
Source: Green Street Advisory Group, NCREIF, FRED
Farmland income returns have delivered a positive spread to fluctuating inflation
0%
2%
4%
6%
8%
10%
12%
1991 1996 2001 2006 2011 2016
Farmland Income Spread to InflationSpread CPI Farmland Income Yield
Farmlan
d Part
ners
Inc.
44This Primer was produced by Green Street’s Advisory Group and commissioned by Farmland Partners.
This is not a Research Report. Please see the last slide for additional disclosure.
www.greenstreet.com
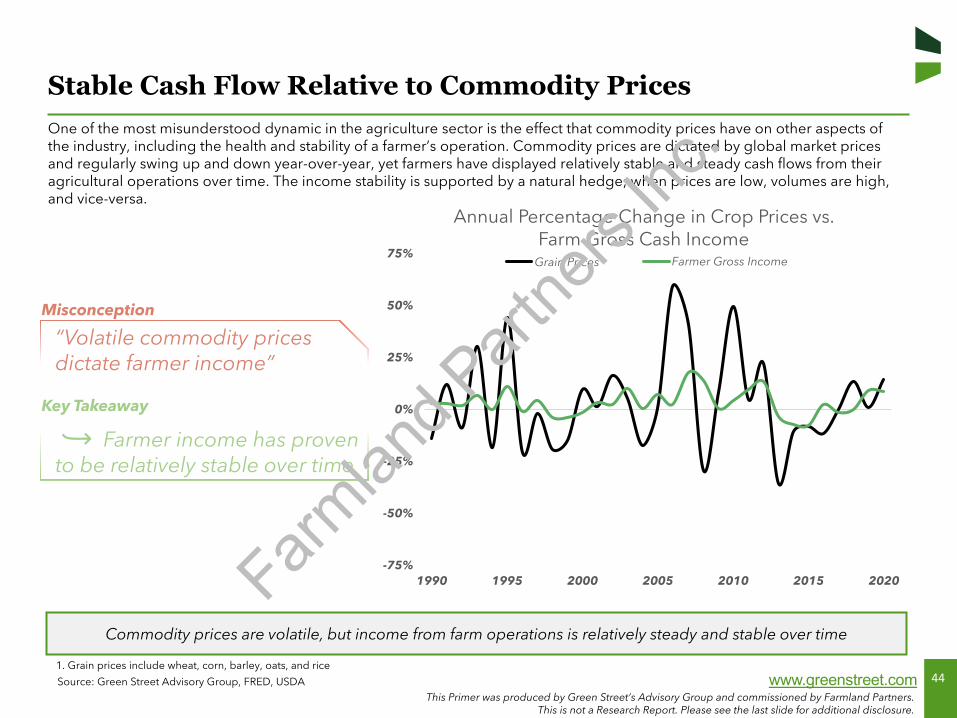
Stable Cash Flow Relative to Commodity PricesOne of the most misunderstood dynamic in the agriculture sector is the effect that commodity prices have on other aspects of the industry, including the health and stability of a farmer’s operation. Commodity prices are dictated by global market prices and regularly swing up and down year-over-year, yet farmers have displayed relatively stable and steady cash flows from their agricultural operations over time. The income stability is supported by a natural hedge; when prices are low, volumes are high, and vice-versa.
Source: Green Street Advisory Group, FRED, USDA
Commodity prices are volatile, but income from farm operations is relatively steady and stable over time
-75%
-50%
-25%
0%
25%
50%
75%
1990 1995 2000 2005 2010 2015 2020
Annual Percentage Change in Crop Prices vs. Farm Gross Cash Income
Grains Prices Farmer Gross Income
“Volatile commodity prices dictate farmer income”
Misconception
Key Takeaway
Farmer income has proven to be relatively stable over time
1. Grain prices include wheat, corn, barley, oats, and rice
Grain Prices1
Farmlan
d Part
ners
Inc.
45This Primer was produced by Green Street’s Advisory Group and commissioned by Farmland Partners.
This is not a Research Report. Please see the last slide for additional disclosure.
www.greenstreet.com
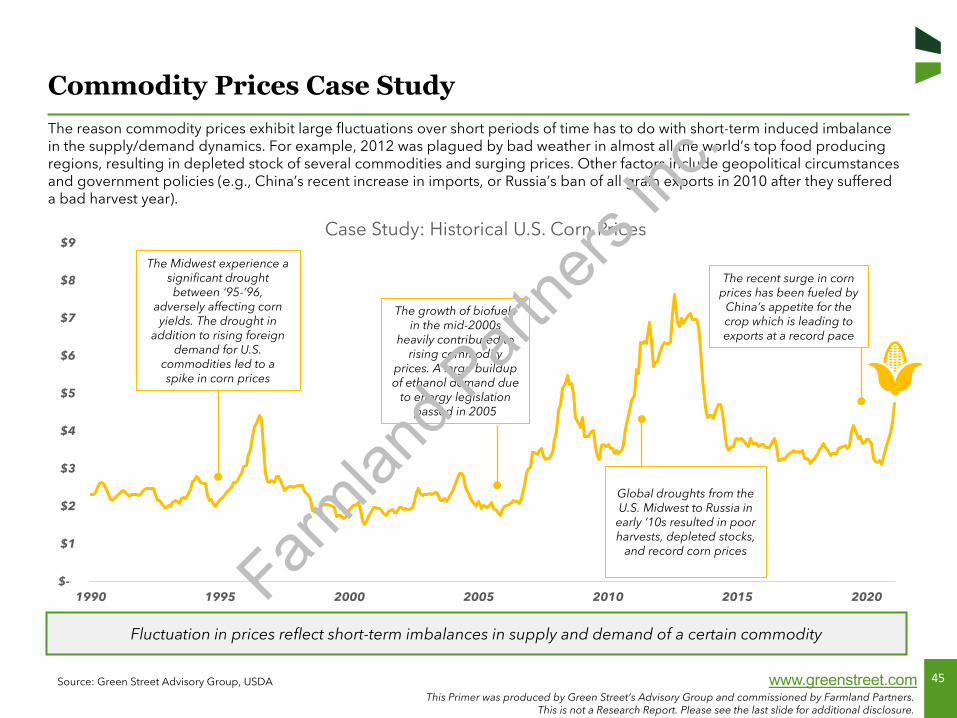
Commodity Prices Case StudyThe reason commodity prices exhibit large fluctuations over short periods of time has to do with short-term induced imbalance in the supply/demand dynamics. For example, 2012 was plagued by bad weather in almost all the world’s top food producing regions, resulting in depleted stock of several commodities and surging prices. Other factors include geopolitical circumstancesand government policies (e.g., China’s recent increase in imports, or Russia’s ban of all grain exports in 2010 after they suffered a bad harvest year).
Source: Green Street Advisory Group, USDA
Fluctuation in prices reflect short-term imbalances in supply and demand of a certain commodity
$-
$1
$2
$3
$4
$5
$6
$7
$8
$9
1990 1995 2000 2005 2010 2015 2020
Case Study: Historical U.S. Corn Prices
The growth of biofuels in the mid-2000s
heavily contributed to rising commodity
prices. A large buildup of ethanol demand due
to energy legislation passed in 2005
The Midwest experience a significant drought between ‘95-’96,
adversely affecting corn yields. The drought in
addition to rising foreign demand for U.S.
commodities led to a spike in corn prices
Global droughts from the U.S. Midwest to Russia in early ‘10s resulted in poor harvests, depleted stocks,
and record corn prices
The recent surge in corn prices has been fueled by
China’s appetite for the crop which is leading to exports at a record pace
Farmlan
d Part
ners
Inc.
46This Primer was produced by Green Street’s Advisory Group and commissioned by Farmland Partners.
This is not a Research Report. Please see the last slide for additional disclosure.
www.greenstreet.com
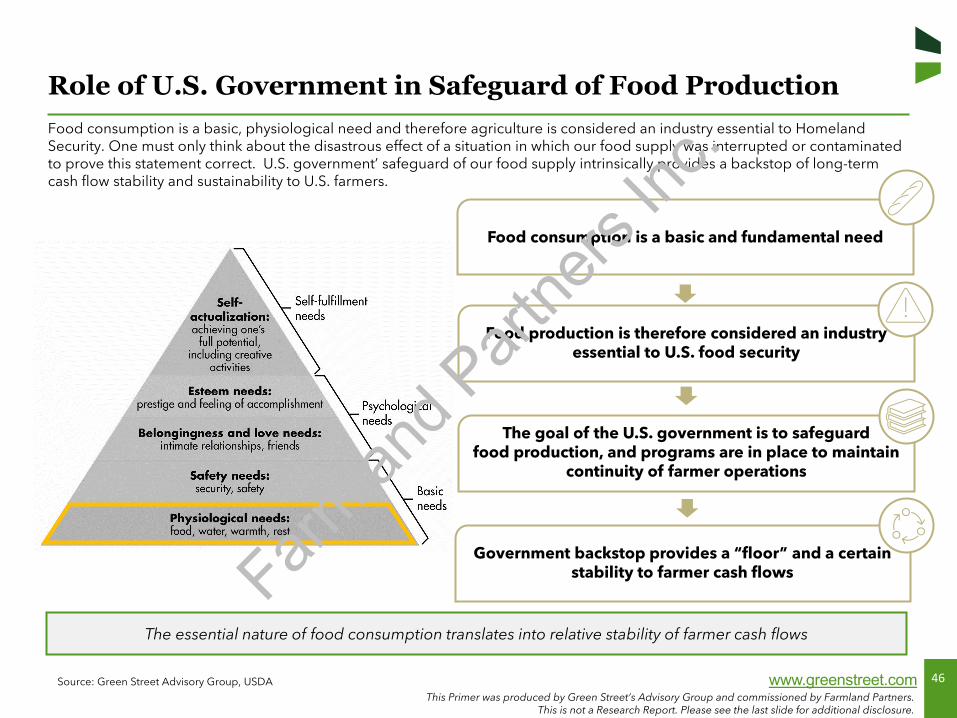
Role of U.S. Government in Safeguard of Food ProductionFood consumption is a basic, physiological need and therefore agriculture is considered an industry essential to Homeland Security. One must only think about the disastrous effect of a situation in which our food supply was interrupted or contaminated to prove this statement correct. U.S. government’ safeguard of our food supply intrinsically provides a backstop of long-term cash flow stability and sustainability to U.S. farmers.
Source: Green Street Advisory Group, USDA
The essential nature of food consumption translates into relative stability of farmer cash flows
Food consumption is a basic and fundamental need
Food production is therefore considered an industry essential to U.S. food security
The goal of the U.S. government is to safeguard food production, and programs are in place to maintain
continuity of farmer operations
Government backstop provides a “floor” and a certain stability to farmer cash flowsFarm
land P
artne
rs Inc
.

47This Primer was produced by Green Street’s Advisory Group and commissioned by Farmland Partners.
This is not a Research Report. Please see the last slide for additional disclosure.
www.greenstreet.com
Government Impact on Farmer Cash FlowsFarmers in the U.S. benefit from government and insurance programs to help mitigate fluctuations in commodity prices. These programs have provided a relatively high level of stability to farmers income over time, with cash flows at the end of the harvest period typically not below ~90% of expectations, while still retaining upside potential when commodity prices rise.
Source: Green Street Advisory Group, USDA, ERS
Government and insurance programs provide a relative level of stability to farmer cash flows
$0 B
$20 B
$40 B
$60 B
$80 B
$100 B
$120 B
$140 B
$160 B
1990 1995 2000 2005 2010 2015 2020
Percentage of Farmer Net Cash Income from Government/Insurance Support
Net Income from Farm Operations Portion of Net Income from Government Support
Government and insurance programs typically average ~15% of farmer net income depending
on the harvest year
2020 included additional COVID-
related support
Farmlan
d Part
ners
Inc.
48This Primer was produced by Green Street’s Advisory Group and commissioned by Farmland Partners.
This is not a Research Report. Please see the last slide for additional disclosure.
www.greenstreet.com
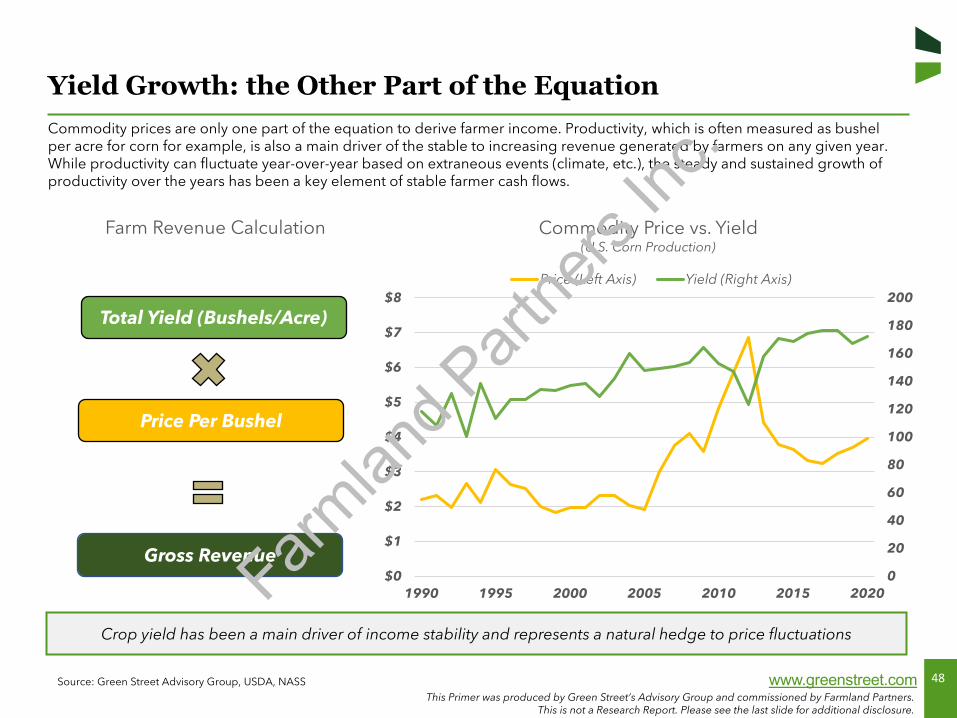
Yield Growth: the Other Part of the EquationCommodity prices are only one part of the equation to derive farmer income. Productivity, which is often measured as bushel per acre for corn for example, is also a main driver of the stable to increasing revenue generated by farmers on any given year.While productivity can fluctuate year-over-year based on extraneous events (climate, etc.), the steady and sustained growth of productivity over the years has been a key element of stable farmer cash flows.
Source: Green Street Advisory Group, USDA, NASS
Crop yield has been a main driver of income stability and represents a natural hedge to price fluctuations
Farm Revenue Calculation
0
20
40
60
80
100
120
140
160
180
200
$0
$1
$2
$3
$4
$5
$6
$7
$8
1990 1995 2000 2005 2010 2015 2020
Commodity Price vs. Yield(U.S. Corn Production)
Price (Left Axis) Yield (Right Axis)
Total Yield (Bushels/Acre)
Price Per Bushel
Gross RevenueFarmlan
d Part
ners
Inc.
49This Primer was produced by Green Street’s Advisory Group and commissioned by Farmland Partners.
This is not a Research Report. Please see the last slide for additional disclosure.
www.greenstreet.com
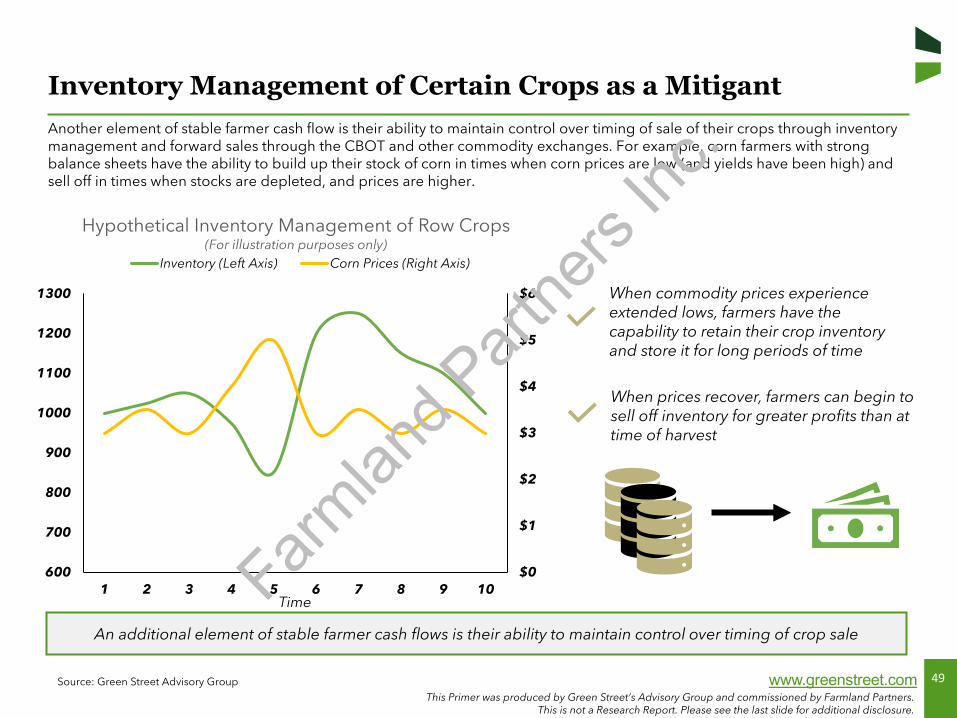
Inventory Management of Certain Crops as a MitigantAnother element of stable farmer cash flow is their ability to maintain control over timing of sale of their crops through inventory management and forward sales through the CBOT and other commodity exchanges. For example, corn farmers with strong balance sheets have the ability to build up their stock of corn in times when corn prices are low (and yields have been high) and sell off in times when stocks are depleted, and prices are higher.
Source: Green Street Advisory Group
An additional element of stable farmer cash flows is their ability to maintain control over timing of crop sale
$0
$1
$2
$3
$4
$5
$6
600
700
800
900
1000
1100
1200
1300
1 2 3 4 5 6 7 8 9 10Time
Hypothetical Inventory Management of Row Crops(For illustration purposes only)
Inventory (Left Axis) Corn Prices (Right Axis)
When commodity prices experience extended lows, farmers have the capability to retain their crop inventory and store it for long periods of time
When prices recover, farmers can begin to sell off inventory for greater profits than at time of harvest
Farmlan
d Part
ners
Inc.
50This Primer was produced by Green Street’s Advisory Group and commissioned by Farmland Partners.
This is not a Research Report. Please see the last slide for additional disclosure.
www.greenstreet.com
Government and
Insurance Programs
Commodity Prices
Yield
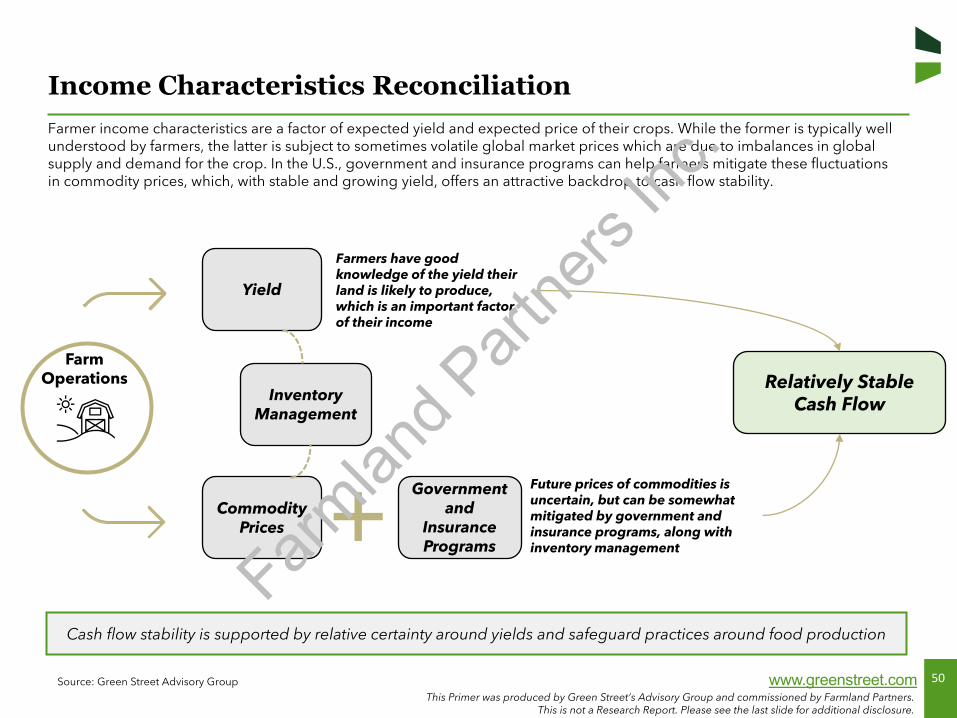
Income Characteristics ReconciliationFarmer income characteristics are a factor of expected yield and expected price of their crops. While the former is typically well understood by farmers, the latter is subject to sometimes volatile global market prices which are due to imbalances in globalsupply and demand for the crop. In the U.S., government and insurance programs can help farmers mitigate these fluctuations in commodity prices, which, with stable and growing yield, offers an attractive backdrop to cash flow stability.
Source: Green Street Advisory Group
Farmers have good knowledge of the yield their land is likely to produce, which is an important factor of their income
FarmOperations
Future prices of commodities is uncertain, but can be somewhat mitigated by government and insurance programs, along with inventory management
Relatively Stable Cash Flow
Cash flow stability is supported by relative certainty around yields and safeguard practices around food production
InventoryManagement
Farmlan
d Part
ners
Inc.

51
Land Lease Investment AttributesSection V
Farmlan
d Part
ners
Inc.
52This Primer was produced by Green Street’s Advisory Group and commissioned by Farmland Partners.
This is not a Research Report. Please see the last slide for additional disclosure.
www.greenstreet.com
Land Lease Investment: Introduction
Source: Green Street Advisory Group
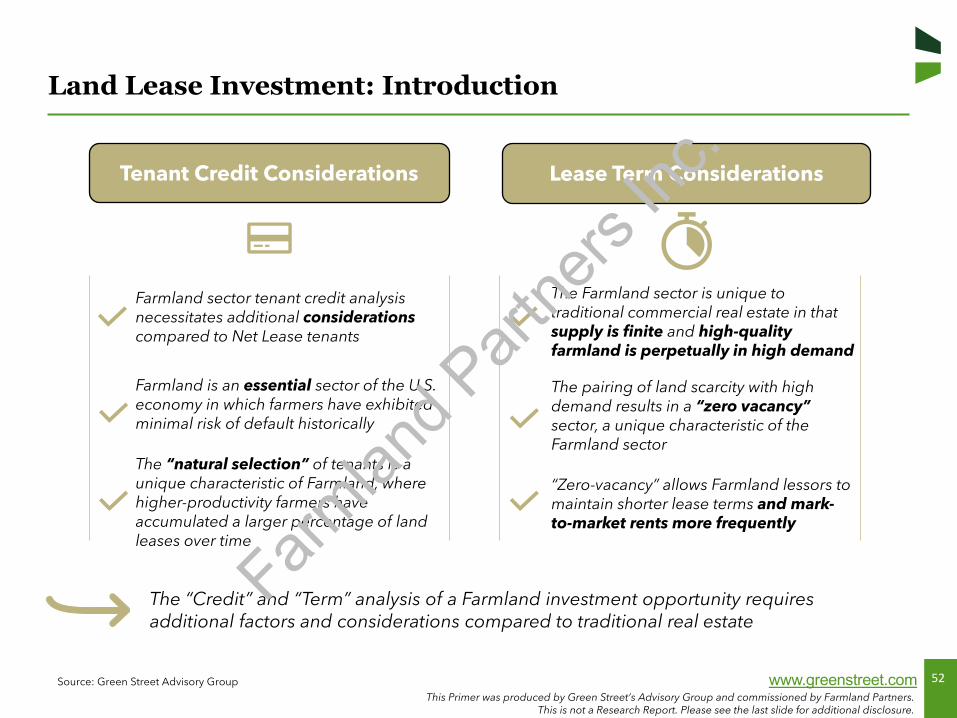
Farmland sector tenant credit analysis necessitates additional considerationscompared to Net Lease tenants
Tenant Credit Considerations
Farmland is an essential sector of the U.S. economy in which farmers have exhibited minimal risk of default historically
Lease Term Considerations
The “Credit” and “Term” analysis of a Farmland investment opportunity requires additional factors and considerations compared to traditional real estate
The “natural selection” of tenants is a unique characteristic of Farmland, where higher-productivity farmers have accumulated a larger percentage of land leases over time
The Farmland sector is unique to traditional commercial real estate in that supply is finite and high-quality farmland is perpetually in high demand
The pairing of land scarcity with high demand results in a “zero vacancy” sector, a unique characteristic of the Farmland sector
“Zero-vacancy” allows Farmland lessors to maintain shorter lease terms and mark-to-market rents more frequently
Farmlan
d Part
ners
Inc.
53This Primer was produced by Green Street’s Advisory Group and commissioned by Farmland Partners.
This is not a Research Report. Please see the last slide for additional disclosure.
www.greenstreet.com
Public Market Participants
Source: Green Street Advisory Group
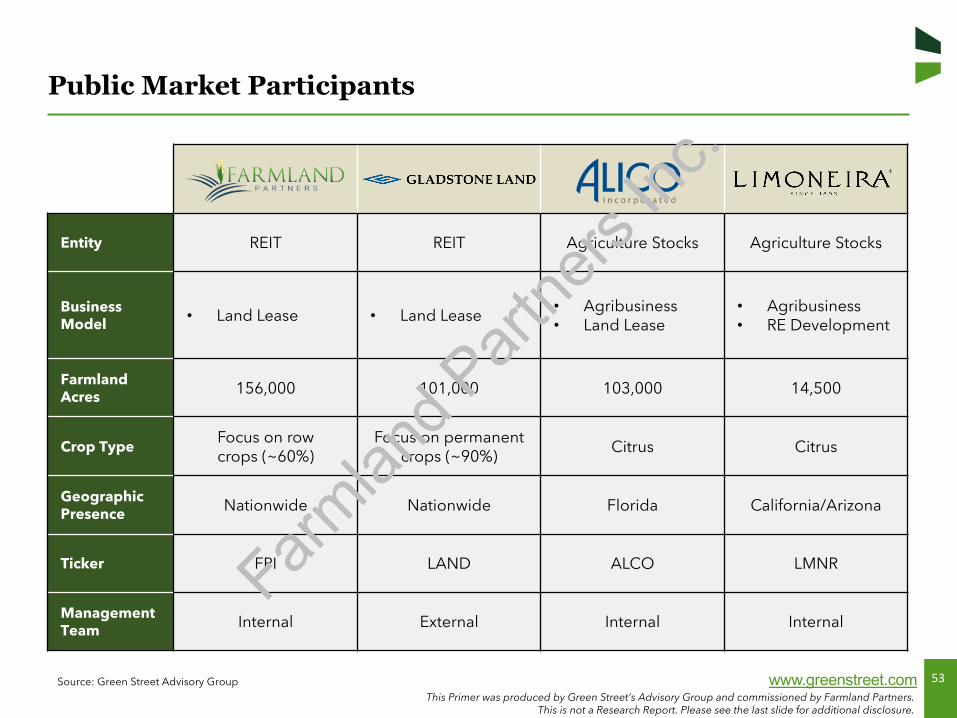
Entity REIT REIT Agriculture Stocks Agriculture Stocks
BusinessModel • Land Lease • Land Lease
• Agribusiness• Land Lease
• Agribusiness• RE Development
FarmlandAcres 156,000 101,000 103,000 14,500
Crop TypeFocus on rowcrops (~60%)
Focus on permanent crops (~90%)
Citrus Citrus
GeographicPresence Nationwide Nationwide Florida California/Arizona
Ticker FPI LAND ALCO LMNR
Management Team Internal External Internal Internal
Farmlan
d Part
ners
Inc.
54This Primer was produced by Green Street’s Advisory Group and commissioned by Farmland Partners.
This is not a Research Report. Please see the last slide for additional disclosure.
www.greenstreet.com
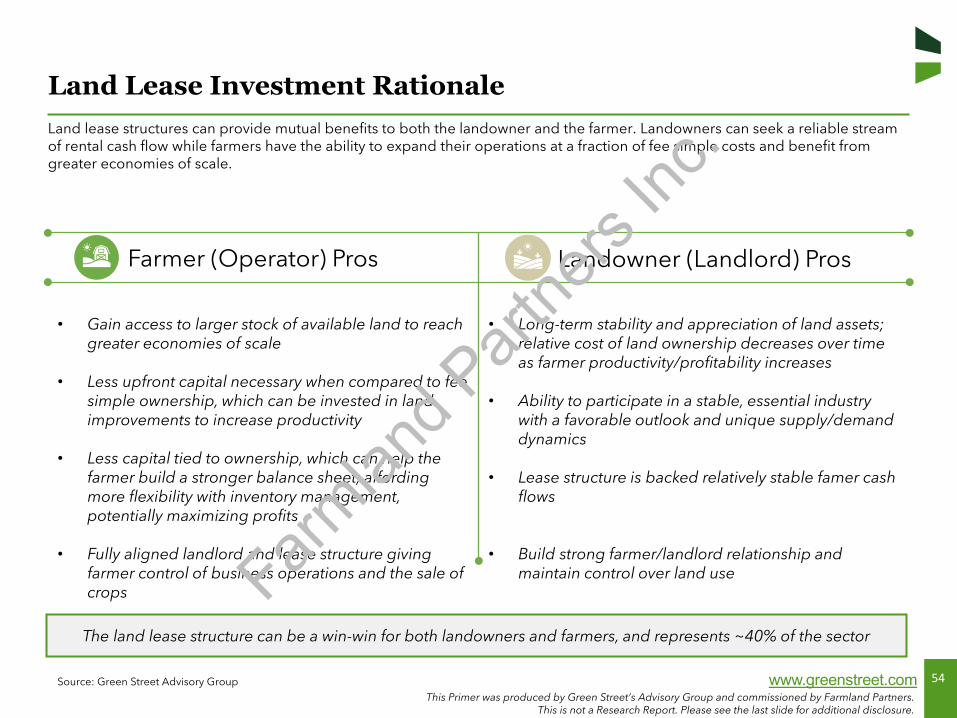
Land Lease Investment RationaleLand lease structures can provide mutual benefits to both the landowner and the farmer. Landowners can seek a reliable streamof rental cash flow while farmers have the ability to expand their operations at a fraction of fee simple costs and benefit from greater economies of scale.
Source: Green Street Advisory Group
The land lease structure can be a win-win for both landowners and farmers, and represents ~40% of the sector
Farmer (Operator) Pros Landowner (Landlord) Pros
• Gain access to larger stock of available land to reach greater economies of scale
• Less upfront capital necessary when compared to fee simple ownership, which can be invested in land improvements to increase productivity
• Less capital tied to ownership, which can help the farmer build a stronger balance sheet, affording more flexibility with inventory management, potentially maximizing profits
• Fully aligned landlord and lease structure giving farmer control of business operations and the sale of crops
• Long-term stability and appreciation of land assets; relative cost of land ownership decreases over time as farmer productivity/profitability increases
• Ability to participate in a stable, essential industry with a favorable outlook and unique supply/demand dynamics
• Lease structure is backed relatively stable famer cash flows
• Build strong farmer/landlord relationship and maintain control over land useFarm
land P
artne
rs Inc
.
55This Primer was produced by Green Street’s Advisory Group and commissioned by Farmland Partners.
This is not a Research Report. Please see the last slide for additional disclosure.
www.greenstreet.com
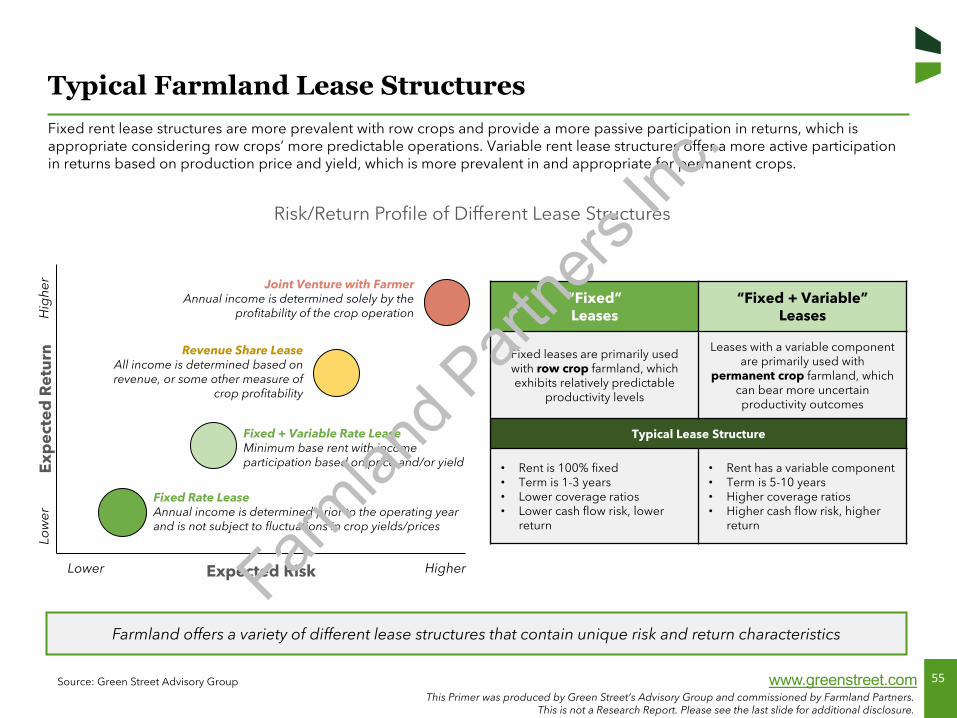
Typical Farmland Lease StructuresFixed rent lease structures are more prevalent with row crops and provide a more passive participation in returns, which is appropriate considering row crops’ more predictable operations. Variable rent lease structures offer a more active participationin returns based on production price and yield, which is more prevalent in and appropriate for permanent crops.
Source: Green Street Advisory Group
Farmland offers a variety of different lease structures that contain unique risk and return characteristics
Exp
ecte
d R
etu
rn
Expected Risk
Hig
her
Low
er
Lower Higher
Fixed Rate Lease Annual income is determined prior to the operating year and is not subject to fluctuations in crop yields/prices
Fixed + Variable Rate LeaseMinimum base rent with income participation based on price and/or yield
Revenue Share LeaseAll income is determined based on revenue, or some other measure of
crop profitability
Joint Venture with FarmerAnnual income is determined solely by the
profitability of the crop operation“Fixed”Leases
“Fixed + Variable”Leases
Fixed leases are primarily used with row crop farmland, which exhibits relatively predictable
productivity levels
Leases with a variable component are primarily used with
permanent crop farmland, which can bear more uncertain productivity outcomes
Typical Lease Structure
• Rent is 100% fixed• Term is 1-3 years• Lower coverage ratios• Lower cash flow risk, lower
return
• Rent has a variable component• Term is 5-10 years• Higher coverage ratios• Higher cash flow risk, higher
return
Risk/Return Profile of Different Lease Structures
Farmlan
d Part
ners
Inc.
56This Primer was produced by Green Street’s Advisory Group and commissioned by Farmland Partners.
This is not a Research Report. Please see the last slide for additional disclosure.
www.greenstreet.com
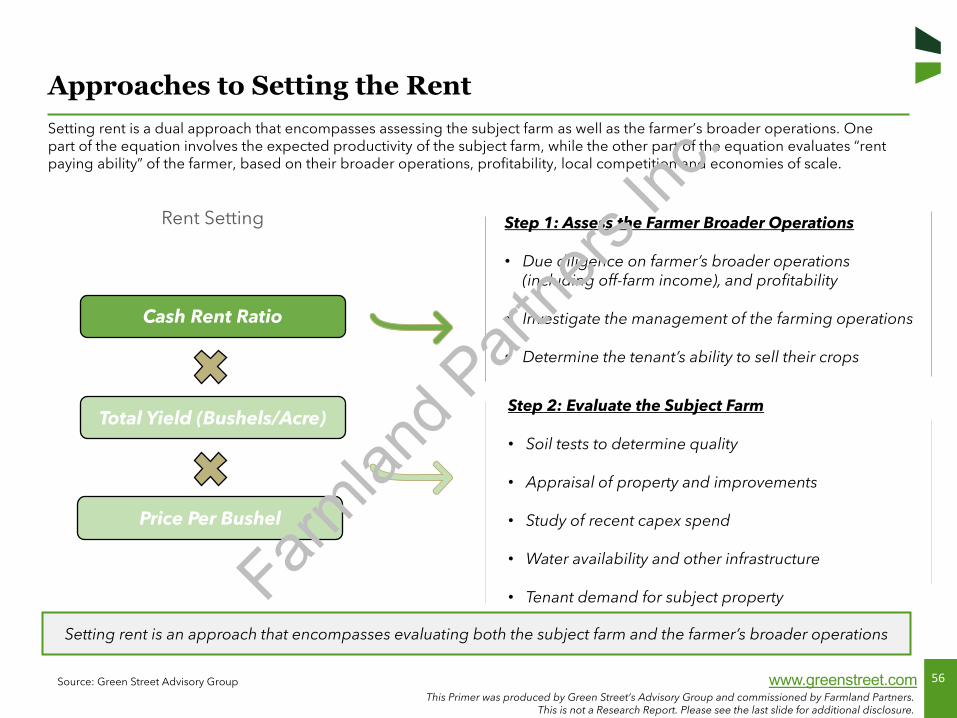
Approaches to Setting the RentSetting rent is a dual approach that encompasses assessing the subject farm as well as the farmer’s broader operations. One part of the equation involves the expected productivity of the subject farm, while the other part of the equation evaluates “rent paying ability” of the farmer, based on their broader operations, profitability, local competition and economies of scale.
Source: Green Street Advisory Group
Setting rent is an approach that encompasses evaluating both the subject farm and the farmer’s broader operations
Rent Setting
Total Yield (Bushels/Acre)
Price Per Bushel
Cash Rent Ratio
Step 2: Evaluate the Subject Farm
• Soil tests to determine quality
• Appraisal of property and improvements
• Study of recent capex spend
• Water availability and other infrastructure
• Tenant demand for subject property
Step 1: Assess the Farmer Broader Operations
• Due diligence on farmer’s broader operations (including off-farm income), and profitability
• Investigate the management of the farming operations
• Determine the tenant’s ability to sell their crops
Farmlan
d Part
ners
Inc.
57This Primer was produced by Green Street’s Advisory Group and commissioned by Farmland Partners.
This is not a Research Report. Please see the last slide for additional disclosure.
www.greenstreet.com
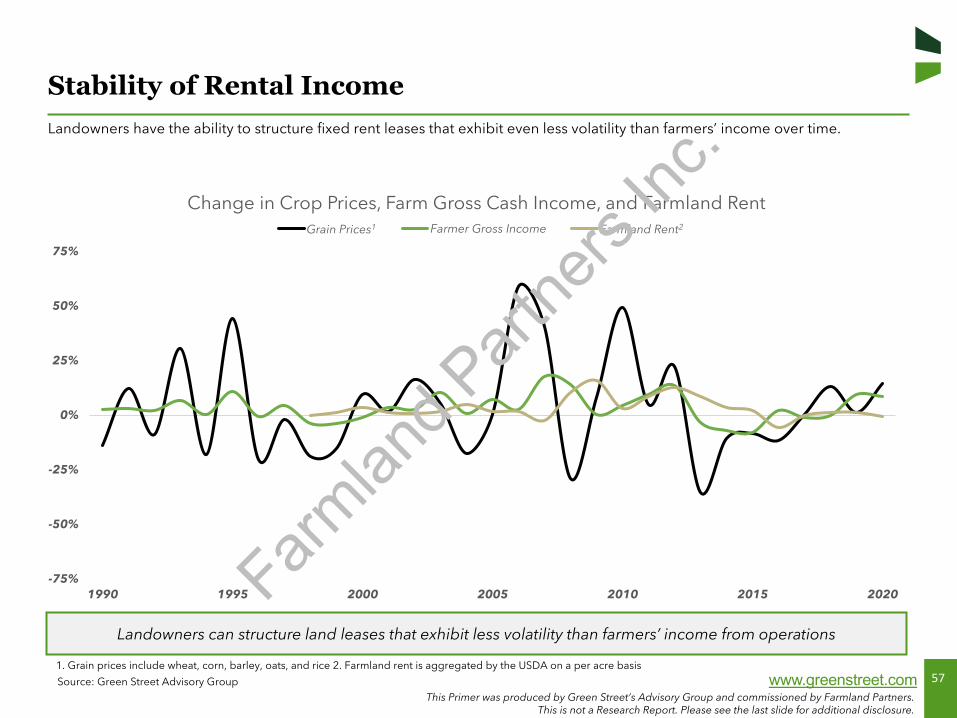
Stability of Rental IncomeLandowners have the ability to structure fixed rent leases that exhibit even less volatility than farmers’ income over time.
Landowners can structure land leases that exhibit less volatility than farmers’ income from operations
-75%
-50%
-25%
0%
25%
50%
75%
1990 1995 2000 2005 2010 2015 2020
Change in Crop Prices, Farm Gross Cash Income, and Farmland RentGrains Prices Farmer Gross Income Farmland Rent
1. Grain prices include wheat, corn, barley, oats, and rice 2. Farmland rent is aggregated by the USDA on a per acre basis
Source: Green Street Advisory Group
Grain Prices1 Farmland Rent2
Farmlan
d Part
ners
Inc.
58This Primer was produced by Green Street’s Advisory Group and commissioned by Farmland Partners.
This is not a Research Report. Please see the last slide for additional disclosure.
www.greenstreet.com
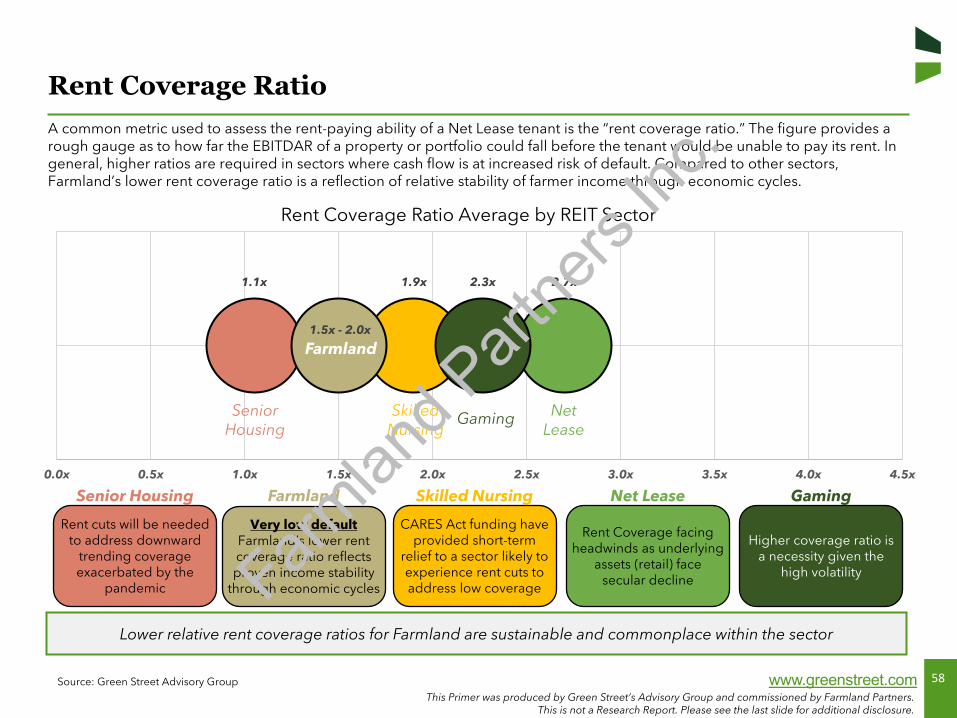
Rent Coverage RatioA common metric used to assess the rent-paying ability of a Net Lease tenant is the “rent coverage ratio.” The figure provides arough gauge as to how far the EBITDAR of a property or portfolio could fall before the tenant would be unable to pay its rent. In general, higher ratios are required in sectors where cash flow is at increased risk of default. Compared to other sectors, Farmland’s lower rent coverage ratio is a reflection of relative stability of farmer income through economic cycles.
Source: Green Street Advisory Group
Lower relative rent coverage ratios for Farmland are sustainable and commonplace within the sector
2.7x1.9x1.1x 2.3x
1.5x - 2.0x
0.0x 0.5x 1.0x 1.5x 2.0x 2.5x 3.0x 3.5x 4.0x 4.5x
Rent Coverage Ratio Average by REIT Sector
Very low defaultFarmland’s lower rent coverage ratio reflects proven income stability
through economic cycles
Rent cuts will be needed to address downward
trending coverage exacerbated by the
pandemic
CARES Act funding have provided short-term
relief to a sector likely to experience rent cuts to address low coverage
Rent Coverage facing headwinds as underlying
assets (retail) face secular decline
Higher coverage ratio is a necessity given the
high volatility
FarmlandSenior Housing Skilled Nursing Net Lease Gaming
SeniorHousing
Skilled Nursing
Net Lease
Gaming
Farmland
Farmlan
d Part
ners
Inc.

59This Primer was produced by Green Street’s Advisory Group and commissioned by Farmland Partners.
This is not a Research Report. Please see the last slide for additional disclosure.
www.greenstreet.com
Low Event of DefaultA history of de-minimis bad debt in the sector is a reflection of farmers’ strong balance sheets, willingness to provide personal guarantees, and experience weathering the volatility within their business, while still capitalizing on growth in opportune times. The scarcity of high-quality land also requires that farmers prioritize meeting their rent requirements or risk losing acreage.
Source: Green Street Advisory Group, USDA
Farmland has experienced low probabilities of rent default over time
$-
$50
$100
$150
$200
$250
$300
$350
1998 2003 2008 2013 2018
Historical U.S. Farmer Profitability ($/acre)
Farmer Net Income Per Acre Rent Per Acre
Net Income is defined as revenue before rent payments
Farmlan
d Part
ners
Inc.
60This Primer was produced by Green Street’s Advisory Group and commissioned by Farmland Partners.
This is not a Research Report. Please see the last slide for additional disclosure.
www.greenstreet.com
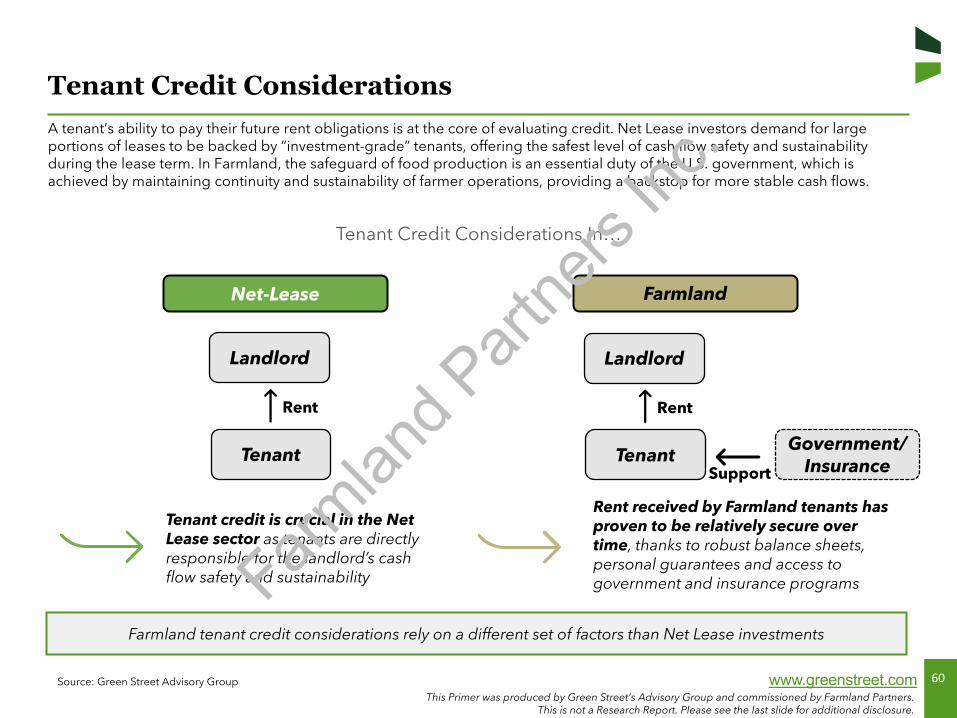
Tenant Credit ConsiderationsA tenant’s ability to pay their future rent obligations is at the core of evaluating credit. Net Lease investors demand for large portions of leases to be backed by “investment-grade” tenants, offering the safest level of cash flow safety and sustainability during the lease term. In Farmland, the safeguard of food production is an essential duty of the U.S. government, which is achieved by maintaining continuity and sustainability of farmer operations, providing a backstop for more stable cash flows.
Source: Green Street Advisory Group
Farmland tenant credit considerations rely on a different set of factors than Net Lease investments
Net-Lease Farmland
Landlord
Rent
Tenant credit is crucial in the Net Lease sector as tenants are directly responsible for the landlord’s cash flow safety and sustainability
Tenant Credit Considerations In…
Tenant
Landlord
Rent
Rent received by Farmland tenants has proven to be relatively secure over time, thanks to robust balance sheets, personal guarantees and access to government and insurance programs
TenantGovernment/
InsuranceSupport
Farmlan
d Part
ners
Inc.
61This Primer was produced by Green Street’s Advisory Group and commissioned by Farmland Partners.
This is not a Research Report. Please see the last slide for additional disclosure.
www.greenstreet.com
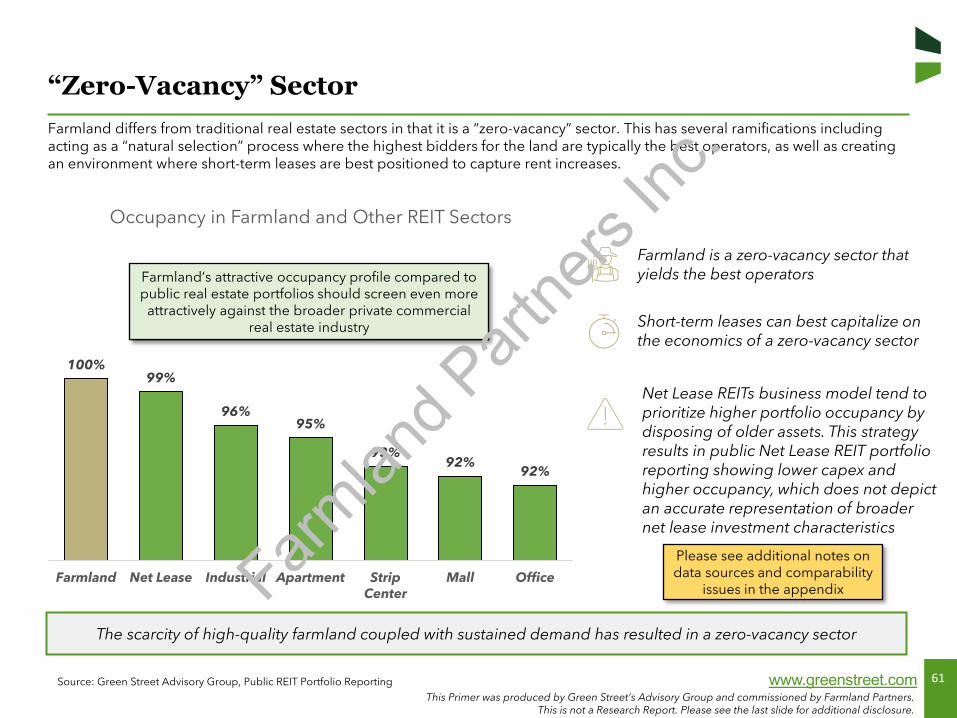
“Zero-Vacancy” SectorFarmland differs from traditional real estate sectors in that it is a “zero-vacancy” sector. This has several ramifications including acting as a “natural selection” process where the highest bidders for the land are typically the best operators, as well as creating an environment where short-term leases are best positioned to capture rent increases.
Source: Green Street Advisory Group, Public REIT Portfolio Reporting
The scarcity of high-quality farmland coupled with sustained demand has resulted in a zero-vacancy sector
100%99%
96%95%
93%92%
92%
Farmland Net Lease Industrial Apartment StripCenter
Mall Office
Occupancy in Farmland and Other REIT Sectors
Farmland’s attractive occupancy profile compared to public real estate portfolios should screen even more
attractively against the broader private commercial real estate industry
Farmland is a zero-vacancy sector that yields the best operators
Short-term leases can best capitalize on the economics of a zero-vacancy sector
Net Lease REITs business model tend to prioritize higher portfolio occupancy by disposing of older assets. This strategy results in public Net Lease REIT portfolio reporting showing lower capex and higher occupancy, which does not depict an accurate representation of broader net lease investment characteristics
Please see additional notes on data sources and comparability
issues in the appendixFarmlan
d Part
ners
Inc.
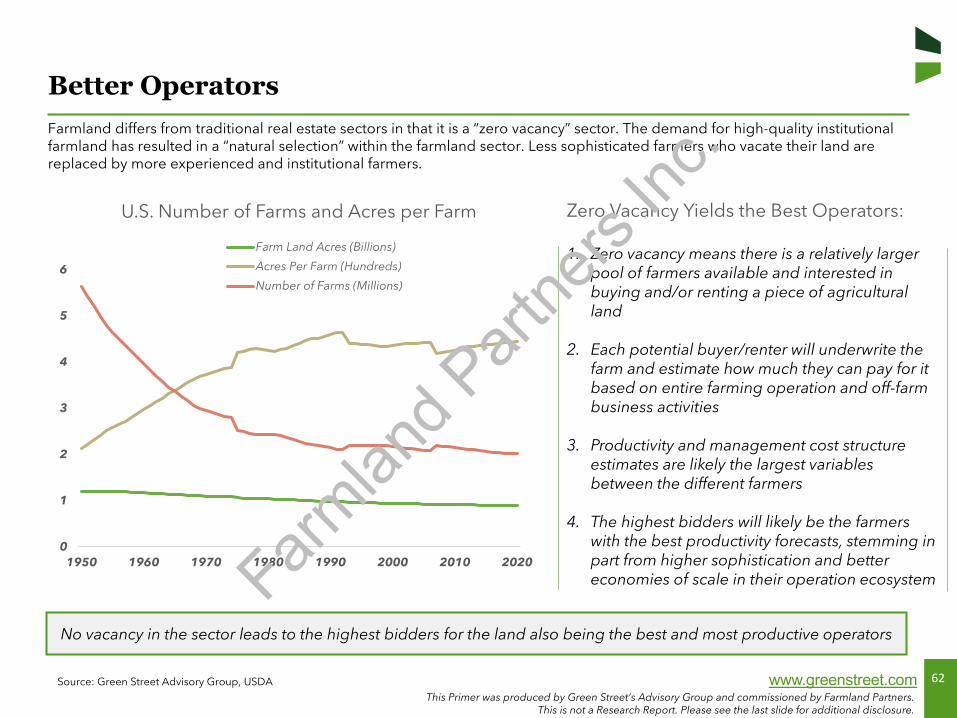
62This Primer was produced by Green Street’s Advisory Group and commissioned by Farmland Partners.
This is not a Research Report. Please see the last slide for additional disclosure.
www.greenstreet.com
Better OperatorsFarmland differs from traditional real estate sectors in that it is a “zero vacancy” sector. The demand for high-quality institutional farmland has resulted in a “natural selection” within the farmland sector. Less sophisticated farmers who vacate their land are replaced by more experienced and institutional farmers.
Source: Green Street Advisory Group, USDA
No vacancy in the sector leads to the highest bidders for the land also being the best and most productive operators
0
1
2
3
4
5
6
20202010200019901980197019601950
U.S. Number of Farms and Acres per Farm
Farm Land Acres (Billions)
Acres Per Farm (Hundreds)
Number of Farms (Millions)
Zero Vacancy Yields the Best Operators:
1. Zero vacancy means there is a relatively larger pool of farmers available and interested in buying and/or renting a piece of agricultural land
2. Each potential buyer/renter will underwrite the farm and estimate how much they can pay for it based on entire farming operation and off-farm business activities
3. Productivity and management cost structure estimates are likely the largest variables between the different farmers
4. The highest bidders will likely be the farmers with the best productivity forecasts, stemming in part from higher sophistication and better economies of scale in their operation ecosystemFarm
land P
artne
rs Inc
.
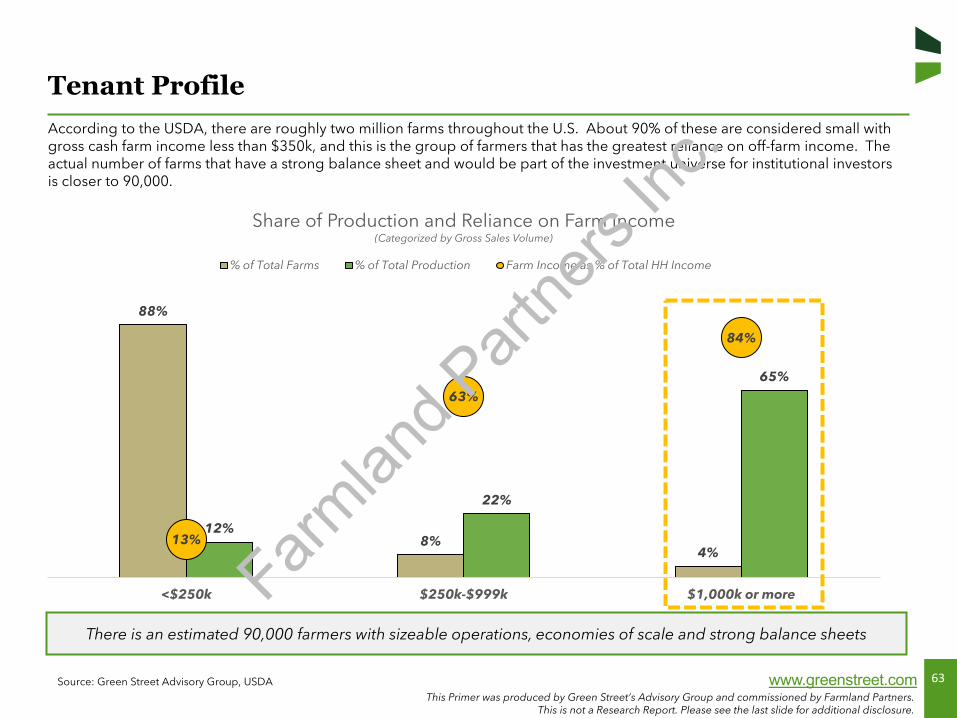
63This Primer was produced by Green Street’s Advisory Group and commissioned by Farmland Partners.
This is not a Research Report. Please see the last slide for additional disclosure.
www.greenstreet.com
Tenant ProfileAccording to the USDA, there are roughly two million farms throughout the U.S. About 90% of these are considered small with gross cash farm income less than $350k, and this is the group of farmers that has the greatest reliance on off-farm income. Theactual number of farms that have a strong balance sheet and would be part of the investment universe for institutional investorsis closer to 90,000.
Source: Green Street Advisory Group, USDA
There is an estimated 90,000 farmers with sizeable operations, economies of scale and strong balance sheets
88%
8%4%
12%
22%
65%
13%
63%
84%
<$250k $250k-$999k $1,000k or more
Share of Production and Reliance on Farm Income(Categorized by Gross Sales Volume)
% of Total Farms % of Total Production Farm Income as % of Total HH Income
Farmlan
d Part
ners
Inc.
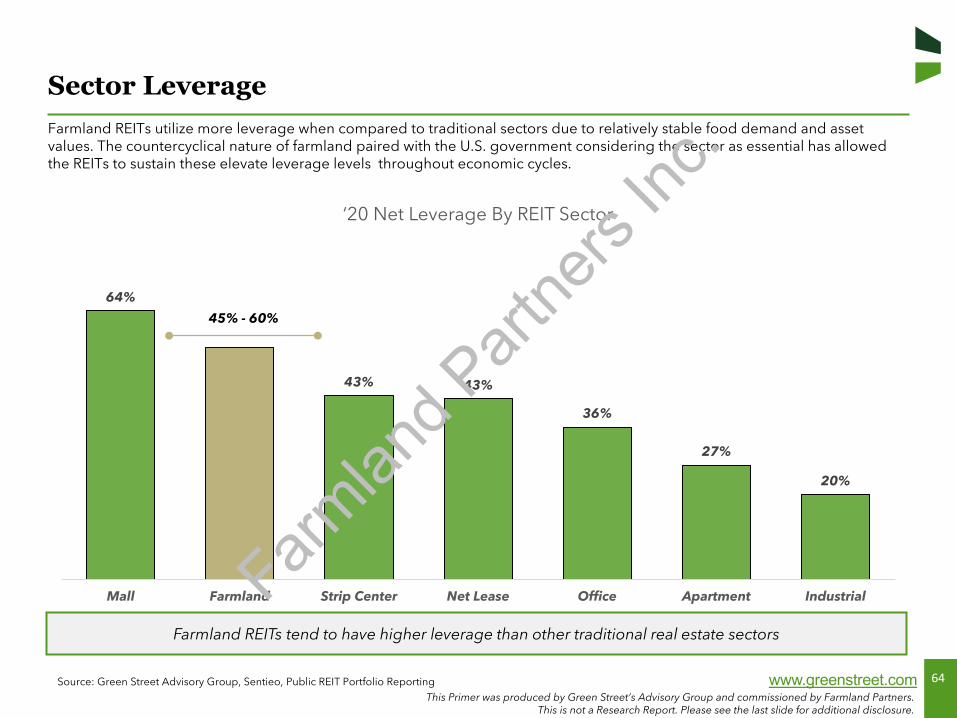
64This Primer was produced by Green Street’s Advisory Group and commissioned by Farmland Partners.
This is not a Research Report. Please see the last slide for additional disclosure.
www.greenstreet.com
Sector LeverageFarmland REITs utilize more leverage when compared to traditional sectors due to relatively stable food demand and asset values. The countercyclical nature of farmland paired with the U.S. government considering the sector as essential has allowed the REITs to sustain these elevate leverage levels throughout economic cycles.
Source: Green Street Advisory Group, Sentieo, Public REIT Portfolio Reporting
Farmland REITs tend to have higher leverage than other traditional real estate sectors
64%
43% 43%
36%
27%
20%
Mall Farmland Strip Center Net Lease Office Apartment Industrial
‘20 Net Leverage By REIT Sector
45% - 60%
Farmlan
d Part
ners
Inc.
65
Relative Valuation ConsiderationsSection VI
Farmlan
d Part
ners
Inc.
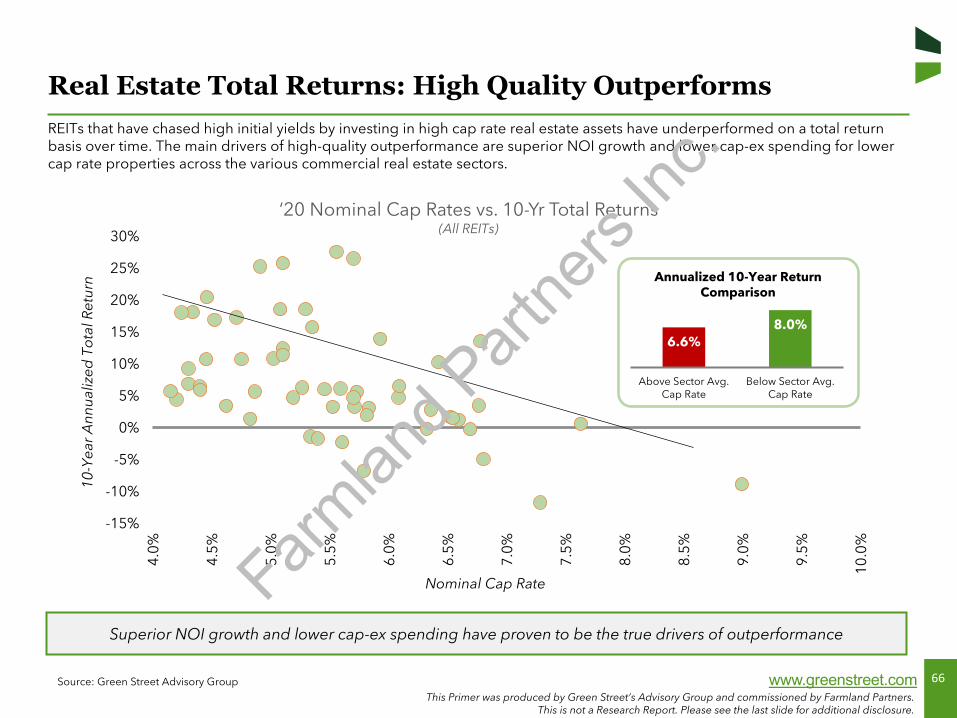
66This Primer was produced by Green Street’s Advisory Group and commissioned by Farmland Partners.
This is not a Research Report. Please see the last slide for additional disclosure.
www.greenstreet.com
Real Estate Total Returns: High Quality OutperformsREITs that have chased high initial yields by investing in high cap rate real estate assets have underperformed on a total return basis over time. The main drivers of high-quality outperformance are superior NOI growth and lower cap-ex spending for lower cap rate properties across the various commercial real estate sectors.
Source: Green Street Advisory Group
Superior NOI growth and lower cap-ex spending have proven to be the true drivers of outperformance
-15%
-10%
-5%
0%
5%
10%
15%
20%
25%
30%
4.0%
4.5%
5.0%
5.5%
6.0%
6.5%
7.0%
7.5%
8.0%
8.5%
9.0%
9.5%
10.0
%
10-Y
ear
Ann
ualiz
ed T
otal
Ret
urn
Nominal Cap Rate
‘20 Nominal Cap Rates vs. 10-Yr Total Returns(All REITs)
6.6%8.0%
Above Sector Avg.Cap Rate
Below Sector Avg.Cap Rate
Annualized 10-Year Return Comparison
Farmlan
d Part
ners
Inc.
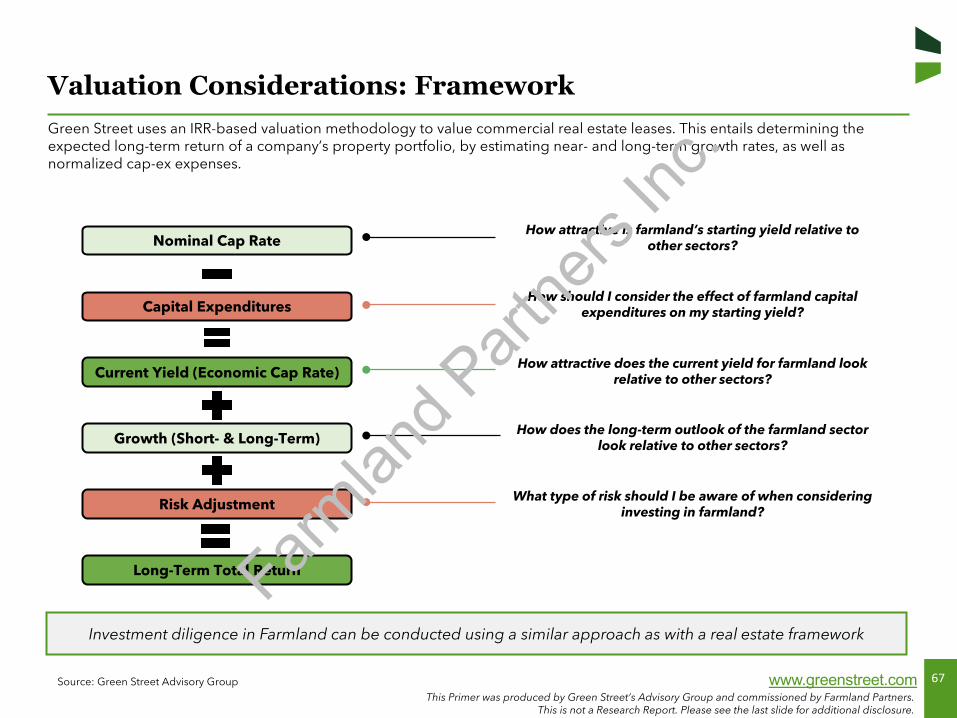
67This Primer was produced by Green Street’s Advisory Group and commissioned by Farmland Partners.
This is not a Research Report. Please see the last slide for additional disclosure.
www.greenstreet.com
Valuation Considerations: FrameworkGreen Street uses an IRR-based valuation methodology to value commercial real estate leases. This entails determining the expected long-term return of a company’s property portfolio, by estimating near- and long-term growth rates, as well as normalized cap-ex expenses.
Source: Green Street Advisory Group
Investment diligence in Farmland can be conducted using a similar approach as with a real estate framework
Current Yield (Economic Cap Rate)
Growth (Short- & Long-Term)
Risk Adjustment
Long-Term Total Return
Nominal Cap Rate
Capital Expenditures
How attractive is farmland’s starting yield relative to other sectors?
How should I consider the effect of farmland capital expenditures on my starting yield?
How attractive does the current yield for farmland look relative to other sectors?
How does the long-term outlook of the farmland sector look relative to other sectors?
What type of risk should I be aware of when considering investing in farmland?
Farmlan
d Part
ners
Inc.
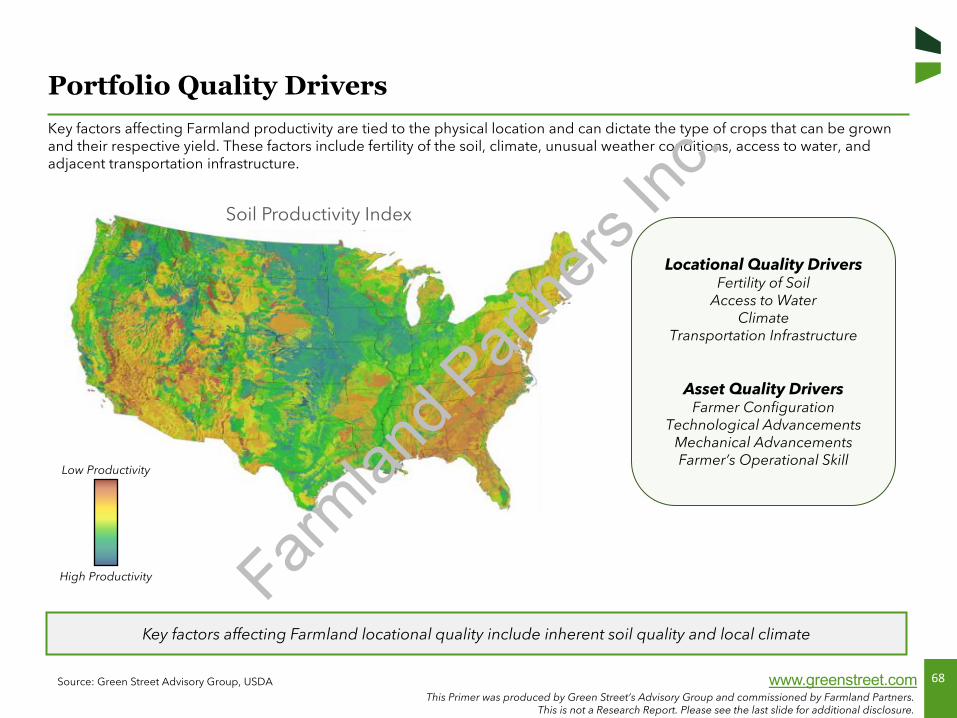
68This Primer was produced by Green Street’s Advisory Group and commissioned by Farmland Partners.
This is not a Research Report. Please see the last slide for additional disclosure.
www.greenstreet.com
Portfolio Quality DriversKey factors affecting Farmland productivity are tied to the physical location and can dictate the type of crops that can be grown and their respective yield. These factors include fertility of the soil, climate, unusual weather conditions, access to water, and adjacent transportation infrastructure.
Source: Green Street Advisory Group, USDA
Key factors affecting Farmland locational quality include inherent soil quality and local climate
Soil Productivity Index
Low Productivity
High Productivity
Locational Quality DriversFertility of Soil
Access to WaterClimate
Transportation Infrastructure
Asset Quality DriversFarmer Configuration
Technological AdvancementsMechanical AdvancementsFarmer’s Operational Skill
Farmlan
d Part
ners
Inc.

69This Primer was produced by Green Street’s Advisory Group and commissioned by Farmland Partners.
This is not a Research Report. Please see the last slide for additional disclosure.
www.greenstreet.com
Nominal Cap RatesRow crop nominal cap rates have compressed to now be among the lowest in the commercial real estate space. Permanent crops on the other hand support higher initial yields, in-line with major sector real estate.
Source: Green Street Advisory Group, USDA, NCREIF, Public REIT Portfolio Reporting
Farmland nominal cap rates are within the lower end of the range of commercial real estate
8.0%
7.1%
6.4%
5.5% 5.4%
4.5% 4.4%
3.2%
Net Lease Mall Strip Center Farmland(Permanent)
Office Industrial Apartment Farmland(Row)
‘20 Nominal Cap Rates By Sector
Permanent Crops
RowCrops
Reasonable Range:~3.0% - 4.0%
Reasonable Range:~5.0% - 7.0%
Real estate portfolios owned by REITs tend to be of higher
quality and situated in higher-barrier locations
Farmlan
d Part
ners
Inc.

70This Primer was produced by Green Street’s Advisory Group and commissioned by Farmland Partners.
This is not a Research Report. Please see the last slide for additional disclosure.
www.greenstreet.com
Capex Burden By SectorThe average cap-ex incurred by property owners over long holding periods can absorb as much as 30% of net operating income in traditional real estate. In the case of Farmland, landlords are typically only involved in capital expenditures dealing with longer-life improvements. In row crops, improvements are minimal, and capex is within the lower range of traditional real estate sectors. In permanent crops, improvements are more substantial and capex load is more similar to major sector real estate.
Source: Green Street Advisory Group, USDA, NCREIF, Public REIT Portfolio Reporting
Capital expenditures for row crops are at the lower range of traditional real estate sectors
26%25%
22%
15%14%
3%
Office Mall Strip Center Industrial Apartment Net Lease Farmland
Capex Reserve as Percentage of NOI
Permanent Crops capex in-line with
major sectors
Row Crops capex in-line with Net
Lease sector
Please see important notes on data sources and comparability
issues in the appendix
Farmlan
d Part
ners
Inc.

71This Primer was produced by Green Street’s Advisory Group and commissioned by Farmland Partners.
This is not a Research Report. Please see the last slide for additional disclosure.
www.greenstreet.com
Economic Cap Rates“Nominal” cap rates are a starting point for assessing how investors are pricing the growth and risk characteristics of cash flows for different property types in their valuation of the portfolio or companies. However, “economic” cap rates provide a more accurate gauge of the investment yield an investor will receive after considering normalized capital expenditure reserves.
Source: Green Street Advisory Group, USDA, NCREIF, Public REIT Portfolio Reporting
Farmland economic cap rates are within the lower end of the range of commercial real estate
7.7%
5.7%5.3%
4.0% 3.8% 3.8%
Net Lease Mall Strip Center Farmland(Permanent)
Office Industrial Apartment Farmland(Row)
‘20 Economic Cap Rates By Sector
Permanent Crops
RowCrops
Reasonable Range:~3.0% - 4.0%
Reasonable Range:~4.5% - 5.5%
Farmlan
d Part
ners
Inc.
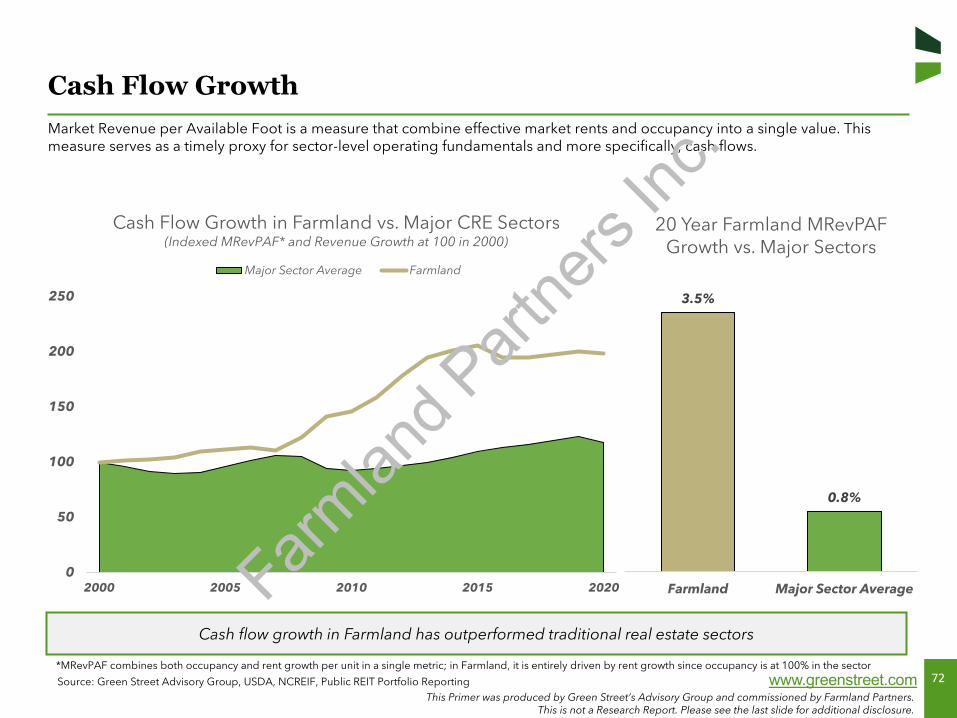
72This Primer was produced by Green Street’s Advisory Group and commissioned by Farmland Partners.
This is not a Research Report. Please see the last slide for additional disclosure.
www.greenstreet.com
Cash Flow GrowthMarket Revenue per Available Foot is a measure that combine effective market rents and occupancy into a single value. This measure serves as a timely proxy for sector-level operating fundamentals and more specifically, cash flows.
Cash flow growth in Farmland has outperformed traditional real estate sectors
0
50
100
150
200
250
2000 2005 2010 2015 2020
Cash Flow Growth in Farmland vs. Major CRE Sectors(Indexed MRevPAF* and Revenue Growth at 100 in 2000)
Major Sector Average Farmland
3.5%
0.8%
Farmland Major Sector Average
20 Year Farmland MRevPAF Growth vs. Major Sectors
*MRevPAF combines both occupancy and rent growth per unit in a single metric; in Farmland, it is entirely driven by rent growth since occupancy is at 100% in the sector
Source: Green Street Advisory Group, USDA, NCREIF, Public REIT Portfolio Reporting
Farmlan
d Part
ners
Inc.
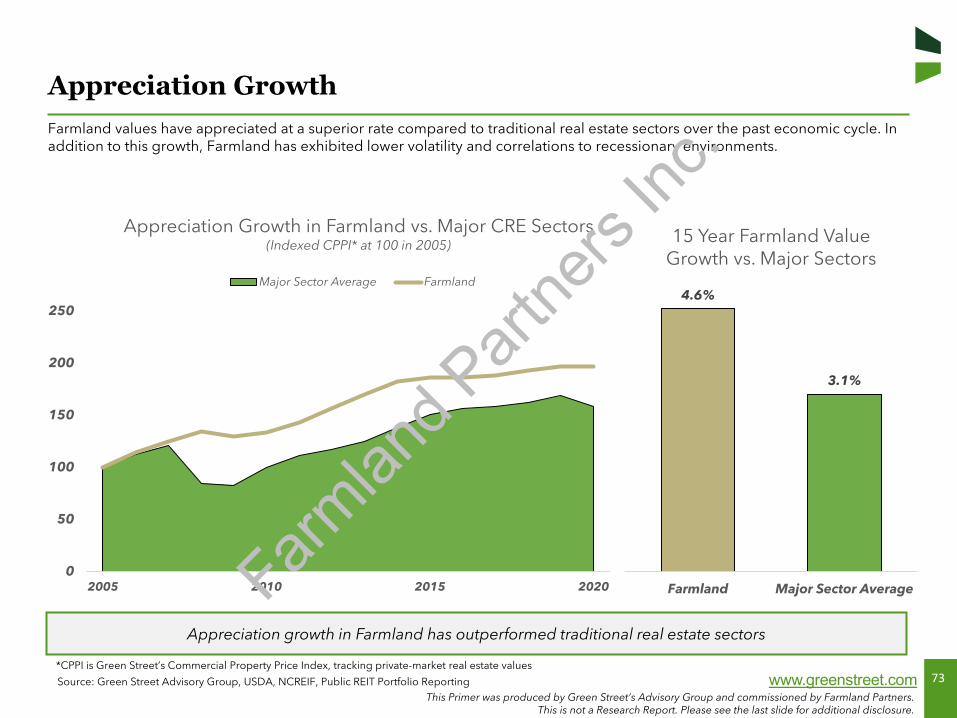
73This Primer was produced by Green Street’s Advisory Group and commissioned by Farmland Partners.
This is not a Research Report. Please see the last slide for additional disclosure.
www.greenstreet.com
Appreciation GrowthFarmland values have appreciated at a superior rate compared to traditional real estate sectors over the past economic cycle. Inaddition to this growth, Farmland has exhibited lower volatility and correlations to recessionary environments.
Source: Green Street Advisory Group, USDA, NCREIF, Public REIT Portfolio Reporting
Appreciation growth in Farmland has outperformed traditional real estate sectors
0
50
100
150
200
250
2005 2010 2015 2020
Appreciation Growth in Farmland vs. Major CRE Sectors(Indexed CPPI* at 100 in 2005)
Major Sector Average Farmland4.6%
3.1%
Farmland Major Sector Average
15 Year Farmland Value Growth vs. Major Sectors
*CPPI is Green Street’s Commercial Property Price Index, tracking private-market real estate values
Farmlan
d Part
ners
Inc.
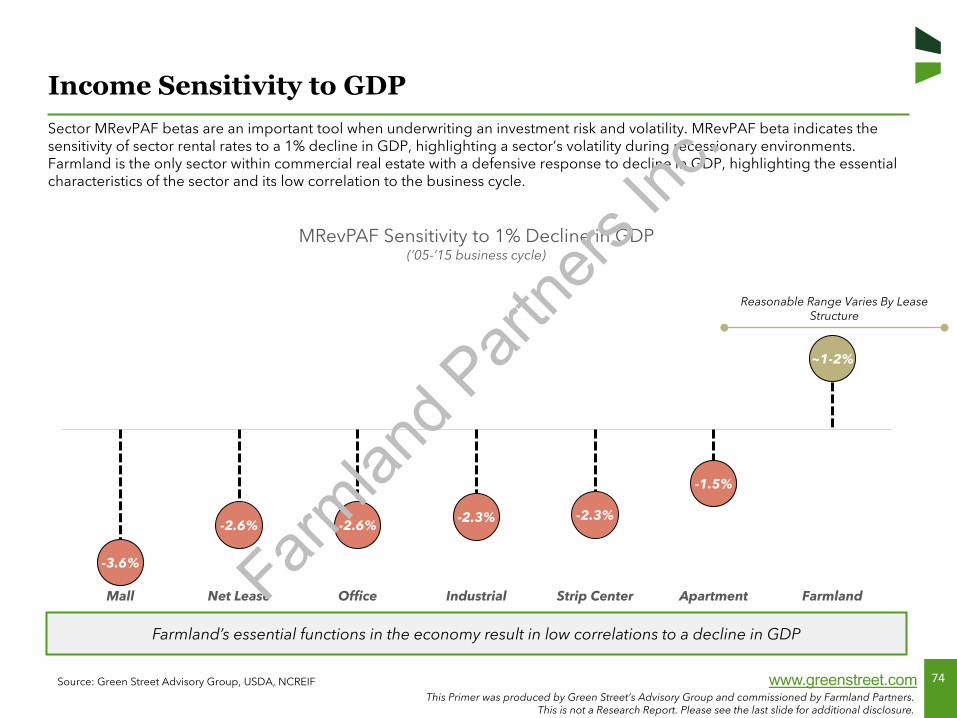
74This Primer was produced by Green Street’s Advisory Group and commissioned by Farmland Partners.
This is not a Research Report. Please see the last slide for additional disclosure.
www.greenstreet.com
Income Sensitivity to GDPSector MRevPAF betas are an important tool when underwriting an investment risk and volatility. MRevPAF beta indicates the sensitivity of sector rental rates to a 1% decline in GDP, highlighting a sector’s volatility during recessionary environments. Farmland is the only sector within commercial real estate with a defensive response to decline in GDP, highlighting the essential characteristics of the sector and its low correlation to the business cycle.
Source: Green Street Advisory Group, USDA, NCREIF
Farmland’s essential functions in the economy result in low correlations to a decline in GDP
-3.6%
-2.6% -2.6%-2.3% -2.3%
-1.5%
~1-2%
Mall Net Lease Office Industrial Strip Center Apartment Farmland
MRevPAF Sensitivity to 1% Decline in GDP(’05-’15 business cycle)
Reasonable Range Varies By Lease Structure
Farmlan
d Part
ners
Inc.
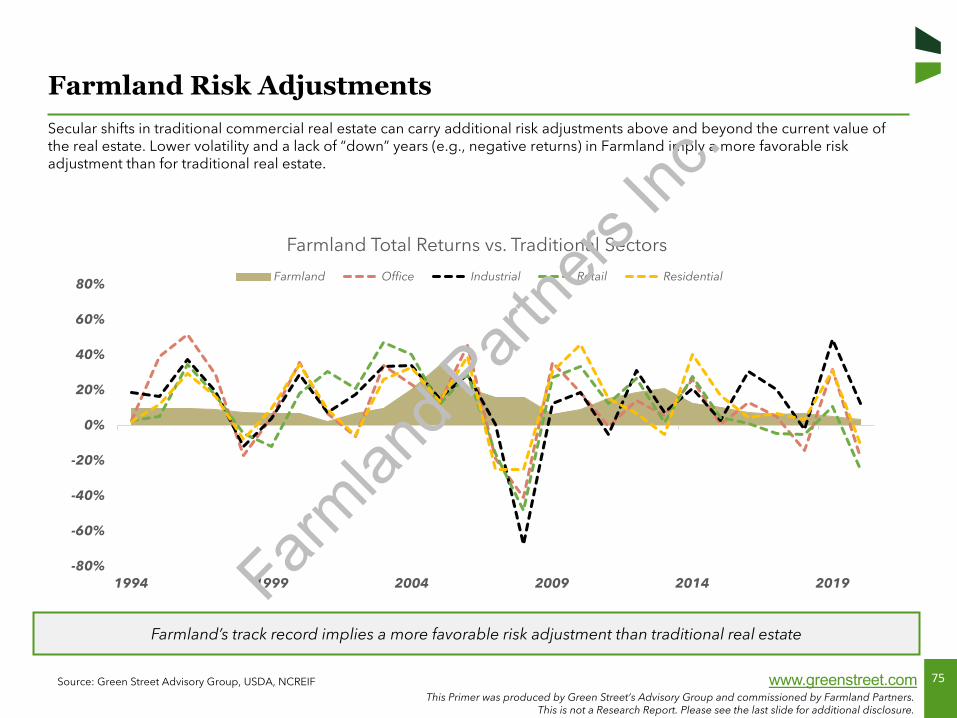
75This Primer was produced by Green Street’s Advisory Group and commissioned by Farmland Partners.
This is not a Research Report. Please see the last slide for additional disclosure.
www.greenstreet.com
Farmland Risk AdjustmentsSecular shifts in traditional commercial real estate can carry additional risk adjustments above and beyond the current value ofthe real estate. Lower volatility and a lack of “down” years (e.g., negative returns) in Farmland imply a more favorable riskadjustment than for traditional real estate.
Source: Green Street Advisory Group, USDA, NCREIF
-80%
-60%
-40%
-20%
0%
20%
40%
60%
80%
1994 1999 2004 2009 2014 2019
Farmland Total Returns vs. Traditional Sectors
Farmland Office Industrial Retail Residential
Farmland’s track record implies a more favorable risk adjustment than traditional real estate
Farmlan
d Part
ners
Inc.
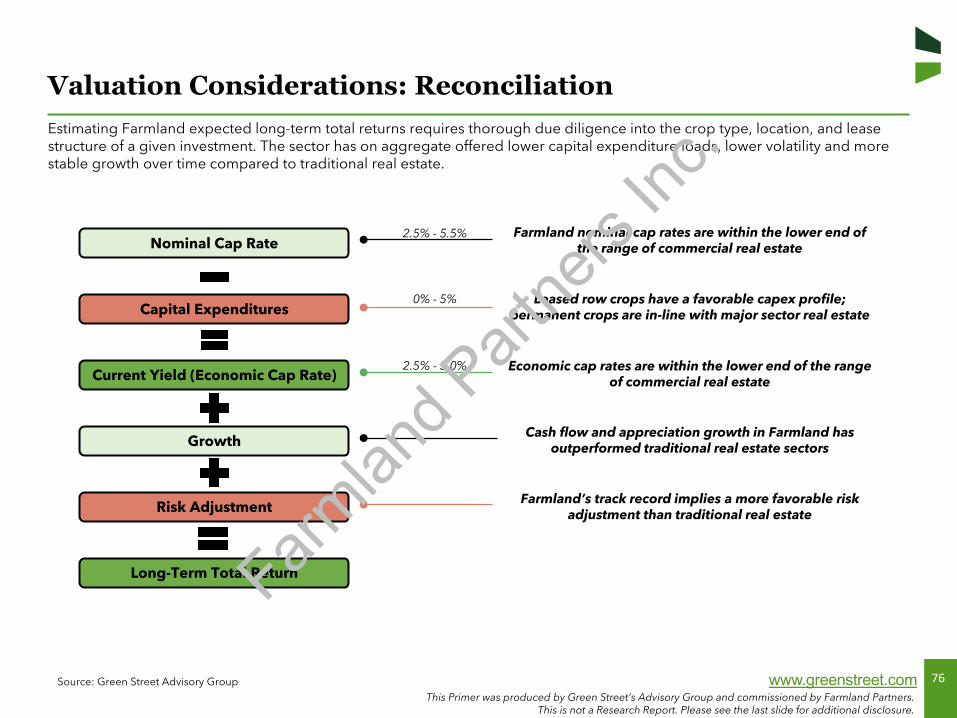
76This Primer was produced by Green Street’s Advisory Group and commissioned by Farmland Partners.
This is not a Research Report. Please see the last slide for additional disclosure.
www.greenstreet.com
Valuation Considerations: ReconciliationEstimating Farmland expected long-term total returns requires thorough due diligence into the crop type, location, and lease structure of a given investment. The sector has on aggregate offered lower capital expenditure loads, lower volatility and more stable growth over time compared to traditional real estate.
Source: Green Street Advisory Group
Current Yield (Economic Cap Rate)
Growth
Risk Adjustment
Long-Term Total Return
Nominal Cap Rate
Capital Expenditures
Farmland nominal cap rates are within the lower end of the range of commercial real estate
Leased row crops have a favorable capex profile; permanent crops are in-line with major sector real estate
Economic cap rates are within the lower end of the range of commercial real estate
Cash flow and appreciation growth in Farmland has outperformed traditional real estate sectors
Farmland’s track record implies a more favorable risk adjustment than traditional real estate
2.5% - 5.5%
0% - 5%
2.5% - 5.0%
Farmlan
d Part
ners
Inc.

77
AppendixSection VII
Farmlan
d Part
ners
Inc.
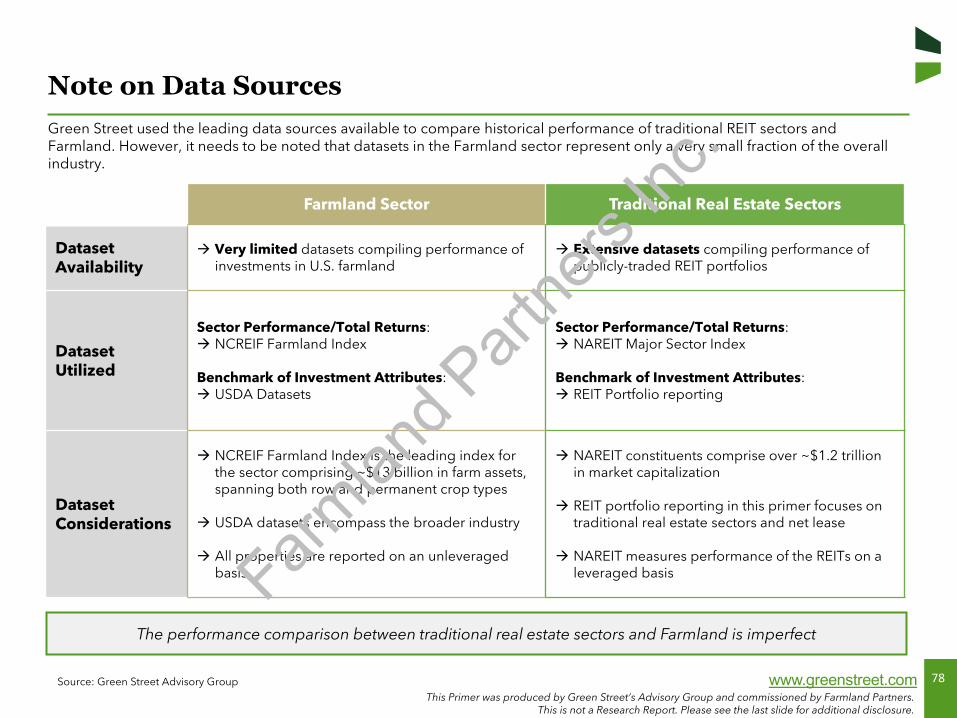
78This Primer was produced by Green Street’s Advisory Group and commissioned by Farmland Partners.
This is not a Research Report. Please see the last slide for additional disclosure.
www.greenstreet.com
Note on Data Sources
Source: Green Street Advisory Group
Farmland Sector Traditional Real Estate Sectors
Dataset Availability
Very limited datasets compiling performance of investments in U.S. farmland
Extensive datasets compiling performance of publicly-traded REIT portfolios
DatasetUtilized
Sector Performance/Total Returns: NCREIF Farmland Index
Benchmark of Investment Attributes: USDA Datasets
Sector Performance/Total Returns: NAREIT Major Sector Index
Benchmark of Investment Attributes: REIT Portfolio reporting
Dataset Considerations
NCREIF Farmland Index is the leading index for the sector comprising ~$13 billion in farm assets, spanning both row and permanent crop types
USDA datasets encompass the broader industry
All properties are reported on an unleveraged basis
NAREIT constituents comprise over ~$1.2 trillion in market capitalization
REIT portfolio reporting in this primer focuses on traditional real estate sectors and net lease
NAREIT measures performance of the REITs on a leveraged basis
Green Street used the leading data sources available to compare historical performance of traditional REIT sectors and Farmland. However, it needs to be noted that datasets in the Farmland sector represent only a very small fraction of the overallindustry.
The performance comparison between traditional real estate sectors and Farmland is imperfect
Farmlan
d Part
ners
Inc.
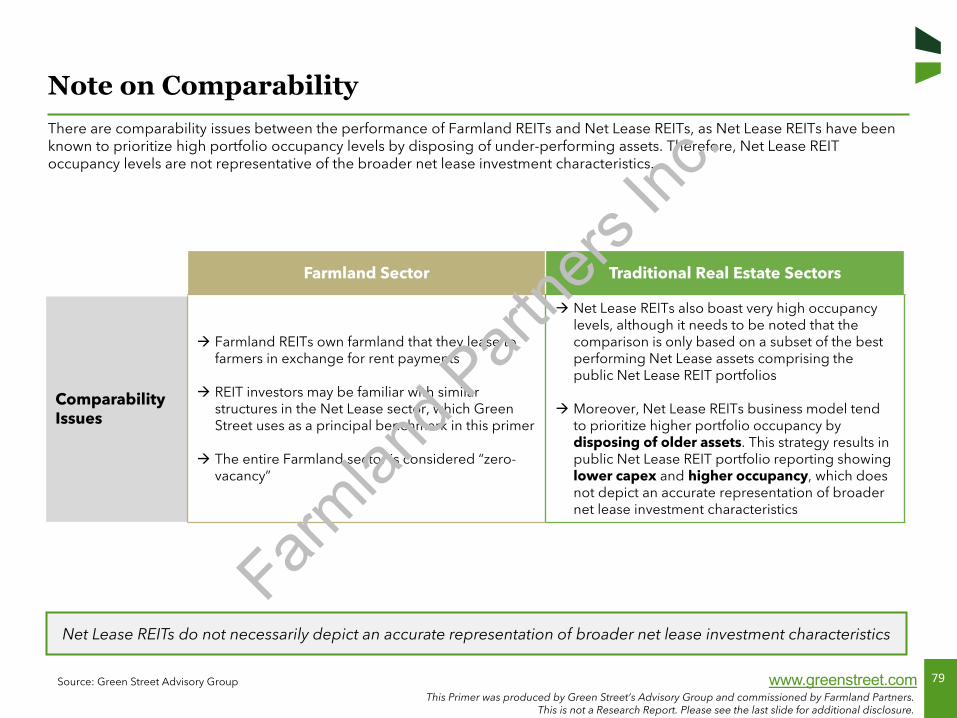
79This Primer was produced by Green Street’s Advisory Group and commissioned by Farmland Partners.
This is not a Research Report. Please see the last slide for additional disclosure.
www.greenstreet.com
Note on Comparability
Source: Green Street Advisory Group
Farmland Sector Traditional Real Estate Sectors
Comparability Issues
Farmland REITs own farmland that they lease to farmers in exchange for rent payments
REIT investors may be familiar with similar structures in the Net Lease sector, which Green Street uses as a principal benchmark in this primer
The entire Farmland sector is considered “zero-vacancy”
Net Lease REITs also boast very high occupancy levels, although it needs to be noted that the comparison is only based on a subset of the best performing Net Lease assets comprising the public Net Lease REIT portfolios
Moreover, Net Lease REITs business model tend to prioritize higher portfolio occupancy by disposing of older assets. This strategy results in public Net Lease REIT portfolio reporting showing lower capex and higher occupancy, which does not depict an accurate representation of broader net lease investment characteristics
There are comparability issues between the performance of Farmland REITs and Net Lease REITs, as Net Lease REITs have been known to prioritize high portfolio occupancy levels by disposing of under-performing assets. Therefore, Net Lease REIT occupancy levels are not representative of the broader net lease investment characteristics.
Net Lease REITs do not necessarily depict an accurate representation of broader net lease investment characteristics
Farmlan
d Part
ners
Inc.
80This Primer was produced by Green Street’s Advisory Group and commissioned by Farmland Partners.
This is not a Research Report. Please see the last slide for additional disclosure.
www.greenstreet.comwww.greenstreet.com
Green Street Headquarters100 Bayview Circle, Suite 400Newport Beach, CA 92660T 949.640.8780 F 949.640.1773
Green Street (UK)30 Panton Street, LSQ LondonLondon SW1Y 4AJ, United KingdomT +44 (0)20.3793. 7000 F +44 (0)20.3793.7001
Green Street’s News Office*5 Marine View Plaza #400Hoboken, NJ 07030T 201.659.1700
NEWPORT BEACH | LONDON | HOBOKEN
* Green Street’s News vertical is not a product of Green Street’s advisory business. Green Street News is an independent business unit of Green Street.Green Street maintains information barriers to ensure the independence of the News unit and the research and advisory services provided by Green Street.
Farmlan
d Part
ners
Inc.
81This Primer was produced by Green Street’s Advisory Group and commissioned by Farmland Partners.
This is not a Research Report. Please see the last slide for additional disclosure.
www.greenstreet.com
Green Street’s Disclosure Information
Management of Conflicts of Interest: Conflicts of interest can seriously impinge the ability of analysts to do their job, and investors should demand unbiased research. In that spirit, Green Street adheres to the following policies regarding conflicts of interest:• Green Street employees are prohibited from owning the shares of any
company in our coverage universe.• Green Street employees do not serve as officers or directors of any of our
subject companies.• Neither Green Street nor its employees/analysts receives any
compensation from subject companies for inclusion in our research.• On occasion, Green Street analysts may be contacted by companies
within the firm’s coverage universe regarding potential employment opportunities. Additional disclosure will be made when appropriate.
Please also have regard to the Affiliate Disclosure listed below when considering the extent to which you place reliance on this research presentation and any research recommendations madeherein.
Green Street, at times, assists Eastdil Secured, a real estate brokerage and investment bank, when Eastdil Secured provides investment banking services to companies in Green Street’s coverage universe. Green Street is never part of the underwriting syndicate or the selling group, but Green Street may receive compensation from Eastdil Secured for consulting services that Green Street provides to Eastdil Secured related to Eastdil Secured's investment banking services. Green Street does not control, have ownership in, or make any business or investment decisions for Eastdil Secured.
A number of companies covered by Green Street research reports pay an annual fee to receive Green Street’s research reports. Green Street may periodically solicit this business from the subject companies. In the aggregate, annual fees for Green Street (US) and Green Street (UK) research reports received from subject companies represent approximately 3% of each of Green Street (US)’s and Green Street (UK)'s respective total revenues.
Green Street publishes research reports covering issuers that may offer and sell securities in an initial or secondary offering. Broker-dealers involved with selling the issuer’s securities or their affiliates may pay compensation to Green Street upon their own initiative, or at the request of Green Street’s clients in theform of “soft dollars,” for receiving research reports published by Green Street.
The information contained in this presentation is based on data obtained from sources we deem to be reliable; it is not guaranteed as to accuracyand does not purport to be complete. This presentation is produced solely for informational purposes and is not intended to be used as the primarybasis of investment decisions. Because of individual client requirements, it is not, and it should not be construed as, advice designed to meet theparticular investment needs of any investor. This presentation is not an offer or the solicitation of an offer to sell or buy anysecurity.
References to “Green Street” in Disclosures in this section and in the Other Important Information section applyto:
•
•
Green Street (U.S.) to the extent that this presentation has beendisseminated in the USA; orGreen Street (U.K.) to the extent that this presentation has beendisseminated in the EEA.
Green Street (U.S.) is exempt from the requirement to hold an Australian financial services license under the Act in respect of the financial services; and is regulatedby the SEC under US laws, which differ from Australian laws. Green Street UK Ltd. is exempt from the requirement to hold an Australian financial services license under the Act in respect of the financial services; and is regulated by the FCA under UK laws, which differ from Australian laws.Green Street reserves the right to update the disclosures and policies set out in this document at any time. We encourage a careful comparison of these disclosures and policies with those of other research providers, and welcome the opportunity to discuss them.
Swiss recipients: the funds, the REITs, the investment companies and any collective investment schemes referred to in these reports may not have been registered with the Swiss Financial Market Supervisory Authority (FINMA) and no Swiss representative or paying agent has been appointed in Switzerland. This report is provided in Switzerland for the use of the addressees only and may not be distributed, copied, reproduced or passed on to any third parties.
Green Street reserves the right to update the disclosures and policies set out in this document at any time. We encourage a careful comparison of these disclosures and policies with those of other research providers, and welcome the opportunity to discuss them.
Affiliate Disclosure: Green Street does not directly engage in investment banking, underwriting or advisory work with any of the companies in our coverage universe. However, the following is a potential conflict regarding our affiliate that should be considered:
• Green Street has an advisory & consulting practice servicing investors seeking to acquire interests in publicly-traded companies. Green Street may provide such valuation services to prospective acquirers of companies which are the subject(s) of Green Street’s research reports.
EEA Recipients: For use only by Professional Clients and Eligible Counterparties: Green Street Advisors (UK) Ltd is authorized by the Financial Conduct Authority of the United Kingdom to issue this report to "Professional Clients" and "Eligible Counterparties" only and is not authorized to issue this report to "Retail Clients", as defined by the rules of the Financial Conduct Authority. This report is provided in the United Kingdom for the use of the addressees only and is intended for use only by a person or entity that qualifies as a "Professional Client" or an "Eligible Counterparty". Consequently, this report is intended for use only by persons having professional experience in matters relating to investments. This presentation is not intended for use by any other person. In particular, this report intended only for use by persons who have received written notice from Green Street (UK) that he/she/it has been classified, for the purpose of receiving services from Green Street (UK), as either a "Professional Client" or an "Eligible Counterparty". Any other person who receives this report should not act on the contents of this report.
Terms ofUse
Protection of Proprietary Rights: To the extent that this report is issued by Green Street (U.S.), this material is the proprietary and confidential information of Green Street and is protected by copyright. To the extent that this report is issued by Green Street (U.K.), this material is the proprietary and confidential information of Green Street (U.K.) Limited, and is protected by copyright.
This presentation may be used solely for reference for internal business purposes. This presentation may not be reproduced, re-distributed, sold, lent, licensed or otherwise transferred without the prior consent of Green Street. All other rights with respect to this presentation are reserved by Green Street.
Green Street (U.S.) generally prohibits research analysts from sending draft research reports to subject companies. However, it should be presumed that the analyst(s) who authored this presentation has(/have) had discussions with the subject company to ensure factual accuracy prior to publication, and has(/have) had assistance from the company in conducting due diligence, including visits to company sites and meetings with company management and otherrepresentatives.
Green Street Advisors, LLC is a Registered Investment Advisor doing business as Green Street. Services are only offered to clients or prospective clients where Green Street and its representatives are properly licensed or exempt from licensure.
For Green Street’s advisory customers, this research presentation is for informational purposes only and the firm is not responsible for implementation. Nor can the firm be liable for suitability obligations. Investing involves risk and possible loss of principalcapital.
This is not a research report, nor a product of Green Street’s Research department. The Green Street Research department does not cover the Farmland sector as of the date of this report. This report was produced by Green Street’s Advisory team and was commissioned by Farmland Partners, a Farmland REIT, who has approved it for public dissemination.
Farmlan
d Part
ners
Inc.