Rethinking connectivity as interactivity: a case study of Pakistan
51
Munich Personal RePEc Archive Rethinking connectivity as interactivity: a case study of Pakistan Haque, Nadeem and Pirzada, Ahmed and Ahmed, Vaqar Planning Commission of Pakistan 2011 Online at https://mpra.ub.uni-muenchen.de/34049/ MPRA Paper No. 34049, posted 11 Oct 2011 15:20 UTC
Transcript of Rethinking connectivity as interactivity: a case study of Pakistan
Munich Personal RePEc Archive
Rethinking connectivity as interactivity:
a case study of Pakistan
Haque, Nadeem and Pirzada, Ahmed and Ahmed, Vaqar
Planning Commission of Pakistan
2011
Online at https://mpra.ub.uni-muenchen.de/34049/
MPRA Paper No. 34049, posted 11 Oct 2011 15:20 UTC

1
RETHINKING CONNECTIVITY AS INTERACTIVITY: A CASE STUDY OF PAKISTAN
Nadeem Ul Haque1
Ahmed Pirzada2
Vaqar Ahmed3
A Background Paper for Planning Commission’s New Growth Strategy
Preliminary Version. Comments are Welcome
Introduction – What Do We Need?
For Pakistan to become a middle-income country, GDP must grow at a sustainable rate of eight per cent,
for more than 20 years–a challenge that can be overcome with proper planning and addressing of
priority issues. If economic growth is not leveraged on a higher t rajectory, the coming demographic
changes will imply rising unemployment, frustrated youth, shortage of assets and difficult ies in
compet ing with neighbouring South Asian countries.
Over the past several decades, Pakistan has faced defence- and security-related problems along with a
series of natural disasters, polit ical, social and economic crises that have impacted virtually all facets of
public and private life. Government and civil society inst itut ions, NGOs, businesses and cit izens are
constant ly in problem-solving and fire-fight ing mode. M oving from one crisis to another has deprived
the body polit ic from addressing intellectual and structural challenges. There is no strategic thinking on
how to solve long-term problems in a sustainable manner, and the implementat ion mechanisms of
innovat ive and high impact solut ions. The nat ional conversat ion in Pakistan simply cont inues to discuss,
dissect and debate short-term issues moving from one crisis to the next.
Like any problem-solving exercise, unpacking the riddle of slow and unpredictable growth requires bold,
innovat ive and holistic thinking about what const itutes growth, how it is sustained and deepened, and
what factors tend to limit growth in Pakistan. In a way, t radit ional neo-classical approach to growth,
where society thinks in terms of investing in public projects instead of growth strategies, is st ill
somewhat relevant. M uch of it has been tried and tested and to some extent it has succeeded; but to a
large extent it has failed in Pakistan.
Today, Pakistan confronts a new round of challenges and urgent demands. It is precisely at this
moment—in the aftermath of a devastat ing flood and with security concerns—that the need to change
the discourse about the country’s development has become most apparent. React ive tact ics and
dependence on external aid are not helping Pakistan to develop or realise its potent ial.
1 Deputy Chairman, Planning Commission of Pakistan
2 Consultant (Connect ivity Reforms), Planning Commission of Pakistan
3 Nat ional Inst itutional Advisor, Planning Commission of Pakistan

2
Box 1 – Pakistan’s New Growth Strategy
The New Growth Strategy (NGS) proposed by Pakistan’s Planning Commission, is bold, innovat ive and holist ic. It
is about Pakistan’s future. It recognises the need for greater private investment and measures that improve the
profitability of investment. It seeks to improve the investment climate, to reduce the cost of doing business,
and to eliminate obstacles to enhance efficiency and accumulat ion of knowledge.
Specifically, NGS aims to enhance productivity to propel economic growth and promote prosperity. It
emphasises: (a) bet ter governance (where the government sets policies and is the umpire, not a player); (b)
bet ter management of resources and accumulation of capital; (c) bet ter connect ivity; (d) making cit ies focal
points for creativity, not f lashpoints for conflict ; (e) involving youth and communities; (f) fostering vibrant
markets; and, (g) promoting entrepreneurship and innovat ion that lead to more and bet ter employment
opportunit ies, especially for the youth and the marginalised.
NGS is an invitat ion to all concerned to have a rigorous debate about where our effort needs to be placed.
Regardless of the eventual outcome of the process, there is no doubt a st rong consensus that a crit ical aspect
of economic growth is to provide an enabling environment—part icularly, connectivity—for economic, polit ical
and social act ivit ies.
Source: Zaidi, M . (2011). Disconnect ed? Physical Capital, Social Capital, And Connect ivity For Economic Growt h In Pakistan, Cent er for the
Process of Change
Among the many factors that const itute an enabling environment, one of the least addressed and most
important, is the degree of connect ivity that the environment offers to its economic and social actors.
No matter where and how growth is sought , a vital and most elusive quest ion within the search for high
and sustained economic growth focuses on the ease with which individuals, firms, organisat ions,
communit ies and inst itut ions connect with each other within and outside Pakistan. Put more simply, it
helps analyse the level and quality of connect ivity within Pakistan and globally.
In order to answer this quest ion, within the context of economic growth, there is a need to understand
connect ivity (and physical, human and social capitals) and its impact on sustained and sustainable
economic growth. The simplest way to conceptualise the value of connect ivity to economic growth is
through the framework of t ransact ion costs. The easier it is for people to interact with each other, the
more likely it is that they will interact . This simplified model does not capture the vastness of the
challenges to a modern economy. Nor does it capture the full value that a well-connected economy can
offer its cit izens, in economic and non-economic terms.
Efficient networks reduce the cost of achieving goals including the product ion and delivery of goods and
services through greater collaborat ion between individuals and groups. Reduct ion in t ransact ion costs,
t imely delivery of raw materials, real-t ime electronic and virtual interact ions between exist ing
infrastructure and those who maintain it , and less wastage of or damage to goods during t ransportat ion
are the benefits provided by a well-connected network. Efficient networks also enhance economies of
scale in the product ion of not only goods and services but also in the promot ion of goals and object ives.

3
Connect ivity needs to be seen within a broader context , which moves beyond the convent ional roads,
railroad networks, t rucking, airlines, computer networks, cell phones, fibre opt ic cables etc. to how
networks enhance interact ivity, with efficient use of physical, human and social capitals – and how these
resources are interwoven to produce desired outputs.
M ost people easily grasp the not ion of physical capital (infrastructure) as comprising roads, bridges, air
and sea ports, internet , phone and wireless networks. Cars, t rains, airplanes and ships that use the
physical infrastructure are also part of physical capital. However, get t ing from one locat ion to another is
also possible through video conferencing, email, Twit ter, VoIP (Voice over Internet Protocol), mobile
telephony and fixed line telecommunicat ions. This entire infrastructure is considered a part of the stock
of physical capital.
Physical capital cannot exist in the absence of cognit ive and technical capacity to establish it in the first
place, and to use it in the most efficient way thereafter. Using physical capital requires some basic skills,
for example t ruck drivers need to know how to use the st ick shift on their Bedford or M ack trucks.
Similarly, software developers need to iron out video conferencing problems to service their remote
clients. Scient ists constant ly t ry to find cheaper alternat ive fuels to make the airline industry more
efficient and profitable. In a similar vein, cell phones began with t ransmit t ing just voice, then basic text
in the form of SM S, then more complex data through the internet, and now offer live video streams of
events taking place thousands of miles away.
The ingenuity, craftsmanship, innovat ion, creat ivity, endurance and thirst for profit that drive the
constant use and improvement of physical capital const itute human capital. Human capital is most
commonly measured through stock of skills, knowledge, experience, reputat ion, and physical at t ributes
of people in a given economy. It is less tangible than physical capital and much more difficult to
measure. It is what is required to convert the latent potent ial of physical capital into product ive output.
It is representat ive of the software of economic act ivity and growth.
But human capital alone is not enough; if physical capital is the hardware of an economy, and human
capital is its software, another input needs to be ident ified that is vital to making full use of hardware
and software. It is inconceivable that there could be much use of hardware or software without a
network connect ion. What use are laptops and applicat ions that run on them, if they cannot connect to
other servers and users? Networks bring people together to interact , by ut ilising the infrastructure, and
enhancing product ivity. The value of these networks is known as social capital.
The report explores this enormously valuable resource which generates happiness and prosperity. To
understand social capital, physical and human capitals are taken as the underlying resources that define
social connect ivity or community as the directory of people one can connect within a collect ive ent ity.
Personal network can be seen as one’s contact-list of members within the community. Social capital can
be defined as the knowledge and experience (a) members of a community have of other members and,
(b) how they interact opt imally within the community, given the formal and informal rules, tact ics and
strategies one learns over t ime by interact ing within the community.
The not ion and concept of social capital has been used since the 19th
century to mean goodwill,
fellowship and mutual sympathy.4 In 1960, Jane Jacobs defined it as ‘value of networks’ which leaves
open quest ions on what exact ly is a network and how to measure the value of a network. Both are
4 L J Hanifan, ‘The Rural School Community Cent re’, Annals of the American Academy of Polit ical and Social Science, vol. 67,
1916, pp.130-138.
4
challenging quest ions. In early 1990s, Burt and Putnam used terms such as friends, colleagues, norms,
t rust and contacts that facilitate coordinat ion and cooperat ion for mutual benefit to define social
capital.
Fukuyama defines social capital as a ‘set of informal values or norms shared among members of a group
that permits them to cooperate with one another’.5 He sees social capital as less bound-up in social
structures the way Coleman sees it . According to Fukuyama, ‘all social relat ions and social structures
facilitate some forms of social capital; actors establish relat ions purposefully and cont inue them when
they cont inue to provide benefits; and, social capital is linked in a more germane way to values and
norms of an informal nature’6 whereas, for Coleman, ‘social capital manifests itself inherent ly in
obligat ions, expectat ions, social relat ions, and norms’.7
M easuring social capital is difficult , but it clearly enables and impacts economic growth significant ly. Like
physical and human capital, social capital offers an important kind of connect ivity. Roads and broadband
may help bring people together, in tangible and measurable ways, but the depth with which personal
and professional associat ions, religious and tribal affiliat ions connect people with each other is
potent ially immense. Social capital is a resource that grows with intensity of interact ion and depreciates
if not used. It can be inherited or acquired by associat ion—e.g. via family connect ions or religious
affiliat ion, or it may be developed through interact ions. One must not confuse social capital as an end in
itself but as a resource that is used for achieving goals, just like technology and labour are used for
producing goods and services.
In a study of 630 urban and rural dwellers in Russia it was found that social capital can be built even
when people do not have shared backgrounds, as long as fairness, generosity, helpfulness, and trust
exist .8 An important caveat to the role of t rust , and culture in determining the levels of social capital is
provided by Sobel, wherein a review of a wide array of research suggests how difficult it is to draw
conclusions from cross-cultural comparisons of t rust .9 The inst itut ional and cultural frameworks that
foster t rust may be different in different countries and controlling for these features may therefore have
different implicat ions in different set t ings.
Technology is impact ing the newest and most cut t ing-edge thinking about social capital. Recent studies
have examined the manner in which social capital is built and used by online communit ies. Ganley and
Lampe find that members of online communit ies begin to develop deep networks, at fairly low levels of
part icipat ion.10
Emphasis on social capital comes from observing and not icing the recent t rend, which views it as an
essent ial resource for economic development. Recent literature highlights organisat ions taking social
capital as an essent ial input in their product ion funct ion, where it is part of organisat ion capital just as
customer lists, intellectual property, reputat ion, brand-name, processes and procedures, human capital
and physical assets. When social capital rises, marginal products of other resources also rise, which are
manifested through increased product ivity and ult imately as economic growth and prosperity. However,
5 F Y Fukuyama, ‘Social Capital and the Global Economy’, Foreign Affairs, vol. 74, no. 5, 1995.
6 ibid
7 J C Coleman, ’Social capital in the creation of human capital’, American Journal of Sociology, vol.94, 1988, pp. 95-120.
8 S Gachter, B Herrmann, and C Thoni, ‘Trust , voluntary cooperat ion, and socio-economic background: survey and experimental
evidence,’ Journal of Economic Behavior & Organisat ion, Elsevier, vol. 55, no. 4, 2004, pp.505-531. 9 J Sobel, ‘Can We Trust Social Capital,’ Journal of Economic Literature, vol. XL, 2002, pp. 139-154.
10 D Ganley and C Lampe, ’The t ies that bind: Social network principles in online communit ies’, Decision Support Systems, vol.
47, 2009, pp. 266-274.

5
Ostrom observes the difficulty of creat ing social capital through external intervent ions.11
Realizing that
the two people cannot be forced to interact with each other, the most that a government can or should
do is improve the infrastructure necessary for interact ion.
Similarly, Facebook–a community of people on the Internet, needs a combinat ion of hardware and
software and the members use their human capital (to access and use the plat form), along with the
directory listing of other members of the community, and a way for contact ing and interact ing with each
other to achieve a common goal. A similar role is played by libraries, community centres, religious
venues, parks and play grounds, etc. to bring people together on a single plat form where they can
interact for some common goal. Within communit ies, libraries play a significant role, especially in large
urban areas, colleges and universit ies, where they are viewed as venues for people to meet and
collaborate rather than places for studying, reading or borrowing books.
It is not just libraries and play grounds but t ransportat ion and telecommunicat ion that also play an
important role in developing networks between communit ies and cult ivat ing them for common goals.
Table 1: Quality of Infrastructure
Road Rail Port Air
Pakistan 72 55 73 81
India 90 23 83 71
China 53 27 67 79
Bangladesh 100 71 107 117
Indonesia 84 56 96 69
M alaysia 21 20 19 29
Thailand 36 57 43 28
Source: Global Compet it iveness Report 2010
As evident in Table 1, Pakistan seems to already have the road infrastructure in place, which is better
than India, Bangladesh, and Indonesia, but its rail and air infrastructure leave much to be desired. To
increase product ivity, exist ing infrastructure needs to be ut ilised efficiently through improved
management and safety.
Almost all infrastructure projects have relied heavily on government funding with lit t le or no investment
from the private sector. Only in the last decade did the government withdraw from the telecom sector
through privat isat ion. This has resulted in considerable gains in producer and consumer surpluses. Now
the telecom sector has not only improved connect ivity in Pakistan but has also contributed PKR 109
billion to the Federal Board of Revenue (FBR) in 2009-10. Annual telecom revenues have increased from
PKR 144 billion at the t ime of privat isat ion in 2005 to PKR 358 billion in the fiscal year 2009-10.12
11
E Ost rom, ‘Social Capital: A fad or fundamental concept ’, Cent re for the Study of Inst itut ions, Populat ion, and Environmental
Change, Indiana University, 1999. 12
Pakistan Telecommunicat ion Authority (PTA), ‘Broadband and Value Added Services’, 2007.

6
The next sect ion reviews the relevant literature which looks at connect ivity as an important factor of
economic growth. It is followed by a brief overview of the state of physical and social infrastructure in
Pakistan today and also analyses how the present state of infrastructure and lack of social capital induce
inefficiencies in markets that constrain economic growth. The conclusion discusses a few high priority
reforms as a way of improving connect ivity in Pakistan.
Literature Review
Improvement in connect ivity creates and cult ivates opportunit ies by linking individuals, organisat ions,
communit ies and markets, and reduces t ime and costs required for product ive interact ions. Some
numeric est imates from research literature show the effect of infrastructure on growth. However, these
est imates need to be compared with investments in other economic act ivit ies to determine which ones
offer the best returns on investment.
Efficient t ransport and telecommunicat ion networks reduce product ion and transact ion costs in poor
regions13
which serve as st imulus for domest ic commerce. Empirical research shows that poverty
incidence in ‘good-road provinces’ and ‘bad-road provinces’ of Indonesia decline by 0.33 and 0.09
percentage points respect ively, for every one percentage point growth in provincial GDP. Increase in
roads also appears to improve the wages and employment levels of the poor.14
Another study shows
that poor households in Vietnam living in rural communit ies with paved roads have a 67 per cent higher
probability of escaping poverty than those living in communit ies without paved roads.15
Improved transport infrastructure has also reduced poverty incidence in People’s Republic of China
through agricultural product ivity and non-farm employment. One per cent increase in road density
increases agricultural GDP per worker by 0.08 percentage points, non-agricultural employment by 0.10
percentage points and wages of non-agricultural workers in rural areas by 0.15 percentage points.
Among all infrastructure projects, roads have played a major role in reducing poverty–for every 10,000
Yuan invested on rural roads, 3.2 poor persons are est imated to be lifted out of poverty.16
Caldron and Serven find that infrastructure development has a relat ively greater posit ive impact on the
income and welfare of the poor, hence addressing issues of income inequality.17
This analysis supports
Estache’s findings that infrastructure helps poorer individuals and underdeveloped areas to get
connected to core act ivit ies, thus allowing them access to more product ive opportunit ies.18
These
studies also ident ify the posit ive impacts of infrastructure services on health and educat ion of the poor,
which boosts employment, product ivity and growth.
13
C Gannon and Z Liu, ‘Poverty and Transport ,’ M imeo, The World Bank, Washington, DC, 1997. 14
I Ali and E M Pernia, ‘Infrast ructure and Poverty Reduction- What is the Connection?’, Asian Development Bank 15
P Glewwe, M Gragnolat i and H Zaman, ‘Who Gained from Vietnam’s Boom in the 1990s? An Analysis of Poverty and
Inequality Trends’, World Bank Working Paper 2275, Washington, D.C. 16
S Fan, L Zhang and X Zhang, ‘Growth, Inequality, and Poverty in Rural China: The Role of Public Investments’, Research Report
125, Internat ional Food Policy Research Inst itute, Washington, D.C., 2002. 17
C Calderon and L Serven, ‘The effects of infrast ructure development on growth and income dist ribution’, 2004. 18
A Estache, ‘On Lat in America’s Infrast ructure Privat isat ion and its Dist ributional Effects’, M imeo, The World Bank, Washington
DC., 2003.

7
Cell phones and the Internet have become major drivers of growth and development in many countries.
Studies have shown that 10 extra cell phones per 100 people induce 0.6 percentage points of extra per
capita GDP.19
Another study indicates that cell phones are more effect ive in promot ing growth in
developing countries (inducing an extra 0.81 percentage GDP points by introduct ion of 10 cell phones
per 100 people) than landline phones (also 10 per 100 people), but have not been as effect ive as
internet and broadband access, which induce an extra 1.12 and 1.38 GDP percentage points.20
However,
to compare these gains to other investments that also increase GDP and human welfare is beyond the
scope of this report .
Cell phones provide labour flexibility and facilitate small entrepreneurs. One such example is of Quadir
(a barber) in Bangladesh. Since he was unable to afford the rent for a shop, he bought a cell phone and a
motorbike and now goes to his customers’ homes for providing his services.21
This has enabled him to
serve a larger area and also charge a higher price for his services. Similarly, cell phones have also
promoted flexibility among other small entrepreneurs, such as taxi-drivers and mechanics. By providing
quick access to informat ion, cells phones have made small markets more efficient . In Kerala, India, use
of cell phones has made the fish markets more efficient because fishermen can now check the prices in
several markets before deciding where to sell.22
Through wider use of cell phones, corrupt ion can also
be reduced. In Pakistan, Zubair Bhatt i asked clerks in Jhang district , who handled land transfers, to
submit daily list of t ransact ions, giving the amount paid and the mobile number of buyers and sellers to
find out whether they had been asked to pay bribes. The guilty part ies were then charged formally
which deterred future corrupt ion.23
A study performed by Caldron and Serven shows that growth benefits of telecommunicat ions are higher
than those of the t ransport networks.24
In their analysis, one standard deviat ion increase in total
telephone lines (telecommunicat ions) increases the growth rate by 3.1 percentage points whereas one
standard deviat ion increase in the length of road and rail network (t ransport) increases the growth rate
by 1.4 percentage points. A study carried out by LECG, an economics research and consult ing firm,
quant ifies product ivity gains for different levels of broadband adopt ion. It finds an increase in
product ivity of 0.1 percentage points for every broadband line added per 100 people in countries with
medium or high level of ICT (Informat ion and Communicat ions Technology). In countries with low level
of ICT, increase in broadband penetrat ion creates the ICT eco-system required to realise product ivity
gains.25
Apart from having a direct impact on economic development, physical connect ivity also has an
indirect effect via improvement in social capital.
Development economics began to integrate not ions of social capital into research in the late 1990s, and
perhaps the most important examinat ion of social capital within a development narrat ive has been
carried out by M ichael Woolcock. Woolcock26
and Narayan27
found that social capital could bring more
19
L Waverman, M Meschi and M Fuss, ‘The Impact of Telecoms on Economic Growth in Developing Count ries’, 2005. 20
C Z W Qiang, ‘M obile Telephony: A Transformational Tool for Growth and Development ’, Private Sector Development ,
Proparco's Magazine, vol. 1, no.4, 2009. 21
‘M obile M arvels, A Special Report on Telecoms in Emerging M arkets’, The Economist , September, 24th edit ion, 2009 22
R Jensen, R, ‘The Digital Provide: Information (Technology), M arket Performance, and Welfare in the South Indian Fisheries
Sector’, The Quarterly Journal of Economics, vol. CXXII, no.3, 2007, pp.879-924. 23
‘M obile M arvels, A Special Report on Telecoms in Emerging M arkets’, The Economist , September, 24th edit ion, 2009 24
C Calderon and L Serven, ‘The effects of infrast ructure development on growth and income dist ribution’, 2004. 25
‘Economic Impact of Broadband: An Empirical Study’, LECG, 2009. 26
M Woolcock, ‘Social Capital and Economic Development : Toward a Theoretical Synthesis and Policy Framework’, Theory and
Society, vol. 27, 1998, pp.151-208. 27
D Narayan, ‘Bonds and Bridges: Social Capital and Poverty,’ Poverty Group, World Bank, 1999.

8
opportunit ies and thus alleviate poverty and promote economic development. Kawachi and Berkman
found that social cohesion, t ies and trust are posit ively associated with self-rated health status, and
negat ively with mortality and crime rates in a community.28
In a similar vein, Helliwell and Putnam found
that a community’s level of social capital is posit ively associated with school performance.29
Knack and Keefer explore the relat ionship between economic performance in 29 market economies and
the levels of t rust and civic norms in those economies. They observe three things: (1) t rust and civic
cooperat ion have significant impact on aggregate economic act ivity; (2) horizontal networks (measured
by membership in groups) are unrelated to t rust and civic norms (controlling for educat ion and income)
and to economic performance; and (3) low social polarisat ion, and formal inst itut ional rules that
constrain the government from act ing arbit rarily, are associated with the development of cooperat ive
norms and trust .30
Akdere and Roberts have summarised some key advantages and disadvantages of social capital. They
highlight three important benefits of social capital, as ident ified by Sandefur and Laumann31
, to be
informat ion, influence and control, and social solidarity.32
Social capital can also lead to problems of free-riding where less-hardworking group members
possessing greater social capital ‘make demands on more successful members’. Portes summarises this
economic downside as a process where ‘opportunit ies for entrepreneurial accumulation and success are
dissipated’.33
The quest ion of group ownership often leads to confusion about whether social capital
benefits the group or the individuals.34
Other disadvantages of social capital, ment ioned by Akdere and
Roberts are ‘exclusion of outsiders’ and ‘downward levelling of norms’.35
Specialised social capital within
a community can deny access to outsiders—e.g. sugar-mill owners may collude to control sugar supply
and seek legal protect ion (by bribing or lobbying) making it difficult for potent ial suppliers to supply to
the market. Similarly, mafia families and criminal gangs damage social norms. Labour unions can also
use internal linkages to influence decision making in ways which lead to inferior outcomes.
It is not just the quant ity of connect ivity infrastructure which effects growth and income distribut ion but
also how efficient ly it is used. One quarter of the growth different ial between Africa and East Asia, and
40 per cent of the growth different ial between high and low growth countries is due to the difference in
the effect ive use of infrastructure resources.36
The effect iveness of infrastructure depends on the
efficiencies of agencies and inst itut ions, which are related to physical infrastructure development, such
as the Nat ional Highway Authority (NHA) in the case of Pakistan.37
28
I Kawachi and L F Berkman, ‘Social Cohesion, Social Capital and Health’, in Social Epidemiology, Oxford University Press, 2000 29
J F Helliwell and R D Putnam, ‘Educat ion and Social Capital’, NBER Working Paper Series, Vol. 7121, 1999. 30
S Knack and P Keefer, ‘Does Social Capital Have an Economic Payoff?’, The Quarterly Journal of Economics, vol. 112, 1997,
pp.1251-1288. 31
R L Sandefur and E Laumann, ‘A Paradigm for Social Capital’, Rat ionalit y and Society,vol. 10, no.4, 1998, pp.481-501. 32
M Akdere and P Robert , ‘Economics of Social Capital: Implicat ions for Organisat ional Performance’, Advances in Developing
Human Resources, vol. 10, no. 6, 2008, pp.802-816. 33
A Portes and P Landolt., ‘The downside of social capital’, The American Prospect , vol. 26, no. 94, 1996, pp.18–22. 34
L Crudelli, ‘Social Capital and Economic Opportunit ies’, Journal of Socio Economics, vol. 35, no.5, 2006, pp. 913-927. 35
ibid. 36
C Hulten, ‘Infrast ructure Capital and Economic Growth: How Well You Use It M ay Be M ore Important than How M uch You
Have’, NBER Working Paper 5847, 1996. 37
H Esfahani and MT Ramirez, ‘Institut ions, Infrast ructure and Economic Growth’, Journal of Development Economics, vol. 70,
2002, pp. 443–77.

9
Connectivity in Pakistan
Together telecom and transport sector of Pakistan account for more than 12 per cent of total GDP.
Telecom sector has a share of two percent of GDP but contributes 6 to 7 per cent in total tax revenue.
Transportat ion sector has a much bigger GDP share of 10.5 per cent and also provides over 6 per cent of
employment in the country.
According to the World Bank ‘although the [t ransport ] sector is funct ional, its inefficiencies (long wait ing
and travelling t imes), high costs, and low reliability are dragging the country’s economic growth. These
factors also reduce the compet itiveness of the country’s exports, increase the cost of doing business,
and constrain Pakistan's ability to integrate into global supply chains, which require just -in-t ime delivery.
The poor performance of the sector is est imated to cost the economy about 5 per cent of GDP every
year’.38
Road and Trucking
Road Infrastructure
The federal budget exhibits a strong bias towards financing the construct ion and maintenance of roads.
Since 1996, total road length has increased by 13 per cent to 259,618 km in 2010, out of which 70%
(179,290 km) are high-type (paved) roads. Nat ional Highways and M otorways const itute 4.2 per cent of
the total road network and handle more than 85 per cent of total commercial t raffic in Pakistan.39
M ost of Pakistan’s highways and motorways are along the North-South corridor with N-5 act ing as the
main artery carrying 55 per cent of the country’s inter-city t raffic. Other major roads include N-55 (Indus
Highway), N-25, N-65, N-40 (RCD Highway) N-45, N-50, N-70, N-35 (Karakoram Highway), M -1
(Islamabad-Peshawar M otorway), M -2 (Islamabad-Lahore M otorway) and M -3 (Pindi Bhatt ian-
Faisalabad M otorway). Around 60 per cent of the road network is in poor condit ion, mainly due to poor
maintenance, t raffic congest ion and burst t ires lit tering the highways and making them dangerous,
especially at night, when there is poor visibility. There has been a significant shift from railways to roads,
for both passenger and freight t ransport .
Over the past few years, there has been gradual increase in the length of paved roads and decline in
low-type (unpaved) roads, since most low-type roads are being converted to high-type. National
Highway Authority (NHA) has been carrying out extensive road development projects. 30 new projects
are focusing on extending the network by 1,000 km, including bridges, flyovers and interchanges. NHA
has also managed to increase its toll revenue by 36 per cent over the past year.
Another problem in road transportat ion is corrupt ion within the police system. Traffic laws are lax in
Pakistan—breaking the law and underage rash driving are common occurrences on the road. Policemen
rarely punish violators. They are often underpaid and work long hours and therefore resort to accept ing
bribes in return for let t ing law breakers go free. Corrupt ion is also rampant when awarding construct ion
38
‘Doing Business in Pakistan 2010’, The World Bank, Washington DC, 2010 39
Nat ional Highway Authority Pakistan, www.nha.gov.pk
10
of road projects. Roads are constructed poorly with low standards so that they deteriorate quickly and
contracts are then given to the same firms for repair and maintenance.
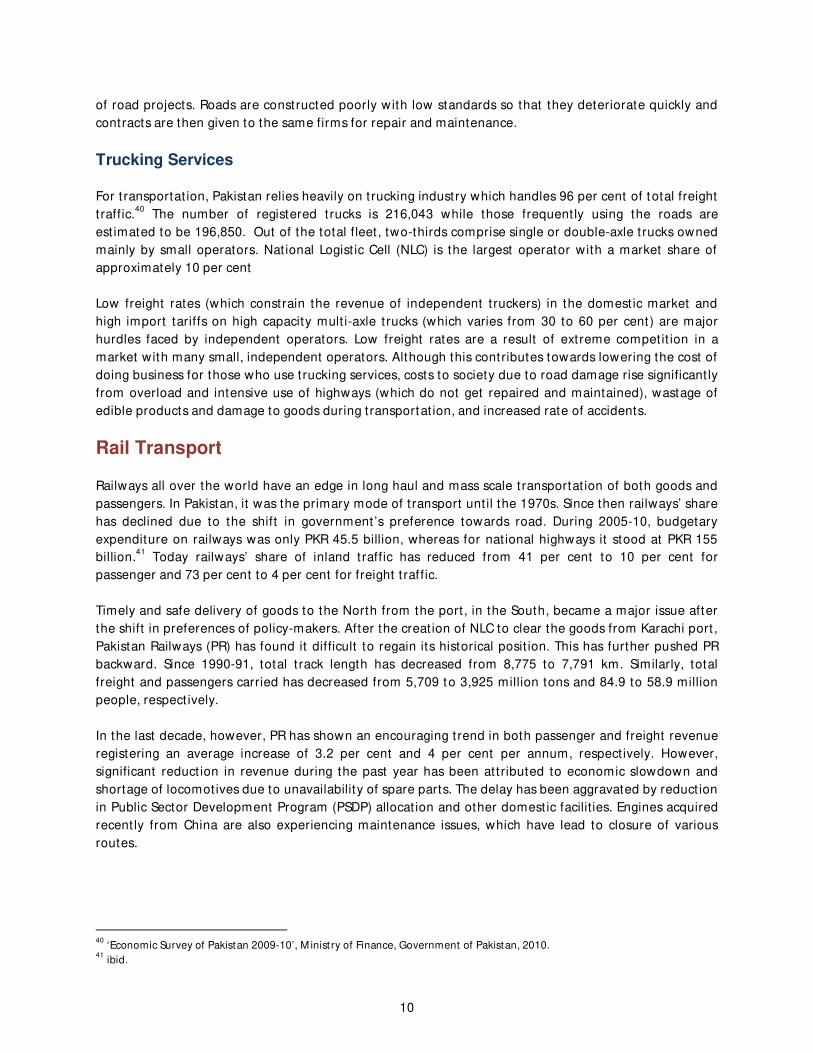
Trucking Services
For t ransportat ion, Pakistan relies heavily on trucking industry which handles 96 per cent of total freight
t raffic.40
The number of registered trucks is 216,043 while those frequent ly using the roads are
est imated to be 196,850. Out of the total fleet , two-thirds comprise single or double-axle t rucks owned
mainly by small operators. Nat ional Logist ic Cell (NLC) is the largest operator with a market share of
approximately 10 per cent
Low freight rates (which constrain the revenue of independent t ruckers) in the domest ic market and
high import tariffs on high capacity mult i-axle t rucks (which varies from 30 to 60 per cent) are major
hurdles faced by independent operators. Low freight rates are a result of extreme compet it ion in a
market with many small, independent operators. Although this contributes towards lowering the cost of
doing business for those who use t rucking services, costs to society due to road damage rise significant ly
from overload and intensive use of highways (which do not get repaired and maintained), wastage of
edible products and damage to goods during t ransportat ion, and increased rate of accidents.
Rail Transport
Railways all over the world have an edge in long haul and mass scale t ransportat ion of both goods and
passengers. In Pakistan, it was the primary mode of t ransport unt il the 1970s. Since then railways’ share
has declined due to the shift in government ’s preference towards road. During 2005-10, budgetary
expenditure on railways was only PKR 45.5 billion, whereas for nat ional highways it stood at PKR 155
billion.41
Today railways’ share of inland traffic has reduced from 41 per cent to 10 per cent for
passenger and 73 per cent to 4 per cent for freight t raf fic.
Timely and safe delivery of goods to the North from the port , in the South, became a major issue after
the shift in preferences of policy-makers. After the creat ion of NLC to clear the goods from Karachi port ,
Pakistan Railways (PR) has found it difficult to regain its historical posit ion. This has further pushed PR
backward. Since 1990-91, total t rack length has decreased from 8,775 to 7,791 km. Similarly, total
freight and passengers carried has decreased from 5,709 to 3,925 million tons and 84.9 to 58.9 million
people, respect ively.
In the last decade, however, PR has shown an encouraging trend in both passenger and freight revenue
registering an average increase of 3.2 per cent and 4 per cent per annum, respect ively. However,
significant reduct ion in revenue during the past year has been at t ributed to economic slowdown and
shortage of locomotives due to unavailability of spare parts. The delay has been aggravated by reduct ion
in Public Sector Development Program (PSDP) allocat ion and other domest ic facilit ies. Engines acquired
recent ly from China are also experiencing maintenance issues, which have lead to closure of various
routes.
40
‘Economic Survey of Pakistan 2009-10’, M inist ry of Finance, Government of Pakistan, 2010. 41
ibid.
11
Table 2: Revenue of Pakistan Railways
Fiscal
Year
Revenue
(PKR M illion)
per cent
Change
1998-99 9,310 --
1999-00 9,889 6.2
2000-01 11,938 20.7
2001-02 13,046 9.3
2002-03 14,812 13.5
2003-04 14,636 -1.2
2004-05 18,027 23.2
2005-06 18,184 0.9
2006-07 19,194 5.5
2007-08 19,973 4.1
2008-09 23,160 16.0
2009-10
Jul- Mar
16,875 -3.3
Source: Economic Survey of Pakistan 2009-10
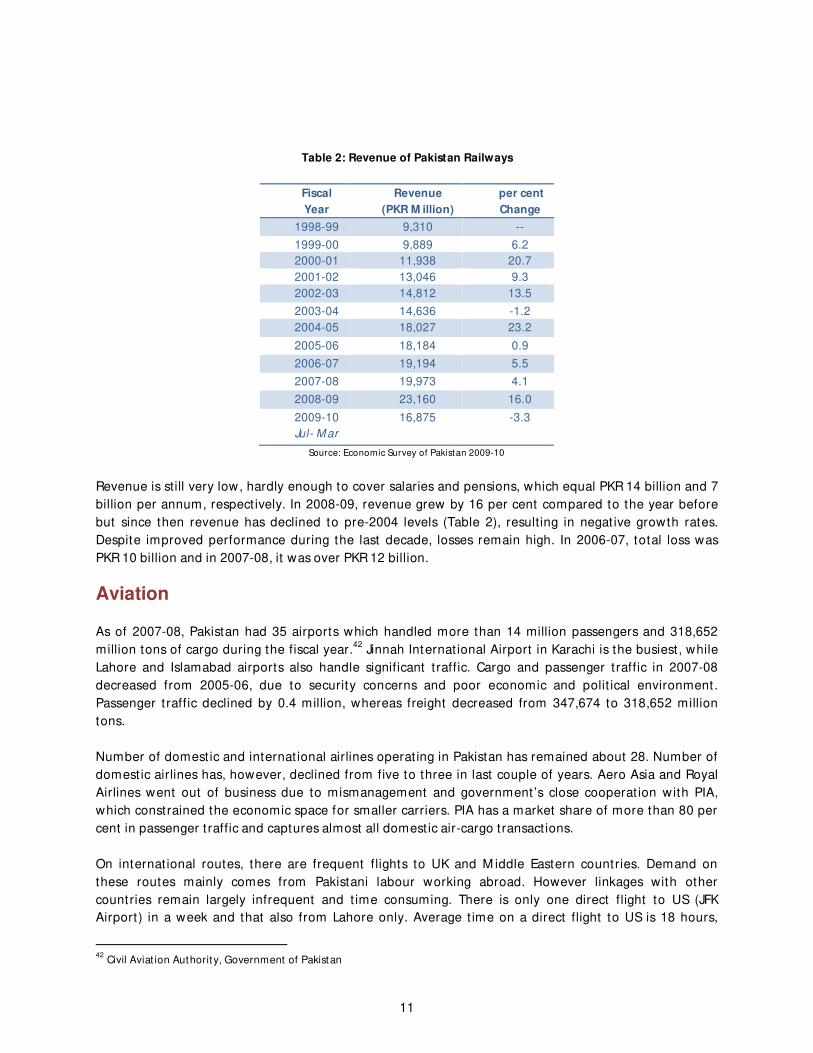
Revenue is still very low, hardly enough to cover salaries and pensions, which equal PKR 14 billion and 7
billion per annum, respect ively. In 2008-09, revenue grew by 16 per cent compared to the year before
but since then revenue has declined to pre-2004 levels (Table 2), resulting in negat ive growth rates.
Despite improved performance during the last decade, losses remain high. In 2006-07, total loss was
PKR 10 billion and in 2007-08, it was over PKR 12 billion.
Aviation
As of 2007-08, Pakistan had 35 airports which handled more than 14 million passengers and 318,652
million tons of cargo during the fiscal year.42
Jinnah Internat ional Airport in Karachi is the busiest , while
Lahore and Islamabad airports also handle significant t raffic. Cargo and passenger t raffic in 2007-08
decreased from 2005-06, due to security concerns and poor economic and polit ical environment.
Passenger t raffic declined by 0.4 million, whereas freight decreased from 347,674 to 318,652 million
tons.
Number of domest ic and internat ional airlines operat ing in Pakistan has remained about 28. Number of
domest ic airlines has, however, declined from five to three in last couple of years. Aero Asia and Royal
Airlines went out of business due to mismanagement and government ’s close cooperat ion with PIA,
which constrained the economic space for smaller carriers. PIA has a market share of more than 80 per
cent in passenger t raffic and captures almost all domest ic air-cargo transact ions.
On internat ional routes, there are frequent flights to UK and M iddle Eastern countries. Demand on
these routes mainly comes from Pakistani labour working abroad. However linkages with other
countries remain largely infrequent and t ime consuming. There is only one direct flight to US (JFK
Airport) in a week and that also from Lahore only. Average t ime on a direct flight to US is 18 hours,
42
Civil Aviat ion Authority, Government of Pakistan

12
whereas on connect ing flights it normally takes more than 24 hours. Similarly, there are only two direct
flights to China (Beijing Airport), each week. Also, there are few flights to Germany, France and other
European dest inat ions. Connect ivity with Africa, Lat in America and South East Asia is also limited.
Current ly there is no Pakistani airline flying to African and Lat in American countries mainly due to lit t le
demand. South East Asia also stays untouched by Pakistani airlines, except one or two direct flights to
M alaysia. Connect ing flights to these dest inat ions are available but it takes much longer than flying
direct and adds uncertainty to t ravel plans.
An in-depth study needs to be carried out to ascertain the demand for flights from Pakistan to various
internat ional cit ies at different prices and how much of that demand (domest ic and internat ional) can
be fulfilled through exist ing airlines, if there were no restrict ions imposed by the government regarding
the number of flights the airlines may offer. Per kilometre cost of air t ravel from Pakistan is also high
relat ive to regional economies (See Appendix 1).
Domest ic connect ivity also faces some constraints for growth, due to inadequate airport handling,
frequent bird hits and slow check-in procedures. Domest ic market largely stays biased towards PIA
through preferent ial route allocat ion, tax benefits and other protect ionist policies making it difficult for
new carriers to enter the aviat ion sector. Due to extra security checks on airlines flying through Pakistan
and the recent recession in the aviat ion sector, internat ional airlines have been reluctant to expand in
the Pakistani market.
Information and Communications Technology (ICT)
Due to economic slowdown in last couple of years, service-providers in Pakistan have taken several cost
cut t ing measures including opt imisation of human resources, cut in employees’ perks and freezing
employment. Recent floods have also damaged the exist ing infrastructure which has forced operators to
divert their funds away from network expansion towards repair and maintenance.
Mobile Telephony
Rural income has risen in many countries with the use of mobile phones. With the introduct ion of pre-
paid services, low-income groups have access to cellular which help provide and facilitate income-
generat ing act ivit ies. M obilink has introduced a M obilink PCO system on the basis of the village phone
model that provides income opportunit ies to households using mobile phones to sell phone calls to
those who cannot afford a cell phone.
In cit ies, text messages are being used as advert isements to promote small businesses that cannot
afford to advert ise in mainstream media. Ideas such as these should be encouraged by Pakistan Telecom
Authority (PTA) to promote businesses that would generate economic act ivity in hard to reach places.
Teledensity (phones per 100 individuals) has increased from 4.3 in 2002-03 to 64.1 in 2009-10. M uch of
this growth has come from cellular industry, which has 94.2 per cent share of telecom traffic, followed
by 3.2 per cent of fixed local loop and 2.6 per cent of wireless local loop. Cellular sector also has the
highest share (70 per cent) in telecom sector, as of 2009-10. With the coming of Warid and Telenor,
share of M obilink in the cellular sector has declined from 64 per cent in 2003-04 to 32 per cent in 2009-
10 (Figure 1). Ufone and Warid have experienced a drop in their total number of subscribers during
2009-10.

13
Fixed land line penetrat ion has remained low despite issuance of new licenses. Old copper-based
infrastructure remains a significant hurdle in its growth. To install new fibre opt ics networks, huge
investment is required. Wireless local loop operators (Wateen and Wi-tribe) have diverted their
resources towards broadband expansion.
Source: Annual Report 2009-10, PTA
Internet and Broadband
Lately, internet services have experienced significant expansion with 13 companies compet ing for
subscribers. According to ISPAK (Associat ion of Pakistani ISPs) est imates, there were about 3.5 million
internet subscribers during 2007 across Pakistan and more than 17 million users—i.e. about 5 users per
subscript ion. The number of internet users increased to 20.5 million in 2009.43
Proport ion of different broadband technologies in Pakistan is illustrated in Figure 2. DSL has historically
dominated due to the existence of fixed land line infrastructure. However, share of DSL has decreased
from 100 per cent to 53 per cent mainly due to successful experience of WiM ax technology. WiM ax was
introduced in Pakistan by Wateen Telecom Ltd (a private company) in December 2007 and since then it
has grown to 257,585 subscribers. Other players include Wi-tribe and PTCL. EvDO (by PTCL) is also a
wireless technology which uses radio signal for t ransmission. It is mainly used to provide mobile
broadband services. Init ially WorldCall was the sole provider of broadband service but now PTCL has
stepped up by offering EvDO in 100 cit ies in Pakistan.
Current ly broadband penetrat ion in Pakistan remains very low at 0.5 per cent (900,648 subscribers). This
low level of penetrat ion, despite considerable growth, is due to less focus on rural areas, low literacy,
poor computer skills, lack of local content and applicat ions, deteriorat ing standard of fixed land lines,
high costs for potent ial rural subscribers, reservations among parents regarding cyber security and child
safety, and language barriers.
43
‘The World Factbook 2010’, CIA 2010
0%
50%
100%
2003-04 2005-06 2009-10
M obilink Ufone Zong
Instaphone Telenor Warid
Figure 1: M arket Share of Cellural Subscribers (%)
52.9%
5.5%
28.6%
0.7%12.3%
DSL HFC WiM ax FTTH EvDO
Figure 2: M arket Share of
Broadband Technologies (%)

14
Connectivity Scorecard
Waverman and Dasgupta have given Pakistan a telecom connect ivity score of 1.53 out of 10 in ‘Useful
Connect ivity’.44
This gives Pakistan the lowest rank in a group of 25 resource driven economies. In the
same group, India is ranked 21st and China 17
th.
Figure 3: Connectivity Scorecard Table 3: Connectivity Scorecard
Source:www.connect ivityscorecard.org (2010)
Figure 3 shows Pakistan’s relat ive posit ion compared to leading countries in each sub-sector. Table 3,
while present ing performance in numeric form, also shows the importance of each sub-sector when
comput ing final connect ivity score. Pakistan does poorly in all sectors. However, score in the consumer
sector is relat ively better, mainly due to increasing foreign and domest ic investment in consumer-
focused ICT infrastructure.
Since 2001-02, foreign direct investment in ICT has increased from USD 6.1 million to USD 1.44 billion in
2007-08. This has resulted in improvement in consumer sector infrastructure and usage and skills
compared to previous years.45
In the Government sector, although significant infrastructure is available, which highlights government
intent ion of promot ing ICT, but due to poor usage and skills not all benefits are being realised. Business
sector, which gets 57 per cent of the total weight, does not score as high as the consumer sector, in both
infrastructure and usage and skills – business sector scores are very low. Why this is so, needs further
invest igat ion and in-depth analysis.
e-Government
Pakistan also scores poorly in e-government which if improved could significant ly increase usage of ICT
for both businesses and consumers. A United Nat ion’s survey breaks e-government development
process into five phases that include Emerging, Enhanced, Interact ive, Transact ional and Connected.46
The first stage involves online presence of various ministries in the form of web page(s) showing stat ic
44
L Waverman and K Dasgupta, ‘Connect ivity Scorecard 2010’, LECG, 2010. 45
‘Broadband and Value Added Services’, Pakistan Telecommunicat ion Authority (PTA), 2009 46
‘E-Government Survey’, The United Nat ions, 2008.
15
Box 2 – Sachivalaya Vahini or e-governance in the Secretariat in Karnataka
The Secretariat is the apex decision making body of the state and deals with a large number of departments. It
involves an enormous amount of communicat ion, keeping, maintaining and processing a large volume of data
files. The manual creat ion, movement and maintenance of f iles involved enormous delays and inefficiencies.
The government of Karnataka has recently set up a Secretariat Local Area Network by connecting 1000
computers in 40 state departments and 6000 secretariats. The Nat ional Informat ics Centre of the state
provided software support . The project has the following components:
(a) Patra-the Let ter M onitoring System. This is designed for the management of a large number of let ters
received in the secretariat by scanning these let ters and moving them from desk to desk, or department to
department ;
(b) Kadatha-File M onitoring System is the decision support system to monitor, t rack and decide/ dispose the
files without delays. Through this system, elect ronic files are moved from desk to desk and from
department to department without waste of t ime;
(c) M okaddame-Court Case M onitoring System monitors the court cases in which government is the party.
Cases received, pet it ioners/ respondents details, court orders, cases put up for hearing on a part icular
day/ type can efficient ly be managed;
(d) Aayayaya-Budget M onitoring System helps in making budget est imates. It also monitors budget proposals
once a budget is allocated to departments;
(e) Sibbandi-Personal Informat ion System maintains informat ion about details of employees. Within a single
click, the entire history of the employee can be viewed;
(f) Customer Support System provides an online system to lodge any complaints regarding hardware,
network, and applicat ion software system. This system also provides online instructions for the solut ions to
problems.
Source: Human Development in Sout h Asia 2008, M ahbub ul Haq Human Development Centre
informat ion. In the third stage, government delivers online services such as downloadable forms.
Services to increase the convenience of cit izens and a user-friendly interface also start becoming
evident. The fifth and final stage, which is the most advanced level of connect ivity, is characterised by:
1. Horizontal connect ions (among government agencies)
2. Vert ical connect ions (central and local government agencies)
3. Infrastructure connect ions (interoperability issues)
4. Connect ions between governments and cit izens
5. Connect ions among stakeholders (government, private sector, academic inst itut ions, NGOs and
civil society).
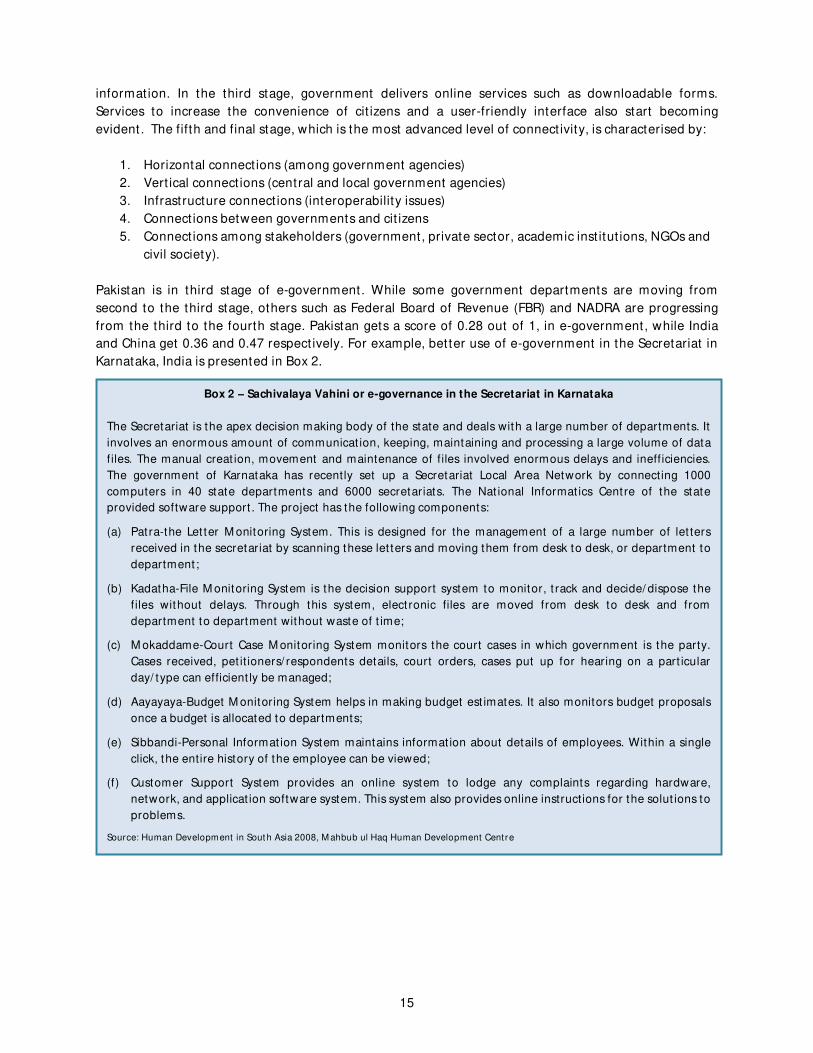
Pakistan is in third stage of e-government. While some government departments are moving from
second to the third stage, others such as Federal Board of Revenue (FBR) and NADRA are progressing
from the third to the fourth stage. Pakistan gets a score of 0.28 out of 1, in e-government, while India
and China get 0.36 and 0.47 respect ively. For example, better use of e-government in the Secretariat in
Karnataka, India is presented in Box 2.

16
Human Capital: Why Brain Drain?
While the importance of connect ivity is emphasised, its effect ive ut ilisat ion depends on human capital
(skills, knowledge and experience). Appropriate skills are required to cult ivate a connect ion—for
example one needs to know how to operate a vehicle (especially a large 18 wheel t ruck) in order to fully
benefit from the road network, or how to use a laptop to connect to the internet , how to use a cell
phone to connect remotely to interact with someone else. At a macro level, high quality human capital
is also necessary especially when it comes to the management of exist ing resources.
M ost of the human capital in Pakistan comprises low- to medium-skilled labour. High-skilled human
capital, finds itself well off in migrat ing to developed world. The end result is brain drain. If t ransmission
of knowledge and skills takes place from high- to medium- and consequent ly to low-skilled labour,
where highly-skilled keep up with the recent t rends in their profession, brain drain can significant ly be
reduced. Other than improving the quality of educat ion to develop highly-skilled human capital,
strategies must be devised to retain and mot ivate this top of the line labour force that can benefit
Pakistan’s growth.47
Brain drain, although a significant source of foreign remit tances, ult imately leads to
deteriorat ion of inst itut ional quality in the home country to which Haque alludes as the ‘vicious cycle’
(See Box 3).
47
NU Haque, ‘Brain Drain or Human Capital Flight ’, Pakistan Inst itute of Development Economics (PIDE), 2005.

17
Box 3 – Vicious Cycle of Poor Governance and Brain Drain
For polit ical reasons, governments in poor countries have found it expedient to expand employment while
capping wage growth. Similar considerations have led to the pursuit of egalitarian policy in the government
cadre so that wage scales have been compressed and salary increases and promot ions are not merit -based. The
result is that there has been a large flow from these public sectors not only to the International Financial
Inst itut ions (IFIs) but also to the multinat ional sector, internat ionally as well as domest ically.
With poor inst itutions and poor governance, public sector delivery of services—personal security, physical
infrastructure, such as roads and railways, clean environment and facilit ies to raise children and provide a
future for them—is poor or inadequate. Declining quality of services has often been cited as a cause of f light of
human capital. Poor governance can therefore be self-reinforcing. Once it sets in, it ratchets taxes upwards and
encourages evasion; lowers professional standards, encouraging the flight of bet ter professionals leaving the
poor quality professionals to manage with ever weakening standards. M any interest ing models have been
developed to illust rate how poor incent ives can lead to poor allocat ion of talent , which ult imately impedes
governance and growth. Societ ies with poor governance can be stuck in a low growth t rap which is difficult to
break out from.
Despite numerous consultant and technical assistance reports for capacity building and civil service reforms
cit ing the scarcity of skills as a major constraint to development , to date no systemat ic at tempts at developing
an assessment of needed skills in the poor countries has been undertaken. Yet it is obvious to those involved in
technical assistance and t raining, to maintain vigilant systems for supervision and regulat ion, provision of social
development (including health and educat ion), development and maintenance of infrast ructure and
governance in general, key skills such as academic, f inancial, engineering, managerial, and medical are required
at different quality levels. Continuous flight of human capital will retard the modernisat ion process as well as
the development and implementation of effect ive domestic policy.
Source: NU Haque, ‘Brain Drain or Human Capital Flight ’ , Pakistan Inst itut e of Development Economics (PIDE), 2005.
State of Social Capital
Zaidi has analysed the overall state of social capital in Pakistan48
by looking at some key instruments
which affect and reflect the intensity of social interact ions within communit ies such as libraries, public
spaces, commit tees or ROSCAs, professional associat ions and labour unions. Some key findings of the
study are summarised in Box 4.
48
M Zaidi, ‘Disconnected? Physical Capital, Social Capital, And Connect ivity for Economic Growth in Pakistan’, Cent re for the
Process of Change, 2011

18
Box 4 – Components of Social Capital
M easuring social capital is a complex exercise. A number of indicative examples of social capital may be useful
for future research, and deriving some generic policy inferences.
Professional Associations and Labour Unions
Professional and labour unions are vital forms of social capital for individuals who cannot easily influence
polit ical and economic decisions, independent ly, in the absence of unified expressions of collective interests.
Professional associations represent highly specialised and skilled labour. M embership in professional
associat ions helps in ident ifying trained professionals that exist in a given economy.
The Pakistan M edical and Dental Council reports a total of 144,403 qualif ied and licensed doctors and dentists
in the country. This represents less than one physician per 1,000 people. M ost developed countries have a
minimum of three or more physicians per 1,000 people. M embership of the Inst itute of Chartered Accountants,
which certifies Chartered Accountants (CAs) in Pakistan, is also skewed. 71 per cent (5,078) of CAs in Pakistan
work in four cit ies: Islamabad, Rawalpindi, Lahore and Karachi. Similarly total membership in labour unions in
Pakistan, as recorded by the Pakistan Stat istical Handbook of the Statist ics Division, has also decreased by 35
per cent since 1980. There is more unionised labour in the public sector than in the private sector. The WAPDA
(Water and Power Development Authority) union has regularly managed to protect the collect ive interests of
WAPDA employees.
Committees and ROSCAs
A common mechanism of informal credit in Pakistan is a ‘commit tee’ or Rotat ional Savings and Credit
Associat ion (ROSCA). ROSCAs use social collateral (connect ions between individuals and the threat of social
sanct ions) to address the problem of incomplete contracts due to imperfect information and diff icult
enforceability. ROSCAs rely to a significant degree on social capital. ROSCA members gather for a series of
economically mot ivated meet ings. Informal surveys of housewives, shopkeepers, members of closely knit
religious and ethnic communities, especially in urban areas, confirm either part icipating in or knowing of a
social commit tee.Numerous instances of policy prescriptions have called for f inding a way to take advantage of
the commit tee system—an exist ing example of the economic value of social capital. For example, in Small &
M edium Enterprise Development Authority’s (SEM DA’s) Provincial Entrepreneurship Promotion Strategy 2004-
2008, one of the recommendations for helping entrepreneurs is by providing them with greater access to
commit tees.
However, at tempts to formalise an informal mechanism that is a manifestat ion of social capital in action may
be a very bad policy. The ent ire basis for the success of ROSCAs and commit tees is the informal arrangement .
However there is no verifiable database of various commit tees in Pakistan. Metrics for est imating the size and
scope of ROSCAs are unknown. Without a substant ial amount of research into ROSCAs any concerted or clear
policy prescription would be speculat ive, and from the angle of social capital, potent ially detrimental to the
communit ies.
Source: M Zaidi, ‘Disconnect ed? Physical Capital, Social Capital, And Connect ivity for Economic Growth in Pakistan’, Centre for the Process
of Change, 2011
In Pakistan, libraries and public spaces (parks, museums, play grounds, stadiums, theatres, and centres
of arts and performances) have played a very limited role in promot ing social interact ion. It is mainly
because of how they have been viewed by policymakers and cit izens, alike. For example, libraries are
viewed as merely buildings (inorganic structures) for reading and perhaps as landmarks for connect ing.
This is a very limit ing and sub-opt imal way of ut ilising resources such as the building, land and garden,
sculptures, paint ings and other art works displayed in the library, books, mult imedia (CDs, DVDs, tapes),
microfiche, magazines and newspapers, academic and technical journals, historical and government
records, furniture and equipment (computers, photocopying machines, internet lines, etc.), and trained
19
Box 5 – Libraries as Public Spaces
There is no official est imate for the total number of libraries in Pakistan. The last known survey undertaken in
1989 est imated a total of 284 libraries in the country. In an interview, officials at the Nat ional Public Library
est imated the number of public libraries to be about 400, which included a caut ionary note about what
const itutes a ‘public library’ at the Tehsil level in Pakistan—often no more than a few shelves of books inside a
dist rict or Tehsil headquarters, which is almost never used.
Anecdotal evidence from both the provincial and dist rict level belies the est imates provided. For example,
Sindh, which has 23 dist ricts, has no public libraries of any kind in sixteen of those dist ricts. In Rawalpindi, a
dist rict with a populat ion of over 4.5 million, only two public libraries are functional. Next door, in the federal
capital of Islamabad, where there are as many as six public libraries, none are functional, lack water and
electricity, as well as the requisite staff. One of the problems has been inconsistent library policies. In a survey
of government ’s performance in promot ing libraries, Bushra Almas Jaswal, Chief Librarian at Forman Christ ian
College University, Lahore, illust rates the declining t rend in efforts to promote and sustain libraries in Pakistan
since 1947. Jaswal measures performance on a six point scale in the areas of planning, legal activity,
development and financial support . The current state of libraries in Pakistan is not hard to understand when
reviewing Jaswal’s excellent portrayal of public policy for libraries. In eras where there was planning and
legislat ive act ivity, there was no money. When there was money, there was no planning.
Other Examples of Public Space
Though there is lit t le data on public parks and sport ing venues for youth, anecdotal evidence suggests these
spaces have skewed usage. Pakistan’s cricket grounds or streets do not show a cross-sect ional representation
of the socio-economic range of Pakistanis. Low confidence in law and order situat ion and poor quality of
grounds and parks could be playing a crit ical role in separat ing Pakistani children from different economic
st rata. The tradit ional place where communit ies sit and interact with each other, the Pakistani version of the
café, is the Dhaaba. In more urbanised spaces, corner Dhaabas often adorn the st reets on which modern cafés
have come up, which means that the socio-economic divide once again determines where you eat and drink
and who you interact with.
The Local Government Ordinance 2001 included a number of inst ruments that sought to leverage the sense of
community that is germane to Pakistani society in service of rural and urban development . Insaaf Commit tees,
M usalihat-e-Anjuman and the Cit izen Community Boards (CCBs), all sought to help drive local solutions for local
problems by formally recognising the social networks and t rust bonds of communities, many of which had
funct ioned without fail for centuries. However, most of the community inst ruments conceived by the Local
Government Ordinance 2001 were of course unable to survive the rollback of devolved local governments in
2009 and 2010. This singular lack of polit ical viability for inst ruments that largely sought to formally recognise,
reward and sustain informal institut ions of the community may represent an important trend.
Source: M Zaidi, ‘Disconnect ed? Physical Capital, Social Capital, And Connect ivity for Economic Growt h in Pakistan’, Centre for t he Process
of Change, 2011
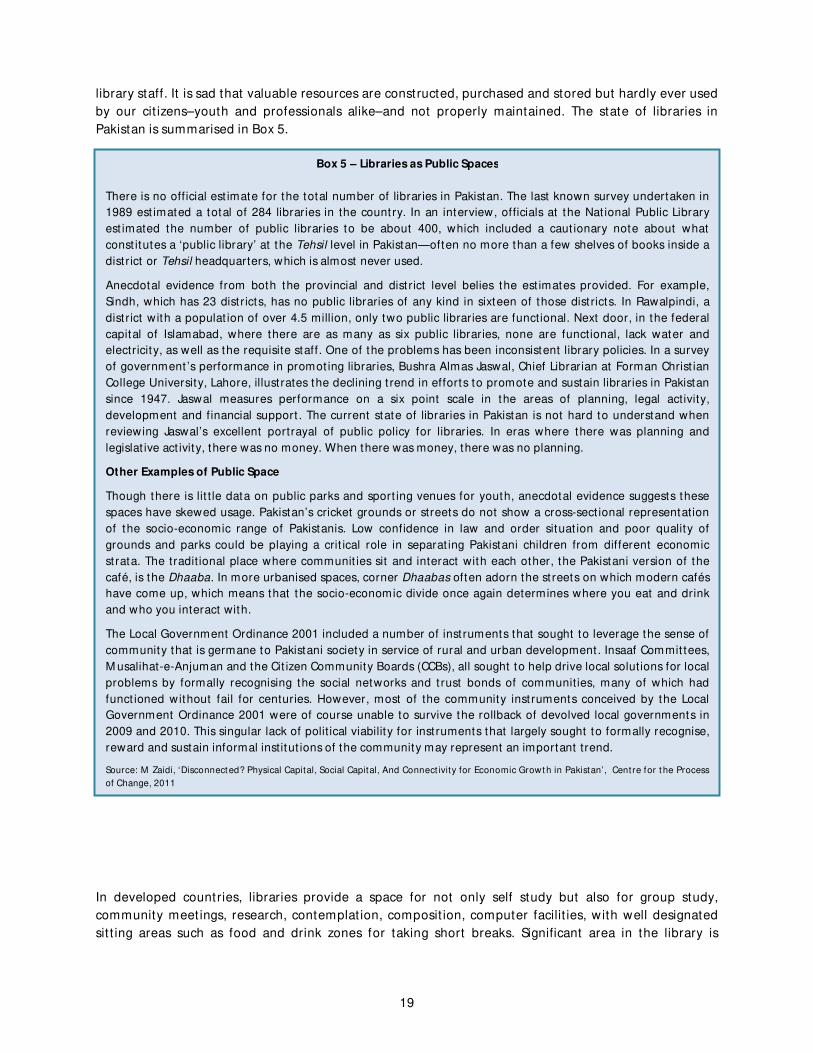
library staff. It is sad that valuable resources are constructed, purchased and stored but hardly ever used
by our cit izens–youth and professionals alike–and not properly maintained. The state of libraries in
Pakistan is summarised in Box 5.
In developed countries, libraries provide a space for not only self study but also for group study,
community meet ings, research, contemplat ion, composit ion, computer facilit ies, with well designated
sit t ing areas such as food and drink zones for taking short breaks. Significant area in the library is
20
dedicated for various ‘collect ive’ act ivit ies for interact ing, which develop social capital. Similarly,
managers of public spaces (Central Park, Time Square, Trafalgar Square), frequent ly organise fest ivals,
fairs, concerts, marathons and sport ing events. In the United States, school parks are open to
communit ies after school t imings–an efficient way of ut ilising exist ing infrastructure.
Social capital can also be of internat ional nature—in the form of Pakistani Diasporas. India presents a
good regional case study. Students graduat ing from Indian Inst itute of Technology (IIT) and Indian
Inst itute of M anagement (IIM ), both having many campuses nat ionwide, go to the developed world,
especially to the U.S., for higher educat ion (M asters and PhD degrees). Since 1953, more than twenty
thousand Indians have migrated to the United States. Although these inst itut ions of higher learning have
been crit icised for encouraging brain drain from India, the highly educated and well connected Indian
Diaspora have provided a vital plat form to India for greater internat ional networking and creat ing the
technology hub in Bangalore, Hyderabad and other cit ies in India, during the past 20 years.
After liberalisat ion of the Indian economy, in the early 1990s, the past t rend of brain drain is
experiencing a gradual reversal. Now, Indian Diaspora is not only invest ing in India but is cult ivat ing
social capital that emerged from the human capital context (i.e., IIT and IIM alums) by bringing in
business contracts from the United States (banks, mult inat ionals, and even U.S. domest ic firms) through
their internat ional contacts. The return of the Diaspora and their networks are being fused with
domest ic networks and contribut ing significant ly towards development of Indian markets, commerce,
inst itut ions and overall economic growth. Over the last decade, emerging scient ific and manufacturing
industries and outsourcing of technical jobs from North America and Western Europe to India has
created significant opportunit ies for the graduates within India.
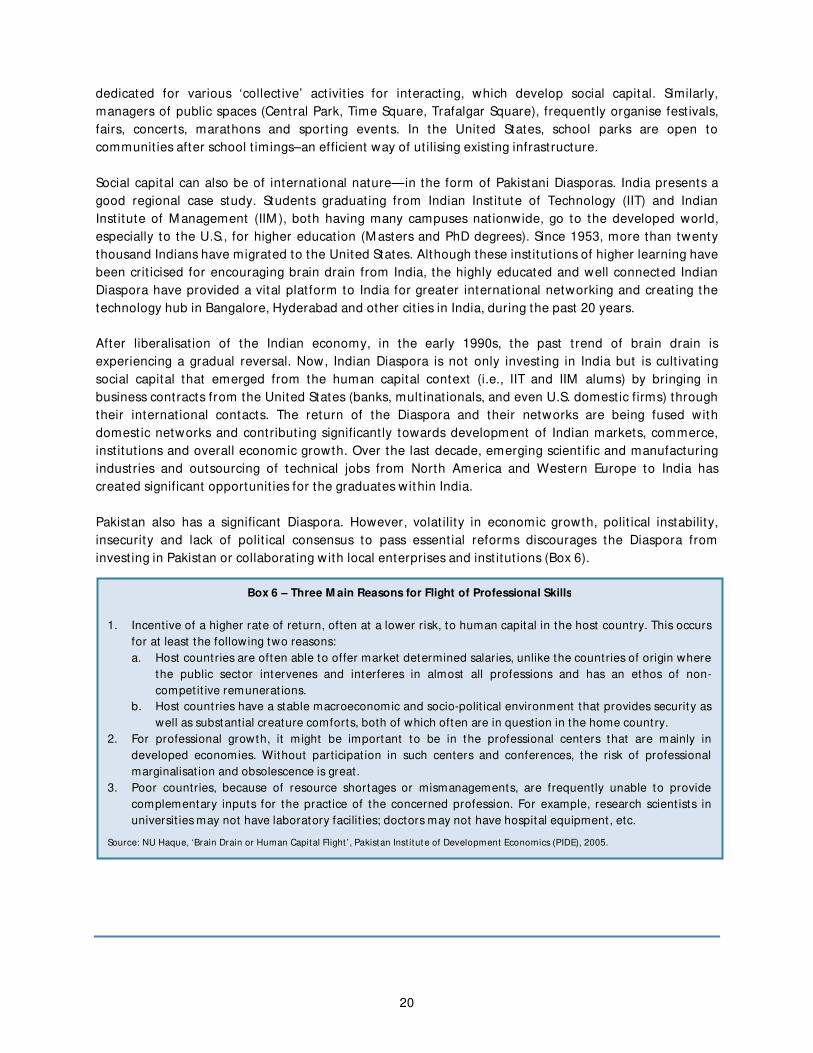
Pakistan also has a significant Diaspora. However, volat ility in economic growth, polit ical instability,
insecurity and lack of polit ical consensus to pass essent ial reforms discourages the Diaspora from
invest ing in Pakistan or collaborat ing with local enterprises and inst itut ions (Box 6).
Box 6 – Three M ain Reasons for Flight of Professional Skills
1. Incentive of a higher rate of return, often at a lower risk, to human capital in the host country. This occurs
for at least the following two reasons:
a. Host countries are often able to offer market determined salaries, unlike the countries of origin where
the public sector intervenes and interferes in almost all professions and has an ethos of non-
compet it ive remunerat ions.
b. Host countries have a stable macroeconomic and socio-polit ical environment that provides security as
well as substantial creature comforts, both of which often are in question in the home country.
2. For professional growth, it might be important to be in the professional centers that are mainly in
developed economies. Without participat ion in such centers and conferences, the risk of professional
marginalisat ion and obsolescence is great.
3. Poor countries, because of resource shortages or mismanagements, are frequently unable to provide
complementary inputs for the practice of the concerned profession. For example, research scient ists in
universit ies may not have laboratory facilit ies; doctors may not have hospital equipment , etc.
Source: NU Haque, ‘Brain Drain or Human Capital Flight ’ , Pakistan Inst itut e of Development Economics (PIDE), 2005.
21
Global Connectivity
Share in internat ional t rade can be viewed as a proxy for global connect ivity of any country as it is
most ly the case that countries with organised physical and social networks find it mutually beneficial to
t ransact with each other. Pakistan’s share in internat ional t rade has experienced minimal change during
last three decades. The only significant reform effort was made during the first of half of 2000-10 under
the t rade liberalisat ion program. It involved reduct ion in government t rading monopolies–especially in
agricultural sector–removal of import quotas, import surcharge and regulatory dut ies, and significant
tariff cuts and rat ionalisat ion. The result ing structural changes lead to increase in the openness rat io
from 25 per cent to almost 30 per cent which was later ident ified as the third most important factor
contribut ing towards economic growth.49
Another posit ive outcome was also an init ial sign of export
diversificat ion.50
However, the second half, especially after the financial crisis of 2008, saw a dramat ic
reversal of this policy hence eliminat ing the benefits accrued t ill then.
Today most of Pakistan’s exports remain geographically concentrated. In 2010, three markets (UK, US
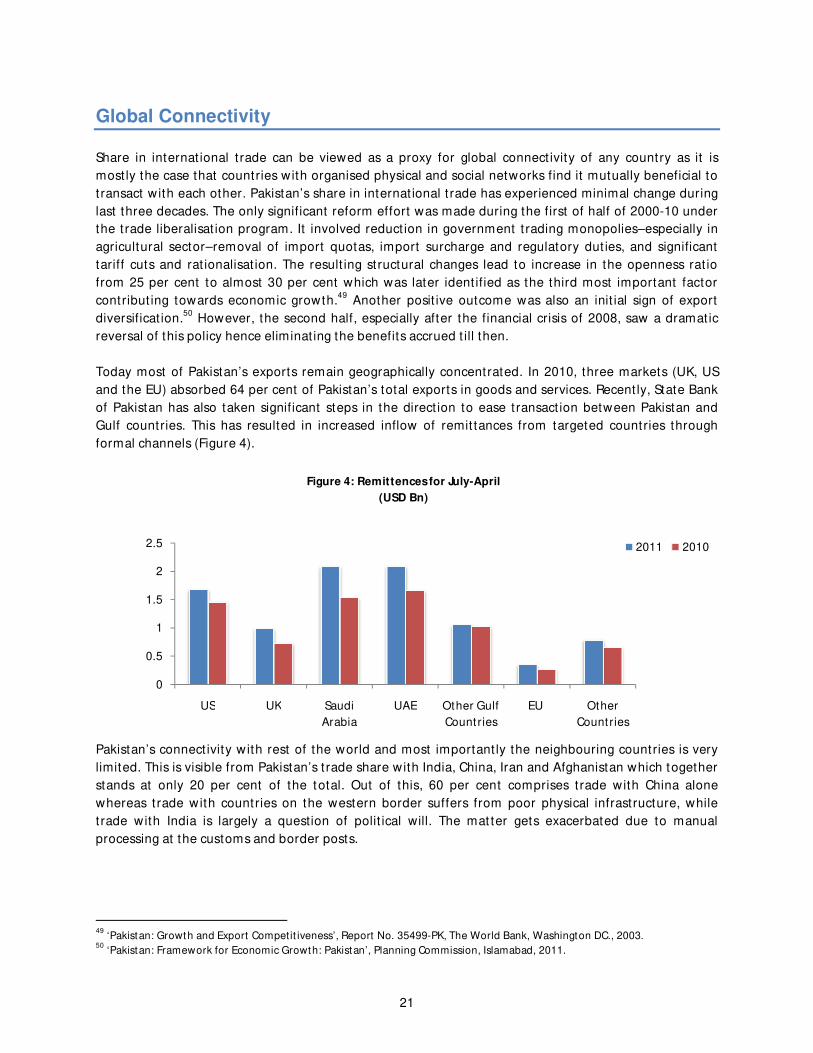
and the EU) absorbed 64 per cent of Pakistan’s total exports in goods and services. Recent ly, State Bank
of Pakistan has also taken significant steps in the direct ion to ease transact ion between Pakistan and
Gulf countries. This has resulted in increased inflow of remit tances from targeted countries through
formal channels (Figure 4).
Pakistan’s connect ivity with rest of the world and most important ly the neighbouring countries is very
limited. This is visible from Pakistan’s t rade share with India, China, Iran and Afghanistan which together
stands at only 20 per cent of the total. Out of this, 60 per cent comprises t rade with China alone
whereas trade with countries on the western border suffers from poor physical infrastructure, while
t rade with India is largely a question of polit ical will. The mat ter gets exacerbated due to manual
processing at the customs and border posts.
49
‘Pakistan: Growth and Export Competit iveness’, Report No. 35499-PK, The World Bank, Washington DC., 2003. 50
‘Pakistan: Framework for Economic Growth: Pakistan’, Planning Commission, Islamabad, 2011.
0
0.5
1
1.5
2
2.5
US UK Saudi
Arabia
UAE Other Gulf
Countries
EU Other
Countries
2011 2010
Figure 4: Remittencesfor July-April
(USD Bn)

22
There is significant t rade potent ial which can be exploited with the adopt ion of the combinat ion of
reduced restrict ions, improved transport network and automated custom posts. It is reported that the
informal t rade with India, Afghanistan and Iran is couple of billion dollars more than what is reported.
Figure 5 highlights clusters along the internat ional border in the neighbouring countries which could
possibly be connected with domest ic clusters in order to increase trade and therefore improve regional
connect ivity of Pakistan.
Figure 5: Cluster Linkages
The total number of border posts along the western border remains roughly the same. However, along
the Indian border, there is potent ial of increasing the border posts from the current number of three
(which include both fully and part ially act ive posts) to at least five.
Figure 5 also shows the potent ial linkages across economic clusters within Pakistan which may facilitate
domest ic commerce. Although most of the linkages already exist and only need to be strengthened, one
major link which requires significant investment is that of Gwadar with upcountry. Given the economic
viability of these linkages, private investment can be at t racted if appropriate regulatory framework is
provided.

23
Constraints on Growth
Disintegrated Markets
Domest ic markets are not fully integrated. M ore than 30 per cent of agricultural output is current ly
wasted due to inadequate farm-to-market roads, lack of cold storage facilit ies, and obsolete and
underpowered trucking fleet . M oreover, average speed of Pakistani t rucks is half of the average truck
speed in developed countries. With product ivity of Pakistan Railway’s freight services being only 1/ 8th
of
China and 1/ 3rd
of India51
, it not only takes longer but also costs more to deliver goods leading to
significant price different ials of goods in both domest ic and internat ional markets. Lack of efficient
connect ivity increases the risk of joint ventures for businesses from different geographic areas. This not
only reduces growth in domest ic commerce but also discourages innovat ion by forcing people to st ick to
their t radit ional ways of doing business.
Furthermore, low ICT penetrat ion and limited connect ion in rural areas slows down the flow of crit ical
informat ion, thus leading to sub-opt imal decision-making. By focusing only on saving agricultural
produce from going to waste and ensuring smooth and t imely informat ion flow the overall turnover and
profitability of farmers can be raised to eventually reduce poverty.
Table 4 highlights key indicators which are responsible for effect ive use of ICT in any country. All
rankings, except e-readiness, are out of 133 countries where rank of 1 is given to the best performer. In
the e-readiness index, 40 per cent weight is given to ‘business environment and consumer and business
adopt ion’ and 20 per cent to ‘connect ivity and technology infrastructure’. Pakistan’s poor performance
in this index suggests that it does not have a suitable environment for intensive e-commerce.
Table 4: Why is e-commerce still at an infant stage?
Countries E-readiness (out of 70)* Prioritisation of ICT Staff training Training services
Pakistan 66 74 112 99
China 56 17 50 47
India 58 19 34 32
Indonesia 65 71 33 48
M alaysia 38 14 16 26
Singapore 7 1 2 1
Source: The Global Informat ion Technology report 2009-10
* The 2009 e-readiness rankings, Economist Int elligence Unit (2009)
Recent ly, however, there has been some growth in e-commerce especially in the banking sector which
has taken advantage of rising teledensity and introduced mobile phone and online banking. Almost half
of the country’s 7,000 commercial bank branches are now providing online banking. On a smaller scale,
there are also few online shopping websites and job portals which can provide the base for developing
the right culture for e-commerce. M ajor hurdles are unavailability of proper hardware infrastructure,
few internet users, low security of online t ransact ions, and poor adopt ion of technology by businesses,
universities, and the government.
51
‘Pakistan: Growth and Export Competit iveness’, Report No. 35499-PK, The World Bank, Washington DC. 2003.

24
In all the other indexes, Pakistan’s performance is again not encouraging, when compared to regional
economies. Although there is not a huge difference in e-readiness when compared to China and India,
significant gap in other rankings suggests that Pakistan will cont inue to lag in e-readiness at least in the
near future. In China alone, there are 1100 e-commerce websites and total number of people
part icipat ing in e-commerce act ivity approximates to 142 million. E-commerce in India is also gaining
momentum. India’s largest e-commerce website (t radeindia.com) has 0.7 million buyers and is growing
at a rate of 35 per cent annually.
Lack of social capital across rural communit ies further exacerbates market inefficiencies. In the absence
of credible accountability infrastructure, which is the case in rural areas, social capital can act as a threat
in the form of social exclusion. Therefore, in rural and tribal areas, business dealings most ly take place
within or across communit ies only if social capital exists, which is t radit ionally an outcome of family and
inter-generat ional linkages.
In the absence of significant cross community interact ion, high level of social capital within a community
can sometimes create mult i-polar societ ies where each pursues its own goals. A prime example of this is
the Khurram Agency in the Federally Administered Tribal Areas (FATA) of Pakistan. Ideological
differences between two religious communit ies in the agency usually lead to clashes and frequent
killings. Increased social and business interact ions between two communit ies can develop social capital
and hence build t rust which is necessary for peaceful and harmonious co-existence. Introducing mobile
market on the patterns of Bangladesh can be one way of increasing informat ion flow across
communit ies and promot ing greater interact ion for mutual benefit .
Lethargic Cities
Over the last decade, cit ies have increasingly faced traffic congest ions. Unorganised and infrequent
public t ransport with no safety and quality control has forced people to resort to personal t ransport
such as cars and motorcycles. City planners look for solut ions in underpasses and flyovers instead of
improving the public t ransport system.
In Karachi, in 2002, cars and motorcycles accounted for 92 per cent of the vehicles as compared to 6 per
cent of para-transit vehicles and 2 per cent of public t ransport vehicles. Furthermore, t ransport is
dominated by the private sector in the form of minibuses and coaches, which are low capacity modes of
t ransportat ion and are unable to cater fully to public demand for t ransport (see Table 5). In Karachi, 81
per cent of the public t ransport vehicles are of low capacity.52
This is mainly due to higher import tariffs
on large buses and inadequate financing.
In bigger cit ies, lack of regulatory framework for monitoring the businesses during the last two decades
has also led to monopolies which are now operat ing, in collaborat ion with corrupt police officers, as
t ransport mafia. Thus, a potent ial entrant faces st iff opposit ion. This also leads to under ut ilisat ion of
routes to a level which offers highest returns to the monopolist .
52
I A Qureshi and L U, ‘Urban Transport and Sustainable Transport Strategies: A Case Study of Karachi, Pakistan’, Tsinghua
Science and Technology, vol.12, no.3, 2007.
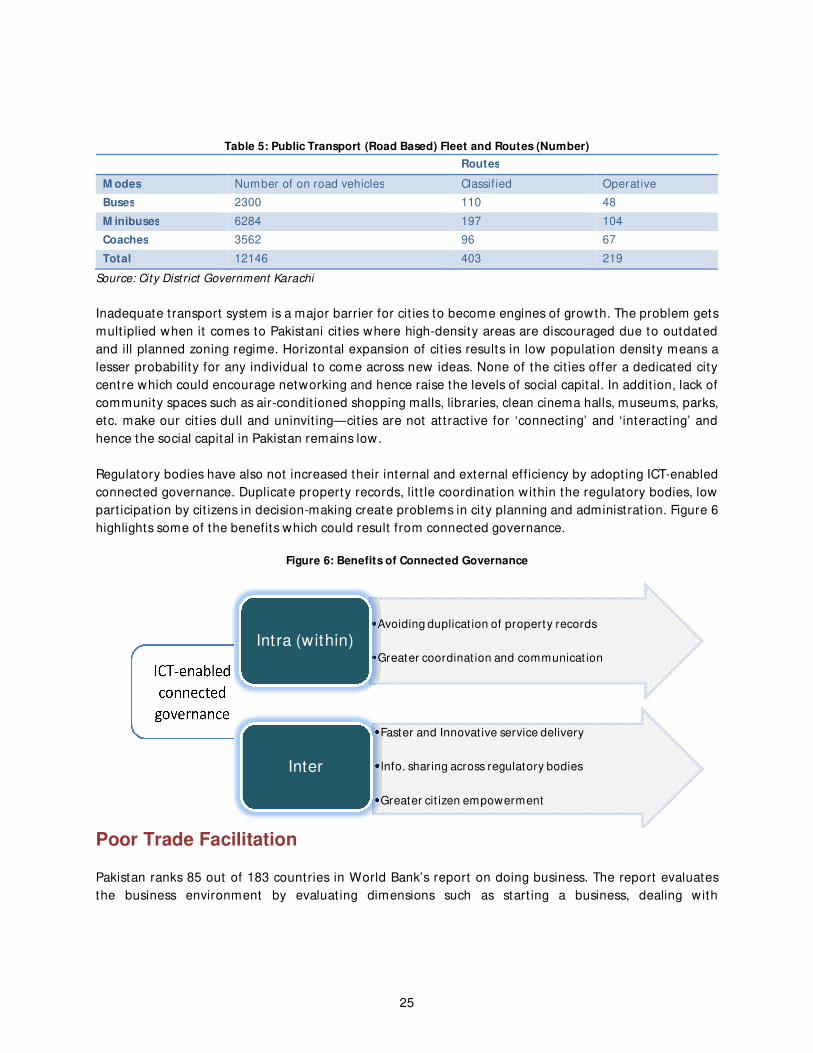
25
Table 5: Public Transport (Road Based) Fleet and Routes (Number)
Routes
M odes Number of on road vehicles Classified Operative
Buses 2300 110 48
M inibuses 6284 197 104
Coaches 3562 96 67
Total 12146 403 219
Source: City Dist rict Government Karachi
Inadequate t ransport system is a major barrier for cit ies to become engines of growth. The problem gets
mult iplied when it comes to Pakistani cit ies where high-density areas are discouraged due to outdated
and ill planned zoning regime. Horizontal expansion of cit ies results in low populat ion density means a
lesser probability for any individual to come across new ideas. None of the cit ies offer a dedicated city
centre which could encourage networking and hence raise the levels of social capital. In addit ion, lack of
community spaces such as air-condit ioned shopping malls, libraries, clean cinema halls, museums, parks,
etc. make our cit ies dull and uninvit ing—cit ies are not at t ract ive for ‘connect ing’ and ‘interact ing’ and
hence the social capital in Pakistan remains low.
Regulatory bodies have also not increased their internal and external efficiency by adopt ing ICT-enabled
connected governance. Duplicate property records, lit t le coordinat ion within the regulatory bodies, low
part icipat ion by cit izens in decision-making create problems in city planning and administrat ion. Figure 6
highlights some of the benefits which could result from connected governance.
Figure 6: Benefits of Connected Governance
Poor Trade Facilitation
Pakistan ranks 85 out of 183 countries in World Bank’s report on doing business. The report evaluates
the business environment by evaluat ing dimensions such as start ing a business, dealing with
• Avoiding duplicat ion of property records
• Greater coordinat ion and communicat ion
Intra (within)
• Faster and Innovat ive service delivery
• Info. sharing across regulatory bodies
• Greater cit izen empowerment
Inter

26
construct ion permits, registering property, get t ing credit , protect ing investors, paying taxes, t rading
across borders, enforcing contracts, and closing a business.53
Pakistan’s ranking exceeds China’s and India’s, which rank 87 and 133 respect ively. If the government
could decrease the total number of documents required for external t rade by only two, through ICT
adopt ion, Pakistan’s ranking would improve further from the current 85 to 78. At present total
documents required for export and import are 9 and 8 respect ively. Document preparat ion takes 11
days on average out of the 22 days required for export ing a container from Pakistan (Figure 7).
Inland transportat ion also suffers from a difference in cost and t ime when export ing and import ing
container from different cit ies. Cost is the lowest for Karachi and Hyderabad (Figure 8) because these
cit ies have closer access to the sea. It costs 57 per cent more to import a container to Lahore than to
Quetta.
To start a business in Pakistan, it requires 10 different procedures which on average consume 20 days to
complete. In 2009-10, Rwanda stood out as a top reformer by reducing the procedures required for
start ing a business from eight to two documents, which helped simplify the start -up process from 14
days to only 3 days.
Source: Doing Business Report , 2010
Youth with Unemployable Skills
Low level of broadband penetrat ion constrains access to modern methods of networking to the youth
and prevents them from enhancing their social and professional connect ivity. Job portals, which signal
and convey skills sought by employers, inform the youth about which skills to learn and acquire.
Physical, professional and social connect ivit ies between universit ies, entrepreneurs, t rade associat ions,
professional and cert ifying associat ions, and enterprises in different sectors are very low in Pakistan.
There are virtually no trade shows and conferences where different part ies could meet, learn and at tend
professional t raining courses and interact for mutual benefit .
53
‘Doing Business 2010’, The World Bank, 2010
Figure 7: Pakistani Exporters Spend M ost of Their
Time on Paper Work
Figure 8: How M uch Does it Cost to Import and
Export a Container to/ from Pakistan

27
Pakistan is ranked 92 out of 133 countries in university-industry linkages index, much lower than the
ranks of China and India, which are at 23rd
and 46th
posit ion respect ively.54
Due to the weak university-
industry-professional nexus in Pakistan, the youth is not able to acquire the skills sought by employers.
Thus, the enterprises and universit ies are not able to compete effect ively in the global markets and the
government is not able to deliver services, efficient ly.
Issues Faced in Financing of Infrastructure Projects
With increasing cost of construct ion, frequent occurrence of large scale natural disasters, and ongoing
fight against insurgents, it has become impossible for the government to cont inue financing
infrastructure projects. This can be seen from the recent reduct ions in the budget of Public Sector
Development Projects (PSDP). Historically, PSDP has been the main source of funds in addit ion to foreign
loans. M uch of the internat ional aid, however, was directed towards social sector projects which were
arguably of temporary humanitarian relief.
To deal with these challenging circumstances, IM F has highlighted some key issues which need to be
addressed when undertaking any infrastructure development project . These include analysing type,
nature and amount of investment that can offer the biggest boost to growth, the means to finance the
investment and the profile of the intended recipients. Without looking at these issues, there remains a
much higher probability that the project will get delayed to an extent that it no longer remains needed.
If the project does get completed, long delays raise the cost to an extent that cost benefit analysis done
when the project was conceived is no longer valid. While the West st ill figures out how to fully recover
from the financial crisis of 2007, it has become difficult for the developed world to finance projects in
developing countries. This has left countries like Pakistan with no other opt ion than to init iate reform
aimed at ut ilising its own full strength.
The type and nature of investments that offer the biggest boost to growth have resulted in the
establishment of Nat ional Trade Corridor M anagement Unit (NTCM U) to come up with plans aimed at
improving trade-related infrastructure facilit ies with the goal of making Pakistan a regional t rade hub.
However, NTCM U is st ill to come up with any coordinated plan. Projects are st ill being approved in
isolat ion with no broader vision of achieving sustainable growth. Ideally, a strategy should have been
prepared by now and NTCM U should have moved on towards implementat ion stage.
Similarly, there is a need for improving PC-I with respect to involving private sector in development
projects. PC-1 is a project proposal which contains cost est imates, technical descript ion, cash flow
est imat ion etc. PC-I documents expect the project to be fully financed from PSDP. Instead, the project
should be floated to the private sector to undertake with full ownership and if not accepted by the
private sector only then the government should be approached for funding. Adding another sect ion on
‘PPP (public private partnership) Opt ion Analysis’ in the PC-I document, as suggested by the
Infrastructure M anagement Unit (IM U), would be a good idea.
54
‘The Global Information Technology Report 2009-2010’, The World Economic Forum, 2010.

28
The IM U has also done an extensive and useful study on constraints to private sector investment in
infrastructure. But much needs to be done in removing these constraints. Some of the key constraints
highlighted by the study related to ‘procurement laws’ and ‘procurement processes’. 55
According to the
study the current procurement laws do not include a requirement for the public body to consider
infrastructure service delivery through the private sector. It also criticises the procurement process for
being too centralised. All procurement decisions for a value as low as USD 4-5 million are made at the
highest level of the Government. This is the case even for projects which are 100 per cent PPP and will
not require any public expenditure. The report states ‘Project-to-project approval culture at the highest
Government level is inefficient , leads to disempowerment of the public implement ing bodies that
undertake primary analysis to priorit ise projects, and opens the door for considerat ions that are
extraneous to the primary object ive of efficient allocat ion among compet ing demands for limited
resources. The public bodies created by statute or under not ificat ions remain constrained by this ‘case-
to-case’ approval culture.
Despite considerable realisat ion and wide consensus, Pakistan is st ill to come up with a detailed and
clear framework on PPP. This is mainly because the direct ion, content and the responsibility for the PPP
framework st ill remains unsett led. For example, at municipal level, legal confusions between the role of
local and provincial governments is undermining the PPP projects. The IM U has ident ified restrict ion on
local governments against financing development projects through user fees, as a major constraint to
PPP at municipal level. Knowing that various amendments are being considered in local government law
at provincial levels, these issues can be revisited with the approach of promot ing private sector in
infrastructure projects.
Also, land acquisit ion laws are current ly in conflict with internat ional norms and therefore need to be
brought in line. It is one of the major issues and has often resulted in delays and sometimes even leads
to the abandonment of the project due to polit ical interest . In addit ion to introducing new PPP
framework, IMU study also highlights the exist ing laws which discourage private sector part icipat ion–
one of them being the NHA Act which does not contain any requirement for PPP Opt ion Analysis. The
NHA Act also does not empower assignment of toll receivables in favour of the private company
execut ing the project . Another issue is that of compet it ion with public sector construct ion. It is argued
by private construct ion companies that lucrat ive projects are always given to public sector corporat ions
in a non-transparent and discriminatory manner. Such at t itude discourages growth of private sector
firms and hence their ability to undertake projects which are spread thin over the t ime horizon.
The Infrastructure Project Development Facility (IPDF) has also come up with several studies which try
to streamline the role of private sector in infrastructure development. The studies, although very much
in line with IMU, speak on the issue of updat ing the PC-1 document in much more detail. For example
the IPDF states ‘The line ministries should assess whether the project can be funded through
privat isat ion or Public Private Partnership. Only once the line ministries and government departments
have proved that the project is not feasible for private sector part icipat ion, should the PC-1 for that
project be formulated for PSDP funding’.
The Government of Pakistan has passed ‘Pakistan Policy on Public Private Partnership’ in 2010 to chart
down a basic framework. However, the above ment ioned issues related to the private sector
part icipat ion in infrastructure development st ill need to be resolved.
55
‘Const raints to Private Sector Investment in Infrast ructure’, Infrast ructure M anagement Unit , Planning Commission,
Government of Pakistan, 2007
29
Reforms
Promoting Public-Private Partnership (PPP) in Infrastructure Development
There is need for improving PC-I with respect to involving private sector in financing infrastructure
projects. It should be made sure that first the project is floated to the private sector to undertake with
full ownership and if not successful only then the government is approached for funding. Another
sect ion on ‘PPP Opt ion Analysis’ in the PC-I document, as suggested by the IMU, can be a good addition
in this direct ion.
Similar analysis is required to be made part of NHA Act which does not contain any such requirement
and therefore discourages private sector part icipat ion. NHA Act also does not empower assignment of
toll receivable in favour of the private project company execut ing the project . Such a requirement has
been very detrimental to fast t rack complet ion of infrastructure projects and has in many cases deprived
Pakistan of possible foreign investment.
Procurement laws and processes also need to be simplified and made more investment friendly. In this
regard, procurement laws should require that the public body first consider infrastructure service
delivery through the private sector before it steps in. Procurement processes should also be
decentralised. All procurement decisions which are 100 per cent based on PPP and do not require any
sovereign guarantee should not require any approval from the highest level of the Government (Federal
or Provincial). Restrict ion on local governments against financing development projects through user
charges or fees should also be reviewed by respect ive provinces.
Land acquisit ion laws (of 1894) are current ly in conflict with internat ional norms and ought to be
reviewed and brought in line with internat ional best pract ices. For this purpose, an evaluat ion process
under the acquisit ion laws should be init iated to take into account adverse social impact, loss of assets,
businesses and income. This is one of the major issues which have often resulted in delays and
sometimes even to project abandonment.
Improving Public Transport Network
Instead of seeing road construct ion as the only solut ion to t raffic jams, an efficient inter- and intra-city
t ransport system must be introduced. M ost large cit ies of the world use some form of rail for effect ive
public t ransport . The Karachi Circular Railway (KCR) was a popular public t ransport system during the

30
1970s with about 0.3 million daily passengers.56
KCR facilitated the urban poor as well as middle-income
populat ion. However, deteriorat ion of infrastructure, stat ions and crossings led to reduct ion in the
number of commuters. The number of daily t rips of KCR decreased from 104 during 1970s to only one in
1999.57
By running a t rain-based public t ransport system, commuting t imes can be reduced to facilitate
commerce and commercial act ivity, as well as increase the product ivity of labour and other resources.
Public t ransport in the cit ies has also collapsed as the public sector (part icularly provincial governments)
completely withdrew from investment, management and operat ion in public t ransport , both within and
between cit ies, after mid-1990s. Under franchise arrangements, private companies operated bus
systems in a few major cit ies for some t ime but for lack of financing and infrastructure, such as bus
terminals, bus depots, workshops etc., these systems are now reduced to about 1200 operat ional buses
in five major cit ies of Punjab. The vacuum has been filled by poor quality and generally unfit 25-seater
M azda, 18-seater Toyota and 12-seater Suzuki that are primarily owned by small operators. Better
regulat ion of road based public t ransport is required. It would involve realignment of exist ing routes by
bringing major avenues within cit ies into the public t ransport network; auct ioning them to private
sector; ensuring appropriate number of buses for every route; declaring the extreme left lane on major
avenues as bus-only lane; and willingness by insurance companies to provide coverage for new entrants
against the host ility of exist ing mafia.
56
M Sohail, ‘Urban public t ransport and sustainable livelihoods for the poor, a case study: Karachi, Pakistan’, WEDC,
Loughborough University, UK 2000. 57
I A Qureshi and L U, ‘Urban Transport and Sustainable Transport Strategies: A Case Study of Karachi, Pakistan’, Tsinghua
Science and Technology, vol.12, no.3, 2007.
Box 7 – Public Transport M odel for Islamabad
Lowson’s model offers rough and quick sketches of a transport scenario for a grid city. It is easy to apply the
model to Islamabad, which is a grid city. Figure 9(a) shows a map of Islamabad with 11 possible routes (round-
t rips) in blue and red lines. Each route traverses two or more sectors, where each sector is a square of length
two kilometres. Thus, shortest route is between two adjacent sectors, totalling eight kilometres and longest
route would traverse six sectors, totalling 24 kilometres. According to Lawson’s model, highest journey speed
of 15 km/ hr is at tained when a bus makes a stop after every 0.5 km.
Thus, it will take two minutes to cover 0.5 km (distance between two stops). Assuming that two buses maintain
a distance of eight bus stops (which is four kilometres) between them, maximum wait ing t ime at each bus stop
will be 16 minutes. Three buses would be required on the shortest round t rip and seven buses on the longest
route. For the 11 routes, shown in chart 9(a) it is est imated that an average of six buses would be required per
route. Thus the total number of buses required on all 11 routes would equal 66.
This est imat ion is a simple applicat ion based on some simple assumpt ions for the bus system. A more accurate
est imate would consider: (a) demand on each route, especially during peak versus off-peak hours; (b) bus
capacity; (c) t raffic density (which again would depend on the hour of the day); (d) shapes of the routes
(whether buses go back and forth on the same avenue or make zigzag circuits); and, (e) the number of signal
lights and waiting t ime at the signal lights or crossings, on each route.
Figure 9(a) Figure 9(b)

31
Box 7 – Public Transport M odel for Islamabad (contd.)
Such a model as explained above would allow passengers to get anywhere with just one t ransfer. Each bus stop
at the intersection would also allow mobility in all four direct ions, except for bus stops at the outer corridor.
Such a network will bring the bus t ravel t ime very close to t ime taken on a private car to cover the same
distance. On the longest route (I-11 to F-5) it will take about an hour to reach from home to work.
To connect Islamabad with the suburban populat ion, which is where most low income people working in
Islamabad reside, three more routes have been shown with green lines in Figure 9(a). City routes are not
f ixed—they can be realigned and the total number of routes can be increased or decreased depending on
demand. Figure 8 (b) shows possible alternate routes, connect ing the centre point of some sectors, which could
either replace the routes shown in Figure 8 (a) or be added to the number of routes.
To make this model work, Capital Development Authority (CDA) would have to auct ion the routes while
ensuring that no bidder acquires too many routes to impede compet it ion. Bidders must not be regulators or
law enforcers. Also the conditions of buses required on various routes must be observed. Ticket ing can also be
int roduced on bus stops or via e-t icketing to make boarding more efficient as done in Curit iba city, Brazil.
Government can also get into a joint venture with private sector which might help boost consumer confidence.
Public private partnership st ructure and rules should be pre determined and designed in cooperation with a
business enterprise council.
Source: Lowson, M . (2004). “ Idealised models for public t ransport syst em,” Int ernat ional Journal of Transport M anagement .
In a situat ion where rail-based city t ransport alone is seen as an expensive proposit ion and beyond the
means of most local governments, a fully integrated rail and road based network that caters to the
needs of Pakistan’s rapidly growing urban populat ion has become an unavoidable necessity. For such
integrat ion of t ransport network, strong regulatory inst itut ions—in charge of maintaining transport
infrastructure and regulat ing private t ransport operators—should be established at provincial and
district level. Urban planners, apart from urban development, should also be responsible for providing
appropriate space for t ransport infrastructure such as t ruck stands, bus terminals, bus depots,
workshops, etc. and transport related act ivit ies like wholesale markets and warehousing. Effort should
also be focused at implement ing t raffic management measures such as one-way traffic, foot paths and
cycle ways, improved signals, intersect ion improvements, bus bays, road maintenance, road drainage,
removal of encroachments etc., than on road building projects.
Creating Sophisticated Market for Railways
In 2008-09, it was est imated that Pakistan Railways employed 90,000 people and carried on average 65
million people annually. Indian Railways on the other hand employs 1.6 million people and carries 7.3
billion people annually. The rat io of passengers per employee for Pakistan Railways stands at 722 and

32
4562 for Indian Railways respect ively. This is mainly due to PR losing market share to road transport .
Indian Railways has not only retained market share but has also carried out some bold reforms during
the last decade which have helped it to become extremely profitable.
Pakistan Railways is facing significant losses due to mismanagement, overstaffing, under-investment,
poor maintenance and weak t icket ing checks allowing travellers to ride the trains without purchasing
t ickets. Over time, there have also been polit ical intervent ions in deciding which new routes to open and
serve. Furthermore, PR is not allowed to charge its marginal cost and the tariffs have always been
dictated by the federal government. With massive losses, Pakistan Railways needs to improve its
operat ions. To reduce corrupt ion, employees should receive performance-based remuneration. Time
delays should be cut so that t ravelling by t rains is an at t ract ive opt ion for both inter- and intra-city
t ravel. Prices should be deregulated and Railways Corporat ion should be allowed to charge the marginal
cost of servicing any route, or port ion thereof, plus a mark-up which is agreed with the appropriate
government regulator. To make sure that public interests are served and exploit ive prices are punished,
an independent regulatory body must be set up.
To improve management, part ial privat isat ion should be encouraged. In India, part ial privat isat ion of
railways has given it a t remendous boost. Pakistan Railways too can adopt part ial privat isat ion
measures, e.g. outsourcing stat ions management, rail hospitals, allowing a group of companies to run
their own container t rains. This will increase private sector part icipat ion necessary for promot ing
compet it ion. Also, when outsourcing stat ion management, contracts should be based on total number
of t ickets sold— for example, some fract ion of the revenue from a part icular stat ion could go to the
management. This will incent ivise the management to ensure that free-riding is minimal. It will also
encourage management to provide better services, such as efficient t icketing system and better on
board services. Gradually Pakistan Railways should be privat ised, completely. There are two possible
ways of doing it . One, through separat ion of infrastructure (unbundling) and secondly, by privat izing
regional railways while allowing them to remain vert ically integrated. Case studies support ing the two
restructuring scenarios are discussed in Box 8.

33
Box 8 – Case Studies on Railways Restructuring
Japan: In Japan privat isation of the former state-owned railway, Japan National Railway (JNR), took the final
form of public stock offerings. Privatisat ion was preceded by restructuring JNR into seven separate
companies—six regional passenger railways and one nat ional freight railway. The reform process took 10 years,
from the time that it was recognised that radical rest ructuring was needed until the first of the JNR successor
companies was offered to the public.
Sweden: Swedish state railways were separated into two act ivity centres. One centre became the state-owned
rail operat ing company, Statens Järnvägar (SJ). At this writ ing SJ held a monopoly for freight t ransport over the
ent ire network and for passenger services over the main line network. The second centre is Banverket (BV), the
Nat ional Rail Administ rat ion. BV is responsible for providing and maintaining the country’s railway
infrastructure.
United Kingdom: Reorganisation of Brit ish Railways defines one ext reme form of the railway st ructuring
envelope. In the process of reorganisat ion, BR was unbundled. The discrete value-adding funct ions, such as car
maintenance, terminal operations, locomotive maintenance, t rack repair, unit t rain operat ions, etc., which are
vert ically connected in most other railways, were separated into numerous relat ively small-scale enterprises.
Each enterprise was offered for sale as an operat ing franchise to private operators. Ownership and
management responsibility for the main line infrast ructure was also privat ised.
United States of America: Railway rest ructuring in the United States has involved industry segmentat ion into
two kinds of private carriers: (1) large inter-regional carriers and (2) small local carriers. Structural changes in
the industry were init iated primarily by the private sector within a regulatory framework that was supportive of
railway reorganisation. Since the liberalisat ion of economic regulat ion in 1980, the U.S. rail industry has
t ransformed itself in the face of st rong compet it ion from other modes. A dist inguishing aspect of this
rest ructuring process has been the creat ion of hundreds of small railways.
Source: R Kopicki and L Thompson, ‘Best M ethods of Railway Restructuring and Privat isat ion’, World Bank, CFS Discussion Paper Series,
Number 111.
The various models discussed in Box 8 have their strengths and weaknesses which need to be
understood before choosing the one that would be most effect ive in a given environment . A vertically
integrated setup (such as in North American)—where an operator has control over all crit ical core
funct ions—can serve consumers well through greater harmony between the infrastructure and services.
However, if checks and balance are not put in place and transparency is not enforced, a vert ically
integrated operator will act like a monopoly. It can also constrain development of key rail corridors by
restrict ing t rain paths.58
On the other hand, unbundling increases track ut ilisation (which is only 42 per cent in Pakistan) by giving
access to small operators. This will also minimise individual operators’ ability to restrict t rack ut ilisat ion.
Furthermore, earnings of the t rack operat ing company will be solely dedicated to the maintenance and
expansion of t rack infrastructure. However this could complicate operat ions, especially between
operators and track providers. Although UK’s experience with unbundling has been quite successful and
improved the quality of service, it has been criticised by companies, passengers, and unions for being
too complex.
58
J Allen, ‘Organisat ional Regimes for Commuter Rail: An Internat ional Perspective’, Regional Transportat ion Agency, 2009.
34
Independent regulatory bodies should be established for Pakistan Rail t ransport with the sole
responsibility of promot ing consumer welfare. Private part icipat ion and greater compet it ion will result
in greater benefits if independent regulatory body exists.
Towards Becoming a Regional Hub of Aviation
Government ’s close cooperat ion with PIA is the main obstacle in ensuring compet it ive environment.
Pakistan needs to introduce compet it ion in its aviat ion industry. This is essent ial to improve efficiency
and to compete better, internat ionally. With world class airlines, such as Emirates and Singapore Airlines
(SAL), operat ing in the same region, it is important for Pakistan to t ry and match up to their standards. It
must be stated that although several successful airlines (such as SAL) are government owned, such
countries have efficient governance structures in place which discourage red-tape and rent seeking. In
Pakistan, which has a deep rooted culture of rent seeking, a compet it ive market which may involve
public-private partnerships can be a more suitable way to achieve higher standards.
Pakistan’s current regulatory regime is too restrict ive and gives airports of regional countries a
significant advantage. A level playing field must be created in the aviat ion sector, too. In this regard, the
rights to carry passengers or cargo from a second country to a third country by stopping in one’s own
country (6th
freedom rights) should be introduced. This will make Pakistan more at t ract ive for potent ial
investors and facilitate current players by increasing the profitability of the sector. SAL and other airlines
use this right extensively to fly passengers between Europe and Australasia. Given Pakistan’s strategic
locat ion, this can significant ly improve connect ivity between Central Asia, Africa, Europe and Australasia
routes. On similar lines, the design of new Islamabad airport (under construct ion) must see itself as a
hub catering to the Central Asian travellers’ requirements.
While effort is made to become compet it ive at regional level, compet it ion must also be encouraged at
domest ic level. Thus, the Civil Aviat ion Authority (CAA) should pursue ‘open sky’ policy in both
passenger and cargo traffic—i.e. all airlines should be free to operate on routes of their choice. Routes
which are congested should be auct ioned instead of giving a preferent ial t reatment to PIA. Similarly on
internat ional routes where ‘open sky’ or ‘mult iple designat ions of airlines’ is not available, routes should
be auct ioned to all airlines, including the nat ional carrier in a t ransparent manner.
Current ly, landing rights fee and t iming slots allocated to airlines by the CAA are favoured towards PIA.
CAA, by the nature of its mandate, should not have control over any assets which makes it a player in
the aviat ion industry. However, all the nat ional airports are under its control. Therefore, to create a level
playing field for all market players, airports should be gradually privat ised. This will not only reduce the
fees through healthy compet it ion between airports but will also improve overall efficiency by improving
check-in procedures, flight management, and provision of modern facilit ies. Under the revised mandate,
CAA, in addit ion to other regulatory responsibilit ies, will also be responsible for ensuring that the
efficiency gains are passed on to the users.
Improving Trade Facilities through Adoption of ICT
To further facilitate t rade act ivit ies, electronic customs declarat ion form should be adopted. The Form is
already available and Pakistan can simply consolidate other informat ion onto the Form, in line with
integrated systems of France or Hong Kong.59
This would significant ly reduce the number of documents
59
‘Doing Business 2010’, The World Bank, 2010
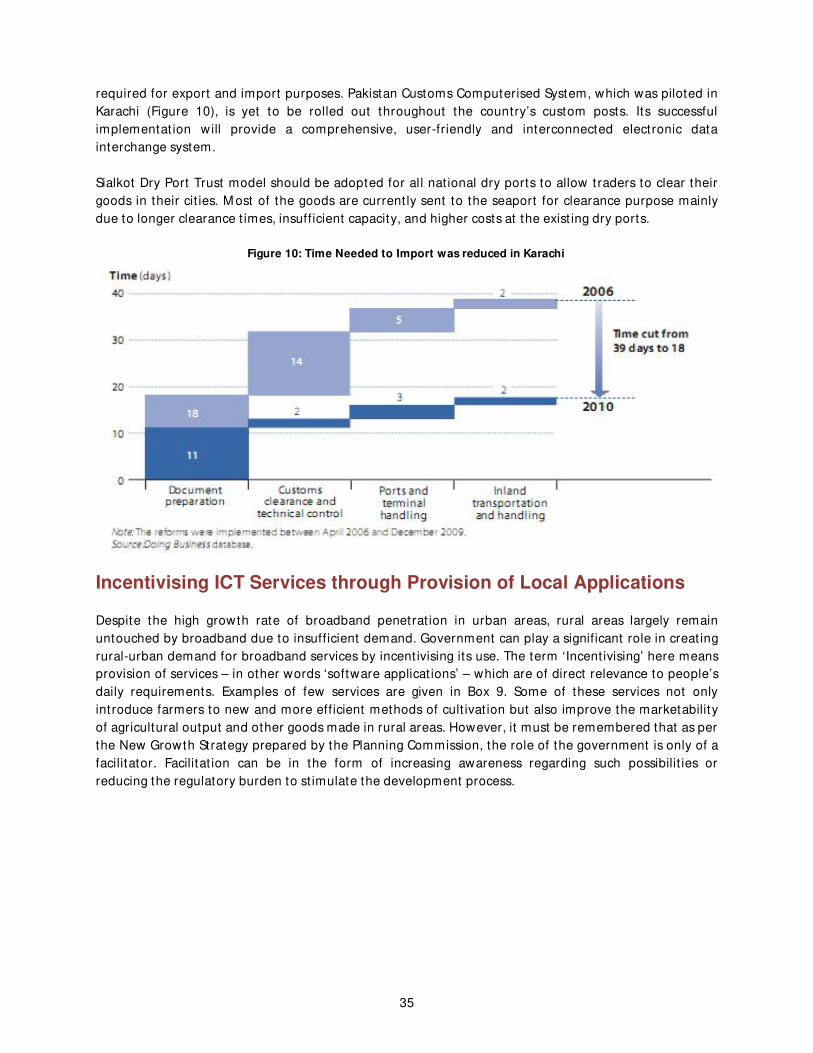
35
required for export and import purposes. Pakistan Customs Computerised System, which was piloted in
Karachi (Figure 10), is yet to be rolled out throughout the country’s custom posts. Its successful
implementat ion will provide a comprehensive, user-friendly and interconnected electronic data
interchange system.
Sialkot Dry Port Trust model should be adopted for all nat ional dry ports to allow traders to clear their
goods in their cit ies. M ost of the goods are current ly sent to the seaport for clearance purpose mainly
due to longer clearance t imes, insufficient capacity, and higher costs at the exist ing dry ports.
Incentivising ICT Services through Provision of Local Applications
Despite the high growth rate of broadband penetrat ion in urban areas, rural areas largely remain
untouched by broadband due to insufficient demand. Government can play a significant role in creat ing
rural-urban demand for broadband services by incent ivising its use. The term ‘Incent ivising’ here means
provision of services – in other words ‘software applicat ions’ – which are of direct relevance to people’s
daily requirements. Examples of few services are given in Box 9. Some of these services not only
introduce farmers to new and more efficient methods of cult ivat ion but also improve the marketability
of agricultural output and other goods made in rural areas. However, it must be remembered that as per
the New Growth Strategy prepared by the Planning Commission, the role of the government is only of a
facilitator. Facilitat ion can be in the form of increasing awareness regarding such possibilit ies or
reducing the regulatory burden to st imulate the development process.
Figure 10: Time Needed to Import was reduced in Karachi

36
Box 9 – Innovation in M obile Phone Usage
Village phone model: In many African rural areas, mobile phones have proved a great source of livelihood,
especially among women. Women in villages buy mobile phones and sell calls around the neighbourhood. The
portability of the mobile phones makes this business flourish in areas where accessibility was denied before. In
Bangladesh, this was promoted by the Grameen Phone, a subsidiary of the Grameen Bank and Telenor, which
gives out microfinance for purchasing handsets. They gave loans to women in rural areas to buy a mobile
phone to sell calls. This system has also been popularised in Afghanistan.
Cell-bazaar: Another innovative idea in Bangladesh is using mobile phones as markets. With the cell bazaar,
people can list the items they are selling and the buyers can access these items and decide whether to buy
them. This is important for many small businesses who cannot afford to advertise in the mainst ream media.
Information: In Uganda, mobile phones have become an inst rument used by farmers to get information about
the weather and other factors that can affect crop yields. Farmers’ Friend is a service that is accessible through
text and can provide answers to quest ions asked by farmers. In some situat ions, people call back in response to
specific queries. While television has been quite active in promoting farmer and general awareness, the use of
cell phones can help provide awareness to remote areas. M obile phones can be used to promote women
empowerment , health and education informat ion to enhance the social development of rural and remote
areas.
M obile cash: In many countries, mobile cash is thriving. M obile money schemes allow t ransfer of money
through cell phones. This is done by mobile phone top-ups or pre-paid vouchers as cash, as compared to
t ransferring money through people. Sometimes, this can be done through transferring airt ime directly and then
convert ing that into money through shopkeepers and retailers. G-cash and Smart M oney in the Philippines,
Wizzit in South Africa, Celpay in Zambia and M -PESA in Kenya are examples mobile money schemes that are
succeeding in this venture. In some countries, it has become popular enough to be used as an alternat ive to
cash where it can be used to pay school fees and taxi fares.
In Bangladesh, similar to Grameen Phone, Grameenphone internet was started to facilitate internet
usage on-the-go in hard-to-reach areas. M obile phones are an already established way to introduce
internet to people without incurring any substant ial addit ional cost . With mobile phone, internet can be
made available in rural areas which will ultimately increase income and st imulate growth. Similar to the
village-phone model, a village-internet model can also be introduced.
In the e-government evolut ion, Pakistan stands at the beginning of the middle stage where government
inst itut ions provide significant informat ion and limited services using their websites. Recent ly, FBR has
taken some key init iat ives to provide opt ions for paying taxes online. By providing more services online,
government can incent ivise broadband usage by reducing wait ing time, t ravel costs and administrat ive
hassle.
Furthermore, Electronic Signature Act should be passed to provide legal cover for the use of digital IDs,
signature cert ificates and electronic authent icat ion and verificat ion. The proposed law should ensure
that the electronic signature is uniquely linked to the signatory, capable of ident ifying the signatory,
created using means that the signatory can keep solely under personal control, linked to the data to
which it relates in such a manner that any subsequent change of data is detectable. However, it must
also be recognised that ensuring all this must not de-incent ivise its usage thus forcing people to st ick to
t radit ional ways. Such Act will promote use of Internet and Intranet e-mail for inter-office

37
communicat ion, both at horizontal and vert ical levels, which will ult imately replace the physical file
system with a computer-based file system. Government of India passed a similar act in 2000 which
addressed issues such as legal recognit ion of electronic documents, legal recognit ion of digital
signatures, offences and contravent ions, just ice dispensat ion systems for cybercrimes (Informat ion
Technology Act 200060
), etc.
To promote right skills, government should also provide ICT infrastructure to rural schools. IT and
Telecommunicat ions Division can approach IT companies in this regard to encourage them in
undertaking the responsibility of providing IT t raining and infrastructure in government schools on
voluntary basis. NGOs and private enterprises can often rat ionalise investments in establishing training
inst itutes and internet centres in rural towns to create rural demand. Wireless technology can be used
for areas which are otherwise inaccessible.
Open Domestic Talent Market
In the past decade, Pakistan has relied heavily on building new universit ies as a means of producing high
skilled human capital. However, very lit t le at tent ion was given to developing university facult ies. As a
result , several universities have sprung up in various cit ies but very few of their graduates get job offers.
M ost of the few high quality students migrate to the developed countries in order to benefit from the
higher rate of return on their human capital, by earning higher wages.
In order to improve the quality of human capital, including the university faculty, Pakistan must open its
domest ic talent market to global pool of talent (Box 10). Some steps have already been taken in this
direct ion and foreign faculty is increasingly being welcomed to local universities. To promote this
further, however, permission to allow researchers to hold joint appointments with internat ional
universities should also be considered. Pakistan must build on the steps already being taken and should
gradually move towards opening other government departments to foreign recruitment.
60
Government of India (2000), “ Informat ion Technology Act 2000,” M inist ry of Law, Justice and
Company Affairs.

38
Box 10 – Open Domestic Talent M arket
Like in the US and many other countries, the global market place should be used to at t ract professionals with
advanced skills to Pakistan. Of course domest ic residents will show a desire for the high end jobs and be
prepared to work for a discount and not need compensat ion for moving costs as would be sought by
professionals abroad. Bit like their richer counterparts, developing countries, too, should not be parochial,
relying only on nat ionals, when it comes to filling key management and research posit ions. Instead they should
open up all such posit ions to the global talent pool.
By thinking think in these terms, the emphasis moves from naïve ideas of curbing or taxing the ‘brain drain’ to
managing the desired skill requirements at home. Human capital flight then becomes relevant only insofar as it
takes away from the required skills at home. Rather than worry about who stays or who goes, we worry about
measuring the required skills and how to get the SIP right in the economy. At the same t ime, by placing
emphasis on the human capital requirements of the economy, and maintaining the analogy with physical or
f inancial capital, Pakistan can move from retaining human capital of domest ic origin to the existing practice in
advanced countries of at tracting the requisite skills from anywhere. This will make developing countries also
act ive in the global market for human capital that is currently only accessed by advanced countries. For
example, it is diff icult to understand why the academic market is fully globalised in the richer countries, with
them picking professors from all countries while in the poor countries it remains the monopoly of domest ic
residents? When governance skills are not widely available, why should governments not delve in the
internat ional market for skills? M oving the emphasis to SIP and Human Capital M anagement (HCM ) will bring
these issues to the forefront.
Source: Haque, N. (2005). Brain Drain or Human Capital Flight , Pakistan Inst itute of Development Economics (PIDE).
Recommendations: Connectivity Action Matrix
Recommendat ions to ensure rapid connect ivity with regards to goals to be achieved, the following
act ions and inst itut ional arrangements are proposed and discussed:
Goal Current Issues Proposed Actions Institutional
arrangement required
1. Promot ing
private sector
part icipat ion in
railways
Pakistan Railways
ministry is self-
regulat ing. This leads to
biased policies which
discourage private
sector part icipat ion
Create an independent
regulatory body,
including in its
members a private
sector representat ive,
having no financial
stake in the market
Ordinance to be
drafted by the
M inistry of Law and
promulgated by the
President

39
Goal Current Issues Proposed Actions Institutional
arrangement required
2. Creat ing a
sophist icated
market for
railways
M onopoly of Pakistan
Railways
Pakistan Railways
should be unbundled
and then privat ised:
Rail Tracks and
Signalling; Stat ion
M anagement; Rail
services (Passenger and
Freight)
To be undertaken by
the M inistry of
Railways;
Restructuring unit
within the M inistry of
Finance
Federal government
intervent ion in the form
of tariff regulat ion
Transfer the authority
of determining tariffs
to service operators
Summary of tariff
deregulat ion to be
prepared by the
M inistry of Railways
and presented before
the ECC
3. Reducing number
of documents
required for
export ing and
import ing
purposes
Laborious
documentat ion
procedures
Electronic Customs
Declarat ion Form
should be adopted
To be done by
Customs’ department
of Federal Board of
Revenue
4. Comprehensive,
user-friendly and
interconnected
electronic data
interchange
system
Too many documents to
be filled manually
Pakistan Customs
Computerised System
should be rolled out on
all through out the
country’s customs
posts
To be done by
Customs’ department
of Federal Board of
Revenue
5. Allowing traders
to clear their
goods in their
cit ies
Long clearing t imes at
the dry ports due to:
inadequate
infrastructure and poor
custom facilit ies
Sialkot Dry Port t rust
model should be
replicated on all dry
ports
To be pursued by the
M inistry of
Commerce, M inistry
of Communicat ions
and M inistry of
Railways

40
Goal Current Issues Proposed Actions Institutional
arrangement required
6. Efficient urban
transport for
facilitat ing
cit izens and
limit ing
increasing
burden on road
infrastructure
Inadequate and
non-transparent
route allocat ions;
Poor quality
controls;
Lack of buses;
No protect ion /
insurance for new
entrants against
the host ility from
exist ing mafia
Inadequate
regulatory controls
All routes should be
realigned and auct ioned in a
t ransparent manner;
M inimum number of buses
on each route and their
quality should be observed
strict ly;
Provide bus/ van insurance
cover to new entrants
against unexpected event—
e.g., at tacks during protests;
Separate bus lane on 3 and
more than 3 lane roads
M inistry of Transport
(provincial level);
City development
authorit ies e.g. CDA,
LDA, KDA etc.
7. Compet it ive
aviat ion sector
Close cooperat ion
of government
with PIA;
Lengthy
documentat ions;
Unrealist ic
condit ions;
Biased route/ slot
allocat ions
Domest ic and Internat ional
routes should be auct ioned;
Documentat ion procedure
should be reduced;
M aximum t ime limit for
responding to various
applicat ions;
Eliminate requirement of
maintaining minimum
financial capital before
invest ing;
Privat isation of nat ional
airports.
To be undertaken by
Civil Aviat ion
Authority

41
Goal Current Issues Proposed Actions Institutional
arrangement required
8. M aking
internat ional
routes
economically
feasible for
nat ional airlines
Less demand for
t ravel to Africa,
Central Asia, South
East Asia
Introduce 6th
Freedom
Rights. It allows airlines to
carry passengers from one
country to another while
making a stop in its own
country
To be proposed by the
Civil Aviat ion
Authority and
approved by the ECC
9. Promot ing e-
government to
offer more online
services
Poor ICT skills
within government
departments;
No legal cover for
Digital IDs;
ICT training should be made
compulsory for government
employees;
All departments should
make their websites more
act ive by uploading all
project details;
Back office of each
department should be
automated to bring all the
informat ion online and
enhance inter departmental
sharing;
Electronic Signature Act
should be passed to provide
legal cover to the use of
Digital IDs, Signature
cert ificates and electronic
authent icat ion
All government
departments with
help from the M inistry
of Informat ion
Technology;
Act to be prepared by
the M inistry of
Informat ion
Technology and
Pakistan
Telecommunicat ion
Authority
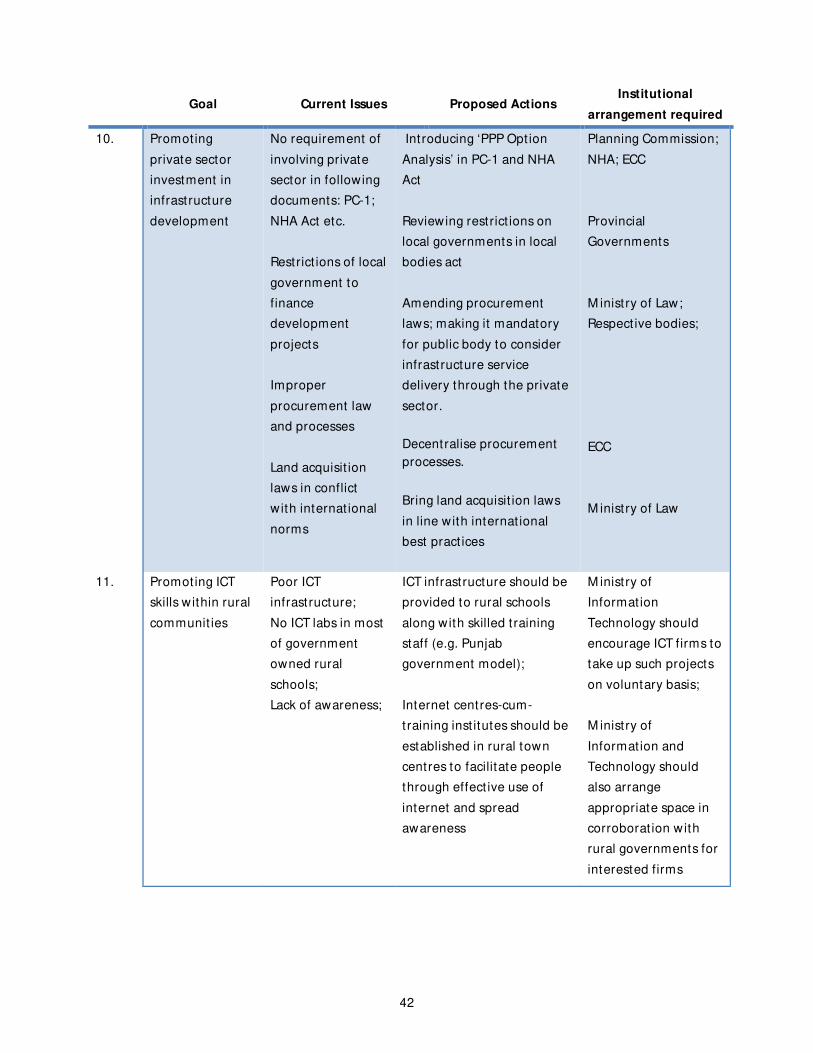
42
Goal Current Issues Proposed Actions Institutional
arrangement required
10. Promot ing
private sector
investment in
infrastructure
development
No requirement of
involving private
sector in following
documents: PC-1;
NHA Act etc.
Restrict ions of local
government to
finance
development
projects
Improper
procurement law
and processes
Land acquisit ion
laws in conflict
with internat ional
norms
Introducing ‘PPP Opt ion
Analysis’ in PC-1 and NHA
Act
Reviewing restrict ions on
local governments in local
bodies act
Amending procurement
laws; making it mandatory
for public body to consider
infrastructure service
delivery through the private
sector.
Decentralise procurement
processes.
Bring land acquisit ion laws
in line with internat ional
best pract ices
Planning Commission;
NHA; ECC
Provincial
Governments
M inistry of Law;
Respect ive bodies;
ECC
M inistry of Law
11. Promot ing ICT
skills within rural
communit ies
Poor ICT
infrastructure;
No ICT labs in most
of government
owned rural
schools;
Lack of awareness;
ICT infrastructure should be
provided to rural schools
along with skilled t raining
staff (e.g. Punjab
government model);
Internet centres-cum-
training inst itutes should be
established in rural town
centres to facilitate people
through effect ive use of
internet and spread
awareness
M inistry of
Informat ion
Technology should
encourage ICT firms to
take up such projects
on voluntary basis;
M inistry of
Informat ion and
Technology should
also arrange
appropriate space in
corroborat ion with
rural governments for
interested firms
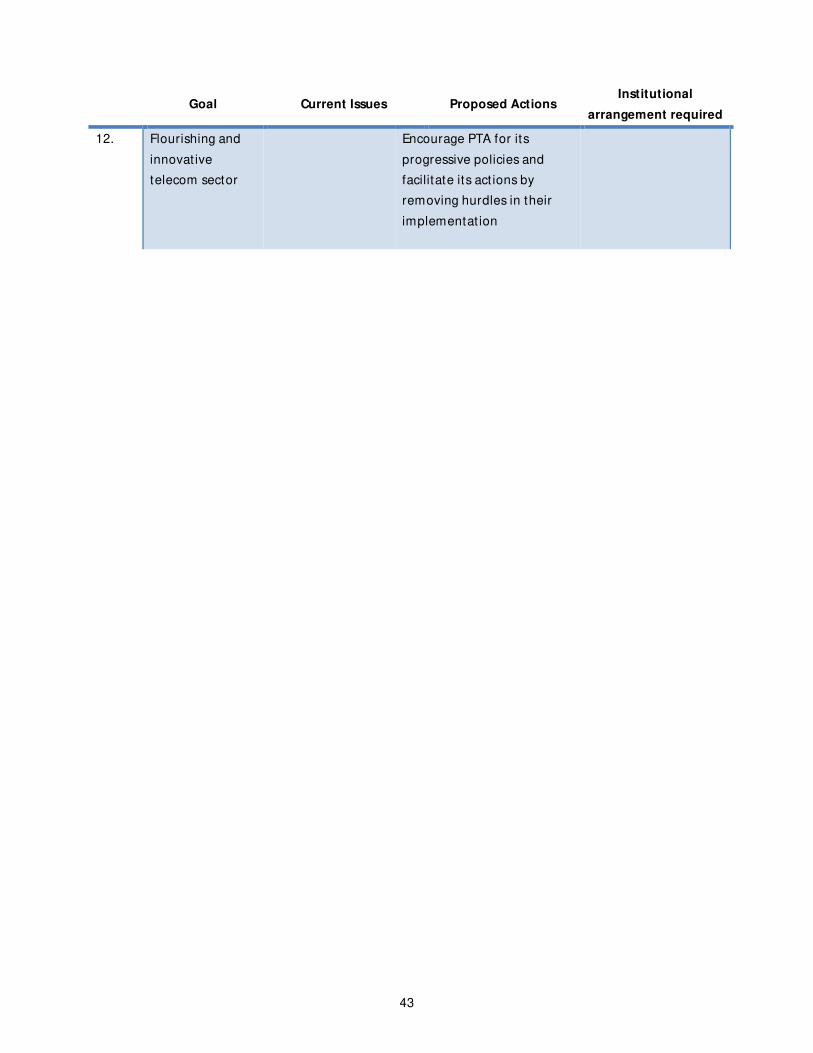
43
Goal Current Issues Proposed Actions Institutional
arrangement required
12. Flourishing and
innovat ive
telecom sector
Encourage PTA for its
progressive policies and
facilitate its act ions by
removing hurdles in their
implementat ion
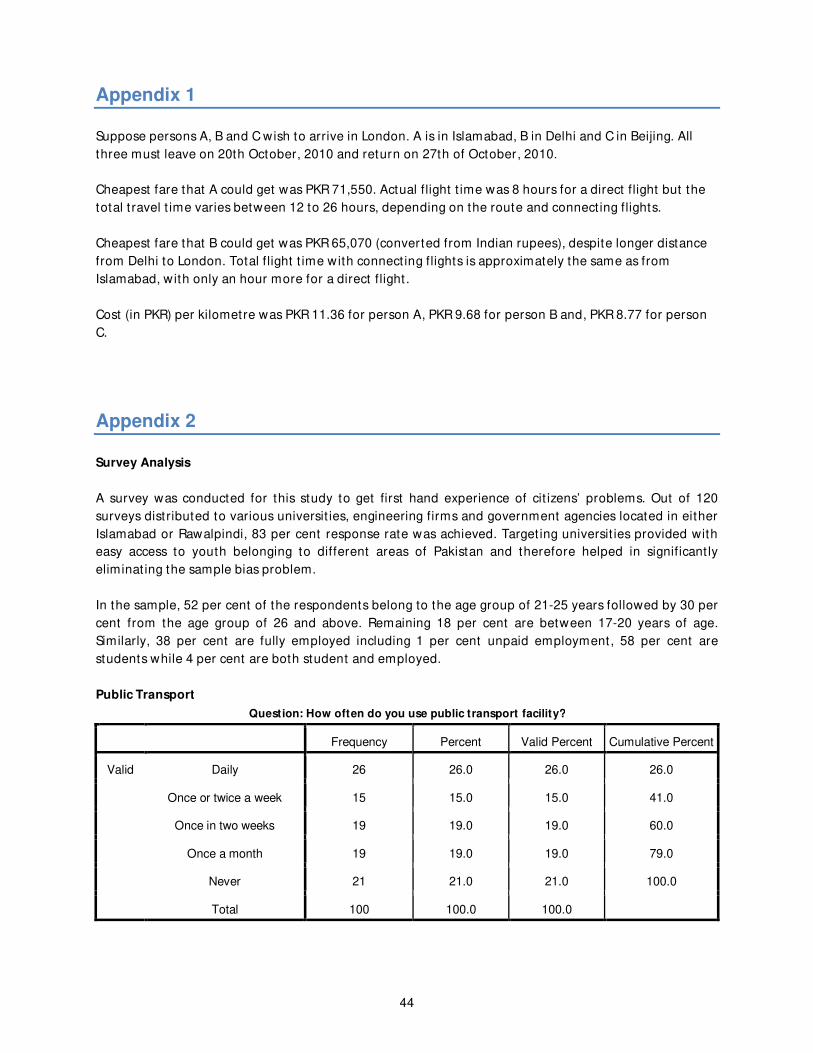
44
Appendix 1
Suppose persons A, B and C wish to arrive in London. A is in Islamabad, B in Delhi and C in Beijing. All
three must leave on 20th October, 2010 and return on 27th of October, 2010.
Cheapest fare that A could get was PKR 71,550. Actual flight t ime was 8 hours for a direct flight but the
total t ravel t ime varies between 12 to 26 hours, depending on the route and connect ing flights.
Cheapest fare that B could get was PKR 65,070 (converted from Indian rupees), despite longer distance
from Delhi to London. Total flight t ime with connect ing flights is approximately the same as from
Islamabad, with only an hour more for a direct flight .
Cost (in PKR) per kilometre was PKR 11.36 for person A, PKR 9.68 for person B and, PKR 8.77 for person
C.
Appendix 2
Survey Analysis
A survey was conducted for this study to get first hand experience of cit izens’ problems. Out of 120
surveys distributed to various universit ies, engineering firms and government agencies located in either
Islamabad or Rawalpindi, 83 per cent response rate was achieved. Target ing universit ies provided with
easy access to youth belonging to different areas of Pakistan and therefore helped in significant ly
eliminat ing the sample bias problem.
In the sample, 52 per cent of the respondents belong to the age group of 21-25 years followed by 30 per
cent from the age group of 26 and above. Remaining 18 per cent are between 17-20 years of age.
Similarly, 38 per cent are fully employed including 1 per cent unpaid employment, 58 per cent are
students while 4 per cent are both student and employed.
Public Transport
Question: How often do you use public transport facility?
Frequency Percent Valid Percent Cumulative Percent
Valid Daily 26 26.0 26.0 26.0
Once or twice a week 15 15.0 15.0 41.0
Once in two weeks 19 19.0 19.0 60.0
Once a month 19 19.0 19.0 79.0
Never 21 21.0 21.0 100.0
Total 100 100.0 100.0

45
It was found that only 26 per cent of the respondents use public t ransport on daily basis. However, there
is considerable demand which is visible from 41 per cent respondents using it at least once or twice a
week and 60 per cent using it at least once in two weeks. On the other hand, only 21 per cent
respondents said they never use public t ransport .
M ain problems faced while commuting are quality and lack of t ransport . 51 per cent reported that they
think quality is the major issue while 36 per cent view it to be lack of t ransport . Of the female
respondents, many reasoned security-related issues to be the main reason for their reluctance to t ravel
on buses. On the contrary, only 13 per cent reported higher prices to be their major concern. This
highlights that current ly insufficient routes are being served with inadequate number of buses. It ,
therefore, makes it necessary for the regulators to realign exist ing routes and ensure minimum number
of buses per route.
Question: Problems faced while commuting via public transport?
Frequency Percent Valid Percent Cumulative Percent
Valid Lack of transport(long delays) 36 36.0 36.0 36.0
High prices/fares 13 13.0 13.0 49.0
Quality of transport 51 51.0 51.0 100.0
Total 100 100.0 100.0
Limitat ions: Sample only covers those who are either students or are in full t ime employment. Those
who are either not employed or are involved in day labour should be studied in detail as they have a
higher probability of t ravelling via public t ransport . This higher probability is mainly due to their low
income levels which do not allow them to own a mode of t ransport .
Railways
Problems facing rail t ravel are also very similar but of greater magnitude. Almost all the part icipants
complained of poor services. However, 55 per cent thought of it as a major problem while 16 per cent
opted for long delays. It was found that 57 per cent of the sample had never t ravelled via rail. Out of the
university students, who represent the newer generat ion, only 36 per cent had ever used railways. This
is again due to poor services and long delays which 78 per cent of all the students considered to be their
immediate issues.
Question: How often do you use railways as mode of transport?
At least once
a week
Once in two
weeks
Once in a
month
Once every
six months Once a year Never Total
Employed 0 0 3 10 5 19 37
Not paid 0 0 0 0 0 1 1

46
student 1 1 5 10 4 37 58
Working
student 0 0 0 2 2 0 4
Total 1 1 8 22 11 57 100
Question: Why do you not travel via Railways?
Rail Stat ion Far from
Residence
Long
Delays
Poor
quality
Take more t ime than
bus
Total
Frequency 14 16 55 15 100
Limitat ions: Given that 57 per cent of the sample has never used railways, it can be observed that much
of the complaints are based on the percept ion of our respondents instead of their experience.
Aviation
Air t ravel is considered to be the most at t ract ive mode of t ravel for long distances but is the least used
due to higher prices. Only 36 per cent had ever experienced air t ravel and 86 per cent find it expensive.
Of the employed class, 41 per cent use it at least once a year but this significant ly goes down to 31 per
cent for students.
Limitat ions: Air t ravel has always been an expensive mode of t ransport . Just because the respondents
cannot afford an air t icket does not lead to any significant analysis. It will be more appropriate to link
this quest ion with the individual or family income levels.
What should we do with Public Sector Enterprises?
Frequency Cumulative Percent
Valid Privatise completely 36 36.0
Public-Private partnership 26 62.0
Do not privatise but allow them to work on
commercial basis
27 89.0
Continue giving subsidy 5 94.0
Dont know 6 100.0
Total 100
When asked ‘how should we improve Pakistan Railways and Pakistan Internat ional Airline?’ 36 per cent
preferred privat isation over any other solut ion. 26 per cent were in favour of public-private partnership
and 27 per cent want the government to run the affairs of these enterprises on commercial basis. M ost
important ly, only 5 per cent wanted the government to cont inue giving them subsidy. This is a major
finding and is against the general percept ion of possible public anger against privat isation.
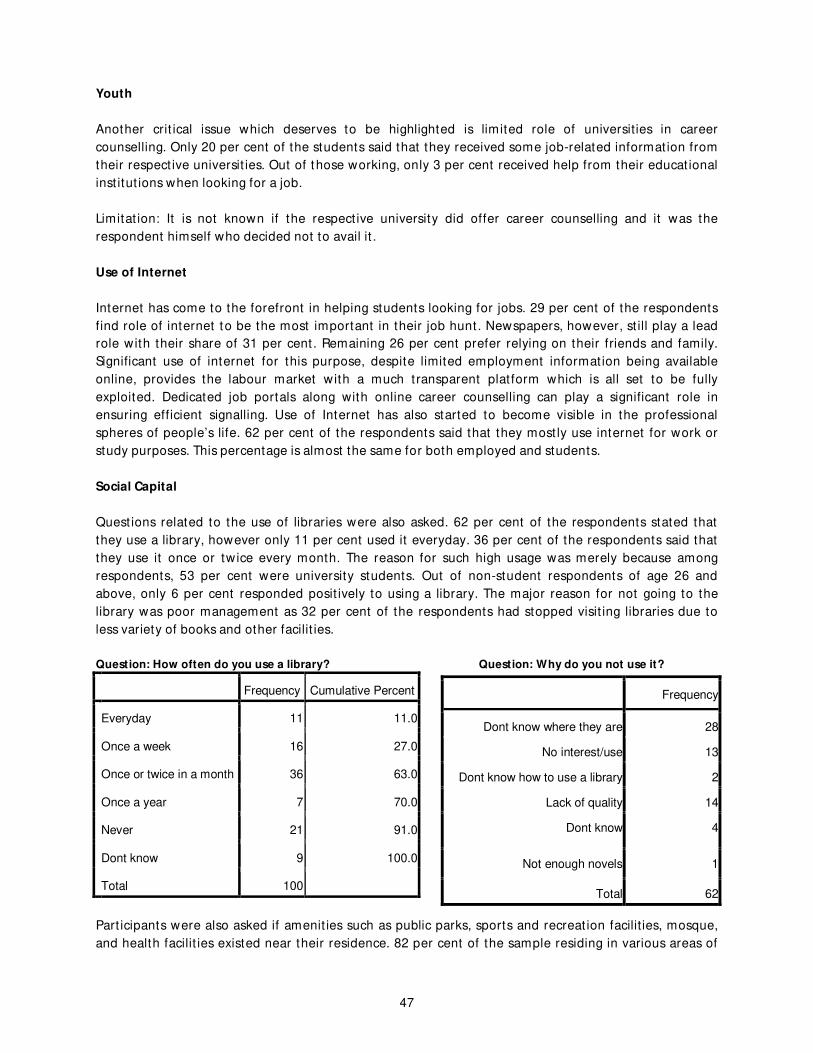
47
Youth
Another crit ical issue which deserves to be highlighted is limited role of universities in career
counselling. Only 20 per cent of the students said that they received some job-related informat ion from
their respect ive universit ies. Out of those working, only 3 per cent received help from their educat ional
inst itut ions when looking for a job.
Limitat ion: It is not known if the respect ive university did offer career counselling and it was the
respondent himself who decided not to avail it .
Use of Internet
Internet has come to the forefront in helping students looking for jobs. 29 per cent of the respondents
find role of internet to be the most important in their job hunt. Newspapers, however, st ill play a lead
role with their share of 31 per cent. Remaining 26 per cent prefer relying on their friends and family.
Significant use of internet for this purpose, despite limited employment informat ion being available
online, provides the labour market with a much transparent plat form which is all set to be fully
exploited. Dedicated job portals along with online career counselling can play a significant role in
ensuring efficient signalling. Use of Internet has also started to become visible in the professional
spheres of people’s life. 62 per cent of the respondents said that they most ly use internet for work or
study purposes. This percentage is almost the same for both employed and students.
Social Capital
Quest ions related to the use of libraries were also asked. 62 per cent of the respondents stated that
they use a library, however only 11 per cent used it everyday. 36 per cent of the respondents said that
they use it once or twice every month. The reason for such high usage was merely because among
respondents, 53 per cent were university students. Out of non-student respondents of age 26 and
above, only 6 per cent responded posit ively to using a library. The major reason for not going to the
library was poor management as 32 per cent of the respondents had stopped visit ing libraries due to
less variety of books and other facilit ies.
Question: How often do you use a library? Question: Why do you not use it?
Frequency Cumulative Percent
Everyday 11 11.0
Once a week 16 27.0
Once or twice in a month 36 63.0
Once a year 7 70.0
Never 21 91.0
Dont know 9 100.0
Total 100
Part icipants were also asked if amenit ies such as public parks, sports and recreat ion facilit ies, mosque,
and health facilit ies existed near their residence. 82 per cent of the sample residing in various areas of
Frequency
Dont know where they are 28
No interest/use 13
Dont know how to use a library 2
Lack of quality 14
Dont know 4
Not enough novels 1
Total 62

48
Islamabad and Rawalpindi had mosques near residence where as 69 per cent had public parks. However,
only a small number of respondents had sports and recreat ion facilit ies.
Conclusion
Survey results are very much in line with the expectat ions and lend significant support to the reforms
proposed.
References
L J Hanifan, ‘The Rural School Community Centre’, Annals of the American Academy of Polit ical and
Social Science, vol. 67, 1916, pp.130-138.
F Y Fukuyama, ‘Social Capital and the Global Economy’, Foreign Affairs, vol. 74, no. 5, 1995.
J C Coleman, ’Social capital in the creat ion of human capital’, American Journal of Sociology, vol.94,
1988, pp. 95-120.
S Gachter, B Herrmann, and C Thoni, ‘Trust , voluntary cooperat ion, and socio-economic background:
survey and experimental evidence,’ Journal of Economic Behavior & Organisat ion, Elsevier, vol. 55, no. 4,
2004, pp.505-531.
J Sobel, ‘Can We Trust Social Capital,’ Journal of Economic Literature, vol. XL, 2002, pp. 139-154.
D Ganley and C Lampe, ’The t ies that bind: Social network principles in online communit ies’, Decision
Support Systems, vol. 47, 2009, pp. 266-274.
E Ostrom, ‘Social Capital: A fad or fundamental concept ’, Centre for the Study of Inst itut ions, Populat ion,
and Environmental Change, Indiana University, 1999.
Pakistan Telecommunicat ion Authority (PTA), ‘Broadband and Value Added Services’, 2007.
C Gannon and Z Liu, ‘Poverty and Transport ,’ M imeo, The World Bank, Washington, DC, 1997.
I Ali and E M Pernia, ‘Infrastructure and Poverty Reduct ion- What is the Connect ion?’, Asian
Development Bank
P Glewwe, M Gragnolat i and H Zaman, ‘Who Gained from Vietnam’s Boom in the 1990s? An Analysis of
Poverty and Inequality Trends’, World Bank Working Paper 2275, Washington, D.C.
S Fan, L Zhang and X Zhang, ‘Growth, Inequality, and Poverty in Rural China: The Role of Public
Investments’, Research Report 125, Internat ional Food Policy Research Inst itute, Washington, D.C.,
2002.
C Calderon and L Serven, ‘The effects of infrastructure development on growth and income distribut ion’,
2004.

49
A Estache, ‘On Lat in America’s Infrastructure Privat isat ion and its Distribut ional Effects’, M imeo, The
World Bank, Washington DC., 2003.
L Waverman, M M eschi and M Fuss, ‘The Impact of Telecoms on Economic Growth in Developing
Countries’, 2005.
C Z W Qiang, ‘M obile Telephony: A Transformat ional Tool for Growth and Development ’, Private Sector
Development, Proparco's M agazine, vol. 1, no.4, 2009.
R Jensen, R, ‘The Digital Provide: Informat ion (Technology), M arket Performance, and Welfare in the
South Indian Fisheries Sector’, The Quarterly Journal of Economics, vol. CXXII, no.3, 2007, pp.879-924.
C Calderon and L Serven, ‘The effects of infrastructure development on growth and income distribut ion’,
2004.
M Woolcock, ‘Social Capital and Economic Development: Toward a Theoret ical Synthesis and Policy
Framework’, Theory and Society, vol. 27, 1998, pp.151-208.
D Narayan, ‘Bonds and Bridges: Social Capital and Poverty,’ Poverty Group, World Bank, 1999.
I Kawachi and L F Berkman, ‘Social Cohesion, Social Capital and Health’, in Social Epidemiology, Oxford
University Press, 2000
J F Helliwell and R D Putnam, ‘Educat ion and Social Capital’, NBER Working Paper Series, Vol. 7121,
1999.
S Knack and P Keefer, ‘Does Social Capital Have an Economic Payoff?’, The Quarterly Journal of
Economics, vol. 112, 1997, pp.1251-1288.
R L Sandefur and E Laumann, ‘A Paradigm for Social Capital’, Rat ionality and Society,vol. 10, no.4, 1998,
pp.481-501.
M Akdere and P Robert , ‘Economics of Social Capital: Implicat ions for Organisat ional Performance’,
Advances in Developing Human Resources, vol. 10, no. 6, 2008, pp.802-816.
A Portes and P Landolt ., ‘The downside of social capital’, The American Prospect, vol. 26, no. 94, 1996,
pp.18–22.
L Crudelli, ‘Social Capital and Economic Opportunit ies’, Journal of Socio Economics, vol. 35, no.5, 2006,
pp. 913-927.
C Hulten, ‘Infrastructure Capital and Economic Growth: How Well You Use It M ay Be M ore Important
than How M uch You Have’, NBER Working Paper 5847, 1996.
H Esfahani and M T Ramirez, ‘Inst itut ions, Infrastructure and Economic Growth’, Journal of Development
Economics, vol. 70, 2002, pp. 443–77.
50
L Waverman and K Dasgupta, ‘Connect ivity Scorecard 2010’, LECG, 2010.
‘Broadband and Value Added Services’, Pakistan Telecommunicat ion Authority (PTA), 2009
NU Haque, ‘Brain Drain or Human Capital Flight ’, Pakistan Inst itute of Development Economics (PIDE),
2005.
M Zaidi, ‘Disconnected? Physical Capital, Social Capital, And Connect ivity for Economic Growth in
Pakistan’, Centre for the Process of Change, 2011
I A Qureshi and L U, ‘Urban Transport and Sustainable Transport Strategies: A Case Study of Karachi,
Pakistan’, Tsinghua Science and Technology, vol.12, no.3, 2007.
M Sohail, ‘Urban public t ransport and sustainable livelihoods for the poor, a case study: Karachi,
Pakistan’, WEDC, Loughborough University, UK 2000.
I A Qureshi and L U, ‘Urban Transport and Sustainable Transport Strategies: A Case Study of Karachi,
Pakistan’, Tsinghua Science and Technology, vol.12, no.3, 2007.
J Allen, ‘Organisat ional Regimes for Commuter Rail: An Internat ional Perspect ive’, Regional
Transportat ion Agency, 2009.
Government of India (2000), “ Informat ion Technology Act 2000,” M inistry of Law, Just ice and
Company Affairs.