Results Q1 2018 Schaeffler AG€¦ · This presentation is intended to provide a general overview...
30
Results Q1 2018 Schaeffler AG Conference Call May 8, 2018 Herzogenaurach
Transcript of Results Q1 2018 Schaeffler AG€¦ · This presentation is intended to provide a general overview...

Results Q1 2018 Schaeffler AG
Conference CallMay 8, 2018
Herzogenaurach

This presentation contains forward-looking statements. The words "anticipate", "assume", "believe", "estimate", "expect", "intend", "may", "plan", "project“, "should" and similar expressions are used to identify forward-looking statements. Forward-looking statements are statements that are not historical facts; they include statements about Schaeffler Group's beliefs and expectations and the assumptions underlying them. These statements are based on plans, estimates and projections as they are currently available to the management of Schaeffler AG. Forward-looking statements therefore speak only as of the date they are made, and Schaeffler Group undertakes no obligation to update any of them in light of new information or future events.
By their very nature, forward-looking statements involve risks and uncertainties. These statements are based on Schaeffler AG management's current expectations and are subject to a number of factors and uncertainties that could cause actual results to differ materially from those described in the forward-looking statements. Actual results may differ from those set forth in the forward-looking statements as a result of various factors (including, but not limited to, future global economic conditions, changed market conditions affecting the automotive industry, intense competition in the markets in which we operate and costs of compliance with applicable laws, regulations and standards, diverse political, legal, economic and other conditions affecting our markets, and other factors beyond our control).
This presentation is intended to provide a general overview of Schaeffler Group’s business and does not purport to deal with all aspects and details regarding Schaeffler Group. Accordingly, neither Schaeffler Group nor any of its directors, officers, employees or advisers nor any other person makes any representation or warranty, express or implied, as to, and accordingly no reliance should be placed on, the accuracy or completeness of the information contained in the presentation or of the views given or implied. Neither Schaeffler Group nor any of its directors, officers, employees or advisors nor any other person shall have any liability whatsoever for any errors or omissions or any loss howsoever arising, directly or indirectly, from any use of this information or its contents or otherwise arising in connection therewith.
The material contained in this presentation reflects current legislation and the business and financial affairs of Schaeffler Group which are subject to change.
Disclaimer
May 8, 2018 Schaeffler AG Q1 2018 Results2
1 Overview
2 Business Highlights Q1 2018
3 Financial Results Q1 2018
4 Outlook
Agenda
May 8, 2018 Schaeffler AG Q1 2018 Results3
Key aspects
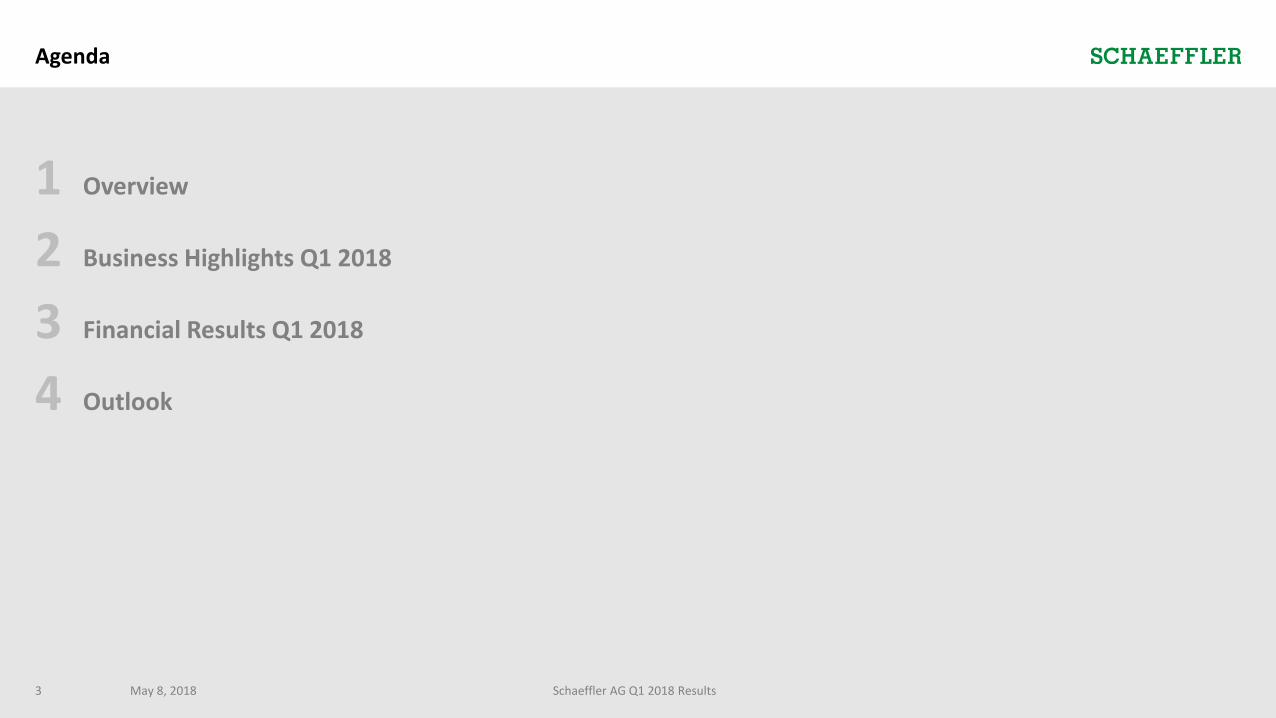
1 Overview
Solid start into the year – Q1'18 reporting with 3 divisions
Outperformance Automotive OEM ~ 4%-pts – EBIT margin2) 9.5% (PY 11.9%)
10.8% growth1) in Industrial – EBIT margin2) 11.4% (PY 8.6%)
Transformation continues – Reallocation of plants to enhance accountability, customer focus and efficiency
Solid start into the year – Q1 group sales +3.9%1), Q1 EBIT margin2) 11.0%(PY 12.2%)
1) FX-adjusted 2) Before special items
May 8, 2018 Schaeffler AG Q1 2018 Results4
Automotive Aftermarket with temporary decline in top-line – EBIT margin2)
17.9% (PY 19.2%)
Free Cash Flow Q1'18 with EUR -71 mn improved (PY EUR -130 mn) – Capex to sales at 8.6% (PY 8.4%)
Guidance 2018 confirmed at group and divisional level – Accelerated growthexpected in H2'18
Automotive OEM
Q1'17 Q1'18
Sales 2,279 mn
EBIT margin2)
2,308 mn
11.9% 9.5%
Sales 446 mn
EBIT margin2)
484 mn
19.2% 17.9%
Sales 826 mn
EBIT margin2)
782 mn
8.6% 11.4%
+3.2%1)
1
2
3
4
5
6
7
Automotive Aftermarket
Industrial
-4.4%1)
+10.8%1)
2 Business Highlights Q1 2018
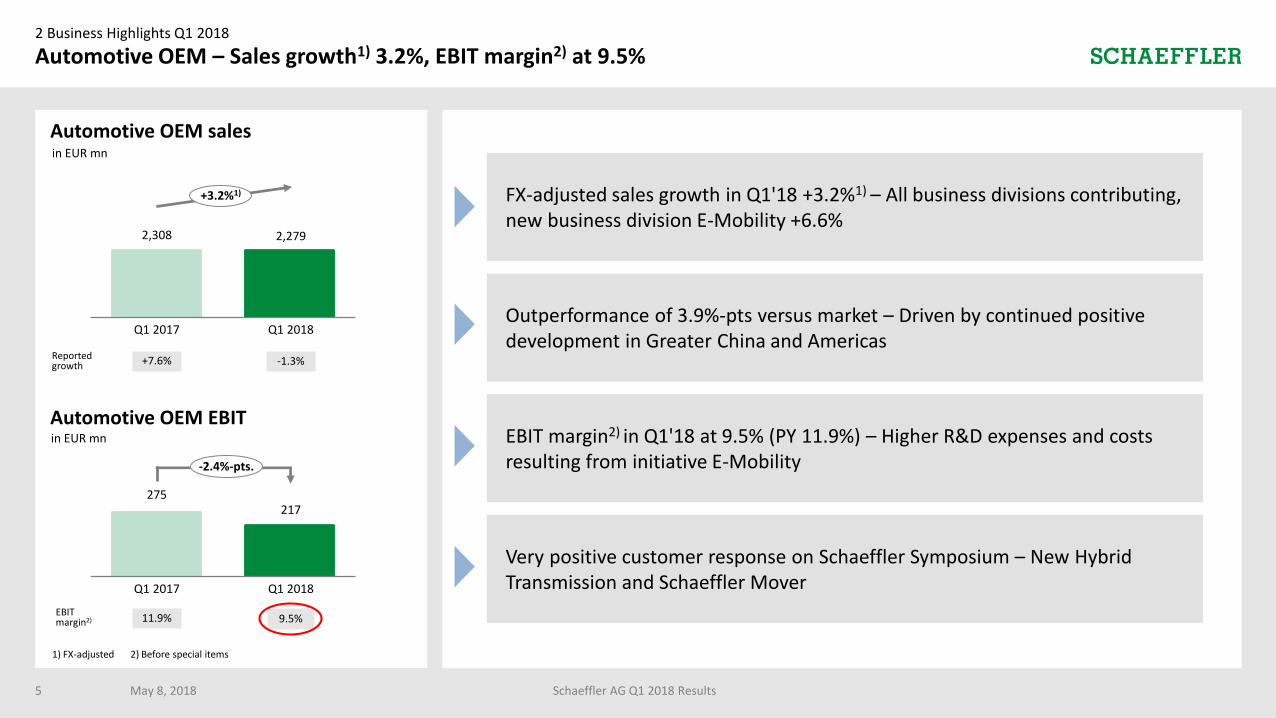
Automotive OEM – Sales growth1) 3.2%, EBIT margin2) at 9.5%
May 8, 2018 Schaeffler AG Q1 2018 Results5
Automotive OEM sales
+3.2%1)
Q1 2018Q1 2017
2,2792,308
Q1 2018Q1 2017
217275
EBIT margin2) 11.9% 9.5%
in EUR mn
in EUR mn
Automotive OEM EBIT
Reportedgrowth -1.3%+7.6%
1) FX-adjusted 2) Before special items
EBIT margin2) in Q1'18 at 9.5% (PY 11.9%) – Higher R&D expenses and costsresulting from initiative E-Mobility
FX-adjusted sales growth in Q1'18 +3.2%1) – All business divisions contributing, new business division E-Mobility +6.6%
Very positive customer response on Schaeffler Symposium – New Hybrid Transmission and Schaeffler Mover
Outperformance of 3.9%-pts versus market – Driven by continued positive development in Greater China and Americas
-2.4%-pts.

May 8, 2018 Schaeffler AG Q1 2018 Results6
2 Business Highlights Q1 2018
Automotive OEM – Very successful Schaeffler Symposium 2018 demonstrating innovative strength
Every four years Schaeffler invites industry specialist for an exclusive event of technical presentations with exciting insights into the technologies and mobility concepts being developed by Schaeffler.
Facts and figures
~ 400 customers
96 exhibits & 28 technical presentations
12 world debuts
New HV Hybrid Transmission 6 speeds for combustion engine-, 2
electrical speeds and eReverse
Lower fuel consumption compared to existing P2 Hybrid Modules
Reduced gearbox complexity
Modular design with scalable electricmachine
11th Schaeffler Symposium 2018 in Baden-Baden Schaeffler Symposium 2018 Product Highlights
Schaeffler Mover Urban vehicle concept
Flexible and zero-emissions platform for diverse vehicle concepts
Drive and suspension modules installed in a single unit, "SchaefflerIntelligent Corner Module"
Easily scalable (vehicle length and width)

2 Business Highlights Q1 2018
Automotive Aftermarket – Sales1) -4.4%, EBIT margin2) at 17.9%
May 8, 2018 Schaeffler AG Q1 2018 Results7
Q1 2018Q1 2017
446484
Q1 2018Q1 2017
8093
EBIT margin2) 19.2% 17.9%
in EUR mn
in EUR mn
Reportedgrowth
-7.9%
1) FX-adjusted 2) Before special items
+11.8%
Automotive Aftermarket sales
Automotive Aftermarket EBITEBIT margin2) in Q1'18 at 17.9% (Q1'17: 19.2%) – Base effect in Q1'17 andgrowing investments into distribution network
FX-adjusted sales growth in Q1'18 -4.4%1) – Driven by weaker development in Europe (-3.6%) and Americas (-16.5%) compared to Q1'17
Continuous improvements in operational excellence – Product innovation, improved supply chain management and service quality
Temporary weakness in sales region Americas – Strong base effect in Q1'17 due to positive one-offs in OES distribution channel
-1.3%-pts.
-4.4%1)

8
TEMOT Asia Pacific Appreciation Award
Awarded for:
• Customer relationship management
• Future orientation
• Local competency
• Service quality
New Warehouse in Lyon, France
More space to better serve customers
• Larger incoming and outgoing areas
• Increased palate space
New Repair Solutions for LUK GearBOX enabling transmission repairs by standard garages
Significant progress in Q1'18
• 9 new applications (new total of 38)
• 95% YoY sales growth in Q1'18
Ruville integration
Egon von Ruville GmbH now part of Schaeffler Automotive Aftermarket GmbH & Co. KG
• Schaeffler management system has been implemented
• Ruville converted to latest ISO standard, common Schaeffler certification to follow
Supply Chain Management Products
Customer Focus Efficiency
Automotive Aftermarket – Strengthening operational excellence and service quality2 Business Highlights Q1 2018
May 8, 2018 Schaeffler AG Q1 2018 Results
Operational excellence andservice quality

2 Business Highlights Q1 2018
Industrial – Sales growth1) 10.8%, EBIT margin2) at 11.4%
May 8, 2018 Schaeffler AG Q1 2018 Results9
Industrial sales
+10.8%1)
Q1 2018Q1 2017
826782
Q1 2018Q1 2017
94
67
EBIT margin2) 8.6% 11.4%
in EUR mn
in EUR mn+2.8%-pts.
Industrial EBIT
Reportedgrowth
+5.6%
1) FX-adjusted 2) Before special items
+2.2%
Q1 Industrial EBIT margin2) at 11.4% (Q1'17: 8.6%) – Higher volumes andpositive impact from initiative CORE
FX-adjusted sales growth in Q1'18 +10.8%1) – All regions contributing, Industrial business in Greater China +40%
Industry 4.0 as a major strategic initiative – Significant business opportunities and growth potential
Strong growth1) in Industrial Distribution business – Double digit growth rates in four out of eight sectors

Hannover Fair April 2018 – Putting Industry 4.0 into practice
10
Digital service "ConditionAnalyzer" (automatic diagnosis) enabled by Schaeffler SmartCheck & Schaeffler Service Cloud
Distribution partner SPIT
Condition monitoring & digital service for electric motors
Digital service "LifetimeAnalyzer"
(calculation of remaining useful life -
RUL) via Cloud-to-Cloud communication
based on Schaeffler's Domain-
Knowhow
Customer ZF
Digital service for gearboxes
Condition Monitoring with SmartCheck
and autonomous relubrication with
Schaeffler's lubricator Concept 8
EDC Kitzingen and implementation
partner SSI Schaefer
Condition monitoring and auto-nomous relubrication for intralogistics
Schaeffler at the Hannover Fair
World's leading trade fair for industrial technology with 5,000 exhibitors and over 220,000 visitors
Specific Industry 4.0 reference projects at the Schaeffler booth were presented under the heading "Schaeffler Puts Industry 4.0 into Practice"
Industry 4.0, one of the key initiatives of the “Agenda 4 plus One”, shows big growth potentials
May 8, 2018 Schaeffler AG Q1 2018 Results
2 Business Highlights Q1 2018

Q1 2017 Q1 2018 ∆ Q1 17/18
FCF as reported (130) (71) 59
Non recurring items1) 36 33 (3)
AKO / EDC2) 22 19 (3)
M&A3) 19 2 (17)
Receivable Sale Program
0 0 0
(53) (17) 36
2 Business Highlights Q1 2018
Free Cash Flow at EUR -71 mn – Capex ratio at 8.6%
May 8, 2018 Schaeffler AG Q1 2018 Results11
Key aspects
Free Cash Flow increased by EUR 59 mn to EUR -71 mn in Q1'18,
FCF conversion ratio 24%
Free Cash Flow seasonally negative due to working capital
development
Capex to sales ratio at 8.6% (Q1'17: 8.4%)
FCF Detailsin EUR mn
Free Cash Flowin EUR mn
Q1 17 Q2 17 Q3 17
FCFconversionratio4)
FY 2017 Target:FCF ~ EUR 500mn1)
1) Including payments for legal cases and restructuring measures2) Capex in major logistic projects Aftermarket Kitting Operation (AKO) and European Distribution Center (EDC)3) Cash in- and outflows for M&A activities4) LTM FCF before M&A divided by LTM EBITDA before special items
Q4 17 Q1 18
+59 mn
-130
41
333244
-71
30% 18% 21% 22%
M&A -19 16 0 -24
FCF before M&A
-111 25 333 268
24%
-2
-69

2 Business Highlights Q1 2018
May 8, 2018 Schaeffler AG Q1 2018 Results12
Transformation continues – All plants allocated to divisions
Key aspects
Dissolution of "Bearing Components & Technologies" (BCT) as an internal bearing supplier
Reallocation of all BCT / Operations plants to the divisions
Simplified structure, reduction of overhead and less allocated costs
Group-wide "Technology umbrella" is maintained
More accountability,more business focus,
more efficiency
Global plant network
Today TomorrowMarket/customer Market/customer
Suppliers Suppliers
72 Plants61 Locations
80 Plants61 Locations16 Campus Plants
PlantsAOEM 37BCT/Operations 26Industrial 9
56-
24
72 80Total 43%
57% 80%
20%
Direct cost
Allocated cost

2 Business Highlights Q1 2018
May 8, 2018 Schaeffler AG Q1 2018 Results13
Indicative Business Case – Cost improvement potential around EUR 60 mn
60
2018 2019 2020 2021
Financial impact1)
EUR mn~ 100% run rate
Indicative allocation of cost savings: Automotive OEM: ~EUR 33 mn
Industrial: ~EUR 27 mn
Targeted HCO reduction
Key aspects
Integration of BCT/Operations plants into the divisions offers significant cost and efficiency potential
Around 950 jobs becoming redundant in BCT overhead and indirect functions of plants
Around EUR 60 mn cost savings targeted to be fully realized in 2021 (Full run rate); around EUR 50 mnrestructuring provisions expected in H2 2018
Negotiations with workers council started; project headed by Andreas Schick, new Board Member responsible for Operations
0
Germany
Continuous cost andefficiency improvement
Other regions
Total
0
0
to come
950
450
500
- 502)
1) Indicative numbers referring to EBIT / EBIT before special items2) One-time restructuring charges, no impact on FY 2018 guidance

3 Financial Results Q1 2018
Key figures Q1 2018
in EUR mn Q1 2017 Q1 2018Q1 2018
vs. Q1 2017
Sales 3,574 3,551-0.6%
+3.9%1)
EBIT2) 435 391-44 mn
-10.1%
EBIT margin2) 12.2% 11.0% -1.2%-pts.
Net income3) 279 240 -39 mn
EPS4) 0.42 0.36 -0.06
ROCE2) 5) 22.1% 19.3% -2.8%-pts.
Free Cash Flow -130 -71 +59 mn
Capex 299 306 +7 mn
Net financial debt 2,742 2,439 -303 mn
Gearing ratio6) 114.3% 88.9% -25.4%-pts.
1) FX-adjusted 2) Before special items
3) Attributable to shareholders of the parent company4) Earnings per common non-voting share
May 8, 2018 Schaeffler AG Q1 2018 Results14
5) LTM6) Ratio of net financial debt to equity incl. non-controlling interests
1
2
3
4
5

3 Financial Results Q1 2018
Sales growth Q1'18 +3.9%1) – 18.1% sales growth1) in China
May 8, 2018 Schaeffler AG Q1 2018 Results15
1) FX-adjusted
Salesin EUR mn
53%
20%
17%
10%
Americas
+1.4%
Greater China
+18.1%
Europe
+1.5%
Asia/Pacific
+1.5%
Sales by region Q1 2018y-o-y growth w/o FX effectsQ1
3,574
Q4
3,541
Q3
3,434
Q2
3,472
Q1
3,551
2017 2018
14,021
+3.9%1)
vs Q1 2017
+5.4% +2.2% +7.4% +8.5% +3.9%
Key aspects
Group sales +3.9%1) (Q1'17: +5.4%1))
Sales growth mainly driven by China (AOEM +12.4%; AAM +40.9%; Industrial +40.0%)
Further acceleration of group sales expected in H2'18
Sales growth1)
1
+6.9% +3.1% +5.2% +5.4% -0.6%Reported growth

Q1 2017 Q2 2017 Q3 2017 Q4 2017 Q1 2018
Automotive OEM 11.9% 9.4% 10.7% 11.2% 9.5%
Automotive Aftermarket
19.2% 15.3% 23.1% 17.9% 17.9%
Industrial 8.6% 8.5% 8.9% 6.1% 11.4%
Total 12.2% 9.9% 12.1% 11.0% 11.0%
3 Financial Results Q1 2018
EBIT Q1'18 11.0% – Mid-point of FY guidance
May 8, 2018 Schaeffler AG Q1 2018 Results16
EBIT1)
in EUR mn
12.2% 9.9% 12.1% 11.0% 11.0%
Key aspects
EBIT margin1) at 11.0% (Q1'17: 12.2%)
Gross profit margin decreased from 28.9% to 27.0% mainly driven by negative FX effect3)
Overhead costs increased mainly due to Agenda 4 plus One initiatives and expansion of Automotive Aftermarket distribution network
EBIT margin1)
Q1
435
Q4
388
Q3
416
Q2
3452)
Q1
391
2017 2018
-44 mnvs Q1 2017
EBIT marginBefore special items
1) Before special items2) Reported EBIT of EUR 358m including EUR 13m positive special item3) Compensating FX hedging effect in Others line
1,584
2

3 Financial Results Q1 2018
Automotive OEM – 3.9%-pts. outperformance versus market
May 8, 2018 Schaeffler AG Q1 2018 Results17
A
Q1 2017 Q1 2018 1)
716 709 +4.1%
1,084 1,075 +3.9%
101 104 +6.6%
407 391 -0.3%
2,308 2,279 +3.2%
Engine Systems
Transmission Systems
Total
E-Mobility
Chassis Systems
Sales by business divisionin EUR mn
Q4 17
8.1%
Q3 17
5.0%
Q2 17
3.5%
Q1 17
0.7%
6.4% 3.5% 7.4% 8.7%
5.7% -0.1% 2.4% 0.6%
Growth rateAutomotive OEM1)
LVP growth2)
Q1 18
3.9%
-0.7%
3.2%
1) FX-adjusted 2) Source: IHS, as of April 2018
Outperformance by quarter
Outperformance Q1'18 of 3.9%-pts. versus global production growth
New business division E-Mobility includes e-axles and hybrid modules as well as CVT, wet DCT and actuators
FY sales target for BD E-Mobility of EUR 500-600 mn
Key aspects
FY 18e
2%
6-7%
Automotive OEM sales and market development Q1
Production of light vehicles Q1 2018 vs Q1 2017 (IHS)
Sales growth1) Schaeffler Automotive Q1 2018 vs Q1 2017
+0.4%+1.4%
Europe Americas Asia/PacificGreater China
+3.7%
-1.0%
+0.5%
-1.5%
+12.4%
-2.3%
World production: -0.7%Schaeffler Automotive OEM: +3.2%1)

3 Financial Results Q1 2018
Automotive OEM – EBIT margin2) of 9.5% (Q1'17: 11.9%)
May 8, 2018 Schaeffler AG Q1 2018 Results18
Key aspects
Gross profit margin declined from 26.6% to 24.1% mainly driven by negative FX effects and ramp-up costs
R&D expenses increased from 7.4% to 8.0% of sales mainly due to higher costs into E-Mobility
Selling expenses remained almost flat at 3.8%
EBIT margin 9.5% in Q1'18 after 11.9% in Q1'17
EBITQ1 2018
OthersEBITQ1 2017
R&D expenses
Selling expenses
EBIT1) Q1 2017 vs. Q1 2018in EUR mn
11.9%
-11 -1
9.5%
1) Before special items 2) Includes negative FX effects of EUR -45 mn
A
+21
EBIT margindevelopment1)
275
GrossProfit
-662)
217
-1
Administrative expenses
-2.5%-pts -0.6%-pts -0.1%-pts -0.1%-pts +0.9%-pts
3 Financial Results Q1 2018
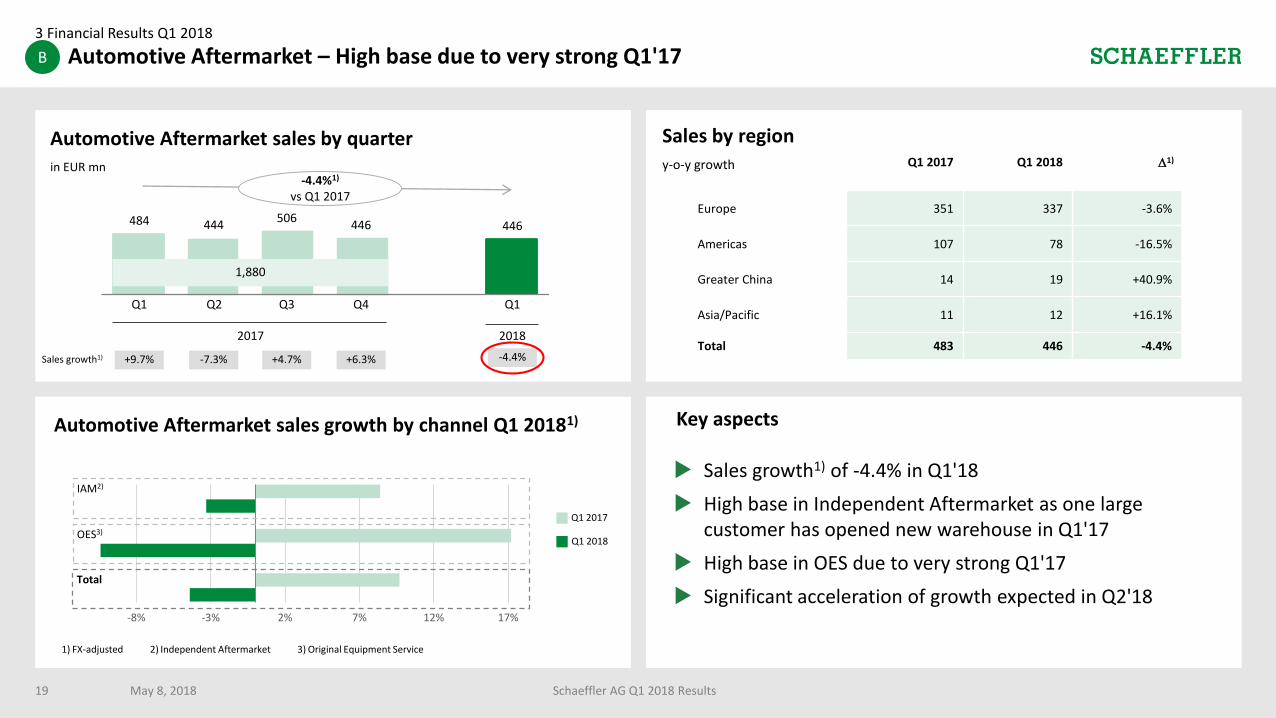
Automotive Aftermarket – High base due to very strong Q1'17
May 8, 2018 Schaeffler AG Q1 2018 Results19
B
1) FX-adjusted 2) Independent Aftermarket 3) Original Equipment Service
Sales growth1) of -4.4% in Q1'18
High base in Independent Aftermarket as one large customer has opened new warehouse in Q1'17
High base in OES due to very strong Q1'17
Significant acceleration of growth expected in Q2'18
Key aspects
Q1 2017 Q1 2018 1)
Europe 351 337 -3.6%
Americas 107 78 -16.5%
Greater China 14 19 +40.9%
Asia/Pacific 11 12 +16.1%
Total 483 446 -4.4%
Sales by region
y-o-y growth
Automotive Aftermarket sales by quarterin EUR mn
+9.7% -7.3% +4.7% +6.3% -4.4%Sales growth1)
Q1
484
Q4
446
Q3
506
Q2
444
Q1
446
2017 2018
1,880
-4.4%1)
vs Q1 2017
-13% -8% -3% 2% 7% 12% 17%
IAM2)
Q1 2018
Q1 2017
OES3)
Total
Automotive Aftermarket sales growth by channel Q1 20181)
3 Financial Results Q1 2018
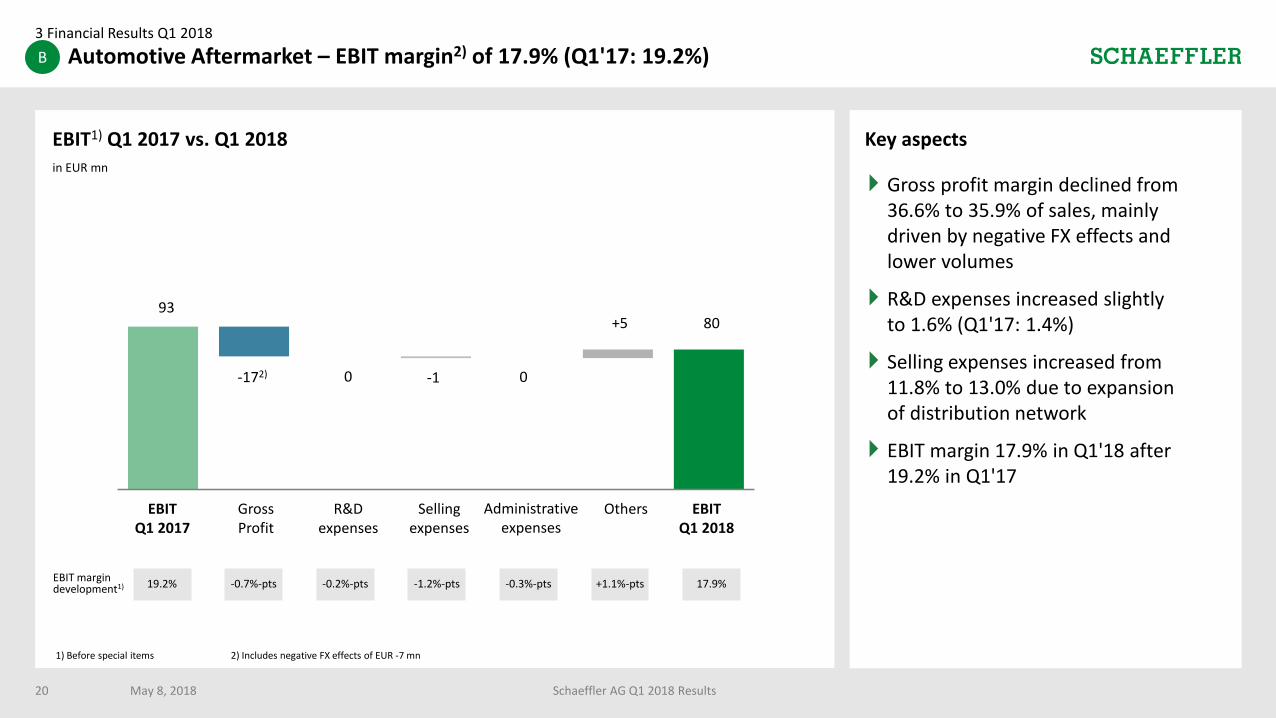
May 8, 2018 Schaeffler AG Q1 2018 Results20
Key aspects
Gross profit margin declined from 36.6% to 35.9% of sales, mainly driven by negative FX effects and lower volumes
R&D expenses increased slightly to 1.6% (Q1'17: 1.4%)
Selling expenses increased from 11.8% to 13.0% due to expansion of distribution network
EBIT margin 17.9% in Q1'18 after 19.2% in Q1'17
EBITQ1 2018
OthersEBITQ1 2017
R&D expenses
Selling expenses
EBIT1) Q1 2017 vs. Q1 2018in EUR mn
19.2%
0 -1
17.9%
+5
EBIT margindevelopment1)
93
GrossProfit
-172)
80
0
Administrative expenses
-0.7%-pts -0.2%-pts -1.2%-pts -0.3%-pts +1.1%-pts
Automotive Aftermarket – EBIT margin2) of 17.9% (Q1'17: 19.2%)B
1) Before special items 2) Includes negative FX effects of EUR -7 mn

3 Financial Results Q1 2018
Industrial Division – Double-digit growth rates in most sectors and Industrial Distribution
May 8, 2018 Schaeffler AG Q1 2018 Results21
Industrial sales by quarterin EUR mn Q1 2017 Q1 2018 1)
Europe 455 484 +8.0%
Americas 153 141 +5.4%
Greater China 102 131 +40.0%
Asia/Pacific 72 70 +4.4%
Total 782 826 +10.8%
Sales by region
y-o-y growth
C
+0.2% +4.5% +9.2% +9.0% +10.8%Sales growth1)
Q1
782
Q4
770
Q3
790
Q2
808
Q1
826
2017 2018
3,150
+10.8%1)
vs Q1 2017
Industrial sales by sector cluster Q1 20181)
-10% +20% +30%
Offroad
Railway
Power Transmission
Aerospace
Two-Wheelers
Wind
Industrial Automation
Raw Materials
Industrial Distribution
Key aspects
Sales growth1) of 10.8% in Q1'18
Positive development in most sectors as well as Industrial Distribution
Growth rates to normalize in coming quarters as base effect declines
1) FX-adjusted
+10%

3 Financial Results Q1 2018
May 8, 2018 Schaeffler AG Q1 2018 Results22
EBITQ1 2018
OthersEBITQ1 2017
R&D expenses
Selling expenses
EBIT1) Q1 2017 vs. Q1 2018in EUR mn
8.6%
-1
+3
11.4%
+15
EBIT margindevelopment1)
67
GrossProfit
+112)
94
-1
Administrative expenses
-0.3%-pts +0.1%-pts +1.1%-pts +0.1%-pts +1.8%-pts
Industrial Division – EBIT margin2) of 11.4% (Q1'17: 8.6%)
Key aspects
Gross margin remained fairly stable at 30.4% (Q1'17: 30.7%) as high volumes are compensated by negative FX effect2)
Significant improvement in Selling expenses driven by CORE program
EBIT margin 11.4% in Q1'18 after 8.6% in Q1'17
C
1) Before special items 2) Includes negative FX effects of EUR -25 mn
Net income1)
in EUR mn
3 Financial Results Q1 2018
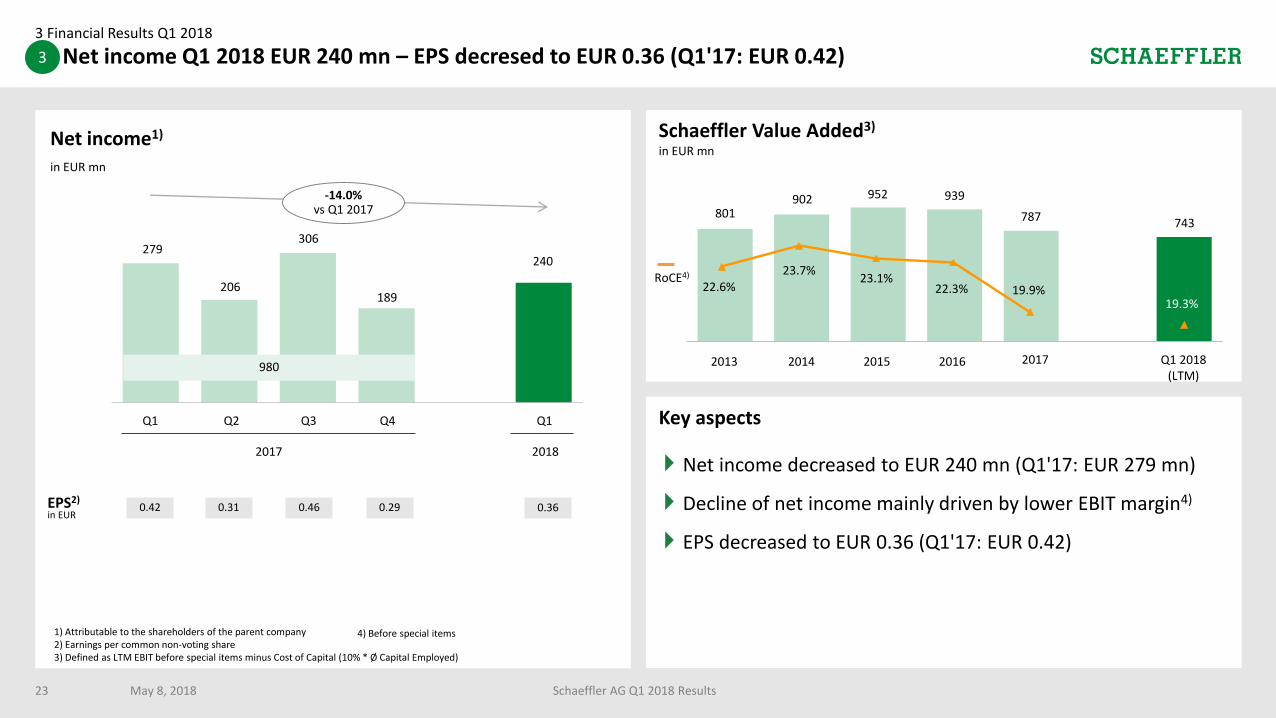
Net income Q1 2018 EUR 240 mn – EPS decresed to EUR 0.36 (Q1'17: EUR 0.42)
May 8, 2018 Schaeffler AG Q1 2018 Results23
980
Q1 Q4Q3Q2 Q1
2017 2018
306279
206
240
189
-14.0%vs Q1 2017
0.42 0.31 0.46 0.29 0.36EPS2)
in EUR
Schaeffler Value Added3)
in EUR mn
RoCE4)
22.6%23.1%
22.3%
2.7
Q1 2018(LTM)
801902 952 939
743
2013 2014 2015 2016
Key aspects
Net income decreased to EUR 240 mn (Q1'17: EUR 279 mn)
Decline of net income mainly driven by lower EBIT margin4)
EPS decreased to EUR 0.36 (Q1'17: EUR 0.42)
2017
23.7%
19.9%
787
3
1) Attributable to the shareholders of the parent company2) Earnings per common non-voting share3) Defined as LTM EBIT before special items minus Cost of Capital (10% * Ø Capital Employed)
4) Before special items
19.3%

Capex2)
in EUR mn
8.6%
Working capital 1)
in EUR mn
3 Financial Results Q1 2018
Working Capital ratio 18.6% of sales – Capex ratio 8.6% of sales
2,820
2,342
2,7332,756
20.8% 20.2% 19.7% 16.7%2)In % of sales (LTM) 18.6%2)
1) According to balance sheet; figures as per the end of period2) At March 31, 2018, trade receivables with a carrying amount of EUR 156 mn (December 31, 2018: EUR 123 mn) net of retained default risks had been sold under the ABCP program
2,575
Q1 Q4Q3Q2 Q1
2017 2018
May 8, 2018 Schaeffler AG Q1 2018 Results24
1.2
2017
Q1 Q4Q3Q2 Q1
2018
1.1
8.4% 8.5%
9.1%
8.1% 11.3%In % of sales
299 295279
400
4
2) Cash view
306
16.7%2)

Net financial debt and Gearing ratioin EUR mn
3 Financial Results Q1 2018
Net debt increased slightly due to negative FCF – Gearing ratio at 89%
25
Net debt increased slightly to EUR 2,439 mn (FY'17: EUR
2,370 mn) due to seasonally negative FCF
Gearing ratio further improved to 89%
Ratings remained unchanged in Q1'18 compared to Dec'17
Cash & cash equivalents
Gross debt
Gearing ratio1)
1) Gearing ratio: Ratio of net financial debt to equity incl. non-controlling interests in %2) Leverage Ratio: Net financial debt to LTM EBITDA ratio before special items
2,742
947
3,689
114%
2,956
2017
Q1 Q4Q3Q2
2018
Q1
399
3,355
136%
2,620
719
3,339
109%
5
Key aspects
672
3,111
89%
2,370
5,778
4,889
2,6362,370
2014
5,447
2013 2015 2016 2017
Net debt developmentin EUR mn
Leverage Ratio2)
2.6 2.62.1
1.1 1.1
2,439
698
3,068
93%
May 8, 2018 Schaeffler AG Q1 2018 Results
Q1 2018
1.0
2,439

4 Outlook
Outlook - FY 2018 guidance confirmed at group and divisional level
May 8, 2018 Schaeffler AG Q1 2018 Results26
Automotive OEM: Growth of global passenger car production of around 2%
Automotive Aftermarket: Stable growth in the global vehicle population and a nearly unchanged average vehicle age
Industrial: Similar growth rate of industrial production in 2018 compared to 2017
Market assumptions
EBIT margin 9.5-10.5% before special items
Sales growth
Free Cash Flow1)
16.5-17.5%before special items
3-4%FX-adjusted
6-7%FX-adjusted
9-10% before special items
3-4%FX-adjusted
Group Automotive OEM Automotive AM
~ EUR 450 mn
5-6%FX-adjusted
Industrial
+
Group Guidance Divisional Guidance
10.5-11.5% before special items
1) Before cash in- and outflows for M&A activities
4 Outlook
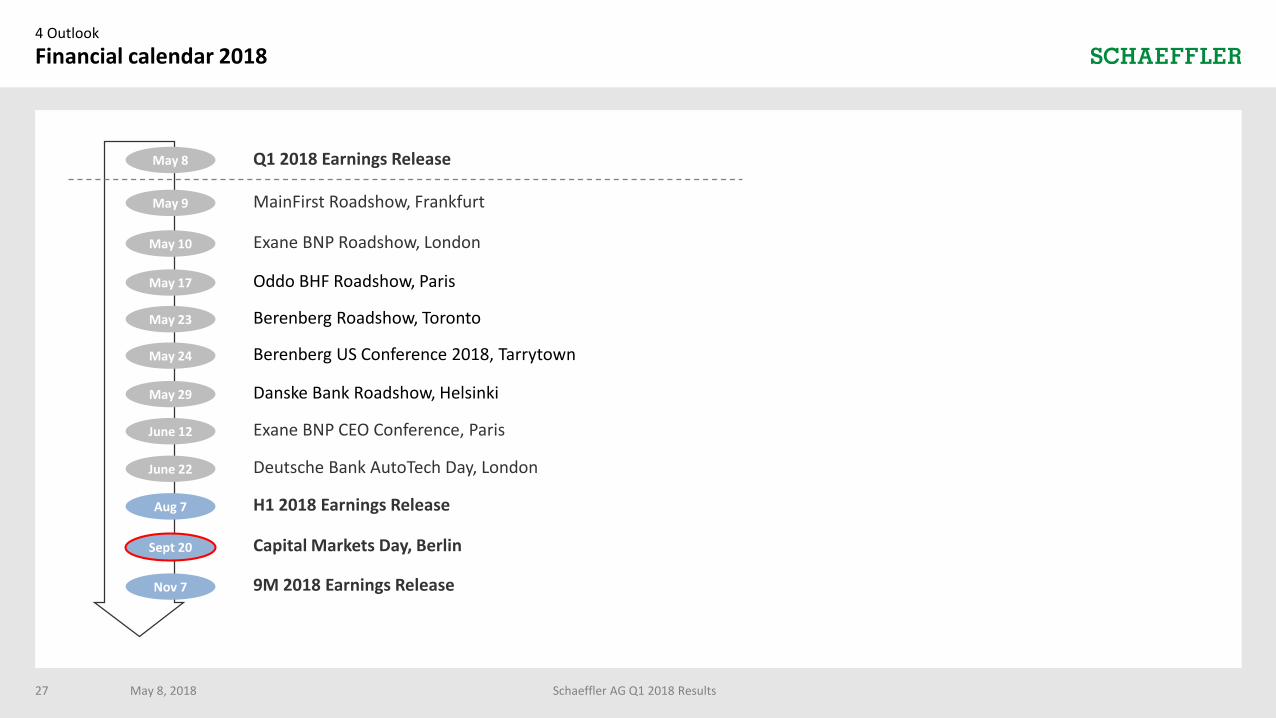
Financial calendar 2018
May 8, 2018 Schaeffler AG Q1 2018 Results27
Sept 20
May 8
Aug 7
Nov 7
Q1 2018 Earnings Release
H1 2018 Earnings Release
Capital Markets Day, Berlin
9M 2018 Earnings Release
June 12 Exane BNP CEO Conference, Paris
June 22 Deutsche Bank AutoTech Day, London
May 9 MainFirst Roadshow, Frankfurt
May 10 Exane BNP Roadshow, London
May 17
May 24 Berenberg US Conference 2018, Tarrytown
Oddo BHF Roadshow, Paris
May 23 Berenberg Roadshow, Toronto
May 29 Danske Bank Roadshow, Helsinki

28
IR Contact
May 8, 2018 Schaeffler AG Q1 2018 Results
Investor Relations
Phone: + 49 9132 82 4440
Email: [email protected]
Web: www.schaeffler.com/ir

Backup
Key figures1) by division – new structure
Schaeffler AG Q1 2018 Results29
1) Proforma figures2) FX-adjusted
Q1 '17 Q2 '17 Q3 '17 Q4 '17 Q1 '18
Sales 2,308 2,220 2,138 2,325 2,279
Sales Growth2) +6.4% +3.5% +7.4% +8.7% +3.2%
EBIT 275 221 229 226 217
EBIT Adjusted3) 275 208 229 261 217
EBIT Margin Adj. 11.9% 9.4% 10.7% 11.2% 9.5%
Q1 '17 Q2 '17 Q3 '17 Q4 '17 Q1 '18
Sales 484 444 506 446 446
Sales Growth2) +9.7% -7.3% +4.7% +6.3% -4.4%
EBIT 93 68 117 55 80
EBIT Adjusted3) 93 68 117 80 80
EBIT Margin Adj. 19.2% 15.3% 23.1% 17.9% 17.9%
Q1 '17 Q2 '17 Q3 '17 Q4 '17 Q1 '18
Sales 782 808 790 770 826
Sales Growth2) +0.2% +4.5% +9.2% +9.0% +10.8%
EBIT 67 69 70 38 94
EBIT Adjusted3) 67 69 70 47 94
EBIT Margin Adj. 8.6% 8.5% 8.9% 6.1% 11.4%
Automotive Aftermarket
Automotive OEM Industrial
3) EBIT before special items
in EUR mn
in EUR mn
in EUR mn
May 8, 2018
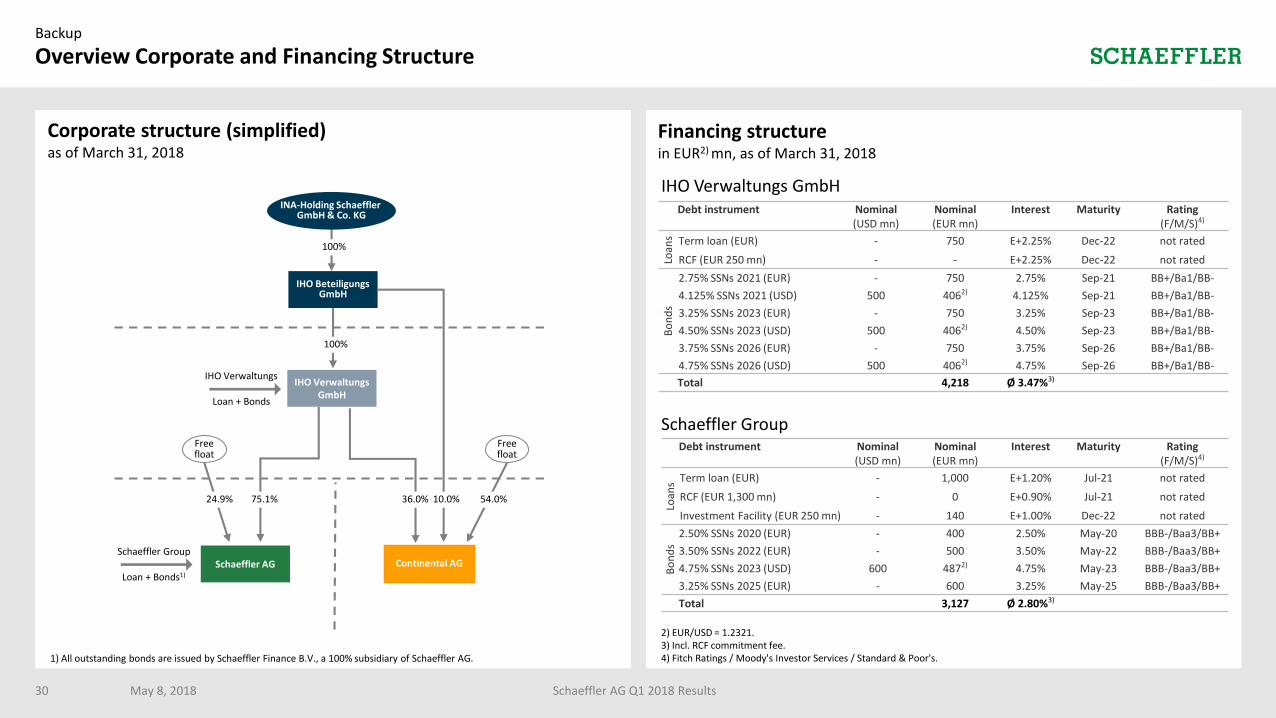
Overview Corporate and Financing StructureBackup
30
Financing structurein EUR2) mn, as of March 31, 2018
Debt instrument Nominal(USD mn)
Nominal(EUR mn)
Interest Maturity Rating(F/M/S)4)
Loan
s Term loan (EUR) - 1,000 E+1.20% Jul-21 not rated
RCF (EUR 1,300 mn) - 0 E+0.90% Jul-21 not rated
Investment Facility (EUR 250 mn) - 140 E+1.00% Dec-22 not rated
Bo
nd
s
2.50% SSNs 2020 (EUR) - 400 2.50% May-20 BBB-/Baa3/BB+
3.50% SSNs 2022 (EUR) - 500 3.50% May-22 BBB-/Baa3/BB+
4.75% SSNs 2023 (USD) 600 4872) 4.75% May-23 BBB-/Baa3/BB+
3.25% SSNs 2025 (EUR) - 600 3.25% May-25 BBB-/Baa3/BB+
Total 3,127 Ø 2.80%3)
IHO Verwaltungs GmbH
Schaeffler Group
2) EUR/USD = 1.2321.3) Incl. RCF commitment fee. 4) Fitch Ratings / Moody's Investor Services / Standard & Poor's.
Debt instrument Nominal(USD mn)
Nominal(EUR mn)
Interest Maturity Rating(F/M/S)4)
Loan
s Term loan (EUR) - 750 E+2.25% Dec-22 not rated
RCF (EUR 250 mn) - - E+2.25% Dec-22 not rated
Bo
nd
s
2.75% SSNs 2021 (EUR) - 750 2.75% Sep-21 BB+/Ba1/BB-
4.125% SSNs 2021 (USD) 500 4062) 4.125% Sep-21 BB+/Ba1/BB-
3.25% SSNs 2023 (EUR) - 750 3.25% Sep-23 BB+/Ba1/BB-
4.50% SSNs 2023 (USD) 500 4062) 4.50% Sep-23 BB+/Ba1/BB-
3.75% SSNs 2026 (EUR) - 750 3.75% Sep-26 BB+/Ba1/BB-
4.75% SSNs 2026 (USD) 500 4062) 4.75% Sep-26 BB+/Ba1/BB-
Total 4,218 Ø 3.47%3)
Corporate structure (simplified)as of March 31, 2018
IHO BeteiligungsGmbH
Continental AGSchaeffler AG
Freefloat
10.0%
IHO Verwaltungs
Loan + Bonds
36.0%
INA-Holding Schaeffler GmbH & Co. KG
Freefloat
IHO VerwaltungsGmbH
Schaeffler Group
Loan + Bonds1)
1) All outstanding bonds are issued by Schaeffler Finance B.V., a 100% subsidiary of Schaeffler AG.
54.0%75.1%24.9%
100%
100%
Schaeffler AG Q1 2018 ResultsMay 8, 2018