Results Q1 2016 Schaeffler AG · results to differ materially from those described in the forward...
23
Results Q1 2016 Schaeffler AG Conference Call May 12, 2016 Herzogenaurach
Transcript of Results Q1 2016 Schaeffler AG · results to differ materially from those described in the forward...

Results Q1 2016 Schaeffler AGConference CallMay 12, 2016
Herzogenaurach

This presentation contains forward-looking statements. The words "anticipate", "assume", "believe", "estimate", "expect","intend", "may", "plan", "project“, "should" and similar expressions are used to identify forward-looking statements.Forward-looking statements are statements that are not historical facts; they include statements about Schaeffler Group'sbeliefs and expectations and the assumptions underlying them. These statements are based on plans, estimates andprojections as they are currently available to the management of Schaeffler AG. Forward-looking statements thereforespeak only as of the date they are made, and Schaeffler Group undertakes no obligation to update any of them in light ofnew information or future events.By their very nature, forward-looking statements involve risks and uncertainties. These statements are based on SchaefflerAG management's current expectations and are subject to a number of factors and uncertainties that could cause actualresults to differ materially from those described in the forward-looking statements. Actual results may differ from those setforth in the forward-looking statements as a result of various factors (including, but not limited to, future global economicconditions, changed market conditions affecting the automotive industry, intense competition in the markets in which weoperate and costs of compliance with applicable laws, regulations and standards, diverse political, legal, economic and otherconditions affecting our markets, and other factors beyond our control).This presentation is intended to provide a general overview of Schaeffler Group’s business and does not purport to dealwith all aspects and details regarding Schaeffler Group. Accordingly, neither Schaeffler Group nor any of its directors,officers, employees or advisers nor any other person makes any representationor warranty, express or implied, as to, and accordingly no reliance should be placed on, the accuracy or completeness of theinformation contained in the presentation or of the views given or implied. Neither Schaeffler Group nor any of its directors,officers, employees or advisors nor any other person shall have any liability whatsoever for any errors or omissions or anyloss howsoever arising, directly or indirectly, from any use of this information or its contents or otherwise arising inconnection therewith.The material contained in this presentation reflects current legislation and the business and financial affairs of SchaefflerGroup which are subject to change.
Disclaimer
May 12, 20162 Schaeffler AG Results Q1 2016 Presentation

Agenda
Overview
Operational Highlights
Financial Results
Outlook
123
May 12, 20163 Schaeffler AG Results Q1 2016 Presentation
4

Schaeffler Group – Good start into the year1 Overview
May 12, 20164 Schaeffler AG Results Q1 2016 Presentation
Group sales +0.1% (FX adjusted +2.4%) –Profitability in line with target range; EBIT margin at 12.6%
Continued outperformance in Automotive division –Sales +2.4% (FX-adjusted +5.0%); EBIT margin at 14.4%
Industrial division operates in challenging environment –Sales -6.9% (FX-adjusted -5.5%); EBIT margin at 6.4%
Schaeffler Value Added1) increased to EUR 906 mn(Q1 2015: EUR 896 mn) – RoCE stable at 22.1%1)
Placement of remaining non-voting shares successfully executed;Upgrade of Standard & Poor's rating from BB- to BB
xxx
Operating cash flow increased to EUR 206 mn (Q1 2015: EUR184 mn) – Free Cash Flow with EUR -112 mn seasonally negative
1) Before one-off effects; Last twelve months

May 12, 2016
Q1 2016 Automotive sales up 2.4% (+5.0% FX adjusted);continued outperformance of global production (+0.9%)
6.3% increase in EBIT1) mainly based on high FX adjusted salesgrowth and positive product mix
Main sales growth drivers were torque converters, dual massflywheels and the aftermarket business as well as strongbusiness in Greater China and Asia/Pacific
German Innovation Award 2016 for anti-roll stabilizer;Green Tec Award 2016 for E-Clutch
2,576
Q1 2015
2,515
+5.0%1)
Q1 2016
Automotive Division – FX-adjusted sales +5.0%2 Operational Highlights
Automotive sales and EBIT margin Key aspects Automotive
372
Q1 2015
3502)
+22
Q1 2016EBITmargin 13.9%2) 14.4%
5 Schaeffler AG Results Q1 2016 Presentation
Sales
EBIT
1) FX-adjusted 2) Before one-off effects

Automotive Division – Continued market outperformance2 Operational Highlights
May 12, 20166 Schaeffler AG Results Q1 2016 Presentation
Sales and market development Automotive
+1%+2%
Europe Americas Asia/PacificGreater China
+2%0%
+19%
-4%
+17%
+4%
Production of light vehicles Q1 2016 vs Q1 2015 (IHS)Sales growth (w/o FX effects) Schaeffler Automotive Q1 2016 vs Q1 2015
World production: +0.9%Schaeffler Automotive: +5.0%
(w/o FX effects)
Q1 2015 Q1 2016D
(w/o FX effects)
660 653 -1.1%(+0.3%)
1,065 1,106 +3.8%(+6.2%)
377 385 +2.1%(+4.8%)
413 432 +4.6%(+9.8%)
2,515 2,576 +2.4%(+5.0%)
Engine Systems
Transmission Systems
Total
Chassis Systems
AutomotiveAftermarket
Sales business divisionsin EUR mn
Key aspects
4 Automotive Division (+5.0% FX adjusted) continuesto outperform global light vehicle production(+0.9%)
4 Outperformance mainly driven by positivedevelopment in Greater China and Asia/Pacific aswell as Automotive Aftermarket business
4 Greater China – High demand for dry doubleclutches and ramp-up of wet double clutches;increased business with local OEMs
4 Asia/Pacific – Change in allocation of a Japanesecustomer from Europe to Asia/Pacific; High demandfor wheel bearings
4 Automotive Aftermarket – FX-adjusted sales growthof 9.8% mainly due to increased OES business inthe US

2 Operational Highlights
May 12, 2016
824
Q1 2016Q1 2015
767
-5.5%1)
Industrial sales and EBIT margin Key aspects Industrial
Q1 2016 Industrial down 6.9% (-5.5% FX adjusted) due toongoing weakness in all regions and most sector clusters
Significant decrease of EBIT margin to 6.4% (Q1 2015: 11.0%)due to lower volume and weak business mix
CORE program in implementation;Completion ratio at 15% (end of March 2016)
Schaeffler presents 'Drive Train 4.0' concept vehicle forindustrial drives at the Hanover Fair
Industrial Division – FX adjusted sales -5.5%
91
49
Q1 2016
-42
Q1 2015EBITmarginin %
11.0% 6.4%
7 Schaeffler AG Results Q1 2016 Presentation
Sales
EBIT
1) FX-adjusted

Industrial Division – Challenging market environment2 Operational Highlights
May 12, 20168 Schaeffler AG Results Q1 2016 Presentation
60%19%
12%
9%
Americas-11.0% (-7.4%)
Greater China-18.6% (-18.4%)
Europe-2.6% (-1.9%)
Asia/Pacific-7.7% (-3.8%)
Q1 2015 Industrial sales by regionY-o-y growth (w/o FX effects)
Industrial sales by sector clustervs. prev. year (w/o FX effects)
-15% -10% -5% +5% +10% +15%
Aerospace
Rail
Industrial Automation
Two-Wheelers
OffroadPower Transmission
RawMaterials
Wind
+20%-20%-25%
Industrial Distribution
Key aspects
4 Industrial sector clusters with mixed development
4 Industrial Distribution suffers from de-stocking,mainly in the Americas and Greater China
4 Ongoing weak market environment in all regions,especially in Greater China (all sector clustersdeclined apart from Wind)
4 CORE program update:
- Major contract for GenC ball bearings signed bywhite goods manufacturer
- Delivery performance increased (EDC Northregion from 80% to 95%; EDC South region from50% to 81%)
- Headcount reduction on track (1301) out of 500)
1) As of March 31, 2016

Schaeffler AG Results Q1 2016 PresentationMay 12, 20169
Free Cash Flow seasonally negative – Schaeffler Value Added positive2 Operational Highlights
1) Before one-off effects; Last twelve months
Q1 2015 Q1 2016
EBITDA 604 598
Interest paid (75) (35)
Interest received 2 3
Income taxes paid (85) (99)
Working capital change (246) (250)
Others (16) (11)
CF from Operations 184 206
Capex (244) (318)
in % of Sales 7.3% 9.5%
Others 0 0
CF from Investments (244) (318)
Free Cash Flow (60) (112)
Free Cash flowin EUR mn
Cash & cash equivalents 609 693
4 Solid cash flow generation; cash flow fromoperations improved to EUR 206 mn thanks tolower interest paid
4 Free Cash Flow seasonally negative at EUR -112 mndue to higher capex (capex ratio 9.5%)
4 Schaeffler Value Added1) increased to EUR 906 mn
Key aspects
Schaeffler Value Added1)
in EUR mn
RoCE1)
22.8%22.2% 21.9% 22.5%
2.7
22.1%
Q1 Q4Q3Q2 Q1
2015 2016
896 931870878 906

Schaeffler AG Results Q1 2016 PresentationMay 12, 201610
Debt reduction on track – Leverage ratio at 2.1x2 Operational Highlights
Schaeffler VerwaltungsGmbH
Schaeffler AG
100%
Continental AG
~75.1% ofsharecapital
36% 10%
Freefloat
54%
Freefloat
~24.9% ofshare
capital2)
Corporate structureSimplified view
Family Shareholders
Schaeffler VerwaltungZwei GmbH
4 HoldCo debt reduction by approximately EUR 1.3 bnfollowing the placement of remaining non-votingshares
4 Net debt3) Schaeffler AG (end of Q1 2016) stable atEUR 4.9 bn; leverage ratio at 2.1x4) (Q4 2015: 2.1x);target <1.5x by 2018
4 Upgrade of Standard & Poor's rating from BB- to BB
Key elements
3) Net debt does not include Loan Note Receivables of EUR 1,773m (secured by share pledges overc23 mn Continental AG shares) 4) Before one-off effects
2.1x
< 1.5xDeleveragingfrom FCF in
the next 3 years
Mid-termtarget
2011 Q1 2016 2018
750 mn
4.9 bn
Net financial debtin EUR
6.7 bn
2.9xFinancial debt
EUR 4.9 bn
Financial debtEUR 2.2 bn1)
-1.8 bn
2) After placement of remaining non-voting shares on April 5, 2016
1) Pro-forma nominal debt after redemption of HoldCo bonds envisaged for May 13, 2016
2.1x
2015
4.9 bn

3 Financial Results
Overview key financials Q1 2016
3) Prior year figure as per December 31, 2015 4) Net financial debt to LTM EBITDA ratio
in EUR mn Q1 2015 Q1 2016 Q1 2016vs. Q1 2015
Sales 3,339 3,343+0.1%
+2.4%1)
EBIT434
4412)
4214212)
-3.0%-4.5%
EBIT margin13.0
13.22)
12.612.62)
-0.4%-pts.-0.6%-pts.
Net income 167 253 +86 mn
Capex 244 318 +74 mn
Capex ratio 7.3 9.5 +2.2%-pts.
Free cash flow -60 -112 -52 mn
Net debt3) 4,889 4,909 +0.4%
Leverage ratio2) 3) 4) 2.1 2.1
Schaeffler Value Added (LTM)2) 896 906 +1.1%
ROCE2) 22.8 22.1 -0.7%-pts.
EPS 0.42 0.38 -9.5%
May 12, 201611 Schaeffler AG Results Q1 2016 Presentation
1) FX-adjusted 2) Before one-off effects
Schaeffler AG Results Q1 2016 PresentationMay 12, 201612
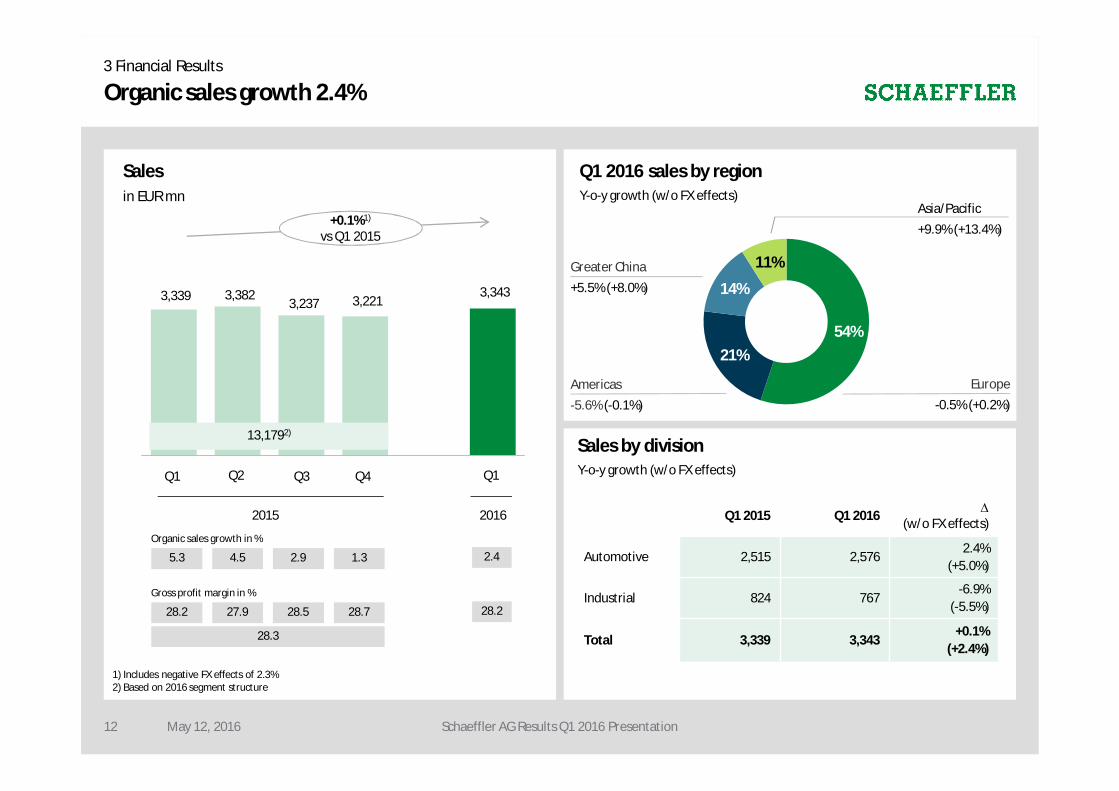
Organic sales growth 2.4%3 Financial Results
Q1
3,339
Q4
3,221
Q3
3,237
Q2
3,382
Q1
3,343
2015 2016
Gross profit margin in %
1) Includes negative FX effects of 2.3%2) Based on 2016 segment structure
Salesin EUR mn
54%21%
14%
11%
Americas-5.6% (-0.1%)
Greater China+5.5% (+8.0%)
Europe-0.5% (+0.2%)
Asia/Pacific+9.9% (+13.4%)
Q1 2016 sales by regionY-o-y growth (w/o FX effects)
Sales by divisionY-o-y growth (w/o FX effects)
Q1 2015 Q1 2016 D(w/o FX effects)
Automotive 2,515 2,5762.4%
(+5.0%)
Industrial 824 767-6.9%
(-5.5%)
Total 3,339 3,343+0.1%
(+2.4%)
28.2 27.9 28.5 28.7
28.3
13,1792)
+0.1%1)
vs Q1 2015
28.2
Organic sales growth in %
5.3 4.5 2.9 1.3 2.4

EBIT margin at 12.6%3 Financial Results
May 12, 201613 Schaeffler AG Results Q1 2016 Presentation
EBITin EUR mn
Q1
434
Q4
151
Q3
433
Q2
384
Q1
421
1,402
2015 2016
Q1 2015 Q1 2016 D
350 372 6.3%
13.9% 14.4% 0.5%-pts.
91 49 -46.2%
11.0% 6.4% -4.6%-pts.
441 421 -4.5%
13.2% 12.6% -0.6%-pts.
EBIT1) by divisionin EUR mn
Automotive
Industrial
Total
Margin
Margin
Margin
1) Before one-off effects
Key aspects
4 EBIT margin at 12.6%; in line with target range
4 Automotive business remains highly profitable;EBIT margin at 14.4%
4 Industrial margin negatively impacted by weakvolumes/mix and FX effects
GrossProfit
EBITQ1 2016
R&Dcost
EBITQ1 2015
∆ EBIT Industrial divisionin EUR mn
Sellingcost
Admin cost/Other
91
49
-38 -1 0 -3
13.2% 11.4% 13.4% 13.0% 12.6%EBITmarginbeforeone-offeffects

Schaeffler AG Results Q1 2016 PresentationMay 12, 201614
Net income 253 million EUR driven by lower interest expenses3 Financial Results
1) Attributable to the shareholders of the parent company
Q1
167
Q4
70
Q3
212
Q2
142
Q1
253
2015 2016
Net Income1)
in EUR mn
591
EUR 86 mnvs Q1 2015
Reconciliation of net incomein EUR mn
Net incomeQ1 2015
Δ MinoritiesΔ FinancialResult
Δ TaxesΔ EBIT
Key aspects
4 Financial result improved significantly byEUR 111 mn to EUR -65 mn due to lower interestexpenses and one-off effect in previous year
4 Net income at EUR 253 mn (Q1 2016: EUR 167 mn)
4 EPS 2015 at 0.38 Euro
167
Net incomeQ1 2016
-13
+111
-11 -1
253

Schaeffler AG Results Q1 2016 PresentationMay 12, 201615
Free cash flow -112 million EUR driven by increase in Capex3 Financial Results
Free cash flow Q1 2016in EUR mn
-250
-318
-99 -11 -112
-32
598
Free cashflow
OtherCapexΔWorkingCapital
EBITDA TaxInterest
FCFQ1 2016
OtherTaxesInterestpayments
CapexΔ NetWorkingCapital
EBITDAFCFQ1 2015
∆ FCF Q1 2016 vs. Q1 2015in EUR mn
-60 -6 -4
-74
41
-14
5
-112
Key aspects
4 Interest payments decreased by EUR 41 mn;Operating Cash Flow improved to EUR 206 mn
4 Capex increased by EUR 74 mn to EUR 318 mn
4 Free Cash Flow negative due to seasonal workingcapital built-up

3 Financial Results
Working capital ratio lower vs prior year – Capex ratio temporarily high
In % of sales
1) Cash view
Capex1)
in EUR mnWorking capitalin EUR mn
May 12, 201616 Schaeffler AG Results Q1 2016 Presentation
Q1
3,022
Q4
2,662
Q3
2,880
Q2
2,944
Q1
2,956
2015 2016
Q1
244
Q4
282
Q3
242
Q2
257
Q1
318
2015 2016
1,025
24.2 22.9 22.1 20.2 22.4 7.3 7.6 7.5 8.8
7.8
9.5
In % of sales

Leverage ratio stable at 2.1x3 Financial Results
Gross debt
Net financial debtin EUR mn
6,799 6,665 6,674 5,688
Cash & cash equivalents
609 420 724 799
Leverage ratio(Net financial debt / LTM EBITDA before special one-off effects)
5,602
693
May 12, 201617 Schaeffler AG Results Q1 2016 Presentation
4,9094,889
5,9506,2456,190
2.7 2.7 2.62.1
2.7
2.1
Q1 Q4Q3Q2 Q1
2015 2016
Change in net financial debtin EUR mn
4,889
-103
112 11 4,909
Q1 2016OtherFCFFX effectQ4 2015
31/12/2015 31/03/2016
Bonds 5,048 4,963
Credit Facilities Agreement 632 616
Other financial debt 8 23
Financial debt 5,688 5,602
Cash 799 693
Net financial debt 4,889 4,909
Net financial debt calculationin EUR mn

Guidance 2016 confirmed4 Outlook
Midterm targets
May 12, 201618 Schaeffler AG Results Q1 2016 Presentation
Guidance 2016
EBIT margin 12-13% of salesbefore one-off effects
Sales growth 3-5%FX-adjusted
Free Cash Flow ~ EUR 600 mn
Market assumptions
4 Automotive: Global Light Vehicle productiongrowth of around 2%
4 Industrial: Low single-digit growth in globalIndustrial production
Dividend Payout Ratio25-35%1)
Profitable Growth
Investment GradeRating
+
+
1) Of net income

Financial calendar 20164 Outlook
May 12, 201619 Schaeffler AG Results Q1 2016 Presentation
Results Q1 2016May 12, 2016
Capital Markets Day, LondonJuly 20, 2016
JP Morgan Annual Autos Conference, LondonJune 7, 2016
UniCredit Automotive Credit Conference, LondonJune 8, 2016
Deutsche Bank European Leveraged Finance Conference, LondonJune 9, 2016
dbAccess German, Swiss, Austrian Conference, BerlinJune 10, 2016
Results H1 2016Aug. 11, 2016

Investor Relations
phone: + 49 9132 82 4440
fax: + 49 9132 82 4444
Email: [email protected]
Web: www.schaeffler.com/ir
IR contact
May 12, 2016
Christoph Beumelburg +49 (0)9132 82 5414
Niels Fehre +49 (0)9132 82 85805
Susanne Sievers +49 (0)9132 82 4408
20 Schaeffler AG Results Q1 2016 Presentation

Backup
Sales per division
21
2,576
Q1Q4Q1 Q3
2,554 2,466
Q2
2,4422,515
Sales Automotivein EUR mn
Sales Industrialin EUR mn
2015
9,977
May 12, 2016 Schaeffler AG Results Q1 2016 Presentation
2016
767
Q1Q4Q1 Q3
828 755
Q2
795824
2015
3,202
2016
Growth rate (w/o FX effects)
+6.7% +7.1% +5.7% +3.8% +5.0%
Growth rate (w/o FX effects)
+1.3% -2.8% -4.8% -6.0% -5.5%

Backup
EBIT per division
22
EBIT Automotivein EUR mn
EBIT Industrialin EUR mn
EBIT1) margin in % EBIT1) margin in %
May 12, 2016 Schaeffler AG Results Q1 2016 Presentation
1) Before one-off effects
372
Q1Q4Q1 Q3
308
128
Q2
356343
2015
1,135
13.9 12.1 14.6 14.6
2016
14.4
49
Q1Q4Q1 Q3
7623
Q2
7791
2015
267
11.0 9.2 9.7 7.8
2016
6.4

Backup
Corporate and financing structure
Corporate structure (simplified)as of May 12, 2016
Financing structure (post redemption)in EUR mn
54.0%24.9%
Debt instrument Nominal(USD mn)
Nominal(EUR mn) Interest Maturity Rating
Scha
effle
rHol
ding
(Hol
dCo)
HoldCo Term Loan (EUR) - 600 E+3.75% Oct-20 Not ratedHoldCo RCF (EUR 200 mn) - - E+3.75% Oct-20 Not ratedTotal HoldCo Loans 600
6.875% SSNs 2018 (EUR)2) - 300 6.875% Aug-18 Ba3 / B+6.875% SSNs 2018 (USD)2) 400 3513) 6.875% Aug-18 Ba3 / B+6.25% SSNs 2019 (USD)2) 475 4173) 6.25% Nov-19 Ba3 / B+5.75% SSNs 2021 (EUR)2) - 210 5.75% Nov-21 Ba3 / B+6.75% SSNs 2022 (USD)2) 405 3563) 6.75% Nov-22 Ba3 / B+Total HoldCo Bonds 1,634Total HoldCo 2,234
Debt instrument Nominal(USD mn)
Nominal(EUR mn) Interest Maturity Rating
Scha
effle
rGro
up(O
pCo)
OpCo Term Loan B (EUR) - 250 E4)+3.50% May-20 Ba2 /BBOpCo Term Loan B (USD) 440 3863) L4)+3.50% May-20 Ba2 /BBOpCo RCF (EUR 1,000 mn) - - E+2.6875% Oct-19 Not ratedTotal OpCo Loans 6364.25% SSNs 2018 (EUR) - 600 4.25% May-18 Ba2 / BB2.75% SSNs 2019 (EUR) - 500 2.75% May-19 Ba2 / BB3.25% Unsec.Ns 2019 (EUR) - 500 3.25% May-19 B1 / B+2.50% SSNs 2020 (EUR) - 400 2.50% May-20 Ba2 / BB4.75% SSNs 2021 (USD) 850 7473) 4.75% May-21 Ba2 / BB4.25% SSNs 2021 (USD) 700 6153) 4.25% May-21 Ba2 / BB3.50% SSNs 2022 (EUR) - 500 3.50% May-22 Ba2 / BB4.75% SSNs 2023 (USD) 600 5273) 4.75% May-23 Ba2 / BB
3.25% SSNs 2025 (EUR) - 600 3.25% May-25 Ba2 / BBTotal OpCo Bonds 4,989Total OpCo 5,625
SchaefflerHolding
Finance B.V.
100%
SchaefflerVerwaltung Zwei
GmbH
SchaefflerVerwaltungs
GmbH
100%
Continental AGSchaeffler AGOpCo
Loans
SchaefflerFinance B.V.
OpCo
Bonds
Freefloat
10.0%75.1%
TopCo
HoldCo
OpCo
HoldCo
Bonds
HoldCo
Loans
36.0%
SchaefflerTechnologies
AG & Co. KG
100%
INA-Holding SchaefflerGmbH & Co. KG
Loan notereceivable1)
Freefloat
1) Loan note receivable of EUR 1,773mn 2) PIK Toggle Notes 3) EUR / USD = 1.13854) Floor of 0.75%
-500
-6000
-140-270
Nominalamount to be redeemed
23 May 12, 2016 Schaeffler AG Results Q1 2016 Presentation