The ILRI-ICRAF Research Methods Group: Supporting livestock research


Results of Livestock Research
2014
© EIAR, September 2015 ›=ÓU›=' 2008 Website: http://www.eiar.gov.et Tel: +251-11-6462633 Fax: +251-11-6461294 P.O.Box: 2003 Addis Ababa, Ethiopia
Proceedings of the Annual National Review Workshop on Results of Livestock Research, 4 - 6 June 2014 EIAR, Addis Ababa
ISBN: 978-99944-66-38-2 Copy editing and design: Abebe Kirub

i
Table of Contents
Preface ..................................................................................................................
1
Tagasaste (Chamaecytisus palmensis) as a Substitute for Concentrate in the Diets of Sheep Fed on Natural Pasture Hay Basal Feed Dereje Kebede, Mengistu Urge, Getnet Assefa and Getu Kitaw ........................................
3
Optimum Dietary Crude Protein Level for Fattening Yearlings of Arsi-Bale Lambs Getahun Kebede ......................................................................................................... .
13
Effects of Sole Diet Feeding of Maize Silage to Dairy Cows on Feed Intake, Milk Yield, Milk Composition and Body Weight Getenesh Teshome, Ashenafi M., Adey M. and Kassahun M.........................................
23
Milk Productivity of Boran-Friesian High Grade Crossbred Cows Supplemented with Oilseed Cakes Tadesse Bekele, Rehrahe Mesfin and Kefena Effa ..........................................................
31
Biological Performance and Economic Benefits of Different Diets in Fattening Arsi-Bale Lambs Getahun Kebede ..........................................................................................................
39
Rearing High Grade Breeding Dairy Bulls with Protein Supplements Tadesse Bekele ...........................................................................................................
51
Feeding Cows Maize Silage as a Sole Diet for Sensory Quality of Yoghurt and Cheese Getenesh Teshome, Ashenafi M., Adey M. and Kassahun M. ...........................................
59
Restoring Techniques for Degraded Rangelands in Semi-Arid Conditions Bedasa Eba, Bikila N., Samuel T., Jaldessa D., Abule E., Asfawu I., and Wandimu T..........
65

ii
Effect of Garden Cress (Lepidium sativum) Seed and Its Extract on Eimeria tenella Infection in Broiler Chickens Meskerem Adamu and Chaiwat Boonkaewwan ...............................................................
75
The Performance of Dual Purpose Chicken (Potchefstroom Koekoek) under Farmers Management Misba Alewi, Alemayehu G., Alemayehu A., Dawud I. and Tadios H. .................................
89
Protective Effects of Moringa stenopetala Leaf Supplemented Diets on Eimeria tenella Infected Broiler Chickens Meskerem Adamu and Chaiwat Boonkaewwan ................................................................
95
Fish Marketing Opportunities and Challenges around Gilgel Gibe Reservoir Abebe Cheffo, Hiwot Teshome and Genanaw Tesfaye ....................................................
107
Biological and Physico-Chemical Limnology of Gilgel Gibe Reservoir Kibru Teshome, Abelneh Yimer, Esayas Alemayehu ........................................................
117
The Biology of Oreochromis niloticus and Labeobarbus intermedius in Gilgel Gibe Reservoir Esayas Alemayehu, Zenebe T., Fekadu T., and Genanaw T. ...........................................
129
Performance of Four Nile Tilapia, Oreochromis niloticus Strains under Highland Pond Culture Zelalem Lema and Getinet Gebrtsadik ...........................................................................
145
Fish Post-harvest Losses and Intervention Measures in Gilgel Gibe Reservoir Yared Tigabu, FekaduTefera and Esayas Alemayehu ......................................................
153
Physico - Chemical and Biological Features of Fish Ponds at Sebeta Adamneh Dagne, Abelneh Yimer and Tarekegn Aragie ...................................................
161

iii
Dearth Period Feeding of Honeybees (Apis mellifera) to Boost Honey Production Tolera Kumsa ...............................................................................................................
179
Performance of Mulberry Silkworm Strains (Bombyx mori L.) in Different Areas of Ethiopia Kedir Shifa, Abiy T. Metasebia T., Ahmed I. Kassa B., Samuel M. and Eshetu Y..................
187
Evaluation of Different Montage Types and Sizes on Cocoon Yield and Silk Quality of Castor and Mulberry Feeding Silkworms Ahmed Ibrahim, Kedir Shifa, Abiy Tilahun and, Metasebia Terefe ......................................
197
Bed Cleaning Frequency During Larval Developmental Period of Silkworms Abiy Tilahun, Kedir Shifa, Ahmed Ibrahim and Metasebia Terefe ......................................
207
The Performance of Eri Silkworm Strains (Samia cynthia ricini B.) in Different Sites Kedir Shifa, Metasebia T., Ahmed I., Abiy T., Samuel M., Kassa B. and Afework B. ..........
223
Performance of Castor (Ricinus communis) Genotypes and their Effects on Eri-Silkworms (Samia cynthia) Metasebia T., Abiy T., Kedir S., Ahmed I., Kassa B., Samuel M., Afework B. and Eshetu Y...............................................................................................
233
Agronomic Practices for Yield and Yield Components of Castor (Ricinus communis) Metasebia Terefe, Ahmed Ibrahim, Abiy Tilahun and Kedir Shifa .......................................
241
Feed Consumption and Feeding Frequencies of Eri and Mulberry Silkworms Ahmed Ibrahim, Abiy Tilahun, Metasebia Terefe and Kedir Shifa .......................................
249

1
Preface Transforming the livestock sector to a competitive and modern production level helps to intensify livestock export market which in turn increases hard currency earnings of Ethiopia. Furthermore, such kind of transformation can help to reach a wider base of the pastoral and farming communities to contribute towards the efforts of poverty eradication being run by the government of Ethiopia. The government has given due emphasis to livestock and fisheries development by considering it as one of the key drivers in the second Growth and Transformation Plan period of the country which is taking place between 2015/16 and 2019/2020. To this effect the provision of appropriate and improved technologies, continuously and in sufficient quantity, required for transforming the livestock and fishery production of this country is highly decisive. In view of this, the exercise of reviewing completed research activities of the sub-sector on annual basis and extracting valuable results to compile them for use in the extension service has now become a regular procedure. This proceeding contains outputs of the 3rd National Livestock workshop held to review completed research activities related to livestock and fisheries. The contents of the proceedings are believed to contribute to required set of recommendations for developing/updating livestock and fishery technological packages to be used in the forthcoming transformation process of the sub-sector. Adugna Wakjira (PhD) Deputy Director General, EIAR

3
Tagasaste (Chamaecytisus palmensis) as a Substitute for Concentrate in the Diets of
Sheep Fed on Natural Pasture Hay Basal Feed
Dereje Kebede1, Mengistu Urge2, Getnet Assefa3 and Getu Kitaw3
1Gode Polythecnic College, P.O. Box 105.Gode, Ethiopia, Email: [email protected] 2Haramaya University, P.O. Box 138 Dire Dawa, Ethiopia
3Ethiopian Institute of Agricultural Research, P.O. Box 2003, Addis Ababa, Ethiopia
Introduction
Most of the dry forages and roughages found in Ethiopia have a crude protein (CP) content of less than 7%, which do not satisfy the requirements of rumen microorganisms (Van Soest, 1994). When fed alone, such feeds are unable to provide even the maintenance requirement of livestock (ILRI, 1999). Hay in central highlands of Ethiopia is usually harvested late with CP content of less than 5%, which is below the maintenance requirement of ruminants (Solomon et al., 2008a). This level of CP content reduces feed intake and affects digestibility. As a result, it is necessary to enhance the utilization of available fodder plants and other alternative feed resources (Wambugu et al., 2006) that can be grown and easily accessible by smallholder farmers in order to meet the increasing demand for animal products.
Feeding ruminants with roughage is attractive where high protein concentrate feed supplements such as noug seed cake or grain bran are available at modest price. With such supplement, intake of roughage may increase 20 to 30% (McDowell, 1988). However, the price of concentrate feeds is not affordable for most small holder farmers in recent times in Ethiopia. Hence, feed resources such as multipurpose tree foliages grown on the farm could be an alternative option.
Browse and multipurpose trees are well adapted to adverse agro-ecological conditions and are important sources of livestock feed in the tropics. Unlike most other herbaceous legumes and grasses, they stay

4
green during the dry season and are rich in crude protein, minerals, and vitamins, which are the most limiting nutrients in tropical feedstuffs (Getnet et al., 2007). Among several browse trees in the tropics, tagasaste (Chamaecytisus palmensis) is well adapted to the cool tropical highlands of Africa (Getnet, 1998). Tagasaste is a perennial browse tree, well-adapted to many regions of the world, including the tropical highlands of Ethiopia. Tagasaste is highly productive (11 t DM/ha), stays green during the dry season, and has high CP levels (160–220 g/kg DM) (Getnet, 1998). Tagasaste is of interest in Ethiopia because it can be grown in integration with food crops as well as in fence lines and roadsides and on marginal soils. The crop is easily utilized in ‘‘cut and carry’’ systems, particularly during the dry season when there is critical feed scarcity. It has also higher rates of degradation compared to other tropical browse trees such as leucenea species which normally have an advantage of increasing total DM intake for better performance of animals (Kaitho et al., 1998). Therefore, this experiment was initiated to evaluate the effect of supplementation of tagasaste forage on the performance of sheep fed on natural pasture hay with the specific objectives of determining the level at which tagasaste forage substitutes concentrate feed in the diet of sheep and to assess feed intake, digestibility, daily weight gain, and carcass characteristics and assessing the economic feasibility of replacing concentrate with tagasaste foliage. Materials and Methods Experimental feeds and animals The experiment was conducted during the wet season from August to November in the cool tropical highlands of Ethiopia at Holetta Agricultural Research Centre (09°N; 38°E). Forage from tagasaste variety ‘MOA’ was used. Tagasaste harvested for the feeding trial was in the vegetative stage and plants did not start flowering until the end of the experimental period. The forage was harvested every morning and leaves and chopped edible branches were offered to animals after harvest. Forage samples were taken every other day for DM and quality analysis. The concentrate was a mixture of wheat bran and noug (Gizotia abyssinica) seed cake in 3:1 proportions. The hay was produced from Holetta research center pasture land was made and the

5
required amount of hay for the experiment was harvested, sun dried for 4–5 days, baled and piled in a hay-shade. The experimental sheep (‘central high land local breeds`) were purchased from tagasaste growing areas. The sheep were below 12 months of age (non-permanent tooth) and had an average weight of 16.1±.84 kg with a range of 15.2 and 17 kg. The sheep were quarantined for 3 weeks and checked for major contagious diseases, drenched with antihelmintic (Albendazole, 5 mg/kg body weight), and sprayed with acaricides (Vetazinon 60%) against external parasite before the start of the trial. Feeding trial Twenty sheep were stratified according to initial body weight and allotted to five blocks of four animals each, and kept in individual pens in a well ventilated barn. The four treatments of supplemental feeds (all on DM basis) were 100% concentrate (T1), 67% concentrate +33% fresh tagasaste forage (T2), 33% concentrate +67% fresh tagasaste forage (T3) and 100% fresh tagasaste forage (T4). The treatments were arranged in a randomized complete block design with the four treatments randomly allocated to the animals in every block. The concentrate supplement was 300 g DM/day/20 kg sheep. All treatments were on DM basis and the tagasaste forage was offered to fulfill the same DM as that of the concentrate. The experimental feeds were offered in the morning between 8:00 and 8:30 a.m. and afternoon at 4:00 p.m. Natural pasture hay was offered ad libitum at the same feeding time. The animals were subjected to 15 days of adaptation to the experimental feeds and the actual data collection was continued for 90 days. Throughout the experimental period, the animals had free access to water and mineral licks. Daily feed offered and refusals were recorded and live body weights were measured in the morning before animals were fed and watered every 10 days. Digestibility trial Following the feeding trial, digestibility of the experimental feeds was determined using the same 20 sheep in the feeding trial. The animals were harnessed with faecal collection bags and allowed for an adaptation period of 3 days. The daily total DM intake and total faecal excretion were weighed. In addition about 20% of the total faecal samples collected from each sheep were kept in a deep freezer. At the

6
end of the digestion trial the faecal samples were pooled per sheep for chemical analysis. Chemical analysis The feeds offered and refused in the experiment as well as feces excreted in the digestibility trial was subjected to laboratory analysis for dry matter (DM), nitrogen (N), and ash following the procedure of AOAC (1990). Crude protein (CP) was calculated as 6.25 multiplied by percent N. The acid detergent fiber (ADF), neutral detergent fiber (NDF), and acid detergent lignin (ADL) components of the samples were determined according to the procedure of Van Soest and Robertson (1985). ADL was determined for feed samples only. Carcass evaluation At the end of the feeding trial all animals were slaughtered for carcass evaluation. Slaughtering was done by cutting the jugular vein. After dressing, the gastrointestinal tract (stomach and intestine) was weighed with and without its contents. The entire fat depot in the gastrointestinal and visceral organs was collected and weighed together. The visceral organs including, heart, kidney, spleen, lung and liver, were weighed separately. Blood, reproductive organs, diaphragm, gall bladder, and urinary tract were also weighed. The empty body weight was calculated by subtracting the contents of the gastrointestinal tract from the live weight at slaughter. The carcass was frozen overnight and rib-eye muscle area and back fat thickness were measured in the following day by cutting the vertebral column between the 12th and 13th ribs. Data analysis Treatment effects of the collected data were compared by analysis of variance using the general linear model procedures of SAS statistical package (SAS, 2008). The following statistical model was used for analysis:
Yij = μ + T i + Bi + Eij Where: Yij = Response variable, μ = Overall mean, T i = Treatment effect, Bi = Block effect, Eij = Random error

7
Results and Discussion
The chemical compositions of experimental feeds used in this study are shown in Table 1. They are found within the ranges of chemical compositions of Ethiopian feeds reported by Seyoum (1995). The chemical composition of tagasaste in the current study, except for ADL, were within the ranges reported by Solomon et al. (2004a) in which CP, OM, NDF, ADF, and ADL in MPTs ranged between 21.6%−27.8%, 88.4%−93.1%, 20.44%, 20.4%−33.8%, and 2.72%−2.82%, respectively. The CP content of tagasaste was within the range of 21.6%−27.8%, but NDF and ADF were higher, and ADL was lower in the current study compared to the report of Solomon et al. (2004a).
Table 1. Chemical composition of experimental feeds (g/kg DM)
CM=concentrate mix (70% of wheat bran and 29% of noug seed cake); ADF=acid detergent fiber; ADL=acid detergent lignin; CP=crude protein; DM=dry matter; NDF=neutral detergent fiber; NSC=noug seed cake; OM= organic matter; WB=wheat bran.
Table 2 presents the dry matter intake of the experimental diets and nutrients. The finding of Getnet (2007) showed that supplementation of Menz sheep with tagasaste significantly (P<0.01) improved daily CP intakes over the noug cake based concentrate mix. However, CP intake in the present study is higher in the group supplemented with sole concentrate mix which could be attributed to the slightly higher dry matter intake in this group. Similar total OM intake of sheep fed on the foliage supplement was in agreement with earlier study which assessed the effect of various forms of Accacia saligna supplementation to sheep fed on basal diet of grass hay (Getachew, 2005). Sheep in all treatments had similar (P>0.05) NDF and ADF intake.
Feed DM OM CP NDF ADF ADL
Grass hay 90.3 92.6 5.4 74.1 17.9 14.7
CM(3:1) 88.4 92.2 20.0 39.4 22.4 6.6
Tagasaste 84.2 94.5 22.0 47.9 23.4 6.5

8
Table 2. Dry matter and nutrient intake of sheep fed grass hay supplemented with concentrates mix, tagasaste or their mixture (DM basis)
Variable
Intake (g/d) Treatment
T1 T2 T3 T4 SEM SL Natural pasture Hay 344.2 316.2 248.7 294.2 15.72 ns Total dry matter 644.2 619.5 548.7 594.2 15.83 ns Organic matter 594.0 536.2 510.6 564.3 16.80 ns Crude protein 87.9a 80.4b 77.2b 82.2ab 1.15 ** Neutral detergent fiber 391.1 367.6 285.0 389.4 19.72 ns Acid detergent fiber 131.4 122.9 113.9 124.8 3.65 ns Acid detergent fiber 76.1a 66.5ab 56.2b 64.1ab 2.36 *
ameans with different superscripts in a row are significantly different; *=(P<0.05); **=(P<0.01); CM=concentrate mix; DMI=dry matter intake; NDF=neutral detergent fiber; ns= non-significant; SEM: standard error mean; SL= significant level; T1= hay+ concentrate mix (CM; NSC and WB at 1:3 ratio); T2= hay+(67% CM+ 33% Tagasaste foliage), T3= hay +(33%CM + 67% Tagasaste); T4=hay + 100% Tagasaste
Table 3. Digestion coefficients of sheep fed grass hay supplemented with concentrates mix, tagasaste or their mixture (DM basis)
Variable Treatment
T1 T2 T3 T4 SEM SL Dry matter 0.67a 0.63ab 0.55ab 0.52b 0.02 * Organic matter 0.69a 0.63ab 0.57ab 0.55b 0.02 * Crude protein 0.75a 0.72a 0.62b 0.61 b 0.01 *** Neutral detergent fiber 0.65 0.61 0.55 0.51 0.02 ns Acid detergent fiber 0.45 0.34 0.31 0.24 0.04 ns
a, b,means with different superscripts in a row are significantly different; *=(P<0.05); **=(P<0.01); ***= (P<0.001); ns= non-significant; SEM=standard error of mean; SL=significant level; T1= hay+ concentrate mix (CM; NSC and WB at a ratio of 1:3); T2= hay+ 67% CM+ 33% Tagasaste); T3=hay + 33% CM + 67% Tagasaste); T4=hay + 100% Tagasaste Digestibility of treatment diets were significantly declining as the level of tagasaste inclusion in the supplement increased (Table 3). The digestibility of NDF and ADF in the present study did not differ (p>0.05) among the treatments, although the magnitude decreased with

9
increasing level of tagasaste. The absence of significant difference in digestibility of NDF among the treatments in the present study was in agreement to the result of McRae and Armstrong (1969) who reported that supplementation had little or no effect on digestibility of NDF. Similar results were reported by Simiret and Solomon (2009), Matiwos et al, (2008), and Koralagama et al, (2008). Table 4. Body weight parameters and feed conversion efficiency of sheep fed
grass hay supplemented with concentrates mix, tagasaste or their mixture (DM basis)
Parameter Treatment
T1 T2 T3 T4 SEM SL Initial body weight (kg) 16.1 16.0 16.3 16.1 0.19 ns Final body weight (kg) 20.3ab 22.0a 20.3ab 18.7b 0.38 * Total body weight gain(kg) 4.2ab 6a 4b 2.6 b 0.35 ** Average daily gain (g) 46.4ab 66.4a 44b 29.6b 3.87 ** Feed conversion efficiency 0.09a 0.07ab 0.05ab 0.03b 0.007 **
a,b=means with different superscripts in a row are significantly different; *=(P<0.05); **=(P<0.01); ns=not significant; SEM=standard error of mean; SL=significance level; T1=hay+ concentrate mix (CM; NSC and WB at 1:3 ratio); T2=hay+67% CM+ 33% Tagasaste foliage; T3=hay +33%CM + 67% Tagasaste; T4=hay + 100% Tagasaste
The lower weight gain of sheep supplemented with sole tagasaste forage (Table 4) could be attributed to the inefficient digestibility of tagasaste (Table 3) due to the presence of anti-nutritional compounds like tannins (Assefa et al., 2006). A similar experiment (Kaitho et al., 1998) on sheep also showed higher DM and digestible OM intake and lower weight gain by treatment groups fed on tagasaste. Roger et al., (1999) indicated that DM intake and average daily weight gain of lambs supplemented with tree legumes were lower than those fed on concentrate. However, the importance of tree foliage such as tagasaste to replace the costly protein supplement dictates the need to survey such forage as they could represent cost effective supplements for ruminants that subsist on poor quality pasture and/or crop residues (Getu et al., 2012). In this study the rib-eye muscles area was higher (P<0.01) for the group fed on sole concentrate supplement and concentrate replaced by lower

10
level of tagasaste as compared to the sole tagasaste supplemented group (Table 5). The observed rib eye muscle area was lower than the 6.7-10.4 cm2 reported by Emebet (2008) when Blackhead Ogaden sheep was fed on a basal diet of haricot bean and supplemented with mixtures of wheat bran. According to Tesfaye and Solomon (2009) Afar rams supplemented with 150g, 250g, and 350 g concentrate mix consisting of WB, NSC, and sesame seed cake at the ratio of 2:1:1 and weighing 21.6 kg, 24.2 kg and 23.8 kg had rib-eye muscle area of 7.9 cm2, 9.4 cm2
, and
8.2 cm2, respectively, were not comparable with the result of the current study. But, the rib-eye muscle area recorded for control and supplemented treatments in the present study were comparable with the rib-eye muscle area of 5.3-6.9 cm2 reported by Abebe and Solomon (2009) in the same sheep breed (Afar) fed on a basal diet of grass hay and supplemented with linseed meal, wheat bran, and their mix at different proportions.
Table 5. Carcass characteristics of sheep fed grass hay supplemented with
concentrates mix, tagasaste or their mixture (DM basis)
Parameter Treatment T1 T2 T3 T4 SEM SL
Slaughter body weight (kg) 19.2ab 20.6a 19.3ab 17.2b 0.36 ** Empty body weight (kg) 15.9b 17.9a 15.7b 13.5c 0.42 *** Hot carcass weight (kg) 8.1ab 9.8a 7.6ab 6.5b 0.38 * Dressing percentage - Slaughter body weight (%) 41.7ab 47.3a 39.2ab 37.5b 1.27 * - Empty body weight (%) 50.3 54.4 48.2 47.8 1.25 Ns Lung, trachea, and esophagus (kg) 0.89ab 1.0a 0.79b 0.52c 0.05 *** Penis and testis (kg) 0.34ab 0.38a 0.35ab 0.23b 0.02 * Skin and feet (kg) 1.7b 1.1c 2.3a 2.0a 0.11 *** Head (kg) 0.98 1.01 1.00 1.05 0.02 Ns Spleen (kg) 0.06a 0.04b 0.06a 0.06a 0.002 *** Gut content (kg) 2.68b 3.28a 3.6a 3.72a 0.11 *** TNEO (kg) 6.62b 6.83b 8.06a 7.63a 0.16 *** Rib eye muscles area (cm2) 5.9ab 6.4a 5.6b 3.7c 0.25 *** a,b,.c, Means with different superscripts in row are significantly different; *=(P<0.05); **= (P<0.01); ***=(P<0.001); ns=not significant; SEM=standard error of mean; SL=significant level; T1=hay+ concentrate mix (CM;NSC and WB at 1:3 ratio); T2=hay+67% CM+ 33% Tagasaste foliage; T3=hay +33%CM + 67% Tagasaste; T4=hay +100% Tagasaste Dietary status of animals and BW affects the production efficiency of offals (Kirton et al., 1972). In the current study, lung, trachea, esophagus, and spleen as well as skin and feet differ (P<0.01) among

11
the treatments. There was no difference (P>0.05) among supplemented treatments for the head part. But, the result of the current study was contrary to the report of Hag and Shargi (1996) and Saikia et al (1996) who reported that different feed supplement had no effect on edible and non-edible offal’s. Total non-edible offals (TNEO) were significantly higher (P< 0.01) for supplemented sheep. Moreover, T3 was higher (P<0.001) in TNEO compared to T1, T2 and T4 group. Similar to the present study, Fluharty and McClure (1997) reported that high protein diets resulted in greater weights of liver, small intestine, and kidney compared to normal protein diets in sheep. Fresh tagasaste forage was found to be good quality supplement for sheep fed on low quality roughages like natural pasture hay. The present result indicated that supplementations improved feed intake, digestibility of nutrients, carcass parameters, BW gain and FCE. The results of this study suggested that T1, T2, and T3 resulted in better BW and hot carcass yield and can be recommended to be biologically efficient References
Abebe Mekoya, 2008. Multipurpose fodder trees in Ethiopia; Farmers’ perception, constraints to adoption and effects of long-term supplementation on sheep performance PhD thesis, Wageningen University, Wageningen, the Netherlands
AOAC (Association of Official Analytic Chemistry), 1990. Official Methods of the Analysis. 15th edition. AOAC. Arlingston, USA.1298p.
CSA, (Central Statistic Authority), 2013. Report on area and production of crops (Private peasant holding, Meher season). Volume 1. ECSA (Ethiopian Central Statistical Agency), Addis Ababa, Ethiopia
Emebet Legesse, 2008. Supplementation of Blackhead Ogaden Sheep Fed Haricot Bean (Phaseolus vulgaris) Haulms with Mixtures of Wheat Bran and Brewers Dried Grain: Effects on Feed Utilization, Live Weight Gain and Carcass Parameters. M.Sc. Thesis, Haramaya University. 1-69p.
Fluharty FKL, EK McClure. 1997. Effect of dietary energy intakes and protein concentration on intakes and visceral organ mass lambs. J. Anim. Sci. 75: 604-610.
Gashaw Geda. 1992. Assessment of feed resources base and performance of cross-bred dairy cows distributed to smallholder in the Selale Dairy Development Project area. MSc. Thesis, Alemaya University of Agriculture, Pp.171.

12
Getachew Assefa, 2005. Evaluation of forage yield and effect of forms of feeding of Acacia salignia on intake and live weight gain of Farta sheep fed on grass hay. MSc Thesis, Alemaya University. 66p.
Getnet Assefa, 1998. Biomass yield, botanical fractions and quality of tagasaste (Chamaecytisus palmensis) as affected by harvesting interval in the highlands of Ethiopia. Agro-forestry systems 42 (1), 13–23.
Getnet Assefa, C Kijora, KJ Peters, K Sonder, M Wink, N Steinmüeller. 2006. Effect of variety, harvesting stage and season on the concentration of tannins and alkaloids in tagasaste (Chamaecytisus palmensis). Proceedings of Deutscher Tropentag, p. 105
Getu Kitaw, Mesfin Dejene, Aemiro Kehaliw and Getnet Assefa, 2012. Comparative evaluation of Tree Lucerne (Chamaecytisus palmensis) over conventional protein supplements in supporting growth of yearling Horro lambs. Livestock Research for Rural Development 24 (1) 2012
International Livestock Research Institute (ILRI), 1999. Farmers, their animals and the environment. Feed and Nutrition.
Kaitho RJ, NN Umunna, IV Nsahlai, S Tamminga and J Van Bruchem, 1998. Effect of feeding graded levels of Leucaena leucocephala, Leucaena pallida, Sesbania sesban and Chamaecytisus palmensis supplements to tef straw given to Ethiopian Highland sheep. Animal Feed Science Technology. 72: 355-366.
Kirton AH, DP Fourie, and EK Jury, 1972. Growth development of sheep. Growth of the carcass and non-carcass component of the south Down and Rommey and their cross and some relationships with composition. J.Agric. Res.15: 214-227.
Koralagama KDN, FL Mould, S Fernandez-Rivera, and J Hanson, 2008. The effect of supplementing maize stover with cowpea (Vigna unguiculata) haulms on the intake and growth performance of Ethiopian sheep. Cambridge Journals Online animal 2 (2008): 954 -961.
McDowell ER. 1988. Plant breeding and the nutritive value of crop residues. Proceedings of the Importance of crop residues for feeding livestock in smallholder farming systems, 7-10 December 1987, ELCA, Addis Ababa.
Saikia G,KK Baruah, SC Buragohain, BN Saikia, and ML Brahma, 1996. Effect of various energy levels on carcass characteristics and body composition of male crossbred kids. Dept. of Animal Nutrition, Assam Agricultural University, Khanpara, Guwahati. pp. 31-33.
SAS, 2008. SAS/STAT Guide to personal computers, Version 9.1.3 Statistical analysis system institute Inc., NC. USA.
Seyoum Bediye. 1995. Evaluation of nutritive value of herbaceous legumes, browse species and oil seed cakes using chemical analysis, in vitro digestibility and nylon bag technique. MSc. Thesis, Alemaya University.
Simret Betsha and Solomon Melaku. 2009. Bodyweight and carcass characteristics of Somali goats fed hay supplemented with graded levels of peanut cake and wheat bran mixture. Trop Anim Health Prod (2008) 40:553–560

13
Optimum Dietary Crude Protein Level for Fattening Yearlings of Arsi-Bale Lambs
Getahun Kebede
Ethiopian Institute of Agricultural Research, Debre Zeit Research Center, Ethiopia. Email: [email protected]
Introduction
Sheep production plays a crucial role in Ethiopia as source of food (meat), income and manure for fertilizer. Ethiopia owns about 29.33 million sheep (CSA, 2014) which are entirely raised under traditional production system- characterized by low input-output. The productivity of sheep is very low as explained by annual off-take rate of 33% and average carcass weight of 10 kg/head (FAO, 2004). The productivity is hindered by feed deficit (inadequate amount and quality), low genetic potential of sheep and prevalence of disease and parasites. Sheep are raised entirely on grazing pasture and rarely supplemented with concentrates. The deficit in livestock feed is sever particularly during dry season and at drought occurrence, when dry roughages remain major available feed resources and protein is the most limiting macronutrient. Most of the sheep are sold to local markets at about yearling age (live weight below 20 kg) often without supplementation (body conditioning) before marketing. Some farmers traditionally fatten their sheep before marketing; with little concentrate supplementation on top of grazing. However, there is uncertainty that the amount fed could support the nutrient requirement for maximum growth of sheep, as the feed is not often formulated and offered based on nutrient demand. Hence, this system of feeding would sometimes lead to over or under utilization of available feed nutrients, which may be economical and may not help animals express their potential capacity. Feeding sheep based on their nutrient requirement at different production phases is not a common practice in Ethiopia. On the other hand, most of the feeding standards developed initially based on temperate wool breed sheep (NRC, 1985) and some tropical sheep breeds (Paul et al., 2003; Kearl, 1982) have been used in improved sheep production systems. According to Andrew and Orskov (1970), the

14
maximum live weight gain and nitrogen retention of temperate breed lambs on high plane of nutrition, growing from 15 to 40 kg were achieved at 17% dietary CP. In addition, National Research Council (NRC, 1985) recommended a diet containing 14.5% CP for maximum growth of early weaned lambs. Unlike that of temperate breeds, Kearl (1982) and Paul et al., (2003) recommended a lower levels of dietary CP and energy for growing tropical sheep at different growth rates and live weights. Although nutrient requirement tables developed for tropical sheep are believed to meet the requirements of indigenous sheep breeds of Ethiopia, it has been rarely accepted and applied, as the recommendations were based on estimates obtained from a specific breed, which may not necessarily represent local sheep. Also, differences feed quality and utilization efficiency by the animal may contribute to this uncertainty. Nutrient requirement of animals vary depending on breed, age, physiological status, growth potential, feed quality and environmental factors, such as temperature, air humidity, solar radiation and wind speed (NRC, 1985). However, there is no adequate information on nutrient requirements of indigenous sheep breeds of Ethiopia. Therefore, this study was conducted to determine the optimum dietary crude protein for maximum growth and feed utilization of yearling Arsi-Bale lambs in feedlot. Materials and Methods
Study Area The experiment was conducted at sheep research unit of Debre Zeit Agricultural Research Centre, located at 45 km South East of Addis Ababa (08°44'N 38°,58'E; average altitude of 1900 m), Ethiopia. The area has bimodal rainfall pattern with average annual rainfall of 845 mm and annual minimum and maximum temperatures of 10 and 22°C, respectively. The area is characterized by mixed-crop-livestock production system; with major crops grown include tef (Eragrostis tef), wheat, chick pea and lentil. Treatments and Feed Composition The diets were similar in ingredient composition, except exclusion of noug seed cake and wheat middling (diet1) and wheat middling (diet4) for the purpose of balancing (Table1). Maize grain, wheat bran, noug

15
seed cake, wheat middling, salt and limestone constituted concentrate part that contained 14, 16, 18, 20 and 22% CP in the respective treatments, leading to differences in dietary CP (9.43% CP in T1, 10.26% CP in T2, 11.06% CP in T3; 12.06 % CP in T4 and 13.1% CP in T5). The diets were formulated to be nearly iso-caloric (2.12 Mcal ME/Kg DM) and meet the energy requirement for growing tropical sheep (Kearl, 1982). The diet containing 9.4% CP was used as negative control, while the diet with 13% CP was used as a positive control. All diets were similar in DM content, but differed in NDF, ADF and ADL.
Table 1. Proportion of feed ingredients used for the different treatment diets and their chemical composition (%DM)
% Diet composition T1 T2 T3 T4 T5 Straw Straw Straw Straw Straw Straw *Noug cake - 6.0 19.9 35.0 47.2 *Wheat bran 82.3 80.8 62.9 49.9 6.0 *Maize grain 15.6 3.0 7.0 12.9 16.1 *Wheat middling - 8.1 8.1 - 28.6 *Limestone 1.1 1.1 1.1 1.1 1.1 salt 1.0 1.0 1.0 1.0 1.0 Total 100 100 100 100 100
Chemical composition:(% DM) DM 91.46 91.55 91.53 91.84 92.30 CP 9.43 10.26 11.06 12.06 13.10 Ash 12.25 12.69 12.91 10.67 9.71 NDF 48.66 52.86 55.79 56.77 54.80 ADF 26.71 26.43 28.15 31.65 29.18 ADL 5.65 5.75 6.33 7.61 7.20 ME (Mcal kg-1) 2.14 2.13 2.12 2.11 2.11 ME =Metabolizable energy; calculated according to Kearl (1982). * % DM of concentrate mix. Ratio of straw to concentrate offered was 65: 35, on as fed basis.
Dietary protein supplement levels, T1= 9.43% CP, T2=10.26% CP, T3=11.06% CP, T4=12.06 % CP, and T5=13.1% CP)
Animals and Feeding Management Thirty-two yearling male Arsi-Bale sheep with mean initial live weight of 17.53 ±1.57 kg were purchased from local markets and treated against endo-and ecto-parasites and vaccinated for common viral

16
diseases. All animals were individually penned in a house with concrete floor and adapted to indoor feeding management for two weeks, before commencing the experiment. Then, they were randomly assigned to five dietary treatments in completely randomized design. Each animal was fed the respective diet adlib, ensuring 15% daily refusal based on previous day's intake. Feed was provided twice daily at 8:30 a.m and 2:00 p.m. The amount of straw and concentrate offered were adjusted daily based on previous day intake, where straw to concentrate ratio was 65:35, on as fed basis. Water was provided in a bucket free of choice. Feed offered and refusals were measured daily and feed intake was calculated as the difference between the two measurements. Representative feed samples were taken daily and sub-sampled every 15 days. All animals were weighed biweekly after overnight (~16 hours) deprivation of feeds and water. At the end of the feeding period (87 days), three lambs were selected per treatment and transferred to individual metabolic crate with slotted floor. The animals were adapted to the attached fecal bags and urine funnels for three days followed by collection of feces and urine for seven days. All animals had unlimited access to water. Urine was directly poured into a glass bottle containing drops of sulfuric acid to prevent ammonia loss. The amount of feces and urine produced per animal/day was measured and recorded. About 10% of the daily fecal and urine outputs were sampled per animal and stored in a deep freezer (-20°C) until sub-sampled for laboratory analysis. Moreover, three animals were randomly selected per treatment and slaughtered for carcass analysis. The animals were slaughtered after 24 hour of feed deprivation. Measurements were taken for slaughter weight (SW), hot carcass weight (HCW) and carcass components (bone, fat and lean, trimmings). Dressing percentage (DP) was calculated as: (HCW/SW)*100. Sample Chemical Analysis Feed and fecal dry matter (DM), crude protein (CP) and Ash were determined according to the procedures of AOAC (1990), while neutral detergent fiber (NDF), acid detergent fiber (ADF) and acid detergent lignin (ADL) were determined according to Van Soest et al., (1991).

17
Statistical Analysis Data was analyzed using the General Linear Model (GLM) procedure of SAS (2003). Treatment means of the parameters were separated using Duncan Multiple Range Test. The statistical model used for feed intake, live weight change, digestibility, feed conversion ratio, carcass parameters and nitrogen utilization was: Yij = µ + αi +∈ij, Where, µ = Grand mean; αi = Effect of treatment feeds; and ∈ij = Experimental error. Data on average daily gain (ADG) for each lamb was computed by regressing the live weight incurred in two weeks interval over the number of days elapsed. Results and Discussion
Nutrient Intake and Digestibility The effect of treatments was not significant on dry matter intake (P>0.05), ranging from 918.3 (T1) to 928.1 g/day per lamb (T3) (Table 2). The DM intake observed in this study is comparable with previous studies for Arsi-Bale lambs maintained on roughage and concentrate (Getahun and Kassahun, 2010; Ermias, 2008). Studies have shown a non-significant DM intake in sheep fed diets containing 9% to 13% CP (Ahn and Moon, 1985), in Saanen kids fed diets containing 14% to16% CP (Mohammad et al., 2013) and in Korean black goats maintained on 14-20% CP diet (Hwangbo et al., 2009). In the present study, intake of crude protein linearly increased (P<0.001) with the increase in dietary CP, where lambs subjected to 13% CP diet consumed 120g CP/day. Also, intake of fiber fractions was increased with the increase in dietary CP, the highest value recorded with 12% CP diet. Although change in the apparent digestibility of nutrients was non-linear with change in dietary CP, there was variation in digestibility of DM (P<0.05), CP (P<0.05), NDF (P<0.001) and ADF (P<0.001). The apparent digestibility of nutrients was greater with T2 and T4 diets, and lowest with T3 diet. Live Weight Change and Feed Conversion Ratio (FCR) Although non-significant (P>0.05), improvements in average final live weight (22.71 vs 23.96 kg), total gain (5.37 vs 6.35 kg) and average daily gain (61.78 vs 73.00 g/day) were observed with an increase in dietary CP (Table 3). The observed higher growth performances for lambs fed on high CP diet could be due to increase in feed consumption.

18
In agreement with the present results, Paul et al., (2003) recommended 9.7% to 12.1% CP diet for tropical sheep, growing from 15 kg to 25 kg. However, improved growth performances were reported at higher (16 to 18%) than lower (10-14%) dietary crude protein for Awassi lambs (Haddad et al., 2001; Titi et al., 2000) and Kivircik lambs (Keser et al., 2008). Similarly, Hwangbo et al., (2009) reported the highest gain for growing Korean black goats at higher (18% CP) than lower level of dietary CP. Table 2. Effect of dietary crude protein level on intake and apparent digestibility
of nutrients
T1 (n=6)
T2 (n=6)
T3 (n=6)
T4 (n=7)
T5 (n=7) SEM P value
Intake (g/day) DM 920.26ba 918.29b 928.09ab 920.33ab 922.23ab 3.17 0.2262 CP 86.71e 94.13d 102.61c 110.87b 120.63a 0.37 <.001 ME 1.97a 1.95ab 1.96ab 1.94b 1.95ab 0.01 <.001 Ash 112.71c 116.61b 119.81a 98.22d 89.51e 0.39 <.001 NDF 447.81e 485.39d 517.68b 522.41a 505.52c 1.74 <.001 ADF 245.86d 242.83d 261.25c 290.93a 269.31b 0.94 <.001 ADL 52.05e 52.85d 58.72c 70.05a 66.41b 0.22 <.001
Digestibility (%) DM 55.59b 61.56a 54.66b 64.30a 60.92ab 2.18 0.0393 CP 59.91ab 59.55ab 58.55b 65.49ab 66.54a 2.32 0.0477
NDF 64.88bc 74.79a 63.0bc 67.11b 60.41c 2.07 <.001 ADF 62.24b 71.75a 49.58c 66.60ab 53.4c 2.65 <.001
a,b,c,d,e Values with different superscripts within same row are significantly different; DM=dry matter intake; CPI=crude protein intake; AshI= ash intake; NDFI= neutral detergent fiber intake; ADFI= acid detergent fiber intake; ADLI= acid detergent intake; SEM= standard error of the mean; n= number of lambs Dietary protein supplement levels, T1= 9.43% CP, T2=10.26% CP, T3=11.06% CP, T4=12.06 % CP, and T5=13.1% CP) There was differences in FCR (P<0.001): the highest FCR were observed in lambs fed 12% CP diet (12.61 DMI/g gain) and 13% CP diet (12.76 g DMI/g gain),while the lowest (14.9) was in lambs fed on 9.4% CP diet, suggesting a higher nutrient availability at given feed protein and energy contents. Previous studies by Abebe et al., (2010) and Ermias (2008) have shown improvement in feed utilization and

19
growth performances of Arsi-Bale lambs at higher than lower level of protein source concentrates.
Table 3. Effect of dietary crude protein on live weight change and FCR
Parameter T1 (n=6)
T2 (n=6)
T3 (n=6)
T4 (n=7)
T5 (n=7) SEM P
value Initial wt, (kg) 17.33 17.41 17.83 17.53 17.57 0.68 0.9886 Final wt, (kg) 22.71 23.25 23.96 23.88 23.86 0.81 0.7814 Total gain, (kg) 5.37 5.83 6.12 6.35 6.28 0.70 0.8673 ADG, g 61.78 67.05 70.40 73.00 72.25 8.12 0.8673
FCR 14.90c 13.70b 13.18b 12.61
a 12.76
a 0.24 <0.001
a,b,c Values with different superscripts within same rows are significantly different; FCR= feed conversion ratio(g DMI/g gain); ADG=average daily gain; SEM= standard error of mean; n=number of animals. Dietary protein supplement levels, T1= 9.43% CP, T2=10.26% CP, T3=11.06% CP, T4=12.06 % CP, and T5=13.1% CP) Nitrogen Utilization Nitrogen intake (NI), urinary nitrogen (UN) and total nitrogen excretion (TN) increased (P<0.001) with increase in dietary CP (Table 4). The highest NI (21.08 g/day), UN (5.02 g/day), and TN excretion (9.19 g/day) were recorded in lambs fed on 13% CP diet. Treatments did not vary (P>0.05) in the level of fecal nitrogen excretion. An increase (P<0.001) in nitrogen balance (NB) was seen with increased dietary CP, being the highest (12.70 g/day) in 12% CP diet. Osuagwuh and Akinsoyinu (1990) reported an increase in NI, UN, FN and N retention for West African dwarf goats as the level of crude protein in the supplement was increased from 5% to 25% DM. However, the present study has proven no significant difference (P>0.05) between lambs fed on 12% and 13% CP diets in nitrogen balance. It has been observed that the higher nitrogen balance, the better the growth performances of lambs. Carcass Analysis There was no real difference (P>0.05) among treatments in SW, HCW, DP, fat and bone yields (Table 5). However, the magnitude of HCW was increased by about 10% (8.88 vs. 9.8 kg) and that of DP by 6.5% (39.38 vs. 42.15kg), as feed CP level in the diet was increased from 9.4% to 12%. Studies have shown that DP increases as SW increases (Marinova et al., 2001; Mourad et al., 2001). However, the fact that no

20
remarkable change was observed in DP in the present study may be attributed to lower SW of sample animals. In this study, lean meat yield increased (P<0.05) with increase in dietary CP, the highest being 6.52 kg for lambs fed 13% CP diet. Similarly, lean to bone and lean to fat ratios were highest for 13% CP diet compared to 9.4% CP diet. There was no significant change in the proportion of fat, bone and meat for Korean Black goat kept on 14% to 20% CP diet (Hwangbo et al., 2009).
Table 4. Nitrogen utilization (g/day) in lambs fed the experimental diets
Treatment NI UN FN TN NB T1 15.03e 1.52c 3.76 5.29d 9.74d T2 16.21d 4.12ab 4.20 8.32c 7.89e T3 17.72c 2.43c 4.68 7.11c 10.61cd T4 19.57b 3.06bc 3.81 6.87dc 12.70ab T5 21.08a 5.02a 4.18 9.19a 11.89cb
SEM 0.103 0.431 0.417 0.623 0.646 P- value <0.001 <0.001 0.5358 0.0005 <0.001
a,b,c,d,e values with different superscripts within same column are significantly different; UN=urine nitrogen, g/d; FN=fecal N; NI= N intake; TN= total N excreted; NB= nitrogen balance; SEM= standard error of the mean - Dietary protein supplement levels, T1= 9.43% CP, T2=10.26% CP, T3=11.06% CP, T4=12.06 % CP, and T5=13.1% CP)
Table 5. Effect of dietary crude protein level on carcass parameters of lambs
Parameter T1 (n=3)
T2 (n=3)
T3 (n=3)
T4 (n=3)
T5 (n=3) SEM P-
value SW (kg) 22.50 23.75 23.83 23.33 23.83 1.46 0.9580 HCW (kg) 8.87 9.07 9.73 9.80 9.83 0.63 0.7177 DP (%) 39.39 38.21 40.77 42.15 41.34 1.60 0.4684 Lean (kg) 4.95b 5.18b 5.58ab 5.96ab 6.52a 0.45 0.0148 Fat (kg) 1.26 0.90 1.35 1.14 1.01 0.19 0.4987 Bone (kg) 2.26 2.65 2.43 2.24 2.10 0.18 0.2980 Trimming(g) 393.3a 339.1ab 365.0ab 460.3a 201.5b 56.18 0.0794 LBR 2.19b 1.98b 2.35b 2.68ab 3.12a 0.24 0.0524 LFR 3.96b 6.05ab 4.41ab 5.47ab 6.89a 0.87 0.1868
a,b,c,d,e Values with different superscripts within same row are significantly different; SW = slaughter weight; HCW= hot carcass weight; DP= dressing percent (HCW/SW*100); LBR= lean to bone ratio; LFR=lean to fat ratio; SEM= standard error of mean; n= no. of slaughtered animals Dietary protein supplement levels, T1= 9.43% CP, T2=10.26% CP, T3=11.06% CP, T4=12.06 % CP, and T5=13.1% CP)

21
References
Abebe Tafa and Solomon Melaku and Kurt J. Peters. 2010. Supplementation with linseed (Linum usitatissimum) cake and/or wheat bran on feed utilization and carcass characteristics of Arsi-Bale sheep. Trop. Anim Health Prod. 42:677–685.
Ahn BH and Moon YH,1985. Effect of dietary protein and calcium levels on nutrition in sheep. I. Effect of dietary protein and calcium levels on digestibility, nitrogen balance and some mineral retention in sheep. Kor. J. Anim. Sci. 27:507-514.
Andrews, R.P., Orskov, E.R., 1970. The nutrition of early weaned lamb. I. The influence of protein concentration and feeding level on rate of gain in body weight. J. Agric. Sci.(Camb) 75, 11-18.
AOAC (Association of Official Analytical Chemists), 1990. Official method of analysis.15th ed. AOAC Inc., Arlington, Virginia, USA. pp. 12-98.
CSA (Central Statistic Authority) of Ethiopia, 2014. Agricultural sample survey 2014. Vol.II. Report on livestock and livestock characteristics (Private peasant holdings). 194p.
Ermias Tekletsadik, 2008. The Effect of Supplementation with barely bran, linseed meal and their mixtures on the performance of Arsi - Bale sheep fed a basal diet of faba bean haulms. MSc Thesis. Haramaya University, Ethiopia.
FAO (Food and Agricultural Organization of the United Nations), 2004. FAOSTATdata.http://www.faostat.fao.org/faostat/collections?subset=agriculture.
Getahun Kebede and Kassahun Melese. 2010. Evaluation of poultry litter as substitute of urea in urea molasses block on growth and carcass characteristics of finished lamb. Ethiopian Journal of Animal Production (EJAP). Vol.10; No1, Pp: 19-31.
Haddad SG, RE Nasr, and MM Muwalla, 2001. Optimum dietary crude protein level for finishing Awassi lambs. Small Ruminant Research, 39, 41−46.
Hwangbo Soon, Sun Ho Choi, Sang Woo Kim, Dong Soo Son, Ho Sung Park1Sung Hoon Lee2 and Ik Hwan Jo. 2009. Effects of Crude Protein Levels in Total Mixed Rations on Growth. Performance and Meat Quality in Growing Korean Black Goats. Asian-Aust. J.Anim. Sci. Vol. 22, No. 8:1133-1139.
Kearl LC. 1982. Nutrient Requirements of Ruminants in Developing countries. International Feedstuffs Institute, Utah State University, Logan, Utah 84322, USA.
Keser O, T Bilal, and H Cankutay. 2008. The effect of different dietary crude protein level on performance and serum immunoglobulin g in male Kivircik lambs. Bulgarian Journal of Veterinary Medicine ,11, No 1, 49−54.
Marinova P, Y Banskalieva, S Alexandrov, V Tzvetkova, and H Stanchev. 2001. Carcass composition and meat quality of kids fed sunflower oil supplemented diet. Small Ruminant. Res. 42:217-225.

22
Mohammad Sharifi, Moslem Bashtani, Abbas Ali Naserian, Hamid Khorasani, 2013. Effect of dietary crude protein level on the performance and apparent digestibility of Iranian kids. African Journal of Biotechnology Vol. 12(26), pp. 4202-4205.
Mourad M, G Gbanamou, and LB. Balde. 2001. Carcass characteristics of West African dwarf goats under extensive system. Small Ruminant. Res. 42:81-85.
NRC (National Research Council), 1985. Nutrient Requirements of Sheep. Sixth Revised Edition. Washington, D.C; National Academic Press.
Osuagwuh AIA and AO Akinsoyinu, 1990. Efficiency of nitrogen utilization by pregnant West African dwarf goats fed various levels of crude protein in the diet. Small Ruminant Research, volume 3, Issue 4. Pages 363-371.
Paul SS, AB Mandal, GP Mandal, A Kannan, and NN Pathak. 2003. Deriving nutrient requirements of growing Indian sheep under tropical conditions using performance and intake data emanated from feeding trials conducted in different research institutes. Small Rumin. Res. 50: 97-107.
SAS(Statistical Analysis System), 2003. SAS Institute. Inc., Cary, NC, USA.
Titi HH, MJ Tabbaa, MG Amasheh, F Barakeh, and B Daqamseh. 2000. Comparative performance of Awassi lambs and black goat kids on different crude protein levels in Jordan. Small Ruminant Research, 37, 131−135.
Van Soest. PJ, JB Robertson, BA Lewis, 1991. Methods for dietary fiber, neutral detergent fiber and non-starch polysaccharides in relation to animal nutrition. J. Dairy Sci.74, 3583-3597.

23
Effects of Sole Diet Feeding of Maize Silage to Dairy Cows on Feed Intake, Milk Yield,
Milk Composition and Body Weight
Getenesh Teshome, Ashenafi Mengistu, Adey Melesse and Kassahun Melesse
Ethiopian Institute of Agricultural Research, Holetta Research Center, Ethiopia
Email –[email protected] Introduction Inadequate and unbalanced feed supplies are the major technical problems that result in low total milk output, reduce milk yield per cow and reduce replacement stock (Ahmed et al., 2003).Dairy animals are generally given energy and protein concentrate supplements to increase milk production and stocking rates (Graciaet al., 2000).Supplementation also helps to correct changes in the amount (increasing total dry matter intake) and quality of basal diet. The basal diet may contain all the essential nutrients for the animals but not in the quantity necessary to achieve the desired level of animal production. Under these circumstances a supplement would provide additional balanced nutrients preferably without reducing the intake of basal diets (Preston and Leng, 1984).Conserved feeds such as silages are an integral part of dairy cattle diet in intensively managed peri-urban dairy farms, although the availability of maize silage to such dairy farms has not been well documented. Utilization of low quality roughages could be improved with supplementation of energy and nitrogen sources, chemical and/or physical treatment, and selection together with breeding of crops, which ultimately depend on the economic benefits and applicability (McDonald et al., 2002). Excess forages can be conserved as hay or silage. Maize silage has low crude protein content and high energy content and ease of mechanization with which the whole plant can be ensiled to provide highly palatable source of energy and high quality forage (Mohamed et al., 2003).Recently utilization of corn silage as livestock feed has increased in many parts of the country. This increase can be related to its relatively high energy content and ease of mechanization with which

24
the whole plant can be ensiled to provide highly palatable source of energy and high quality forage (Mohamed et al., 2003).Silage protein quality represents perhaps the most important determinant of silage nutritive value from an economic point of view. Therefore, protein supplementation is important to improve livestock performance and this clearly needs to be done according to requirements of the animal and the balance of other nutrients available. Therefore, this study was conducted with the objective of evaluating the effects of feeding maize silage as a sole diet and protein source on feed intake, milk yield, milk composition, body weight change. Materials and Methods Experimental animals and management In the four months of feeding trial, four Holstein dairy-cows with similar lactation stage, exotic blood level, and parity were used. The cows were vaccinated against Foot and Mouth Disease (FMD), Blackleg, Anthrax and Bovine Pasteurellosis. California Mastitis Test (CMT) was conducted for all the experimental animals prior to the feeding trial and all the cows were found free of mastitis. The cows were fed and watered individually. Every morning the animals were visually inspected for signs of illness. Milking was done twice per day (at 6:00 AM in the morning and 4:00 PM in the evening) manually following recommended hygienic procedures. Experimental diets Four feed types were considered for the study; namely, maize silage, noug cake, cotton seed cake and linseed cake. Maize silage was used as a basal diet whereas the rest three were protein supplements. The amounts of supplements were determined based on the protein requirements and milk yield of individual cows filling the protein gap from an average intake of maize silage in relation to average daily milk yield. The details of the experimental diets are presented in Table 1.
Table 1. Experimental treatment diets used in the study
Treatment diet Basal diet Protein supplement T1 Maize silage Control T2 Maize silage Noug cake (NC) T3 Maize silage Cotton seed cake (CSC) T4 Maize silage Linseed cake (LSC)

25
The protein supplements were offered in two portions at 8:00 AM in the morning and 3:00 PM in the afternoon. Clean water was made available at all the times. Experimental design A change-over design (cross over design) was used for the feeding experiment with four dietary treatments assigned to each animal, arranged as one dietary treatment per period (Table 2). The dairy cows were assigned and fed with four feed treatments for a period of 21 days to collect actual data feeding with an adaptation period of 7 days prior to each period.
Table 2. Treatment arrangements using cross over design for the
experimental animals
Cow ID Feeding period 1st 2nd 3rd 4th
64.2 T1 T2 T3 T4 92.7 T2 T3 T4 T1 68.6 T3 T4 T1 T2 65.4 T4 T1 T2 T3
T1= Maize silage unsupplemented; T2= Maize silage + Noug cake,
T3= Maize silage + Cotton seed cake; T4= Maize silage + Linseed cake Data recording The amounts of feed offered and refused were measured and recorded daily from which daily feed intake was calculated by difference. Daily milk yields of experimental animals were measured and recorded. Moreover, composite milk samples were collected at the beginning and final week of each dietary treatment period for milk composition analysis. The body weight changes were calculated by difference from recorded initial and final weights of the experimental animals. Chemical analysis of feed samples The chemical analyses were done at the Holetta Agricultural Research Center. Silage sample was taken in duplicate from the silo to analyze the chemical composition of the silage. Dry matter contents of the feed samples were determined after drying in an oven at a temperature of 65oC for 72 hours. Nitrogen content of feed was determined by Micro-

26
Kjeldahal method from which the crude protein (CP) values were calculated as CP = N*6.25. Milk yield data and milk composition analysis Milk yield of each cow was recorded twice per day for the whole duration of the experimental period. At the beginning and the end of each dietary treatment of individual cows, milk samples were placed in a clean plastic cup, immediately after milking, placed in icebox and compositions were analyzed. The milk samples were analyzed for fat, solid-non-fat, total solid, protein and lactose contents using Lactoscan: (milk analyzer).
Statistical analysis Quantitative data were analyzed according to the General Linear Model (GLM) procedure of version9.0 SAS, (2002) employing the following model: Yijk = μ + Si + Cij + Pk + Tt + Eijk, Where, Yijk = response during the kthperiod of the jth cow in the ith sequence group, μ = population mean, Si = sequence effect (Seq.), Cij = the effect of the jth cow on the ith sequence, Pk = period effect,Tt = treatment effect (t = 1, 2, 3, 4) and E = residual err The Duncan’s Multiple Range Test procedure was used to separate treatment means. Results and Discussion Chemical composition of feeds The chemical compositions of experimental feeds are shown in Table 3. The CP content of maize silage used in this experiment (6.93%) was lower than what was reported by El-Ashry et al (2003) where the value was 8.72%. The CP content of noug seed cake used in this experiment was 35% and it’s almost similar to 35.3% reported by Hadjipanayiotou (1984). These differences may be due to the method of extraction employed, which creates differences in chemical composition of oil seed cakes (McDonald et al, 2002). The crude protein content of cottonseed cake used in this study was lower than the expected value of above 36%,

27
and it was similar to the value for whole cotton seed reported elsewhere (NRC, 1989) which might be due to mechanical methods used for oil extraction.
Table 3: Chemical composition of maize silage and protein sources
Experimental supplement feeds DM% CP
(%DM) OM
(%DM) Ash
(%DM) Maize silage 91.8 6.9 91.0 8.9 Noug cake 93.7 35.0 89.9 10.0
Cotton seed cake 93.8 31.0 92.8 7.1 Linseed cake 93.5 29.9 91.3 8.7
DM=Dry Matter; CP=Crude Protein; and OM=Organic Matter; Feed Intake The observed average daily maize silage intakes by the experimental animals are presented in Table 4. Treatment effect was highly significant (p<0.0001) in affecting daily maize silage intake. In the present study, there were statistically significant differences in daily maize silage intake among the four dietary treatments. The study also showed a considerable increase in maize silage intake as a result of supplementation of linseed cake was highest (32.5 kg) followed by cotton seed cake (30.5 kg).The lowest (27.3 kg) maize silage intake was observed for cows fed without supplement while the lowest (29.5 kg) maize silage intake from among the supplemented group was observed for cows supplemented with noug cake.
Table 4. Effect of treatments on maize silage intake
Treatment Means maize silage (kg/day)
T1 27.3c T2 29.5b T3 30.5b T4 32.5a
Significance *** SE 3.35
abc= within column, means with different superscripts are significantly different. *** = P<0.0001, T1=Maize silage; T2= Maize silage + Noug cake; T3= Maize silage + Cotton seed cake; T4= Maize silage + Linseed cake; SE= Standard Error.

28
Milk yield and composition Daily milk yield and milk composition of cows fed on maize silage and supplemented with protein sources are presented in Table 5. The effect of dietary treatments on milk yield was highly significant (p< 0.0001). Cows fed maize silage with linseed cake gave the highest milk yield followed those supplemented with cotton seed cake. These findings were similar to the report of Sanz Sampelayo et al. (2007) where goats supplemented with linseed cake produced more milk than those supplemented with extracted rapeseed meal. This explained that productivity of ruminants is influenced primarily by feed intake, which in turn was determined by the digestibility and capacity of the diet to supply the correct balance of nutrients required (Preston and Leng, 1987).The least (7.03 kg) milk yield was recorded from cows fed on maize silage alone. However, from the three protein supplemented group, the least (9.21 kg) daily milk yield was recorded from cows fed on maize silage with noug cake. Treatment effects on milk fat, protein, solids- not- fat and total solids were not significant (p>0.05). Similar with the present study, Petit (2010)reported that feeding diets with whole or crushed or micronized linseed had no effect on the milk protein content in mid lactation of dairy cows. However, the lactose content was significantly (p<0.05) influenced by treatment. Cows fed on maize silage supplemented with linseed cake showed the highest (4.67%) lactose content followed by cotton seed cake (4.60%) whereas the least (4.40%) was recorded for those cows fed on maize silage alone. Table 5. Daily milk yield and composition from cows fed on maize silage
supplemented with different protein sources
Treatments Mean
milk yield (kg)
Milk composition (%) Fat Protein SNF TS Lactose
T1 7.03c 3.79 2.98 8.12 11.90 4.40b T2 9.21b 4.18 3.05 8.35 12.55 4.58ab T3 10.86a 4.15 3.05 8.36 12.50 4.60a T4 11.31a 3.94 3.09 8.50 12.45 4.67a
Significance *** NS NS NS NS * SE 1.8 0.39 0.13 0.39 0.72 0.18
abc= within column, means with different superscripts are significantly different,* = P<0.05, *** = P<0.0001; T1= Maize silage (control); T2= Maize silage + Noug cake; T3= Maize silage + Cotton seed cake; T4=Maize silage + Linseed cake;; TS=Total Solids; SNF= Solid-Non-Fat; NS= Not Significant. SE= Standard Error.

29
Body weight change of cows The body weight changes of cows are presented in Table 6. The effects of dietary treatments on body weight change of cows were highly significant (p< 0.0001) among the treatments. Dietary treatments were showed gain or no loss of weight to the experimental cows. The loss of weight was recorded in cows fed on maize silage alone (-20 kg). Highest (28.75 kg) weight gain was recorded in cotton seed cake supplemented cows compare to noug cake (23.75 kg) and linseed seed cake (23.75 kg) supplemented cows.
Table 6: Effects of feeding maize silage and protein sources on body weight change of cows
Treatment Number of cow BW change / treatment (kg)
T1 4 -20.00c T2 4 23.75b T3 4 28.75a T4 4 23.75b
Significance *** SE 7.90
abc = Means with different superscripts with in columns are significantly different, *** = P<0.0001; T1=Maize silage (Control); T2= Maize silage + Noug seed cake; T3= Maize silage + Cotton seed cake; T4= Maize silage + Linseed cake; BW= Body Weight
References
Ahmed M, MS Ehui, and Y Assefa. 2003. Dairy Development in Ethiopia. Socio
economicsand Policy Research Working Paper 58. ILRI (International Livestock Research Institute), Nairobi
El-Ashry M.A, IA Abou-Selim, HM El-Sayed, and AA El-Aidy. 2003. Effect of maize silage with berseem on the productive performance of dairy buffaloes. Egyptian J. Nutrition and Feeds.6 (1): 25-36.
Garcia SC, FJ Santin, and JC Elizalde. 2000. Sites of digestion and bacterial protein synthesis in dairy heifers fed fresh oats with or without corn or barley grain. J. Dairy Sci., 83:746-755.
Hadjipanayiotou M. 1984. The use of poultry litter as ruminant feed in Cyprus. World Animal Review,49: 32-38.

30
McDonald P, RA Edwards, JFD Greenhalgh, CA Morgan. 2002. Animal Nutrition (6thed.). Pearson Educational Limited. Edinburgh, Great Britain. pp 544.
Mohamed SA, MK Mohsen, MM Bendary, EM Abdel-Raouf, and HMA Gaafar. 2003. Performance of growing Friesian calves fed rations containing corn silage- Blood constituents and carcass traits. Egyptian J, Nutrition and Feeds,6: 727.
National Research Council. 1989. Nutrient Requirement of Dairy Cattle. Sixth Revised Edition, National academy Press, Washington
Petit HV. 2010. Review: feed intake, milk production and milk composition of dairy cows fed flaxseed. Can. J. Anim. Sci., 90: 115-127.
Preston TR and RA Leng. 1984. Supplementation of diets based on fibrous residues and by-products. In: Straw and other fibrous by-products as feed. Sundstol F. and Owen E.(eds). Elsevier, PP 373- 413.
Preston TR and RA Leng. 1987. Matching Ruminant Production Systems with Available Resources in the Tropics and Sub-Tropics. Penambul books, Armidale, New South Wales
SanzSmpelayo MR, Y Chilliard, PH Schmidely, and J Boza. 2007. Influence of type of diet on the fat constituents of goat and sheep milk. Small Ruminant Research 68: 42-63.
SAS (Statistical Analysis system Institute) 2002. SAS guide for personal computers. version 9. SAS Institute, Kary, NC. USA.

31
Milk Productivity of Boran-Friesian High Grade Crossbred Cows Supplemented with
Oilseed Cakes
Tadesse Bekele, Rehrahe Mesfin and Kefena Effa
Ethiopian Institute of Agricultural Research, Holetta Research Center, Ethiopia Email - [email protected]
Introduction Cattle in the tropics are mostly dependent on natural pastures and crop byproducts for feed. The crude protein content of the feed is often below 7.5%, which reduces rumen efficiency and the true digestibility of the feed. As a result, lactating cows are unable to meet their nutritional requirements and lose weight and condition during lactation. Cows with excessive weight loss and severe negative energy balance have irregular estrus periods and longer time to first ovulation and first breeding (Ferguson et a., 1991). Dairy cattle performances in terms of production, reproduction and survival mostly depend upon management and feeding. Genetic improvement of dairy cattle needs to be supported by proper nutrition and feeding in order to help the animal express its maximum production potential. Feeding of high producing lactating cows needs special attention due to heavy physiological burdens during lactation. One of the great challenges to dairy producers is to get cows consume sufficient amount of energy that supports milk production during early lactation. During early lactation, nutrient intake of cows lags behind requirement. As a result the cows face energy deficit, which obliges them to draw from body nutrient store. Lactating cows pass through different phases during lactation. These are peak milk production, maximum dry matter intake, body weight gain and dry period. During these phases, the cow is in the interplay of three or more physiological functions of feed intake, lactation, body weight change and reproduction. Several studies suggest that feed supplied in particular to cows postpartum should be enough to maintain body condition, to

32
support milk production, as well as to initiate ovarian cyclicity (Ghosh et al., 1993). Energy intake of lactating cows during early lactation may be increased by increasing energy density through feeding greater proportion of the diet in the form of fat, increasing the amount of readily fermentable carbohydrates (increasing concentrate : forage ratio) and using individual feeders (Schingoethe, 1998). Protein is critical nutrient in the diets of young and high producing cows (Church and Kellemes, 1998). Sources of protein diets are expensive in Ethiopia as elsewhere. Therefore, most producers either underfeed or never feed these diets to their cattle. This reduces productivity and survival of the dairy herd. All sources of protein diets are not equally useful, since most sources vary in their amino acid profile, rumen degradability and digestibility. Some protein sources may be deficient in several essential amino acids. In practical dairy diets the amino acids most likely deficient are Lysine, Methionine and Tryptophan. A greater production response may be obtained by supplementing with two to four amino acids that are likely to be limiting than by supplementing with only one amino acid. Protein sources of animal origin have low degradability values while plant protein sources have low values. Good quality protein sources must have rumen undegradability value of 35-40%. Protein supplements are feedstuffs that have 20% or more CP (DM basis) (Church and Kellemes, 1998). Digestibility and amino acid composition of bypass protein is very important .Rumen degradability is also important for increased rumen bacteria viability which helps for the increased flow of bacterial protein and increased cellulosic activity that supports increased feed intake and animal productivity. Selection of protein to use in a feed formula is affected by different considerations. The most important factors to be considered are availability, cost, amino acid content (for monogastric), and presence of toxic compounds in the diet and content of other nutrients in the protein diet. The most common protein sources in ruminant diets in Ethiopia include noug (Guizotia abyssinca), linseed, cotton, groundnut, peanut seed cake etc. These protein sources vary in their essential amino acid content and rumen degradability (Yoruk et al., 2006). However due to accessibility

33
and cost, producers mostly use noug seed cake. Cottonseed meal usually contains gossypol, unless it has been obtained from glandless (gossypol-free) seeds. Monogastric animals and young ruminants are highly susceptible to gossypol in cottonseed meal. Mature ruminant animals do not suffer from cottonseed meal consumption but it may affect their reproductive performance (European Commission, 2003). Small holder dairy cattle producers and medium to large scale producers depend upon different oil seed cakes as sources of protein supplements in Ethiopia. However, the effect of most oil seed cakes on lactation performances of high grade cows has not been studied and compared. The objective of this study was to evaluate the potential of some oil seed cakes based concentrate feed supplements on feed intake, milk production and milk composition of 75% BOF crossbred cows. Materials and Methods Experimental animals Ten 75% Friesian Boran crossbred cows from Holetta Research Center breeding herd were used in the study. Each of the experimental cows was assigned to the treatments right after calving. Experimental feeds Concentrate supplements were formulated based upon nutrient requirements for growth and milk production (Crampton and Harris, 1969). Formulated ration for supplementation in each treatment was shown in Table 1. Supplements were designated as treatments 1, 2, and 3 for Noug Seed Cake (NSC), Cotton Seed Cake (CSC) and Linseed Cake (LSC) based diets, respectively.
Table 1. Proportion of concentrate feeds used to formulate the treatment supplement diets
Feed Ingredients (%) Treatment
1 2 3 Wheat bran 69.0 79.0 69.0 Noug seed cake 30.0 --- --- Cotton seed cake) --- 20.0 --- Linseed cake --- --- 30 Salt 1.0 1.0 1.0

34
Feeding Concentrate was supplemented during milking (in the morning and evening) at the rate of 0.5 kg per liter of milk produced. Hay was offered ad lib in the morning and evenings following each milking in a tie stall. Feed offered and refusals were measured and recorded. Data collection and Laboratory analysis of milk samples Daily milk yield was recorded during every milking. Whole milk and skim milk samples were collected weekly for chemical analysis. Milk fat was analyzed using Gerber method (BSI, 1989). CP was determined using formaldehyde titration method according to the technique described by Pyne (1932). Total solid was determined by oven drying method (Marth, 1978). Data analysis GLM procedure of SAS (SAS, 2004) was used to analyze the data and Duncan’s multiple range tests was used to separate mean differences between supplement groups. Results and Discussions Results Mean daily milk yield and body weight gain of cows in the study are presented in Table 2. There were no marked differences in daily milk yield and body weight gain between cows supplemented with different oil seed cakes (P>0.05).However, cows supplemented with linseed cake numerically maintained better body weight as compared to either noug or cotton seed cake supplemented groups.
Table 2. Daily milk yield and body weight changes of cows fed with different supplement treatment diets
Treatment supplement diets Daily milk yield (l) Daily body weight gain
(g) Noug seed cake 5.92±0.71 105.74±54.48
Cotton seed cake 6.48±0.71 134.43±62.91
Linseed cake 5.32±0.5 172.68±62.9

35
Cows supplemented different oil seed cakes had different lactation curves during early lactation. Cotton seed cake supplemented cows had relatively higher lactation curve followed by those supplemented with noug seed cake. Cows supplemented linseed cake based diet had lower lactation curve. Linseed cake and cotton seed cake supplemented groups tended to have similar response, while those supplemented with noug cake exhibited declining lactation curve starting from 140 days of lactation. The amount of concentrate supplements consumed per unit of milk produced, which is usually expressed as feed conversion ratio was higher for linseed cake based diet followed by noug seed cake. Feed conversion ratio for milk production was the least for cotton seed cake based diets. Therefore, cows supplemented with cotton seed cake were more milk yield efficient followed by those supplemented with noug seed cake. Cows supplemented with linseed cake were less efficient in converting supplementary nutrients into milk. Cows supplemented with noug seed cake didn’t use any nutrients to be converted to body weights and were more body weight efficient followed by those supplemented with cottonseed cake. Linseed cake supplemented cows had higher amount of intake that might have been converted into body weights. Body weights of all cows during early lactation were very low and nearly similar for all cows in the study. However, body weights started to recover starting after five months in lactation. All cows had higher body weights towards the end of lactation. However, earlier body weight repletion and higher body weight gains were achieved for cows fed on linseed cake supplement. It took longer time for cows supplemented with cotton seed cake to replenish their body weight as compared to the other groups. However, these cows had attained similar weights with those supplemented with noug seed cake during late lactation. Compositions of milk produced from three diets are presented in Table 3. Fat, protein and total solid were similar in all treatments (P<0.05). However milk protein composition was numerically higher for cotton seed cake supplemented group than either noug seed cake or linseed cake supplemented group.

36
Table 1. Fat, protein and total solids contents of milks collected from cows
fed with different supplement treatment diets
Treatments supplement diets Number
Composition (%)
Fat Protein Total Solids
Noug seed Cake 4 4.18±0.19 2.65±0.13 12.46±0.33
Cotton seed cake 3 3.92±0.23 2.83±0.15 12.64±0.38
Linseed cake 3 4.11±0.23 2.60±0.15 12.62±0.38
Discussion Cows supplemented with linseed cake tended to produce higher daily milk yield as compared to noug seed cake supplemented group. However, these cows had higher daily concentrate intake, which might have contributed to relatively better milk yield. Therefore, more amount of milk produced might be due to the quantity of linseed cake supplement rather than linseed cake supplement per se. Feed conversion ratio of supplementary nutrients into milk yield was high for cows supplemented with cotton seed cake. This might be due to cotton seed cake’s protein characteristics of lower rumen degradability value as compared to the other oil seed cakes. Cows fed on cotton seed cake lost their body weight due to body nutrient mobilization for milk production, most probably due to low amount of the supplement as compared to the other dietary supplements. Cotton seed cake was also more efficient in maintaining cows’ body weight during lactation due to its rumen un-degradability factor. Cows supplemented with noug seed cakes were losing body weights during lactation, indicating that noug seed cake supplementation has failed to maintain cows’ body weight. Extent of body fattening is a function of both the genetic ability of the animal and the total energy in the diet. In addition to these factors physiological state of the animals influences the partition of nutrients between lactation, reproduction and body fat deposition (Bauman and Currie, 1980). Milk from cotton seed cake supplemented cows had numerically lower fat and higher CP content as compared to the other oil seed cakes.

37
References
Bauman E E and W B Currie. 1980. Partitioning of nutrients during pregnancy and
lactation: A review of mechanisms involving homeostasis and homeorhesis. J Dairy Sci 63:1514-1529
British Standard Institute. 1989. Determination of fat content of milk and milk products (Gerber Method). British Standard. BSI 696. Part II.
Church DC and RO Kellemes.1998. Supplemrntal protein sources. In: Kellemes RO and DC. Church (ed). Livestock feeds and feeding. 4th Ed. Printice Hall, Upper Saddle River, N.J.
Crampton EW and LE Harris. 1969. Nutrient needs of animals: The use of feed staffs in the formulation of livestock ration. In: Salisbury GW and EW Crampton (eds). W.H. Freeman and Co. U.S.A.
European Comission.2013. http://www.feedipedia.org/node/16102. Last updated on December 23, 2013, 16:03.
Ferguson JD and W Chalupa. 1991. Impact of protein nutrition on reproduction in dairy cows. J. Dairy Sci. 1991.2580-2587.
Ghosh A, MGS Alam, and MA Akbar. 1993: Effect of urea-molasses-mineral block supplementation in postpartum ovarian activity in zebu cows. Animal Reproduction Science 31 61-67.
Marth H. 1978. Standard method for the examination of dairy products. 14th Ed. American Public Health Association. Washington, D.C.
Pyne GT. 1932. The determination of milk proteins by formaldehyde titration. Biochem. J. 26:1006-1014.
SAS. 2004. User's Guide. Statistics Ver.8 SAS Institute INC. Cary NC.
Schingoethe DJ. 1998. Feeding dairy cows. In: Richard O. Kellemes and DC Church (eds).Livestock feeds and feeding. 4th Ed. Printice Hall, Upper Saddle River, N.J.
Yoruk MA, T Aksu, M Gul, D Bolat. 2006. The effect of soybean meal treated with formaldehyde on amount of protected protein in the rumen and absorption of amino acid from small intestine. Turk J Vet Anim. Sci. 30:457-463.

39
Biological Performance and Economic Benefits of Different Diets in Fattening
Arsi-Bale Lambs
Getahun Kebede
Ethiopian Institute of Agricultural Research, Debre Zeit Research Centre, Ethiopia Email: [email protected]
Introduction In Ethiopia, the production and productivity of sheep is hampered both by environmental and genetic factors. Inadequate nutrition is the most influential factor, adversely affecting the expression of potential productivity of farm animals, besides the effects of disease and parasitic burden. There are genetically distinct sheep breeds in Ethiopia with the majority (75%) of population being raised in the highlands mainly under unimproved husbandry practices. The present productivity index of sheep is low, growing annually at a rate of 1% with a mean carcass weight of 10 kg per head. The number of sheep held by a household in highlands showed sharp reduction since the past three decades due to expansion of cropping at the expense of pasturelands. Sheep are underfed particularly during the dry season; when dry roughages represent most of the available feeds and animals are hardly supplemented with energy and protein rich feeds, leading to sever performance loss. The roughages used to feed livestock in sub-Saharan Africa are deficient in nitrogen, energy, vitamins and minerals (Kabaiji and Little 1988), supporting little of maintenance requirement. Due to inadequate nutrition, meat animals maintained on low quality roughages grow at slow rate, taking longer days to attain market weight and body condition. Cost of feed production is becoming a single unit affecting the potential benefit derived from improved livestock farming in Ethiopia. In some areas, existing livestock farms have been withdrawn from their operation and farm establishment is not encouraging due to ever increase in feed cost. In mixed crop-livestock production system, production of improved forage crops is at a limited scale as priority is

40
given to food-crop production and forage production is less integrated with it. Various agro-industrial by-products are available and used to supplement farm animals. Differing with locations and seasons, wheat-and maize bran and middling and oil seed cakes are produced. However, timely increase in price of these concentrates and its limited availability affected most smallholder livestock producers. For instance, the price of wheat bran and noug seed cake has increased two-to-three fold within the last five years. Nevertheless, feeding grain-based diets for ruminants is not practical and unaffordable by most smallholder farmers owing to ever increasing human population. However, there are a number of non-conventional feed resources in Ethiopia that are moderate in nutritive value, but not well-utilized. These include home-made brewery and distillery by-products, poultry litter, pulse grain hulls, fruit and vegetable by-products, coffee pulp, sisal, cactus, duckweed, moringa and fish offal (Negese et al., 2009; Yoseph et al., 2002). Industrial by-products such as molasses, bagasse and cane top, and fodder trees are also potential feed resources. Improved use of these feed resources could help improve feed availability and also increases the net benefit of production by reducing feed cost. However, these feeds are less considered in ration formulation. Previous studies (Getahun, 2014; Solomon, 2004; Nigussie et al., 2000; Kaitho et al., 1998a; Ben Salem et al., 2004) have shown the paramount importance of these feedstuffs as supplemented to sheep fed on roughages. Apart from fragmented studies, little was known on effect of replacing costly conventional concentrate with non-conventional feeds on animal performance and economic benefit. Hence, developing alternatively low-cost ration using non-conventional feeds improves feed availability, reduces cost per unit of animal product and creates market opportunity for the by-products. This study was aimed to replace locally available conventional concentrates with non-conventional ones and evaluate level of consumption and performances of meat sheep.
Materials and Methods
Animals, Diets and Feeding Procedure The experiment was conducted Debre Zeit Agricultural Research Center's sheep research unit, located at 45 km South East of Addis

41
Ababa, Ethiopia. A total of 20 yearling male Arsi-Bale lambs, weighing 14.75±1.25 kg were purchased from local market for the study. All animals were treated with anti-parasitic drugs and vaccinated for common viral diseases before commencing the experiment. After adaptation to pen management and experimental diets (15 days), the animals were allotted to three dietary treatments in Complete Randomized Design, and fed for three months. The diets were formulated from different feedstuffs, incorporating each ingredient at its safest limit and leading to low-cost alternative diets (Table1). The conventional concentrate (wheat bran + noug seed cake + salt) supplemented to animals in Diet1(control) was either entirely or partially replaced with alternative feeds such as molasses, local brewery residues (Tela atela), poultry litter and/or Leucaena pallida leaf hay to formulate Diet2 and diet3. Wet brewery residues were collected from local cottage industries and air dried (under shade) before use, while poultry litter was taken from poultry research farm and treated in similar manner. All diets were iso-nitrogenous and iso-caloric, meeting CP and ME requirements for growing tropical sheep (8.4 MJ ME/kg DM and 11% CP) (Kearl, 1982), including 1% safety factor to allow for variable feed composition. The diets constituted of 60-61% roughage (tef straw) and 39-40% of supplement. To avoid risks of feed poisoning, the amount of molasses used in the concentrate mix was determined and blended daily just before feeding, making no use of unfed mix on the following day. The magnitude of daily feed offer (dry matter basis) to each lamb was adjusted weekly at a rate of 3.6% live weight. Tef straw was fed free of choice to all animals, while concentrate mix was supplemented twice daily at 9:00 am and 2:00 pm. Feed offered and refusals were measured and recorded daily, while representative samples were taken per animals, pooled and sub-sampled per treatment pending chemical analysis. Live weight of experimental lambs was taken fortnightly after overnight fasting (~16 hr). Digestibility Trial and Carcass Analysis At the end of feeding period, three animals were randomly selected per treatment and transferred to metabolic crates for digestibility trial. Fecal bags and urine funnels were harnessed to each lamb. The animals were adapted to the cage for three days, followed by collection of feces and urine for 7 days. The experimental animals were fed the respective diets and the daily amount offered and orts were measured to determine intake. Urine excreted from each animal was directly poured into a

42
bottle containing 2ml of sulfuric acid (98%), to prevent nitrogen loss in the form of ammonia. The daily amounts of urine and feces produced was recorded, of which 10% was sampled per animal and stored in deep freezer (-21oC), pending chemical analysis.
Table 1. Composition of test diets fed to experimental lambs
Item (% of DM) Diet Diet 1 Diet 2 Diet 3
Diet composition (%) Tef straw 60.3 61.4 61.3 Noug seed cake 13.3 6.2 8.1 Wheat bran 26 0 0 Molasses 0 6.2 6.2 Dried brewery residue (Tela atela) 0 15.8 0 Poultry litter 0 10 7 Leucaena pallida leaf hay 0 0 17 Salt 0.4 0.4 0.4 Total 100% 100% 100%
Chemical composition DM (%) 91.6 90.0 90.2 OM (% DM) 92.39 90.24 89.75 CP (% DM) 11.07 11.08 11.02 NDF (% DM) 70.67 67.53 56.42 ADF (% DM) 40.08 36.40 33.44 Lignin (% DM) 8.41 7.77 7.30 ME (Mj/kg DM) 8.47 8.06 8.04
On the other hand, three of the remaining experimental lambs were randomly selected per treatment and transported to nearby Abattoir for slaughtering and carcass analysis. The animals were starved for about 24 hr and weighed before slaughtering. Edible and non-edible carcasses and offal were sorted, weighed and recorded for each animal. In the meantime, hot carcass weight (HCW) was taken for each animal, followed by dissecting the carcass carefully at median line into left and right part. The left side of the carcass was chilled at 2oC for 24 hr followed by deboning into carcass tissues (bone, fat and lean). The magnitude of carcass components in the left half carcass was doubled to give its share in the whole carcass for each animal. Dressing percentage was determined as the proportion of hot carcass weight to slaughter weight.

43
Sample Chemical Analysis Feeds and fecal samples were analyzed for DM, OM and CP contents using the standard procedures of AOAC (1990) and for NDF, ADF ADL and Lignin contents using the procedures of Van Soest (1991). Similarly, urine samples were analyzed for nitrogen content, and CP for each sample was determined by multiplying % N by 6.25. Data Analysis Data were analyzed using the GLM procedure of SAS (2003). Treatment means were separated using LSD test. Data on feed cost was summarized using simple statistics. Results and Discussion Feed intake Availability of various non-conventional feed resources of better nutritional quality which can substantially contribute to feed supply have been reported in Ethiopia (Negese et al., 2009; Mekasha et al., 2002). In the present study, the extent of feed intake, live weight change and feed conversion efficiency of lambs fed on experimental diets are shown in Table 2. Dry matter intake was significantly (p<0.001) different among treatments. Lambs maintained on diet3 consumed higher dry matter (649.8g/day) compared to lambs fed on Diet1 and Diet2. Improvement in feed intake was observed as the alternative feeds replaced part of noug seed cake and wheat bran, remarkably with inclusion of leucaena. Similarly, intake of CP and ME were highest (P<0.001) for lambs maintained on Diet3, implying that alternative diets containing molasses and leucaena foliage might have favored rumen fermentation and DM digestibility. Improved feed intake and performances of sheep supplemented with leucaena foliage hay was reported elsewhere (Bonsi et al 1995; Kaitho et al 1998a; Nigussie et al 2000; Solomon 2004; Getahun 2014), indicating the potential importance of leucaena as a protein supplement. However, there was no difference (P>0.05) between Diet1 and Diet2 in intake of DM, CP and ME, where leucaena foliage was not included. Lower intake of DM and CP were observed for diet2 compared to diet3, which could be due to high fiber (NDF) content of the former diet that might be contributed by brewery residue (Tegene et al., 2009). The nutritional quality of brewery residues is affected by type of ingredients used and processing methods

44
(Beker, 1985). Mekasha et al (2002) reported improved feed DM and N intake in sheep supplemented with brewery residues on native hay. Similarly, lactating dairy cows fed brewery residue based diets had shown improved DM consumption (Senthilkumar et al., 2012), while Dhiman et al (2003) reported unimproved DM intake of lactating dairy cows upon inclusion of the residue.
Table 2. Nutrient intake and growth of lambs maintained on experimental diets (mean± se)
Measurement Diet 1 Diet 2 Diet 3 P-value N 7 6 7
DMI (g/day) 587.42±2.85b 589.30±3.32b 649.77±2.99a <0.001
CPI (g/day) 66.71±0.24b 66.08±0.28b 71.06±0.25a <0.001
MEI (MJ/day) 5.01±0.02b 4.99±0.02b 5.48±0.02a <0.001
Initial LWT (kg) 14.79±0.49 14.58±0.53 14.86±0.49 0.9292
Final LWT (kg) 19.04±0.62 19.67±0.67 19.79±0.62 0.6660
LWT gain (kg) 4.25±0.43 5.08±0.46 4.93±0.43 0.3828
ADG (g/day) 47.28±1.72c 56.24±2.01a 54.86±1.81ab 0.0007
FCE (g gain /g DMI) 0.082±0.003b 0.093±0.003a 0.086±0.003ab 0.0507 Values with different letters within same row are significantly different; ADG= average daily gain; DMI= dry matter intake; CPI= crude protein intake; MEI= metabolisable energy intake; FCE= feed conversion efficiency; N=number of lambs; LWT= live weight
Live weight change The ADG of lambs was significantly (p=0.001) higher in lambs fed on diet2 (56.24 g/day) and diet3 (54.86g/day) compared to those fed on diet1 (47.28g/day). There was no significant difference (p>0.05) among the diets in final live weight and total gain of lambs. However, lambs on alternative diets grew relatively better than those on control, gaining 4.93 to 5.08 kg live weight. The mean live weight of lambs was increasing over the feeding period, except that it declined for diet1 between day 14th and 28th. Lambs on diet3 performed higher than those on diet1 and diet2. Feed conversion efficiency was higher (p<0.05) with alternative diets (diet2: p =0.093; diet3=0.086) than the control (p=0.082), indicating increased production per unit of alternative feeds used. Studies have shown improved performances of sheep due to inclusion of leucaena foliage (Bonsi et al., 1995; Kaitho et al., 1998a;

45
Nigussie et al., 2000; Shenkoru and Mekonnen 1994; Solomon 2004; Getahun, 2014) and brewery residues (Mekasha et al., 2002) in the diet. As evident from the present result, replacing noug seed cake and wheat bran of conventional concentrate with mixture of molasses, poultry litter, leucaena foliage and brewery residues improves growth performances of sheep.
Table 3. Apparent digestibility of nutrients and nitrogen utilization
Parameter T1 (n=3)
T2 (n=3)
T3 (n=3) SEM p-value
DM 64.26c 81.02a 73.38b 1.93 <.001 CP 74.49b 81.40a 82.05a 1.52 0.0012 ASH 39.72b 65.25a 62.88a 3.02 <.001 OM 66.36c 82.65a 74.48b 1.83 <.001 NDF 66.95c 83.00a 73.76b 1.84 <.001 ADF 57.03c 77.77a 68.31b 2.33 <.001 Hemicelluloses 79.26b 89.32a 81.56b 1.21 <.001 Lignin 46.44c 73.24a 61.66b 2.87 <.001 Intake of N (g d-1) 11.93c 13.56b 15.25a 0.24 <.001 Fecal N (g d-1) 3.04a 2.52a 2.74a 0.21 0.2381 Urinary N (g d-1) 0.09a 0.097a 0.13a 0.01 0.1424 Total N excreted (g d-1) 3.13a 2.61a 2.87a 0.21 0.2366 N balance (g d-1) 8.79c 10.95b 12.38a 0.29 <.0001 Values with different letters within same row are significantly different; DM=Dry matter; CP= Crude protein; OM=Organic matter; NDF = Neutral detergent fiber; ADF= Acid detergent fiber; N=nitrogen; SEM =Standard error of mean; n= number of lambs
Digestibility and nitrogen utilization There was a significant difference (p<0.001) among treatments in apparent digestibility of nutrients (Table 3). The digestibility of DM, CP, OM, Ash and fiber fractions (except hemicelluloses) were higher for alternative diets than control. The DM digestibility was increased by 14.2% in diet2 and by 26.08% in diet3 over the control. However, diet2 was superior to diet3 in the digestibility of DM, OM and fiber fractions. The comparative increase of fiber digestibility for diet2 compared to diet3 might be associated with higher soluble carbohydrate contributed by brewery residue in diet2, or high fiber fractions contributed by leucaena foliage in diet3. The increment in nutrient digestibility of

46
alternative diets compared to the control shows the potential importance of non-conventional feeds in the degree of utilization by animals. Higher level of feed N consumption (P<0.0001) was observed in lambs fed on alternative diets than those on control. There was no significant variation among treatments in the excretion of daily fecal N (P=0.2381), urinary N (P=0.1424) and total N (P=0.2366). Lambs fed on alternative diets have shown higher N balance (diet2 =10.95 g/day; diet3=12.30 g/day; P<0.001) than those fed on diet1 (8.79 g/day). The higher nitrogen balance observed with alternative diets has a positive synchronized the corresponding improvements in growth performances.
Table 4. Results of carcass parameters measured for Arsi–Bale lambs supplemented with different concentrate feeds at Debre Zeit
Parameter T1 (n=3)
T2 (n=3)
T3 (n=3) SEM P-value
SW (kg) 18.92 18.83 18.50 1.02 0.9544 HCW (kg) 6.93 7.27 6.87 0.46 0.8123 Total edible of offal 3.09 2.91 3.00 0.14 0.6675 Gut fill total 5.38 5.11 5.19 0.36 0.8612 Total non-edible offal 8.90 8.66 8.63 0.51 0.9238 DP (%) 36.57 38.60 37.11 1.14 0.4707 Lean (kg) 3.88 4.27 4.07 0.21 0.4812 Fat (kg) 0.46 0.53 0.43 0.11 0.7973 Bone (kg) 2.34 2.13 2.15 0.13 0.4985 LBR 1.70 2.02 1.90 0.12 0.2762 LFR 9.33 8.22 11.56 2.06 0.5420
SW=slaughter weight; HCW= hot carcass weight; DP= dressing percent ((HCW/SW)*100); LBR= lean to bone ratio; LFR=lean to fat ratio; n= number of lambs slaughtered
Carcass characteristics Table 4 shows mean values of carcass traits for the slaughtered experimental animals. There was no variation (P>0.05) among the treatments in the magnitude of carcass traits. The average hot carcass weight was 6.93, 7.27 and 6.87 kg with dressing percentage being 36.57, 38.60 and 37.11 for lambs fed on diet 1, 2 and 3, respectively. Although there was no difference (P>0.05) among the treatments in the proportion of lean, fat and bone tissues, higher lean to fat ratio was

47
observed in T3 (11.56) compared to T2 (8.22) and T1 (9.33), indicating that carcass leanness is favored by inclusion of leaucana foliage in the diet. Cost of feeding Feeding costs were estimated based on the then market price of feed items (Table 5). Cost of production of diet2 and diet3 were 11 to 15% lower per kg DM than that of control diet. Reduction in the cost of production of alternative diets was due to inclusion of relatively cheaper feed items, replacing noug seed cake and wheat bran. Moreover, due to difference in DM consumption among treatments, costs of alternative diets were lower by 9 to 24% per lamb over the feeding period, or 21 to 26% lower per kg of live weight gain compared to the control group.
Table 5. Estimation of cost of feeding for experimental diets
Items Diet T1 Diet T2 Diet T3
Price/Kg DM, Birr 2.67 2.37 2.27 *% reduction in feed cost/Kg DM - 11.21 15.01 Total DM consumed, Kg 373.93 319.37 400.50 Total cost of feed DM, Birr 997.27 756.31 907.80 *% reduction in total feed cost - 24.16 8.97 Weight gained/lamb, Kg 4.25 5.08 4.93 Cost of feed/lamb, Birr 142.47 126.05 129.69 Cost feed /kg gain, Birr 33.52 24.81 26.31 The then purchase prices of feed items (birr/Kg DM): Tef straw=1.66; Noug seed cake =5.48; Wheat bran=3.54; Molasses=1.09; Brewery residue (tela atela) = 4.44; Poultry litter = 2.22; Leucaena pallid leaf hay=3.32; salt=3.65; *Calculated in relation to control (Diet1)
References
AOAC (Association of Official Analytical Chemists), 1990. Official method of
analysis. 15th ed. AOAC Inc., Arlington, Virginia, USA. pp. 12-98.
Beker Ali. 1985. Evaluation of the nutritive value of brewers’ grain to chicks. M.Sc. Thesis. Addis Ababa University, 1 pp.

48
Ben Salem H, HPS Makkar, A Nefzaoui. 2004. Towards better utilization of non-conventional feed sources by sheep and goats in some African and Asian countries. In: Ben Salem H, A Nefzaoui. P Morand-Fehr (eds). Nutrition and feeding strategies of sheep and goats under harsh climates. Zaragoza: CIHEAM,. p. 177-187 (Méditerranéennes: Série A. Séminaires Méditerranéens; n. 59). http://om.cih eam.org/article.ph p?ID PD F=460002 6
Bonsi MLK, PO Osuji, and Ak Tuah. 1995. Effect of supplementing teff straw with different levels of leucaena or susbania on the degradabilities of teff straw, Sesbania, Leucaena, Tagusastae and Nermonia and on certain rumen and blood metabolites in Ethiopian Menz sheep. Animal Feed Science and Technology 52: 101-129.
Dhiman TR, HR Bingham, and HD. Radloff. 2003. Production Response of Lactating Cows Fed Dried Versus Wet Brewers’ Grain in Diets with Similar Dry Matter Content J. Dairy Sci. 86 (9):2914–2921.
Getahun Kebede, 2014. Effect of wheat straw urea treatment and Leucaena leucocephala foliage hay supplementation on intake, digestibility, nitrogen balance and growth of lambs. International J. of Livestock Production, Vol. 6(4): 88-96.
Kearl LC. 1982. Nutrient Requirements of Ruminants in Developing countries. International Feedstuffs Institute, Utah State University, Logan, Utah 84322, USA.
Kabaiji E and Little DA. 1988. Nutrient quality of forages in Ethiopia with particular reference to mineral elements; In: BH Dzowela (ed), Pasture Network for Eastern and Southern Africa (Panesa). Proceeding of 3rd workshop, Arusha, Tanzania, 27-30 April,1987.ILCA,AddisAbaba.pp.440-448. http://www.fao.org/Wairdocs/ILRI/x5491E/x5491e18.htm
Kaitho RJ, NN Umunna, IV Nsahlai, S Tamminga,and J Van Bruchem. 1998. Effect of feeding graded levels of Leucaena leucocephala, Leucaena pallida, Sesbania sesban and Chamaecytisus palmenesis supplements to teff straw given to Ethiopian highland sheep. Animal Feed Science and Technology 72:355-366.
Negussie Dana, Azage Tegegne and Teshome Shenkoru, 2000. Feed intake, sperm output and seminal characteristics of Ethiopian highland sheep supplemented with different levels of L. leucocephala leaf hay. Animal Feed Science and Technology 86 (3/4):239-249.
SAS(Statistical Analysis System).2003. SAS Institute. Inc., Cary, NC, USA.
Senthilkumar S, TV Viswanathan, AD Mercy, P Gangadevi, K Ally, and PT Philomina. 2012. Economics of Feeding Brewery Waste in Lactating Cows. Tamilnadu J. Veterinary and Animal Sciences 8(5): 286-289.
Shenkoru T and Mekonnen G. 1994. The effect of Leucaena supplementation on the feeding value of chick pea (Cicer ariettinum L.) haulm to sheep. Tropical Agriculture. Trinidad 71:66-70.

49
Solomon Melaku, 2004. Feed intake, digestion kinetics and rumen volatile fatty acids
in Menz rams supplemented with Lablab purpureus or graded levels of Leucaena pallida 14203 and sesbania sesban 1198. Animal Feed Science and Technology.117:61-73.
Tegene Negesse, HPS Makkar, and K Becker. 2009. Nutritive value of some non-conventional feed resourcesof Ethiopia determined by chemical analyses and an in vitro gas method. Animal Feed Science and Technology 154: 204–217.
Van Soest PJ, JB Robertson, BA Lewis. 1991. Methods for dietary fiber, neutral detergent fiber and non-starch polysaccharides in relation to animal nutrition. J. Dairy Sci. 74, 3583-3597.
Yoseph Mekasha, Azage Tegegne, Alemu Yami, and NN Umunna. 2002. Evaluation of non-conventional agro-industrial by-products as supplementary feeds for ruminants: in vitro and metabolism study with sheep. Small Ruminant Research 44: 25–35.

51
Rearing High Grade Breeding Dairy Bulls with Protein Supplements
Tadesse Bekele
Ethiopian Institute of Agricultural Research, Holetta Research Center, Ethiopia Email - [email protected]
Introduction Breeding bulls are important sources of genetic materials for sustainable productivity in dairy cattle farms. Rearing of breeding bulls involve selection during calf hood, rearing, health care and training for semen collection and evaluation. The bull can be either used for natural mating or semen collection for AI service. High pedigree bulls mostly go through these processes. Under farmers’ conditions, there are a number of problems associated with breeding bulls. The major ones include bulls’ aggressive behavior, lack of restraining facilities, disease transmission, lack of feeding management skill, health management, and lack of keeping record. Therefore, it is important to improve bull performance for accelerated growth, less body fat deposition, normal body condition (without under nutrition), with sound breeding performance. Therefore, it is necessary to improve rearing practices to obtain breeding bull with accelerated growth, normal body condition, and sound breeding performances. In order to achieve the aforementioned goals, bulls need improved feeding, housing, health care and up to date pedigree record. The most important limiting nutrients in rearing young breeding bulls are proteins, energy, minerals and vitamins. These nutrients can be obtained from supplements, green legumes, roughages, green fodders and pastures. One of the important nutrients that affect young bull growth is protein. Protein diets have complex characteristics in ruminant nutrition. Because this feed staff is expensive, there is high competition between humans and animals.

52
Protein quality is based upon rumen degradability, composition of essential amino acid composition which if excess will be execrated to the environment, and there is no control over partitioning the amino acids to the desired production target. In Ethiopia, potential protein sources for ruminant nutrition include forage legumes, shrubs, trees (improved/indigenous) and agro industrial by products. Popular agro industrial by products used as protein sources include noug (Guizotia abyssinca), cotton, linseed, groundnut, sesame, and peanut seed cakes. However, information on the effect of using oil seed cakes on the growth and reproductive performances of breeding bulls is limited in Ethiopia.. The objective of this study was to rear and evaluate growth and reproductive performances of high grade (75% exotic blood level) breeding bulls under supplementation with different protein sources. Materials and Methods Animals Ten yearling 75% Friesian Boran breeding bulls from Holetta Research Center were employed for this study. Bulls were divided into three treatment groups starting at one year of age. Management Bulls were housed and fed with some exercise during daily watering. Feed refusals, manure and feces were cleaned twice daily. The floor was allowed to stay dry all the time except in the nights. Feeding Bulls were fed natural pasture hay twice daily. Concentrate mixture was offered only once in the morning based on computations made from NRC Nutrient Requirement table on body weight basis. Treatments Experimental treatments were based upon feed mixtures formulated and varied by protein sources (Table 1). Therefore, protein sources of noug seed cake, linseed, and cotton seed cakes were used as treatments A, B and C, respectively. Concentrate: roughage ratios in the feeding treatment groups were 38:62, 35:65 and 38:62 for treatments A, B, and C, respectively.

53
Table 1. Proportion of feed ingredients used to formulate the supplement treatment diets
Supplement feed ingredients Treatment diets
(Supplement Feeds) A B C
Wheat bran 62.00 60.00 70.00 Noug seed cake 35.00 ---- ---- Linseed cake ---- 37.00 ---- Cottonseed cake ---- ---- 27.00 Salt 3.00 3.00 3.00 Concentrate: Roughage ratio 38:62 35:65 38:62
Data Analysis GLM procedure of SAS (SAS, 2004) was used. Yearling weight was used as a covariate for two year weight, weight change and mean daily weight gain. Duncan’s multiple range test was used to separate means. Results Least square mean daily feed consumption of bulls in the study is presented in Table 2. There were no marked differences in concentrate, hay and Total Dry Matter (TDM) intake between different oil seed cake based supplements (P>0.05).However, bulls reared on linseed cake supplement had numerically lower concentrate, hay and TDM intakes than the other supplemented groups.
Table 2. Least square mean daily dry matter feed intake of bulls fed with treatment supplement diets
Treatment Number Feed intake (kg on DM basis)
Concentrate Hay Total A 3 3.67±0.33 4.56±0.50 7.91±0.79 B 3 2.93±0.33 4.37±0.50 7.03±0.79 C 4 3.68±0.29 4.75±0.43 8.11±0.69
Mean 10 3.14 4.58 7.72 CV% 16.52 18.78 17.75
R2 0.34 0.05 0.14 Means with the same superscripts within columns are not significantly different (P>0.05)

54
Least square mean body weight attained at two years of age, body weight change and daily gains of bulls in the study are presented in Table 3. There were no marked differences in body weight attained at two years of age, body weight change and daily weight gains between different oil seed cake based supplements during the feeding period (P>0.05).However, bulls reared on linseed cake supplement had lower body weight attained at two years of age and daily weight gain than noug or cotton seed cake supplemented groups.
Table 3. Least square mean body weights of bulls fed with different supplement treatment diets
Treatment Number Two years weight (kg)
Weight change
(kg)
Mean daily weight gain
(g) 1 3 529.02±22.38 238.32±22.38 653±0.06
2 3 475.92±22.00 185.22±22.00 507±0.06
3 4 538.61±19.75 247.91±19.75 679±0.05
Overall mean 10 516.93 226.23 620
CV% 7.32 16.72 1 6.72
R2 0.88 0.65 0.65
Means with the same superscripts within columns are not significantly different (P>0.05)
Bulls reared using cottonseed cake supplementation had numerically the highest body weight change and daily body weight gain followed by the noug seed cake supplemented group. However, difference between three oil seed cakes supplemented group was not significant (P>0.05). Mean daily body weight gain for bulls supplemented with linseed cake based diet was numerically the least. Gross efficiency of feed conversion ratio in terms of body weight gain is presented in Table 4. There was no marked difference between treatments in the amount of concentrate, hay and total feed consumed per gram of daily body weight gain (P>0.05). However, feed intake per daily body weight gain for bulls supplemented with linseed cake was numerically the least as compared to that of noug and cotton seed cake supplemented bulls.

55
Table 4. Feed conversion ratio of bulls fed with different supplement treatment diets
Treatment Number Concentrate as fed per gain (g)
Hay as fed per gain (g)
Total feed per gain (g)
1 3 3.18±0.058 4.50±0.000021 7.00±0.052
2 3 2.67±0.058 4.50±0.000021 6.54±0.052
3 4 3.11±0.05 4.50±0.000018 6.94±0.046
Overall mean 10 3.00 4.5 6.84
CV% 3.37 0.00079 1.33
R2 0.87 0.38 0.87
Means with the same superscripts within columns are not significantly different (P>0.05)
Regression of daily body weight gain on concentrate supplement is presented in Figure 1. Mean daily body weight gain of bulls was higher for bulls supplemented with linseed cake followed by cotton seed cake. Rate of body weight gain for bulls supplemented with noug cake based diet was the least. Bulls reared on noug seed cake supplement had the lowest growth rate relative to their total dry matter intake Regression of daily body weight gain on TDM intake is presented in figure 2. Bulls that were reared on cotton seed cake based supplement were gaining body weight as TDM intake was increased. However, bulls supplemented with linseed cake based diet had declining trend in rate of gain as daily TDM intake was increased. Bulls reared using noug seed cake based diet also showed decreasing rate of body weight gain despite increased TDM intake. However, rate of decrease in noug cake supplemented bulls was slower. Bulls reared using cottonseed cake supplementation had higher scrotal circumferences followed by those supplemented with noug cake. Regression of scrotal circumference on daily Concentrate Dry Matter (CDM) intake is presented in. Scrotal circumferences of bulls supplemented with noug cake were increasing at higher rate, while, scrotal circumference of bulls supplemented with cotton seed cake was relatively increasing at lower rate as CDM intake was increasing. On the other hand, scrotal circumference of bulls supplemented linseed cake had a declining growth trend as CDM intake was increasing. Regression

56
of daily weight gain on concentrate intake also supports this finding where the regression value for linseed cake supplement was the highest. Bulls supplemented with noug seed cake had declining rate of scrotal circumference growth as body weights of bulls were increasing, indicating that, increased amount of noug cake supplement doesn’t improve scrotal circumference.
.

57
Regression of scrotal circumference on daily body weight gain is presented in Figure 5. Bulls supplemented with cotton seed cake had increased growth of scrotal size as daily body weight gain was improved. However, bulls supplemented with linseed cake and noug seed cake had declining scrotal size as daily body weight gain of bulls was improved. Discussion Absence of statistically significant differences between noug linseed and cotton seed cake as a protein source for rearing breeding bulls in growth rate, feed efficiency and scrotal circumference indicates that protein nutrient available to be utilized by these animals doesn’t vary in terms of their effect on productivity. Similarly, there was no significance difference among the three dietary treatment groups (linseed, noug seed and cotton seed cake based diets) in final weight gain, average daily weight gain, and total weight gain of bulls in the feeding trial over 84, 112 and 224 days (Mieso et al, 2013). However, bulls reared under cotton seed cake supplement appeared to be performing better in terms of daily weight gain. However, if feed supplement intake is taken into account, bulls reared on linseed cake had the better growth performance despite lower intake. This indicates that linseed supplementation was more efficient than the other oil seed cakes in terms of bull growth. Relationships between Concentrate Dry Matter (CDM) intake and daily body weight gains were progressive for all oil seed cake supplements. However, feeding hay in addition to concentrates resulted in a declining relationship between TDM intake and daily body weight gain for bulls reared using noug seed cake as supplement. This indicates that supplementing noug cake beyond certain limit reduces its efficiency to be converted to body weight. Bull reproductive performance has positive relationship with body growth Bulls supplemented cotton seed cake based diet had relatively larger scrotal size indicating its suitability for improving bull reproduction performance. Linseed cake based diet is promising to improve bull growth; however, it has depressing effect on scrotal circumference as daily body weight

58
gain increases. Bulls reared on cotton seed cake based diet had lower growth rate, but had best scrotal circumference growth which has positive effect on fertility. Using cotton seed cake is as protein source is recommended to improve bull reproductive performance. However, further study is needed to identify semen characteristics of bulls reared under this feeding system. References
Mieso Gurmu, Girma Debele, Tesfaye Alemu Tucho, Frihiwot Messele and Tesfaye
Alemu Aredo.2013. Evaluation of different feeding options on yearling Borana bulls to attain export market weight at Adami Tulu Agricultural Research Center, Ethiopia. WWW.http://acascipub.com/Journals.php
SAS. 2004. User's Guide. Statistics Ver.8 SAS Institute INC. Cary NC.

59
Feeding Cows Maize Silage as a Sole Diet for Sensory Quality of Yoghurt and Cheese
Getenesh Teshome, Ashenafi Mengistu, Adey Melesse and Kassahun Melesse
Ethiopian Institute of Agricultural Research, Holetta Research center, Ethiopia
Email - [email protected]
Introduction The quality of dairy products can be strongly modified by animal diet, from both an intrinsic and extrinsic perspective. Animal feed can affect the chemical composition of milk; for example, the levels of fat, protein, vitamins or carotenoids, its ability to be processed into butter or cheese, and the sensory characteristics of the final product. In addition, feeding method also affects consumer perceptions of dairy products. The effect of feed type (e.g. maize silage vs. grass silage or hay) on milk composition is well known (Sutton, 1989, Coulon and Rémond 1991, Coulon et al., 1997), Even fewer data exist on the influence of pasture composition on the technological quality and sensory properties of dairy products, despite the fact that Cheese makers believe that animal diet has an important influence on cheese sensory properties (Urbach, 1990; Forss, 1993),Consumers have perceived differences in the sensory properties of milk, butter and cheeses, such as flavor, taste, color and texture. Conserved feeds such as silages are an integral part of dairy cattle diet in intensively managed peri-urban dairy farms, although the availability of maize silage to such dairy farms has not been well documented. Utilization of low quality roughages could be improved with supplementation of energy and nitrogen sources, chemical and/or physical treatment, and selection together with breeding of crops, which ultimately depend on the economic benefits and applicability (McDonald et al., 2002).Maize silage has low crude protein content and high energy content and ease of mechanization with which the whole plant can be ensiled to provide highly palatable source of energy and high quality forage (Mohamed et al., 2003).Silage protein quality represents perhaps the most important determinant of silage nutritive

60
value from an economic point of view. Therefore, this study was conducted with the objective of evaluating the effects of feeding maize silage as a sole diet and protein source on Effects of Feeding Maize Silage as a Sole Diet and Protein Sources on Sensory Quality of Cow Milk by Product Materials and Methods Experimental Animals and Management In the four months of feeding trial, four Holstein dairy-cows with similar lactation stage, exotic blood level, and parity were used. The cows were vaccinated against Foot and Mouth Disease (FMD), Blackleg, Anthrax and Bovine Pasteurellosis. California Mastitis Test (CMT) was conducted for all the experimental animals prior to the feeding trial and all the cows were found free of mastitis. The cows were fed and watered individually. Every morning the animals were visually inspected for signs of illness. Milking was done twice per day (at 6:00 AM in the morning and 4:00 PM in the evening) manually following recommended hygienic procedures. Experimental Diets Four feed types were considered for the study; namely, maize silage, noug cake, cotton seed cake and linseed cake. Maize silage was used as a basal diet whereas the rest three were protein supplements. The amounts of supplements were determined based on the protein requirements and milk yield of individual cows filling the protein gap from an average intake of maize silage in relation to average daily milk yield. The experimental diets were different protein supplement sources including T1 = control, T2 = noug seed cake, T3 = cotton seed cake and T4 = linseed cake. The experimental animals were feed a basal diet of maize silage. The protein supplements were offered in two portions at 8:00 AM and 3:00 PM. Clean water was made available at all the times. Experimental Design A change-over design (cross over design) was used for the feeding experiment with four dietary treatments assigned to each animal. The diets were arranged as one dietary treatment per period as shown in Table 1. The dairy cows were assigned and fed with four feed treatments for a period of 21 days to collect actual data feeding with an adaptation period of 7 days prior to each period.

61
Table 1. Treatment arrangements for experimental animals
Cow ID Feeding Period
1st 2nd 3rd 4th 64.2 T1 T2 T3 T4 92.7 T2 T3 T4 T1 68.6 T3 T4 T1 T2 65.4 T4 T1 T2 T3
T1= Maize silage unsupplemented; T2= Maize silage + Noug cake, T3= Maize silage+Cotton seed cake; T4= Maize silage +Linseed cake.
Data Recording The amounts of feed offered and refused were measured and recorded daily from which daily feed intake was calculated by difference. Butter yield was recorded from five liters milk sample churned at the end of each experimental period. Chemical Analysis of Feed Samples The chemical analyses were done at the Holetta Agricultural Research Center. Silage sample was taken in duplicate from the silo to analyze the chemical composition of the silage. Dry matter contents of the feed samples were determined after drying in an oven at a temperature of 65oC for 72 hours. Nitrogen content of feed was determined byMicro-Kjeldahal method from which the crude protein (CP) values were calculated as CP = N*6.25. Sensory Quality Evaluation of Cheese and Yoghurt Sensory evaluations of yogurt and cheese were carried out by eight experienced panelists selected from among DZARC staff. Evaluation sessions conducted at the end of each experimental period. The sensory quality attributes under consideration were taste and flavor after 2 days of storage at room temperature. Each panelist scored samples independently and recorded the scores on the sheets provided. Statistical Analysis Quantitative data were analyzed according to the General Linear Model (GLM) procedure of version9.0 SAS, (2000).

62
Results and Discussion Chemical Composition of Feeds The chemical compositions of experimental feeds are shown in Table 2. Maize silage had the least CP content (6.9%) from the ingredients. Among the feed ingredients used, noug cake had the highest CP (35.0%) content followed by cotton seed cake (31.0%) and linseed cake (29.9%).
Table 2. Chemical composition (%) of maize silage and supplement protein sources
Experimental diet DM CP OM Ash
Maize silage 91.8 6.9 91.0 8.9
Noug cake 93.7 35.0 89.9 10.0
Cotton seed cake 93.8 31.0 92.8 7.1
Linseed cake 93.5 29.9 91.3 8.7 DM=Dry Matter; CP=Crude Protein; OM=Organic Matter;
Butter Yield There was a highly significant (p<0.0001) period effect on butter yield. However, treatment effect on butter yield was not significant (p>0.05) (Table 3). However, the least (138.75 g) butter yield was recorded in cow fed on maize silage without supplement compare to protein supplemented cows.
Table 3. Mean of butter yield of lactating cows fed maize silage
supplemented with protein sources.
Treatment Mean of butter yield per kg milk (g)
T1 138.75 T2 161.25 T3 181.25 T4 157.50
Significance NS SE 23.86
T1=Maize silage; T2= Maize silage+Noug seed cake; T3= Maize silage+Cotton seed cake; T4= Maize silage+Linseed cake; SE= Standard Error; NS= Non significance (P>0.05)

63
Sensory Quality Evaluation of Yoghurt The results have shown that the flavor of yoghurt was affected by the dietary treatments. About 71.87% panelists reported that yoghurt made from cows supplemented with cotton seed cake had excellent flavor (Table 4). Yoghurt made from cows fed on maize silage with noug cake was the next good quality yoghurt which is preferred by 25% of panelists. However, about 71.87% panelists not preferred cow milk yogurt made from cows fed on maize silage supplemented with linseed cake followed by maize silage without supplements (59.37%).
Table 4. Effects of maize silage supplemented with protein sources
on yogurt flavor as rated by panelists (%)
Treatment Yoghurt flavor
Excellent Very good Good T1 9.38 30.13 59.37 T2 25.00 50.00 25.00 T3 71.87 15.62 12.5 T4 6.25 21.87 71.87
T1=Maize silage; T2= Maize silage + Noug cake; T3= Maize silage + Cotton seed cake; T4= Maize silage + Linseed cake
Sensory Quality Evaluation of Cheese The results have shown that the flavor of cheese was affected by the dietary treatments (Table 5).Among the treatments, cheese made from cow fed on maize silage alone was preferred by the majority (71.9%) of the panelists. Cheese made from cow fed on maize silage with noug cake was the next good quality, which is preferred by 28.1% of panelists. However, about 81.25% of panelists not preferred cheese made from cows supplemented with linseed cake followed by cotton seed cake (78.12%).

64
Table 5: Effects of maize silage supplemented with protein sources on cheese flavor as rated by panelists (%)
Treatment Cheese flavor Excellent Very good Good
T1 71.87 25.00 3.12 T2 28.12 40.62 31.25 T3 0 21.87 78.12 T4 0 18.75 81.25
T1=Maize silage; T2= Maize silage + Noug cake; T3= Maize silage + Cotton seed cake; T4= Maize silage + Linseed cake
References Coulon JB, P Pradel, and I Verdier. 1997. Effect of forage conservation (hay or
silage)on chemical composition of milk. Annales de Zootechnie46: 21-26.
Coulon JB and B Rémond. 1991. Variations in milk output and milk protein content in response to the level of energy supply in the dairy cow: a review. Livestock Production Science 29: 31-47.
Forss DA. 1993. Effects of feed on flavor of dairy products. New Zealand Dairy
Research Institute (eds) Milk fat flavor forum, summary of proceedings. Palmerston North, New Zealand, pp. 50-54
McDonald P, RA Edwards, J.F.D. Greenhalgh, CA Morgan. 2002. Animal Nutrition (6th ed.). Pearson Educational Limited. Edinburgh, Great Britain. pp 544.
Mohamed SA, MK Mohsen, MM Bendary, EM Abdel-Raouf, and HMA Gaafar. 2003. Performance of growing Friesian calves fed rations containing corn silage- Blood constituents and carcass traits. Egyptian J, Nutrition and Feeds,6: 727.
Sutton JD.1989. Altering milk composition by feeding. Journal of Dairy Science 72:2801-2814.
Urbach G. 1990. Effect of feed on flavor in dairy foods. Journal of Dairy Science 73:3639-3650.

65
Restoring Techniques for Degraded Rangelands in Semi-Arid Conditions
Bedasa Eba1, Bikila Negasa1, Samuel Tuffa1, Jaldessa Doyo1, Abule Ebro2, Asfawu Ijo1, and Wandimu Tolcha1
1Yabello Pastoral and Dryland Agriculture Research Center, Oromia
Agricultural Research Institute, P.O. Box 085, Yabello, Ethiopia 2 International Livestock research Institute, P.O. Box 5689, Addis Ababa,
* Correspondence: [email protected] Introduction In Borana, rangeland conditions are steadily degrading from time to time (Oba et al., 2000; Gemedo, 2004; Sintayehu et al, 2006; Angasa, 2007; Daniel, 2010) as a result of many interacting factors, such as heavy grazing, and expansion of encroaching bushes and weeds. Moreover, bush encroachment is transforming potential open grassland savannas into thick bushes and shrubs (Barnes, 1979), indicating the degree of severity in arid and semi-arid rangelands. Besides, the rangelands are subjected to frequent and recurrent droughts resulting in massive livestock mortalities and impacting famine and poverty by pastoral households. Research and development in rangeland improvement schemes is therefore an important investment in order to reverse the negative impacts of different rangeland degradations caused by biotic and/or abiotic factors. Range improvement is defined as special treatment(s), development(s) and structure(s) used to improve the forage productivity potentials of rangeland types with the aim of promoting livelihood quality of pastoral communities through production of quantity and quality range-feeds and their uses by grazing livestock species. In this context, rangeland improvement include: i) to restore depleted rangelands to higher levels of productivity, ii) control of bush encroachment and replacing undesirable range plants with desirable productive species and iii) reclamation of severely degraded and wasted lands and converting them in to in-situ drought period feed conservation sites (Holechek et al., 2000). Rangeland improvement programs are global perspectives, however, where the complex situation of rangeland is high like in semi-arid and arid region, it needs to test each and/or combination improvement techniques. Depending on the situations of Borana rangeland, some of the possible range improvement techniques

66
that can be employed include enclosures, over sowing, control of undesirable range plants, burning, fertilization, improvement of grazing systems and stocking rates, application of soil moisture conservation techniques, re-seeding and plantation of drought tolerant succulents (Solomon et al, 2005). These techniques can be applied individually or in various combinations to get best results (DLHP-Sudan, 2003). Although some individual techniques evaluated for rangeland rehabilitation, still the result is not compressive. Hence, this study was aimed to evaluate the combined effects of reseeding native grasses, fertilization, soil and water conservation practices on recovery potential of highly degraded rangeland. Materials and Methods Site selection and field layout A bare site of 72mx72m in area and with no desirable vegetation cover was selected from Dugda Dawa district and fenced to exclude both human and animal interference. The field was divided into sub-plots. Different restoration treatments were randomly applied in each sub-plot. Experimental design and treatments The experimental design was RCBD with 12 treatments replicated three times separately for each grass species (Chloris gayana Kunth and Cenchrus ciliaris). The treatments were applied at the beginning of the main rainy season. The experiment was conducted over the course of two seasons during March to May in 2010 and 2012. In the year 2011, no treatments were applied due to drought occurrence in Borana zone. The experimental treatments applied were: control, mulch, cattle manure , mulch + cattle manure, ripping, semicircular bund, ripping + mulch, ripping + cattle manure, semicircular bund + mulch, semicircular bund + cattle manure, ripping + mulch + cattle manure, and semicircular bund + mulch + cattle manure. Since the study area was moisture stressed, treatments of in-situ moisture conservation techniques were considered. The structures suggested for this purpose were semi-circular bunds and ripping. Semicircular bunds are earthen bunds in the shape of a semi-circle to accumulate runoff water in front of the bund, where plants are grown. The diameter or the distance between the two ends of each bund and height of the bunds were 1m and 30-50cm, respectively as stated by Theib et al., (2000). Ripping was a cultivation action with a one tine-sub-soiler implement to a depth of at least 20-25cm and 10cm wide as

67
indicted by Breebaart et al (2006). This was used to break the hard compacted crust of the surface soil and to create furrows in order to increase water infiltration for promoting seedling establishment. Mulch was applied using grasses that had not set seed and thickness of the mulch was 15cm on plots. The grass mulch application was to facilitate maximum plant establishment by retaining soil moisture and reducing impact of raindrops (Van der Merwe, 1997; De wet, 2001). Cattle manure stored as pile around the encampment of pastoral area of Borana zone for many years. This manure used as fertilizer and broadcasted uniformly on plots at the rate of 88kg/100m2. Land preparation and seeding were carried out soon after commencement of the long rainy season (beginning of March). Seeding rate of grass was 8kg/ha. Hoeing was made to prepare the plots for reseeding. Vegetation sampling The plot cover, dry matter yield, seed yield and plant height were measured. Height measured by selecting ten representative tillers of Chloris gayana Kunth and Cenchrus ciliaris from each plot. Plot cover was assessed by randomly placing three 0.5mx0.5m quadrates on each plot. Cover within an area of 0.25m2 was assessed following the methods developed by Baars et al. (1997). Seed yield assessed by harvesting the whole area of each sub-plot. Dry matter assessed by placing randomly three 0.5m×0.5m quadrat in each sub-plot, and the aboveground Chloris gayana Kunth and Cenchrus ciliaris forage was clipped at 5cm above the ground at the stage of 50% of heading. Dry matters of the grasses were estimated by determining dry matter % of the forage through oven drying of samples at 105 °C for 24 hours at Yabello Pastoral and Dryland Agriculture Research Centre. Data analysis Data were subjected to the analysis of variance using SAS version 9.0 (SAS, 2002). Least significance differences (LSDs) at 5% level of probability were computed to test significance of differences among treatment means. Results and Discussion Restoring degraded ranglands by reseeding Chloris gayana High variations were observed among treatments on restoration of rangeland as shown in Table 1. Accordingly, Ripping + mulch + cattle

68
manure and semicircular bund + mulch + cattle manure were significantly (P<0.05) resulted in higher dry matter yield, height, plot cover and seed yield of Chloris gayana Kunth. This implies the combinations of rehabilitation techniques tended to restore degraded rangeland leading to higher dry matter yield. This agree with the study of Griffith et al. (1984) that indicates soil and water conservation practices improve dry matter yield of grasses and better water infiltration on degraded rangeland. As observed from this result, mulching also increases the restoration of degraded rangeland when combined with soil and water conservation. Similarly, some results indicated that mulching increases establishment of grasses and reduce evaporation on degraded land (Brady, 1990; Jordaan & Rautenbach, 1996).
Ripping + cattle manure and Semicircular bund + cattle manure were also significantly different (P<0.05) that resulted in higher dry matter yield, height, plot cover and seed yield of Chloris gayana Kunth. This implies that cattle manure also supports better restoration when combined with other treatments. In the same way, Edwards (1981) and Roundy and Call (1988) emphasized the need for fertilizers to promote plant establishment and growth on rapid restoration of degraded rangeland. In rangeland of Borana, manure usage as fertilization for rangeland improvement techniques have not practiced. This is due to lack of recognizing manures as system elements and their role in rangeland nutrient recycling within the ecosystem and hence improves degraded rangeland condition. Hence, this emerging evidence suggests usage of manures on degraded rangeland enhance rangeland improvement. The dry matter yield, seed yield and height of Chloris gayana Kunth was not same between 2010 and 2012 experiment. This could be attributed to the carryover effect of drought during the year of 2011 resulting in poor performance in 2012. From this empirical result, the performance of Chloris gayana Kunth was by far better than Cenchrus ciliaris in dry matter and seed yield (Table 1 and 2). This indicates the need for more work on Cenchrus ciliaris to improve its productivity

69
Table 1: Mean ± SE of plot cover, dry matter yield, seed yield and height of Chloris gayana in Dugda Dawa district of
Borena area
Treatment 2010 experiment 2012 experiment
Plot Cover (%)
Dry matter (kg/ha)
Seed (kg/ha)
Height (cm)
Plot Cover (%)
Dry matter (kg/ha)
Seed (kg/ha)
Height (cm)
Control 21.7±3.3d 266.7±109.1c 80.0±15.3d 25.0±12.6e 10.0±0.0d 320.0±40.0d 3.3±0.3c 17.0±3.6c Cattle manure 15.0±2.9d 466.7±126.7c 96.7±28.5cd 31.0±11.0ed 12.7±2.7cd 206.7±17.6d 6.0±0.6c 17.0±1.5c Ripping 33.3±3.6cd 577.3±181.1c 106.7±66.7bcd 75.3±32.9bc 21.7±3.3c 133.3±3.3d 8.0±0.6c 21.3±0.7c Ripping + cattle manure 50.0±3.2bc 5173.3±590.7a 260.0±70.2abc 108.3±18.3ab 65.0±2.9a 2236.7±8.8c 206.7±17.6b 71.7±4.4a Semicircular bund 18.3±3.3d 2220.0±557.5bc 146.7±37.1abcd 91.3±6.3abc 16.7±4.4cd 136.7±8.8d 6.7±1.7c 19.0±2.1c Semicircular bund + cattle manure 46.7±12.0bc 4673.7± 54.8a 266.7±59.3ab 120.7±1.2a 39.3±4.7b 2601.7±85.2c 226.7±29.1b 82.0±7.0a Mulch 10.0±0.0d 200.0±0.0c 56.7±16.7d 23.3±3.3e 15.0±2.9cd 172.7±1.9d 5.7±0.9c 9.7±0.9c Mulch + cattle manure 20.0±5.0d 4500.0±1917.3ab 106.7±46.7bcd 74.3±14.1bc 18.3±6.0cd 2233.3±52.1c 5.3±0.3c 70.0±8.4a Semicircular bund + mulch 15.0±5.0d 386.7±104.1c 51.3±24.7d 59.3±1.8cde 33.3±3.3b 443.3±49.1d 16.7±3.3c 72.3±4.1a Semicircular bund + mulch + cattle manure 63.3±15.9ab 5966.7±777.6a 93.3±17.6cd 128.3±17.1a 66.7±3.3a 4006.7±137.8b 286.7±17.6a 83.3±4.3a Ripping + mulch 15.0±5.0d 1233.3±24.0c 73.3±24.0d 72.3±10.4bcd 41.7±4.4b 153.3±13.3d 19.3±2.4c 36.3±0.9b Ripping + mulch + cattle manure 76.7±6.7a 5253.3±1693.5a 313.3±157.2a 130.7±20.5a 58.3±4.4a 4860.0±893.2a 233.3±24.0b 84.3±8.7a Overall mean 32.1±4.1 2576.5±423.8 137.6±20.6 78.3±7.3 33.2±3.5 1125.4±275.9 85.4±18.8 48.7±5.1
a-e means with different letters along column differ significantly (p<0.05)

70
Restoring degraded rangeland by reseeding with Cenchrus ciliaris Treatment effects on degraded rangelands reseeded with Cenchrus ciliaris were presented in Table 2. There is significance difference (P<0.05) in plot cover, dry matter yield, seed yield and height among treatments in both seasons. Ripping + cattle manure and semicircular bund + cattle manure had highest dry matter yield and plot cover in both seasons. This implies that the combination of cattle manure, soil and water conservation practices produced highest dry matter production. The water and soil conservation practices also have great contribution for establishment of grasses. This study agrees with study of Shotton (2000) that revealed application of fertilizer on Cenchrus ciliaris increase dry matter production. Ripping + cattle manure, Mulch + cattle manure, Semicircular bund + mulch + cattle manure, and Ripping + mulch + cattle manure had highest seed yield in first season, where as in second season, only Ripping + cattle manure had significant seed yield among the treatments. The amounts of seed and dry matter yield obtained in this study less than the Cenchrus ciliaris found in elsewhere. This may be due to difference accessions of Cenchrus ciliaris. In line to this, study of Hacker and Waite (2001) indicated that there are superior accessions of Cenchrus ciliaris that giving high dry matter and selects different soil types. There is variation between the two grass species in performance (for example, dry matter yield). The dry matter yields of Chloris gayana Kunth is three times greater than Cenchrus ciliaris. This implies that Chloris gayana Kunth have high potential for reseeding at marginal land. The dry matter yield obtained from control treatment was below 0.08 t ha-1. This is because of the topsoil of degraded rangeland often crusted rendering water infiltration difficult and less germination.

71
Table 2. Mean ± SE of plot cover, dry matter yield, seed yield and height of Cencherus cialries in Dugda Dawa district of Borena area
Treatment 2010 experiment 2012 experiment
Plot cover (%)
Dry matter (kg/ha)
Seed (kg/ha)
Height (cm)
Plot cover (%)
Dry matter (kg/ha)
Seed kg/ha)
Height (cm)
Control 18.3±4.4cd 73.3±6.7d 9.3±0.7cd 11.0±2.1de 9.0±0.6cd 83.3±6.7f 16.3±4.5ef 15.7±2.8c Cattle manure 28.3±11d 440.0±122.2dc 34.0±12.5ab 24.3±7.3bcd 5.0±0.0d 396.7±26.0ef 38.3±1.7bcdef 51.7±1.9a Ripping 18.3±4.4cd 146.7±26.7d 4.7±0.3d 8.3±0.3e 20.0±15.0bcd 600.0±152.8edf 41.3±11.6bcde 49.0±8.4a Ripping + cattle manure 76.7±7.3a 1280.0±484.9ab 33.3±13.3abc 32.7±9.6ab 40.0±5.0a 933.3±96.8bcde 93.3±17.6a 56.3±6.2a Semicircular bund 16.7±4.4d 113.3±17.6d 20.0±10.0abcd 12.0±3.1de 11.7±4.4cd 980.0±170.9bcde 12.0±1.2f 50.3±9.7a Semicircular bund + cattle manure 33.3±16.4cd 1353.3±182.7a 20.0±10.0abcd 29.7±3.5bc 16.7±4.4bcd 1586.7±337.1a 53.3±6.7bc 54.7±4.4a Mulch 23.3±8.8cd 63.3±12.0d 33.3±13.3abc 15.3±3.2de 4.7±0.3d 116.7±12.0f 17.8±1.5ef 23.3±4.8bc Mulch + cattle manure 25.7±10.2cd 766.7±100.9bc 20.0±10.0abcd 37.7±4.9ab 11.7±6.7cd 1093.3±246.9abcd 26.7±6.7cdef 43.7±6.1ab Semicircular bund + mulch 25.0±2.9cd 73.3±17.6d 23.3±8.8abcd 18.0±4.7cde 20.0±5.8bcd 586.7±70.6edf 25.3±7.4def 55.7±8.4a Semicircular bund + mulch + cattle manure 40.0±8.7bc 553.3±150.3cd 40.0±11.5a 37.7±1.8ab 38.3±1.7a 1400.0±408.1abc 60.0±11.5b 60.3±4.7a Ripping + mulch 31.7±4.4cd 220.0±64.3d 13.3±3.3bcd 11.0±2.1de 33.3±8.3ab 1513.3±281.9ab 60.0±11.5b 58.0±12.9a Ripping + mulch + cattle manure 60.0±10.4ab 551.7±185.1cd 40.0±0.0a 44.7±4.5a 23.3±1.7abc 826.7±231.3cde 46.7±17.6bcd 62.7±4.8a Overall mean 33.1±6.9 469.6±84.8 24.3±2.9 23.5±2.3 19.5±2.5 843.1±96.5 40.9±4.5 48.4±2.9
a-e means with different letters along column differ significantly (p<0.05)

72
References Ayana Angasa. 2007. The Dynamics of Savanna Ecosystems and Management in Borana,
Southern Ethiopia, PhD Thesis presented Department of International Environment and Development Studies, NORAGRIC, Norwegian University of Life Sciences (UMB), Norway, pp 1-183.
Bedasa Eba, Bikila Negasa, Samuel Tuffa and Jaldessa Doyo. 2014. Effect of reseeding of Rhodes Grass on the Restoration of Degraded Rangeland of Borana, Southern Ethiopia Direct Research Journal of Agriculture and Food Science (DRJAFS) Vol.2 (7), pp. 102-106,
Brady NC. 1990. The nature and properties of soils. 10th edition. Macmillan Publishing Company, New York
Breebaart L, K Coetzee, WRJ Dean, P Toit du, KJ Esler, T Hoffman, L Jones, L Mills, SJ Milton, LJ Theron, S Todd, G Verdoorn. 2006. Karro veld. In: KJ Esler, SJ Milton, WRJ Dean (eds). Ecology and management.. Briza Publications, Pretoria, South Africa, pp. 214.
Daniel Jaleta. 2010. Extent of Bush encroachment and Its impacts on selected soil properties in Borana Rangelands, Ethiopia. MSc. Thesis Presented to Hawassa University Wondo Genet College of Forestry and Natural resources, pp 1-82.
Edwards PJ. 1981. Sour grassveld. In: N.M. Tainton (ed.). Veld and pasture management in South Africa. Shuter and Shooter, Pietermaritzburg. Pp. 395-400.
Gemedo Dale. 2004. Vegetation ecology, rangeland condition and forage resources evaluation in the Borana lowlands, southern Oromia, Ethiopia. Ph.D. dissertation, Georg-August University Goettingen, Germany, pp 1-319.
Griffith LW, GE Schuman, F Rauze, and RF Baumgartner. 1984. Mechanical renovation of short grass prairie for increased herbage production. J. Range Manage. 38, 7-10.
Hamadeh, S., 2002. Feeding calendar and grazing survey and development of rangeland management options for target areas in Northern Beka’a. Consultancy Report-GEF/UNDP Project on “Conservation and sustainable Use of Dry land Agro biodiversity in the Near East
Hacker JB and RB Waite. 2001. Selecting buffel grass (Cenchrus ciliaris) with improved spring yield in subtropical Australia
Holechek JL, Gomez H, Molinar F and Galt D 2000. Grazing studies: What we have learned. Rangelands, 21: 12-16.
Jordaan FP and GF Rautenbach. 1996. The influence of organic mulches on soil temperatures with the establishment of smuts finger and white buffalo grasses on a vertic soil. Afr. J. Range & Forage Sci. 13, 72-74.
Oba G, E Post, PO Syvertsen, and NC Stenseth. 2000. Bush cover and range condition assessments in relation to landscape and grazing in southern Ethiopia. Landscape Ecology 15, 535–547.

73
Roundy BA and CA Call. 1988. Vegetation of arid and semiarid rangelands. Vegetation science applications for rangeland analysis and management, Handbook of vegetation science, Vol. 4. Dodrechts Kluwer Academic Publishers, 607-635.
SAS.2002.Statistical Analysis System software, Version 9.0, SAS Institute, Inc. Cary, NC, USA.
Shotton. P., 2000. The Performance of Six Tropical Pasture Legumes when Sown as a companion with Buffel Grass in the NT. Technote, No.110; ISSN No: 0158-2755
Sintayehu Melese, Huluf Gebrekidan, Lema Gizachew and DL Coppock, 2006. Changes in land cover and soil conditions for the Yabello District of the Borana Plateau, 1973-2003. Research Brief 06-06-PARIMA. Global Livestock Collaborative Research Support Program. University of California, Davis. 4 pp.
Solomon Tadesse, Snyman HA, and Smit GN 2007. Cattle-rangeland management practices and perceptions of pastoralists towards rangeland degradation in the Borana zone of Southern Ethiopia. Journal of Environmental Management 82: 481–494.
Theib O, P Dieter, and H Ahmed. 2000. Water harvesting: Indigenous knowledge for the future of the drier environments. Pp. 36.
Van der Merwe JPA.1997. The development of data base and expert system for rangeland reinforcement practices in Southern Africa. M.Sc., Thesis, Potchefstroom University for Christian Higher Education, South Africa.
Yeshitila Admassu. 2007. Efficiency of livestock feed resources utilization and forage development in Alaba Woreda, southern Ethiopia, MSc thesis, Haramaya University.

75
Effect of Garden Cress (Lepidium sativum ) Seed and Its Extract on Eimeria tenella
Infection in Broiler Chickens
Meskerem Adamu1 and Chaiwat Boonkaewwan2
1Ethiopian Institute of Agricultural Research, Debre Zeit Research Center, Ethiopia. Email – [email protected]
2Department of Animal Science, Faculty of Agriculture, Kasetsart University, Bangkok 10900, Thailand. Introduction Lepidium sativum (LS), commonly known as garden cress (locally called fetto In Amharic) belongs to the Brassicaceae family and is an annual erect herbaceous plant, growing up to 20–80 cm. In Europe and many other parts of the world, seedlings of LS are used as a salad or to season salads, because of their pungent taste. In Ethiopia, LS is cultivated for its seeds, which are primarily used as cultural medicine (Jansen, 1981). LS seed possesses varied medicinal properties and is known as a “versatile medicine”. The seed has been used in local traditional medicine, for example, in villages around Debre Libanos monastery and in Butajira district to treat various kinds of human and animal ailments such as diarrhea, dysentery, unidentified gastrointestinal disorders, stomach ache, indigestion, febrile disease and skin disorders (Teferi and Hahn, 2003; Tilahun et al., 2007). Previous studies have shown that antioxidant-rich plant extracts and feed diets with high n-3 fatty acids (n-3 FA) have potential benefits in treating cecal coccidiosis in chickens (Allen et al., 1996; 1997). Diwakar et al. (2010) reported that the essential oil derived from LS seed contained tocopherol (a natural antioxidant), carotenoid, oleic acid and α-linolenic acid, while Zia-Ul-Haq et al. (2012) showed that LS extract (Soxhlet extracted), had a good antioxidant property that could reduce different types of radicals. The protective action of LS seed including an antihypertensive and diuretic effect was indicated by Maghrani et al. (2005). Some studies have also shown the hypoglycaemic activity of LS in diabetic rats

76
(Eddouks et al., 2005), improvement in asthmatic attacks (Paranjape and Mehta, 2006) and an inhibitory effect of the LS juice against heterocyclic aromatic amines-induced DNA damage and preneoplastic lesions (Fekadu et al., 2002). However, the anticoccidial effects of LS seed against chicken coccidiosis have not been reported. Therefore, this study was aimed to investigate the anticoccidial effect of LS seed against E. tenella experimental infection in broiler chickens.
Materials and Methods Experimental birds A sample of one day old 240 Hubbard classic, broiler chicks were purchased from the Debre Zeit Agricultural Research Center, Ethiopia. Chicks were maintained in a brooder house for 18 days. Feed and water were provided ad libitum without anticoccidial drugs. The starter feed was formulated using maize, wheat bran, soybean, noug cake (Guizotia abysinica), limestone, vitamin premix and salt. All broiler chicks were housed in an intensive deep-litter floor. Chicks were divided by group into separate pens. Experimental chicks were vaccinated against Newcastle and infectious bursal diseases. Collection of Lepidium sativum seeds Lepidium sativum seeds, brownish red in color, were collected during August and September 2011 from the Bench Maji Zone, Bebeqa woreda, southwestern Ethiopia. The seeds were cleaned and prepared as whole seed and powder. Seeds were powdered using a mortar and pestle. Ethanol’s extract preparation using hot continuous Soxhlet extraction method Samples of 500 g of LS seed powder were placed in a thimble made of filter paper and inserted into the wide central tube of the extractor of the Soxhlet apparatus. The solvent (ethanol) was placed in the flask and heated at 78°C and its vapors condensed in a reflux condenser. The condensed extractant was dripped into the thimble containing the crude drug, which was extracted by contact. When the level of the liquid in the chamber had risen to the top of the siphon tube, the liquid contents of the chamber were drained off into the flask. This process was continuous and was carried out until a drop of the solvent from the siphon tube did not leave any residue when evaporated (Handa, 2008). One mL aliquots of

77
the filtrate were taken and concentrated. The concentration of LS solution was 27 mg/mL (12.8%). The extract was stored in a refrigerator for 2 weeks until used being mixed with feed. Isolation and propagation of Eimeria tenella oocysts Eimeria tenella oocysts used in this study were identified by a combination of oocyst size, location in the gut, appearance of the lesions and schizont size (McDougald and Fitz-Coy, 2008). Following evisceration at post mortem, the cecal contents were washed into a beaker using tap water and the oocysts were isolated using a flotation procedure (Permin and Hansen, 1998). Oocysts were sporulated by incubating a small amount of feces or concentrated suspension of oocysts in distilled water with one or more percentage of potassium dichromate solutions with forced aeration at room temperature for 72 h (Conway and Mckenzie, 2007; Bowman, 2009). The sporulated E. tenella oocysts were orally inoculated in three chickens for oocyst multiplication. Chickens were monitored daily for the development of clinical coccidiosis and the presence of Eimeria oocysts in their feces. Sporulated E. tenella oocysts were obtained as described earlier. The sporulated E. tenella oocysts were suspended in 2% K2Cr2O7 solution and refrigerated at 4ºC until oral administration. The K2Cr2O7 solution was removed through centrifugation and the sporulated E. tenella oocysts were suspended in distilled water at the time of oral administration. In vitro efficacy evaluation of Lepidium sativum extracts on Eimeria tenella oocysts To assess the effective dosage, a preliminary anticoccidial efficacy test was conducted by observing the effect of the plant extracts on the sporulation of E. oocysts. Various concentrations (500, 1,000 and 1,500 mg/mL) of LS extract in distilled water were incubated with 100 E. tenella oocysts at room temperature for 72 h. Oocysts were also incubated in K2Cr2O7 solution as a control. Oocysts were monitored for their sporulation for a period of 72 h. The number of sporulated E. tenella oocysts was then recorded. The highest sporulation inhibition was observed in vitro in the incubation with 1,000 and 1,500 mg/mL concentrations of LS extract. Experimental treatments The experimental treatments were carried out using a completely randomized design. Two hundred and forty chickens were randomly

78
allotted into eight treatments (n = 30) (Table 1), with three replications per treatment for a period of 2 weeks. The experiment was conducted at the Debre Zeit Agricultural Research Center Poultry Farm. Treatments were applied beginning from day 18 of hatching. The chicks were supplemented with the different treatments throughout the experiment for a period of 2 wk. At age 18 d, chickens in treatments 2, 3, 4, 5 and 6 were orally challenged with 1 × 10⁵ sporulated E. tenella oocysts in 1mL of distilled water suspension using a calibrated syringe and fed a regular diet. Chickens in treatments 1, 7 and 8 were not challenged. Based on the results of the preliminary anticoccidial efficacy test, 1 g/kg of each seed preparation in feed was applied. Two days after infection, the chickens in treatments 3, 4, 5 and 6 were respectively supplemented with 1 g/kg of seed powder, 1 g/kg of whole seed, 1 g/kg of extract in feed and 0.6 g/L of amprolium in the drinking water. Chickens in treatments 7 and 8 were also respectively supplemented with 1 g/kg of LS seed powder and 1 g/kg of whole seed (Table 1). Chickens were monitored daily for the presence of clinical signs. Experimental parameters and data collection The efficacy of treatments was assessed on the basis of the following parameters: 1) performance measures (body weight gain, feed intake and mortality); 2) fecal oocyst measurements; and 3) cecal lesion scores. The number of dead chickens was recorded daily until day 7 post challenge. The body weight of all experimental chickens was weighed twice—on day 18 (before challenge) and on day 7 post challenge. The feed intake of all experimental chickens in each group was weighed daily from day 18 to day 7 post challenge. Fecal samples from all experimental groups were collected and checked before challenge; no oocysts were detected. Fecal samples in each cage were collected from randomly selected sites and the oocyst count per gram of feces was calculated using the technique described by Permin and Hansen (1998) and recorded from day 4 to day 12 post challenge. On day 7 after challenge, three randomly selected chickens in each group were euthanized by cervical dislocation for cecal lesion scoring according to the method of Johnson and Reid (1970). The scoring scales ranged from 0 to +4, where 0 = no lesion, +1= mild lesion (with few scattered petechia), +2= moderate lesion (with numerous petechia, bleeding and slight thickening), +3= severe lesion (with severe bleeding and clotting) and +4= extremely severe lesion (with severe bleeding, a much thickened or ruptured cecal wall, gangrene or death).

79
Table 1. Experimental treatments, (30 chickens each) to evaluate the effect
of Lepidium sativum on Eimeria tenella infection
Treatment Number of chicks
Oocyst challenge
Un supplemented 30 _ Un supplemented 30 + 1 g of seed powder per kg of feed 30 + 1 g of whole seed per kg of feed 30 + 1 g of extract per kg of feed 30 + 0.6 g of amprolium per liter in drinking water 30 + 1 g of seed powder per kg of feed 30 _ 1 g of whole seed per kg of feed 30 _
Oocyst challenge involved challenge with 1 × 10⁵ of sporulated E. tenella oocysts, (–) = No infection with sporulated E. tenella oocysts, (+) = Infection with sporulated E. tenella oocysts
Data analysis The data were analyzed using the analysis of variance procedure of the statistical analytical system (SAS, 2003). Tukey’s post hoc test was applied to compare the means of body weight gain, feed intake, mortality and fecal oocyst count between treatments. Cecal lesion scores were analyzed using general linear models and the means of cecal lesion scores between treatments were compared using least square means. The difference between treatments was considered significant at the (P < 0.05) level. Result and Discussion
Oocyst excretion After the peak of oocyst shed (day 7 post challenge), chickens fed the diet supplemented with whole seed demonstrated a slow reduction of oocyst shed when compared to those fed a diet supplemented with either seed powder, extract or amprolium on day 8 post challenge (Figure 1). Average daily weight gain and average daily feed intake The average daily gain (ADG) of E. tenella- infected chickens fed on the diet supplemented with LS seed powder, whole seed or extract was

80
11.08 ± 1.29, 11.24 ± 1.27, 10.55 ± 0.76 g, respectively. The ADG was significantly (P < 0.003) higher than in those fed the un supplemented control diet (6.80 ± 0.45 g). The average daily feed intake of chickens fed on the diet supplemented with either LS seed powder, whole seed or extract was also significantly greater (P < 0.0001) than in those fed on the un-supplemented or control diet (Figure 2). Oocysts per gram, mortality and lesion score Chickens fed a diet supplemented with seed powder, whole seed or extract, fallowing E. tenella infection demonstrated significantly lower oocyst counts of 88 ± 10.5, 100 ± 10 and 3.67± 2.51 (P < 0.0007), mortality 3.33 ± 5.77, 0 and 0 % (P < 0.0001) and lesion score 0.89 ± 0. 27, 0.56 ± 0.27 and 0.67 ± 0.27 (P < 0.0001), respectively, compared with those fed on the un supplemented or control diets with 370 ± 225, 16.67 ± 5.77% and 2.67 ± 0.27, respectively. Infected chickens fed on a diet supplemented with seed powder showed slightly higher lesion scores and mortality when compared to those fed on the whole seed or extract-supplemented diet. Non infected chickens fed on the diet supplemented with seed powder also showed levels of cecal lesion and mortality similar to the case of infected chickens (Tables 2 and 3). After the peak of oocyst shed (day 7 post challenge), chickens fed on a diet supplemented with either seed powder, extract or amprolium demonstrated a rapid reduction of oocyst shed on day 8 post challenge (Figure 1). However, the chickens fed on the diet supplemented with whole seed gradually exhibited reduced oocyst shed until day 9 post challenge. The delay in the reduction of oocyst shed might have been related to the retardation of parasite development.

81
Figure 1. Oocyst fecal count of Eimeria tenella-challenged chickens fed on the diet supplemented either with or without Lepidium sativum, or with or without amprolium, 6-12 d post challenge.
This could have been due to the whole seed coat, which may contain different active ingredients of different amounts which are capable of preventing the intra cellular development of E. tenella or the enhancement of the host immunity. Delaquis et al. (2002) reported that different active ingredients could be found in different parts of the plant. Lepidium sativum seed oil is rich in tocopherol (a natural antioxidant), carotenoid and fatty acids such as oleic and α-linolenic acids (Diwakar et al., 2010). Tocopherols are lipid-soluble antioxidants which may have an effect on the intracellular development of the parasites. A diet supplemented with whole seed might affect the development of E. tenella alike n-3 fatty acid- supplemented diets. Allen et al. (1996) reported reduced parasite (E. tenella) invasion and development in chickens that consumed diets supplemented with high levels of n-3 fatty acids from fish (menhaden) oil and expressed flaxseed oil. Danforth et al. (1997) also reported ultra structural changes in both the asexual and sexual stages induced by n-3 fatty acids.

82
Treatments were: non-infected un supplemented (1), infected un supplemented (2), infected + seed powder (3), infected + whole seed (4), infected + extract (5), infected + amprolium (6), non-infected + seed powder (7) and non-infected + whole seed (8). (Vertical error bars indicate ± SD)
Figure 2. Average daily gain (ADG) and average daily feed intake (ADFI) of
Eimeria tenella-challenged chickens fed on the diet supplemented either with or without Lepidium sativum, or with or without amprolium, 7 days post challenge.
At sufficiently high intakes, long-chain n-3 polyunsaturated fatty acids (PUFAs), as found in oily fish and fish oils, decrease the production of inflammatory eicosanoids, cytokines and reactive oxygen species and the expression of adhesion molecules. Long-chain n-3 PUFAs act both directly (for example, by replacing arachidonic acid as an eicosanoid substrate and inhibiting arachidonic acid metabolism) and indirectly (for example, by altering the expression of inflammatory genes through effects on transcription factor activation). Long-chain n-3 PUFAs also give rise to a family of anti-inflammatory mediators termed resolvins (Calder, 2006). The decrease in cecal lesions might have been associated with a reduction in the inflammatory process and the development of the parasite within the cecal mucosa. Diets rich in n-3 PUFAs have anti-inflammatory and immunosuppressive activities (Calder, 1997). Such n-3 fatty acid-induced effects may be of use as a therapy for acute and chronic inflammation and for disorders which involve an inappropriately activated immune response (Calder and Grimble, 2002).

83
Table 2. Oocyst fecal count and mortality rate in Eimeria tenella-challenged
chickens fed diet supplemented either with or without Lepidium sativum, or with or without amprolium
Treatment SD OPG (at day12) Mortality (%) ±
Control check (non-infected + un-supplemented)
0.00 ± 0.00b 0.00 ± 0.00b
Control(infected + un-supplemented) 370 ± 225a 16.7 ± 5.77a Infected + seed powder 88.0 ± 10.5b 3.33 ± 5.77b Infected + whole seed 100 ± 10.0b 0.00 ± 0.00b Infected + extract 3.67 ± 2.51b 0.00 ± 0.00b Infected + amprolium 37.3 ± 14.2b 0.00 ± 0.00 b Non-infected + seed powder 0.00 ± 0.00b 6.67 ± 5.77b Non-infected + whole seed 0.00 ± 0.00b 0.00 ± 0.00b
Eimeria tenella-challenged chickens fed on a diet supplemented with either seed powder, whole seed or extract showed better body weight gain. This might have been associated with the antioxidant capacity of LS seed. Antioxidants are an important part of the defense system of the host body and help to cope with oxidative stress caused by reactive oxygen species. Colnago et al. (1984) reported significantly reduced mortality and increased body weight gain in non-immunized chickens challenged with E. tenella and fed on diets supplemented with selenium or vitamin E. A Lepidium sativum-supplemented diet showed similar anticoccidial effect to these previous results. Lepidium sativum seed was reported to have high amounts of all essential amino acids, except S-containing types and tryptophan with appreciable amounts of protein, fiber, lipids, ash, moisture and carbohydrates (Zia- Ul-Haq et al., 2012). These may have contributed to the reduction in growth retardation. Apart from diet, the body also has several antioxidant mechanisms that it can use to protect itself from damage mediated by reactive oxygen species. The antioxidant enzymes glutathione peroxidase, catalase and superoxide dismutase are such enzymes. However, an imbalance between oxidants and antioxidants in favor of the oxidants, potentially leading to damage, is termed “oxidative stress” (Sies, 1997).

84
Three randomly selected chickens from each group (a total of 9 chickens per treatment) were euthanized for cecal lesion scoring on day 7 after challenge. Lepidium sativum seed extract has good antioxidant capacity, which can reduce different types of radicals, such as the phenol content, the tetraethylammonium chloride content, the ferric- reducing antioxidant power and the total radical- trapping antioxidant parameter (Zia-Ul-Haq et al., 2012). Diwakar et al. (2010) reported that the essential oil derived from LS seeds contained fatty acids such as oleic acid and α-linolenic acid. The current results demonstrated that LS seed- supplemented diets could significantly reduce the oocyst count, mortality and lesion score of E. tenella-infected chickens similar to those supplemented with amprolium when compared to the control chickens. This might have been associated with the antioxidant capacity of LS seed.
Table 3. Lesion score results in Eimeria tenella-challenged chickens fed
diet supplemented either with or without Lepidium sativum, or with or without amprolium
Treatment LS means lesion score ± SE
Control check (noninfected + unsupplemented)
0.00 ± 0.27c
Control (infected + unsupplemented) 2.67 ± 0.27a Infected + seed powder 0.89 ± 0.27b Infected + whole seed 0.56 ± 0.27bc Infected + extract 0.67 ± 0.27bc Infected + amprolium 0.56 ± 0.27bc Noninfected + seed powder 0.11 ± 0.27c Noninfected + whole seed 0.00 ± 0.27c LS = Least squares means; a,b,c = Means in a column with different superscript letters are significantly different (P < 0.05).
Sies (1997, described that oxidants are formed as a normal product of aerobic metabolism but can be produced at elevated rates under patho physiological conditions. Intestinal mucosal cells are exposed to a variety of reactive intermediates and xenobiotics and the rate of accumulation of products of oxidative damage in these cells is high.

85
The intake of plant-based exogenous antioxidant capable of scavenging free radicals may help to limit the oxidative stress and to prevent the damage caused by free radicals. Antioxidant defense involves several strategies, both enzymatic and non-enzymatic. In the lipid phase, tocopherols and carotenes as well as oxy- carotenoids are of interest, as are vitamin A and ubiquinols. Lepidium sativum-supplemented diets showed similar anticoccidial effect to those supplemented with n-3 fatty acids. Allen et al. (1997) reported significantly reduced cecal lesion in chickens challenged with E. tenella and fed on diets supplemented with 5% menhaden oil and 15% flaxseed. Allen et al. (1996) reported significantly decreased cecal lesions and maintained weight gains in chickens challenged with E. tenella and fed on diets supplemented with 2.5 to 10% fish oil, 10% flax seed oil or 10% linseed oil as compared to those fed on unsupplemented diets. Infected chickens fed on a diet supplemented with seed powder showed slightly increased lesion scores and mortality when compared to those fed on whole seed or extract-supplemented diets. Non-infected chickens fed on a diet supplemented with seed powder also showed cecal lesions and mortality similar to the infected chickens. However, the difference between treatments was not statistically significant. In contrast non-infected chickens fed on a diet supplemented with whole seed did not show any cecal lesions or mortality. Although Datta et al. (2011) showed that LS seed powder did not induce acute or sub-chronic toxic effects in LS seeds powder-fed Wistar rats, chickens fed a supplement with infected/non-infected LS seed powder showed toxic-like effects. A possible reason for the different results of LS to E. tenella infection could have been due to the preparation of the medicinal plant and the different active ingredients found in different parts of LS seeds. The composition of essential oils from different parts of the same plant differs widely. Essential oils obtained from the seeds of coriander (Coriandrum sativum L.) have a different composition to cilantro, which is obtained from the immature leaves of the same plant (Delaquis et al., 2002). In conclusion, diets supplemented with Lepidium sativum seeds showed effective anticoccidial results on E. tenella infection in broiler chickens. A diet supplemented with either LS whole seed, powder or extract was effective in improving bodyweight gain and in reducing cecal lesions, mortality and the numbers of oocysts shed. However, non-

86
infected chickens fed on a diet supplemented with seed powder of LS showed cecal lesions and mortality. This might have been due to the toxic effects of the seed powder. Therefore, further investigation should be done regarding the toxicity of LS seed powder in chickens. References
Allen PC, H Danforth, and OA Levander. 1997. Interaction of dietary flaxseed
with coccidia infections in chickens. Poult. Sci. 76: 822–827.
Allen PC, HD Danforth, and OA Levander. 1996. Diets high in n-3 fatty acids reduce cecal lesion scores in chickens infected with Eimeria tenella. Poult. Sci. 75: 179–185.
Bowman DD. 2009. Diagnostic parasitology, pp. 295–301 In D.D. Bowman, (ed.). Parasitology for Veterinarians, 9th ed. Saunders, Elsevier, Inc. St. Louis, MI, USA.
Brenes A and E Roura. 2010. Essential oils in poultry nutrition: Main effects and modes of action. Anim. Feed Sci. and Technol. 158: 1–14.
Calder PC and RF Grimble . 2 0 0 2 . Polyunsaturated fatty acids, inflammation and immunity. Eur. J. Clin. Nutr. 56 (3Suppl): S14–19.
Calder PC. 1997. n-3 Polyunsaturated fatty acids and immune cell function. Adv. Enzyme Regul. 37: 197–237.
Calder PC. 2006. n-3 Polyunsaturated fatty acids, inflammation and inflammatory diseases. Am. J. Clin. Nutr. 83 (6 Suppl): 1505S–1519S.
Casewell M, C Friis, E Marco, P McMullin, and I Phillips. 2003. The European ban on growth-promoting antibiotics and emerging consequences for human and animal health. J. Antimicrob. Chemother. 52: 159–161.
Chapman HD. 1998. Evaluation of the efficacy of anticoccidial drugs against Eimeria species in the fowl. Int. J. Parasitol. 28:1141–1144.
Colnago GL, LS Jensen, and P.L Long. 1984. Effect of selenium and vitamin E on the development of immunity to coccidiosis in chickens. Poult. Sci. 63: 1136–1143.
Conway DP and ME McKenzie. 2007. Poultry Coccidiosis: Diagnostic and Testing Procedures. 3rd ed. Black-well. Ames, IO, USA. 164 pp.
Dalloul RA and HS Lillehoj. 2005. Recent advances in immunomodulation and vaccination strategies against coccidiosis. Avian Dis. 49: 1–8.
Dalloul RA and HS Lillehoj. 2006. Poultry coccidiosis: Recent advancements in control measures and vaccine development. Expert Rev. Vaccines 5: 143–163.

87
Danforth HD, PC Allen, and OA Levander. 1997. The effect of high n-3 fatty acids diets on the ultra-structural development of Eimeria tenella. Parasitol. Res. 83: 440–444.
Datta PK, BT Diwakar, S Viswanatha, KN Murthy, and KA Naidu. 2011. Safety evaluation studies on garden cress (Lepidium sativum L.) seeds in Wistar rats. Int. J. Applied Res. Nat. Prod. 4: 37–43.
Delaquis PJ, K Stanich, B Girard, and G Mazza. 2002. Antimicrobial activity of individual and mixed fractions of dill, cilantro, coriander and eucalyptus essential oils. Int. J. Food Microbiol. 74: 101–109.
Dinka, Ayana and Yacob Hailu. 2012. Coccidiosis in Fayoumi chickens at Debre Zeit Agricultural Research Center Poultry Farm, Ethiopia. Europ. J. Appl. Sci. 4: 191–195.
Diwakar BT, P K Dutta, BR Lokesh, and KA Naidu. 2010 Physicochemical properties of garden cress (Lepidium sativum L.) seed oil. J. Am. Oil Chem. Soc. 87: 539–548.
Eddouks M, M Maghrani, NA Zeggwagh, and JB Michel. 2005. Study of the hypoglycaemic activity of Lepidium sativum L. aqueous extract in normal and diabetic rats. J. Ethnopharmacol. 97: 391–395.
Fekadu Kassie, S Rabot, M Uhl, W Huber, HM Qin, C Helma, RS Hermann, and S Knasmuller. 2002. Chemo-protective effects of garden cress (Lepidium sativum) and its constituents towards 2-amino-3-methyl-imidazo [4,5-f] quinoline (IQ)-induced genotoxic effects and colonic preneoplastic lesions. Carcinogenesis 23: 1155–1161.
Fikre Lobago., Netsanet Worku and Abebe Wossene. 2005. Study on coccidiosis in Kombolcha poultry farm, Ethiopia. Trop. Anim. Health Prod. 37: 245–251.
Handa SS. 2008. An overview of extraction techniques for medicinal and aromatic plants, pp. 21–103. In SS. Handa, SPS. Khanuja, G Longo, and DD Rakesh (eds). Extraction Technologies for Medicinal and Aromatic Plants, United Nations Industrial Development Organization and the International Centre for Science and High Technology, Trieste, Italy.
Jansen PCM. 1981. Spices, Condiments and Medicinal Plants in Ethiopia, Their Taxonomy and Agricultural Significance. Center for Agricultural Publishing and Documentation, Wageningen, the Netherlands.
Johnson J and M Reid. 1970. Anticoccidial drugs, lesion scoring techniques in battery and floor-pen experiments with chickens. Exp. Parasitol. 28: 30–36.
Maghrani M, NA Zeggwagh, JB Michel, and M Eddouks. 2005. Antihypertensive effect of Lepidium sativum L. in spontaneously hypertensive rats. J. Ethnopharmacol. 100: 193–197.
McDougald LR and SH. Fitz-Coy. 2008. Coccidiosis, pp. 1068–1080. In YM Saif, (ed.). Disease of Poultry, 12th ed. Blackwell Publishing. Ames, IA, USA.

88
Paranjape AN and AA Mehta. 2006. A study on clinical efficacy of Lepidium sativum seeds in treatment of bronchial asthma. Iran. J. Pharm. Therapeutics 5: 55–59.
Permin A and JW Hansen. 1998. The Epidemiology, Diagnosis and Control of Poultry Parasites. FAO Animal Health Manuals, Rome, Italy. 155 pp.
Sies H. 1997. Physiological society symposium: impaired endothelial and smooth muscle cell function in oxidative stress: Oxidants and antioxidants. Exp. Physiol. 82: 291–295.
Statistical Analysis System. 2003. SAS Online Doc 9.1.3. SAS Institute Inc., Cary, NC, USA.
Teferi Gedif and HJ Hahn. 2003. The use of medicinal plants in self-care in rural central Ethiopia. J. Ethnopharmacol. 87: 155–161.
Tilahun Teklehaymanot., Mirutse Giday, Giday Medhin and Yalemtsehay Mekonnen. 2007. Knowledge and use of medicinal plants by people around Debre Libanos monastery in Ethiopia. J. Ethnopharmacol. 111: 271–283.
Zia-Ul-Haq M, S Ahmad, L Calani, T Mazzeo, D Del Rio, N Pellegrini, and V De Feo. 2012. Compositional study and antioxidant potential of Ipomoea hederacea Jacq. and Lepidium sativum L. seeds. Molecules 17: 10306–10321.

89
The Performance of Dual Purpose Chicken (Potchefstroom Koekoek) under Farmers
Management
Misba Alewi, Alemayehu Guteta, Alemayehu Amare, Dawud Ibrahim and Tadios Habte
Ethiopian Institute of Agricultural Research, Debre Zeit Research Center, Ethiopia.
E-mail: [email protected]
Introduction Poultry production is one area of livestock production with significant contribution to human food production (Solomon, 2004). Chicken is not only a valuable source of eggs and meat but also renders various social and spiritual benefits mainly to the rural community. It is of paramount economic importance especially in low income, and food deficient countries like Ethiopia. According to the recent report of Central Statistical Authority of Ethiopia (CSA, 2014), there are about 51 million chicken in the country, of which 96.9, 2.4 and 0.8% are indigenous, hybrid and exotic breeds, respectively. However, despite the benefits and huge population of chicken, the total output of this sector has remained very low due to diverse reasons. The per capita egg and chicken meat consumption are about 57 eggs and 2 kg, respectively. Additionally, in view of the Ethiopian population that has increased by about 3.0% per annum over the last three years (2010, 2011 and 2012) (CSA, 2014). The gap between supply and demand in the future per capita egg and chicken meat consumption is imminent unless appropriate measures are taken for promoting chicken production. Therefore, to tackle the ever existing problem, different approaches of improved poultry technology packages dissemination should be followed on the basis of social, economic and physical environments under which the production takes place.

90
Materials and Methods The study was conducted in Shashemene and Kuyera Towns, which are located at 237 km and 250 km southeast of Addis Ababa, respectively. Five households (three from Shashemene and two from Kuyera) were selected to participate in the demonstration. Households were selected based on their experience in chicken production and interest to participate in the study. Thereafter, a two days training was given on basic poultry management and data recording techniques. A total of 250 unsexed day-old chicks were used for the study. Each of the five households involved in the study were provided with 50 day-old chicks. Each household constructed a separate house for the chickens and they were raised under intensive management system in a closed confinement from day old to the end of the experimental period (74 weeks). During this period, birds were fed on complete feed formulated at the national poultry research farm of Debre Zeit Agricultural Research Center (DZARC). Feed was formulated based on the requirements of the chickens at different developmental stages (i.e. starter, grower and layer). Feed was provided twice a day while water was made available for the chickens all the time. Newcastle disease vaccination was given immediately after hatch (ocular administration) and repeated on first and third weeks, and they were regularly vaccinated thereafter every three months as it is recommended by veterinarians. Data on performance traits (growth, egg production and viability) were recorded with active involvement of each participating households. Group body weight was taken at different developmental stages. During the brooding and growing period, body weight was taken regardless of sex, whereas during the laying period body weight was taken separately for both sexes. Due to lack of reliable record on feed refusal at household level, data on feed intake was not computed and reported. Age at first egg was recorded as number of days between date of hatching and date of their first egg. Egg production record was taken on daily basis starting from age at first egg until 74 weeks of age. The laying intensity was estimated as number of eggs per hen-housed divided by number of days from the start of lay to the end of experiment and this is termed as rate of lay per hen-housed (Zamanet al., 2004).

91
Mortality was also recorded as occurred at different developmental stages (brooding, growing and laying stages). The hen-hosed egg production (HHEP) was calculated using the following formula (Aberra, 2007):
𝐇𝐇𝐄𝐏 (%) =𝐓𝐨𝐭𝐚𝐥 𝐞𝐠𝐠𝐬 𝐩𝐫𝐨𝐝𝐮𝐜𝐞𝐝
(𝐍𝐨 𝐨𝐟 𝐛𝐢𝐫𝐝𝐬 𝐢𝐧𝐢𝐭𝐢𝐚𝐥𝐥𝐲 𝐡𝐨𝐮𝐬𝐞𝐝 𝐱 (𝐍𝐨 𝐨𝐟 𝐝𝐚𝐲𝐬 𝐢𝐧 𝐥𝐚𝐲) 𝐱 𝟏𝟎𝟎
Descriptive statistical tools were used to analyze the data. The descriptive part includes mainly mean values summarized in the form of tables and figures as appropriate. ANOVA tests were done using the General Linear Model (GLM) procedure to assess the effects of sex on different response variables. The Statistical Package for Social Sciences, version 20 (SPSS, 2011) was used to enter and analyze the data. Results and Discussion Growth performance The growth performance of Potchefstroom Koekoek was evaluated based on three developmental stages, which include brooding, growing and laying periods. Accordingly, the chicks had an average daily gain of 9.62 g during the first eight weeks of brooding period and attained an average body weight of 565 g by the end of the brooding period (Table 1). During the growing period (9 to 20 weeks of age), the chickens had an average daily gain of 13.7 g, and attained an average body weight of 1717 g at 20 weeks of age (Table 2).
Table 1. Average body weight and daily gain of koekoek chicken during the brooding period
Age
(weeks) Body weight (g)
(Mean ± SD) Daily gain (g) (Mean ± SD)
0* 26.6 ± 0.92 - 2 81.8 ±7.36 3.94 ±0.51 4 204 ±6.21 8.75 ± 0.63 6 370 ±4.18 11.9 ± 0.23 8 565 ±13.3 13.9 ± 0.69
* Week “0” = Day-old chick weight

92
During the laying period, the growth performance of chickens was evaluated taking the effect of sex into consideration. A significant (p<0.05) difference in the means of body weight and daily gain was observed between the two sexes (Figures 1 and 2). The male birds had higher body weight and daily gain than that of females. The mean body weight at 52 weeks of age was 2819 ± 23.4 g and 2023 ± 33.8 g for males and females, respectively. The current finding on growth performance of the breed at different developmental stages was relatively lower as compared to the results reported by South African ARC- Animal Production Institute (2010). However, the growth performance of the breed under the three developmental stages (brooding, growing and laying stages) was relatively higher as compared to the result reported by Wondmeneh et al. (2011) under on-station management conditions at DZARC.
Table 2. Average body weight and daily gain during the growing period
Age (weeks)
Body weight (g) (Mean ± SD)
Daily gain (g) (Mean ± SD)
10 763.8 ± 20.4 14.2 ± 0.52 12 965.0 ±28.0 14.4 ±0.55 14 1171 ±33.7 14.7 ± 0.42 16 1383 ±34.8 15.1 ± 0.12 18 1565 ±34.5 13.0 ± 0.37 20 1717 ± 35.6 10.8 ± 0.82
Figure 1: Mean body weight during the laying period. Error bars are 95% CI values.
100012501500175020002250250027503000
20 24 28 32 36 40 44 48 52
Mea
n bo
dy w
eigh
t (g)
Age (weeks)
Male Female

93
Figure 2. Mean daily gain during the laying period. Error bars are
95% CI values.
Egg production performance The age at which the chickens started laying their first egg was found to be 161.4 ± 2.88 days. The average number of eggs laid per hen per year was 221 ± 4.67 eggs. The rate of lay on the basis of hen-housed egg production per production cycle (52 weeks of production) was 60.6 ± 1.14%. The average egg weight at 52 weeks of age was 54.6 ± 3.07 g. The finding on percentage egg production (rate of lay) was comparable with the result (60.4 to 61.1%)reported by South African ARC- Animal Production Institute (2010).The finding on egg production performance of the current study was also comparable with the result of on-station study conducted at DZARC which was reported by Wondmeneh et al. (2011). However, Grobbelaar et al. (2010) reported a higher daily percentage (67.8%) of hen-housed egg production for the same breed under confinement. Mortality The average mortality rate during the brooding, growing and laying periods was 10.4 ± 2.19%, 3.10 ± 2.54%, and 0.94 ± 1.29%, respectively. There was high mortality during the first eight weeks of brooding period. It was mainly attributed to stress related to day-old chick transportation to the study sites which resulted in high first week mortality, i.e. 6.5%. The overall mortality (4.8%) during the experimental period (74 weeks) was relatively lower as compared to mortality result (22.2%) reported by Globbelaar et al. (2010).

94
References
Aberra Melesse. 2007. Poultry Production and Management in the Tropics: Teaching
material, Hawassa University, Collegue of Agriculture, Hawassa, Ethiopia. Pp. 177-192.
AlemuYami and TadeleDessie.1997.The Status of Poultry Research and Development in Ethiopia, Research Bulletin No. 4.Poultry Commodity Research Program, Debre Zeit Agricultural Research Center, Alemaya University of Agriculture, Ethiopia.
CSA.2014. Agricultural sample Survey. Report on livestock and livestock characteristics, Vol., II, Statistical Bulletin 573. Addis Ababa, Ethiopia.
Grobbelaar JAN, B Sutherland and NM Molalakgotla. 2010.Egg production potentials of certain indigenous chicken breeds from South Africa. Anim. Genet. Resour. Info., 46: 25–32.
Solomon Demeke. 2004. Egg production performance of local and White Leghorn hens under intensive and rural household conditions in Ethiopia. Jimma College of agriculture P.O. Box 307, Jimma, Ethiopia.
Statistical Packages for Social Sciences (SPSS). 2011. SPSS User’s guide version 20.0.SPSS Institute Inc., Cary NC. www.spss.com
Wondmeneh Esatu, Dawud Ibrahim, Alemayehu Amare, Meskerem Adamu and Tadios Habte. 2011. Enhancing the Genetic Basis of the Commercial Layer Industry through Introduction and Evaluation of Dual Purpose Chicken (Potchefstroom Koekoek Breed). Proceedings of the 19th Annual Conference of the Ethiopian Society of Animal Production (ESAP), Addis Ababa, Ethiopia, pp. 61-68.
Zaman MA, P Sørensen, and MAR Howlider. 2004. Egg production performance of a breed and three crossbreeds under semi-scavenging system of management. Livestock Research for Rural Development, 16(8).

95
Protective Effects of Moringa stenopetala Leaf Supplemented Diets on Eimeria tenella
Infected Broiler Chickens
Meskerem Adamu1 and Chaiwat Boonkaewwan2
1Ethiopian Institute of Agricultural Research, Debre Zeit Research Center, Ethiopia. Email – [email protected]
2Department of Animal Science, Faculty of Agriculture, Kasetsart University, Bangkok 10900, Thailand. Introduction Conventional disease-control strategies mainly rely on chemo-prophylaxis, which is a tremendous cost to the industry. Existing vaccines consist of live, virulent or attenuated Eimeria strains with limited protection against this pathogen. The continual emergence of drug- resistant strains of Eimeria, combined with the increasing regulations and a rejection on the use of anticoccidial drugs in commercial poultry production, urges the need for novel approaches and alternative control strategies (Dalloul and Lillehoj, 2005). It has been reported that antioxidant-rich plant extracts have potential benefits in treating coccidial infections (Allen et al., 1997; Naidoo et al., 2008). The nutrient contents of 3-year-old M. stenopetala leaf originating from Ethiopia and Kenya per 100 g fresh weight were found to contain dry matter (24%), protein (5.8 g), iron (5.4 mg), calcium (711 mg). The concentrations of total phenolics, antioxidant vitamins A, C and E on a dry weight basis were 94, 0.9, 88 and 1.6 µmol/g for phenolics, β-carotene, ascorbate and α-tocopherol, respectively (Yang et al., 2006). The nutrient composition of raw M. stenopetala leaf per 100 g on a dry weight basis was reported as: energy, 295.4 kcal; protein, 9.0%; fat, 5.8%; carbohydrate, 518%; crude fiber, 20.8%; Ca, 793 mg; P, 65.6 mg; Zn, 0.53 mg; Fe, 3.8 mg; β-carotene, 160 µg; and ascorbic acid, 28 mg (Cherinet et al., 2003). The amount of short chain fatty acid in M. stenopetala leaf was 103 mmol (Aberra, 2012). Nibret and Wink (2010) reported that 100 g of essential oil derived from M. stenopetala seeds, contained benzyl isothiocyanate

96
(54.30%), isobutyl isothiocyanate (16.37%), palmitic acid (14.57%) and oleic acid (up to 8.13%). Moringa is a small genus belonging to the family Moringaceae; the genus comprises 13 species of trees and shrubs distributed in Africa and Asia (Padayachee and Baijnath, 2012). Moringa oleifera or the Lam tree is a native of India, occurring wild in the sub-Himalayan regions of Northern India, and is now grown worldwide in the tropics and subtropics (Rajangam et al., 2001). Moringa species have a broad variety of uses in medicine, food, cosmetics and oil production; various parts possess many medicinal uses, pharmacological activities and provide sources of numerous medicinal compounds (Padayachee and Baijnath, 2012). Moringa stenopetala (Moringaceae) is endemic to East Africa which occurs in northern Kenya and Ethiopia (Bosch, 2004). Moringa stenopetala in tree form is known as aleko or shiferaw among local communities in Ethiopia and commonly grows to 6–10 m high. The tree is cultivated for leaves that are boiled and eaten like cabbage. The people use the tree not only for food but also as a medicine (Verdcourt, 2000; Yalemtsehay, 2005). It is used traditionally for the treatment of different diseases. The Turkana people of northern Kenya make an infusion of the leaf, which is used as a remedy against leprosy. In the Konso area of southern Ethiopia the smoke of burning roots is used as a treatment for epilepsy and the leaves of certain M. stenopetala trees are renowned for their effectiveness against diarrhea. In the Negelle and Wolayeta Sodo areas of Ethiopia, the leaves and roots are also used as a cure for malaria, stomach problems and diabetes. The leaves are also used to treat hypertension, retained placenta, asthma, colds, as an anthelmintic, to induce vomiting and to promote wound healing (Bosch, 2004). The extract of M. stenopetala leaf showed an antidiabetic effect in normoglycemic and alloxan-induced diabetic mice (Aschalew et al., 2011) and an antispasmodic property on uterus strips of guinea-pigs and mice (Yalemtsehay, 1999). The essential oil of M. stenopetala seeds and its main compound, benzyl isothiocyanate, showed the most potent trypanocidal activities (Nibret and Wink, 2010). Both the dried leaf and the fresh root extracts of M. stenopetala showed activity against Trypanosoma brucei (Yalemtsehay et al., 1999). However, the anticoccidial activity of M. stenopetala leaf was not investigated. The current study was therefore aimed to evaluate the anticoccidial effects of M. stenopetala leaf powder and its extract against cecal coccidiosis in broilers.

97
Materials and Methods
Experimental birds 150 one day-old broiler chicks were purchased from Alema (a private commercial broiler farm), Debre Zeit, Ethiopia. All experimental chicks were vaccinated against Newcastle and infectious bursal diseases. Chicks were placed in a brooder house for 18 days. Feed and water were offered ad libitum. The starter feed was formulated using maize, wheat bran, soybean, noug cake (Guizotia abysinica), limestone, vitamin premix and salt. Feed was provided without anticoccidial drugs. Collection and preparation of M. stenopetala leaf powder Fresh M.stenopetala leaves were collected during September and November 2011 from Yeki woreda, Tepi coffee farm, south western Ethiopia. The leaves were collected from 7-year-old trees and were dried under shade to avoid nutrient loss associated with exposure to direct sunlight. The leaves were dried for 15 days with a temperature and humidity ranges of 15–34oC and 60–70%, respectively. Leaves were stored for 2 weeks until the day before commencement of the experiment, when leaves were powdered using a mortar and pestle. Ethanol extracts preparation using hot continuous Soxhlet extraction method 500g s a m p l e s of M. stenopetala leaf powder were placed in a thimble made of filter paper and inserted into the wide central tube of the extractor of the Soxhlet apparatus. The solvent (ethanol) was placed in the flask and heated at 78oC and its vapors condensed in a reflux condenser. The condensed extractant was dripped into the thimble containing the crude drug, which was extracted by contact. When the level of the liquid in chamber was raised to the top of siphon tube, the liquid contents of the chamber were drained off into the flask. This process was continuous and was carried out until a drop of the solvent from the siphon tube did not leave any residue when evaporated (Handa, 2008). One mL aliquots of the filtrate were taken and concentrated. The concentration of Moringa solution was 50 mg/mL (23%). The extract was stored in a refrigerator for 1 week until used being mixed with feed.

98
Isolation and propagation of Eimeria oocysts Eimeria oocysts used in this study were isolated from chickens with clinical signs of cecal or “bloody” coccidiosis. E. tenella oocysts were identified by a combination of oocyst size, location in the gut, appearance of the lesions, and schizonts size (McDougald and Fitz-Coy, 2008). Following evisceration at post mortem, the cecal contents were washed into a beaker using tap water and oocysts were isolated using a flotation procedure (Permin and Hansen, 1998). Oocysts were sporulated within 72 h (Bowman, 2009). The sporulated oocysts were orally inoculated in two chickens for oocyst multiplication. Chickens were monitored daily for the development of clinical coccidiosis and the presence of Eimeria oocysts in their feces. The sporulated Eimeria oocysts were obtained as described earlier. Sporulated oocysts were suspended in 2% K2Cr2O7 solution and refrigerated at 4ºC until oral administration. The K2Cr2O7 solution was removed through centrifugation and the sporulated E. tenella oocysts were suspended in distilled water at the time of oral administration. Experimental treatments The experimental treatments were carried out using a completely randomized design. One hundred fifty chickens were randomly allotted to five treatments (n = 30), with three replications per treatment for a period of 2 weeks. The experiment was conducted at the Debre Zeit agricultural research center poultry farm. Treatments were applied beginning from day 18 of hatching. The chicks were supplemented with the different treatments throughout the experiment for a period of 2 weeks. At age of 18 d, chickens in treatments 2, 3, 4 and 5 were orally challenged with 12 × 104 sporulated E. tenella oocysts in 1 mL of distilled water suspension using a calibrated syringe. Chickens in the first treatment were not challenged. Two days after infection, the chickens in treatments 3, 4 and 5 were respectively supplemented with 0.6 g/L of amprolium in drinking water, 1.5 g/kg of M. stenopetala leaf powder and 1.5 g/kg of M. stenopetala leaf powder extract in feed. The chickens in the first (control check) and second (control) treatments were not supplemented (Table 1). Chickens were monitored daily for the presence of clinical signs.

99
Table 1. Experimental treatments, to evaluate the effect of Moringa stenopetala on coccidiosis caused by Eimiria tenella
Treatments Chicks Oocysts for challenge with 12×10
4 E. tenella
Control check (non-infected & unsupplemented) 30 _ Control (infected un supplemented) 30 + Feed with 1.5 g/kg of leaf powder 30 + Feed with 1500 mg/kg of extract 30 + 0.6g of amprolium/L in drinking water 30 +
– = No infection with oocysts, + = Infection with oocysts Data collection The efficacy of treatments was evaluated on the basis of survival rate, body weight gain (BWG), oocyst count and cecal lesion score. The number of dead chickens was recorded daily until day 7 post challenge. The body weight of all experimental chickens in each group was weighed twice—on day 18 (before challenge) and on day 7 post challenge. Feed intake of all experimental chickens in each group was weighed daily during the period of day 18 to day 7 post challenge. Fecal samples from all experimental groups were collected and checked before challenge; and no oocysts were detected. The oocyst count per gram of feces (OPG) was calculated using the technique described by Permin and Hansen (1998) and the OPG data was recorded during the period of day 4 to day 12 post infection. On day 7 after challenge, three randomly selected chickens in each group were euthanized by cervical dislocation for cecal lesion scoring according to the method of Johnson and Reid (1970). The scoring scale ranged from 0 to +4, where 0 = no lesion, 1 = mild lesion, 2 = moderate lesion, 3 = severe lesion and 4 = extremely severe lesion/death. Data analysis The data were analyzed using the analysis of variance procedure of the statistical analytical system (SAS, 2003). Tukey’s post hoc test was used to compare the means of BWG, feed intake, mortality and fecal oocyst count between treatments. Cecal lesion scores were analyzed using general linear models and the means of cecal lesion scores between treatments were compared using least square means. The difference between treatments was considered significant at the (P < 0.05) level.

100
Results and Discussion Oocysts count, mortality and lesion score Challenged chickens fed on a diet supplemented with either dry leaf powder or leaf extract showed significantly lower ocysts counts of 43 ± 3.46 and 25 ± 5.68 (P < 0.0001), respectively compared with those fed on un supplemented diets (939 ± 53.5). However, Moringa leaf supplemented diets did not reduce the mortality in E. tenella-infected chickens (Table 2). E. tenella-challenged chickens fed on the diet supplemented with M. stenopetala dry leaf powder showed a significantly reduced cecal lesion score of 3.44 ± 0.14 (P < 0.0001) compared to those fed on diets that were extract supplemented (3.56 ± 0.14) and un supplemented (3.89 ± 0.14), respectively, as shown in Table 3. Average daily gain and feed intake The average daily gain (ADG) of E. tenella-infected chickens fed on the diet supplemented with M. stenopetala dry leaf powder was significantly greater (5.59 ± 0.59 g, P < 0.0001) than in those fed on the extract supplemented and control (infected un supplemented) diets (3.66 ± 1.33 and 2.19 ± 1.25 g), respectively (Table 4).
Table 2. Oocysts count per gram of feces (OPG) and mortality rate in Eimiria tenella challenged chickens fed diet supplemented either with or without Moringa stenopetala, or with or without amprolium
a,b = Means in a column with different lowercase superscript letters differ significantly (P < 0.05).
Treatment OPG Mortality Control check (non-infected and un-supplemented) 0.0 ± 0.0b 0.0± 0.0b Control (infected un supplemented) 939 ± 54.5a 30 ± 20 a Infected + amprolium 30.0 ± 5.0b 00 ± 00b Infected + M. stenopetala leaf powder 43.0 ± 3.5b 23 ± 12ab Infected + M. stenopetala leaf extract 24.7 ± 5.7b 23 ± 15ab P-value 0.0001 0.011

101
Table 3. Lesion score results in Eimiria tenella challenged chickens fed diet supplemented either with or without Moringa stenopetala, or with or without amprolium
Treatment LSM lesion score
± SE Control check (non-infected and un-supplemented) 00.0 ± 0.14 c Control (infected un supplemented) 3.89 ± 0.14 a Infected + amprolium 3.22 ± 0.14 b Infected + M. stenopetala leaf powder 3.44 ± 0.14 b Infected + M. stenopetala leaf extract 3.56 ± 0.14 ab P-value 0.0001
a,b,c = Means in a column with different lowercase superscript letters differ significantly (P < 0.05); LS = Least squares means, SE = standard error
Table 4. Average daily gain (ADG) and average daily feed intake (ADFI) of E Eimiria tenella challenged chickens fed diet supplemented either with or without Moringa stenopetala, or with or without amprolium
Treatment ADG (g per chick)
ADFI (g per chick)
Control check (non-infected & un-supplemented) 16.18 ± 3.08a 47.73 ± 4.04a Control (infected un-supplemented) 2.19 ± 1.25c 36.73 ± 2.99 a Infected + amprolium 9.38 ± 0.36b 42.02 ± 4.98a Infected + M. stenopetala leaf powder 5.59 ± 0.59b 38.46 ± 5.75a Infected + M. stenopetala leaf extract 3.66 ± 1.33c 39.45 ± 1.51a P-value 0.0001 0.085
,b,c = Means in a column with different lowercase superscript letters differ significantly (P < 0.05).
The assay in this study was used to evaluate the anticoccidial effects of M. stenopetala leaf against E. tenella infection in broilers. The results showed that a diet supplemented with either M. stenopetala leaf powder or leaf extract could significantly reduce the oocyst count of E. tenella-infected chickens similarly to those supplemented with amprolium when compared to the control chickens. A diet supplemented with Moringa leaf powder could reduce the cecal lesion scores of E. tenella-infected chickens similarly to those supplemented with amprolium. However, increased cecal lesion

102
scores were observed in leaf extract or unsupplemented diet fed chickens. Previous studies have indicated that diets with antioxidant rich plant have anticoccidial activities (Allen et al., 1997; Naidoo et al., 2008). Moringa leaf is an excellent source of a wide spectrum of dietary antioxidants, such as phenolics and vitamins A, C and E that is, of β-carotene, ascorbate and α-tocopherol, respectively, (Cherinet et al., 2003; Yang et al., 2006), and short chain fatty acids (Aberra, 2012). The effects of Moringa might be associated with the dietary antioxidants because antioxidants are capable of scavenging free radicals (Sies, 1997). Sies (1997) discussed the process of oxidant uptake and the effect of antioxidants. Oxidants are formed as a normal product of aerobic metabolism but can be produced at elevated rates under patho-physiological conditions. Intestinal mucosal cells are exposed to a variety of reactive intermediates and xenobiotics and the rate of accumulation of products of oxidative damage in these cells is high. Intake of plant-based exogenous antioxidant capable of scavenging free radicals may help to limit the oxidative stress and prevent the damage caused by free radicals. Antioxidant defense involves several strategies, both enzymatic and non-enzymatic. In the lipid phase, tocopherols and carotenes as well as oxy-carotenoids are of interest, as are vitamin A and ubiquinols (Sies, 1997). Moringa stenopetala showed anticoccidial effect similar to Artemisia annua. Brisibe et al. (2008) and Dragan et al. (2010), reported significantly lower fecal oocysts and lesion scores in chickens infected with E. tenella and treated with Artemisia annua (an antioxidant rich plant), when compared to the E. tenella-infected and the non-treated control groups. It was also reported that immunized chickens fed on diets supplemented with 25 ppm selenium or 100 IU vitamin E/kg could increase the body weight gain and feed intake compared to control chickens fed on un supplemented diet after a challenge with E. tenella oocysts. Dietary supplementation with selenium or vitamin E could also reduce the mortality and could increase the body weight gain of the non-immunized chickens after a challenge with E. tenella oocysts (Colnago et al., 1984). Diets supplemented with 65 mg/kg levels of vitamin E could positively affect performance and improve humoral immune response, mainly in birds vaccinated against

103
coccidiosis (da Silva et al., 2009). Aberra et al. (2011) also indicated that chickens fed on M. stenopetala leaf meal (MSLM) diets showed higher average weight gain than those fed on the control diet. The dry matter and crude protein intake and average weight gain of chicks fed with MSLM diets increased with an increasing level of MSLM. Moringa stenopetala showed similar results to those reported by previous authors as M. stenopetala leaf is rich not only in dietary antioxidants but also in energy, protein, fat, carbohydrate and minerals (Cherinet et al., 2003; Yang et al., 2006). These may have contributed to the improvement in body weight gain. Chickens fed on a diet supplemented with M. stenopetala leaf powder showed significantly higher average weight gain than those fed on the un supplemented diet. However, the supplement did not reduce the mortality in E. tenella-infected chickens. Chickens fed on M. stenopetala leaf powder extract did not show improvement in average weight gain nor did the leaf powder extract reduce the lesion score of E. tenella-infected chickens. This could have been due to the hot extraction process. High temperature may affect the antioxidant effects of M. stenopetala leaf extract. Cherinet et al. (2003), showed that the ascorbic acid content in cooked M. stenopetala leaf was decreased by about ten-fold when compared to that in the raw leaf, probably due to oxidation of vitamin C in the leaf during cooking; The lack of improvement in the ADG and the no reduction in the lesion score of extract supplemented diet fed chickens or the h igher mortality in chickens fed a diet supplemented with extract or pwder could have been due to the duration of the M. stenopetala supplementation. In this study, chickens were fed on diets supplemented with Moringa leaf starting 2 days after challenge until 7 days post challenge. It has been reported that the regeneration of the epithelium and glands may be complete within 10 days in light coccidian infections (McDougald and Fitz-Coy, 2008); however, the epithelium may never completely recover in severe infections. In addition, the lost muscularis mucosa is not replaced, and the sub mucosa becomes densely fibrosed (McDougald and Fitz-Coy, 2008). Allen et al. (1997) reported that E. tenella infected chickens fed dried leaf of A. annua over a period of 3 weeks at a level of 5% could significantly reduce lesions. The supplementation of the diet with pure compounds of artemisinin over a period of 3 weeks also could promote weight gain in chickens infected with E. tenella. Its activity may depend on the length of time it is administered before a challenge.

104
In conclusion, supplementation of the diet with M. stenopetala dry leaf powder has a protective effect against E. tenella infection. It could improve BWG and reduce cecal lesions in E. tenella-infected chickens. Diets supplemented with either M. stenopetala dry leaf powder or leaf extract were also effective in reducing the numbers of oocysts shed; however, diets supplemented with Moringa leaf could not reduce mortality. The diets supplemented with Moringa leaf extract did not improve BWG and did not reduce the cecal lesion score of challenged chickens. This might have been due to the extraction process and the short period of time the Moringa supplementation was used. These results needs to be further investigated with cold extract and with a prolonged supplementation time of the diet supplemented with Moringa leaf. References
Aberra Melesse. 2012. Assessing the feeding values of leaves, seeds and seeds-removed pods of Moringa stenopetala using in vitro gas production technique. Afr. J. Biotechnol. 11: 11342–11349.
Aberra Melesse, Workenesh Tiruneh and Tegene Negesse. 2011. Effects of feeding Moringa stenopetala Leaf meal on nutrient intake and growth performance of Rhode Island Red chicks under tropical climate. Trop. Subtrop. Agroecosyst. 14: 485–492.
Allen PC, J Lydon, and HD Danforth. 1997. Effects of components of Artemisia annua on coccidia infections in chickens. Poult. Sci. 76: 1156–1163.
Aschalew Nardos., Eyasu Makonnen and Asfaw Debella. 2011. Effects of crude extracts and fractions of Moringa stenopetala (Baker f) Cufodontis leaves in normoglycemic and alloxan-induced diabetic mice. Afr. J. Pharm. Pharmacol. 5: 2220–2225.
Bowman DD. 2009. Diagnostic Parasitology, pp. 295–301 In: Bowman DD (ed). Parasitology for Veterinarians. 9th ed. Saunders, Elsevier Inc. New York, NY, USA.
Bosch CH. 2004. Moringa stenopetala (Baker f.) Cufod, pp. 395–397. In: . Grubben GJH and OA Denton (eds). PROTA 2: Vegetables/ Legumes. Wageningen, the Netherlands.
Brisibe EA, UE Umoren, PU Owai, and F Brisibe. 2008. Dietary inclusion of dried Artemisia annua leaves for management of coccidiosis and growth enhancement in chickens. Afr. J. Biotechnol. 7: 4083–4092

105
Cherinet Abuye, C, K Urga, H Knapp, D Selmar, AM Omwega, JK Imungi, and P. Winterhalter. 2003. A compositional study of Moringa stenopetala leaves. E. Afr. Med. J. 80: 247–252.
Colnago GL, LS Jansen, and PL Long. 1984. Effect of selenium and vitamin E on the development of immunity to coccidiosis in chickens. Poult. Sci. 63: 1136–1143.
da Silva ICM, AM Leal Ribeiro, C Wageck Canal, CC Pinheiro, M de Moraes Vieira, TA Gonçalves, R Alves Pereira, and L Lacerda. 2009. Broiler chicken responses to immunological stimuli as mediated by different levels of vitamin E in the diet. J. Appl. Poult. Res. 18: 752–760.
Dalloul RA and HS Lillehoj. 2005. Recent advancesin immune modulation and vaccination strategies against coccidiosis. Avian Dis. 49: 1–8.
Dragan L, A Titilincu, I Dan, I Dunca, M Dragan, and V Mircean. 2010. Effects of Artemisia annua and Pimpinella anisum on Eimeria tenella (Phylum Apicomplexa) low infection in chickens. Sci. Parasitol. 11: 77–82.
Handa SS. 2008. An overview of extraction techniques for medicinal and aromatic plants, pp. 21–103. In: Handa SS, SPS Khanuja, G Longo, and DD. Rakesh, (eds.). Extraction Technologies for Medicinal and Aromatic Plants. United Nations Industrial Development Organization and the International Centre for Science and High Technology. Trieste, Italy.
Johnson J and M Reid. 1970. Anticoccidial drugs, lesion scoring techniques in battery and floor-pen experiments with chickens. Exp. Parasitol. 28: 30–36.
Kinung SM, Tilahun Getachew, HM Hafez, Moges Woldemeskel, M Kyule, M Grainer, and MPO. Baumann. 2004: Assessment of economic impact caused by poultry coccidiosis in small and large scale poultry farms in Debre Zeit, Ethiopia. Int. J. Poult. Sci. 3: 715-718, 2004.
McDougald LR and SH Fitz-Coy. 2008. Coccidiosis, pp. 1068–1080. In Y.M. Saif, (ed.). Disease of Poultry, 12th ed. Blackwell. Ames, IA, USA.
Mersha Chanie., Tamiru Negash and Samuel Bekele. 2009. Occurrence of concurrent infectious diseases in broiler chickens is a threat to commercial poultry farms in Central Ethiopia. Trop. Anim. Health Prod. 41: 1309–1317.
Naidoo V, LJ McGaw, SPR Bisschop, N Duncan. and JN Eloff. 2008. The value of plant extracts with antioxidant activity in attenuating coccidiosis in broiler chickens. J. Vet. Parasitol. 153: 214–219.
Nibret E and M Wink. 2010. Trypanocidal and antileukaemic effects of the essential oils of Hagenia abyssinica, Leonotis ocymifolia, Moringa stenopetala and their main individual constituents. Phytomedicine 17: 911–920.
Padayachee B and H Baijnath. 2012. An overview of the medicinal importance of Moringaceae. J. Med. Plants Res. 6: 5831–5839.
Permin A and JW Hansen. 1998. T h e Epidemiology, Diagnosis and Control of Poultry Parasites. FAO Animal Health Manuals. Rome, Italy. 155 pp.

106
Rajangam J, ARS Manavalan, T Thangaraj, A Vijayakumar, and N Muthukrishan.
2001. Status of Production and Utilisation of Moringa in Southern India. Development potential for Moringa products, 29 October - 2 November 2001. Dar es Salaam,Tanzania.
Sies H. 1997. Physiological society symposium: Impaired endothelial and smooth muscle cell function in oxidative stress. Oxidative stress: Oxidants and antioxidants. Exp. Physiol. 82: 291–295.
Statistical Analysis System (SAS). 2003. SAS Online Doc 9.1.3. SAS Institute Inc., Cary, NC, USA.
Verdcourt B. 2000. Moringaceae, pp. 160–162. In Edwards, S., M. Tadesse, S. Demissew and I. Hedberg, (eds.). Flora of Ethiopia and Eritrea. Magnoliaceae to Flacourtiaceae. vol. 2, Part 1. The National Herbarium, Addis Ababa University, Addis Ababa, Ethiopia and Department of Systematic Botany, Uppsala University, Sweden.
Yalemtsehay Mekonnen. 1999. Effects of ethanol extract of Moringa stenopetala leaves on guinea-pig and mouse smooth muscle. Phytother. Res. 13: 442–444.
Yalemtsehay Mekonnen., V Yardley, P Rock, and S Croft. 1999. In vitro antitrypanosomal activity of Moringa stenopetala leaves and roots. Phytother. Res. 13: 538–539.
Yang RY, SCS. Tsou, TC Lee, LC Chang, G Kuo and PY Lai. 2006. Moringa, a novel plant rich in antioxidants, bioavailable iron and nutrients, pp. 224-239. In M. Wang, (ed.). Herbs: Challenges in Chemistry and Biology, Am. Chem. Soc. Washington, DC, US.

107
Fish Marketing Opportunities and Challenges around Gilgel Gibe Reservoir
Abebe Cheffo, Hiwot Teshome and Genanaw Tesfaye
Ethiopian Institute of Agricultural Research, National Fishery and Other Aquatic Life Research Center, Sebeta, Email - [email protected]
Introduction Fishery in Ethiopia is based only on inland freshwater capture fisheries. The inland capture fishery comprises: Rift Valley lakes (eg lakes Chamo, Abaya and Ziway and the northern part of Lake Turkana), Lake Tana, and reservoirs such as Koka and Fincha. There is a tremendous fishing activity in water bodies mentioned above, but fishing activity for commercial purpose is dominantly practiced in Lake Ziway, Hawassa, Chamo and Tana. In addition to these, Koka reservoir can also serve as good source for commercial fishing (Ann Gordon et al, 2007). In Ethiopia, there is an estimated total area of 857 km2 of reservoirs with an estimated potential of fishery harvesting of 4399 tons per year (MOA, 2013). These area coverage and production potential shows the country underutilized the resources. The main causes of the inefficient use of the fish resources in the country include of poor fishing gears and vessels, poor infrastructure like road, permanent market places, and hydroelectric services in major landing sites, poor market linkages and telecommunication services (Abebe et al, 2013). Materials and Methods The reservoir is located in Jimma Zone of Oromia regional state, around 260 km South-West of Addis Ababa and about 70km Northeast of Jimma (7o50’N, 37o 20’E) at an altitude of 1640 m (Gilgel Gibe Hydroelectric project, Environmental Impact Assessment, November 1997). The reservoir has an area at the maximum normal level is about 51square kilometers. The catchment area is 4,225km2 and average depth of 20 meters (Ethiopian Electric Power Corporation, February 2004). Three fish species namely Barbus intermediacy, Oreochromis niloticus

108
and Labeo barbus adapted well in the reservoir. However the dominant fish species are Oreochromis niloticus and Labeo barbus were comprising 38% and 62% respectively (Eskedar, et al, 2008). Both primary and secondary data were used in this study.. The primary data were collected through questionnaire administration, interviews, discussions, and personal observation in the field. In the study, data were collected from fishers and traders. The secondary data were obtained from consultation of documents of related studies. A representative sample was drawn from the fish marketing population. Sample size of the respondents was 50 fishers and 15 fish traders of Deneba, Sekoru and Jimma towns. The selection was done using proportionate sampling techniques. Data collected were mainly analyzed using descriptive statistics – means and percentages. Ordinary Least Square (OLS) was used as measure of econometric determinants of fish supply by fishers to market and STATA software was used for data analysis. Result and Discussion Demographic characteristics of fishers The mean age of fishers in the study area is 20 years which indicates that majority of the respondents were young. The education level of the respondents mainly lie on the primary level of formal education and on the average most respondents are grade 3. The majority of the respondents live with their parents and the average family size was five (Table1).The average amount of fish harvested per day was about 8 kilograms with price range of 15 to 32 birr and 17 to 35 birr per kilogram for filleted Barbus and Tilapia respectively. Fish marketing chain and distribution channel According to Elias, 2005 the present coffee domestic marketing structure of Ethiopia comprises individual farmers and former state coffee farms (now organized under Coffee Plantations Development Enterprise-(CPDE) on the production side and by service cooperatives, primarily coffee collectors and wholesale coffee suppliers, the Coffee Purchase and Sale Enterprise (now called the Ethiopian Coffee Export Enterprise-ECEE) and the huller operator on the processing and marketing side. This kind of complex market linkage is not observed in

109
fish marketing activities in the Gelgel Gibe area. The chain of distribution of fresh fish (Figure 1) is relatively short as compared to other products like coffee due to the nature of the product and poor storage/preservation methods. Fishers in most cases sell their catch for retailers in the areas for minimizing the loss of fish due to spoilage.
Table 1. Responses of different parameters with the average daily harvest of fish (Average number of fish=21 per day)
Parameters Mean value of the parameter
Range of sample size SD
Age of fishers (years) 20 17-59 4.25 Education (grade) 3 1-9 5.50 Family size 5 2-10 5.22 Average fish harvested per day (kg) 8 5-21 6.02 Price of filleted Barbus (Birr/kg) at landing sites 20 15-32 5.14 Price of filleted Tilapia (Birr/kg) at landing sites 25 17-35 3.81
Figure 1: Diagram showing fish marketing channel from Gilgel Gibe Reservoir
Major distributing channel of fish Channel I: Gibe Consumers Channel II: Gibe Sokoru Consumers Channel III: Gibe Addis Ababa Consumers Channel IV: GibeDeneba Jimma Consumers
Fishermen
Retailer Final consumer Wholesaler
Semi wholesaler
Retailer

110
According to this study, there are four channels of fish selling in the study area. The first channel is directly connecting fishers with consumers. This channel is mainly found in the main landing sites and the price ranges 15 to 20 birr and 17 to 24 birr per kilogram for filleted Carp and Tilapia respectively. The marketing strategy is selling the fish right after escaping from the water and there is no any preservation method of fish. The second channel manly concentrated in Sokoru town is targeting local inhabitant and passengers. There is a little price differences based on the form of the product. The first form is gutted without removing the flash and the price is 14 birr per kilo gram. The second form is filleted and packed with plastic and the price is 25 birr per kilogram. The third channel is a unique channel which wholesaler of Addis Ababa directly purchases the fish from fishers in bulk. There is no price range in this channel and the traders buy as much as possible without considering the fish size and freshness. In most cases the traders are illegal and transport the fish in the middle of night. The fourth channel is selling fish to Jimma consumers. This channel is characterized by selling whole, filleted and filleted with packing fish to local collector of Jimma. There was a wide range of prices differences based on the product type. The price was 14, 18 and 25 birr per kilogram of whole, filleted and filleted with packing fish respectively. Fish traders and market characteristics Table 2 presents the socio-economic profiles of fish traders in the study area. It appears that most of the small-scale fish traders are relatively young. In the four markets surveyed, approximately 68% of the respondents were under 40 years old. The gender composition represented 95 and 5% of male and female respectively. Mostly, the respondents operated in urban markets (61%) and some 39% operate along road side stalls on major roads leading to urban areas, The bulk of traders (75%) were married and have formal education level of grade 7. Fish trading was the sole means of income for the majority of the respondents (93%). Such occupations as transporting, brick making and civil service work also figure to some extent as additional means of livelihood for a small section of fish traders. The fish trading businesses of traders were financed by personal funds (not loans) responded by 84%. Access to credit is another obstacle faced by the small-scale fish marketing operators and this is partly due to lack of collateral necessary

111
to secure credit. It is not surprising therefore, that 100% of all traders interviewed did not have access to credit. Over 95 percent of the respondents have been operating their business for more than 1 year. The majority of the traders (73%) lived far (outside of 2 kilometers) from the market where they operate and refrigeration was the most common method used to preserve unsold fish. Marketing costs As noted by Kirema-Mukasa and Reynolds (1993), marketing costs vary widely between the different channels of fish trading operations. A retailer operating in a formally established market place mainly incurs marketing costs in storage of unsold products. In our sample the major market channels were wholesale and retail channels. In the wholesale channel, fish was bought from both fishermen at the landing site and from local collectors. Storage costs represent a substantial amount of the cost in both wholesale (0ne birr/kg) and retail (seventy five cents/kg) respectively. In addition to this, transportation of fish from the landing sites to the markets costs fifty cents /kg in the retail and wholesale markets respectively. Infrastructures In Ethiopian fishery fishing techniques are tremendously artisan, with very few motorized boats (limited to a very small number on Lake Tana and on some of southern lakes). Gill nets are the most common, but there is also some use of beach seines, cast nets and line-fishing (the latter for Nile perch) (Bereuil, 1995).Similarly in this study the main fishing gears used by fisher individuals in the reservoir are mainly gillnets and hooks and the line. In addition to this, there is high influence of hot weather in the area which lead faster spoiling rate of the fish. Thus, the daily catch of fishermen is very low as compared to water bodies of other rift valley lakes as well as reservoir of Koka (Abebe et al, 2013).This is due to using improper fishing gears, poor boat services and to some extent low culture of fish eating habit in areas near and little far of the Reservoir.

112
Table 2. Demographics and other characteristics of traders
Variable Category Frequency Percent Gender (male) 14 95 Age<40years 10 68 Marital Status(Married) 11 75 Education (5+years of Schooling) 15 100 Group Membership Yes 3 20
No 12 80 Type of Business Retailer 12 80
Wholesaler 1 7 Wholesaler and retailer 2 13
Market Location Deneba 2 13 Sekoru 2 13 Jimma 11 74
Other Occupation Yes 1 7 No 14 93
Type of Market Urban Market 11 74 Roadside Market 3 20 Other markets 1 6
Experience(1+years ) 14 95 Traded species* Tilapia 14 95
Other species 1 5 Distance to market (<2 kilometers) 4 27 Preservation Methods* Refrigerate 5 33
Other Methods 6 40 Access to Credit Yes 0 0 No 15 100 *Percentages do not add up to 100 due to missing data or because the responses fell in more than one category.
Production and marketing constraints The constraints of production of fish from Gelgel Gibe Reservoir was assessed and ranked by fishers based on the importance of the problems (Table 3). Fishers were categorizing their problems in to seven main categories. They rank, Lack of refrigerator , poor fishing gear and both

113
fishing gear and boat service in first, second and third order respectively. These ranking showed as the respected government and non-government bodies should do more on this regards in order to solve the problems by arranging credit facilities for buying the materials or offering these materials in kind and collect the money in long period of time.
Table 3. Major production constraints and their rated value by fishers
Constraint Frequency Percent Cumulative Poor fishing gear 14 28 28 Poor boat service 7 14 42 Poor fishing gear and boat service 8 16 58 Poor post-harvest handling 1 2 60 Lack of value adding facilities 1 2 62 Lack of facilities (refrigerator) 15 30 92 Lack of raw material for gear making 4 8 100
Total 50 100 Fish marketing constraints of the area also ranked by fishers. According to their rank (Table 4), low prices of fish at landing sites and hot weather influences take the lion share of it which is 58 and 22 percent respectively. These percentage shares depicted that fishers are very much discouraged by low prices of fish which ranges from 18 to 25 birr per kilogram of filleted fish. This range indicates that middle men are very much enjoying the differences of prices which stretch up to 50 birr differences per kilograms of filleted fish. Thus, Fishery cooperatives should strengthen their financial capacity for searching better markets. The other limiting factor is environmental influences. The area near to landing site is relatively hot and fishers were forced to put their catch in the water until they get buyers. This act can cause losing the quality of fish and lead them to get a low price. Opportunities of fishing in Gilgel Gibe Reservoir The existence of the Reservoir in the area creates many opportunity for local people in the area. It becomes an alternatives source of protein for people live in towns near the Reservoir. It also creates a job opportunity for young people and school boys of the area surrounding the Reservoir. In addition to this, farmers who do have marginal land can involve in fishing activity and support their subsistence life. In fish trading, there

114
are fish collectors, wholesalers and retailers. This trading activity creates many job opportunities along the value chain. The dam also creates job opportunities for people who are trained by maintaining fishing equipment.
Table 4. Marketing constraints and their rated values by fishers
Constraint Frequency Percent Cumulative Poor road accesses 3 6 6 Low prices of fish at landing sites 29 58 54 Poor linkage between fishers and traders 2 4 68
Dominancy of middlemen 3 6 74 Hot weather condition 11 22 96 Sanitary problems in market places 1 2 98 Conflict between buyers and sellers 1 2 100
Total 50 100 Econometrics results Nine explanatory variables were hypothesized to determine for fishers household level marketable supply of fish. Among these only four variables i.e., Farm size (FARMSIZE), means of transportation (TRANSMEAN), availability of off fishing activity (AVOFFAR) and marketing constraints(MARCONS) were found to be significantly affecting the household’s marketable supply of fish (Table 5).
Table 5. Determinants of fish supply by fishers (OLS result)
Variables Coefficient SE P value AGE 0.4213 0.3407 0.22 EDUCT -0.3440 0.2983 0.26 FAMILYSIZE 0.5092 0.3899 0.20 FARMSIZE -5.1420 2.9035 0.08* FISGIRAV -2.3363 2.0015 0.29 TRANSMEAN 0.6601 0.3335 0.04** AVOFFAR 0.3652 0.1265 0.08* PROCONS -6.4200 3.8547 0.11 MARCONS -5.3259 2.9855 0.09* R SQUEAR 0.6944 P value 0.0003 Cons 13.7565 7.1718 0.06 *significant at p=0.1, **significant at p=0.05

115
Farm size (FARMSIZE) Availability of farm land was negatively and significantly related to the supply of fish in the study area. This could be explained as fishers who have more farming land, the time spent on fishing activity becomes short and as a consequence the amount of fish supply to market becomes small. Means of transport (TRANSMEAN) This variable is positively and significantly affects the amount of fish supplied to market. Fishers who have accesses to animal driven cart or live animal transport facility can deliver more fish than those who do not have. Availability of off fishing activity (AVOFFAR) This activity positively affects the amount of fish deliver to market. This is because fishers who do have other means of income can easily buy or maintain fishing equipment as compared to fishers who do not have such accesses. Marketing constraints (MARCONS) Marketing activities are very crucial for fish activities. If fishers are confident enough to have market for their catch, they can spend more time on fishing activities and harvest more fish. Marketing constraints are negatively and significantly affects the amount of fish deliver to markets. References
Abebe Cheffo, Lemma Zemedu and Endrias Geta. 2013. Market chain analysis of Koka
reservoir fish in Ethiopia. Msc thesis in Agricultural Economics, Haramaya University, PP 5-12
Ann Gordon, Sewmehon Demissie Tegegne and Melaka Tadesse. 2007. Marketing systems for fish from Lake Tana, Ethiopia: Opportunities for marketing and livelihoods. p5.
Beierlein JG and MW Wooverton. 1991. Agribusiness Marketing: The Management Perspective. Prentice Hall New Jersey, U.S.A.
Breuil C. 1995. Review of the Fisheries and Aquaculture Sector: Ethiopia. FAO ( Food and Agriculture Organization of the United Nations), Rome, Italy.

116
Crammer GL, CW Jensen, and DD Southgate. 2001. Agricultural Economics and Agribusiness (Eight Edition) John Wiley and Sons, Inc., New York, U.S.
Dereje TK. 2004. Spatial and temporal distributions and some biological aspects of commercially important fish species of Lake Tana, Ethiopia: J. Coastal Life Med. 2(8):589-595
Elias Abebe, 2005. Economics of Coffee Bean Marketing: A Case study of Goma district in Jimma zone of Ethiopia. Msc. Thesis, Alemaya University. PP 15-16.
Kirema Makasa CT and J Eric Reynolds. 1993. Marketing and consumption of fish in Uganda, in Marketing and consumption of fish in eastern and southern Africa: Selected country studies, FAO Fisheries Technical Paper No. 332, Rome: Food and Agriculture Organization of the United Nations, 1993.

117
Biological and Physico-Chemical Limnology of Gilgel Gibe Reservoir
Kibru Teshome, Abelneh Yimer, Esayas Alemayehu
Ethiopian Institute of Agricultural Research, National Fisheries and other Aquatic Life Research Center Sebeta, Email – [email protected]
Introduction Limnological and hydrological studies in Ethiopia began in the 1960s for some water bodies. Being landlocked since 1990s, the country is endowed with varieties of lentic and lotic water bodies with unique and varying limnological characteristics (Zinabu, 1998). According to Greboval et al (1994), the total area of water bodies in the country is estimated to at 8,800 square kilometers, 0.72 percent of the total area. The rift valley lakes and some highland lakes were investigated for decades in which many of them were found to be biologically highly productive (Tudorancea et al, 2002). Although less studied, the lotic water bodies consist of 8 major river basins some of which are gradually being dammed mainly for the purpose of hydroelectric generation. Consequently, medium to large water reservoirs are coming to existence. Lake Aba Samuel, though small in size, is the first such reservoirs created on River Akaki some 30 km South of Addis Ababa. Later in the 1950s, even a much larger Lake Koka was created mainly for power generation after a dam was put on River Awash. Gilgel gibe I reservoir was created behind a dam on River Gilgel-gibe for the same primary purpose. Many of those reservoirs now support both riverine and lacustrine type of ecosystem in terms of hydrological, morphological and nutrient dynamics (Agostinho and Gomes, 1997; Wetzel, 2001; Calisto et al. 2005). The biological and physico chemical characteristics of newly formed reservoirs like Gilgelgibe-I are determined by the water quality of the rivers and the surrounding riparian land use pattern (Torloni, 1994). The physicochemical and biological limnology of a reservoir in turn determines the type of fish species, the stock size and the sustainability of capture fishery. In the relatively young Gilgel Gibe-I reservoir, a few scientific investigations on some faunal and physico

118
chemical features exist. Argaw Ambelu et al (2013) studied macro invertebrate assemblage and some water quality parameters where it was concluded that the formation of the dam led to poor macro invertebrate diversity both in the downstream river and the reservoir due to water level fluctuation, young age of the reservoir and reduced ecological downstream flow (Ambelu et al, 2013). In earlier studies by Devi et al(2007), it was noted that siltation, sediment load, high turbidity and high nutrient content (above permissible limit of WHO) such as phosphates, sulphates, nitrates and total suspended solids (TSS) to be the major problems in the reservoir. The catchment of Gilgel Gibe-I Reservoir is characterized by intense deforestation, land cultivation, landslides and accelerated erosion whose combined effect led to sediment yield of 11 ton/ha/year to the river and eventually to the reservoir (Broothaerts et al, 2012). Seasonal water level fluctuation, sedimentation, siltation and nutrient enrichment are processes that affect the temporal variation in physic-chemical and biological features and the entire ecosystem service such as reservoir fishery and recreational amenities. However, comprehensive temporal and spatial data on planktonic diversity and abundance, physic-chemical parameters as well as information on mixing patterns in the Gilgel Gibe-I Reservoir is lacking which is the main aim of this study. Materials and Methods Description of the study area Gilgel Gibe Reservoir is found in Jimma Zone, some 265 km Southwest of Addis Ababa, the capital of Ethiopia and 60 km East of Jimma Town. It is located at N 7o48.300’, E 37o19.582’ at an altitude of 1670 m a.s.l. It is a man-made lake created in 2003 after a hydroelectric dam was erected on River Gilgel Gibe (Fig.1). The total reservoir area shows greater fluctuation year round but ranges from 50-60 km2 with a maximum depth up to 20m at the river channel near the 41m dam (MME-EELPA, 1997). A buffer zone up to 0.5 km wide was initially assumed. Its water level fluctuates from 1653 to 1671 m year round (Pietrangeli and Pallavicini, 2007). It is located in a region with moderate rain fall (mean annual precipitation of 1263 mm 2008 to 2010) (NMA, 2012) and warm temperature (mean daily maximum temperature of 27.5oc) (NMA, 2012).

119
Samplings and measurements One near shore (NS) and one off shore (OS) sampling stations were determined with the near shore sampling site significantly drifting during the sampling period due to fluctuation in water level as the water is siphoned to the power generation system. Monthly samples of plankton were collected over a year period. Samples for vertical distribution of zooplankton along depth intervals (surface, 0.5m, 1m, 3m, 5m, 7m, 10m and 15m) were collected twice which corresponded to the dry and wet seasons. Plankton samples were taken with 40µm net from each sampling sites. For quantitative samples 5 liter point sampler (Model: UWITEC) was used to pull water samples from defined depth intervals. The water was then filtered through 40µm mesh net. Physicochemical parameters such as water temperature, dissolved oxygen content, pH, conductivity, Secchi depth transparency (SDT) were measured in situ at different depths. A 20 cm Secchi disk was used to measure SDT while WTW electrochemical probes were used for the in situ measurements of the remaining parameters. Sampling was carried out between October 2012 and September 2013. Laboratory analysis Phytoplankton and zooplankton samples for 9 months were analyzed qualitatively through microscopic examinations. Relative abundance was considered based on a three scale scoring (1=rare, 2=abundant, 3=most dominant), quantitative analysis was carried out for vertical distribution of zooplankton for two periods by counting with stereo zoom microscope on counting slides. Data analysis Descriptive analysis was used to reveal the major trends in physic-chemical parameters. Two tailed t-test were employed for pair wise comparisons of independent samples (offshore and near shore stations). SigmaPlot v.10 and XLSTAT Pro v.7.5 were used for graphical presentation of data and statistical analyses respectively.

120
Results and Discussion Physico-chemical parameters Temperature and dissolved oxygen (DO) content The mean annual surface water temperature of Gilgel Gibe Reservoir was 23.7±0.4oc (SE) in which the coldest and warmest surface water were observed in March and September respectively. These surface water temperature extremes corresponded to minimum (20.5oc) and maximum (27 oc) air temperatures, consistent with previous studies on similar reservoirs such as Koka (Degefu et al, 2011). Except superficial surface warming in August with thermocline above 1m depth, thermal depth profile revealed that the water is holomictic. Apparently, thermoclines develop near the surface followed by wind induced mixing. An exceptional deep stratification was observed in August 2013 which is attributed to a period of calm weather that persisted over a few days before the sampling day. Therefore, it is not surprising that, a polimictic condition persisted during most of the study period since the reservoir is located in a plain topography with little wind protection. The water column undergoes mixing on daily basis. We also hypothesize that significant river discharge from the main river course may also contribute to the mixing. The seasonal thermal profile exhibited some similarity with another shallow reservoir, Lake Koka in Ethiopia’s Rift Valley which also undergoes intermittent shallow stratification due to surface heating (Degefu et al., 2011). Dissolved oxygen content is the most important environmental parameter in structuring secondary producers and heterotrophic communities in the aquatic food web. Zooplankton communities require different level of oxygen which is often species specific (Wetzel 2001). The water column was oxygenated throughout during most of the sampling period except intermittent chemo cline formation from February to March. The surface water is often supersaturated reaching up to 10mg l-1 with a mean DO content of 8.02 ± 0.80 mg/l (SE). The oxygen super-saturation at the surface is attributed to atmospheric diffusion and increased photosynthetic oxygen production by the dominant cyanophytes Microcystis sp. and Anabaenna sp. which forms thin scum at the surface.

121
Most tropical fish species require DO level above 3mgL-1 but some can still tolerate DO level as low as 2mg/l (Liebmann, 1960; Popma and Lovshin, 1996). Bottom water becomes anoxic in February and March (up to 1mgL-1) but remains well above 2.5 mgL-1 during the rest of sampling season. Thus, dissolved oxygen level in Gilgelgibe reservoir is above the threshold value for the fish species O. niloticus, Labeobarbus sp. and Gara sp. (Popma and Lovshin, 1996) The pH values are slightly alkaline at the surface reaching 9.09 in September which is attributed to increased photosynthetic activity mainly by the cyanophytes. Increased CO2 uptake leads to accumulation of HCO3
- which increased the pH values at the surface compared to the rest of the water column. The hypolimnion is nearly neutral during the study period with slight decrease in pH down the water column. Conductivity, salinity and Secchi disk transparency (SDT) Seasonal variation in vertical conductivity profile of Gilgel Gibe Reservoir indicates no chemo cline except in the upper 0.5 m depth. Surface conductivity values at the open water station increased from 82.2µScm-1 during medium water level season in January to 106µScm-1 during the low water season in April which then decreased towards June with mean conductivity of 93.8±3.7µScm-1(SE). Conductivity measured slightly higher at the littoral station (94.4±3.4) during most of the sampling periods although statistically not significant (P>0.05; n=7). Vertical conductivity profile indicates no chemo cline except the upper 0.5 m depth where surface heating raises the temperature and hence increased conductivity. Sudden increase at the bottom is attributed to an artifact caused by sensor contact with the bottom sediment. However, despite, high level of erosion in the rivers catchment and increased sediment influxes (Devi et al, 2007; Broothaerts et al, 2012; Ambelu, 2013), both conductivity and salinity of Gilgel Gibe Reservoir are still far lower than other dilute freshwater reservoirs like Koka (286 µScm-1 and 200mg/l ) (Elsabeth Kebede et al, 1994) and sometimes reaching above 400 µScm-1(Zinabu Gebremariam, 2002).Salinity was measured between 40 to 50mgL-1 with mean values of 46.7±3.3 and 43.7±3.2mg/l (SE) at both littoral and offshore stations respectively. There was no significant difference over seasons (p>0.05; n=4) despite

122
the differences in mean values, a similar trend as conductivity. The reservoir is only about a decade old. The bed rock is not well exposed and rather rapidly being filled with silt and sand (Devi et al, 2007). This implies that mineral dissolution is low leading to very low electrical conductivity and salinity which predict low ionic content. Catchment geology and bed rock type are best predictors of stream water chemistry (Olson, 2012). The Secchi depth transparency (SDT) is the measure of light penetration in to the water column. The SDT exhibited variation with Lowest (9cm) and highest (30cm) occurring in July (wet season) and February (dry period) respectively with mean SDT of 20.3±2.2cm at the OS site. Secchi disk transparency (SDT) is a measure of light penetration in to the water column (Wetzel, 2001) Even though, it is used as surrogate index for determination of planktonic biomass and trophic status of water bodies, it can be affected by presence of suspended solids other than planktons, a phenomenon known as mineral turbidity. In young reservoirs like Gilgel Gibe with a flood plain hydrological feature, increased river discharge in the wet season result in massive sediment influx due to erosion in the catchment. This resulted in high turbidity and therefore low SDT. During the dry season, much of the sediment settles to the dam bottom and the transparency improves where light can penetrate up to 30 cm deep, closing the optimal transparency for mesotrophic systems (Carlson, 1977). Planktonic diversity and abundance Phytoplankton The phytoplankton community was composed of mainly three divisions: Cyanophyta (Blue green algae), Cholorphyta (green algae) and Bacillarophytes (diatoms) although the Dinophytes and Euglenophytes were each represented by one species in rare occasion. The cyanophytes which were represented by Microcystis sp. and Anabaenna sp. were the dominant groups during most of the study period (Figure 1a). The small colonial forms Pediastrum simplex, P. duplex and Scenedismus sp dominated the chlorophytes along with rarely encountered species such as Staurastrum sp., Botriococcus sp and Spirogyra sp.

123
Figure 1. Seasonal variation in relative abundance of (a) phytoplankton, (b)
zooplankton and (c) wet and dry season vertical distribution of zooplankton communities in Gilgel Gibe reservoir

124
The chlorophytes were observed in moderate abundance between January to June at both offshore and on shore stations. There was no marked seasonal variation between the two sites (Figure 1a). The diatoms were encountered only during the rainy periods of June, July and August and were generally rare. They were represented by three species, Suriella sp, Navicula sp and Synedra sp. The diatoms appeared to be the dominant groups exceptionally at the near shore station in July. These results are consistent with that of Davis et al (2009) and Imai et al (2006) where higher temperature during the dry season favors fast growing cyanophytes as nutrient is not limited in the reservoir (Ambelu, 2012). Furthermore, the high turbidity in Gilglgibe reservoir favored cynobacteria as these groups can keep themselves buoyant with the help of the gas vesicles and their increased tolerance to the incoming UV radiation at the surface (Chaffin, 2009; Ma and Gao, 2009). Zooplankton Zooplankton assemblage in the reservoir consisted of the copepods, Cladocerans and the Rotifers. The copepods are more abundant during much of the study period (Figure 1b) while there is a seasonal community shift from cladoceran co dominance during the dry season to rotifers during the wet season (Figure1b). The zooplanktons were present throughout the water column with increased abundance (up to 75 individuals per liter) as food from bactrio-plankton and oxygen through continuous vertical mixing enables them to flourish (Figure 1c). The seasonal abundance of zooplankton in Gilgel Gibe reservoir followed a similar trend with lake Ziway, a fresh water body in the mid rift valley (Adamneh Dagne, 2011) where copepods dominate the zooplankton biomass. Large cladoceran such as the Moina micrura and Daphnia barbata are generally rare while Cerodaphnia cornuta and Diaphanasoma excisum dominated the cladoceran community. This is not unexpected as Microcystis dominated water body where cladocerans are inefficient filter feeders on colonial cyanophytes and hence nearly absent at the surface due to the intense competition from copepods. Additionally, since cladocerans are the preferred prey for juvenile fish (Adamneh Dagne, 2010) they tend to escape this by migrating towards the bottom as can be seen from the vertical distribution. During the peak rainy season, the rotifers outnumbered the cladocerans as they can efficiently

125
filter feed on suspended particles coated with organic material (Hart, 1988; Kirk, 1991) and selective feeding on algae (Kirk and Gilbert, 1990). In consistent with some evidences indicating the better adaptation of large sized calanoid copepods, and the mid-sized cladocerans such as Moina and Diaphanasoma to mineral turbidity than any other crustacean zooplankton (Threlkeld 1986a; Hart 1988), the copepods, Cerodaphinia. and Diaphanasoma are the dominant representative of the respective zooplankton communities in Gilgelgibe reservoir which is in turn characterized by high turbidity. Therefore, we conclude that factors such as turbidity and Microcystis bloom favored abundance of copepods, and mid-sized cladocerans while presence of bacterioplankton from decomposing organic matter from the relatively young reservoir favored rotifers while predation pressure and increased mineral turbidity was a disadvantage for large cladocerans. Albeit the overall high primary and secondary production has positive implication for increased body condition of fish species such as the O.niloticus with filter feeding adults, the copepods, the dominant zooplankton group might not be efficiently filtered by both juvenile and adult fishes due to their special movement pattern that enables evasion of predator. Hence it is possible that this significant biomass is not efficiently transferred to fish biomass. The abiotic factors such as mixing pattern, increased turbidity and high nutrient content were responsible for structuring of phytoplankton and zooplankton communities. The abiotic factors are heavily influenced by physical land processes such as removal of vegetation cover and the resulting accelerated erosion and high siltation rate in the water shade (Ambelu, 2013).Consequently, the reservoirs biota is characterized by increased abundance and low diversity which is typical of eutrophic tropical water bodies. In particular, high turbidity and nutrient content favored the cyanophytes which in turn favored the dominance of copepods as top grazers. Moreover, if increased nutrient content is to persist in the future especially at the time of rising temperature as result of regional climate change, toxic cyanophytes can emerge (Davis et al, 2009) leading to mass fish kill as observed in some other water bodies in the country (Tadese Fetahi, 2011; Teshome et al, in press). It is therefore noteworthy that the sustainable fisheries in the reservoir is entirely dependent on the state of the surrounding catchment which affects both biotic and abiotic factors, their interactions and likely

126
implication on economically important fish species. In fact, the state of the catchment also determines the fate of the reservoir itself and its power generation capacity. The catchment restoration measures frequently suggested such as forestation and better farming practices need to be implemented in the vast catchment area in order to sustain the reservoirs age and its ecosystem services. Refrences
Adamneh Dagne. 2010. Zooplankton community structure, population dynamics and
production and its relation to abiotic and biotic factors in Lake Ziway, Ethiopia. Phd Dissertation, University of Vienna, Austria.
Agostinho AA and LC Gomes. 1997. Manejo e monitoramento de recursos pesqueiros: perspectivas para oreservatorio de Segredo.In: Agostinho AA, Gomes LC, editors. Reservatorio de Segredo: bases ecologicas para omanejo. EDUEM, Maringa.p. 319–364.
Argaw Ambelu, K Lock, and PLM Goethals. 2013. Hydrological and anthropogenic influence in the Gilgel Gibe I reservoir (Ethiopia) on macro-invertebrate assemblages. Lake and Reservoir Management, 29:3, 143-150.
Broothaerts N, E Kissi, J Poesen., A Van Rompaey, K Getahun, E Van Ranst, J Diels. 2012 Spatial patterns, causes and consequences of landslides in the Gilgel Gibe catchment, SW Ethiopia. Catena. 97 (2012) 127–136.
Calisto M, M Goulart, FAR Barbosa, and O Rocha. 2005. Biodiversity assessment of benthic macro-invertebrates along a reservoir cascade in the lower Sao Francisco river Northeastern Brazil). Braz J Biol. 65:229–240.
Carlson RE. 1977. A trophic state index for lakes. Limnology and Oceanography. 22:361-369.
Chaffin JD. 2009 Physiological Ecology of Microcystis Blooms in Turbid Waters of Western Lake Erie. MSc thesis, University of Toledo, Biology (Ecology).
Davis WT, DL Barry, GL Boyer, and CJ Gobler. 2009 The effects of temperature and nutrients on the growth and dynamics of toxic and non-toxic strains of Microcystis during cyanobacteria blooms. Harmful Algae. Vol. (8) 715–725.
Devi R, E Tesfahune, W Legesse, B Deboch. 2008. Assessment of siltation and nutrient enrichment of Gilgel Gibe dam, Southwestern Ethiopia. Bioresour Technol. 99:975–979.
Elizabeth Kebede and Ameha Belay 1994. Species composition and phytoplankton biomass in a tropical African lake (Lake Awassa, Ethiopia). Hydrobiologia, 288: 3-32.

127
Fasil D, T Kibru, T Gashaw, T Fikadu T, and L Aschalew . 2011 Some Limnological observation on shallow tropical artificial Lake Koka, Ethiopia. Journal of Recent Trends in Bioscience. Vol.1. No.1.
Greboval D, M Bellemans, and M Fryd. 1994. Fisheries characteristics of the shared lakes of the East African Rift. CIFA Technical Paper No. 24. Rome: FAO.
Hart H. 1988 Zooplankton feeding rates in relation to suspended sediment content: Potential influences on community structure in a turbid reservoir. Freshwater Biol. 19: 123-l 39.
Imai I, Yamaguchi M, Hori Y 2006 Eutrophication and occurrences of harmful algal blooms in the Seto Inland Sea, Japan. Plankton Benthos Res 1: 71-84.
Kirk KL and Gilbert JJ. 1990. Suspended clay and the population dynamics of planktonic rotifers and cladocerans. Ecology 71: 1741-1755.
Kirk KL. 1991. Inorganic particles alter competition in grazing plankton: The role of selective feeding. Ecology 72: 9 15-923.
Koenings JP, RDB umm, and JM Edmundson. 1990. The exclusion of limnetic Cladocera from turbid glacier-meltwater lakes. Ecology 71: 57-67.
Liebmann H. 1960. Handbuch der Frischwasser und Abwasserbiologie. II. München. (Cited by EIFAC 1973. (Threshold ammonia).
Ma Zengling, Kunshan Gao 2009. Photosynthetically active and UV radiation act in
an antagonistic way in regulating buoyancy of Arthrospira (Spirulina) platensis (cyanobacterium). Environmental and Experimental Botany 66 (2009) 265–269.
[MME-EELPA] Ministry of Mines and Energy: Ethiopian Electric Light and Power Authority .1997. Gilgel Gibe hydroelectric project environmental assessment main report. Addis Ababa (Ethiopia). 100 p.
Olson John R. 2012. The Influence of Geology and Other Environmental Factors on Stream Water Chemistry and Benthic Invertebrate Assemblages. All Graduate Theses and Dissertations. Paper 132.
Pietrangeli A and I Pallavicini. 2007. Hydroelectric cascade plants in the Omo basin in Ethiopia. International Commission on Large Dams 75th annual meeting; Dam safety management: role of state, private companies and public in designing, constructing and operating of large dams. Saint Petersburg, Russia. 10 p.
Popma TJ and LL Lovshin. 1996. Worldwide Prospects for Commercial Production of Tilapia”. R and D Series 41, International Center for Aquaculture and Aquatic Environments, Department of Fisheries and Allied Aquacultures, Auburn University, Alabama 36849, USA.
Robinson. 1957. The effects of suspended materials on the reproductive rate of Daphnia magna. Publ. Inst. Mar. Sci. 4: 265-277.
Torloni CE. 1994. Management of fishing resources in CESPs reservoirs. Acta Limnol Brasil. 5:177–186.

128
Tudorancea C and Taylor WD. 2002. Ethiopian Rift Valley Lakes. Biology of Inland Water Series; Backhuys Publishers; PP. 61-93.
Wetzel RG. 2001. Limnology: Lake and River Ecosystems. 3rd edition, Academic Press, N. Y; pp.338.
Zinabu Gebre-Mariam. 1998. Human Interactions and Water Quality in the Horn of Africa, American Association for advancement of Science (AAAS), Africa Program; Science in Africa: Emerging Water Management Issues. A symposium Proceeding, February, 1998 Pennsylvania, PA.
Zinabu Gebre-Mariam. 1994. Long term changes in indices of chemical and productive status of group tropical Ethiopian lakes with differing exposure to human influences. Arch Hydrobiologia 132:115-125.
Zinabu Gebre-Mariam. 2002. The Ethiopian Rift Valley lakes: Major threats and strategies for conservation. In: Tudorancea C and Taylor DW (eds). Ethiopian Rift Valley lakes, pp.259- 271. Backhuys Publishers, Leiden. The Netherlands.

129
The Biology of Oreochromis niloticus and Labeobarbus intermedius
in Gilgel Gibe Reservoir
Esayas Alemayehu, Zenebe Tadesse, Fekadu Tefera, and Genanaw Tesfaye
Ethiopian Institute of Agricultural Research, National Fisheries and Aquatic Life Research Center, P.O.Box 64, Sebeta - Email – [email protected]
Introduction The vast number of literature on length weight relationship, condition factor, reproduction, growth and food and feeding habit of fish are epitomes of the importance of studying the biology of a particular fish species. These aspects of the fish biology are also inputs to a number of models (e.g. Bioenergetics, Ecopath), that enhanced our understanding of a species at both population and ecosystem levels. Length-weight relationship gives information on the conditions and growth patterns of fish. It provides the health and general wellbeing of a fish as related to its environment (Bagenal and Tesch, 1978). The condition factor or simply the wellbeing of fish, which is a derivative of the length-weight relationship, measures the corpulence of the fish. The condition factor varies between species and within the same species with sex, age and other variables. It is important as it is employed to compare populations living under similar or different levels of food availability, density and climate (Demeke Admassu, 1990). It is also used in determining the timing and duration of gonadal development and of growth pattern (Demeke Admassu, 1990). The feeding activity of fishes over time could also affect their condition factor. It is, therefore, apparent that knowledge of the condition factor of fishes is a necessary prerequisite to demographic analysis of a fish population. Knowledge on the diet composition and natural feeding of fish permit the identification of the trophic relationships, feeding composition, structure and stability of food webs present in aquatic ecosystems (Post, 2000; Abdel-Aziz and Gharib, 2007), and hence are the basis for the development of successful fisheries management program (Oso et al., 2006).

130
Due to its wide distribution and commercial importance, the Nile tilapia (Oreochromis niloticus) is the most studied fish species in Ethiopia, if not in the world. It inhabits lakes, reservoirs, rivers, impoundments and fish ponds. The biology of the species was the subject of numerous studies in Ethiopia (Demeke Admassu, 1990, 1994; Zenebe Tadesse, 1988, 1997; Getachew Tefera, 1987, 1993; Getachew Tefera and Fernando, 1989; Getachew Tefera and Zenebe Tadesse 1998; Getachew Tefera et al., 2000; Tudorancea et al., 1988; Yirgaw Teferi et al., 2000; 2002). Generally speaking, O. niloticus is an herbivore (Getachew Tefera, 1987, 1993; Getachew Tefera and Fernando, 1988; Getachew Tefera et al., 2000; Yirgaw Teferi et al., 2000; 2002), feeding mainly on plankton (Getachew Tefera, 1987, 1993, Yirgaw Teferi et al., 2000) and displaying an ontongenic shift from zooplankton to phytoplankton as it grows up (Getachew Tefera, 1993, Yirgaw Teferi et al., 2000).The condition factor and the length weight relationship of the species are the factors of its feeding (Yirgaw Teferi and Demeke Admassu, 2002), reproduction (Zenebe Tadesse, 1998), and season (Yirgaw Teferi and Demeke Admassu, 2002). The Labeobarbus intermedieus is one of the morphotypes of the famous species flock in Lake Tana (Nagelkerke et al., 1994). Along with other species of the genus, it is one of the commercially important species in the country (Abebe Getahun, 2007). Its widespread distribution is only rivaled by O. niloticus. Studies on the species focused primarily on its taxonomy, diversity and spawning migration (Nagelkerke et al., 1994; Nagelkerke and Sibbing, 1996; de Graaf, 2003; Shewit Gebremedihen, 2012; Wasie Anteneh et al., 2008). The biology of the species got attention in a number of studies including its food and feeding habits (Demeke Admassu and Elias Dadebo, 1997; Shewit Gebremedihen, 2014).These few studies revealed that L. intermedieus is an omnivore feeding on the bottom of the lake and its feeding and reproduction depends on seasonal changes in rain and temperature (Nagelkerke et al., 1994; de Graaf, 2003; Shewit Gebremedihen, 2012; Wasie Anteneh et al., 2008). As mentioned in the above paragraphs, the biology of the two species has been studied in most Ethiopian lakes and reservoirs. However, the sex ratio, condition factor, length-weight relationship, food and feeding habits of the two species in Gilgel Gibe Reservoir is unknown. The

131
present study was therefore, conducted to generate crucial information about the above mentioned aspects of their biology that will be used in future studies and management plans in the reservoir. Materials and Methods Description of the study area Gilgel Gibe Reservoir (7o79’N, 37o27’E) is located some 265 kms South West of Addis Ababa (Figure 1). It is formed when Gilgel Gibe River was dammed for hydro-electric power generation. The dam was completed and started operation in 2004. This reservoir is designed for a live storage of 657 million m3 and a dead storage of 182 million m3 water (MME-EELPA, 1997). It operates at reservoir water levels between 1653 and 1671ma.s.l. and has an average inflow of 50m3/s (Pietrangeli and Pallavicini, 2007 cited in Argaw Ambelu et al., 2013). The theoretical buffer zone around the reservoir is 0.5 to 1 km wide; nonetheless, the buffer area is prone to intensive grazing and tillage (Argaw Ambelu et al., 2013). The maximum area of the reservoir covers about 60 km2, which would occur when the water reaches nearly 1671 m a.s.l. At normal operating schedules, the reservoir area is estimated to cover 50 km2 (MME-EELPA, 1997).
Figure 1. Map of Gilgel Gibe Reservoir ( Argaw Ambelu et al., 2013)

132
Field sampling and measurement Samples of O. niloticusand L. intermedius were collected monthly between October2011 and September 2012 using gill nets of stretched mesh sizes 6, 8, 10, 12 and 14cm. Nets were set at two stations, one near the shore at the littoral area and the other at the open water in the morning (about 09:00) and lifted in the following morning (about 07: 00 am). Immediately after capture, total length (TL) and total weight (TW) of each specimen were measured to the nearest 0.1 cm and 0.1g, respectively. Each specimen was then dissected and its sex was determined by inspecting the gonads. Stomachs of O. niloticus and guts of L. intermedius (since cyprinids do not have true stomachs) with contents were preserved in 4% formaldehyde solution. Preserved samples were then transported to the National Fisheries and Aquatic Life Research Center for further laboratory analysis. Estimation of sex-ratio The number of female and male O. niloticusand L. intermedius caught was recorded for each sampling occasion. Sex-ratio (male: female) was then calculated for each month and for the total sample. Chi-square test was employed to test if sex ratio varied from one - to – one in monthly samples and in the total sample.
Length - weight relationship Length-weight relationship of O. niloticus and L. intermedius was calculated using least squares regression analysis as in Bagenal and Tesch (1978) as follows:
TW = a * TLb, Where, TW = Total weight in grams, TL = Total length in centimeters, a and b = intercept and slope of the regression line, respectively.
Condition factor The condition factor (wellbeing) of each fish was determined by computing Fulton’s condition factor as in Bagenal and Tesch (1978). The condition factor of individual fish was calculated and then monthly mean values were determined for each sex separately. Fulton condition factor was calculated as:

133
FCF = TW 100
TL3
Where, FCF = Fulton’s condition factor
TW = Total weight in grams TL = Total length in centimeters Significance of differences in length-weight relationships and in condition factors of O. niloticus and L. intermedius between sexes, sampling periods, and size groups were tested using one way ANOVA. Food and feeding habit Preserved stomach and gut content of O. niloticusand L. intermedius were transferred into a petri dish. Larger food items were identified by eye whereas small-sized food items were microscopically examined using a WILD type stereoscope (magnification 6X to 50X), and each food item was identified to the lowest taxa possible using description, illustrations and keys in the literature (Fernando, 2002; Koste, 1978). In addition, smaller food items, such as phytoplankton, were examined at high magnifications (100X to 400X) under a compound microscope.
The relative importance or contribution of each food item to the diet of O. niloticus and L. intermedius was determined using the standard methods, i.e., the frequency of occurrence method and relative abundance (Hynes, 1950; Hyslop, 1980).
In the frequency of occurrence method the number of stomach or gut samples in which one or more of a given type of food item was found was expressed as a percentage of all non-empty stomachs examined. This was considered as the proportion of the population that feeds on that particular food item.
In the relative abundance method each food item in the stomachs examined will be assigned a number, 1-5: 1 being scarce and 5 dominant, relative to the other food items.

134
Results and Discussion Sex ratio L. intermedius was more numerous than O. niloticus in the total as well as monthly catches. Similar result was observed in Koka Reservoir (Esayas Alemayehu et al., 2011). This might be due to the fact that L. intermedius is riverine, the relatively young age of the reservoir and high fishing pressure on O. niloticus. A total of 165 male and 126 female O. niloticus and 1083 male and 1431 female L. intermedius were caught in this study (Table 1). In the case of O. niloticus sex ratio varied significantly in October, 2011 and February, 2012 and the total catch. However in the remaining 9 sampling months sex ratio did not vary significantly from 1:1 (Chi-square test, p>0.05). Male preponderance over females was observed in Lake Tana (Zenebe Tadesse, 1997), where as female dominance over males was reported in Lake Hawassa (Demeke Admassu, 1994). Significant variation from 1:1 (Chi-square test, p<0.05) in sex ratio of L. intermedius in both the total and monthly catches except May and August, 2012 was observed. Sex ratio in L. intermedius was female biased in the total catch and in 7 of the 11 sampling months. Contradictory result was reported in the same species in Lake Hawassa (Demeke Admassu, 1997) where sex ratio did not vary significantly. Biased sex ratio in the sample may be due to the differential fishing factors related to seasons and schooling of fishes, in the feeding and spawning grounds, or to selective fishing for the large fish, rather than reflecting a real population sex ratio (Demeke Admassu, 1994; Zenebe Tadesse, 1997).
Length-weight relationship and condition factor The length-weight relationship of O. niloticus and L. intermedius in Gilgel Gibe Reservoir were significant (ANOVA, p<0.001) and curvilinear (Figure 2).The equations TW=0.023TL2.97, r2=0.98 and TW=0.02TL2.83, r2=0.86, better describe the length weight relationship of O. niloticus and L. intermedius, respectively. The length-weight relationships of O. niloticus (b= 2.97) and L. intermedius (2.83) in Gilgel Gibe Reservoir indicate that the two species grew nearly isometrically (Bagenal and Tesch, 1978). The value of b calculated in

135
this study for O. niloticus is comparable to b values of 3.04, 3.19, 2.89, 2.90, 2.98 and 2.74 calculated for Lakes Langano, Ziway and Koka (Gashaw Tesfaye and Zenebe Tadesse, 2008), Hawassa (Demeke Admassu, 1990), Chamo (Yirgaw Teferi and Demeke Admassu, 2002) and Tana (Zenebe Tadesse, 1997), respectively. The b value calculated for L. intermedius in this study is comparable to the Labeobarbus spp. in Lakes Hawasssa (Demeke Admassu, 1997) and the morphotypes of Labeobarbus in Lake Tana (Nagelkerke et al., 1994; Shewit Gebremedihen, 2013). Tabe 1. Number of males, females and sex ratio in monthly samples of
Oreochromis niloticus and Labeobarbus intermedius in Gilgel Gibe Reservoir. X2shows chi square values. * significant, (P<0.05).
Month L. intermedius O. niloticus
M F ratio X2 M F ratio X2
Oct 2011 146 97 1.51 9.88* 35 13 2.69 10.08* Nov 2011 103 142 0.73 6.21* 19 11 1.73 2.13 Dec 2011 56 31 1.81 7.18* 14 16 0.88 0.13 Jan 2012 18 47 0.38 12.94* 6 15 0.40 3.86 Feb 2012 34 142 0.24 66.27* 4 0 0.00 4.00* Mar 2012 154 429 0.36 129.72* 18 9 2.00 3.00 Apr 2012 223 95 2.35 51.52* 47 43 1.09 0.18 May 2012 61 69 0.88 0.49 8 9 0.89 0.06 Jun 2012 55 191 0.29 75.19* 1 1 1.00 0.00 Aug 2012 81 85 0.95 0.10 13 9 1.44 0.73 Sep 2012 152 103 1.48 9.42* 0 0 0.00 0.00 Total 1083 1431 0.76 48.17* 165 126 1.10 5.24*
The Fulton’s condition factor (FCF) indirectly measures the wellbeing of fish as it indicates the nutritional level and status of the fish overtime (Bagenal and Tesch, 1978). FCF for both species varied significantly (ANOVA, p<0.01) between months, but did not show significant variations between sexes. It ranged from 1.28 to 2.86 in O. niloticus and from 0.33 to 2.33 in L. intemedius. FCF (mean+SE) are given for both species in Table 2.

136
Table 2. Monthly values (Mean + SE) of Fulton’s condition factor of Oreochromis niloticus and Labeobarbus intermedius in Gilgel Gibe Reservoir
Month O. niloticus L. intermedius M F M F
Oct-11 1.99+0.02 2.00+0.05 1.73+0.02 1.75+0.02 Dec-11 2.18+0.03 2.19+0.04 1.14+0.01 1.19+0.01 Jan-12 1.95+0.04 2.25+0.04 1.17+0.01 1.22+0.02 Feb-12 2.21+0.06 2.27+0.03 1.68+0.05 1.71+0.02 Mar-12 2.27+0.05 - 1.18+0.03 1.14+0.01 Apr-12 2.11+0.05 2.29+0.09 1.19+0.01 1.20+0.07 May-12 2.19+0.02 2.20+0.02 1.15+0.01 1.20+0.02 Jun-12 1.95+0.07 1.73+0.11 1.09+0.01 1.11+0.01 Jul-12 1.99 1.58 1.08+0.01 1.04+0.01 Aug-12 - - 0.89+0.03 0.9+0.02 Sep-12 2.4+0.06 2.24+0.08 1.14+0.01 1.16+0.01
Total Mean 2.15+0.04 2.08+0.04 1.22+0.02 1.24+0.02 The overall mean FCF value for O. niloticusin Gilgel Gibe Reservoir, 2.12, is larger than Fulton’s FCF values calculated for the same species in Lakes Koka (1.87), Ziway (1.81) and Langano (1.84) (Gashaw Tesfaye and Zenebe Tadesse, 2008) and lower than Lake Chamo (2.35) (Yirgaw Teferi and Demeke Admassu, 2002). The higher value of FCF of O. niloticus in Gilgel Gibe can be attributed to the dominance of phytoplankton in the diet of the species. Getachew Teferra et al. (2000) attributed the seasonal variations in condition factor of the same species in Lake Tana, where higher values of FCF were recorded, to the phytoplankton bloom in the lake which is influenced by the seasonal variation in rainfall and air temperature. It has also been determined that phytoplankton have high nutritional value (Bowen et al., 1995). Higher value of FCF in Lake Chamo has also been attributed to the interplay of a phytoplankton based diet and high water temperatures (Getachew Tefera, 1993). The FCF values for male and female L. intermedius were 1.22 and 1.24, respectively with an overall mean of 1.23. This result is larger than the value 0.94 calculated for the Labeobarus spp. in Lake Hawassa. Comparable results were reported for the same species in Lake Tana and its tributaries (Shewit Gebremedihen, 2013). The seasonal variation in the FCF was ascribed to season and spawning activities (Shewit Gebremedihen, 2014).

137
Figure 2. Length-weight relationship of (a) Oreochromis niloticus and
(b) Labeobarbus intermedius in Gilgel Gibe Reservoir Diet composition A total of 16 genera belonging to phytoplankton and zooplankton as well as macrophyte bits and detritus were observed in O. niloticus. Cyanophytes (blue green algae), Cholorophyta (green algae), and Bacillariophytes (Diatoms) are the phytoplankton groups, each of which are represented by 2, 1, and 2 genera, respectively. The zooplankton is represented by 2 genera of copepoda, 4 genera of cladocera and 5

138
genera of rotifer (Table 3). The diversified food items of plant and animal origins as well as detritus in the diet of O. niloticus, suggest that the species is an omnivore in Gilgel Gibe Reservoir. 15 genera belonging to phytoplankton, zooplankton and insects along with detritus and macrophyte bits constituted the diet of L. intermedius. The phytoplankton were represented by 2 genera of cyanophyta, 1 genera of chlorophyta, 3 genera of bacillariophyta and 1 genus of euglenophyta. 1 genus of rotifera, 2 genera of copepoda, 2 genera of cladocera and 1 genus of ostracoda are the zooplankton genera observed in the diet of L. intermedius. Chironomidae larvae and notonectidae are the families of insects that were frequently ingested by the species in the reservoir (Table 3). Such diversified food items were found in Lake Hawassa (Demeke Admassu and Elias Dadebo, 1997), which led to the consideration of the species as a polyphagus. The polyphagous nature of Labeobarbus spp. might have contributed to their highly explosive speciation as is the case in Lake Tana (Nagelkerke et al., 1994). Relative importance of different food items The percentage frequency of occurrence and relative abundance of the different food items consumed by O. niloticus and L. intermedius in Gilgel Gibe Reservoir are given in table 3. Based on frequency of occurrence, food items that were encountered more frequently in the diet of O. niloticus were the cyanophytes Microcystis spp. and Anabaena spp., the chlorophyte Botryococcus spp. each occurring in 92.6%, 77.8% and 51.9% of the fish examined, respectively. Among the zooplankton Ceriodaphnia spp., Anuraeopsis spp., Trichocerca spp., Kerratella spp. and the cyclopoid copepods appeared more frequently in decreasing order (Table 3). The analysis of the relative abundance of food items in the diet of O. niloticus showed that among the phytoplankton, Microcystis spp. and Anabaena spp. are the most abundantly consumed items followed by Botryococcus spp. Anuraeopsis spp., Trichocerca spp., and Moina spp. were found to be the zooplankton most abundantly ingested by the species (Table 3).
The types and abundance of the food items found in the diet of O. niloticus in Gilgel Gibe Reservoir were similar to what has been reported in several lakes of the country. Blue green algae dominated the diet of the same species in Lakes Chamo (Yirgaw Teferi and Demeke Admassu, 2002), Hawassa (Getachew Tefera and Fernando, 1989; Tudorancea et al., 1988) and Ziway (Zenebe Tadesse, 1988). This type

139
of diet appears to have high nutritional value to the fish (Getachew Tefera and Fernando, 1989). The presence of detritus in few O. niloticus was also observed. Bowen (1980) showed that non-protein amino acids and the bacterial cells that are found in association with detritus are the important components that provide the bulk of the essential nutrition in this fish. Similar results were reported in Lakes Chamo (Yiergaw Teferi, 2002) Hawassa (Getachew Tefera and Fernando, 1989), and Langano (Zenebe Tadesse, 1999).
Table 3. List of items and their relative importance as determined by frequency of occurrence (FO) and relative abundance (RA) in the diet of Oreochromis niloticus and Labeobarbus intermedius
Food items O. Niloticus L. Intermedius
Fo (%) Ra Fo (%) Ra Cyanophyta Microcystis 92.6 5 11.8 1
Anabaena 77.8 5 11.8 1 Cholrophyta Botryococcus 51.9 4 Spyrogyra 2.9 5 Bacilariophyta Synedra 7.4 2 2.9 1
Nitzschia 5.9 1
Eunotia 3.7 2 2.9 1 Euglena 20.6 4 Rtifera Trichocerca 44.4 3 Anuraeopsis 51.9 3 2.9 1
Polyarthra 11.1 2 Asplanchna 14.8 2 Keratella 37.0 2 Copepoda Calanoid 22.2 2 17.6 1
Cyclopoid 29.6 2 26.5 1
Nauplii 33.3 2 Cladoera Cerodaphnia 48.1 2 2.9 1
Moina 18.5 3 Alona 41.2 1
Diaphanosoma 14.8 2 Daphnia 14.8 2 Insecta Chironomidae 73.5 2
Notonectidae 2.9 1 Ostracoda 2.9 3 Macrophyte 97.1 5 Detritus 6.3 2 70.6 3

140
Among the zooplankton rotifers dominated in the diet of O. niloticus as is the case in Lakes Hayq, Hawassa and Langano (Workiye Worie, 2009; Getachew Tefera and Fernando, 1989; Zenebe Tadesse 1999). High turbidity, abundance of bacterio plankton and dominance of blue greens in the reservoir might have favored the small rotifers, than the large filter feeding cladocerans (Lampert and Rothaupt, 1991; KibruTeshome, et al., (submitted to this volume)). In the diet of L. intermedius, macrophyte bits, Chironomid larvae, detritus and the cladoceran Alona spp. occurred in 97.1%, 73.5%, 73.5% and 41.2%, respectively, of the fish examined making them the most important food items based on the frequency of occurrence method (Table 3). The frequency of occurrence also showed that the contribution of phytoplankton and zooplankton to the diet of the species was low. However, the chlorophyte Spyrogyra spp. was found to be as important as macrophytes and detritus in few fish based on the relative abundance method (Table 3). The presence of insects and the discovery of large amount of detritus, macrophytes and sand suggest that L. intemedius is a bottom feeder in Gilgel Gibe Reservoir. Similarly Demeke Admassu and Elias Dadebo (1997) found that the Labeobarbus spp. in Lake Hawassa consumed benthos which included mollusks. Macrophytes, detritus and insects were also the dominant food items in the gut of the species in other studies in Ethiopian lakes (Sibbing, 1998; De Graaf, 2003). Only two families of insects, Chironomidae and Notonectidae were identified in this study. However, Argaw Ambeluet al., (2013) reported 20 taxa of macro invertebrates in the reservoir. The absence of small sized fish in our samples and the use of only two sampling station might have influenced our results. The presence of insects in the diet of L. intermedius indicates that the species occupies a trophic level uninhabited by O. niloticus. This can be further substantiated by the finding that the two species held different trophic positions in Lake Koka as determined by stable isotope analysis (Ermias Derbie et al., 2011). Thus, the two species can coexist in the reservoir. Fewer O. niloticus than L. intermedius were caught during the sampling period. Selective fishing for O. niloticus and the relatively younger age of the reservoir can be the reason for this. Length weight relationship showed that both species grew nearly isometrically and the condition

141
factor of O. niloticus in the reservoir was found to be larger than several lakes in Ethiopia, suggesting that the reservoir is composed of quality feed and suitable habitat for the species. O. niloticus was found to be an omnivore in the reservoir while L. intermedius was found to be a bottom feeder. The presence of different food items in the diet of the two species led to the conclusion that the two species occupy different trophic positions and hence, they can coexist in the reservoir. There is a thriving fishery activity in the reservoir. However, the catch of O. niloticus, which is the main focus of the fishery, is declining very rapidly. Fishery management options should be explored and implemented for the fishery to be sustainable. In addition stock enhancement works should be carried out by restocking juvenile O. niloticus into the reservoir. Efforts should also be exerted towards the development of the L .intermedius fishery.
References
Abdel-Aziz NE and SM Gharib. 2007. Food and feeding habits of round Sardinella (Sardinella aurita) in El- Mex Bay, Alexandria, Egypt. Egyptian J. Aqu. Res. 33: 202-221.
Abebe Getahun, 2007. An overview of the diversity and conservation status of the Ethiopian fresh water fish fauna. J. Afrotrop. Zool. Special issue: 87-96.
Argaw Ambelu, K Lock, and PIM Goethals. 2013. Hydrological and anthropogenic influence in the Gilgel Gibe I reservoir (Ethiopia) on macroinvertebrate assemblages. Lake and Reservoir Management 29:143–150.
Bagenal TB and FW Tesch. 1978. Age and growth.In: Methods for Assessment of Fish Production in Freshwaters (Bagenal. T.B, ed.). IBP. Hand book No.3, Blackwell, Oxford, England. pp. 101-136.
Bowen S H. 1980. Detrital non protein amino acids are the key to rapid growth of Tilapia in Lake Valencia, Venezuela. Science 207:1216-1218.
Bowen SH, EV Lutz, and MO Ahlgren. 1995.Dietary protein and energy as determinants of food quality: trophic strategies compared. Ecology 76:889-907.
De Graaf M. 2003. Lake Tana’s piscivorous Barbus (Cyprinidae, Ethiopia): Ecology Evolution Exploitation. Doctoral thesis, Experimental Zoology Group, Wageningen University, AH Wageningen, The Netherlands
Demeke Admassu, 1990. Some morphometric relationships and the condition factor of tOreochromisniloticus (Pisces: Cichlidae) in Lake Awassa. SINET: Ethiop. J. Sci. 13: 83-96.

142
Demeke Admassu. 1994. Maturity, Fecundity, Brood size and sex ratio of Tilapia (Oreochromis niloticus L.) in Lake Awassa. SINET: Ethiop. J. Sci. 17: 53-96.
Demeke Admassu and Elias Dadebo. 1997. Diet composition, length-weight relationship and condition factor of Labeobarbus species Ruppell, 1836 (Pisces: Cyprinidae) in Lake Awassa, Ethiopia. SINET: Ethiop. J. Sci. 20:83-96.
Ermias Deribe, BO Rosseland, R Borgstrøm, B Salbu, Zinabu Gebremariam, Elias Dadebo, HR Norli, and OM Eklo. 2011. Bioaccumulation of persistent organic pollutants (POPs) in fish species from Lake Koka, Ethiopia: The influence of lipid content and trophic position. Science of the Total Environment 410: 136-145.
Esayas Alemayehu, Zenebe Tadesse, Kibru Teshome and Abelneh Yimer, 2011. Some morphometric relationships and feeding habits of commercially important fish species in Koka Reservoir. Proceeding of the 25th annual conference of the Ethiopian Society of Animal Production.Pp 309-3016.
Fernado CH. 2002. A Guide to Tropical Freshwater Zooplankton: Identification,
Ecology and Impacts on Fisheries. Blackhuys Publishers, Leiden, 291pp.
Gashaw Tesfaye and Zenebe Tadesse, 2008. Length-weight relationship, Fulton’s condition factor and size at first maturity of tilapia, Oreochromis niloticus L. in Lakes Koka, Ziway and Langano (Ethiopian Rift Valley).Ethiop. J. Biol. Sci. 7:139-157.
Getachew Teferra, 1987. A study on an herbivorous fish, Oreochromis niloticus L., diet and its quality in two Ethiopian Rift Valley lakes, Hawasa and Zwai. J. Fish Biol. 30: 439–449.
Getachew Teferra and C. Fernando. 1989. The food of an herbivorous fish (Oreochromis niloticus L.) in Lake Hawassa Ethiopia.Hydrobiologia178: 195-200.
Getachew Teferra, 1993. The composition and nutritional status of the diet of Oreochromis niloticus in Lake Chamo, Ethiopia.J. Fish Biol. 42: 865–874.
Getachew Teferra, Bowen, S. H., Eyualem Abebe and Zenebe Tadesse, 2000. Seasonal variations determine diet quality for Oreochromis niloticus L. (Pisces: Cichlidae) in Lake Tana, Ethiopia. SINET: Ethi. J. Sci.23: 13-23.
Hynes HBN. 1950. The food of freshwater Sticklebacks (Gasterosteusaculeatus and Pygosteuspungiteus), with a review of methods used in studies of the food of fishes.J. Anim. Ecol. 19: 36 -58.
Hyslop EJ. 1980. Stomach content analyses- A review of methods and their application.J. Fish. Biol. 17: 411-429.
Kibru Teshome, Abelneh Yimer, Esayas Alemayehu (2014). Some biological and physico-chemical limnology of Gilgel Gibe Reservoir. This volume.
Koste W. 1978. Rotatoria. Volume II. GebrÜderborntraeger, Berlin, Stuttgart, 234pp.
Lampert W and KO Rothhaupt. 1991. Alternating dynamics of rotifers and Daphnia magna in a shallow lake. Arch. Hydrobiol. 120: 447-456.

143
Lopez-Peralta RH and CAT Arcila. 2002. Diet feeding composition on fish species from the southern continental shelf of Colombia. Naga 25: 23-29.
Mequilla ATL and WI Campos. 2007. Feeding relationships of dominant fish species in the Visayan Sea. Science Diliman19: 35-46.
Ministry of Mines and Energy: Ethiopian Electric Light and Power Authority, 1997. Gilgel Gibe hydroelectric project environmental assessment main report. Addis Ababa (Ethiopia). 100 p.
Nagelkerke LAJ, FA Sibbing, JGM Boogaart, EHRR vanden, Lammens, and JWM Osse. 1994. The barbs (Barbus spp.) of Lake Tana: a forgotten species flock? Environ. Biol. Fish. 39:1-22.
Nagelkerke LAJ and FA Sibbing. 1996. Reproductive segregation among the large barbs (Barbus intermedius complex) of Lake Tana, Ethiopia.An example of intralacus trine speciation? J. Fish. Biol.49:1244–1266.
Oso J A, IA Ayodele, and O Fagbuaro. 2006. Food and feeding habits of Oreochromis
niloticus (L.) and Sarotherodon galilaeus (L.) in a tropical reservoir. World J. Zool. 19: 35-46.
Post DM, ME Conners, and DS Goldberg. 2000. Prey preference by a top predator and the stability of linked food chains. Ecology 81: 8-14.
Shewit Gebremedhin, Minwyelet Mingist, Abebe Getahun and Wassie Anteneh. 2012. Spawning migration of Labeobarbus spp. (pisces: cyprinidae) of Lake Tana to Arno-Garno river, Lake Tana sub-basin, Ethiopia. SINET: Ethiop. J. Sci. 35:95–106.
Shewit Gebremedhin, Minwyelet Mingist and Brhanu Kebede. 2013. Spawning migration and some biological aspects of Labeobarbus species in Infranz River, Lake Tana Sub Basin, Ethiopia. J. of Fisheries and Aquatic Science 8: 627-642.
Sibbing FA. 1998. Ecomorphology as a tool in fisheries: identification and ecotyping of Lake Tana barbs (B. intermedius Complex) Ethiopia. Neth. J. Agri. Sci. 42: 77-85.
Tudorancea C, CH Fernando, and JC Paggi. 1988. Food and feeding ecology of Oreochromis niloticus (Linnaeus, 1758) juveniles in Lake Awassa (Ethiopia). Arch. Hydrobiol. Suppl. 79:267-289.
Workiye Worie. 2009. Some aspects of the biology of Oreochromis niloticus L. (Pisces: Cichlidae) in Lake Hayq, Ethiopia. M.Sc. thesis, Addis Ababa University, Addis Ababa.108 pp.
Yirgaw Teferi, Demeke Admassu and Seyoum Mengistou. 2000. The food and feeding habits of Oreochromis niloticus L. (Pisces: Cichlidae) in Lake Chamo, Ethiopia. SINET.Ethiop. J. Sci. 23: 1-12.
ZenebeTadesse. 1988. Studies on some aspects of the biology of Oreochromis niloticus L. (Pisces: Cichlidae) in Lake Ziway, Ethiopia. M.Sc. thesis, Addis Ababa University, Addis Ababa.78 pp.

144
ZenebeTadesse, 1998. Food and Feeding Ecology of Tilapia, Oreochromis niloticus L. and effects of diet on the lipid quality of fish in some Lakes in Ethiopia. Ph. D. dissertation, School of Graduate studies, Addis Ababa University, Addis Ababa. 139 pp.
Zenebe Tadesse, 1999. The nutritional status and digestibility of Oreochromis niloticus L., diet in Lake Langeno, Ethiopia. Hydrobiologia 416: 97–106.

145
Performance of Four Nile Tilapia, Oreochromis niloticus Strains under
Highland Pond Culture
Zelalem Lema and Getinet Gebrtsadik
Ethiopian Institute of Agricultural Research, National Fishery and other Aquatic Life Research Center, Sebeta, Ethiopia
Introduction Tilapia is now the second most cultured group species after the carps (FAO, 2008b) surpassing the salmonids group. World tilapia production has been led by China as major producer (also exporter), followed quite distantly by Egypt and other countries like Philippines, Indonesia, Thailand, Taiwan and Brazil (FAO, 2008a). The great acceptance of tilapia as a commercial farmed species has led to major genetic improvement programs to improve their culture performance. Many of these programs were implemented and promoted in Asia, where tilapia is mostly cultured. The production of the GIFT strain (Genetically Improved Farm Tilapia) implemented by World Fish Center (formerly known as ICLARM – International Center for Living Aquatic Resources Management) in collaboration with some other co-partners such as AKVAFORSK (Institute of Aquaculture Research of Norway) and UNDP (United Nations Development Program) has brought tilapia culture forward by using improved stocks through selective breeding (Eknath and Hulata, 2009). The high diversity of tilapia application in aquaculture, coupled with a high growth and wide consumer acceptability (Sipe, 1992) which makes O. niloticus virtually unique as a potential global food fish and justifies its popular accolade as an ‘aquatic chicken’. Moreover, tilapia is one of the most suitable of all aquaculture species. So long as water temperature remains near the optimum of 27 °C, tilapia can withstand crowding, degraded water quality, a wide range of salinities (depending on species), and handling stress. Tilapia are very easy to reproduce, are remarkably resistant to disease, grow very rapidly to market size, have

146
firm white flesh, and are rated very high in flavor with high social and economic demand. In addition, their relatively low fat content provides for a long shelf life in comparison with various other fishes (Stickney, 2000). Therefore, the intention of this study is to evaluate in pond culture system under highland environmental condition, the growth performance of four strains of O. niloticus collected from geographically isolated water bodies. Materials and Methods The experiment was conducted in National Fisheries and Aquatic Life Research Center (NFALRC), Sebeta, Ethiopia. The Research Centre is situated at a distance of 24km Southwest direction of Addis Ababa, the capital city of Ethiopia. The climatic zone is classified as mid-altitude zone (2240m above sea level). Experimental fish Four strains of the Nile tilapia, O. niloticus were collected from lakes: Hashenge, Tana, Ziway and Chamo using a beach seine of 50 m x 2 m size with stretched mesh size of 15 mm. Brood fish (n=200) for each trial were transported to Sebeta NFALRC. Transportation protocol developed by the research center was followed. Polyethylene bags containing approximately 25 to 30 liters of water and oxygen cylinder containing 24 liters of pure oxygen were used to transport about 200 brood fish O. niloticus. The rearing and successive processes for fry production (F1) of each parent strain were carried out in four different acclimatization ponds. The F1 generation was allowed to spawn and produce subsequent F2 generations. Fifty juvenile of F2 (1.5-2.0 g weight and 4.2-4.8cm length) were randomly selected for each strain and stocked into 12 experimental compartments into three treatment ponds under the same environment. The stocking density of the fish was 2 fish m-2. The experiment was done in triplicate. The total number of fish at the start of the experiment were 600 (50 fish * 12 = 600 fish). Experimental design The experiment was done in a completely randomized blocked design (CRBD) consisting of concrete earthen ponds with three replicates of similar sizes (10.0 m × 10.0 m × 1.2 m). Each pond was partitioned into four equal parts using nets of mesh size less than 1.5-2 mm to avoid

147
mixing of strains. Ponds were filled to an average depth of 0.8m using spring water and about one-third of the pond water was changed bi-weekly. Sampling procedure Ten to fifteen fish were sampled every 30 days for body weight and body length measurement to determine how much the fish have been grown. Every two weeks eggs were checked from the mouth to confirm the reproductive performance using standard protocols as described by Little et al (1993). The presence of fry was also checked by observation during the time of feeding every day. Length and weight of the fish were measured using ruler and digital weight balance (Ohaus portable balance). Mortality of the fish was registered throughout the experiment. Sexual maturity and other effects were also registered for all strains. Statistical analysis The data on body weight and size of experimental fish were analyzed by one way analysis of variance (ANOVA) and Least Significant Difference (LSD) test was used to determine mean differences between strains. Correlation coefficient using "standard" correlation (Pearson's product-moment correlation) test was used to test relationships between age, growth rate and final body weight. All analysis were carried out using statistical package SPSS (20 version) and all values were considered significant when P < 0.05 and expressed as mean ± S.E.M. Results Temperature The mean temperature recorded around 8:00 a.m. in the morning was 18.7 ± 0.04oC. The mean temperature recorded around 1:00 p.m. in the afternoon was 23.40 ± 0.16 (SE), during late afternoon was 22.0 ± 0.09 oC (SE), respectively. There was no pronounced and deep-seated thermal stratification during the study period in all the three replicates. It was observed that all water quality parameters of the experimental ponds including inorganic nutrients varied temporally over the study period. The mean values observed were in the range of 9.29 ± 0.107 to 9.43 ± 0.082 for pH (Figure 1), and 158.59±4.34 to 207.53 ± 11.94) for

148
conductivity. Mean total alkalinity and hardness recorded were in the range of 2.08 ± 0.056 mval L-1 and 1.46 ± 0.067 mval L-1 to 2.32 ± 0.096 mval L-1 and 1.64 ± 0.096 mval L-1, respectively. Phytoplankton biomass estimated as chlorophyll-a showed mean concentration of 22.59 ± 8.23mg L-1 to 44.13 ± 11.5 over the study period. Despite law water temperature conditions, water quality variables are in optimum range for tilapia growth and reproduction. The phytoplankton community was dominated by cyanobacteria in particular by Anabaenopsis sp and the zooplankton species composition of all replicates was highly dominated by rotifers. All three experimental ponds are dominated by nutritionally important plankton taxa which justifies there is enough natural feed for the fish.
Figure 1. pH ranged between 8.5 and 9.75 with a mean of 9.38 ± 0.18.
Growth performance The final mean body length, final mean body weight and weight gain of all the strains were calculated after 180 days of the experiment and were summarized in Table 1., in addition the growth pattern is showed in Figure 2. The highest and the lowest final mean body weight were observed in Chamo strain (51.03 ± 5.56 g) and Hashenge strain (21.53 ± 2.33 g), respectively. The Chamo strain showed significantly higher final mean body weight than the Ziway, the Tana and the Hashenge strains. The final mean body weight of the Ziway and Tana strains was higher than the final mean body weight of the Hashenge strain, but there was no significant mean body weight difference among the Ziway and Tana strains.

149
Table 1. Growth performances of four O. niloticus stains collected from geographically isolated natural water bodies and reared in pond culture
Strain Initial length (cm)
Initial weight (g)
Final length (cm)
Final weight (g)
Weight gain (g)
Chemo (CH) 4.43 ± 0.40a 1.93 ± 0.53a 14.13± .36a 52.96± .64a 51.03±5.56a Tana (TA) 4.46 ± 0.43a 2.01 ± 0.6a 13.19± .31ab 41.02± .74b 39.01±3.84b Zewai (ZE) 4.77 ± 0.23a 2.09 ± 0.35a 12.43±0.13bc 34.75±2.60b 32.66 ±2.50b Hashengie (HA) 4.27 ± 0.36a 1.69 ± 0.39a 11.04±0.95c 23.22±2.30c 21.53±2.33c
In each column, data with different letter are significantly different (p < 0.05)
Data are means ± SEM of three replications, ANOVA, LSD , P < 0.05
Data are means ± SEM of three replications, ANOVA, LSD, and P < 0.05, (T1C = Chamo,, T2T= Tana,T3Z= Ziway,and T4H Hashengie,
Figure 2. Variation in body weight of four Nile tilapia strains collected from
geographically isolated natural water bodies reared in pond culture at Sebeta.
Discussion The analysis of the growth performance of four strains namely Chamo, Zewaye, Tana and Hashenge collected from geographically isolated environments led to the conclusion that genotype-environmental interaction was higher for Chamo strain relative to growth compared to that of the other strains . This is in agreement with Liti et al., (2005) findings on evaluation of growth and reproduction capacity of three strains of Nile tilapia, found locally in Kenya (Victoria strain, Sagana strain, Turkana strain). They reported that growth and

150
reproductive performance was affected by strain differences. This result is also in agreement with the findings of Admassu D, and Ahlgren I. who worked on growth of wild juvenile tilapia, Oreochromis niloticus (L.) from Lakes Zewaye, Langeno and Chamo (Ethiopian Rift Valley) based on otolith micro-increment analysis (2000). Workagegn and Gjoen (2012) who compared the growth performance of four juvenile O. niloticus strains from Hawassa, Ziway, Koka, and Chamo lakes in pond culture reported higher mean growth rate by Chamo strain. This suggests that there is a genetic variation among strains habituating in a geographically isolated water bodies. Identification of relatively fast growing strains in their early life stage is an important aspect in aquaculture, thus, the first step of selection is characterizing the available strains and subsequently select one or more strains to form a base population for genetic improvement (Lutz, 2006), and thus an increase in productivity through the application of genetic techniques (Shepherd et al., 2006). Therefore, determination of genetic variation on the growth performance of different O. niloticus strains is very important for breeding program. References
Abdel-Tawwab M. 2004. Comparative Study of Growth Performance and Feed
Utilization of Four Local Strains of Nile Tilapia, (Oreochromis niloticus L), Collected From Different Location in Egypt. In: The 6th International Symposium on Tilapia in Aquaculture Bolivar, G. M. and Fitzsimmons, K. (Eds.). Manila, Philippines (Page. 514).
Azevedo PA, CY Cho, S Leeson, and DP Bureau. 1998. Effects of feeding level and water temperature on growth, nutrient and energy utilization and waste outputs of rainbow trout (Oncorhynchus mykiss). Aquatic Living Resources, 11(4): 227-238.
Britz PJ, T Hecht, and S Mangold. 1997. Effect of temperature on growth, feed consumption and nutritional indices of Haliotis midae fed a formulated diet. Aquaculture, 152: 191-203.
David Liti and James Barasa Ekesa. 2005. Evaluation of growth and reproduction capacity of three strains of Nile tilapia, Oreochromis niloticus, found locally in Kenya for use in aquaculture. Tenth Work Plan, New Aquaculture Systems/New Species Research 4A (10NSR4A) Final Report.
Eknath AE, Hulata, Gideon. 2009. Use and exchange of genetic resources of Nile tilapia (Oreochromis niloticus). Reviews in Aquaculture, 1: 197-213.
FAO. 2008a. The state of World Fisheries and Aquaculture. Rome, Italy

151
FAO. 2008b. World aquaculture production by species groups. Rome, Italy. Gadowaski DM and SM Caddell, 1991. Effects of temperature on early-life-history
stages of California halibut Paralichthys californicus. Fish Bulletin, 89: 567-576.
Houlihan DF, EM Mathers, and A Foster. 1993. Biochemical correlates of growth rate in fish. In: Fish Ecophysiology. J. C. Rankin and F. B. Jensen (Eds.). Chapman and Hall, London. UK, pp: 45-71.
Little DC, DJ Macintosh, and P Edwards. 1993. Improving spawning synchrony in Nile tilapia, Oreochromis niloticus (L). Aquaculture and Fisheries Management, 24, 399-405.
Little DC and G Hulata. 2000. Strategies for tilapia seed production. In: MCM Beveridge and BJ McAndrew (eds), Tilapias: Biology and Exploitation pp. 267–326. Kluwer Academic Publishers, London.
Lutz CG. 2006. Tilapia: Biology, Culture, and Nutrition, New York, Food Products Press.
Popma TJ and BW Green. 1990. Sex reversal of tilapia in earthen ponds: aquacultural production manual. Research and Development Series 35. Auburn University, Alabama (p. 15).
Sipe M. 1992. Tilapia marketing in the USA. INFOFISH International, No. 3/92, 23-25.
Shepherd BS, GM Weber, MM Vijayan, A Seal, LG Riley, MF Rodriguez, NH Richman Iii, T Hirano, and EG Grau. 2006. Tilapia: Biology, Culture, and Nutrition, New York, Food Products Press.
Stickney RR. 2000. Status of research on tilapia. In: Costa-pierce, B.A, Rakocy, J.E. (Eds.), Tilapia Aquaculture in the America. The World Aquaculture Society (Vol. 2, pp. 21-33). Baton rouge, Louisiana, USA.
Workagegn and Gjoen. 2012. Comparative Studies on the Growth Performance of Four Juvenile Oreochromis niloticus L., (1785) Strains in Pond Culture, Ethiopia, International Journal of Aquaculture, Vol.2, No.7 40-47.

153
Fish Post-Harvest Losses and Intervention Measures in Gilgel Gibe Reservoir
Yared Tigabu, Fekadu Tefera and Esayas Alemayehu
Ethiopian Institute of Agricultural Research, National Fishery and other Aquatic Life Research Center, Sebeta – Email - [email protected]
Introduction Post-harvest losses in fisheries comprise material losses of fish due to lack of market, spoilage, breakage, size, discarding by catch and operational losses. There are also losses of value, what the fish is worth in monetary terms, deterioration of quality, when stale fish becomes less attractive to consumers, losses in nutritional value, when the fish contribute less towards the diet of consumer than it did (Geoffrey, 1990). These losses have major implications on the nutritional quality and availability of fish products which mainly occurs during flaws in the handling, storage, distribution and processing of fish and in marketing techniques. The study of fish losses should be done on a case by case for improvement, and is a key step for improvement (Alverson et.al., 1994). The important issue is therefore, to reduce losses and make fish food more available to raise the income of the fishing communities. Previous studies showed high level of fish post-harvest losses in different lakes of Ethiopia both in quantity (material or physical ) and quality (mostly due to spoilage) (Yared et al., 2006, 2013). For example in Lake Ziway and Hashengie at landing sites alone loss was estimated at 23 % and 28 %, respectively (Yared et al., 2006, 2013). Although the fishery sector is under developed in the country, there is a sign of over exploitation in the rift valley lakes like Ziway, Awassa and Chamo. The only way to develop fishery in such areas is by proper utilization of the catch through minimizing post-harvest losses at all stages of fish handling, processing and marketing. Therefore, the objective of this study was to determine the amount and extent of fish loss and examine

154
the common practices in handling, processing, preservation, and marketing of fish products in the Gilgel Gibe reservoir. Material and methods The study area Gilgel Gibe I Reservoir is located about 263 km, south-west of Addis Abeba in Jima zone, Oromia region. River Gilgel Gibe is the major tributary for the reservoir. The reservoir has a catchment area of 4225 km2and has an area of 54 km2 at its full supply level. Maximum height of the dam is 41m, at 1671 m. Loss Assessment The assessment was carried out by adopting the methodology of Wood (1985) by measuring flow of fish through the system (assessment format was developed). Direct weight measurement of the catch was taken using simple balance at landing site. The total catch of the fish by species was counted and the total discard (due to spoilage, size, lack of market, etc) was measured. The appearance, texture and odor of the fish were also assessed following Howgate (1994). Huss (1995) sensory assessment method was used to identify the cause of the spoilage. The study was conducted for twelve months between October 2012 and September 2013. Data were analyzed using descriptive statistics. Total monthly catch was calculated using the formula:
𝐒𝐮𝐦 𝐨𝐟 𝐬𝐚𝐦𝐩𝐥𝐢𝐧𝐠 𝐝𝐚𝐲 𝐜𝐚𝐭𝐜𝐡 𝐱 𝐦𝐨𝐧𝐭𝐡𝐥𝐲 𝐟𝐢𝐬𝐡𝐢𝐧𝐠 𝐝𝐚𝐲𝐬𝐍𝐮𝐦𝐛𝐞𝐫 𝐨𝐟 𝐬𝐚𝐦𝐩𝐥𝐢𝐧𝐠 𝐝𝐚𝐲𝐬
Monthly discard was determined by
𝑺𝒖𝒎 𝒐𝒇 𝒔𝒂𝒎𝒑𝒍𝒊𝒏𝒈 𝒅𝒂𝒚𝒔 𝒅𝒊𝒔𝒄𝒂𝒓𝒅 𝒙 𝒎𝒐𝒏𝒕𝒉𝒍𝒚 𝒇𝒊𝒔𝒉𝒊𝒏𝒈 𝒅𝒂𝒚𝒔𝑵𝒖𝒎𝒃𝒆𝒓 𝒐𝒇 𝒔𝒂𝒎𝒑𝒍𝒊𝒏𝒈 𝒅𝒂𝒚𝒔
Percent spoilage calculated as : 𝑻𝒐𝒕𝒂𝒍 𝒘𝒕.𝒐𝒇 𝒔𝒑𝒐𝒊𝒍𝒂𝒈𝒆
𝑻𝒐𝒕𝒂𝒍 𝒘𝒆𝒊𝒈𝒉𝒕 𝒐𝒇 𝒄𝒂𝒕𝒄𝒉𝐱𝟏𝟎𝟎

155
The operational yield was determined by:
𝑾𝒉𝒐𝒍𝒆 𝒘𝒆𝒊𝒈𝒉𝒕 𝒐𝒇 𝒇𝒊𝒔𝒉 − 𝒐𝒑𝒆𝒓𝒂𝒕𝒊𝒐𝒏𝒂𝒍 𝒅𝒊𝒔𝒄𝒂𝒓𝒅 Other information on the overall fishery activity was obtained through observation and discussion with fishermen and development agents. Results and Discussion The reservoir habituated 3 species, Nile tilapia, Oreochromis niloticus, Labeobarbus intermmidus and Lebeo cylindericus. The dominant fish species in the reservoir are Nile tilapia and Labeobarbus intermmidus. However, the local fishers exclusively prefer Nile tilapia, Oreochromis niloticus to sell in the local market. Postharvest losses of tilapia due to size and spoilage at Gilgel Gibe are presented in Table 1. Similarly postharvest losses of barbus due to market forces are indicated in Table 2. It was reported that fish have spent many hours caught in the fishing gear and begun to spoil. By the time caught fish released and collected from the net spoiled fish have no market and thrown away at the landing sites. Table 1. Post-harvest losses of O. niloticus due to size and spoilage in Gilgel
Gibe Reservoir
Month Total catch (kg)
Discard fish due to spoilage Total
loss (kg)
Total loss (%) Landing
Site (kg) Storage
(kg) October 990 50 90 140 14.14 November 1030 54 130 184 17.86 December 1200 68 270 338 28.17 January 1580 74 356 430 27.22 February 1720 120 420 540 31.40 March 1598 145 380 525 32.85 April 1030 95 185 280 27.18 May 620 45 95 140 22.58 June 510 32 110 142 27.84 July 380 28 95 123 32.37 August 179 21 84 105 58.66 September 638 27 78 105 16.46 Total 11475 759 2293 3052 26.60

156
Technical knowledge of the fishers in post-harvest fish handling, managing, processing and storing of fishes is very limited. No technical guidelines or manuals are available regarding harvesting gear and methods, time, temperature effects, methods for filleting and gutting, use of containers, shelf life of fish and preservation procedures.
Table 2. Post-harvest losses of Barbus, Labeo barbus intermmidus and Labeo cylindericus due to market force
Month Total catch (kg)
Market force loss (kg)
Total loss (%)
October 2079 1850 88.99 November 2163 1625 75.13 December 2520 2242 88.97 January 3318 2953 89.00 February 3612 3214 88.98
March 3356 2986 88.97 April 2163 1925 89.00 May 1302 1158 88.94 June 1071 953 88.98 July 798 710 88.97
August 376 334 88.83 September 1340 1192 88.96 Total 24098 21142 87.73
Monthly post-harvest loss of tilapia and barbus ranged from 105 kg to 540 kg and 334 to 3214 kg respectively. Post-harvest fish losses were significantly higher (p<0.0001) between January and March for both species. This could be due to rise in water temperature which enhances the fish movement and increase the chance of fish being caught by the gill net. Moreover, the rise in air temperature obviously enhances rate of fish spoilage since the fish harvested are not iced immediately after catch. The Post-harvest loss also increases as the catch increases due to low storing capacity of the deep freezer available there. During these months the fish production reaches to its peak. As the catch was high and fishers have limited storage they over load the freezer and the cooling rate of the stored fish declines as there is no space for cold air movement and these leads to spoilage.

157
The barbus catch has no market at all. Labeo barbus intermmidus is not preferable by consumers and has no market at all as the fish flesh is full of tiny spines. In other lakes where this species is found, consumers pick out the spines from the flesh manually after boiling the fish with water for 15- 30 minutes. During the peak season, January to march the supply of tilapia fish exceeds demand and forces fishers to sell their fish at reduced prices. The other factor for high post-harvest loss of tilapia was due to constant power interruption which resulted in high rate of spoilage to the fish even inside the freezer. The fishers do not use blast freezer, chiller, ice or cold storage.The temperature in the freezer does not reach the recommended temperature of -18oC required for long shelf life of fish. The shelf life of fish products markedly extends when products are stored at low temperature (Huss, 1995). Immediately after catch, a complicated series of chemical and bacterial changes begin to take place within the fish. If these changes are not controlled, the fish quickly gets spoiled due to bacterial contamination and autolysis (Clucas, 1981). On landing sites the fish are gutted and processed on the ground without any shelter or protection. At no stage in this chain the fish is protected from direct sun, dust and wind. There is no proper fish handling and preserving facilities both on boat and landing sites. Long fishing hours as well as extended period between capture and arrival at landing sites causes spoilage of fish in the reservoir. Fishers usually got to fishing grounds in the morning to set their gears and return the next day or the following morning to collect their catch. Research finding in Lake Kariba show that an average of 35% by weight of the total catch spoiled due to bacterial attack and autolysis if nets are set for more than 13 hours in tropical climate without cooling (Mulambozi, 1990). There are no regulations governing quality and standards of fish to be sold for human consumption. This is evidence at landing sites where the quality of fish is mixed. There is no regular supervision from the government side and the extension service (awareness creation, training, follow up etc) is very poor. The lack of high demand for good quality fish tends to encourage carelessness of the fishers and processors. Quality assessment of the fish used only organolepticaly and the consumer relies on his own judgment and on trust on the fishermen as there is no government inspection service body.

158
Table 3. Percentage yield of gutted and filleted fish in three
Ethiopian lakes
Product Gilgel Gibe Ziway Hashengie
Tilapia fillet 26-29 25-28 32-36
Tilapia gutted 71-75 72-76 74-78 Source: Yared et. al. 2006; Yared, 2014
The yield of each operation and final production of yield differs from lake to lake. According to Montaner et al. (1994) the main reason for operational yield differences from the same species are quality of the raw material, the capacity of the processer and size of the fish. The prices for tilapia fluctuated from 25 to 30 birr per/kg. Conclusion and Recommendations Accurate assessment of post‑harvest loss of fish in Ethiopia is an important challenge, which is made difficult by the fact that much of the artisanal catch is unrecorded and the fishermen may or may not be licensed. Additionally, it passes through many hands on its way from harvest to consumption. Fish, being an extremely perishable foodstuff, it requires careful handling and processing both from public health aspects and improvement of the welfare of fishing communities. The main causes for post-harvest losses include market force loss, inadequate handling, processing and storing facilities, poor extension services and lack of knowledge on proper fish preserving techniques. Although the extent of the problem varied from lake to lake, the country loses significant amount of fish annually due to various reasons. To reduce the post-harvest losses of the fish in the reservoir, the following intervention measures should be in place • Introduce techniques how to remove spines from the barbus flesh and
cooking methods for human consumption; • After harvest to keep the fish in the shade out of direct sun contact and
keep the fish in boxes and off the ground; • Stocking tilapia fingerlings to enhance reservoir fish production; • Processing at the landing sites must be carried out on simple tables;

159
• Maintain a hygienic environment and avoid careless handling; • Construct appropriate processing shade and cooling facilities; • Create consumers awareness on usefulness of barbus for human
consumption; and • Introduce fish meal preparation techniques at village level
References
Alverson DL, MH Freeberg, JG Pope, and SA Muravaski. 1994. A global assessment
of fisheries by-catch and discard FAO Fish. Tech. pp., (339):233.
Geoffrey. R. 1990. The kinds and levels of post-harvest losses in African inland fisheries. In: proceeding of the symposium on post-harvest fish technology. CIFA Technical paper No 19. Rome, FAO. 1992 (1-9).
Howgate P, 1994. Proposed draft Guide line for the Sensory Evaluation of Fish and Shell fish. Cx/FF9 (ital.) 94/0. Joint FAO/WHO food standards program.
Huss HH, 1995. Assurance of sea food quality. FAO fisheries technical paper No.334.
Clucas IJ. 1981. Fish handling, preservation and processing in the tropics: Part 1. Report of the Tropical Products Institute, G144, V iii+144
LFDP (Lake Fisheries Development Project). 1996. Final report, Addis Ababa, Ethiopia.
Montaner MI, MA Parin, AY Zugarramudi, HM Lupin. 1994. Requerimiento insumos en industria pesquera. Alim., (Espana), (253):19-24.
Mulambozi. 1990. Post-harvest fish technology in Zambia. In: Proceedings of the symposium on post-harvest fish technology. Cairo pp.103-106.
Wood CD. 1985. A methodology for the assessment of losses of cured fish and evaluation of counter measures. In: Proceedings of the FAO expert consultation on fish technology in Africa, Lusaka, P.360-368.
Yared Tigabu, Abera Degebasa and Ahmed Mohammed. 2006. Kinds and levels of post-harvest losses and the possible ways to reduce the losses in Lake Ziway. ESAP Proc. Ethiopian Society of Animal production. Addis Ababa, Ethiopia. Pp 141-148.
Yared Tigabu. 2013. Fish post-harvest losses and intervention measures to reduce the losses in Lake Hashengie. Journal of Agricultural development (JAD).JAD 2 (1) 2013 Addis Ababa, Ethiopia. Pp. 34-43.

161
Physico-Chemical and Biological Features of Fish Ponds at Sebeta
Adamneh Dagne, AbelnehYimer and Tarekegn Aragie
Ethiopian Institute of Agricultural Research, Sebeta National Fishery and other Aquatic Life Research Center, Email - [email protected]
Introduction
One of the key issues in aquaculture research is monitoring the water quality of the culture systems as the water quality is consistently changing in ponds. The animals, such as fish, living in the pond are able to acclimate to some of the changes without any ill effect. However, if the water quality change is drastic, then serious consequences to the health of the aquatic life in the pond can happen. According to Meybeck et al. (1996) ’’Water quality” is a term used to express the suitability of water to sustain various uses or processes. Any particular use will have certain requirements for the physical, chemical or biological characteristics of water; for example limits on the concentrations of toxic substances for drinking water use, or restrictions on temperature and pH ranges for water supporting invertebrate communities. Consequently, water quality can be defined by a range of variables which limit water use. According to Piper et al. (1982) Water quality determines to a great extent the success or failure of a fish cultural operation because fish and other organisms with aquaculture potential live and perform all their body functions in water. Understanding the physical and chemical qualities of water is critical to successful aquaculture. Important water quality parameters that should be monitored in order to maintain the health of the aquatic animals living in a pond include measurement of dissolved oxygen (DO), water temperature, pH, ammonia, nitrite and nitrate. In Ethiopia, most of the water bodies are unprotected and used for integrated activities. As a result nutrients are supplied to the aquatic system through erosion from catchment; uncontrolled waste disposal etc. which intern affects the productivity of the water. Aquaculture itself also has significant role in increasing water productivity (Brummett, 2006 c). To use these water bodies for fish culture, limnological studies before

162
and during experiment time is crucial. According to Jamie and Richard (1996) monitoring as a practical activity, provides the essential information which is required for an assessment of water quality. However, assessments require additional information, such as an understanding of the hydro- dynamics of a water body, information on geochemical, atmospheric and anthropogenic influences and the correct approaches for analysis and interpretation of the data generated during monitoring. In addition to the physico-chemical parameters, investigating the prevalence of fish diseases and parasites is also one of the key issues to be included in the day to day monitoring activities in the aquaculture farm. It is when the water quality of the culture systems is in our control that the objectives of the cultured organisms will be achieved. Therefore, the objectives of the present study were to investigate the physico-chemical and biological features of the culture systems at Sebeta NFALRC. Material and Methods
Study area
The study was conducted at Sebeta National Fishery and other Aquatic Life Research Center (NFALRC) research ponds at an altitude of 2220 masl. NFALRC has experimental ponds of different size and type. Concrete walled with a size of 50 to 575 m2, earthen ponds of 50 to 900 m2. The center uses the ponds for experimental trials, breeding and brood stock holding. The experimental trials conducted in those ponds include tilapia strain selection, poly culture of tilapia and catfish, integrated aquaculture and agriculture and cage culture. Ponds water is often renewed by flashing new water and releasing the over flow to avoid aging of the water since aged water will have different physico-chemical propriety that ultimately will have negative impact on the cultured organisms. One of the major problems during the experimental period is under water macrophyte (aquatic weeds) growth in the ponds which have an impact on the growth of algae (phytoplankton), a natural fish food (primary producers) and the base for the aquatic food chain. Weeding of macrophytes was done whenever necessary.

163
Sampling and laboratory analysis Physico-chemical variables: Dissolved oxygen (DO), pH, specific conductivity and water temperature were measured on monthly basis using a multi-probe (Model HQ40d, HACH Instruments).Time serious measurement, three times a day morning, around midday and late afternoon, was done to evaluate their changes along the course of the day (Figure 1). Some of the nutrients such as ammonium-nitrogen and total phosphorous were also analyzed in the laboratory following standard procedures. As part of the monitoring activity, integrated plankton samples were taken from the ponds using 40 µm mesh size plankton net for phytoplankton and 100 µm for zooplankton. Filtered plankton samples were identified under microscope in the laboratory. Species composition and their relative abundance were examined.
Results and Discussion
Physico-chemical parameters The minimum and maximum temperatures of the experimental units during the beginning of the experiment in November and December were 180C around the morning and 20.40C in late afternoon, respectively. The low water temperatures in those months are expected because these are the coldest seasons of the year (Table 1 and Figure 1). The temperature situation in a water body has also significant impact on chemical and biological features of the aquatic systems. According to Balkew (2012) when the temperature becomes low or below the recommended level, the fish stops feeding and even could lead to death. The metabolic activity and physiological functions of aquatic animals (e.g. feed utilization, feed conversion, growth rates of fish) can be affected by the water temperature (Halver and Hardy, 2002; Azaza et al., 2008; Balkew, 2012; Tadesse et al. 2012). However, fish can tolerate a wide range of temperature from 80C to 420C (Philippart & Ruwet, 1982; Trewaves, 1983; FAO, 2009b). Each fish species has an ideal temperature range within which it grows quickly. Suitable temperature for normal Nile tilapia growth and reproduction ranges from 200C to 350C (Trewaves, 1983; El-Sherif El-Feky, 2009) where the present records were also within the range. Results of different experimental trials suggested some water quality requirement for Nile tilapia (Table 2).

164
Tabel 1. Minimum, maximum and mean values of some physico-chemical
parameters during the experiment period
Months Water temp. (0C) DO (mg per liter) Min Max Av. Min Max Av. Oct. 2012 19.8 21.3 21.2 8.9 14.3 10.5 Nov. 17.5 26 21.6 5.5 15.9 12 Dec. 16.9 24 20.5 5.1 16.9 11.3 Nov. 2013 17 22.8 19.7 4.2 11.8 7.6 Dec. 16.8 22.3 19.5 8.6 14.6 10.9 Jan. 2014 17.9 23.9 20.7 7.9 13.6 10.8 Feb. 19.4 24 22.2 7.4 14.1 11.5 pH Cond. (µS per cm) Min Max Av. Min Max Av. Oct. 2012 9.5 10 9.7 153.2 213.6 168.2 Nov. 8.5 9.9 9.4 166.7 227 192 Dec. 8.4 9.8 9.2 Nov. 2013 7 7.6 7.2 171.5 222.5 203.9 Dec. 6.2 8.2 7.1 161.8 216.6 190.6 Jan. 2014 6.8 10 7.9 150.3 206.5 176.9 Feb. 6.8 9.5 8 153 196.4 176.2
Because fish are poikilothermic, temperature has a drastic effect on their metabolism, including the immune system. Fish kept below their optimal temperature zone have a suppressed immune system. There are large fluctuations in the water temperature of ponds during the course of the day. Temperate fish species are able to tolerate a wider temperature range than most tropical species or cold water species. Most fish are able to tolerate a rapid drop in water temperature better than an equivalent rise in temperature. The metabolic rate, which includes oxygen consumption, increases as the temperature rises. Therefore, as dissolved oxygen decreases and the oxygen consumption increases with the increase in temperature, hypoxia (low dissolved oxygen) is frequently a serious concern with high temperature. The temperature of ponds may fluctuate as much as 100C each day without harm to the fish because fish that are acclimated to temperature fluctuations are not as affected by temperature changes as fish acclimated to a constant temperature. For each species, there exist upper and lower limits, as well as an optimum range for growth, which changes with development stages.

165
Figure 1. Pond water temperature at different time of a day, from morning 8:30 am to 5:30 late afternoon, of 3 different ponds (7, 8 and 9)
The dissolved oxygen concentration is above 10 mg/l in the afternoon (Figures 2, and 3a and 3b) which coincides with the rise in the water temperature (reached its maximum in late afternoon, Figure 3c), which also will raise algal production where oxygen is one of the product. The dissolved oxygen (DO) which is essential to all forms of aquatic life is also affected by the temperature regime. According to Wetzel (2001) the solubility of DO depends on temperature, pressure and altitude. The solubility of oxygen decreases as temperature increases (Wetzel, 2001; Lemma, 2008), which is also observed in this study where the concentration of DO was higher during the relatively low temperature condition in November-December and start to decline as the temperature increases.
The DO concentration was relatively higher in this study as compared to similar studies (Liti et al. 2005; Balkew 2012). In the present study the fish were seen actively feeding on the supplemental feed given in the form of pellets in one particular feeding plats (prepared from nets and suspended in the water). This could result in less dependency on the natural fish-feed and can result in more algal biomass, which could result high CO2 fixing via photosynthesis means high oxygen. The other reason for the increased DO in the present study could be due to the growth of aquatic weeds which are one source of oxygen into the pond water.
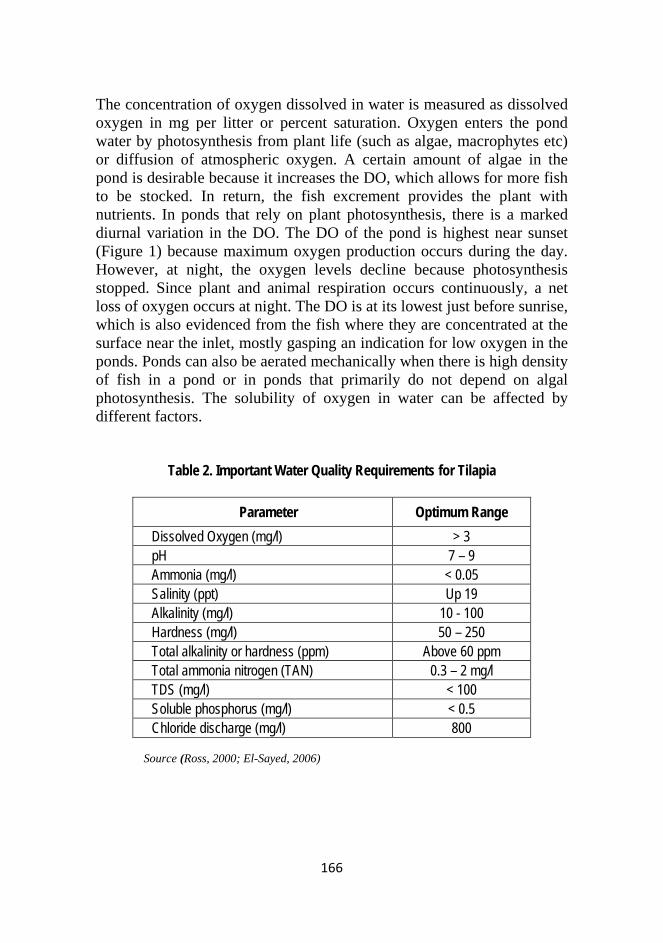
166
The concentration of oxygen dissolved in water is measured as dissolved oxygen in mg per litter or percent saturation. Oxygen enters the pond water by photosynthesis from plant life (such as algae, macrophytes etc) or diffusion of atmospheric oxygen. A certain amount of algae in the pond is desirable because it increases the DO, which allows for more fish to be stocked. In return, the fish excrement provides the plant with nutrients. In ponds that rely on plant photosynthesis, there is a marked diurnal variation in the DO. The DO of the pond is highest near sunset (Figure 1) because maximum oxygen production occurs during the day. However, at night, the oxygen levels decline because photosynthesis stopped. Since plant and animal respiration occurs continuously, a net loss of oxygen occurs at night. The DO is at its lowest just before sunrise, which is also evidenced from the fish where they are concentrated at the surface near the inlet, mostly gasping an indication for low oxygen in the ponds. Ponds can also be aerated mechanically when there is high density of fish in a pond or in ponds that primarily do not depend on algal photosynthesis. The solubility of oxygen in water can be affected by different factors.
Table 2. Important Water Quality Requirements for Tilapia
Parameter Optimum Range Dissolved Oxygen (mg/l) > 3 pH 7 – 9 Ammonia (mg/l) < 0.05 Salinity (ppt) Up 19 Alkalinity (mg/l) 10 - 100 Hardness (mg/l) 50 – 250 Total alkalinity or hardness (ppm) Above 60 ppm Total ammonia nitrogen (TAN) 0.3 – 2 mg/l TDS (mg/l) < 100 Soluble phosphorus (mg/l) < 0.5 Chloride discharge (mg/l) 800
Source (Ross, 2000; El-Sayed, 2006)

167
Figure 2. Dissolved oxygen (DO) at different time of a day, from morning 8:30 am to 5:30 pm late afternoon of 3 different ponds (7, 8 and 9)
Temperature, pressure and altitude affect the solubility of oxygen in water. Oxygen solubility in water increases with the increase in pressure. In the case of temperature, oxygen solubility increases considerably in cold water (for example at 00C one can measure dissolved oxygen concentration of 14.62 mgl-1 but 6.412 mgl-1 at 400C). Large amounts of decomposing material also create a high Biological Oxygen Demand (BOD), lowering dissolved oxygen levels for fish. On the other hand the pH recorded in this study (Figure 4a) was similar to other studies (Liti et al., 2005 and 2006; Balkew 2012) in ponds and other most highland lakes of Ethiopia (Ayenew 2009). The pH fails within the recommended value for fish culture 6.7 - 9.5 (Bhatnagar and Devi 2013). Conductivity which is a measure of the total dissolved ion content of the water in this study ranged from 150 µScm-1 to 227 µScm-1. According to Bhatnagar and Devi (2013) the recommended range of conductivity for pond fish culture ranged between 30 and 5000 µScm-
1where the result in the present study is also within the range.

168
Figure 3. Mean dissolved oxygen - DO (a & b) and mean water temperature (c) at
different time of a day
The nutrients analyzed in this study were total phosphorus (TP) and ammonia-N. The reason behind measuring these two parameters is that the TP which is essential in the algal biomass, which in turn means availing natural food for the ultimate goal of the experiment (increasing fish biomass). On the other hand knowing the concentration of ammonia, which is responsible for the formation of toxicity to the aquatic lives is essential to take intervention measures. For example when ammonia is high in the pond water may be from waste food, fish excreta, dead plankton etc., it will be toxic (El-Shafai et al., 2004; Lemma, 2008). In the present study the concentration of TP (Figure 4) and ammonia-N were 55.2 and 99.2 µgl-1and 0.05 and 0.11µgl-1, respectively. During the study period, the concentration of ammonia was within the range, that could not lead to toxicity. This could be due to the fact that the supplemental feed was given in a suspended net plate where the fish can utilize the feed and no feed leftovers to settle down into the bottom where the formation of ammonia could have been possible. Our observation also

169
confirmed this situation where there was no feed in the suspended net plate after some time indicating the feed given was consumed by the fish.
Figure 4. Temporal variation of total phosphorus in the experimental ponds
As with temperature, fish differ in their optimal pH range, however a pH range between 6.5 and 9 is recommended for freshwater fish. A pH value outside of this range is stressful and potentially lethal to fish. Fish acclimate to a relatively low pH can survive a drop in pH better than the same species maintained at high pH. Also fish exposed to wide pH fluctuations, which is typical in ponds, are most likely to tolerate a rapid change in pH than fish kept under stable pH conditions. In a pond, the pH is highly influenced by the soil type. Acid sulfate soils may create a pond pH less than 4, which is not suitable for fish. The metabolic activity of plants and animals living in the pond produces acids, which tend to gradually decrease the pH.
If water changes are not regularly performed or the pH not adjusted, then the pH can reach 5, which is stressful to fish or below that which can be lethal. Pond water pH is influenced by the buffering capacity of the water, such as the amount of bicarbonate present, and photosynthesis. Photosynthesis uses carbon dioxide, which increases the pH which will be at its peaks at sunset (Figure 5a). At night, however, photosynthesis stops and the carbon dioxide increase cause the pH to decrease. Thus, it is common for the pH to fluctuate in a pond diurnally from 6.5 to 9. However, the change in the pH of pond water will have significant change in the chemistry of the water. For example if the pH is below 8,
0
20
40
60
80
100
120
Nov. 2013 Dec. Jan. 2014 Feb.
Tota
l pho
spho
rus
(µgl-1
)
Months
P7
P8
P9

170
there is almost exclusively ammonium ion (NH4+) which is harmless
(Figure 5b). But above pH 10.5 it becomes entirely un-dissociated ammonia (NH3) which is toxic and at high total ammonium concentration & nutrient rich condition can lead to sudden fish death.
Figure 5. Mean pH of ponds at Sebeta (a) at different time of a day and (b) effect of change in pH
Increasing the buffering capacity of ponds with pH values that consistently fall below 6 will solve the pH problems. In warm water fish ponds with an alkalinity less than 50 mgl-1 as CaCO3, buffer should be added. Ponds with chronic diurnal high pH problems are usually associated with an excessive amount of phytoplankton or higher plant photosynthesis, which tends to increase the pH during the day as CO2 is consumed. Wide pH swings in ponds occurs in low alkalinity water because there is not enough buffering capacity to moderate the plant associated metabolic alkalosis. Most ponds, however, have the proper
5.0
6.0
7.0
8.0
9.0
10.09:
00-1
0:00
1:30
-2:3
0
4:30
-5:3
0
9:00
-10:
00
1:30
-2:3
0
4:30
-5:3
0
9:00
-10:
00
1:30
-2:3
0
4:30
-5:3
0
9:00
-10:
00
1:30
-2:3
0
4:30
-5:3
0
Nov. 2013 Dec. Jan. 2014 Feb.
pH
Time of measurement
a
P7
P8
P9
pH
NH3
NH4+
0 2 4 6 8 10 12 14
Log 10
conc
entra
tion b

171
amounts and proportions of hardness and alkalinity, therefore high pH stress is an uncommon ailment of pond fish. High pH in ponds is important because it increases the amount of toxic, unionized ammonia in the water. Water hardness refers to the concentration of mineral ions in water predominantly by calcium and magnesium. It is expressed in terms of calcium carbonate (CaCO3).One degree of hardness equals 17 ppm CaCO3. Soft water refers to water with 0-75 ppm CaCO3 and has the lowest buffering capacity. Moderately hard water has 75-150 ppm CaCO3 and hard water has 150-300 ppm CaCO3 which has the highest buffering capacity. On the other hand, alkalinity refers to the concentration of basic substances, i.e. bicarbonate, carbonate and hydroxide ion in solution. It is expressed as ppm equivalents of carbonate; therefore, in general, total hardness measurements will be close to measurements of total alkalinity because Ca and Mg are generally associated with carbonate. Water with a high alkalinity is more strongly buffered than water with a low alkalinity. In a closed aquatic system, the pH decreases because of increase hydrogen ions from respiratory processes and a pH crash (pH <4) occurs in soft water when all the buffering capacity is utilized. If a pH crash occurs, then a portion of a water should be changed and a commercially available buffer, such as dolomitic or limestone should be added.
Performance of fish in aquaculture is extremely dependent on the water quality. For fish to effectively feed, grow, excrete wastes and reproduce in a water body, its aquatic environment has to be inhabitable. Both physical and chemical aspects of the aquatic environment must be acceptable to the particular fish species requirements. Based on the data presented herein the key water quality parameters: temperature, pH and specific conductivity measured during the study period were within the optimum range for rearing tilapia as suggested by various authors (Boyd, 1990; Xu et al., 2005; Azaza et al., 2008). However, the dissolved oxygen (DO) saturation is high in most cases between 8 and 10 mg/l) in the morning and super-saturation occurred in both the midday and late afternoon measurement usually between 10 and 14 mg/l (Fig. 3). The reason for such high DO reading is due the production of oxygen by algae and submerged macrophytes (aquatic weeds). The macrophytes which grows continuously due to the availability of nutrients in the ponds which in turn is due to the stirring of the pond bottom while harvesting the fish for sample measurement (every two week) has its own impact to have such high DO reading. Specific conductivity varied strongly among the experimental ponds; however the values were within the range

172
recommended for fishponds (Boyd, 1997; Hargreaves and Heussel, 2000). Hanley (2005) also provided extensive environmental physiology of Oreochromis niloticus where most parameters measured in this study are within the range (Table 3).
Table 3. Some environmental physiology of Oreochromis niloticus Variables Optimum range
for tilapia species Description
Temperature (OC) 25 - 32 • < 22 OC: Reproduction stops; < 16 OC Feeding stops
Salinity 0/0 0 - 20 • < 10 0/00: Fecundity decreases, however some will reproduce
pH 0.5 - 8.0 • Strongly influenced by photosynthesis & hardness
Dissolved oxygen (mg L-1) 3 - 9 • Highly influenced by
temperature & partial pressure of other gases
Ammonia-N (mg L-1) 0 - 0.5 • Influenced by pH & temperature
Hydrogen sulfide (mg L-1) < 0.01 • Highly dependent on dissolved oxygen
Source: Hanley, 2005
Nutrients such as nitrogen and phosphorous are essential for aquatic plants and microbial activity. However, excessive level of these nutrients can create an overabundance of plant growth. Fertilized ponds can lead to excessive weed growth including filamentous algae which can form pond scum. On the other hand, the production of ammonia, nitrite and nitrate or the nitrogen cycle and nitrification are important metabolic features of a pond or aquatic systems. Ammonia is converted to nitrite by bacteria decomposition and nitrite is converted to nitrate by Nitrobacter decomposition. Bacteria, algae and higher plants utilize nitrate as a nutrient. Ammonia & nitrite are toxic to fish. The concentration of Ammonia nitrogen (NH3-N) was within the recommended range, varied between 0.048+0.006 mg/l and 0.107+0.007 g/l.

173
Plankton species composition In the present study, the phytoplankton community consisted of high numbers of Chlorophyta and Bacillariophyta species which can be utilized by the fish. The presence of diverse phytoplankton species in each experimental pond could be due to the less pressure from the fish because of the supplemental feed. The transparency of the pond water usually secchi depth greater than half of the pond water depth could favor most phytoplankton species to grow. Such conditions also will not favor the blue greens to dominate as this species become dominant in turbid condition (Scheffer, 1998). The other reason for such diverse phytoplankton species could be the absence of large filter feeder cladocerans such as Daphnia species (Table 4) which have high grazing pressure (Fernando 1994, Sarma et al., 2005). Phytoplankton biomass estimated as chlorophyll-a in the present study (Figure 6) was low compared with other studies in fertilized ponds elsewhere (Liti et al., 2005; 2006). The difference might be manure fertilization was not done in this study, however the disturbance of the pond water every two weeks while taking sample fish for weight length measurement could have its own influence for the low chlorophyll-a and absence of one dominant phytoplankton species.
Figure 6. Temporal variation in the algal biomass (in terms of Chlorophyll-a) of the experimental ponds
0
5
10
15
20
25
30
35
Nov. 2013 Dec. Jan. 2014 Feb.
Chl-a
(µgl
-1)
Months
P7
P8
P9

174
Table 4. Phytoplankton and Zooplankton species composition of experimental ponds at Sebeta
Phytoplankton Zooplankton
Genus Relative abundance Relative
abundance Chlorophyta Rotifera
Coelastrum sp. 1 Asplanchina sp. 3 Haematococcus sp. 3 Brachionus caudatus 4 Pediastrum sp. 4 B. calyciflorus 2 Scenedesmus sp. 3 B plicatilis 4 Staurastrum sp. 1 Hexarthera sp. 1 Zygnema sp. 3 Keratella quadrata 2
Bacillariophyta Keratella tropica 2 Cymbella sp. 1 Lecane sp. 1 Navicula sp. 1 Polyarthra sp. 1 Nitzschia sp. 1 Trichocerca sp. 3 Synedra sp. 1
Cyanophyta Copepoda Anabaena sp. 3 Diaphanosoma excisum 3 Microcystis sp. 1 Moina micrura 2 Oocystis sp. 1 Cladocera
Dinophyta Cyclopoid copepods 3
Peridinium sp. 1 Nauplii 4
Euglenophyta Euglena sp. 4 Phacus sp. 2
The increasing trend in the algal biomass from November onwards could be due the presence of different algal species which again is associated with the increase in the water temperature. Since the was interruption of the pond bottom for fishing and removing submerged weeds every two weeks that could be the case for the variation in the nutrient concentration (Figure 4) that led for the increase in the algal biomass (Figure 6). In the case of ammonia, the increasing trend compared with

175
the beginning of the experiment could be due to the feed and fish feces effect that is expected through time. However, it was still within the optimal range for tilapia as recommended by (Ross, 200; El-Sayed, 2006) as the other parameters (Table 1).
Rotifers were with species rich greater than three forth of the total zooplankton species identified during the study period. The contribution of the rotifers to the total zooplankton abundance were highest followed by copepods (Figure 7).
Figure 7. Relative abundance of zooplankton groups in the experimental ponds The bacterial and small phytoplankton species which is not identified in the present study are also the potential foods of the rotifers and hence could favor the diversity. On the other hand such zooplankton species composition also reflects typical tropical aspects where rotifers being the diverse taxa (Green, 1993; Fernando, 1994; Dagne et al., 2008). The absence of more crustacean species especially Daphnia species could be the pond age where the experiment was started in a dried and refilled pond and run only for short period that did not give chance for such species to develop in the pond

176
Conclusions and Recommendations
• Most pond water quality parameters measured were within the range recommended for tilapia
• Nutritionally important phytoplankton taxa (mainly green algae) were diverse and abundant indicating the availability of the natural fish food in the system
• Steering the pond bottom while fish sampling for length-weight data measurement cause nutrients re-suspension in the water column which in turn lead the algae to bloom and aquatic weeds to multiply.
• Aged water should be flushed with freshwater at least once a week to kept some toxic nutrients like NH3 below the critical limit for tilapia growth
• Aquatic weeds should be removed to avoid clear water stage-means low natural fish food in ponds
• For successful aquaculture production planned water quality monitoring should be conducted which help to avoid stunt fish growth and or the risk of mass fish kills caused by the changes in the system.
References
Ayenew T. (2009) Natural Lakes of Ethiopia. Addis Ababa University Press. Addis Ababa, Ethiopia.
Azaza M. S., Dhraief M. N. and Kraiem M. M. (2008) Effects of water temperature on growth and sex ration of juvenile Nile tilapia (Oreochromis niloticus) reared in geothermal waters in Southern Tunisia, Journal of thermal Biology, 33: 98-105
Balkew K.W. (2012) Evaluation of Growth Performance, Feed Utilization Efficiency and Survival Rate of Juvenile Nile tilapia, Oreochromis niloticus (Linnaeus, 1758) Reared at Different Water Temperature. Journal of International Aquaculture 2(9), 59-64.
Bhatnagar A. and Devi P. (2013) Water quality guidelines for the management of pond fish culture. International Journal of Environmental Science 3 (6). ISSN: 0976-4402.
Boyd C. (1990) Water Quality in ponds for Aquaculture, Alabama Agriculture Experiment Station, Auburn University, Alabama, USA

177
Boyd C.E. (1997) Practical aspects of chemistry in pond aquaculture, the progressive fish-culturist, 59: 85-93
Brummett R.E. (2006c) Role of aquaculture in increasing water productivity. Challenge Program on Water and Food – Aquatic Ecosystems and Fisheries Review Series 4. Theme 3 of CPWF. c/o World Fish Center, Cairo, Egypt, 23 p.
Dagne A., Herzig A, Jersabek C and Tadesse Z. (2008) Abundance, species composition and spatial distribution of planktonic rotifers and crustaceans in Lake Ziway (Rift Valley Ethiopia). Internat. Rev. Hydrobiol., 93: 210-226.
El-Sayed, A.M. (2006) Tilapia culture in salt water: Environmental requirements, nutritional implications and economic potentials. Eighth Symposium on Advances in Nutritional Aquaculture. November 15–17, Nuevo Leon, Mexico.
El-Shafai, S. A., El-Gohary, F. A., Nasr, F. A., Van Der Steen, N. P. & Gijzen, H. J. (2004)Chronic ammonia toxicity to duckweed-fed tilapia (Oreochromis niloticus). Aquacultural, 232: 117-127.
El-Sherif M.S. and El-Feky AMI.(2009) Performance of Nile Tilapia (Oreochromis niloticus)Fingerlings. II. Influence of Different Water Temperatures. Int.J.Agric.Biol.11:301-305.
FAO (2009b) Fisheries Topics: Statistics. Fisheries statistics and information. In: FAO Fisheries and Aquaculture Department [online]. Rome. Updated in 2009.15 09. [Cited 4 April 2009]. http://www.fao.org/fishery/species/3217.
Fernando C.H. (1994) Zooplankton, fish and fisheries in tropical freshwaters. Hydrobiologia, 272: 105-123.
Green J. (1993) Zooplankton association in East African lakes spanning a wide salinity range. Hydrobiologia, 267: 249-256.
Halver, J. E. & Hardy, R. W. (2002) Fish nutrition, London, Academic Press: An imprint of Elsevier Science.
Hanley F. (2005) A Guide to the Farming of Tilapia II, Aquaculture Jamaica Limited, Bartol Isle farm, St. Elizabeth, Jamaica, pp39
Hargreaves J.A., and Heusel L. (2000) A control system to simulate diel pH fluctuation in eutrophic aquaculture ponds, J. World Aquacult. Soc, 31: 390-402
Jamie B. and Richard B. (1996) Water Quality Monitoring: A Practical Guide to the Design and Implementation of Freshwater Quality Studies and Monitoring Programs. Published on behalf of United Nations Environment Program and the World Health Organization., London UK , Pp. 400.
Lemma B. (2008) Introduction to lake ecology, aquaculture and fisheries in Ethiopia, Haramya University.
Lim C.M. and Webster C.D. (2006) Tilapia, Biology, Culture and Nutrition. pp 27-50. New York, London, Oxford, 678 pp

178
Liti D. M., Mugo R. M., Munguti J. M. and Waidbacher H. (2006) Growth and economic performance of Nile Tilapia (Oreochromis niloticus l). Fed on three brans (maize, wheat andrice) in fertilized ponds. Aquaculture Nutrition 12, 239-245.
Liti D., Cherop L., Munguti J. and Chhorn L. (2005) Growth and economic performance of Nile Tilapia (Oreochromis niloticus l) fed on two formulated diets and two locally available feeds in fertilized ponds. Aquaculture research 36, 746-752.
Meybeck M., Kuusisto E., Mäkelä A. and Mälkki E.(1996) Water Quality. Water Quality Monitoring: A Practical Guide to the Design and Implementation of Freshwater Quality Studies and Monitoring Programmes. United Nations Environment Programme and the World Health Organization.
Philippart, J.-C. & Ruwet, J. C. (1982) Ecology and distribution of tilipia. In: The biology and culture of tilapias. ICLARM Conference Proceedings: International Center for Living Aquatic Resources Management. Manila, Philippines.
Piper R. G., McElwainI. B., OrmeL. E., McCraren J. P., Flower L. G., and Leonard J. R. (1982) Fish hatchery management. U. S. Fish and Wildlife Service, USA
Ross, L. G. (2000) Environmental physiology and energetics. pp. 89–128. In: M. C. M. Beveridge and B. J. McAndrew (eds.) Tilapias: Biology and Exploitation, Fish and Fisheries Series 25, Kluwer Academic Publishers, Dordrecht, The Netherlands.
Sarma S.S.S., Nandini S. and Gulati R.D. (2005) Life history strategy of cladocerans: comparison of tropical and temperate taxa. Hydrobiologia, 542: 315-333.
Scheffer M (1998) Ecology of shallow lakes. Chapman & Hall, pp. 357.
Tadesse, Z., W/gebriel, A., Jovani, M., Tefera, F. and Degefu,F. (2012) Effect of supplementary feeding of agro-industrial by products on the growth performance of Nile Tilapia(Oreochromis niloticus) in concrete ponds. Ethiop. J. Biol. Sci 11:29-41
Trewaves, E. (1983) Tilapiine Fishes of the Genera Sarotherodon, Oreochromis and Danakilia. British Museum (Natural History): London.
Wetzel, R.G. (2001) Limnology: Lake and river ecosystems. 3rd edition. Academic press. N.Y. 1006pp.
Xu J. Y., Miao X. W., Lu Y., and Cui S. R.(2005) Behavioral response of tilapia (Oreochromis niloticus) to acute ammonia stress monitored by computer vision, J. Zhejiang Univ. Sci. B, 6:812-816
ZelalemTeshome (2013) Evaluation of growth and reproduction performance four OreochromisniloticusL. (1758) strains at highland environment under pond culture, Ethiopia. MSc. thesis. UNISCO-IHE, The Netherlands. Pp. 115.

179
Dearth Period Feeding of Honeybees (Apis mellifera) to Boost Honey Production
Tolera Kumsa
Oromiya Agricultural Research Institute, Holetta Bee Research Center Email - [email protected]
Introduction Supplementary feeding to honeybees required when natural floral sources (pollen, nectar, or honey) in scarce (Neupane and Thapa, 2005). Optimum population of honeybee colonies during dearth seasons is required to ensure early colony building to produce surplus honey during honey season (Pernal and Currie, 2001; Kalev et al., 2002; and Prakash, et al., 2007, Somerville and Collins, 2007; Sihag and Gupta, 2013). Different types of supplementary feeding have been tried to feed colonies to maintain the dearth periods in Ethiopia. However, the effect of supplementary feeding on various parameters of honeybee colonies has not been adequately studied. Therefore, this study was carried out to investigate the effect of early supplementary feeding of honeybee colonies using cheaper local supplementary feeding expressed in terms of brood area and honey yield. Materials and Methods Description of the study area The study was conducted In West Shewa Zone, Gedo station of Holeta Bee Research Center from September 2011 to June 2013. Two clearly demarked apiaries with uniform environment were used to minimize the robbing effect of honeybee during external feeding of flour. Two treatments each with seven colonies were established in each apiary in Zander hives and the colonies were equalized to ensure similar strength. Supplementary feeding was provided when flowering plants were not in bloom from February to March (dry season) and from July to August (rainy season). The study colonies received similar seasonal colony manipulation such as super adding for honey production and super reducing when there was no flower.

180
Preparation of supplementary feeding The selection of the feeding material was made based on information local beekeepers and preliminary screening of the important flour through colony feeding. Pea flour was selected for this study based on colony preferences, availability and reasonable price in the study area. Preparation of pea flour follows roasting, removal of seed coat and milling to the texture consumed by honeybees. Water was added to the weighted powder until it turns to soften texture not to be blown by wind while bees collected. Sugar solution supplementary feeding was used as control and was prepared using one kg of sugar with one litter of water to get 50% solution. Supplementary feeding method Feeding pea flour was carried out externally for easy access for bees to collect as the case of natural pollen. It was confirmed by Saffari et al. (2010) that honeybees by nature need humming to collect powdery substances which is an easy method and consumes minimum time and labour. Sugar syrup was fed internally as conventional feeding according to Avni et al (2009). Feeding was suspended when pea flour consumption ceased by honeybees because of the availability of natural pollen (Mattila and Otis, 2006). Both treatments were free accessed to collect naturally available flora if any in the area. Colony population measurement Colonies were assessed following a standard procedure including the estimate of adult bee populations using the number of combs covered with bees, areas of brood coverage and pollen stored in the colonies using a grid that covers the entire side of combs and was measured after every 21 days interval following (Keller, et al, 2005, Sena, et al, 2012, Kumar et al, 2013). Finally in honey flow seasons, honey was harvested and recorded. Statistical analysis All the recorded data were statistically tested using T-test and linear regressions. The cost of feeding materials was calculated and compared to find the cheapest supplementary feeding.

181
Results and Discussion Consumption of pollen supplement The consumption rate of pea flour was recorded for five consecutive days based on the daily colonies consumption progress. The mean pea flour consumption (gram/colony) of honey bees was found to be progressive for the first three days and started to decline on fourth and fifth days (Figure 1). Colonies preferentially collected and utilized 1.6 litters (1:1) sugar solution in three days. The mean consumption of pea flour was 348.9 gram per colony in dry seasons (February to March) and 128 gram during rainy season (July to August). During the study, it was observed that colonies collected the flour and stored in combs for further consumption. Linear regressions showed that there was a positive and highly significant (p< 0.001) relationship between the amounts of supplementary flour consumed, brood area and adult bee population increase. Pollen supplementation with locally-available ingredients can be a valuable resource for beekeepers to maintain and increase colony population (Morais et al., 2013). Pea, chickpea and soybean flour have long been practiced as local feeding materials as supplementary feeding of honeybees during floral dearth because of easy availability, relatively high protein content and reasonable price as compared to other bee feeding materials (Somerville, 2005).
Figure 1. Mean consumption rate of pea flour

182
Dearth period supplementary feeding of honeybee Findings of the present study showed that colonies fed on the pea flour significantly (P<0.05) produced more brood compared to colonies fed sugar syrup during dearth periods. The mean amount of brood produced from colonies fed on pea flour was 1274.3cm2±195cm2 in dearth period, while mean dearth period brood production for colonies fed on sugar solution (SS) was 924.8cm2±163cm2 (Table 1). In situation, where, pollen and nectar are in short supply, supplementary feeding of honeybees will maintain the colony strength throughout dearth period and help to improve colony strength as would be expected in honey flow seasons (Prakash, et al., 2007). Similar results from supplementary feeding of soybean flour to honeybee colonies indicated that it increases brood production during a shortage of natural pollen (Al-Gamdi, 2002, Dastouri et al, 2007, Abusabbah, et al., 2012). Moreover, this study showed that the colonies fed on pollen supplement reared significantly more brood as conformed by Kumar et al., 2013 and Nabors, 2000) who reported an increase brood rearing of honeybee colonies fed on pollen supplements during pollen dearth period. Adult bee populations was also estimated on frames occupied by honeybees and it was significantly different (p<0.05) between colonies feeding pea flour and sugar solution. Supplementary feeding of pea flour to honeybee colonies produced higher number of bees estimated on frames (9.7±2.6 frames) compared to colonies fed on sugar syrup (7.3±1.5 frames). As shown in Table 1, significant differences were observed between treatments in terms of their effects to increase brood area in cm2, bee population and honey production. Feeding pea flour gave better result, compared to sugar syrup feeding. The finding is in close agreement with Collins (2007) and Kumer and Agrawal (2013) who reported that number of bee covered on frames are positively affected by feeding protein-rich diet to the bees. As the natural flower progressed such as Gizotia scabira, Bidens pachyloma, Gizotia abyssinica and Vernonia amygdalina from September to December and Eucalyptus species, Croton machrostachyus and Grevillea robusta from April to May, the consumption of pea flour steadily decreased to the level honeybees were refused to collect. Somerville (2005) who indicated that good flowering

183
conditions provided the necessary natural pollen and nectar requirements and bees did not create significant response to consume supplementary feeding. Table 1. Effect of feeding of pea flour and sugar syrup on brood area, honeybee
population, stored pollen and honey production
Test group Feeing treatments Mean + SD T-stat Sig
Dearth period brood area (cm2) Pea flour 1274.3+195
1.83 0. 04 Sugar syrups 924.8+163
Dearth period bee population (frames number)
Pea flour 9.7+2.6 1.78 0.35
Sugar syrup 7.3+1.5
Active season natural pollen store (cm2)
Pea flour 276.2+16 0.9 0.22
Sugar syrup 233.3+13
Active season brood area (cm2) Pea flour 3851+74
1.96 0.01 Sugar syrup 3337+55
Honey yield (kg) Pea flour 26.8 ±2.2
2.0 0.02 Sugar syrup 21.3 ±1.8
After natural flower is become available, the natural pollen stored is steadily increased in the hive with 276.2+16 cm2 and 233.3+13 cm2 in colonies fed pea flour and sugar syrup respectively, however, there was no significant differences in pollen store (P= 0.22) between treatments. The brood areas also progressively increased and significant differences (p<0.05) was observed between the treatments (Table 1). The mean amount of pollen stores in brood produced in the early honey-flow was 3851±174cm2 for colonies fed on pea flour, while mean brood production for colonies fed on sugar syrup was 3337±155cm2 before additional hive supers were given for honey production. This indicated that supplementary feeding was increased the capacity of honeybees to store more natural pollen before honey flow to rear more brood to produce more forager bees for surplus honey production before natural flower is dried. Sugar syrup feeding stimulated honeybees to increase the natural pollen income and become capable of producing brood. It has long been recognized as having a stimulatory effect, such as an increase in pollen-gathering and egg-laying activity as well as

184
increased hygienic behavior of honeybee (Madras-Majewska, et al, 2005, Prakash, et al., 2007, Sammataro and Weiss, 2013). Honey yield Honey was harvested in late January and sometimes in October. It should be noted that first year was not a very good year for honey production, because of the unsuitable weather conditions occurred in the area. There was statistically significant differences in honey yields between treatments (P<0.05). Colonies which received pea flour produced more honey (26.8 ±2.2 kg) compared to colonies which received sugar syrup (21.3 ±1.8 kg). This statement is also supported by the finding of Nabors (2000) and Mattila and Otis (2006) who reported that feeding honeybee colonies with protein supplements increased the yield of honey harvested compared to sugar supplemented colonies. Cost of supplemental feeding The cost benefit of supplementary feeding of honeybee colonies compared and pea flour is found as attractive protein supplementary feeding, easily available at local condition and relatively cheap. The cost analysis of feeding including labor cost indicated that return from surplus honey production exceeded costs of supplementary feeding for both treatments. Moreover, feeding pollen supplement resulted in better return than sugar feeding (Table 2).
Table 2. Supplementary feeding cost of honeybees
Treatment Total revenue from sale of honey (Birr)
Cost of supplementary feeding materials (Birr)
Net revenue
(Birr)
Pea flour supplement
26.8kg of honey per harvest/colony x 60 = 1596
4 kg pea flour x 20 b including labor cost = 80 1516
Sugar syrup supplement
21.3kg honey per harvest/ colony x 60 = 1278 6kg of sugar x 20 b = 120 1158 b
Supplementary feeding of honeybee helps to sustain colonies during dearth periods so that colonies could exploit the full advantage of honey-flow for surplus honey production. The study indicated that, early brood production and pollen store was increased in pea flour fed colonies compared to sugar fed colonies. The overall study has a great

185
significance for productive beekeeping and it can be concluded that pea flour as supplementary feeding of honeybee colonies was important in early brood production and surplus honey store in honey flow time, followed by colonies fed on sugar syrup. Therefore, future detailed studies will be required to prepare attractive and palatable recipe of supplementary feeding of honeybees that contain all balanced diet. References
Abusabbah MO, ME Mahmoud, MO Mahjoub, D Omar, MN Abdelfatah. 2012.
Promising alternative diets for honey bees to increase hive activities and sustain honey production during dry seasons in Saudi Arabia. International Journal of Agri-Science. Vol. 2(4): 361-364. www.inacj.com
Al-Ghamdi A. 2002. The effect of pollen supplementary feeding on some activity of honeybee colonies during summer season in Riyadh. Saudi. J. Biol. Sci.,Vol. 9(2).
Avni D, A Dag, and S Shafi. 2009. The effect of surface area of pollen patties fed to honey bee (Apis mellifera) colonies on their consumption, brood production and honey yields. Journal of Apicultural Research and Bee World 48(1): 23-28.
Dastouri MR, N Maheri-Sis, A Aghajanzadeh-Golshani, and Y Ebrahim-Nezhad. 2007. The effect of replacement of feeding of some protein sources with pollen on honey bee population and colony performance. Journal of Animal and veterinary advances 6 (11): 1258-1261
Kalev H, A Dag, S Shafir. 2002. Feeding pollen supplements to honey bee colonies during pollination of sweet pepper in enclosures. American Bee Journal 142(9): 675-679.
Keller I, P Fluri, and A Imdorf. 2005. Pollen nutrition and colony development in honey bees Part II. Bee World 86(2): 27-34. www.ibra.org.uk.
Kumar R and OP Agrawal. 2013. Influence of feeding protein rich diet to Apis Mellifera colonies during dearth periods in Gwalior, India. Asian J. EXP. Biol. SCI.VOL. 4(3): 411-417
Kumar R, GS Rajpoot, RC Mishra, and OP Agrawal. 2013. Effect of feeding various diet formulations to honey bee colonies during dearth period under Gwalior (India) conditions. Munis Entomology and Zoology, 8 (1): 267-272.
Madras-Majewska B, Z Jasinski, A Jojczyk, and F Korfanty. 2005. Effect of early supplemental feeding honeybee colonies with a substitute of bee bread made of drone brood candy, glucose and honey on colony strength.
Marghitaş LA, O Bobiş, M Tofalvi. 2010. The effect of plant supplements on the development of artificially weaken bee families. Animal Science and Biotechnologies: 43(1).

186
Mattila HR and GW Otis. 2006. Influence of pollen diet in spring on development of honeybee (Hymenoptera: Apidae) Colonies. Journal of Economic Entomology, 99(3):604-613.
Morais M, AP Turcatto, TM Francoy, LS Gonçalves, FA Cappelari, and D Jong. 2013. Evaluation of inexpensive pollen substitute diets through quantification of haemolymph proteins. Journal of Apicultural Research 52(3): 119-121.
Nabors RA. 2000. The effects of spring feeding pollen substitute to colonies of Apis mellifera. American Bee Journal 140: 322-323.
Neupane KR and RB Thapa. 2005. Alternative to off-season sugar supplement feeding
of honeybees. J. Inst. Agric. Anim. Sci. 26:77-81
Pernal SF and RW Currie. 2001. The influence of pollen quality on foraging behavior in honey bees (Apis mellifera L.). Behavioural Ecology and Sociobiology 51: 53-68.
Prakash S, NS Bhat, MI Naik,. and BC Swamy. 2007. Evaluation of pollen supplement and substitute on honey and pollen stores of honeybee, Apis cerana Fabricius. Karnataka J. Agric. Sci.,20(1): 155-156.
Saffari A, PG Kevan, and J Atkinson. 2010. Consumption of three dry pollen substitutes in commercial apiaries. J. of Apicultural Science. Vol. 54: 5-12.
Sammataro D and M Weiss. 2013. Comparison of productivity of colonies of honey bees, Apis mellifera, supplemented with sucrose or high fructose corn syrup. J. of Ins. Sci. 13:19. Available online: http://www.insectscience.org/13.19.
Sena L, S Sena, and A Hoda. 2012. Feeding efficiency of pollen substitutes in a honey bee colony. Third International Scientific Symposium "Agrosym Jahorina.
Sihag R C and M Gupta. 2013. Testing the effects of some pollen substitute diets on colonies build up and economics of beekeeping with Appis Mellifera L. Journal of Entomology 10 (3):120-135.
Somerville D. 2005. Fat bees skinny bees – a manual on honeybee nutrition for beekeepers. Rural Industries Research and Development Corporation. Canberra, ACT, Publication number 05/054.
Somerville D and D Collins D. 2007. Field trials to test supplementary feeding strategies for commercial honeybees. Rural Industries Research and Development Corporation. www.rirdc.gov.au/fullreports/index.html.

187
Performance of Mulberry Silkworm Strains (Bombyx mori L.) in Different Areas of Ethiopia
Kedir Shifa1, Abiy Tilahun1, Metasebia Terefe1, Ahmed Ibrahim1, Kassa Biratu2, Samuel Menbere3 and Eshetu Yirsaw4
Ethiopian Institute of Agricultural Research, (1Melkassa, 2Jimma, and 3Wondo Genet)
and , 4Alagae ATVET College , Email – [email protected]
Introduction However, rearing of superior silkworm strains that adapt to the local environment in Ethiopia is an important strategy for enhancing cocoon quality, increasing cocoon yield and improving economic benefit (Nguku et al., 2009). Differences in climatic conditions of different agro-ecological across the regions, including the significant distinctions in temperature and humidity necessitate that the silkworm strain should be both high yielder and adversity resistant (Basavaraja et al., 2005). Rearing performance in silkworms is affected by ecological, biochemical, physiological and quantitative characters, which influence growth and development, quantity and quality of silk they produce in different geographical locations (Virk et al, 2011; Ramesh et al, 2012; Anandakumar and Michael, 2012 and Reddy et al, 2012). Its success depends on the various factors including successful implementation of technological and managerial tools along with high yielding best-suited mulberry varieties and silkworm strains (Rajan and Himantharaj, 2005). In addition, the B. mori insect is an oligophagous herbivore and depends mainly on the quality of mulberry leaves and environmental conditions for its development (Murthy et al, 2007). Therefore, appropriate selection of the silkworms strains based on rearing performance and economic values in different climatic conditions is essential to select and exploit suitable silkworm strains for improved sericulture practices (Basavaraja et al, 2005 and Virk et al, 2011). On the other hand, there is no any recommended silkworm strain for mulberry silk production in Ethiopia. The objective of this study was therefore to evaluate different introduced mulberry silkworm strains for adaptability, yield and quality.

188
Materials and Methods Description of the study areas The experiment was conducted in four locations: Melkassa, Wondo-Genet, Jimma Agricultural Research Centers (ARCs), and Alagae ATVET College, Ethiopia. These locations represent some of the agro-ecologies of the country assumed suitable for silkworm production. Lay out and rearing As per the rearing recommendations of silkworms by Rajan and Himantharaj (2005), the silkworm rearing room and equipments were cleaned, washed and disinfected with 2% formalin solution at the rate of 800ml per 10m2 before the commencement of the experiment (rearing). In this experiment, eight mulberry silkworm strains were evaluated. These include four Kenyan (ICIPE) bivoltine strains (Kenya-1, Kenya-3, Kenya-4 and Kenya-5), two Korean bivoltine strains (Korea-1 and Korea-3) and two Vietnamese multivoltine strains (Mult-yel and Mult-wh). The experiment was designed in a Completely Randomized Design (CRD) with four replications. In each replication, 200 worms were used and allowed to complete their life cycle. Rearing was done in trays measuring 90 x 60cm, placed on rearing racks, 150 x 75 x 200cm which accomodated 20 trays each. Mulberry (Bomyx mori) was cultivated and used as feed source for these silkworms. Tender leaves were fed four times a day until the larvae ends 2nd instar stage and semi tender leaves to 3rd instar larvae, while more matured leaves were fed to 4th and 5th instar larvae. Data collection and analysis As adopted by Kedir et al. (2014), egg count was made before larval hatching. On the sixth day of spinning, the cocoons were harvested, counted and weighed. Data like larval and total life cycle duration (in days) and mature larval weight (in grams) were recorded. Cocoons from all strains were harvested from the mountages and then sorted. Cocoons were weighed by using sensitive electronic balance after cutting open the cocoons using a blade to release the pupa and the moulted skin. Then, the cocoon weight (with pupa) and cocoon shell weight (without pupa) were documented. The following formulae were used to determine egg hatchability (%), effective rate of rearing (ERR %) and silk or shell ratio (%).
eggsnormalofNumbereggsnonhatchedofNumbereggsnormalofNumberlarvatotyhatchabiliEgg −
=
𝑆ℎ𝑒𝑙𝑙 𝑟𝑎𝑡𝑖𝑜 =
𝑤𝑒𝑖𝑔ℎ𝑡 𝑜𝑓 𝑡ℎ𝑒 𝑐𝑜𝑐𝑜𝑜𝑛 𝑠ℎ𝑒𝑙𝑙 𝑤𝑒𝑖𝑔ℎ𝑡 𝑜𝑓 𝑡ℎ𝑒 𝑤ℎ𝑜𝑙𝑒 𝑐𝑜𝑐𝑜𝑜𝑛
𝑥 100

189
𝐸𝑅𝑅 =𝑁𝑢𝑚𝑏𝑒𝑟 𝑜𝑓 𝑐𝑜𝑐𝑜𝑜𝑛 𝑦𝑖𝑒𝑙𝑑
𝑁𝑢𝑚𝑏𝑒𝑟 𝑜𝑓 𝑙𝑎𝑟𝑣𝑎𝑒 𝑏𝑟𝑢𝑠ℎ𝑒𝑑𝑥100
Finally, data were analyzed using SAS software (SAS, 2000). Least Significant Difference (LSD) was used to test significance of differences among treatment means at 5% probability. Results and Discussion The present study clearly showed variations in growth and cocoon characters of mulberry silkworm strains, Bombyx mori. Data on growth, rearing performance and cocoon traits of mulberry silkworm strains viz., egg hatchability (%), larval and total life cycle durations (days), larval weight (g), effective rate of rearing (%), cocoon weight (g), shell weight (g) and shell ratio (%) of different strains are illustrated below. Significant differences were observed in silkworm characters among mulberry silkworm strains in different locations. Varying larval development periods and total life cycle durations were recorded from the strains. Egg hatchability Egg hatchability of mulberry silkworm strains to larval stage ranged from 63.7% to 91.0% (Table 1). The mulberry silkworm strains showed significant variation in egg hatchability at Melkassa and Jimma areas. In Melkassa, Kenya-1 strain had highest egg hatchability (75.7%) followed by Mult-yel (85.557 %) but Kenya-3 strain had the least one (63.7 %). In Jimma, the best egg hatchability was recorded from Korea-3 (91.0 %) followed by Korea-1 (89.0 %), Mult-wh (85.81 %), Kenya-1 (84.0 %) and Mult-yel (79.9%) but the least hatchability was recorded from Kenya-4 (76%). Larval and total life cycle duration Larval period and total life cycle duration of the strains showed significant differences in all locations (Figure 1). The shortest larval duration was noticed at Alage from Mult-yel (21.89 days) and Mult-wh (22.0 days) strain. However, the longest larval duration was observed at Jimma from Kenya-5 (32.0 days) strain. In addition, the shortest total life cycle duration was recorded at Alage from Mult-yel (45 days) and Mult-wh (45.6 days) strains but the longest was recorded at Jimma from Kenya-1 (79.7 days) strain. Generally, multivoltine strains had shorter larval and total life cycle durations compared to bivoltine strains.
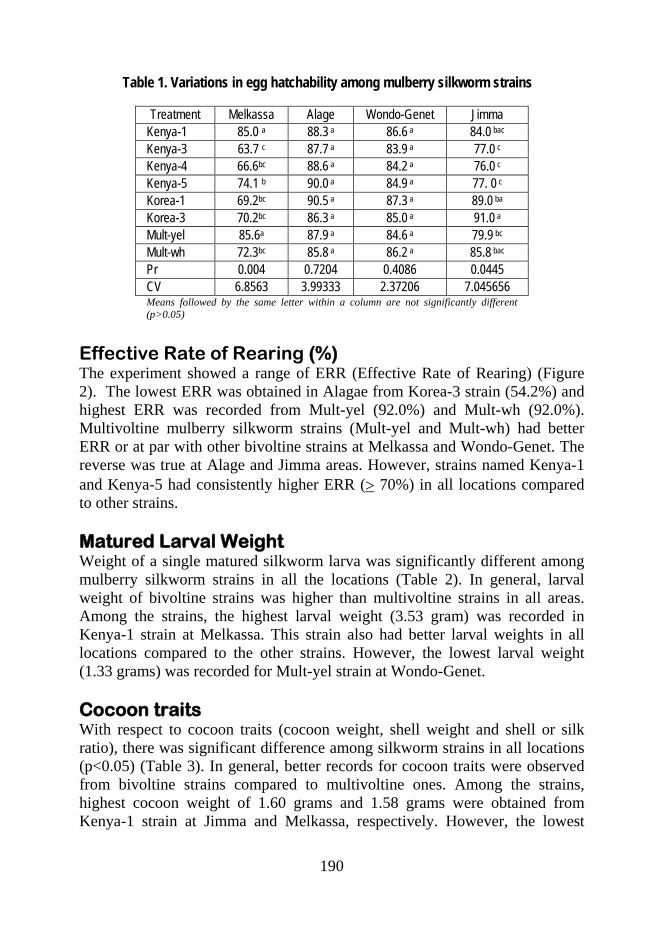
190
Table 1. Variations in egg hatchability among mulberry silkworm strains
Treatment Melkassa Alage Wondo-Genet Jimma Kenya-1 85.0 a 88.3 a 86.6 a 84.0 bac Kenya-3 63.7 c 87.7 a 83.9 a 77.0 c Kenya-4 66.6bc 88.6 a 84.2 a 76.0 c Kenya-5 74.1 b 90.0 a 84.9 a 77. 0 c Korea-1 69.2bc 90.5 a 87.3 a 89.0 ba Korea-3 70.2bc 86.3 a 85.0 a 91.0 a Mult-yel 85.6a 87.9 a 84.6 a 79.9 bc Mult-wh 72.3bc 85.8 a 86.2 a 85.8 bac Pr 0.004 0.7204 0.4086 0.0445 CV 6.8563 3.99333 2.37206 7.045656 Means followed by the same letter within a column are not significantly different (p>0.05)
Effective Rate of Rearing (%) The experiment showed a range of ERR (Effective Rate of Rearing) (Figure 2). The lowest ERR was obtained in Alagae from Korea-3 strain (54.2%) and highest ERR was recorded from Mult-yel (92.0%) and Mult-wh (92.0%). Multivoltine mulberry silkworm strains (Mult-yel and Mult-wh) had better ERR or at par with other bivoltine strains at Melkassa and Wondo-Genet. The reverse was true at Alage and Jimma areas. However, strains named Kenya-1 and Kenya-5 had consistently higher ERR (> 70%) in all locations compared to other strains. Matured Larval Weight Weight of a single matured silkworm larva was significantly different among mulberry silkworm strains in all the locations (Table 2). In general, larval weight of bivoltine strains was higher than multivoltine strains in all areas. Among the strains, the highest larval weight (3.53 gram) was recorded in Kenya-1 strain at Melkassa. This strain also had better larval weights in all locations compared to the other strains. However, the lowest larval weight (1.33 grams) was recorded for Mult-yel strain at Wondo-Genet. Cocoon traits With respect to cocoon traits (cocoon weight, shell weight and shell or silk ratio), there was significant difference among silkworm strains in all locations (p<0.05) (Table 3). In general, better records for cocoon traits were observed from bivoltine strains compared to multivoltine ones. Among the strains, highest cocoon weight of 1.60 grams and 1.58 grams were obtained from Kenya-1 strain at Jimma and Melkassa, respectively. However, the lowest

191
cocoon weight was obtained from Mult-yel (0.73 grams) and Mult-wh (0.73 grams) strains at Wondo-Genet.
a) Larval duration (in days)
b) Duration of the total life cycle (in days)
Figure 1. Larval (a) and total life cycle (b) durations (in days) for different mulberry silkworm strains
0 10 20 30 40
Kenya-1
Kenya-3
Kenya-4
Kenya-5
Korea-1
Korea-3
Mult-yel
Mult-whJimma
Wondo-Genet
Alagae
Melkassa
0 20 40 60 80
Kenya-1
Kenya-3
Kenya-4
Kenya-5
Korea-1
Korea-3
Mult-yel
Mult-wh Jimma
Wondo-Genet
Alagae
Melkassa

192
Similarly, maximum shell weight was obtained from Kenya-1 strain at Jimma (0.3547 grams) and Melkassa (0.33 grams), while the minimum shell weight was recorded from Mult-yel (0.11 grams) and Mult-wh (0.11 grams) strains at Wondo-Genet. In addition, the highest shell ratio was documented from Kenya-1 strain at Jimma (22.2%) and Wondo-Genet (21.6 %) but the lowest was from Mult-yel and Mult-wh strain in all locations (Table 3).
Figure 2. Variability of different mulberry silkworm strains in effective rate of rearing
Table 2: Variations in larval weight (in grams) of different mulberry silkworm strains
Treatment Melkassa Alagae Wondo-Genet Jimma Kenya-1 3.53 a 2.13 a 2.66 a 3.23 a Kenya-3 3.1 bc 2.10 a 2.03 b 3.42 a Kenya-4 2.92 c 1.79 b 2.06 b 3.57 a Kenya-5 3.16 bc 1.63 c 2.64 a 3.53 a Korea-1 3.18 bc 1.67 c 1.98 b 3.14 a Korea-3 3.41 ba 1.60 c 2.02 b 3.42 a Mult-yel 2.22 d 1.43 d 1.38 c 2.09 b Mult-wh 2.20 d 1.40 d 1.33 c 2.25 b Pr <0.0001 <.0001 <.0001 0.0071 CV 6.2904 3.384016 5.813441 10.85261 Means followed by the same letter within a column are not significantly different (p>0.05)
0102030405060708090
100
Melkassa
Alagae
Wondo-Genet
Jimma

193
In general, the different silkworm strains showed statistical significant differences among themselves in terms of important silkworm characters in the study locations at p<0.05. For example, significant variation in duration to complete different life stages was observed which include larval duration (21.7days to 32.0 days) and total life cycle duration (44.9 days to 79.7 days. Related studies conducted by Shah et al. (2007), studied the performance of mulberry silkworms and different seasons and different varieties and confirmed such type of variations. Moreover, significant variability among silkworm strains on egg hatchability (63.7% to 91%) and larval weight (1.33 grams to 3.57 grams) and effective rate of rearing (56.2% to 92%) were recorded which was also in conformity with Qader et al (1992) who observed such differences among silkworm stains through feed nutritive value studies. In regard to cocoon parameters, this study showed single cocoon weight (0.73 grams to 1.6 grams), single shell weight (0.108 grams to 0.36 grams) and silk ratio (14.7 to 22.7%). This result is in agreement with findings of Nguku et al (2009) who studied performance of different mulberry silkworm strains in neighboring country (Kenya). In general, all differences could be justified because rearing performance in silkworms is affected by ecological, biochemical, physiological and quantitative characters, which influence growth and development, quantity and quality of silk they produce in different geographical locations (Virk et al, 2011; Ramesh et al, 2012; Anandakumar and Michael, 2012; and Reddy et al, 2012). Among geographically determined factors, Legay (1958) and Scriber and Slansky (1981) stated that temperatures in the range of 21–27 °C with relative humidity (RH) of 70–85% are required for silkworms effective growth and cocoon productivity. It is known that the productivity of silkworms is affected by temperature and humidity and is verified among the silkworms reared in the all locations. In addition, the nutritive value of leaves especially the moisture content may also vary to contribute to variability in performance of silkworm strains at different agro-ecological zones (Jayaramiah and Sannappa, 1998).

194
Table 3. Differences in cocoon traits among mulberry silkworm strains
Means followed by the same letter within a column are not significantly different (p>0.05)
Treatment Melkassa Alage Single cocoon
weight (g) Single shell weight (g)
Silk ratio (%) Single cocoon weight (g)
Single shell weight (g)
Silk ratio (%)
Kenya-1 1.58a 0.33 a 21.0a 1.19 a 0.270 a 22.8 a Kenya-3 1.38bc 0.28b 20.5 a 1.18 a 0.263 a 22.4ba Kenya-4 1.34 c 0.27 b 20.4 a 0.91 b 0.187 b 20.6 b Kenya-5 1.55 ba 0.33 a 21.1 a 0.83d 0.144 c 17.4 c Korea-1 1.55 ba 0.32 a 20.7a 0.87 c 0.160 c 18.3 c Korea-3 1.53 ba 0.33a 21.4a 0.87 c 0.153 c 17.7 c Mult-yel 0.94d 0.15 c 15.8 b 0.81 d 0.123 d 15.3 d Mult-wh 0.93d 0.14 c 14.7 b 0.80 d 0.120 d 14.9d P <0.0001 <0.0001 <0.0001 <.0001 <.0001 <.0001 CV 7.7314 7.327 3.881 2.0386 6.1602 5.8587 Wondo-Genet Jimma Kenya-1 1.24 a 0.27 a 21.6 a 1.60 a 0.355 a 22.2 a Kenya-3 1.22 a 0.25 b 20.5 ba 1.35 b 0.272 bc 20.1ba Kenya-4 1.21 a 0.24 b 20.1 b 1.47 ba 0.268 c 18.2bc Kenya-5 1.22 a 0.25 b 20.3 ba 1.54 a 0.335 a 21.8 a Korea-1 1.23 a 0.25 b 20.3 ba 1.35 b 0.272 bc 20.1ba Korea-3 1.24 a 0.25 b 20.5 ba 1.50 a 0.327 ba 21.7 a Mult-yel 0.73 b 0.11 c 15.3 c 0.85 d 0.128 d 15.2 c Mult-wh 0.73 b 0.11 c 14.9 c 1.04 c 0.162 d 15.6 c P <.0001 <.0001 <.0001 <.0001 <.0001 0.0019 CV 1.6157 3.4345 4.0699 6.3653 11.9265 10.3933

195
Conclusion and Recommendation The evaluated mulberry silkworm strains exhibited important variability in different locations. Hence, the characteristics of the strains of silkworms and agro-ecological conditions, etc. can be recognized to affect mulberry sericulture from this experiment. Therefore, evaluation and identification of mulberry silkworm strains for adaptability and yield at different environments is confirmed to be very essential practice for future interventions in silk production sector. In summary, it is observed that multivoltine strains showed significantly lower life periods as compared to bivoltine strains. These multivoltine strains also exhibited significantly lower larval, pupal and shell weights. Conversely, bivoltine strains have performed better than multivoltine strains in regard to commercial (cocoon) traits. On the other hand, the bivoltine strains have also revealed significant differences among each other. Among them, a bivoltine mulberry silkworm strain known by Kenya 1 have showed an outstanding performance compared to all other strains in all locations. Therefore, it is recommended for future research and development efforts on mulberry sericulture in Ethiopia. However, a lower cocoon yield obtained in the country compared to recent international productivity levels necessitates the need for further research and improvement works. References
Anandakumar MD and AS Michael. 2012. Effect of nutritive additive of mulberry and its impact on nutritional components of silkworm, Bombyx mori L. Int. J. Adv. Biotech. Res. 3:523-529
Basavaraja HK, SK Aswath, NS Kumar, NM Reddy, and GV Kalpana. 2005. Silkworm Breeding and Genetics. Central Silk Board, Bangalore, pp. 39-341.
Kedir Shifa, Emana Getu and Waktole Sori. 2014. Rearing Performance of Eri-Silkworm (Samia cynthia ricini Boisduval) (Lepidoptera: Saturniidae) Fed with Different Castor (Ricinus communis L.) Genotypes. J. Entomol. 11:25-33
Hajare TN, AD Jadhav, M Venugopalan, NG Patil, A Chaturvedi, and AK Maji. 2007. Evaluation of sericulture for augmenting agricultural income of marginal farmers in semi-arid region of India. Proceedings of the International Conference on Sericulture Challenges in the 21st Century and the 3rd BACSA Meeting, September 18-21, 2007,. Vratza, Bulgaria.

196
Jayaramaiah M and B Sannappa. 1998. Correlation coefficients between foliar constituents of castor genotypes and economic parameters of the eri silkworm, Samia cynthia ricini, Boisduval (Lepidoptera: Saturniidae). Proceedings of the 3rd International Conference on Wild Silkmoths, November 11-14, 1998, Bhubaneshwar, India.
Legay JM. 1958. Recent Advances in Silkworm Nutrition. Ann. Rev. Entomol. 3:75-86
Murthy VNY, HL Ramesh, G Lokesh, Munirajappa, and BRD Yadav. 2013. Assessment of six Mulberry Germplasm varieties through Moulting and Bioassay parameters by using Crossbreed Silkworms Bombyx mori L. for Commercial Exploitation in Kolar District, Karnataka, India. Int. Res. J. Biol. Sci. 2: 69-75
Metaferia H/Yimer, Amanuel Tamiru and Kedir Shifa, 2006. Scaling up of silk production technologies for employment and income generation in Ethiopia. Proceedings of the International Conference on Scaling Up and Scaling Out of Agricultural Technologies in Ethiopia, May 9-11, 2006, Ethiopian Institute of Agricultural Research, Addis Ababa, Ethiopia.
Nguku EK, VV Adolkar, SK Raina, KG Mburugu, OM Mugenda, and DM Kimbu. 2009. Performance of Six Bivoltine Bombyx mori (Lepidoptera: Bombycidae) Silkworm Strains in Kenya. Th. Op. Entomol. J. 3: 1-6
Qader MA, R Haque, and N Absar. 1992. Nutritive effects of different types of mulberry leaves on larval growth and cocoon characteristics of Bombyx mori L. Pak.J. Zoology, 24: 341-345
Rajan RK and MT Himantharaj. 2005. Silkworm Rearing Technology. Central Silk Board, Bangalore, pp. 15-136.
Ramesha C, H Lakshmi, SS Kumari, CM Anuradha, CS Kumar. 2012. Nutrigenetic screening strains of the mulberry silkworm, Bombyx mori, for nutritional efficiency. J. Ins. Sci. 12:1-18
Reddy NM, SN Kumar, AR Naseemabegum, SM Moorthy, and SMH Qadri. 2012. Performance of bivoltine silkworm hybrids of Bombyx mori L. involving parental foundation crosses of different generation. Int. J. Res. Zool. 2 : 1-5
SAS, 2000. SAS/STAT User’s Guide. SAS Institute Inc., Cary, NC., USA.
Scriber JM and JF Slansky. 1981. The nutritional ecology of immature insects. Ann. Rev. Entomol. 26:183-211
Shah, S.I., Khan, Z., Hussain, S.M., Usman, A., Sadozai, A., 2007. Studying the performance of silkworm, Bombyx mori L., races fed with different varieties. Sarhad J. Agric. 23: 1079-1083
Spring C and J Hudson. 2002. Silk in Africa: Ethiopia. University of Washington Press, Seattle, USA.
Virk JS, L Kaur, and B Singh. 2011. Evaluation of different strains of mulberry silkworm and eri silkworm for the development of sericulture in Punjab. Int. J. agric. Sci., 7: 266-269

197
Evaluation of Different Montage Types and Sizes on Cocoon Yield and Silk Quality of Castor and Mulberry Feeding Silkworms
Ahmed Ibrahim, Kedir Shifa, Abiy Tilahun and, Metasebia Terefe
Ethiopian Institute of Agricultural Research, Melkassa Research Center, P.O. Box-436, Ethiopia, email – [email protected]
Introduction Mounting is the last stage of rearing operation. Transferring mature fifth instar larvae to mountage is called mounting. When larvae are fully mature, they become translucent, their body shrinks, and they stop feeding and start searching for suitable place to attach themselves for cocoon spinning and pupation. These movements clearly indicate to transfer the mature larvae into the mountage. Different types of mountage are used in different parts of silk producing areas of the world. In addition to support the spinning worms, the mountages should provide convenient space for suitable dimension of spinning good sized cocoons; not promote formation of double cocoons, malformed cocoons and flimsy cocoons; have provisions for drying up of the last excreta of the worm prior to spinning and prevention of its falling on the cocoons of other worms; and be suitable for easy mounting and harvesting. The material and structure of montages significantly affect the quality of cocoon filament and also the labor required for mounting and harvesting the cocoons. The basic concept of proper montages types and sizes are to provide an angular uniform space for silk worm to facilitate easy cocoon formation. The fabrication and type of montages depends on the availability of cheap materials in the respective places. If the material and structure of montages are not proper, it will affect the shape and size of cocoons, besides increasing of double, deformed, soiled cocoons and wastages of silk in the form of floss. The common montages used at present in India and China are made out of bamboo, plastic material,

198
wood etc. However, the works on mountage types and size are very limited in Ethiopia. Therefore, it is crucial to evaluate different types of montages types and size for better cocoon yield and silk quality for the country. Material and Methods Six different mountage types (ply wood, cartoon made, Banana leaf made, plastic, rolling paper and mango leaf montages) and six different montage sizes (3x3, 3x4, 3x5, 4x4, 4x5 and 5x5cm) were evaluated. The experiment was laid out in complete randomized design with four replications. For the montage type activities, ply wood, cartoon and plastic made mountage were purchased from the market and montages of different size were made in the center. Banana and mango branch leaf were collected from the center and dried under shade and used for making mountage of different size. Cocooning percentage, defective cocoon percentage, reliability, average filament length and silk ratios were used to evaluate the mountage types. Similarly, number of double cocoon formation/plot, average weight of 10 cocoons, defective cocoon percentage, spinning quality, length of single cocoon and silk ratios were used for the evaluation of mountage sizes. Data were subjected to SAS 6.12 software. Results and Discussion The effects of different mountage types on silkworm cocooning percentage, defective cocoon percentage, spinning quality, filament length and silk ratios of Eri-3.4 are indicated in Table 1 and Table 2. Significantly (P<0.01) higher cocooning percentage, lower defective cocoon percentage, higher spinning quality and filament length were recorded in plywood, carton made and banana leaf made mountage followed by mango leaf made mountage (Table1 and Table 2). Even though lower cocooning percentage and higher defective cocoon percentage were observed in plastic made mountage, significantly higher spinning quality, higher average filament length and silk ratios were observed (Table1). On the other hands, silk ratios for all the treatments were in the acceptable ranges for both Eri-India and Eri-3.4 silkworms, except for rolling paper treatment of Eri-3.4 silkworms

199
(Table1). An average filament length and silk ratios were significantly high in all the mountage types and insignificant differences were observed among them with in the column for both Korean and Kenyan bivoltine (Table3 and Table4). Similarly, cocooning percentage significantly higher in cartoon and banana leaf made mountage followed by ply wood mountage for mulberry multivoltine silkworms (Table5). Defective cocoon percentages significantly higher in plastic made mountage followed by rolling paper mountage but significantly lower in the other treatments. Significantly higher cocooning percentage, reeling quality and lower defective cocoon percentage were observed in plywood, carton made and banana leaf made mountage followed by the other montage types for both Korean and Kenyan silkworms and non-significant differences were recorded among the treatments with in the column (Table 4). An average filament length significantly (P<0.01) higher in the plywood, cartoon, banana leaf and plastic made mountage than the other treatments and non-significant differences were observed among them. But, significant differences were recorded among the treatments with respect to the silk ratios; although all the values were in the acceptable ranges for mulberry multivoltine silkworms (Table 5).
Tabele 1. The effects of different mountage types on silkworm cocooning
percentage, defective coccon percentage, spinning quality filament length and silk ratios of Eri-3.4 silkworms
Mountage type Cocooning (%)
Defective cocoon (%)
Spinning quality (%)
Filament length of 10 cocoons (M)
Silk ratio %
Ply wood made 97.20+0.44a 0.012+0.01c 96.87+0.62a 8.88+0.32a 11.53+0.22ab carton made 95.69+0.56a 0.014+0.01c 96.65+1.01a 8.36+0.64ab 11.44+0.04b Banana leaf made 96.69+0.22a 0.015+0.01c 95.63+0.68a 7.86+0.13cb 11.77+0.18a Plastic made 69.01+0.50c 0.459+0.02a 91.74+5.75a 8.34+0.16ab 11.42+0.20ab Rolling paper 70.84+3.76c 0.473+0.01a 65.01+4.40b 6.63+0.11d 9.74+0.22c Mango leaf 80.50+5.10b 0.050+0.01b 97.46+0.99a 6.93+0.09cd 11.41+0.17ab CV% 5.33 9.35 6.26 6.58 3.08 Figures within a column with different superscripts differ significantly (1% level of probability)

200
Table 2. The effects of different mountage types on silk worm cocooning, defective cocooning, spinning quality, filament length and silk ratios of Eri – India mixed silkworms
Mountage type Cocooning (%)
Defective cocoon (%)
Spinning quality (%)
Filament length of 10 cocoons (M)
Silk ratio %
Ply wood made 93.26±0.75a 0.088±0.01c 85.78±0.78a 8.09±0.13a 12.38±0.08a carton made 93.70±0.42a 0.105±0.01c 86.83±0.44a 8.24±0.22a 12.05±0.18a Banana leaf made 92.11±0.63a 0.094±0.01c 86.15±0.11a 7.92±0.12ab 11.87±0.39a Plastic made 67.09±1.30c 0.332±0.02b 76.67±2.31b 8.19±0.18a 11.83±0.13a Rolling paper 62.93±1.73d 0.447±0.03a 62.91±2.50c 7.55±0.29b 11.12±0.34b Mango leaf 82.59±0.28b 0.124±0.02c 88.07±0.13a 6.76±0.26c 10.76±0.08b CV% 1.76 13.05 2.69 3.97 3.28
The effects of different mountage sizes of plywood on the number of pupae /cocoon/plot, weight of cocoon, defective cocoon percentage, spinning quality, length of single cocoon and silk ratios of Eri- 3.4 and Eri India silkworm are indicated in Table6 and Table7. Significant differences were observed among the treatments within the column for all parameters. Number of double pupae/cocoon/ plot significantly lower in all sizes of the mountage, except for 5 cm x 5 cm mountage size. The average weight of 10 cocoons and length of a single cocoon were significantly lower in the 3cm x3cm and 4cm x3cm but significantly higher in the other treatments. On the other hand, insignificant and similar results were observed among the treatments within the column for defective cocoon percentages, spinning quality and silk ratios of different mountage sizes (Table 6). On the other hand, number of double pupae/cocoon/plot significantly ( P<0.01) higher in 5cm x5cm followed by 4cm x5cm and 3cm x5cm mountage sizes (Table7). However, significantly lower numbers of double pupae/cocoons/plot formation were appeared in the other mountage sizes. Similarly, insignificant and higher average weight of 10 cocoons were observed among the mountgae sizes. Defective cocoon percentage and length of spinning thread were significantly higher in 3cm x 5cm, 4cm x 5cm and 5cm x5cm mountage sizes than the other treatments. Nevertheless, the reeling quality and the silk ratios were significantly higher in 3cm x 3cm, 3cm x 4cm and 4cm x 4 cm mountgae sizes and non- significant differences were recorded among them within their columns (Table 7).

201
Table 3. The effects of different mountage types on silkworm cocooning, defective cocoon, reeling quality, filament length and silk ratios of Kenya bivoltine (K1,K3, K4 and K5) silkworms
Mountage type Cocooning (%)
Defective cocoon (%)
Reeling quality (%)
filament length of 10
cocoons (m)
Silk ratio %
Ply wood made 95.1±1.21a 0.020±0.001c 83.5±1.76ab 811.9±12.87a 21.9± 0.49a carton made 87.5±5.31a 0.025±0.001c 82.3±2.00ab 827.5± 20.95a 23.7±0.04a Banana leaf made 87.8±0.92a 0.032±0.001c 81.2±1.64ab 830.9±45.20a 22.5±1.17a Plastic made 62.2±3.49b 0.131±0.001b 86.8±0.23a 797.4±10.39a 21.4±0.41ab Rolling paper 64.5±5.09b 0.351±0.026a 64.6±3.92c 851.5±56.00a 19.0±1.14b Mango leaf 57.8±2.58b 0.017±0.001c 79.8±2.45b 805.7±15.01a 22.9 ±0.17a
CV% 8.44 19.79 4.67 7.36 6.23 Figures within a column with different superscripts differ significantly (1% level of probability)
Table 4. The effects of different mountage types, on silkworm cocooning,
defective cocoon, reeling quality, filament length and silk ratios of Korea-bivoltine silkworms
Mountage type Cocooning (%)
Defective cocoon
(%)
Reeling quality
(%)
Filament length of 10
cocoons (m)
Silk ratio (%)
Ply wood made 75.7+ 1.18a 1.34 + 0.06b 73.7+2.07ab 701.7+ 2.33a 21.43+.57b carton made 74.1+0.57a 1.23 + 0.07b 74.6+0.77a 709.0+1.00a 23.15+.44a Banana leaf made 71.6+ 1.08a 1.34 + 0.04b 74.2+0.58a 707.4+ 4.61a 22.21 + 0.48ab Plastic made 57.2+ 4.02c 2.59 + 0.25a 65.3+5.89bc 575.8+17.01b 22.91+ 0.36ab Rolling paper 74.7+0.35 a 2.58 + 0.26a 59.7+2.86c 574.3+20.57b 23.80+ 0.16a Mango leaf 65.5+1.39b 1.31 + 0.10b 75.1+ 1.01a 707.9+ 2.08a 22.33+ 0.16ab
CV% 4.74 15.02 6.68 3.14 4.00 Figures within a column with different superscripts differ significantly (1% level of probability)
Mounting and mountage considerably influences the quality of cocoons. The farmers are said to be losing about 5-8 % of yield due to improper mountage (Chandrakanth et al., 2004). It is evident from the mean data of the experiment that, ply wood, cartoon and banana leaf mountage showed a marginal tendency to improve many of the economic character as compared to the plastic and rolling paper montage. The results of the present study agreed with (Chandrakanth et al., 2004 ) where the author used seven types of mountage: Banana leaf type, mango twigs type,

202
shoot rearing rack rotary type, plastic collapsible, fixed vertical type, bamboo mountage and rotary mountage. To evaluate them, by considering cocooning (%), double cocoon(%), floss(%), defective cocoon (%), single cocoon weight (gm), shell weight (gm), shell ratio (%), and reel ability (%) in which the bamboo mat base easily available, cheap and can last 4-5 years but demerit using lot of space during mounting but both all of these mountage shows some merits as well as demerits during study time and also shows variations in economic parameters of cocoon production and quality in each type of mountage. Datta (Biswas) et al., [2008] also shows plastic collapsible mountage, plywood mountage, mango and banana leaf mountage are an alternate to bamboo spiral and others mountage in Eastern India for better cocoon yield. Chikkannaet al., (2009) also studied qualitative improvement in terms of economic gained by using more than two different types of mountage for silkworm cocoon. He quoted that, types of mountage, sizes and mounting environmental condition play a paramount role in determining the quality of cocoons of silkworm, Bombyxmori. Pandeyet al.,[2007] indicated that, plywood and cartoon made mountage with 4x5cm for Eri silkworm larvae and 4cm x4cmand 4cm x3cm for mulberry silkworm mounting space sizes in North-western India showed better result during study period. Datta (Biswas) et al., [2007] also showed comparative study of spinning of silkworm in more than three types of mountage (mango leaf, carton made, rolling paper, plastic mountage and banana leaf made montage). The Mango tree twigs and banana leaf mountage are playing important role in saving the cocoon crop and are easily available for farmers. According to Mathur and Quadri, (2010) also estimated that farmers loss about 12-15 % of crop due to defective cocooning which is attributed to inadequate mountage poor quality of mountage, shortage of time, lack of proper mounting space, mounting care and management of environmental conditions. Our studies confirmed that, the percentage of urinated cocoon was more in plastic and rolling paper mountage compared to other types of mountage. Pandey et al., (2007) also used banana and mango leaf mountage in North-Western India which shows better results in improving cocoon quality during study period. Thus from the present study it can be concluded that the mountage made from plywood, Mango tree twigs, banana leaf and cartons are directly placed on rearing bed to spin cocoon helping the farmer to save labor and do not have any problems of identifying and picking ripe larvae at

203
newly joined sericulturist. However, this method needs more space but during emergency time when there were no sufficient mountage or no any mountage with poor, newly joined farmers at that time Mango tree twigs and banana leaf mountage play vital role for farmers to save cocoon crop.
Table 5. The effects of different mountage types on silkworm cocooning,
defective cocoon, reeling quality, filament length and silk ratios of Multivoltine silkworm
Mountage type
Cocooning (%)
Defective cocoon (%)
Reeling quality (%)
filament length of 10
cocoons (m)
Silk ratio (%)
Ply wood made 89.8+0.75b 0.128+0.005d 83.91+1.52a 825.6+31.4abc 21.61+0.32c carton made 91.2+0.14ab 0.190+0.007c 84.13+1.52a 877.2+4.3a 23.28+0.28a Banana leaf made 93.5+1.50a 0.175+0.006c 83.10+1.00a 815.0+ 15.5bc 23.38+0.30a
Plastic made 70.1+0.80d 0.423+0.004a 67.84+3.93b 834.3+18.2ab 22.46+0.56ab Rolling paper 62.9+0.92e 0.368+0.013b 63.13+2.25b 638.0+13.8d 20.62+0.28c Mango leaf 73.9+0.58c 0.138+0.001d 81.39+1.37a 768.3+10.8c 22.59+0.38ab CV% 1.84 5.84 5.24 4.14 3.01
Figures within a column with different superscripts differ significantly (1% level of probability)
Table 6. Effects of different mountage sizes of plywood on number of cocoon single space, weight of cocoon, defective cocoon, spinning quality, length of single cocoon and silk ratios of Eri- 3.4 and India silkworm.
Mountage size (cm)
Number of double and above/plot
Weight of 10 cocoons (g)
Spinning quality (%)
Length of a single cocoons
Silk ratio %
3 x 3 0.00+0.00b 2.46+0.22c 76.53+1.94a 5.803+ 0.52c 11.63+0.33a 3 x 4 0.00+0.00b 3.30+0.02b 73.58+1.31a 7.660+0.11b 11.95+0.12a 3 x 5 0.00+0.00b 3.92+0.09a 74.01+2.13a 8.380+0.14a 12.20+0.49a 4 x 4 0.00+0.00b 3.79+0.03a 74.74+0.37a 7.667+0.08b 12.90+0.95a 4 x 5 0.00+0.00b 4.07+0.02a 74.43+0.85a 8.086+0.04ab 12.23+0.88a 5 x 5 2.05+0.00a 4.08+0.07a 73.81+1.52a 8.106+0.02ab 11.68+ 0.27a CV% 5.34 5.34 3.74 5.01 7.77

204
Table 7. Effects of different mountage sizes of plywood on number of cocoon
/single space, weight of cocoon, defective cocoon, reeling quality, length of single cocoon and silk ratios of bivoltine and multivoltine silkworms (K1, K3,K4,K5, yellow cocoon, white cocoon and Korea).
Mountage size (cm)
Number of double and above/plot
Average weight of
10 cocoons (g)
Defective cocoon
(%)
Reeling quality
(%)
Length of a single
cocoon Silk ratio
%
3 x 3 1.65±0.33d 1.87±0.31a - 91.8±1.25a 674.3±10.17c 21.3±0.32bc 3 x 4 2.00±0.00d 2.67±0.17a - 94.5±1.21a 933.7±35.17b 23.6±0.83a 3 x 5 14.00±1.52c 2.97±0.05a 0.39±0.01a 67.6±1.21b 1002.0±17.03a 19.1±0.43d 4 x 4 2.00±0.57d 2.69±0.09a - 94.0±0.98a 987.7±11.69 b 22.7±0.74ba 4 x 5 23.54±2.60b 3.08±0.06a 0.4±0.03a 64.9±1.80b 979.0b±25.69a 19.6±0.42dc 5 x 5 28.63±1.20a 2.90±0.02a 0.43±0.01a 66.1±3.28b 1023.0±5.89a 18.6±0.49d CV% 21.24 10.30 12.56 3.88 3.91 4.81
Conclusion and Recommendation The present study showed that the mountage made from plywood, Mango tree twigs, banana leaf and cartons are directly placed on rearing bed to spin cocoon helping the farmer to save labor and do not have any problems of identifying and picking ripe larvae at newly joined sericulturist. However, this method needs more space but during emergency time when there were no sufficient mountages or no any mountages with poor and newly joined farmers, Mango tree twigs and banana leaf mountage play vital role for farmers to save cocoon crop. On the other hands, from present study it can be concluded that, plywood made, carton made and banana leaf made mountage followed by mango leaf mountage types should be recommended for eri and mulberry silk worms. Regarding the mountage sizes, 4cm x 4cm and 4cm x 5cm mountage size made from ply wood can be recommended for mulberry and Eri- silkworms, respectively.

205
References
Chandrakanth KS, GK Srinivasa, SB Dandin, VB Mathur, and TS Mahdevmurthy. 2004. Development of improved Mountages. Indian Silk.43:7-11.
Chicano GS, VA Singh, and SMH Qadri. 2009. Qualitative and improvement in terms of economic gained by using two different types of Mountages for Silkworm cocoon. Green Farming.2 (14): 1014-1016.
Datta T, AK Saha, Sk Das, and S Sarkar. 2007. A comparative study of Spinning of silkworm in two types of Mountages. Indian Sericulture.11(2): 39-43.
Ganga G and J Sulochana Chetty. 1997. Handbook of Silkworm rearing Technology.
Hiware CJ. 2001. Agro-Cottage Industry Sericulture.Daya Publishing House, Delhi, India 57-93.
Inokuchi T, GB Singh, R Meenal, RK Rajan, MT Himantharaj. 1995. Evaluation of mountages for shoots rearing (JICA), project no. CSRM 1227.
Krishnaswami S.1978. New technology of silkworm rearing.Central Sericultural Research and Training Institute, Mysore, India. Pp:1-28.
Krishnaswami S.1978. New Technology of Silkworm rearing.Central Sericultural Research and Training Institute, Mysore, India.57-93.
Naphade ST, CJ Hiware, and SB Avhad. 2010. Development of improved Mountage Using Mango plant twigs during lack of sufficient number or absence of Mountages on field for Silkworm cocoon. Rec. Res. in Sci. and Tech. 2(7):05-08.
Pandey RK, MA Khan, BB Bindroo, A Dhar, and SS Chauhan. 2007. Plant shoots Mountages of North- Western India. Indian Silk.46(8):4-5.
Vindhya GS, Bipin Kumar, and B Gangadhar. 1985. Mounting trials with different types ofmountages project no. CSRM 1190.

207
Bed Cleaning Frequency During Larval Developmental Period of Silkworms
Abiy Tilahun, Kedir Shifa, Ahmed Ibrahim and Metasebia Terefe
Ethiopian Institute of Agricultural Research, Melkassa Research Center P.O. Box-436, Ethiopia, Email - abiyt@gmail,com
Introduction During larval growth stage, bed cleaning is an important silkworm rearing process to ensure the hygiene in the immediate vicinity of silkworms in order to protect from disease infection and to ensure a good feeding appetite (Gogoi and Goswami 1998). The larvae should be fed with appropriate quantity of leaves and feeding frequency based on their age/size and their population in the bed (Ahmed et al unpublished). Silkworms do not consume all the leaves that are supplied to them and invariably a part of the feed is left behind on the rearing bed. If the residual leaves, silk worm’s excreta, exuviate, dead worms, diseased larvae are left on the rearing bed for some time; all can decompose and ferment quickly leading to dampness of the bed and increase the humidity and temperature in the bed (Reddy et al., 1999). This adversely affects the larval physiology (Reddy et al., 1999) and favoring multiplication of pathogenic organisms such as protozoa, fungi, bacteria and viruses (Sannappa et al., 1999). Therefore, it is essential to remove these materials from the bed periodically and keep it clean. The process of doing is known as bed cleaning. If proper bed cleaning is not done in time it leads to various complications viz. ill health of larvae, disinterest of the larvae to feed, ultimately resulting in weak and unproductive (Hisao, 2001) and cause financial loss to the silk producers. The frequency of bed cleaning studies revealed that when larvae were not cleaned more number of dead larvae was observed compared to the treated beds (Zhang,et al., 2002). They further revealed that regular bed cleaning every day minimizes the larval mortality (0.67%). Next to feeding, cleaning is an equally important factor to secure uniform growth and development of silk worms. Silkworms at regular bed cleaning resulted in significantly higher larval weight, larval survival, cocoon weight, shell weight, shell ratio, pupal weight, and rate of

208
pupation, silk productivity, fecundity and egg hatching with lower larval and pupal durations than those raised under no bed cleaning condition in farmers’ practices. The present study was therefore conducted to determine stage wise bed cleaning frequency for each larval instars of the different silkworm races reared at Melkassa sericulture laboratory. Materials and Methods This experiment was carried out at Melkassa Agricultural Research Center (MARC), from 2011 to 2013. Mulberry and eri-silkworm rearing were carried out on multivoltine and bivoltine silkworm breeds as per appropriate recommendations for egg hatching, feeding, bed spacing, mounting and maintenance of recommended temperature, relative humidity, light and ventilation conditions (Dayashankar, 1982). The silkworm rearing equipments were cleaned, washed, sun dried and disinfected with 2% formalin solution at the rate of 800 ml per 10 m2 areas before the commencement of rearing (Nataraju et al., 2005). The breeds were reared following shelf rearing techniques starting from brushing till cocoon spinning. Silkworms at larval stage were fed on mulberry and castor leaves four times a day with tender leaves until 3rd instar and mature leaves during 4th and 5th instars. Silkworms are fed four times in a day – morning (8-8:30 A.M.), mid-day (11:30-12:00 A.M.), after noon (2:00-2:30 P.M.) and evening (5-6 P.M.). Before bed cleaning, leaves were spread on top of the feeding tray and worms crawl up to feed. Then, the worms were shifted using the newspaper to new beds and feeding is then resumed. The litter, leftover food and dead silkworms, were removed carefully and disposed off from the rearing house. The mature fifth instar silkworm larvae were transferred to mountage (equipment to provide support for cocoon formation) for spinning raw silk cocoons. Ripened silkworms were identified by their characteristics movement to the corners of the rearing beds, reduction in size and transparent yellow appearance. After six to eight days of spinning, cocoons were harvested from the mountages. Observations on larval duration, larval mortality rate and qualitative characters of the cocoon (fresh cocoon weight, cocoon shell weight, length of spinning thread and silk ratio) were recorded. Then, cocoon was boiled to make the serecin soft to dissolve. Silk filament was extracted out in which the coarser floss layer was removed.

209
Diseased larvae were examined to identify causes of larval death. Fungal pathogens were grown on potato dextrose agar and bacterial pathogens on nutrient agar. On the other hand, direct microscopic observation of the infected silkworm parts was used for the identification of silkworm diseases. Data such as number of infected silkworms versus total number of silkworms were recorded to determine the silkworm larval mortality rate. Silkworm races used for this study were Vietnamese eri-silkworm, Indian eri silkworm, Kenyan bivoltine silkworm, Korean bivoltine silkworm, and Vietnamese multivoltine silkworm races. The treatments used for this study were one time bed cleaning frequency per instar, two times bed cleaning frequency per instar, three times bed cleaning frequency per instar, once bed cleaning frequency per day, twice bed cleaning frequency per day and no bed cleaning (control). During larval life, the larva sheds its skin (moult) 4 times to accommodate growth. The period between successive moults is known as an instar. Durations for 1st, 2nd, 3rd, and 4th instar stages each is 4 to 7 days and for 5th instar stage is 6 to 10 days depending on the type of race, temperature and relative humidity. For once bed cleaning per instar only one cleaning for each instar was applied. For once bed cleaning per day, cleanings were applied on daily basis for each instar and likewise applications were used for the other treatments. Complete randomized design with three replications was used for each treatment and 200 silkworms were brushed in each replication and allowed to complete the larval period. Data was analyzed using the ANOVA procedure of statistical analytical system (SAS). Least significant difference (LSD) was used for mean separation. Percentage proportions were calculated for larval mortality rate. Results and Discussions Bed cleaning frequency vs larval period Once bed cleaning per day, twice bed cleaning per day and three times bed cleaning per instar significantly (P < 0.05) shortened the larval period of Vietnamese eri-silkworm races (23.7, 25 and 24.3 days), Indian eri silkworm races (29.8, 28.6, 29.6 days), Kenyan bivoltine

210
silkworm races (27.5, 30.6, 31.5 days), Korean bivoltine silkworm races (24.7, 25.3, and 25.8 days) and Vietnamese multivoltine silkworm races (25.7, 25.8, and 25.8 days) respectively as compared to the untreated check which was 36.3 days in Vietnamese eri, 55.4 days in Indian eri, 33.1days in Kenyan bivoltine, 30.2 days in Korean bivoltine and 30.3 days in Vietnamese multivoltine silkworm races as shown in Table 1. Sachan and Bajpai (1973a) observed the larval duration of Eri silkworm on different host plants revealed that 22-27 days were required in good silkworm rearing condition to complete the larval development. The larval period in our study falls more or less within the same range reported by the authors. Significantly (P < 0.05) longer larval developmental period was registered from the untreated check (55.5 days) as opposed to the shortest larval developmental period recorded from once bed cleaning per day in Vietnamese eri silkworm races (23.7 days), in Kenyan bivoltine silkworm races (27.5 days), in Korean bivoltine silkworm races (24.7 days), and in Vietnamese multivoltine silkworm races (25.7 days) (Table 1). The entire larval period (1st to 5th larval stages) ranged from 23.7 days to 31.5 days feeding on castor and mulberry host plants (Reddy, 2008). The authors also observed superior larval growth and higher cocoon production when eri silkworms raised with ideal feeding, spacing and bed cleaning. Further, the larvae receiving once bed cleaning per day during fifth instar had better growth (Joshi, 1987). According to this author the ideal bed cleaning is essential to ensure good health to all the worms simultaneously and thereby to secure uniform growth and development of the worms. In this study the larval period to spin cocoons (the harvested row silk) was delayed (up to 46.5 days) when the bed cleaning frequency was limited to once per instar (Table 1). With no bed cleaning situation silkworm larval period was longer (55.7 days). When bed cleaning was practiced larval period shortened to 23.7 days (Table 1). Thus, there was a large variation in larval period (22 days difference) between the control and the other treatments. Shorter larval period indicate fast production period of row silk and longer larval period indicate prolonged production period of row silk which could influence the number of silk production times per year.

211
Table 1. Effect of silkworm larvae bed cleaning frequency on larval period of different silkworm races
No of bed cleaning Vietnamese Eri-silkworm
races
indian Eri-silkworm races NS
Kenyan bivoltine
races
Korean bivoltine
races
Vietnamese Multivoltine
races One time per instar 33.67±0.33b 31.42±1.34 46.5±0.97b 30.17±1.16a 29.50±0.28ab Two times per instar 29.67±0.67c 30.29±0.78 38.87±1.83c 28.83±1.69a 29.00±0b Three times per instar 24.33±0.67d 29.63±0.22 31.5±0.32d 25.83±0.83b 25.83±0.60c once per day 23.67±0.33d 29.84±0.33 27.53±0.84e 24.67±0.44b 25.66±o.16c Twice per day 25.00±0d 28.67±0.51 30.63±0.46d 25.33±0.44b 25.83±0.16c No bed cleaning / control 36.33±0.88a 33.13±0.31 55.47±0.26a 30.17±0.83a 30.33±0.44a
Bed cleaning frequency vs mortality and quality of cocoon Vietenamese eri-silkworm races Bed cleaning during the 1st instar larval growth has no significant effect on their mortality rate. A significant effect of bed cleaning was observed from 2nd instar up to 5th instar larval stages. The percentage of larval mortality due to disease causing organisms ranged from 2.58% in the 2nd instar to 15.58% in the 5th instar in the control plots (Table 2). All treatments were significantly superior to the control in reducing larval mortality in 2nd and 3rd larval instars (Table 2). However, for these larval stages applying twice bed cleaning per instar could save time and labor than the other treatments. For the mature larval stages of 4th and 5th instars three times bed cleaning per instar could significantly reduce larval mortality which is more economical than the other treatments (Table 2). Table 2. Effect of bed cleaning frequency on mortality of different larval instars
of Vietnamese eri-silkworm races
No of bed cleaning 1st instar
2nd instar
3rd instar
4th instar
5th instar
One time per instar 0.5±0bac 1.91±0.30b 0.83±0.71b 5.75±0.14b 11.58±1.16b Two times per instar 0.58±0.08ba 0.33±0.08c 0.33±0.08b 4.16±0.30c 5.41±0.68c Three times per instar 0.33±0.16bc 0.08±0.08c 0.41±0.22b 0±0d 0.08±0.08d once per day 0.5±0.14bac 0.08±0.08c 0.25±0.14b 0.33±0.08d 0.16±0.08d Twice per day 0.66±0.08a 0±0c 0.41±0.22b 0.08±0.08d 0±0d No bed cleaning / control 0.25±0.14c 2.58±0.16a 3.25±0.28a 8.25±0.86a 15.58±0.65a

212
Length of silk thread (5.77m), silk cocoon weight (2.94g), shell weight (0.28g) and silk ratio (9.53%) were significantly (P < 0.05) lower when larval bed refuse and fecal matter of Vietnamese eri-silkworm larvae were not cleaned from rearing beds during their growth period than the tested bed cleaning frequencies (Table 3). Once and twice bed cleaning per day during the 5th instar resulted in significantly (P < 0.05) higher length of silk thread (8.65 and 8.51 m), silk cocoon weight (3.43 and 3.44 g), shell weight (0.426 and 0.436 g) and silk ratio (12.50 and 12.82%) as opposed to the other larval bed cleaning frequencies as shown in Table 3. Table 3. Effect of bed cleaning frequency on the qualitative characters of the
cocoon of Vietnamese eri-silkworm races
No of bed cleaning Length of
silk thread (m)
Silk cocoon
weight (g)
Silk shell weight
(g) silk ratio
(%)
One time per instar 6.76±0.15 b 3.11±0.02 b 0.306±0.003 d 9.78±0.07c Two times per instar 7.09±0.26 b 3.28±0.06 a 0.33±0.005 c 10.02±0.22 c Three times per instar 8.25±0.23 a 3.35±0.03 a 0.39±0.05 b 11.68±0.16 b once per day 8.65±0.16 a 3.43±0.05 a 0.426±0.003 a 12.5±0.23 a Twice per day 8.51±0.52 a 3.44±0.06 a 0.436±0.003 a 12.82±0.16 a No bed cleaning / control 5.77±0.08 c 2.94±0.04 c 0.28±0 e 9.53±0.17 c
Indian eri-silkworm races No clear trend was observed in the 1st larval instar in terms of larval mortality rate through applying bed cleaning frequencies. Larval mortality was significantly higher in the control group during 2nd instar (2.46%), 3rd instar (6.4%), 4th instar (5.01%) and 5th instar (11.66%) larval stages as opposed to all levels of cleaning frequencies (Table 4). Significant results were achieved in reducing larval mortality rate from all levels of bed cleaning frequencies compared with the control (Table 4). The result suggested that, through applying two times bed cleaning per instar in 2nd larval stage, three times bed cleaning per instar in 3rd larval stage, once bed cleaning per day in 4th and 5th larval stages, the mortality rate was significantly lower and could be recommend to save time and labor (Table 4).

213
Table 4. Effect of bed cleaning frequency on mortality of different larval instars of Indian eri-silkworm races
No of bed cleaning 1st instar 2nd instar 3rd instar 4th instar 5th instar One time per instar 0.5±0.05 e 1.2±0.02c 4.56±0.08b 3.7±0.27b 10.91±0.28a Two times per instar 0.85±0.07d 0.66±0.12d 2.08±0.14c 2.53±0.09c 9.21±0.55b Three times per instar 3.05±0.13c 2.05±0.10b 0.4±0.05d 1.06±0.01d 7.15±0.40c once per day 3.81±0.04b 2.08±0.10b 0.28±0.01ed 0.61±0.14e 6.73±0.29c Twice per day 4.51±0.01a 2.3±0.17ba 0.16±0.01e 0.58±0.09e 6.98±0.20c No bed cleaning / control 0.75±0.07d 2.46±0.01a 6.4±0.05a 5.01±0.17a 11.66±0.24a
Length of silk thread (8.28m to 8.35m) and cocoon weight (3.24g to 3.38g) were significantly (P < 0.05) increased when fecal matter of silkworm larvae and other left over’s (dead worms and leaf remnants) were cleaned once and twice per day and three times per instar period. In the control beds length of silk thread and silk cocoon weight were reduced to 5.9m and 2.87g respectively (Table 5). Among the tested treatments, once and twice bed cleaning frequencies per day significantly increased the important yield components of silk shell weight (0.4g to 0.41g) and silk ratio (11.73% to 11.95%). Silk shell weight and silk ratio were greatly reduced in the control plots. This was 0.246g of shell weight and 8.72% of silk ratio (Table 5). Table 5. Effect of bed cleaning frequency on the qualitative characters of the
cocoon of Indian eri- silkworm races
No of bed cleaning Length of silk
thread (m)
Silk cocoon weight
(g) Silk shell weight
(g) Silk ratio
(%)
One time per instar 6.56±0.02c 3.05±0.06c 0.29±0.01d 9.61±0.15d Two times per instar 6.98±0.15b 3.12±0.05cb 0.313±0.003c 10.09±0.03c Three times per instar 8.3±0.10a 3.24±0.09ab 0.38±0.005b 11.73±0.19b once per day 8.35±0.07a 3.36±0.01a 0.4±0a 11.95±0.05ab Twice per day 8.28±0.01a 3.38±0.04a 0.41±0a 12.21±0.15a No bed cleaning / control 5.9±0.03d 2.87±0.02d 0.246±0.003e 8.72±0.16e
Kenyan bivoltine silkworm races The highest larval mortality (3.6% to 30.06%) was registered when the larvae did not receive bed cleaning treatment in all level of larval instars except 1st instar (Table 6). Bed cleaning did not show an effect to the 1st

214
instar larvae for the Kenyan bivoltine silkworm races. Larval mortality rate was significantly lower in all the treatments and differences were observed among them from 3rd to 5th instars (Table 6). Though significant results were achieved in reducing larval mortality rate in all levels of bed cleaning frequencies the result suggested that two times bed cleaning per instar for 2nd , three times bed cleaning per instar for 3rd and once bed cleaning per day for 4th and 5th instars could be recommend for silkworm producers to save time and labor.
Table 6. Effect of bed cleaning frequency on mortality of different larval instars
of Kenyan bivoltine silkworm races
No of bed cleaning 1st instar
2nd instar
3rd instar
4th instar
5th instar
One time per instar 2.2±0.15d 2.9±0.3ba 5.8±0.3b 11.2±0.2ba 24.4±0.72b Two times per instar 2.83±0.08d 1±0.25c 4.3±0.11c 9±0.87b 21.73±1.29b Three times per instar 2.83±0.27c 3.03±0.23ba 0.96±0.2d 3.93±0.41c 14.13±0.58c once per day 11.06±0.46b 3.03±0.12ba 0.8±0.2d 0.9±0.3d 11.73±1.24c Twice per day 13.16±0.40a 2.86±0.12b 0.53±0.23d 1.06±0.23dc 13±0.34c No bed cleaning / control 2.83±0.32d 3.6±0.25a 6.76±0.44a 12.2±2.25a 30.06±1.88a
The untreated control significantly (P < 0.05) reduced the important yield components of silkworm larvae as indicated by the short length of single spinning thread (583 meter), smaller silk cocoon weight (1.42g), and smaller silk shell weight (0.263g). Significantly (P < 0.05) higher percentage of silk ratio was registered from one time bed cleaning per day (23%) and two times bed cleaning per day (22.45%) as opposed to the lowest percentage of silk ratio from the check (18.49%). Significantly higher length of single spinning thread (915 m to 952 m), big silk cocoon weight (1.81g to 1.82g) and big silk shell weight (0.41g to 0.42g) were obtained from the same treatments followed by three times cleaning frequency per instar larval developmental period for the same parameters (Table 7).

215
Table 7. Effect of bed cleaning frequency on the qualitative characters of the cocoon of Kenyan bivoltine silkworm races
No of bed cleanings Length of silk
thread (m)
Silk cocoon weight
(g)
Silk shell weight
(g) Silk ratio
(%)
One time per instar 692.43±15.06c 1.62±0.02c 0.313±0.006c 19.25±0.10c Two times per instar 698.83±22.37c 1.64±0.01bc 0.316±0.003c 19.35±0.25c Three times per instar 854.56±19.62b 1.75±0.01ba 0.387±0.006b 22.11±0.40b once per day 915.18±15.38a 1.82±0.02a 0.410±0.005ba 22.45±0.08ba Twice per day 952.17±30.16a 1.81±0.01a 0.420±0.005a 23.00±0.35a No bed cleaning / contro 583.01±5.44d 1.42±0.07d 0.263±0.013d 18.49±0.07d
Korean bivoltine silkworm races Bed cleaning had no significant effect in all level of treatments on larval mortality rate of Korean silkworm races until the 3rd larval instar. This indicates bed cleaning is not essential in 1st, 2nd and 3rd larval stages. Percentage larval mortality rate in these life stages was less than 0.83%. A significant effect among treatments was merely observed in 4th and 5th life stages. A significant high mortality rate was recorded in the untreated control silkworm rearing beds during the above mentioned life stages. This was 13.83% and 32.83% respectively. Three times bed cleaning per instar (1.66%), one time bed cleaning per day (1.5%) and two times bed cleaning per day (1%) in 4th larval stage, once bed cleaning per day (0.83%) and twice bed cleaning per day (0.5%) in 5th larval stage caused a statistically low mortality rate (Table 8). Table 8. Effect of bed cleaning frequency on mortality of different larval instars
of Korean bivoltine silkworm races
No of bed cleaning 1st instar 2nd instar 3rd instar 4th instar 5th instar One time per instar 0.5±0.28a 0.83±0.16a 0±0a 10.83±0.72b 27.83±2.31b Two times per instar 1±0.57a 0.66±0.66a 0.33±0.33a 7.83±1.01c 24±2.36b Three times per instar 0.16±0.16a 0.33±0.16a 0.16±0.16a 1.66±0.60d 5.16±0.72c Once per day 0.66±0.66a 0.33±0.33a 0.16±0.16a 1.5±0.28d 0.83±0.33d Twice per day 0.83±0.83a 0.33±0.16a 0±0a 1±0d 0.5±0d No bed cleaning / control 0.33±0.33a 0.83±0.16a 0.5±0.28a 13.83±0.44a 32.83±1.74a

216
Important yield components such as length of spinning silk thread, silk cocoon weight, silk Shell weight and silk ratio were significantly lower in the untreated check (Table 9). Once bed cleaning per day and twice bed cleaning per day were significantly (P < 0.05) superior than other treatments in obtaining higher length of spinning thread (950 and 961m), bigger cocoon weight (1.81 and 1.77g), bigger Shell weight (0.42 and 0.40g) and higher percentage of silk ratio (23.03 and 22.31%) respectively (Table 9).
Table 9. Effect of bed cleaning frequency on the qualitative characters of the cocoon of Korean bivoltine silkworm races
No of bed cleaning Length of silk
thread (m)
Silk cocoon weight
(g)
Silk shell weight
(g) Silk ratio
(%)
One time per instar 673.66±20.43dc 1.65±0.02b 0.337±b 20.26±b Two times per instar 719.00±22.23c 1.68±0.05ba 0.347±b 20.41±b Three times per instar 796.33±46.81b 1.80±0.04a 0.357±b 19.48±cb once per day 950.66±19.06a 1.81±0.05a 0.420±a 23.03±a Twice per day 961.00±17.61a 1.77±0.02ba 0.400±a 22.31±a No bed cleaning / control 611.66±13.86d 1.45±0.09c 0.277±c 19.00±c
Vietnamese multivoltine silkworm races There was high larval mortality rate in some of the treated larvae than the untreated ones in 1st instar larvae. This could be explained by the existence of other causes of larval death such as mechanical damage of worms while feeding and bed cleaning practices. In the 2nd instar, there was no much variability among the treatments with regard to larval mortality rate. A significant bed cleaning effect was not found in the 3rd and 4th instar larval growth where larval mortality rate was not exceeded 0.83%. However mortality was drastically increased (45.5%) during the 5th larval stage in the untreated control. Mortality was reduced to 0.66% in three times bed cleaning per instar and once bed cleaning per day. No mortality was recorded from twice bed cleaning per day treated silkworm larvae (Table 10). Better cocoon characters that indicate to harvest bigger shell weight and longer row silk filament were significantly (P < 0.05) higher in the treated silkworm larvae than the control. Superior results were obtained from once bed cleaning per day, twice bed cleaning per day, and three

217
times bed cleaning per instar (Table 11). Thus, silkworm growers can use three times bed cleaning per instar which is the least frequent interval among others to gain better silk cocoon yield. Table 10. Effect of bed cleaning frequency on mortality of different larval instars
of Vietnamese multivoltine silkworm races
No of bed cleaning 1st instar 2nd instar 3rd instar 4th instar 5th instar One time per instar 0.5±0.28c 0.16±0.16bc 0.5±0.28a 0±0a 25.16±0.72b Two times per instar 0.5±0.28c 0.66±0.16ba 0.5±0.28a 0.33±0.33a 17.16±0.92c Three times per instar 6.66±0.72ba 0±0c 0.5±0a 0.33±0.33a 0.66±0.16d Once per day 5.33±0.44b 0.5±0.28bac 0.5±0.28a 0.83±0.83a 0.66±0.33d Twice per day 7.5±0.57a 0.16±0.16bc 0.16±0.16a 0.33±0.16a 0±0d No bed cleaning / control 0.66±0.16c 1±0.28a 0.33±0.16a 0.33±0.16a 45.5±1.60a
Sannappa et al., (1999) reported that as soon as the larvae grow-up, the unconsumed leaves and litter increase in the rearing bed which ultimately cause changing atmosphere and favoring multiplication of pathogenic organisms such as protozoa, fungi, bacteria and viruses. They further mentioned that due importance towards strict adherence to maintenance of hygienic conditions in and around the rearing house are a prerequisite for a successful cocoon harvest and ideal rearing condition such as bed spacing and bed cleaning should be done as per the different instars of larval stages and silkworm breeds. This study also confirmed there was variability in larval mortality rate among instars of different silkworm races in respective with various bed cleaning treatments. The results showed that bed cleaning caused significant reduction in mortality due to diseases against the control in all silkworm races. Silkworm diseases observed during our study were bacterial, fungal, and viral diseases. Rearing under better feeding and bed cleaning, ensuring pathogen free rearing conditions are some of the vital requirements for the growth of healthy worms. This enables the silkworm to tolerate adverse conditions. Periodic removal of bed refuse and fecal matter ensures good bed hygiene, prevention of diseases and good larval growth. The unconsumed leaves and accumulation of litter in the rearing bed ultimately cause changing atmosphere and favoring multiplication of pathogenic organisms (Sannappa et al., 1999).

218
Table 11. Effect of bed cleaning frequency on the qualitative characters of the
cocoon of Vietnamese multivoltine silkworm races
No of bed cleaning Length of silk thread (m)
Silk cocoon weight (g)
Silk shell weight (g) Silk ratio (%)
One time per instar 684.33±16.79c 1.59±0.07 0.303±0.020bc 19.00±0.34b Two times per instar 772.33±54.75bc 1.64±0.11 0.3100±0.017bc 18.77±0.19b Three times per instar 895.00±90.50ba 1.62±0.11 0.360±0.015ba 22.29±0.93a once per day 954.67±40.06a 1.72±0.01 0.377±0.003a 21.86±0.35a Twice per day 925.67±41.98a 1.65±0.06 0.367±0.013ba 22.13±0.26a No bed cleaning / control 666.33±11.83c 1.46±0.22 0.270±0.040c 18.59±0.46b
Devaiah et al., (1985) reported that feeding and cleaning are important silkworm management practices affecting the larval weight, silk gland weight, cocoon weight and shell weight considerably. Their observation on different bed cleaning frequencies indicated that once and twice bed cleaning treatments caused less mortality and greater effective rate of rearing compared to other treatments and these are statistically significant. Though these bed cleaning frequencies were consuming more time and labor they can result in less larval mortality and maximum effective rate of rearing. The results of the present study agreed with Devaiah et al., (1985) that confirmed once and twice bed cleaning treatments can provide favorable silkworm larvae rearing condition, also statistically significant compared to other types of bed cleaning frequencies on many parameters. Bed cleaning experiment revealed that once bed cleaning per day, twice bed cleaning per day followed by three times bed cleaning per instar treatments were statistically superior in terms of minimum larval mortality, shorter larval period, longer silk thread, bigger cocoon weight, bigger silk shell weight and maximum percentage silk ratio depending on the successive larval stages of silkworm races. After successful silkworm rearing such as ideal bed cleaning, Cocoon weight gain was recorded in previous findings. This difference in cocoon weight gain may be attributed to the difference in the bed cleaning treatments selected for the study and it may be inferred that treatments are a better performer than the control. Results from our study revealed that higher effective rate of rearing, higher cocoon weight; shell weight

219
and silk ratio were obtained in the treatment against the control in all silkworm races. The findings of our study are in agreement with those of Joshi and Misra (1982); Hajarika et al., (2003). They found that higher effective rate of rearing, cocoon weight, shell weight and shell ratio were achieved in the bed cleaning treatments against the control. This was achieved by integration of not a single but a multitude of approaches viz. proper disinfection of the rearing room and appliances, use of bed disinfectant, spacing, bed cleaning and feeding as per recommendations. Prevention is better than Cure” is the correct approach that should be adopted in integrated silkworm rearing management (Nataraju et al., 2005). This means that one should go about actively preventing diseases before it occurs, and it is only when preventive measures are in force that we can hope to effectively control the occurrence and spread of diseases. Patil et al., (2009) observed that eri silkworms receiving ideal bed cleaning treatment showed significantly higher larval weight (7.904 g), effective rate of rearing (90.0%), cocoon weight(3.683 g), shell weight (0.426 g), shell ratio (13.31%), pupal weight (3.256 g) with lower larval and pupal durations. Reddy et al., (1989b) recorded survival rate (95.67%), shell ratio (12.20%), and shorter developmental period (26.49 days) when eri silkworms were reared on ideal bed cleaning treatment. In our study significant increase above the control on shell weight (0.436 g), silk ratio (12.82%) and cocoon weight (3.44 g) were also recorded from eri-silkworms shelf rearing method which was in conformity with Patil et al., (2009). Devaiah et al., (1985) reported that feeding, bed spacing and bed cleaning are important worm management practices affecting the larval weight, silk gland weight, cocoon weight and shell weight considerably. According to them maximum larval weight (7.6 g), cocoon weight (2.96 g) ,effective rate of rearing (90.0%), shell weight (0.44g) and silk ratio (14.9 g) has been obtained in shelf method of rearing on castor.

220
Conclusion and Recommendation Larval mortality was significantly higher in all the tested silkworm races of the 4th and 5th larval instars in the control beds where these mature larval stages were found vulnerable to disease attacks. The young larval stages (1st, 2nd, and 3rd instars) were less attacked than the mature larval stages. All bed cleaning frequencies had no significant effect for Korean silkworm races until the 3rd instars and Vietnamese multivoltine silkworm races until the 4th instars. Hence, bed cleaning is not necessary up to these stages in silk worm rearing practices for such races. Bed cleaning has showed a positive effect to reduce larval mortality rate for Vietenamese eri-silkworm races, Indian eri-silkworm races and Kenyan bivoltine silkworm races during 2nd and 3rd larval growth. Bed cleaning frequencies had no significant effect for 1st instar in all silkworm races. However, the 1st instar larvae are more liable for mortality due to mechanical damage than other larval growth stages in feeding and bed cleaning practices. Thus, maximum care should be taken during such practices. Bed cleaning is an important silkworm rearing process to ensure good hygiene and better feeding appetite especially during the 5th larval instar to obtain better cocoon yield components of silkworm races. In this regard, long spinning silk thread, robust silk cocoon and shell weight and higher percentage of silk ratio of silkworms were registered from treated beds. Silk growers can use more economical bed cleaning practices to ensure higher cocoon yield depending on the type of silkworm races. This study suggested that, if proper bed cleaning is not done in time it leads to ill health of larvae, disinterest of the larvae to feed due to unhygienic conditions, which ultimately makes worms weak and low in productivity. To this effect, stage wise bed cleaning frequency for each larval instars of the different silkworm races should be done to reduce larval mortality, to shortened larval period and to improve the yield components of the different silkworm races. References
Dayashankar KN. 1982. Performance of eri silkworm, Samia cynthia ricini Boisduval
on different host plants and economics of rearing on castor under Dharwad conditions. M.Sc. Thesis, University of Agricultural Sciences, Bangalore, pp.60-86.

221
Devaiah MC, R Rajashekar Gouda,Yelshetty Suhas, and R Govindan. 1985. “Growth and Silk Production in Samiya cynthia ricini Boisduval (Lepidoptera: Saturniidae) Fed on Four Different Host Plants”, Indian J. Seric., Vol. 24, pp. 33-35.
FAO. 1976. Agricultural service Bulletin (15/1). Sericultural manual 1: Mulberry cultivation. Rome, Italy.
.Gogoi B and BC Goswami. 1998. Studies on certain aspects of wild eri silkworm (Philosamia cynthia Drury) with special reference to its rearing performance. Sericologia 38:465-468.
Krishnaswami S. 1978. New Technology of Silkworm Rearing. Bull.Cent. Seric. Res.Train. Inst., Mysore, pp. 1-24.
Hajarika U, A Barah, JC Phukan, and KV Benshamin. 2003. Study on the effect of different food plants and seasons on the larval development and cocoon characters of silkworm Samia cynthia ricini Boisduval. Bull. Ind. Acad.Seric. 7:77- 85.
Hisao Aruga. 2001. Principles of sericulture. 3rd ed. Oxford and IBH publishing Co. Pvt. Ltd., 66 Janpath, New Delhi. Pp.267-270.
Joshi KL. 1987. “Progression Factor for Growth in Eri Silk Moth in Relation to Diet”, Indian J. Seric., Vol. 26, pp. 98-99.
Joshi KL and SD Misra. 1982. Silk Percentage and effective rate of rearing of eri silkmoth, Philosamia ricini Hutt. (Lepidoptera: Saturniidae). Entomol. 7:107-110
Metaferia Hebtehyimer Amanuel Tamiru and Kedir Shifa. 2006. Scaling up of silk production technologies for employment and income generation in Ethiopia. In: Success With Value Chain: proceedings of scaling up and scaling out of agricultural technologies in Ethiopia, an international conference, 9-11 May 2006 (Tsedeke Abate ed). Ethiopian Institute of Agricultural Research, Addis Ababa.
Nataraju B, K Sathyaprasad, D Manjunath, and CA Kumar. 2005. Silkworm Crop Protection. Central Silk Board, Bangalore. 412pp.
Neelu Nangia, Jagadish PS, and BK Nageshchandra. 2000, “Evaluation of the Volumetric Attributes of the Eri Silkworm Reared on Various Host Plants”, Int. J. Wild Silkmoth and Silk, Vol. 5, pp. 36-38.
Patil RR, S Kusugal, and G Ankad. 2009. Performance of eri silkworm, Samia cynthia ricini Boisd. on few food plants. Karnataka J. Agric. Sci. 22:220-221.
Raghavaiah CV. 2003. Prospects of Eri silk (Philosomia ricini) production along with castor beans (Ricinus communis L.) and Tapioca (Manihot utilisimma) production in Andhra Pradesh. Ind.Silk 42: 33-35
Reddy DNR, YK Kotikal, and M Vijayendra. 1989. “Development and Silk Yield of Eri Silkworm, Samia Cynthia ricini (Lepidoptera: Saturnidae) as Influenced by the Food Plants”, Mysore J. agric. Sci., Vol. 23, pp. 506-508.
Reddy DN and KC Swamy. 1999. Effect of host on the consumption rate, leaf – cocoon and leaf egg ratio of eri silkworm, Samia cynthia ricini Boisduval (Lepi doptera: Saturniidae). Entomol. 24: 67-70.

222
Reddy RM. 2008. Value addition span for silkworm cocoon - time for utility optimization. Int. J. Indust. Entomol. 17:109-113.
Sachan JN and SP Bajpai.1973, “Response of Castor (Ricini communis L.) Varieties on Growth and Silk Production of Eri Silkworm Philosamia ricini Hutt. (Lepidoptera: Saturniidae)”, Ann. Arid Zone, Vol. 11, pp. 112-115.
Sakthivel N. 2004. Eri culture on castor and tapioca in Tamil Nadu. In:Proceeding on workshop of prospects and development of ericulture, University of Agricultural Sciences, Dharwad, pp. 78-81.
Sannappa B and J Jayaramaiah. 1999. Mineral Constituents of Selected Genotypes of Castor, Ricinus communis L. Mysore J.agric.Sci. 33: 157-161 Sarkar, D.C. (1988). Ericulture in India. Central Silk Board, Grafo Printers, pp.1- 49.
Sharma RK, SK Dutta, and C Bhuyan.1996. “Effect of Food Plants on Certain Life Parameters of Eri Silkworm (Philosamia ricini)”, Journal of Applied Biology, Vol. 6, Nos.1-2, pp.115-120.
Singh KC and KV Benchamin. 2002. Biology and ecology of the eri silkmoth Samia ricini Donovan (Saturniidae): Bullet. Ind. Acad. Seric. 6: 20- 33.
Takano K and N Arai. 1978. Studies on the food values on the basis of feeding and cocoon productivity in the silkworm, Bombyx mori. Sericol. Sci. 47: 134-142.
Zhang YH, AY Xu, YD Wei, MW Li, CX Hou, and GZ Zhang. 2002. Studies on feeding habits of silkworm germplasm resources for artificial diet without mulberry. Acta Sericologia Sinica 28: 333-336.

223
The Performance of Eri Silkworm Strains (Samia cynthia ricini B.) in Different Sites
Kedir Shifa1, Metasebia Terefe1, Ahmed Ibrahim1, Abiy Tilahun1, Samuel Menbere2, Kassa Biratu3 and Afework Bogale4
Ethiopian Institute of Agricultural Research, (1Melkassa, 2Wondo Genet, and 3Jimma)
and, 4Hawassa, SARI, Email – [email protected]
Introduction Eri-silkworm is one of the most exploited, domesticated and commercialized non mulberry silkworms. It has many generations per year and feeds on several host plant species (Singh and Das, 2006; Chakravorty and Neog, 2006; Bindroo et al., 2007). It is a domesticated silkworm and can be reared in doors (Joshi, 1992). Among all host plants, castor (Ricinus communis L.) is the most preferred host plant for eri-silkworm (Sannappa et al., 2004; Kumar and Elangovan, 2010). Moreover, about 25-40% of castor foliage can be defoliated (removed) and used for feeding eri-silkworm without affecting oil seed production (Raghavaiah, 2003). Castor grows widely and abundantly in many parts of Ethiopia. In addition to cultivated castor on cultivable lands, it is also found wild in waste places, fallow fields, along road sides, farm borders and irrigation canals. It is dominantly used for oil seed production; however, it is also used for rearing of eri-silkworms especially in the rift valley areas and southern Ethiopia (Metaferia et al., 2006). However, rearing of improved silkworm strains that adapt to the local environment is an important method for improving cocoon quality, increasing cocoon yield and enhancing economic benefit (Nguku et al., 2009). Differences in climatic conditions of different agro-ecological regions, including the significant distinctions in temperature and humidity, necessitate that the silkworm variety should be both high yielder and adversity resistant (Basavaraja et al., 2005). Priyanki and Jorgen (2013) carried out a comparative study on eri silkworm strains in India and reported significant variation in morphological and productivity parameters among strains. Debraj et al. (2001) stated phenotypic diversity and characterization of strains of eri silk worm will be useful for selection of breeding components for developing high silk productive breeds of silk worm. Hence, it can be recognized that evaluation of eri silkworm strains is an important beginning for future breeding and improvement efforts and for sericulture inclusive development endeavors. However, the differential performance of eri-silkworm strains has

224
not been studied and documented in Ethiopia. There was no recommended silkworm strain for silk production in the country. This study therefore, assessed the adaptability and silk yield performance of different introduced eri silkworm strains under Ethiopian condition. Materials and Methods Description of the study area The experiment was conducted at Melkassa, Hawassa, Wondogenet and Jimma Agricultural Research Centers (ARCs) of Ethiopia. These locations represent some of the agro-ecologies of the country assumed suitable for silkworm. Lay out and rearing As per the rearing recommendations of silkworms by Rajan and Himantharaj (2005), the silkworm rearing room and equipment’s were cleaned, washed and disinfected with 2% formalin solution at the rate of 800ml per 10m2 before the commencement of the experiment (rearing). Different eri silkworm strains viz… Eri-3.4/Vietnamese White plain strain/, Eri-Yellow/Indian Yellowish White Plain/, Eri-green/Indian Greenish Blue Plain/ and Eri-marked/Indian White Zebra/ were evaluated in the experiment. The experiment was designed in a Completely Randomized Design (CRD) with four replications. In each replication, 200 worms were used and allowed to complete their life cycle. The primary food plant, castor (Ricinus communis L.), was used as feed source for these silkworms. Tender leaves of castor were fed four times a day until the larvae ends 2nd instar stage and semi tender leaves at 3rd instar larvae, while more matured leaves were fed to 4th and 5th instar larvae. Data collection and analysis As adopted by Kedir et al. (2014), egg count was made before larval hatching. On the sixth day of spinning, the cocoons were harvested, counted and weighed. Data like larval and total life cycle duration (in days) and mature larval weight (in grams) were recorded. The cocoon weight (with pupa) and cocoon shell weight (without pupa) were documented. The following formulae were used for analysis of egg hatchability (%), effective rate of rearing (ERR %) and silk shell ratio (%) calculations.
eggsnormalofNumbereggsnonhatchedofNumbereggsnormalofNumberlarvatotyhatchabiliEgg −
=

225
𝑺𝒉𝒆𝒍𝒍 𝒓𝒂𝒕𝒊𝒐 =𝒘𝒆𝒊𝒈𝒉𝒕 𝒐𝒇 𝒕𝒉𝒆 𝒄𝒐𝒄𝒐𝒐𝒏 𝒔𝒉𝒆𝒍𝒍 𝒘𝒆𝒊𝒈𝒉𝒕 𝒐𝒇 𝒕𝒉𝒆 𝒘𝒉𝒐𝒍𝒆 𝒄𝒐𝒄𝒐𝒐𝒏
𝒙 𝟏𝟎𝟎
𝑬𝑹𝑹 =𝑵𝒖𝒎𝒃𝒆𝒓 𝒐𝒇 𝒄𝒐𝒄𝒐𝒐𝒏 𝒚𝒊𝒆𝒍𝒅
𝑵𝒖𝒎𝒃𝒆𝒓 𝒐𝒇 𝒍𝒂𝒓𝒗𝒂𝒆 𝒃𝒓𝒖𝒔𝒉𝒆𝒅𝒙𝟏𝟎𝟎
Finally, data were analyzed using SAS software (SAS, 2000). Least Significance Difference (LSD) was used to test significance of differences among treatment means at 5% probability. Results and Discussion Findings of the present study showed variations in growth and cocoon characters of different eri silkworm strains, Samia cynthia ricini. Data on growth, rearing performance and cocoon traits of eri silkworm strains viz., egg hatchability (%), larval and total life cycle durations (days), larval weight (g), effective rate of rearing (%), cocoon weight (g), shell weight (g) and shell ratio (%) of different strains are described below. Significant differences were observed in silkworm characters among mulberry silkworm strains in different locations. Varying larval development periods and total life cycle durations were recorded from the strains. Egg hatchability Hatchability of eri silkworm strains to larval stage ranged from 62.6% to 89.0% (Table 1). However, significant variation (p<0.05) in egg hatchability among eri silkworm strains was observed only at Melkassa. At Melkassa, higher egg hatchability (75.665 %) was recorded in Eri-3.4 strain followed by Eri-Yellow (73%) and Eri-Green (71.3 %). The least egg hatchability was recorded on Eri-Marked strain (62.608 %).
Table 1 - Variations in egg hatchability (%) among eri-silkworm strains
Strain Melkassa Hawassa Wondo-Genet Jimma Eri-3.4 75.7a 80.0 82.3 82.0 Eri-Yellow 73.0ba 77.3 83.2 85.5 Eri-Green 71.3b 79.8 83.5 82.5 Eri-Marked 62.6c 79.0 80.7 89.0
Pr <.0001 0.1839 0.7318 0.3169 CV 3.956 1.862 4.007 5.612
Means followed by the same letter within a column are not significantly different from each other (P>0.05)

226
Larval and total life cycle duration The overall larval duration ranged from 20.7 days to 25.8 days. Larval duration of eri-silkworm strains showed significant difference only in Jimma area (Figure 1). In Jimma, the shortest larval period was observed in Eri-3.4 strain/21.0 days compared to the other strains. On the other hand, duration of the total life cycle generally ranged from 50.5 days to 74.0 days. However, statistically significant total life cycle duration was recorded only in Hawassa area where Eri-Green strain exhibited the shortest duration of 56.5 days. Effective Rate of Rearing (ERR) (%) The experiment showed a range of ERR from 60.1% to 93.7% (Figure 2). Eri silkworm strains showed significant variation in ERR at all the study locations except in Wondo-Genet. The highest ERR was recorded for Eri-3.4 strain at all the locations while the lowest ERR was recorded for Eri-marked strain at Jimma. Matured larval weight Weight of a single matured silkworm larva was significantly different among eri silkworm strains at all the locations except in Jimma (Table 2). The result showed that larval weight was significantly highest in Eri-3.4 strain in Melkassa (7.61g). This strain had better larval weight in Hawassa and Wongo-Genet areas compared to other strains. The lowest larval weight was obtained from Eri-Yellow strain (4.64 g) in Hawassa area.
Table 2: Variations in larval weight (g) of different eri silkworm strains
Strains Melkassa Hawassa Wondo-Genet Jimma Eri-3.4 7.61 a 7.13 a 5.38 a 6.61 Eri-Yellow 8.16 a 4.64 b 5.36 b 7.16 Eri-Green 6.41 b 5.13 b 5.39 ba 7.28 Eri-Marked 6.26 b 5.50 b 5.13 c 7.04 P 0.001 0.001 0.01 0.31 CV 10.246 8.266 2.215 6.079
Means followed by the same letter within a column are not significantly different from each other at 5% level of probability

227
a) Larval duration (in days)
b) Duration of the total life cycle (in days)
Figure 1. Larval (a) and total life cycle (b) duration (in days) of
different eri-silkworm strains
0 10 20 30
Melkassa
Hawassa
Wondo-Genet
Jimma
Eri-MarkedEri-GreenEri-YellowEri-3.4
0 20 40 60 80
Melkassa
Hawassa
Wondo-Genet
Jimma
Eri-MarkedEri-GreenEri-YellowEri-3.4

228
Figure 2. Variability of different eri silkworm strains in effective rate of rearing Cocoon traits With respect to cocoon traits, maximum and significantly different single cocoon weight was recorded for Eri-3.4 strain in Melkassa (2.64g). The lowest cocoon weight (1.85g) was obtained from Eri-Yellow strain in Hawassa. In addition, eri silkworm strains showed variation in their single cocoon shell weight in different locations. The highest was 0.42 g from Eri-Green strain in Jimma but the lowest was 0.25g from Eri-Yellow strain in Hawassa. However, the shell ratio which will indicate the quantity of silk that can be spun from cocoons was not significantly different among eri silkworm strains in all the locations (Table 3). In general, the different silkworm strains showed variations in silkworm characters (p<0.05) in different locations viz., egg hatchability (62.6% to 89.0%), larval duration (20.7days to 25.8 days), total life cycle duration (50.49 days to 74.00 days), single weight of larva (4.43 grams to 8.16 grams), effective rate of rearing (60.11% to 93.7%), single cocoon weight (1.85 grams to 2.90 grams), single shell weight (0.25 grams to 0.42 grams) and silk ratio (13.1 to 15.1%).
0102030405060708090
100
Eri-3.4
Eri-Yellow
Eri-Green
Eri-Marked

229
Similar findings carried out by Priyanki and Jogen (2013) confirmed such differences among eri silkworm strains. In addition, Singh et al., 2011 carried out study on morphological characters of eco races and six strains of eri silk worm and found out variations in their rearing performance, and recommended Yellow Zebra as the best strain in terms of rearing performance, which is not introduced to Ethiopia until today. These differences are justifiable in that rearing performance of silkworms is affected by ecological, biochemical, physiological and quantitative characters, which influence growth and development, quantity and quality of silk they produce in different geographical locations (Virk et al, 2011; Anandakumar and Michael, 2012; and Reddy et al, 2012). The ability of silkworms to produce is mainly affected by temperature and humidity, as verified by the silkworms reared in all locations. In addition, it has been well established that efficiency in silkworm production is often lower during and after the hot season. One reason for the reduction in their productive performance in some locations might be elevated ambient temperatures, which induce heat stress (Scriber and Slansky, 1981). Moreover, the nutritive value of leaves especially the moisture content may also vary to contribute to variability in performance and productivity of silkworm strains at different agro-ecological zones (Jayaramiah and Sannappa, 1998). Conclusions and Recommendation The evaluated eri silkworm strains exhibited important variability in different locations. Hence, evaluation and identification of eri silkworm strains that adapt to diverse agro-climatic conditions and produce high yield is confirmed to be very essential practice for future interventions in silk production sector. A Vietnamese white plain eri silkworm strain known by Eri-3.4 showed an outstanding performance compared to other strains in all the locations especially in cocoon parameters and effective rate of rearing. These parameters are very important with respect to commercial terms. The strain was at par level with other strains in regard to other silkworm performance parameters too. Therefore, a Vietnamese white plain eri silkworm strain known by Eri-3.4 was the best strain in terms of growth and cocoon characters. As a result, it is now recommended to be reared in bulk and to be utilized for research and development efforts on eri silkworms in Ethiopia. On the other hand, a cocoon weight recorded from the present study is lower compared to recent international findings. Therefore, further research and improvement works should be carried out on eri silkworm strains to achieve better productivity.

230
Table 3: Differences in cocoon traits among eri silkworm strains
Strain
Melkassa Hawassa Wondo-Genet Jimma
Single cocoon weight (g)
Single shell weight (g)
Silk ratio (%)
Single cocoon
weight (g) Single shell weight (g)
Silk ratio (%)
Single cocoon
weight (g) Single shell weight (g)
Silk ratio (%)
Single cocoon
weight (g)
Single shell weight (g)
Silk ratio
(%)
Eri-3.4 2.64a 0.37a 14.11a 2.34a 0.32a 13.65a 2.64a 0.39a 14.71ba 2.57b 0.34b 13.22a
Eri-Yellow 2.41b 0.33b 13.85a 1.85b 0.25b 13.57a 2.54b 0.38a 15.05a 2.90a 0.38ba 13.22a
Eri-Green 2.44b 0.34b 13.80a 2.06b 0.27ba 13.06a 2.34c 0.32b 13.83b 2.89ba 0.42a 14.41a
Eri-Marked 2.48ba 0.35b 14.00a 2.06b 0.29ba 13.87a 2.26c 0.33b 14.82ba 2.81ba 0.39ba 13.90a
Pr 0.0314 0.0123 0.7329 0.0156 0.1606 0.8327 <.0001 0.0001 0.0952 0.1475 0.1598 0.3306
CV 5.3318 5.7475 3.7585 6.5508 11.9039 8.1940 1.9443 3.0062 3.6280 6.2720 9.6453 6.3205
Means followed by the same letter within a column are not significantly different from each other at 5% level of probability

231
References
Anandakumar MD and AS Michael. 2012. Effect of nutritive additive of mulberry and
its impact on nutritional components of silkworm, Bombyx mori L. Int. J. Adv.Biotech. Res. 3: 523-529
Basavaraja HK, SK Aswath, NS Kumar, NM Reddy, and GV Kalpana. 2005. Silkworm Breeding and Genetics. Central Silk Board, Bangalore, pp. 39-341.
Bindroo BB, NT Singh, AK Sahu and R Chakravorty. 2007. Eri silkworm host plants. Ind. Silk, 5: 13-16.
Debraj Y, MC Sarmah, RN Dutta, LS Singh, PK Das, and KV Benchamin. 2001. Field trail of elite Comparative study on six strains of ERI silk crosses of eri silkworm, philosamia ricini, Hutt, Ind. Silk, 40, 15-16.
Jayaramaiah M and B Sannappa. 1998. Correlation coefficients between foliar constituents of castor genotypes and economic parameters of the eri silkworm, (Samia cynthia ricini) Boisduval (Lepidoptera: Saturniidae). Proceedings of the 3rd International Conference on Wild Silkmoths, November 11-14, 1998, Bhubaneshwar, India.
Kumar R and V Elangovan. 2010. Assessment of the volumetric attributes of eri-silkworm (Philosamia ricini) reared on different host plants. Int. J. Sci. Nat., 1:156-160.
Priyanki SH and CK Jogen. 2013. A comparative study on six strains of Eri silkworms (Samia ricini Donovan) based on morphological traits. G.J.B.B. 2: 506-511
Raghavaiah CV. 2003. Prospects of Eri silk (Philosomia ricini) production along with castor beans (Ricinus communis L.) and tapioca (Manihot utilisimma) production in Andhra Pradesh. Ind. Silk, 42: 33-35.
Rajan RK and MT Himantharaj. 2005. Silkworm Rearing Technology. Central Silk Board, Bangalore, pp. 15-136.
Reddy NM, SN Kumar, AR Naseemabegum, SM Moorthy, and SMH Qadri. 2012. erformance of bivoltine silkworm hybrids of Bombyx mori L. involving parental foundation crosses of different generation. Int. J. Res. Zool.. 2: 1-5
Sannappa B, R Naika, R Govindan, and Siddagangaiah, 2004. Ericulture: A venture for rural betterment. J. Curr. Sci., 5: 137-140.
SAS, 2000. SAS/STAT User’s Guide. SAS Institute Inc., Cary, NC., USA.

232
Singh BK and PK Das. 2006. Prospects and problems for development of Eri culture in
non-traditional states. Proceeding of Regional Seminar on Prospects and Problems of Sericulture: An Economic Enterprise in North West India, November 11-12, 2006, Dehradun, India.
Scriber JM and JF Slansky. 1981. The nutritional ecology of immature insects. Ann. Rev. Entomol. 26:183-211
Virk JS, L Kaur, and B Singh. 2011. Evaluation of different strains of mulberry silkworm and eri silkworm for the development of sericulture in Punjab. Internat. J. agric. Sci., 7: 266-269.011

233
Performance of Castor (Ricinus communis) Genotypes and their Effects on Eri-Silkworms
(Samia cynthia)
Metasebia Terefe1, Abiy Tilahun1, Kedir Shifa1, Ahmed Ibrahim1, Kassa Biratu2, Samuel Membere3, Afework Bogale4 and Eshetu Yirsaw5
Ethiopian Institute of Agricultural Research, (1Melkassa, 2Jimma, and 3Wondo Genet)
4Hawassa (SARI), 5Alagae ATVET College - Email – metasebiaterefe@gmail,com
Introduction Castor (Ricinus communis) is the primary feed plant, which is known for high production of good quality cocoon. However, cassava (Manihot utilissima), Kesseru (Heteropanax fragrance), Papaya (Carico papaya), Jatropha (Jatropha curcas), Barpat (Ailanthus grandis) and Payam (Evodia fraxinifolia) are secondary and tertiary host plants during unfavorable seasons (Hajarika et al., 2003). Sakthivel 2004, also reported the superiority of castor over other hosts including cassava for larval and cocoon traits. It also been observed that the growth and development of silkworms and quality of silk cocoon produced are directly influenced by the variety and quality of leaves fed to the worms (Krishnaswami et al., 1970). Morphological characters of leaves contribute to acceptability by silkworms (Krishnaswami et al., 1970). Gogoi and Goswami (1998), studied castor genotypes and observed variation in leaf yield in different genotypes. Therefore, selection of castor genotypes is an important criterion for better growth and development of eri-silkworm for proper nourishment to obtain better fecundity and higher cocoon productivity (Joshi and Misra, 1982). However, very little information is available on the different castor genotypes and its performance on eri-silkworms in Ethiopia. Therefore, the objective of this study was to evaluate the agronomic and their rearing performance of different genotypes of castoroneri- silkworms.

234
Materials and Methods Experiment conducted on field and laboratory, across differentAgricultural Research Center (Melkassa, Jimma, Wondogenet, Hawassa) and Alage ATVET College. All genotypes were collected from different parts of the country mainly from institute of Biodiversity conservation (IBC), Essential Oil Research Center and the surrounding areas. About 6 genotypes of castor namely, Acc 105524, Acc 208624, Hiruy, Acc 106509, Abaro and Local were used as a treatment and evaluated under field and laboratory conditions. The study was carried out under rain fed condition with supplemental irrigation during dry periods. The castor genotypes were sown with a spacing of 75 cm* 75 cm between plants and rows on a plot size of 6m * 4.5 m. The treatments were arranged with RCBD in three replications in the field. For laboratory eri-silkworm was reared on the 6 castor genotypes. The silk worm rearing room and equipment’s were cleaned, washed and disinfected with 2 % formalin solution at the rate of 800ml per 10m2 before the commencement of the experiment (Dayashankar, 1982). This silk worm was reared following cellular techniques starting from brushing till silkworms at larval stage was fed four times a day with tender leaves until III instars and mature leaves until V instars. The grown up worms were picked and left on the mountages for spinning. On the sixth-eighth day of spinning, the cocoons were harvested, counted and weighed (Singh and Benchamin, 2002). The experiment was arranged in Completely Randomized Design (CRD) in three replications. In each replication, 50 worms/ tray were used and allowed to complete the larval period to cocoon spinning on the six genotypes. Data collection Agronomic parameters like, plant height, number of leaves per plant, number of primary and secondary branches, fresh and dry leaf weight were recorded. For the laboratory, rearing variables like larval duration (hr), larval body weight (g), hatchability (%), effective rate of rearing (%), cocoon traits like (cocoon and shell weight in grams and silk ratio in percent) and fecundity (number of eggs per female in number) were recorded. The following formulae adopted by Singh and Benchamin (2002) were used:-
Hatchability (%) =𝑁𝑜. 𝑜𝑓 𝑛𝑜𝑟𝑚𝑎𝑙 𝑒𝑔𝑔𝑠 − 𝑛𝑢𝑚𝑏𝑒𝑟 𝑜𝑓 𝑛𝑜𝑛ℎ𝑎𝑡𝑐ℎ𝑒𝑑 𝑒𝑔𝑔𝑠
𝑁𝑜. 𝑜𝑓 𝑛𝑜𝑟𝑚𝑎𝑙 𝑒𝑔𝑔𝑠𝑥 100

235
𝐒𝐢𝐥𝐤 𝐫𝐚𝐭𝐢𝐨 =𝒘𝒆𝒊𝒈𝒉𝒕 𝒐𝒇 𝒔𝒉𝒆𝒍𝒍𝑾𝒆𝒊𝒈𝒉𝒕 𝒐𝒇 𝒄𝒐𝒄𝒐𝒐𝒏
𝒙 𝟏𝟎𝟎
𝐄𝐟𝐟𝐞𝐜𝐭𝐢𝐯𝐞 𝐫𝐚𝐭𝐞 𝐨𝐟 𝐫𝐞𝐚𝐫𝐢𝐛𝐠 (𝐄𝐑𝐑) =𝐍𝐨.𝐨𝐟 𝐥𝐚𝐫𝐯𝐚𝐞 𝐬𝐩𝐢𝐧𝐧𝐢𝐧𝐠 𝐜𝐨𝐜𝐨𝐨𝐧
𝐍𝐨.𝐨𝐟 𝐥𝐚𝐫𝐯𝐚𝐞 𝐛𝐫𝐮𝐬𝐡𝐞𝐝𝐱 𝟏𝟎𝟎
Data analysis The data were subjected to analysis of variance (ANOVA) using Statistical Analysis Software (Gomez and Gomez, 1984)(version 9.00, SAS, Institute Inc., Cary, NC, USA). Treatment means were separated using Duncan multiple ratio. Results and Discussion Evaluation of castor genotypes in field and its rearing performance was carried out.Eri- silkworms fed with the leaves of different genotypes of castor and their response was evaluated. Results showed that in all locations displayed significant (P<0.05) differences for a number of agronomic and yield characters for different castor accessions as compared to local check. There were significant differences (P<0.05) in number of leaf production, fresh and dry leaf weight among treatments in different locations. However, in Jimma treatments comparable results on the mean number of leaf production were obtained. Maximum fresh leaf weight (748g) and dry leaf weight (169g) were recorded from Hiruy at Melkassa site. However, the least fresh (205g) and dry leaf weight (31g) was recorded in local and208624accessionfrom Alage site, respectively (Table 3). Among all treatments, Abaro and Hiruy gave significantly (P<0.05) higher yield as compared to local check and other treatments. They gave better and similar results in most of the measured parameters. Except Jimma and Alage sites, significant difference in plant height was not recorded (Table 1).The difference between the highest and the lowest in leaf production was 39 and 7.7 at Jimma and Alage locations, respectively.

236
Table 1. Means for plant height (cm) and number of leaf per plant at harvesting stage of castor accessions grown across locations
Treatment Plant height and number of leaf per plant at harvest respectively
Melkassa Jimma Wondogenet Hawassa Alage PH NL PH NL PH NL PH NL PH NL
105524 193a 18bc 188bc 32a 144a 20b 135b 20b 184a 10bc 208624 188a 16c 197abc 39a 150a 22ab 161ab 22ab 214a 7.7c HIRUY 234a 24ab 224abc 25a 155a 27a 133b 24ab 205a 14a 106509 190a 17c 255ab 34a 150a 23ab 172a 20b 216a 10bc Abaro 220a 28a 266a 23a 125a 19b 152ab 26a 165a 14a Local 184a 20bc 180c 23a 100a 20b 162ab 20b 148a 12ab CV 17 16.8 18 38 25 16 17.5 14.7 22 17 LSD 62.7 6.2 71 20.6 62 6.6 31.6 6 76 3.5
Means within a column with a common letter are not significantly different (P<0.05), PH= plant height (cm), NL= Number of leaves per plant Gemechu (2012) stated that when genotypes perform consistently across locations, breeders should be able to effectively evaluate germplasm with a minimum cost in a few locations for ultimate use of the resulting varieties across wider geographic areas. However, with high genotype by location interaction effects, genotypes selected for superior performance under defined environmental conditions (Ceccareelli, 1997). Therefore, it could be implicated that selection of better performing genotypes at one location may not enable the identification of genotypes that can repeat nearly the same performances at another location. Studies on nutritional ecology of an insect are very important for its commercial exploitation (Slansky and Scriber, 1985). The suitability of host is determined through estimation of rate of ingestion, digestibility, conversion efficiency of food and growth rate of the animal (Englemann, 1966).The results indicated that castor genotypes of Acc 105524, Acc 208624, Hiruy, Acc 106509, Abaro and Local check resulted significant variation in rearing performances of the worms. Insects do vary in efficiency of conversion of digested food due to the varied level of nutrients intake, quality of the food and total biochemical components of the leaf supplied to the insects (Krishnaswami et al., 1970).

237
Table 2. Means for Primary and Secondary branches per plant during harvesting stage of castor accessions grown across location
Treatment Primary and Secondary branches
Melkassa Jimma Wondogenet Hawassa Alage Primary Secondary Primary Secondary Primary Secondary Primary Secondary Primary Secondary
105524 5ab 1.7ab 9a 3.7a 7bc 1.7ab 6a 0.3b 9a 2a 208624 4bc 2ab 8a 4a 7bc 1b 6a 1.3ab 9a 1.2a HIRUY 6a 2ab 9a 3a 10a 2.7a 5a 2.0a 11a 1.6a 106509 2.7c 1b 7a 3.7a 5c 2ab 6a 2.7a 9a 1.4a Abaro 5.7a 2.7a 6.7a 3a 9ab 2ab 5a 2.0a 7a 0.8a Local 5ab 2ab 7a 2a 8ab 1.7ab 4a 1.3ab 8a 1a CV 19 44.7 32 46 17 33 27 46.5 30 60 LSD 1.6 1.5 4.7 2.7 2.4 1 2.6 1.4 5 1.4
Means within the same column with a common letter are not significantly different (P<0.05).
Table 3: Means for fresh and dry leaf weight (g) per plant at harvesting stage of castor accessions grown across locations
Treatment Leaf weight (g) per plant at harvesting stage
Melkassa Jimma Wondogenet Hawassa Alage Fresh Dry Fresh Dry Fresh Dry Fresh Dry Fresh Dry
105524 508cd 128ab 435c 105bc 288b 67b 471c 120a 292b 51b 208624 362d 89b 457c 107bc 287b 74b 492bc 148a 280b 31b HIRUY 748a 169a 698a 149ab 419ab 101ab 637ab 160a 475a 119a 106509 563bc 132ab 544bc 123abc 338ab 72.7b 475c 156a 284b 34b Abaro 703ab 167a 668ab 153a 459a 116a 659a 163a 408a 101a Local 587bc 153a 423c 95c 313b 68b 438c 141a 205b 47b CV % 14 18 15 20 22 25 15 26 17 31 LSD 151 46 149 45 139 38 146 70.5 99 36
Means within the same column with a common letter are not significantly different (P<0.05),

238
Table 4. Rearing performance of eri silkworm fed on different castor genotypes
Treatment HaP LaD Larw CoW Shw SiR Fecun ERR
Abaro 84.17b 584.17 b 8.29ba 3.3a 0.479a 14.5a 372cb 78a Acc105524 95.3333a 584.17 b 8.05bc 3.149e 0.453e 14.395c 409.000a 69.32c Acc106509 81.50d 588.17 b 8.05bc 3.131e 0.447f 14.281d 337.667e 73.38a Acc208624 87.00b 588.17 b 8.05bc 3.307b 0.477b 14.424bc 374.000cb 73.18a Hiruy 93.83a 592.17 b 8.02c 3.205dc 0.458d 14.305d 388.667b 69.92bc Local 84.8333c 588.17 b 7.60d 3.144e 0.443g 14.073e 353.000ed 65.36d SE 0.61 3.75 0.04 0.01 0.001 0.02 5.3 1.2
CV (%) 1.21 1.1 0.96 0.47 0.51 0.21 2.47 2.45
B: Hap= hatching percentage, LaD= larval duration (HR), Larw =larval weight, CoW= cocoon weight, Shw =shell weight, SiR= silk ratio, fecund= fecundity, ERR =effective rate of rearing; Means with the same column with a common letter are not significantly different at Pr< 0.05.
Among different genotypes of castor, eri-silkworms fed on leaf of Abaro gave better results such as larval weight (8.29 g), effective rate of rearing (78 %), cocoon weight (3.30 g), shell weight (0.479 g) and silk ratio (14.5 %) as compared to local check and other treatments (Table 4). The study by Rajesh et al.,(2010) on the increase of larval weight, cocoon and pupal weight and silk ratio exhibited by eri silkworm fed on castor leaf was explained due to the higher rate of food ingestion, food assimilation and respiratory activity. The involvement of these factors in increasing the larval body substance has been reported by Stockner (1971). In general, Abaro and Hiruy showed better results in agronomic performances in the field; however, Abaro also gave better results in rearing performance of eri-silkworms in the laboratory. References
Ceccarelli S. 1997. Adaptation to low/high input cultivation. Adaptation in Plant Breeding, pp.225-236, (Tigerstedt, P.M.A., ed), Kluwer Academic Publishers, The Netherlands.
Dayashankar KN. 1982. Performance of eri silkworm, SamiacynthiariciniBoisduval on different host plants and economics of rearing on castor under Dharwad conditions. M.Sc. Thesis, University of Agricultural sciences, Bangalore.

239
Engelmann 1966. Energetics, terrestrial, field studies and animal productivity In: Advances in Ecological Research. Vol. 3, J.B. Cragg, (Ed.), Academic Press, London and New York, pp.73-115.
Gemechu Keneni. 2012. Genetic potential and limitations of Ethiopian chickpea (Cicer arietinumal) germplasm for improving attributes of symbiotic nitrogen fixation, phosphorus uptake and use efficiency, and adzuki bean beetle (Callosobruchus chinensis L.) resistance. PhD. Thesis. Addis Ababa University faculty of life science, Ethiopia.
Gogoi B. and BC Goswami. 1998. Studies on certain aspects of wild eri silkworm (Philosamiacynthia Drury) with special reference to its rearing performance. Sericologia 38:465-468
Gomez KA and AA Gomez, 1984. Statistical Procedures for Agricultural Research, 2ndEdn, John Willey and Sons, New York.
Hajarika U, A Barah, JC Phukan, and KV Benshamin. 2003. Study on the effect of different food plants and seasons on the larval development and cocoon characters of silkworm Samiacynthia riciniBoisduval. Bull. Ind. Acad. Seric. 7:77- 85.
Joshi KL and SD Misra. 1982. Silk Percentage and effective rate of rearing of erisilkmoth, Philosamiaricini Hutt. (Lepidoptera: Saturniidae). Entomol. 7:107-110
Krishnaswami S, KR Noamani and MA san, 1970. Studies on the quality of mulberry leaves and silkworm cocoon crop production. Indian J. Sericult., 9:11-25.
Rajesh Kumar and SK Gangwar. 2010. Impact of varietal feeding on Samiaricini Donovan in spring and autumn season of Uttar Pradesh. ARPN Journal of Agricultural and Biological Science. VOL. 5, NO. 3, ISSN 1990-6145.
Sakthivel N. 2004. Eri culture on castor and tapioca in Tamil Nadu, Proceeding of the Workshop of Prospects and Development of Eri culture, University of Agricultural Sciences, (WPDE 04), Dharwad, pp: 78-81.
Stockner JH. 1971. Food utilization by the last instar larvae of the silk-moth, Antheraeaproylei in indoor condition. J.Fish. Res. Bd. An. 28: 73-94. Cited in Dey S. 1983, The Indian Zoologist. 7(122), 85 -87.
Slansky F and JM Scriber. 1985. Food consumption and utilisation. In: Kerkut GA and LI Gilbert (eds), Comprehensive Insect Physiology, Biochemistry and Pharmacology. Vol.4, pp. 88-151..
Singh KC and KV Benchamin. 2002. Biology and ecology of the eri–silk moth, Samiaricini Donovan (Saturniidae): Bullet. Ind. Acad. Seric. 6: 20-33.

241
Agronomic Practices for Yield and Yield Components of Castor (Ricinus communis)
Metasebia Terefe, Ahmed Ibrahim, Abiy Tilahun and Kedir Shifa
Ethiopian Institute of Agricultural Research, Melkassa Research Center, P.O.Box-436, Ethiopia Email – metasebiaterefe@gmail,com
Introduction Castor (Ricinus communis) of a family Euphorbiaceae is flowering plant of the ancient oilseed crops and the major feed plant for the production of eri-silkworm, Samia cynthia which belong to saturnidae family. Eri-silkworm is among the commercially exploited silkworm species and can be reared in doors throughout the year to produce silk (Joshi, 1992). Castor is indigenous to the southeastern Mediterranean Basin, Eastern Africa (including Ethiopia) and India, but it is widespread throughout tropical regions. Castor has also established in waste accumulation areas, the edges of cultivated fields and canal banks (Zimmerman et al., 1958). Castor can also be considered as commercial crop from seed and sericulture businesses. Its seed contains 50-55 % oil (Weiss, 1971). Though, eri-silkworm is multivoltine feeding on a wide range of feed plants, castor serves as primary food plant (Singh and Das 2006). Reddy et al. (1989b) recorded higher survival rate, maximum growth index, higher shell ratio, higher net reproductive rate and shorter developmental period when eri-silkworms were reared on castor. Devaiahet al. (1985) also reported that castor is the best host plant affecting the larval weight, silk gland weight, cocoon weight and shell weight considerably. Hence, determination of optimum plant population, planting and leaf harvesting date for castor is important to obtain optimum leaf yield for the production of silk. However, very little information is available on the agronomic/cultural practices of castor for better production of leaf. Therefore, this study was conducted to find out optimum intra and inter row spacing, planting and appropriate leaf harvesting dates for improved castor leaf productivity.

242
Materials and Methods Land preparation Melkassa Agricultural Research Center (MARC) experimental field was used for planting of seeds of castor. Prior to planting, the land was prepared by ploughing, digging and leveling. Two seeds of castor per hole at a time were planted at the onset of the rain. The land was provided with supplemental irrigation for spacing and leaf harvesting trials. However, for assessing the production of castor during rainy season for the use of farmers who do not have the access of irrigation, supplementary water was not provided for planting date trials. Castor seed was planted at a spacing of 75cm x 75cm. Treatments Spacingl: Four within plant spacing (intra row spacing) (50, 75, 100 and 120cm) and three inter- row spacing (120, 100 and 75 cm) were arranged in factorial combination (12 treatment combinations) in RCBD design with 3 replications. Leaf harvesting date: 10, 12, 14, 16, 18 and 20 weeks after planting were used as treatments and it was arranged in RCBD design with 3 replications. Planting date: Late May (3rd - 4th week of May), Early June (1st - 2nd week of June), Late June (3rd - 4th week of June), Early July (1st - 2nd week of July, Late July (3rd - 4th) week of July) and early August (1st - 2nd week of August) were used as treatments and RCBD design in 3 replications. Data collection and analysis Agronomic parameters like, plant height, number of leaves per plant, number of primary and secondary branches, fresh and dry leaf weight were recorded. The data were subjected to analysis of variance (ANOVA) using Statistical Analysis Software (Gomez and Gomez, 1984) (version 9.00, SAS, Institute Inc., Cary, NC, USA). Treatment means were separated using the least significance difference (LSD).

243
Results and Discussion In the present study, significant differences (p<0.05) between treatments were observed: spacing, leaf harvesting and planting dates in selected parameters such as plant height, number of leaf production (Table 1), fresh and dry leaf weight. Significantly (P<0.05) higher number of fresh (13,295 kg/ha) and dry leaf weight (2,912 kg/ha) were observed from 50 cm plant and 75cm row spacing (Table 2). However, the least fresh (6,376 kg/ha) and dry leaf weight (1,460 kg/ha) were observed from combination of 120cm with 120 cm spacing (Table 2).These results are in accordance with the findings of Rao (1988).
Table 1. Mean effect of row and plant spacing on plant height and number of leaf per plant of castor variety, grown at Melkassa
Intrarow spacing
(cm)
Plant height (cm) and number of leaf per plant, respectively
120 100 75 Mean
Height Leaf per plant Height Leaf per
plant Height Leaf per plant Height Leaf per
plant
50 120ab 26.6 105bcd 26.7 118ab 25.7 114.0 26.3 75 102cd 27.0 100cd 24.8 106bcd 22.8 102.6 24.5 100 91d 22.8 95cd 25.9 101cd 24.8 96.0 24.5 120 96.7cd 25.0 123a 23.7 110abc 26.7 110.0 25.0 Mean 102.4 25.4 105.7 25.3 108.7 25.0 105.6 25.2
Means with the same letters within a column do not differ significantly (p>0.05).
Determination of plant population, planting and leaf harvesting date for castor is very important for obtaining optimum leaf yield for the production of reasonable amount of cocoon. It can be maximized by using optimum plant population, appropriate planting/sowing date, quality seed and recommended fertilizer rate and weeding practices. Practicing optimum spacing can significantly improve leaf yield. Kittock and Williams (1970), studied the effect of plant population on the yield and yield components of castor in irrigated and non-irrigated castor and showed the optimum plant population of dwarf irrigated castor was 55,000 plants/ha. Row spacing from 0.5m to 1m did not affect yield if plant population was held constant or narrow intra row spacing.

244
Table 2. Mean effect of row and plant spacing on fresh and dry leaf weight castor variety, grown at Melkassa
Intrarow spacing
(cm)
Inter Row Spacing (cm) in fresh and dry leaf weight (kg/ha)
120 100 75 Mean
Fresh Dry Fresh Dry Fresh Dry Fresh Dry
50 10625ab 2055bc 10081ab 2304ab 13295a 2912a 11334 2422.0
75 8705b 1896bc 9182ab 1872.8bc 10437ab 2335ab 9441 2034.6
100 9056b 1688bc 7467b 1775bc 7969b 2180abc 8164 1880.8
120 6376b 1460c 8628b 1598bc 8669b 1715bc 7891 1591.0
Mean 8690.5 1773.4 8839.5 1887.5 10092.2 2285.4 9207.4 1982.1
Means with the same letters within a column do not differ significantly (p>0.05). Solomon 1988, tested the castor plants vary in size from short annuals to small tree like plants, therefore, row and plant spacing will have significant effect on yield and yield components. Getnet et al., 2013 also reported that 80cm row with 50 cm plant spacing is optimum for top branching castor of Hiruy variety. The current study showed that, plant and row spacing/treatment combinations of 75 cm x 50cm or a plant population of about 26,670 plants per hectare gave better results as compared to the other combinations. Ghose and Patra (1994) also reported, the closer crop geometry of 90 x 90 cm noted perceptibly higher leaf area index and at harvest stages, respectively, compared to all other treatments imposed. The treatment with wider square planting of 150 x 150 cm with 125% NK application and mechanical weeding registered persistently lower leaf area index at all the crop growth stages of crop growth. The increase in leaf area index under closer spacing throughout the growth period was due to increased number of plants unit area-1 and in turn more number of leaves per unit area. For leaf harvesting and planting dates, the stage of growth at harvesting and method of harvesting have great impact on final yield. There were no significant differences among treatments in all the parameters during different leaf harvesting periods. The data indicated that from 10 weeks up to 20 weeks after planting, did not have any variability on plant height, number of leaves and branch (Table 4). However, leaf harvesting date at, significant differences (P<0.05) was observed in 20 weeks after planting between treatments in terms of fresh and dry leaf weight.

245
Leaf harvesting dates from 10 to 18 weeks gave similar yield in fresh (4438 to 6441 kg/ha) and dry leaf weight (2521 to 3709 kg/ha). With regard to biotic factors, rust was the major disease in all the treatments and there was a reduction of edible leaf area (up to 57%) for silk worms in all the years of the experiment The three years results showed that starting of first leaf harvesting of castor at 10 weeks after planting is advisable for the feed of eri-silkworms to obtain the optimum production of cocoon. Moreover, in planting date, significant differences (P<0.05) were observed among treatments in the study period (Table 3). Optimum sowing dates were studied for most oil seeds at major growing areas (Nigussie et al., 1992a). The recommended sowing dates for oilseeds are still good information during normal/good years although, range of sowing dates were identified no one can be certain whether there will be sufficient moisture or not during that period. Sowing between late June to early July for higher altitudes (>2000masl) mid to late June for the lower altitudes (< 2000 masl) areas in the central highlands mid-July, Western and South-western and early to mid-July for the North western were found optimum for the production of late maturing (Hiruy 1988).
Table-3 Mean effect of planting dates on agronomic and yield characters of castor at Melkassa
Planting date
Plant height (cm)
NLPP Number of branch Fresh leaf
yield ( kg/ha)
Dry leaf yield
(kg/ha) SY
(t/ha) DI (%)
DS (%)
1ry 2ry
Late May 138bc 19b 5.8b 2ab 6135bc 1481ab 1.1a 20b 15 Early June 166ab 23ab 8.0b 3.2a 7816ab 1867a 1.3a 30a 14.7 Late June 186a 25a 6.5ab 1.9b 8223a 2037a 1.2a 28ab 19.0 Early July 147abc 18bc 5.0b 2.2a 7432ab 1977a 1.1a 26ab 15.7 Late July 111cd 14cd 4.7b 1.4bc 4212cd 1138bc 0.8b 24ab 15.0
Early Aug. 83d 10d 2.9c 0.7c 3609d 764c 0.6b 26ab 21.7 10 LSD 42 5 1.8 1.2 2080.9 624.5 0.27 7.7
CV % 17 14.4 18 35 18 22.2 14 16.5 33
NLPP= Number of leaf per plant, SY=Seed yield, DI= Disease incidence, DS= Disease severity. Means with the same letters within a column do not differ significantly (p>0.05).

246
Although a range of sowing dates should be identified, no one can be certain whether there will be sufficient moisture or not during that period. Planting date at 1st-2nd week of June to 1st-2nd week of July gave higher and equal amount of fresh and dry leaf weight, plant height, production of branch, number of capsule and seed weight as compare to other treatments (Table 4). Though, significant differences were not observed among treatments in infestation of rust disease on castor. Our findings are in line with Reddy et al. (2007) who reported that castor crop sown during July gave the highest yield as compared to the crop sown in August.
Table-4 Mean effect of leaf harvesting date on agronomic and yield
characters of castor at Melkassa
Leaf harvesting
ages (Weeks)
PH (cm) (NS)
NLPP (NS)
Number of branches Fresh leaf yield
(kg/ha)
Dry leaf yield
(kg/ha)
SY (t/ha) (NS)
DI (%) DS (%) (NS)
10ry branch 2ry branch
10 135 19 7.5ab 4.7 5962a 3620a 1.1 51ab 57 12 137 20 6.8ab 5 5815a 3209a 1.1 41ab 57 14 141 21 5.7b 5 4438ab 2564ab 1.05 42ab 55 16 140 21 8.5a 6 6441a 3709a 0.98 36b 39 18 141 19 7.9a 5 4520ab 2521ab 1.1 48ab 57 20 142 18 6.9ab 5 3050b 1752b 1.06 53a 55
LCD 24 7.8 2 2 2376.7 1375 0.16 15 14 CV 9.5 21.8 15 23 26 26 8.3 18 14.6
PH=Plant height, NLPP= Number of leaf per plant, NCPP=Number of capsule per plant, SY=Seed yield, SW= Seed weight, DI= Disease incidence, DS= Disease severity, Means with the same letters within a column do not differ significantly (p>0.05).
Planting of castor at 3rd - 4th week of June gave maximum leaf yield (25 leaf per plant). Whereas, planting at 3rd-4th week of July and 1st-2nd week of August gave lowest and equal amount of fresh and dry weight. Sowing date and seed rate trials on rape seed of Castor conducted during 1970 to 1982 showed that yields were high when planted during the onset of the main rainy season (end of May to late of June) (Nigussie et al., 1992a) which was in agreement with our findings.

247
References
Dvaiah MC, GR Rajashekar, S Yelshetty, and R Govindan. 1985. “Growth and Silk Production in Samia cynthiaricini Boisduval (Lepidoptera: Saturniidae) Fed on Four Different Host Plants”. Indian J. Seric.,24, 33-35.
Getnet Alemaw, Abel Moges and DegeneAbera, 2013. Effect of Plant and Row Spacing on the yield and Oil Contents of castor (Ricinus communis L.) in the Central Rift Valley, Ethiopia. Eth. J. Agric. Sci. 24:155-162.
Gomez KA and AA Gomez. 1984. Statistical Procedures for Agricultural Research, 2ndEnd. John Willey and Sons, New York.
Ghose DC and AK Patra. 1994. Effect of plant density and fertility levels on productivity and economics on summer sesame (Sesamum indicum). Indian J. Agron., 39: 71-75.
Hiruy Belayneh, 1988. Niger seed in Ethiopia: history, research and improvement prospect, Proceedings of the 19th Crop Improvement Conference 22-26 April 1987 Addis Abeba Ethiopia.
Joshi KL 1992. Evaluation of Diets for Larvae of the Eri Silkworm, Samia cynthia ricini(Lepidoptera: Saturniidae). Ind. J. Seric. 31: 49-51.
Kittock DL and JH Williams 1970. Effects of Plant Population on Castor bean yield. Agronomy Journal . 62:527-529.
Nigussie Alemayehu and Yershanew Ashagrie. 1992a. Noug Agronomy Research in Ethiopia in Oilseeds research and development in Ethiopia, pp. 95-103 Proceedings of the First National Oilseeds Workshop, 3-5 December 1991, Addis Abeba, Ethiopia
Rao P. 1988. Production trends of high density grain as influenced by nitrogen, season, crop canopy and duration of low land irrigated paddy. Oryza., 25: 47-51.
Reddy DNR, YK Kotikal,. and M Vijayendra. 1989. “Development and Silk Yield of Eri Silkworm, Samia cynthia ricini (Lepidoptera: Saturnidae) as Influenced by the Food Plants”, Mysore J. agric. Sci., 23:506-508.
Reddy UVB, GP Reddy, and DS Reddy. 2007. Yield and oil content of castor varieties as influenced by planting dates. Indian J. Dryland Agri. Res. Dev., 22(1): 114-116.
Severino LS, L Dick, JD Marco Baldanzi, J.D. Magno Candido, Grace Chen, Willian Crosby, Tan D. Xiaohua He, P. Lakshmamma, C. Lavanya, Olga L.T. Machado, Thomas Mielke, MairaMilani, Travis D. Miller, J.B. Morris. 2012. A Review on the challenges for Increased Production of Castor. Agronomy Journal 104 (4): 853-880.
Solomon Eshete. 1988. Sunflower (Helianthus annus L.) research achievements and future prospects Proceedings of the 19th Crop Improvement Conference 22-26 April 1987 Addis Ababa Ethiopia, pp 292-300.

248
Soratto RP. 2011. Low-height castor bean row spacing and plant population for mechanical harvest. Pesquisa Agropecuaria Brasileira, 46 (3): 245-253.
Singh, BK and PK Das, PK. 2006. Prospects and problems for development of eri culture in non- traditional states. Proceeding of Regional seminar on Prospects and problems of sericulture an economic enterprise in NorthWest India. Held at Dehradun 11th -12th November, pp 312-315.
Weiss EA. 1980. Oil seed Crops, Second Edition, Blackwell Science Ltd, Oxford, England.
Zimmerman LH, MD Miller, and PF Knowles, 1958. Castor bean in California. Calif. Agr. Expt. Sta. pp 460-468.

249
Feed Consumption and Feeding Frequencies of Eri and Mulberry Silkworms
Ahmed Ibrahim, Abiy Tilahun, Metasebia Terefe and Kedir Shifa
Ethiopian Institute of Agricultural Research, Melkassa Research Center Email – [email protected]
Introduction The quality and quantity of feed plants can play an important role in growth and development of silkworm, particularly during adult and larval stage, which in turn influence the expression of cocoon productivity traits. This also leads to the increase in body size and dry weight of cellular mass which are dependent on the rate of metabolism, absorption of nutrients, and stage of development. In recent times, there has been a remarkable improvement in the production of silk by domestic silkworms (Hanifa et.al, 1988). Success of silkworm crops depends upon spacing given, feed quality, frequency of feeding and environmental conditions in each instars in the rearing bed. Feeding frequency and overcrowding in rearing bed affects the economics of cocoon crop significantly as over feeding leads to leaf wastage and higher leaf cocoon ratios. While overcrowding of silkworm in rearing bed leads to insufficient consumption of feeds, poor growth and higher incidence of disease, resulting in low cocoon yield of inferior cocoon quality (Krishnaswam et.al, 1977). Superior quality of silkworm feeds should be feeds to late age and young larvae and quantitative differences in feed influence both the larval growth and cocoon character of mulberry and Er-silkworms According to Krishnaswam et.al, 1978a, it is known that silkworm consumes 14% and 80% of the total quantity of leaf - in IV and V instars, respectively. As per the environmental conditions of different seasons, feed is given two times per day in rainy season, while three times per day in rainy season, while three times during winter season and summer seasons (Krishnaswam et.al, 1978a). Different feeding schedules are followed in different agro climatic zones of the world in which silkworm rearing would be practiced. If the temperature and humidity can be maintained at the desired level such

250
as 25-27 oc and 70-80 rh, respectively , four feeding per day in case of leaf feeding method for late age and three feedings per day in case of young age larvae system are advocated in summer season, while two feeding per day in rainy and winter seasons. However, depending on the the weather condition, it is desirable to increase or decrease the feeding frequency without affecting the quantum of feed required at a particular instars, which considerably affects the cocoon quality (Krishnaswam et.al, 1978b). The production of silk from lepidoptera insects in Africa, particularly in Ethiopia is still infancy in comparison to other developing countries like China, India and other European Countries. The major cause for the underdevelopment of silk production in Ethiopia is lack of extension and management practices to produce quality silk. In Ethiopia production of silk was started during the Italian invasion in 1936 and discontinued when the Ethiopian heroes drove out the Italian invaders during 1941. The silk production experiment was re-started in 1990 by Melkassa Agricultural Research Center although there are some major constraints to boost the production. Among these problems lack of management practices including determination of quantity of feed per day and feeding frequencies are factors that hinder silk production of. Therefore, it is crucial to determine quantity of feed required per day for each instars of silkworms and feeding frequencies according to environmental conditions of the study area. Thus, this experiment was proposed to determine quantity of feed required and feeding frequencies for castor and mulberry silkworms according to the environmental conditions of the study area. Material and Methods The experiments were conducted at Melkassa Agricultural Research Center, in sericulture and apiculture research laboratory during 2011-2013. Prior to experimentation daily feed consumption rate were determined for both Eri and Mulberry silkworms. To determine the quantity of feed for each instar, five feeding trays which are having equal amount of larvae were used and equal amount of feeds were given. The feed/leaf was added for each treatment immediately after they finished during the larval growing period for both day and night until all the larvae moved to spinning. Rearing bed space and silk ratios

251
were taken to evaluate the daily quantity of feed determination. Based on daily feed consumption determined, five different feeding frequencies (one, two, three, four and five times feeding per day) were evaluated to determine number of possible time of feeding under normal laboratory environmental conditions. Ply wood made feeding tray with the sizes of 90 cm x 60 cm were used to conduct the experiment. On each feeding tray 400 hundred larvae’s were put to evaluate the number of feeding times. The treatments were laid out in randomized block design with four replications. Daily temperature and relative humidity were recorded during the experiment. Silkworm mortality percentage in each instar (1st, 2nd, 3rd, 4th and 5th), larval period, and weight of matured larvae, average filament length and silk ratios were used to evaluate the feeding frequencies. Any dead larvae’s observed during data collection were replaced from the larvae’s of the same age and species types from other feeding trays with the collected data for the feeding frequencies were subjected to SAS 6.12 software. Results and Discussions Daily feeding quantum required and bed space for both mulberry (bivoltine, multivoltine) and Eri-silkworm (Eri India and Eri 3.4) instars are indicated in Tables 1 and 2. Both rearing bed space and amount of feeds required for all the three species were recorded differently, for the reason that of different in their species and sizes. Depending on the larval age, the requirements in surface and space for silkworm rearing are presented in Table 2. For a normal and successful rearing, comfortable room for the rearing and growth of silkworm is a prerequisite. It appears that for young larvae, the needs in surface and space are small and the 5th instar requires more surface and space, but this is for only few days (6-7 days) (Table 1). Eri and Mulberry silkworm larval mortality were higher in one and two times feeding/day for all instars, except in the 1st instars of the two times feeding/day (Figures 1and 2). However, larval mortality was lower in three, four and five times feeding per day in all instars (Figures 1 and 2). According to Kirishnaswami et al., 1971, the healthy growth of the silkworms and ultimately the economic traits such as cocoon yield, shell weight, larval weight and silk percentage are negatively influenced by less feeding frequency per day.

252
Table 1. Recommended quantity of mulberry and castor leaf required per day for each instar of 100 eggs/larvae of Mulberry bivoltine, mulbery multivoltine and Eri silkworms (Average of five treatments).
Instars days Quantity of mulberry (g)
(Mulberry bivoltine)
Quantity of mulberry (g)
(Mulberry muoltivoltine)
Quantity of mulberry (g)
(Eri India and 3.4)
I
1 4.0 2.0 3.8 2 5.6 3.6 5.3 3 6.9 4.9 6.6 4 1.9 1.0 3.4 5 1.5 1.5 2.5
Total 19.6 13.0 21.6
II
1 12.5 11 32.1 2 17.5 14.5 34.5 3 5 2.0 6.1
Total 62.07 27.5 72.7
III
1 35 15 68.74 2 55 35 75 3 54 24 78 4 17.5 13.5 56.9
Total 161.5 161.5 278.64
IV
1 70 40 097 2 130 210 242 3 155 150 285
Total 355 400 624
V
1 210 210 450 2 300 220 640 3 450 350 750 4 550 450 590 5 690 590 940 6 400 500 68
Total 2800 2320 4050 Total 3.39 kg 2.92kg 5.045kg

253
Figure 1. Effects of different feeding frequencies on different instars of Eri-silkworm larval mortality during summer and winter cropping seasons (combined Anova for both seasons)
Figure 2. The rate of mortality on mulberry silkworm affected by different
feeding frequencies (December – May)
0
5
10
15
20
25
30
35
One Two Three Four Five
Num
ber
of d
ead
larv
ae
Feeding frequency
1st instar dead larvae (no)2nd instar dead larvae (no)3nd instar dead larvae (no)4th instars dead larvae (no)5th instar dead larvae (no)
0
10
20
30
40
50
60
70
One Two Three Four Five
Num
ber o
f de
ad la
rvae
Feeding Frequency
1st instar dead larvae (no)
2nd instar dead larvae (no)
3nd instar dead larvae (no)
4th instars dead larvae (no)
5th instar dead larvae (no)

254
Significantly (P<0.01) higher larval period, lower weight of matured larvae, lower length of single cocoon thread and silk ratios are observed in one and two times feeding per day. However, significantly lower larval period, higher weight of matured larvae, higher length of single cocoon thread and higher silk ratios were recorded in four and five times feeding per day followed by three times feeding/day compared to one and two feeding per day (Tables 3 and 4). Krishnawami et al, (1977) reported that, three to four times feeding/day for Eri silkworms resulted in higher larval weight, lower larval mortality and shorter larval durations than two times feeding /day. Similarly, Das et.al, (1994) reported both Eri and mulberry feeding silkworm larval duration considerably extended in one and two times feeding/ day than 3, 4 and 5 times feeding/day. On the other hands, Krishnawami et al, (1977) reported that silkworm larval mortality was significantly very high in one and two times feeding/ day compared to 3, 4 and 5 times feeding/day.
Table 2. Recommended rearing bed space required for 100 eggs/larvae's of
Mulberry multivoltine, mulberry bi-voltine and Eri silkworms (Average of five treatments).
Instars Rearing bed space (sq.cm)
(Mulberry multivoltin) Rearing bed space (sq.cm)
(Mulberry bi-voltine) Rearing bed space (sq.cm)
(Eri India and 3.4)
At the beginning At the end At the beginning At the end At the beginning At the end
I 0.0024 0.0049 0.0027 0.0058 0.0037 0.0069
II 0.0049 0.0143 0.0058 0.0150 0.0069 0.0254
III 0.0143 0.0339 0.0150 0.0350 0.0254 0.0458
IV 0.0339 0.0649 0.0350 0.0689 0.0458 0.0856
V 0.0649 0.1289 0.0689 0.1392 0.0856 0.2457

255
Table 3. Effects of different feeding frequencies on larval period, weight of matured larvae, length of spinning thread and silk ratios of Eri - silkworm both during summer and Winter cropping seasons (combined Anova for both seasons).
Feeding per day
larval period (Days)
Wight of 10 matured
larvae 6 days after 4th molt
(g)
Length of the cocoon thread (m)
Silk ratio %
One time 29.00 +0.00a 48.67 +5.48c 4.45 +0.05e 9.91 +0.24b Two times 30.33 +0.88a 52.64 +2.96c 5.49 +0.12d 9.33 +0.13c Three times 24.66 +0.33b 66.66 +3.71b 6.70 +0.12c 11.03 +0.17a Four times 25.00 +0.57b 83.68 +2.40a 8.53 +0.08b 11.50 +0.14a Five times 23.66 +0.33b 85.36 +3.30a 8.99 +0.24a 11.41 +0.16a CV% 3.74 9.91 2.79 2.83 Means with the same letter within a column do not significantly differ at 1% level of probability (Student-Newman- Keul`s Range Test).
Significantly higher silkworm larval mortality was observed in four and five time feeding per day than the other treatments for 1st instars larvae (Table 5). Similarly, higher larval mortalities were obtained in two, three, four and five times feeding/day for 2nd instar. However, significantly higher mulberry feeding silkworm larval mortalities were recorded in one and two times feeding per day for 3rd, 4th and 5th instars than the other treatments (Table 5). Das et al, (1994) also reported that, higher mortalities and lower silk ratios were recorded in one and two times feeding/day than three and above feeding time/day. This study is also in agreement with Krishnaswami et al. (1977) who observed more matured larval weight in 2 times feeding/day with plucked leaves in the young age and 3, 4 and 5 times feeding/day with matured leaf from third and above instar larval period. Likewise, feeding frequencies of 3 and 4 times/day was found superior and resulted higher larval weight as shown in Das et al., (1994) and Chandrashekar, (1996). Rearing of silkworms with different feeding regimes caused marked influence on late age larval duration and overall larvae unlike its lower effect on young-age worms. The larval duration in the present study followed the trend observed in previous studies (e.g. Das et al., 1994; Chandrashekar, 1996). Haniffa et al. (1988) showed when the numbers of feeds were

256
reduced from 4 to 1 times feeding/day, the larval period was extended. Krishnaswami et al. (1978a; 1978b; 1980) also observed prolonged larval period as a result of under feeding.
Table 4. Effects of different feeding frequencies of mulberry silkworms on different parameters (December – May)
Feeding per day
larval period (days)
Wight of 10 matured larvae 6 days after 4th
molt (g)
Length of the cocoon thread
(m) Silk ratio %
One time 29.65 + 0.31 a 28.69 + 1.56 b 659.50 + 63.00 b 19.73 + 0.44 b
Two times 29.31 + 0.30 a 33.35 + 2.33 b 561.50 + 61.00 b 19.38 + 0.46 b
Three times 26.33 + 0.86 b 43.03 + 1.94 a 680.20 + 11.35 b 21.74 + 0.65 a
Four times 23.25 + 0.34 c 45.76 + 0.79 a 970.20 + 36.02 a 22.75 + 0.39 a
Five times 23.54 + 0.30 c 44.51 + 0.74 a 967.51 + 36.02 a 22.48 + 0.51 a
CV% 3.48 7.19 18.03 4.58 Means with the same letter within a column do not significantly differ at 1% level of probability (Student-Newman- Keul`s Range Test).
According to Anonymous (1987), shorter silkworm larval duration, higher larval weight and good quality were recorded in 3 and above feeding/day than one time feeding/day of mulberry silkworms. This study also showed that the number of feeding times per day increased from 3 to 4 times per day and from 2 to 3 times per day during winter cropping season for late and young age larvae’s, respectively. Whereas 3 and 2 times feeding per day during summer cropping season for late and young age larvae, respectively. This is for the reason that of higher leaf moisture losses during winter cropping season and lower moisture losses from the leaf during summer cropping season.

257
Table 5. Effects of different feeding frequencies on mulberry silkworm larval mortality (June-November)
Feeding per day
1st instar dead larvae
(No)
2nd instar dead larvae
(No)
3nd instar dead larvae
(No)
4th instars dead larvae
(No)
5th instar dead larvae
(No) One time 11.33 + 0.30b 1.78 + 0.00b 2.14 + 0.16a 11.00 + 0.58a 22.00 + 0.16a
Two times 3.12 + 0.31c 1.10 + 0.15c 2.13 + 0.13a 10.00 + 0.56a 11.66 + 1.20b
Three times 15.45 + 0.52a 1.11 + 0.16c 0.00 + 0.00b 0.00 + 0.00b 1.65 + 0.30c
Four times 16.00 + 0.51a 2.00 + 0.00a 0.00 + 0.00b 0.00 + 0.00b 2.00 + 0.00c
Five times 18.00 + 0.52a 2.20 + 0.10a 0.00 + 0.00b 0.00 + 0.00b 1.32 + 0.32c
CV% 8.15 11.49 16.71 14.08 19.10 Means with the same letter within a column do not significantly differ at 1% level of probability (Student-Newman- Keul`s Range Test).
References
Anonymous, 1987. Frequency of feed during youngage rearing. Annual Report, Central Sericultural Research and Training Institute, Mysore, p 38.
Chindrashelar S. 1996. Influence of feeding frequency based on feeding potential in late-age on performance of Bombyx mori L. M.Sc. thesis, University of Agricultural Sciences, Bangalore, p.76.
Das S, PK Saha, M Shamsuddin, and SK Sen. 1994. Feeding frequency- The economic potentiality and efficacy in tropical bivoltine rearing during the favourable season. Sericologia, 34: 533- 536.
Haniffa M, T Punitham, and Arunachalm, 1988. Effect of nutrition on survival, growth and reproduction in the silkworm, Bombyx mori L. Sericologia, 28: 563-575.
Krisshnaswami, S. 1978a. Mulberry Cultivation in South India. Bulletin No. 1, Central Sericultural Research and Training Institute, Mysore, p.19.
Krisshnaswami, 1971. Silkworm feeding traits for evaluating the quality of mulberry leaves as infulenced by variety, spacing and nitrogen fertilization. Indian journal of Sericulture. 10:79-89
Krisshnaswami S. 1978b. New Technology of Silkworm Rearing. Bulletin No. 2, Central Sericultural Research and Training Institute, Mysore, p.23.

258
Krisshnaswami S, KV Benchmain, RG Geethadevi, and R Raghuraman. 1980. Studies
on the effect of under feeding in silkworm - Evaluation of two methods of under feeding. Annual Report, Central Sericultural Research and Training Institute, Mysore, pp. 51-52.
Krisshnaswami S, K Singh, and R Raghuraman. 1977. Studies on improvement of rearing silkworm with special reference to mode of feeding, preservation of leaf quality and feeding regimes. Annual Report, Central Sericultural Research and Training Institute, Mysore, pp.108-110.
Sundararaj N, S Nagaraju, MN Venkataramu, and MK Jagannath. 1972. Design and Analysis of Field Experiments. Directorate of Research, University of Agricultural Sciences, Bangalore, p.419.