Results from Proposed ROHVA and OPEI Dynamic Maneuvers ...
34
Results from Proposed ROHVA and OPEI Dynamic Maneuvers – Vehicles A, F, and J for: Consumer Product Safety Commission November 2011 Vehicle Dynamics Division 7349 Worthington-Galena Rd. Columbus, Ohio 43085
Transcript of Results from Proposed ROHVA and OPEI Dynamic Maneuvers ...

Results from Proposed ROHVA and OPEI Dynamic Maneuvers
– Vehicles A, F, and J
for: Consumer Product Safety Commission
November 2011
Vehicle Dynamics Division 7349 Worthington-Galena Rd.
Columbus, Ohio 43085
Results from Proposed ROHVA and OPEI Dynamic Maneuvers
– Vehicles A, F, and J
for: Consumer Product Safety Commission
“These comments are those of S-E-A, Ltd. staff, and they have not been reviewed or approved by, and may not necessarily reflect the views of, the Commission.”
Report prepared by Gary J. Heydinger, Ph.D., P.E., with primary support from Ron Bixel, Hank Jebode,
Elaine Peterman and Anmol Sidhu
Vehicle Dynamics Division 7349 Worthington-Galena Rd.
Columbus, Ohio 43085

TABLE OF CONTENTS 1. OVERVIEW .................................................................................................................. 1 2. DYNAMIC TESTING................................................................................................... 2 3. DISCUSSION OF TEST RESULTS ............................................................................. 4 Appendix A: Results From Constant Steer Tests....................................................................... A-1 Appendix B: Results From Dropped Throttle J-Turn Tests........................................................B-1 Appendix C: Measurements Used to Determine Target Steering Wheel Angles for ROHVA Constant Steer Tests .........................................................................C-1

1
1. OVERVIEW This report contains results from measurements made by S-E-A, Ltd., for the U.S. Consumer Product Safety Commission (CPSC) under contract CPSC-S-10-0014, Modification 0004. This report covers two of the objectives of Modification 0004, namely:
• Conduct constant steer turns on an asphalt surface at a set turn radius of 25 ft. Increase speed until vehicle limit is achieved and dynamic data are recorded. (For this objective, tests were performed to evaluate a dynamic test protocol recommended by the Recreational Off-Highway Vehicle Association (ROHVA) in their December 22, 2010, Canvass Draft of the proposed American National Standard for Recreational Off-Highway Vehicles.)
• Conduct J-turns on an asphalt surface using drop throttle techniques and initiating 180
degrees of steering at a set speed of 20 mph. Use a steering controller to achieve accurate steer angles and consistent steering rate. (For this objective, tests were performed to evaluate a dynamic test protocol recommended by the Outdoor Power Equipment Institute (OPEI). On January 11, 2011, the CPSC staff received the second canvass draft of ANSI/OPEI B71.9-20XX, American National Standard for Multipurpose Off-Highway Utility Vehicles.)
S-E-A has conducted laboratory testing and dynamic testing on 10 recreational off-highway vehicles (ROVs) for CPSC. A previous report titled, “Vehicle Characteristics Measurements of Recreational Off-Highway Vehicles,” containing measurement results for nine vehicles (Vehicles A through I), was published in April 2011.1 A second report titled, “Vehicle Characteristics Measurements of Recreational Off-Highway Vehicles – Additional Results for Vehicle J,” contains results for measurements made on the tenth recreational off-highway vehicle.2 The vehicles tested under this portion of the contract modification are Vehicles A, F, and J; and they were selected for testing by CPSC. This report contains three main sections and three appendices that contain test results. The three report sections are Overview, Dynamic Testing, and Discussion of Test Results. Appendix A contains test results from the constant steer tests; Appendix B contains test results from the dropped throttle J-turn tests; and Appendix C contains measurements used to determine target steering wheel angles for the ROHVA constant steer tests.
1 Vehicle Characteristics Measurements of Recreational Off-Highway Vehicles, CPSC Contract CPSC-S-10-0014, S-E-A, Ltd. Report to CPSC, April 2011. http://www.cpsc.gov/library/foia/foia11/os/rov.pdf. 2 Vehicle Characteristics Measurements of Recreational Off-Highway Vehicles – Additional Results for Vehicle J, CPSC Contract CPSC-S-10-0014, S-E-A, Ltd. Report to CPSC, August 2011. http://www.cpsc.gov/PageFiles/93928/rovj.pdf.

2
2. DYNAMIC TESTING All of the dynamic tests were performed in one loading configuration, namely:
1. Operator, Instrumentation, and Outriggers This dynamic testing loading condition was specified to be the vehicle curb condition, plus the weight of the actual test driver, test instrumentation (including measurement transducers, data acquisition computer, S-E-A’s Automated Steering Controller (ASC), ASC controller box, and ASC battery box), and safety outriggers. Table 1 lists the nominal weights of the test driver and test equipment, including the outriggers. The total weight of the driver, instrumentation, and safety outriggers is nominally 426 lb, which is the same weight as two 213 lb occupants. This dynamic loading condition was designed to match as closely as possible the total weight of the Operator and Passenger (each weighing nominally 213 lb) loading condition used during previous laboratory testing. The test equipment and safety outriggers were adjusted so that the vertical, lateral, and longitudinal CG positions of the dynamic loading configurations would match those of Operator and Passenger loading configurations as closely as practically possible. This dynamic loading configuration is also referred to as the representative Operator and Passenger loading configuration.
Table 1: Weights of Driver and Test Equipment
Object Weight (lb) Test Driver with Helmet 182 ASC Handwheel Unit 34 ASC Battery Box 27 ASC Electronics Box and Cables 25 S-E-A Data Acquisition Computer 10 Auxiliary 12V Battery 25 RT3002 GPS/IMU, Antenna, and Cables 10 S-E-A Power Distribution Box and Misc. Straps 7 CPSC Triangulated Aluminum Safety Outriggers 106
Total Nominal Weight 426 The same test driver, test instrumentation, and CPSC outriggers that were used for previous testing of Vehicles A through J were used for the testing. The tests on Vehicles A and F were conducted on April 6, 2011, and the tests on Vehicle J were conducted on May 20, 2011. With one exception, all of the maneuvers were conducted on the flat, dry asphalt surface of TRC’s Vehicle Dynamics Area (VDA). The exception is that the constant steer tests for Vehicle J were conducted on a flat asphalt surface near the TRC Winding Road Course (the VDA was not available when these tests were conducted). Table 2 lists the instrumentation used during the dynamic testing. The RT3002 was mounted

3
near the CG of the vehicle. Nonetheless, the longitudinal, lateral, and vertical offsets from the center of the RT3002 to the actual vehicle CG location were measured and entered into the RT3002 system software. This information was used to translate the measured quantities to those at the CG of the vehicle. The longitudinal and lateral accelerations measured and reported here are accelerations parallel to the road plane, as opposed to vehicle body fixed accelerations. The vertical acceleration is the acceleration orthogonal to the longitudinal and lateral accelerations.
Table 2: Instrumentation Used During Dynamic Testing
Transducer Measurement Range Accuracy or Linearity
Longitudinal, Lateral, and Vertical Accelerations ± 10 g 0.1% 1σ
Roll, Pitch, and Yaw Rates ± 100 deg/s 0.1% 1σ
Speed No Limit Specified 0.2% 1σ
Roll and Pitch Angles No Limit Specified 0.03° 1σ
Oxford Technical Solutions
RT3002 Inertial and
GPS Navigation System
Vehicle Heading and Sideslip Angle No Limit Specified 0.1° 1σ
Encoder on S-E-A, Ltd. ASC Steering Wheel Angle + 800 deg + 0.25 deg

4
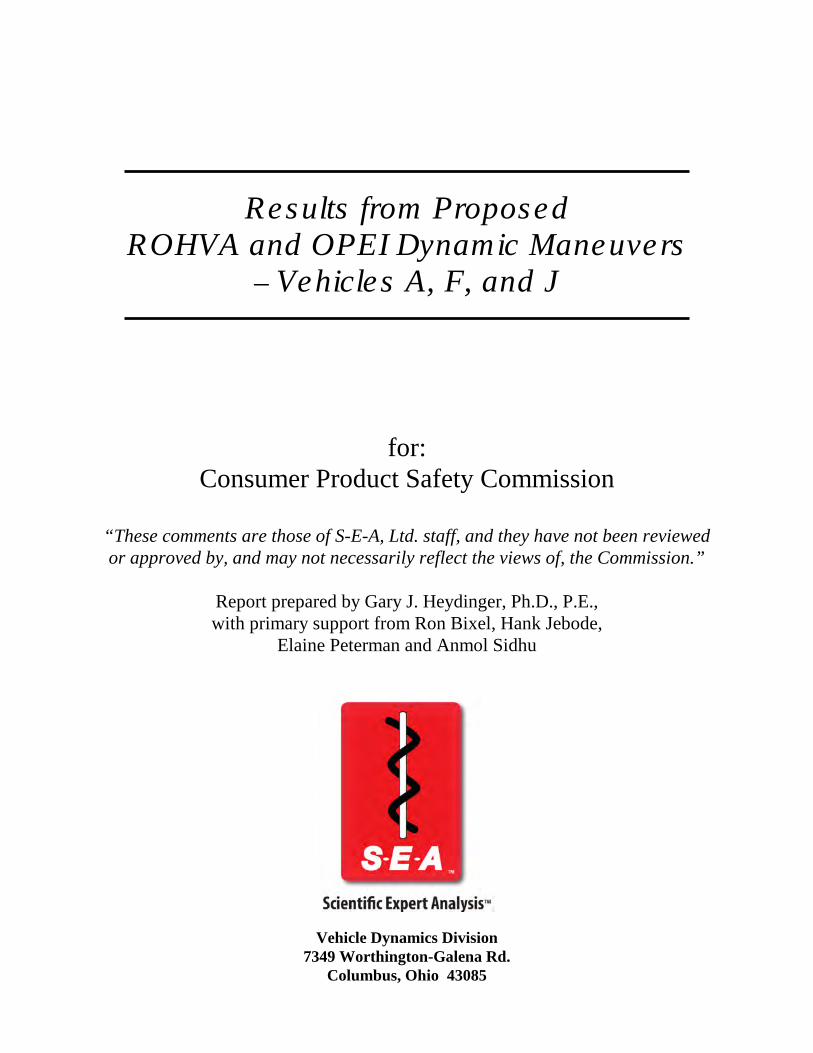
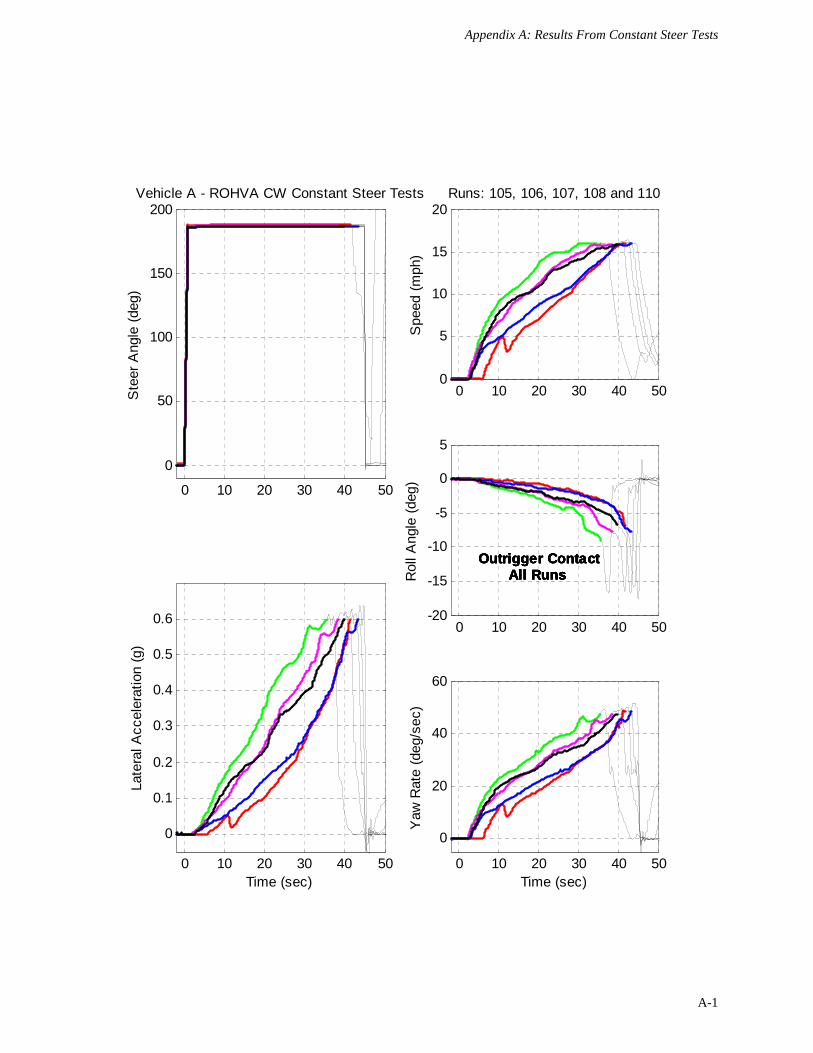
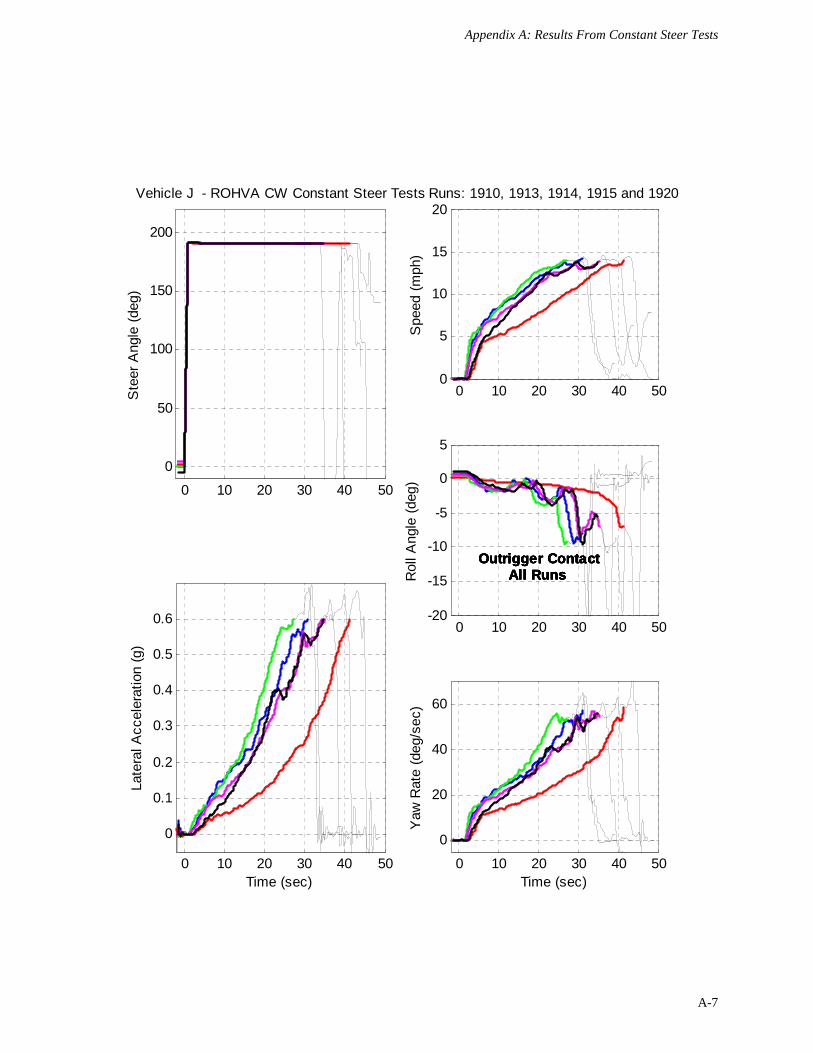
3. DISCUSSION OF TEST RESULTS Constant Steer Tests The constant steer tests involve turning the steering wheel to a fixed steer angle and then slowly increasing the speed of the vehicle from zero mph. The ROHVA protocol is to apply steady throttle input until the vehicle achieves a corrected lateral acceleration of 0.6 g; additional throttle input does not result in increased vehicle speed; or a two-wheel lift of two inches or more occurs. However, for these tests conducted for CPSC, throttle input was increased up to the limit of vehicle performance. In this case, resulting in a two-wheel lift, maximum speed, or spinout; and there was no attempt made to stop the tests at 0.6 g of corrected lateral acceleration. The fixed steering magnitudes used for these tests are based on the geometric Ackerman steering required to negotiate a circular turn of 25 ft radius. In their December 22, 2010, Canvass Draft report, ROHVA describes a method for determining the geometric Ackerman steering angle, and they refer to this angle as the Target Steering Wheel Angle. The ROHVA method to determine Target Steering Wheel Angle was used for this testing; and the measurements made to determine the Target Steering Wheel Angles for the three vehicles tested are contained in Appendix C. Appendix A contains the results from the constant steer tests. There are three pages of results for each of the three vehicles. The first page for each vehicle contains results from five constant steer tests conducted in the clockwise direction; and the second page for each vehicle contains results from tests conducted in the counterclockwise direction. The third page for each vehicle contains two graphs: the top graph is a plot of path radius versus corrected lateral acceleration, and the bottom graph is a plot of roll angle versus corrected lateral acceleration. The top graph is one of the typical plotting formats suggested by SAE J2663 for evaluating vehicle understeer gradient from a constant steer test. Each of the first two pages for each vehicle in Appendix A contains time domain plots of Steer Angle, (Corrected) Lateral Acceleration, Speed, Roll Angle, and Yaw Rate. All of the dynamic test data are sampled at 100 Hz. For the constant steer test results, the data shown were digitally low-pass filtered to 1.0 Hz using a phaseless, eighth-order, Butterworth filter. The time domain data shown for each vehicle contain data from 2.0 seconds prior to the time the steering was ramped to the Target Steering Wheel Angle, until 50.0 seconds after the start of the steering input. Notice that the steering angle is positioned to the Target Steering Wheel Angle and held there prior to the time at which the vehicle begins to speed up. The steering input is applied and held by S-E-A’s ASC and the test driver controls the vehicle speed. The thin black lines for the CW and CCW tests show the range of data from –2.0 to 50.0 seconds. The thicker colored lines indicate the range of data from –2.0 seconds until a corrected lateral acceleration of 0.6 g is achieved. On the third page for each vehicle, the top graphs contain understeer gradient characteristic curves showing path radius (path curvature) as a function of lateral acceleration. The “Radius” is computed using the relationship below, which is based on a vehicle operating at a steady-state condition. 3 SAE J266, Surface Vehicle Recommended Practice, Steady-State Directional Control Test Procedures for Passenger Cars and Light Trucks, 1996.

5
rV
Radius =
where:
Radius = Path Curvature (ft) V = Vehicle Speed (ft/sec) r = Yaw Rate (rad/sec)
These graphs contain data for all runs conducted in both the clockwise and counterclockwise directions. On these graphs, the thin colored lines show the raw data, and the thicker blue lines show second-order polynomial curve fits to the raw data. The range of raw data and curve fit data used is from a lateral acceleration level of 0.05 g up to the point where the vehicles reached their maximum speeds during each test. Regarding conducting constant steer tests for passenger vehicles, SAE J2664 states: “… speed may be steadily increased, at a rate not exceeding 1.5 km/h per second (0.93 mph per second) …”. At speeds beyond the range of 5 to 8 mph, the rates of speed increase during the constant steer tests conducted are much less than the J266 recommended maximum rate. Based on previous testing used to quantify understeer, all three vehicles (A, F, and J) were found to transition from understeer to oversteer during constant radius (100 ft) circle tests and constant speed (30 mph) tests. For the understeer gradient characteristic curves from the constant steer tests shown in Appendix A, a line with a slope of zero represents a neutral steer condition, the line with a positive slope represents an understeer condition, and a line with a negative slope represents an oversteer condition. Notice that a negative slope on these graphs indicates that the vehicle path follows a smaller path radius as the lateral acceleration increases. The red circles on these graphs show the radius (25 ft), based on the geometric Ackerman steering angle. The constant steer tests show that Vehicle A exhibited understeer at low lateral acceleration levels, and then transitioned to oversteer in the range of 0.25 to 0.30 g (Page A-3). Vehicle F exhibited oversteer at all lateral acceleration levels (Page A-6). Vehicle J exhibited near neutral steer at low lateral acceleration levels and then transitioned to oversteer (Page A-9). On the third page for each vehicle, the bottom graphs of roll angle versus corrected lateral acceleration are useful for determining when the roll angle of the vehicle increased toward impending tip-up. These graphs contain data for all runs conducted in both the clockwise and counterclockwise directions. On these graphs, the range of data shown is from a lateral acceleration level of 0.05 g up to the point where the vehicles reached their maximum speeds during each test. For Vehicle A, the bottom graph on Page A-3 shows that the tip-ups occurred at lateral accelerations slightly below 0.6 g in both the clockwise and counterclockwise directions. The graph on Page A-6 for Vehicle F shows that the vehicle did not tip-up onto the outriggers while the vehicle speed was increasing up to its maximum value during each test. For this vehicle, soon after the driver reduced the vehicle speed from its maximum, the yaw rate and lateral acceleration increased, the path curvature decreased, and the vehicle tipped up onto the
4 Ibid.

6
outriggers. For Vehicle J, the bottom graph on Page A-9 shows that the tip-ups occurred at lateral accelerations slightly below 0.6 g in the clockwise direction. In the counterclockwise direction, where the vehicle spun out, the roll angles were not large, and no tip-ups occurred. To minimize rear tire wear that occurred as a result of the spinouts, only four tests were conducted for Vehicle J in the counterclockwise direction. As mentioned previously, the ROHVA protocol is to apply steady throttle input until the vehicle achieves a corrected lateral acceleration of 0.6 g; additional throttle input does not result in increased vehicle speed, or a two-wheel lift of two inches or more occurs. In practice, segregating these three test-ending conditions from one another can be difficult to realize. Table 3 contains a summary of the constant steer tests conducted. The third column of Table 3 lists the ROHVA end conditions achieved for each vehicle in the clockwise and counterclockwise directions. All of the end conditions for Vehicle A in both turn directions are two-wheel lift (Pages A-1 and A-2). All of the end conditions for Vehicle F in both turn directions are maximum speed; however, this vehicle tipped up onto the safety outriggers once the driver slowed down the vehicle at the end of each run (Pages A-4 and A-5). All of the end conditions of Vehicle J in the clockwise direction are two-wheel lift (Page A-7). However, all of the end conditions for Vehicle J in the counterclockwise direction are maximum speed spinouts, characterized by the high yaw rates at the end of the maneuvers (Page A-8). During a constant steer test using the ROHVA protocol, it is difficult to monitor in real time precisely when 0.6 g of corrected lateral acceleration is achieved. It is difficult for a test driver, an off-board test observer, or using analytical methods to determine when the onset of a steady magnitude of 0.6 g of corrected lateral acceleration is first achieved. On-board accelerometers generally have high frequency content (noise) that makes getting real-time steady acceleration readings difficult. Also, sensors that measure body-fixed lateral acceleration need to be “corrected” by compensation for roll angle, which may hinder real-time monitoring. Corrected lateral acceleration can also be computed from the product of vehicle speed and yaw rate. These signals are also prone to typical measurement noise and actual vehicle oscillations during these tests when the vehicles are near their limits of performance in the range of 0.6 g. For these reasons, it is very difficult to repeatedly end the proposed ROHVA maneuver at 0.6 g of corrected lateral acceleration. For Vehicle A, two-wheel lift leading to outrigger contact started at corrected lateral accelerations just below 0.6 g in both the right and left steer directions. For this vehicle, two-wheel lift of two inches or more occurs very close to 0.6 g. For Vehicle F, in both the right and left steer directions, the driver sensed that the vehicle was at its maximum speed, and he slowed down to end the maneuver. As a result of dropping the throttle, the vehicle load transferred forward, yaw rate and lateral acceleration increased, the path curvature decreased, and the vehicle tipped up onto the outriggers. For this vehicle, maximum speed occurred very near 0.6 g; and slowing down from maximum speed resulted in tip-up onto the outriggers. For Vehicle J, in the right steer (clockwise) direction, two-wheel lift leading to outrigger contact started at corrected lateral accelerations below 0.6 g. However, in the left steer (counterclockwise) direction, the vehicle did not tip up, but rather, it spun out with the onset of spin out very near a lateral acceleration of 0.6 g.

7
The Vehicle A maneuver end conditions were two-wheel lift near maximum speed and 0.6 g lateral acceleration in both steer directions. The Vehicle F end conditions were maximum speed in both directions (which was also very close to 0.6 g lateral acceleration); but the vehicle tipped up onto the outriggers soon after the driver slowed down to end the maneuver. One of the Vehicle J end conditions was two-wheel lift in the right steer direction and maximum speed in the left steer direction. For this sample of three vehicles, in several cases multiple test end conditions occurred at nearly the same time, for one of the vehicles, a maximum speed test end condition was followed by a two-wheel lift end condition, and for one of the vehicles the test end conditions differed in the right and left steer directions. For these reasons, it appears that the proposed ROHVA test protocol end conditions can be difficult to segregate from one another and the test outcomes can differ for a single vehicle, depending on the direction of steer. Column four of Table 3 lists the ROHVA pass or fail outcomes for each vehicle in both steer directions. Vehicle A failed in both steer directions; Vehicle F passed in both directions (but these were followed by a failed conditions as the driver slowed down at the end of each run); and Vehicle J failed in the clockwise direction and passed in the counterclockwise direction.
Table 3: Summary of Constant Steer Tests Using Ackerman Geometric Steering Magnitude for 25 ft Radius Path
Vehicle Turn Direction Test End
Condition / Limit Response
ROHVA Test Pass/Fail
Outcome
Right (CW) Two-wheel Lift Fail Vehicle A
Left (CCW) Two-wheel Lift Fail
Right (CW) Maximum Speed* Pass** Vehicle F
Left (CCW) Maximum Speed* Pass**
Right (CW) Two-wheel Lift Fail Vehicle J
Left (CCW) Maximum Speed / Spinout Pass
*Maximum speed occurred very near 0.6 g of corrected lateral acceleration for Vehicle F.
**Two-wheel lift occurred for Vehicle F after the driver slowed from maximum speed at the end of the test.

8
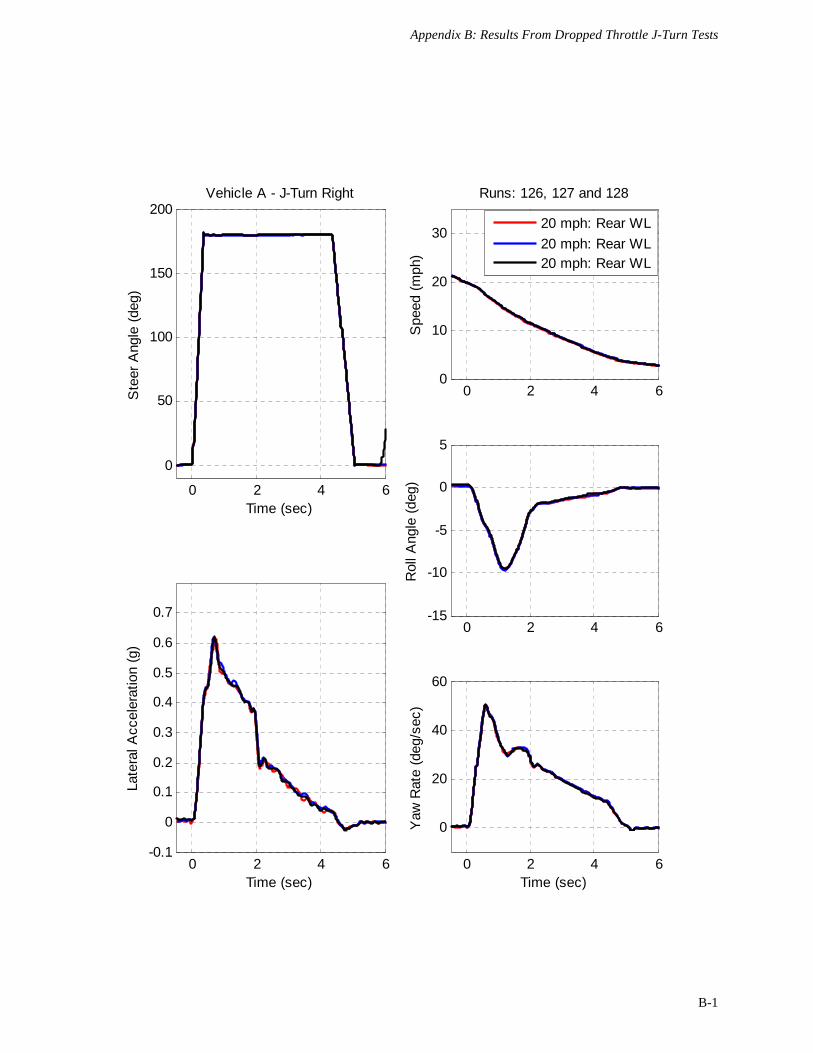
Dropped Throttle J-Turn Tests J-turn tests, often referred to as step steer tests, involve imparting a rapid steering input up to a fixed magnitude while the vehicle is traveling along a straight path. For the dropped throttle J-turn tests, the test driver drove each vehicle along a straight-line path at a speed slightly above the desired test speed. He then dropped the throttle and triggered the ASC to initiate the steering input precisely when the vehicle speed reached the desired test speed. The OPEI test protocol is to conduct the dropped throttle J-turn test at 20 mph and to use a steering magnitude of 180 degrees. A vehicle subjected to the proposed J-turn test would be considered to have acceptable lateral stability if it did not experience two-wheel lift of two inches or more during the test. For these tests conducted for CPSC, steering magnitudes of 180 degrees and steering rates of 500 deg/sec were used for all of the J-turn tests. Additionally, if a vehicle did not tip up at 20 mph, the test speed was increased in one mph increments to determine the speed at which moderate two-wheel lift would occur. In this case, moderate two-wheel lift means that at least two inches of simultaneous two-wheel lift occurred. Appendix B contains the results from the dropped throttle J-turn tests. Each page in Appendix B contains time domain plots of Steer Angle, (Corrected) Lateral Acceleration, Speed, Roll Angle, and Yaw Rate. All of the dynamic test data are sampled at 100 Hz. For the J-turn test results, the data shown were digitally low-pass filtered to 5.0 Hz, using a phaseless, eighth-order, Butterworth filter. The time domain data shown for each vehicle contains data from 0.5 seconds prior to the time of the J-turn steering until 6.0 seconds after the start of the steering input. Notice that once the steering angle reaches 180 degrees it is held there for a dwell time of 4.0 seconds. The steering input was applied and held by S-E-A’s ASC, and the steering was triggered at the precise desired speed by a speed signal sent to the ASC. There are four pages of results each for Vehicles A and F, and two pages for Vehicle J. The first two pages for Vehicles A and F contain results from three right turn, J-turn tests; and the third and forth pages contain results from three left turn J-turn tests. For Vehicles A and F, three repeat tests at 20 mph were conducted, and these are the results shown on the first and third pages for these two vehicles. These pages showing repeat runs conducted at 20 mph (Pages B-1 and B-3 for Vehicle A, and Pages B-5 and B-7 for Vehicle F) indicate that the vehicle responses and test outcomes from the dropped J-turn maneuvers are very repeatable. Table 4 contains a summary of the dropped throttle J-turn tests conducted. As indicated in the forth column of Table 4, all three of the vehicles tested passed the proposed OPEI test since they did not experience two-wheel lift of two inches or more during the tests conducted at initial test speeds of 20 mph. The third column of Table 4 shows the initial test speed that did result in two-wheel lift of two inches or more during the dropped throttle J-turn tests. As indicated in the table, all three of the vehicles experienced two-wheel lift of two inches during the tests conducted at a minimum speed of 21 mph, in either the right or left turn direction. Results from the tests conducted at initial test speeds above 20 mph, including the ones that resulted in moderate two-wheel lift (wheel lift of

9
two inches or more), are contained in Appendix B. The legends on the graphs in Appendix B indicate the test outcomes for each run. The outcomes listed are: Rear WL (only rear wheel lift), Slight 2WL (two-wheel lift of less than two inches), 2WL (two-wheel lift of two inches or more), and Outriggers (wheel lift much greater than two inches and high enough to cause contact of the safety outriggers with the test surface).
Table 4: Summary of Dropped Throttle J-Turns with 180 deg Steering at 500 deg/s
Vehicle Turn Direction Initial Speed Required for
Moderate 2WL
OPEI 20 mph Test
Pass/Fail Outcome
Right 22 mph Pass Vehicle A
Left 21 mph Pass
Right 21 mph Pass Vehicle F
Left 22 mph Pass
Right 21 mph Pass Vehicle J
Left 23 mph Pass
Appendix A: Results From Constant Steer Tests
A-1
0 10 20 30 40 500
5
10
15
20
Spe
ed (m
ph)
Runs: 105, 106, 107, 108 and 110
0 10 20 30 40 50
0
50
100
150
200
Ste
er A
ngle
(deg
)
Vehicle A - ROHVA CW Constant Steer Tests
0 10 20 30 40 50
0
0.1
0.2
0.3
0.4
0.5
0.6
Late
ral A
ccel
erat
ion
(g)
Time (sec)
0 10 20 30 40 50-20
-15
-10
-5
0
5
Rol
l Ang
le (d
eg)
Outrigger ContactAll Runs
Outrigger ContactAll Runs
Outrigger ContactAll Runs
Outrigger ContactAll Runs
Outrigger ContactAll Runs
0 10 20 30 40 50
0
20
40
60
Yaw
Rat
e (d
eg/s
ec)
Time (sec)
Appendix A: Results From Constant Steer Tests
A-2
0 10 20 30 40 500
5
10
15
20
Spe
ed (m
ph)
Runs: 111, 112, 113, 114 and 115
0 10 20 30 40 50-200
-150
-100
-50
0
Ste
er A
ngle
(deg
)
Vehicle A - ROHVA CCW Constant Steer Tests
0 10 20 30 40 50
-0.6
-0.5
-0.4
-0.3
-0.2
-0.1
0
Late
ral A
ccel
erat
ion
(g)
Time (sec)
0 10 20 30 40 50-5
0
5
10
15
20
Rol
l Ang
le (d
eg) Outrigger Contact
All RunsOutrigger Contact
All RunsOutrigger Contact
All RunsOutrigger Contact
All RunsOutrigger Contact
All Runs
0 10 20 30 40 50-60
-40
-20
0
Yaw
Rat
e (d
eg/s
ec)
Time (sec)

Appendix A: Results From Constant Steer Tests
A-3
-0.6 -0.4 -0.2 0 0.2 0.4 0.6-40
-30
-20
-10
0
10
20
30
40
Ay (g)
Rad
ius
(ft)
Vehicle A - ROHVA Constant Steer Tests
-0.6 -0.4 -0.2 0 0.2 0.4 0.6-10
-8
-6
-4
-2
0
2
4
6
8
10
Ay (g)
Rol
l Ang
le (d
eg)
Vehicle A - ROHVA Constant Steer Tests

Appendix A: Results From Constant Steer Tests
A-4
0 10 20 30 40 500
5
10
15
20
Spe
ed (m
ph)
Runs: 204, 205, 206, 207 and 208
0 10 20 30 40 50
0
50
100
150
200
Ste
er A
ngle
(deg
)
Vehicle F - ROHVA CW Constant Steer Tests
0 10 20 30 40 50
0
0.1
0.2
0.3
0.4
0.5
0.6
Late
ral A
ccel
erat
ion
(g)
Time (sec)
0 10 20 30 40 50-20
-15
-10
-5
0
5
Rol
l Ang
le (d
eg)
Outrigger ContactAll Runs
Outrigger ContactAll Runs
Outrigger ContactAll Runs
Outrigger ContactAll Runs
Outrigger ContactAll Runs
0 10 20 30 40 50
0
20
40
60
Yaw
Rat
e (d
eg/s
ec)
Time (sec)

Appendix A: Results From Constant Steer Tests
A-5
0 10 20 30 40 500
5
10
15
20
Spe
ed (m
ph)
Runs: 209, 210, 211, 212 and 213
0 10 20 30 40 50
-200
-150
-100
-50
0
Ste
er A
ngle
(deg
)
Vehicle F - ROHVA CCW Constant Steer Tests
0 10 20 30 40 50
-0.6
-0.5
-0.4
-0.3
-0.2
-0.1
0
Late
ral A
ccel
erat
ion
(g)
Time (sec)
0 10 20 30 40 50-5
0
5
10
15
20
Rol
l Ang
le (d
eg) Outrigger Contact
All RunsOutrigger Contact
All RunsOutrigger Contact
All RunsOutrigger Contact
All RunsOutrigger Contact
All Runs
0 10 20 30 40 50-60
-40
-20
0
Yaw
Rat
e (d
eg/s
ec)
Time (sec)

Appendix A: Results From Constant Steer Tests
A-6
-0.6 -0.4 -0.2 0 0.2 0.4 0.6-40
-30
-20
-10
0
10
20
30
40
Ay (g)
Rad
ius
(ft)
Vehicle F - ROHVA Constant Steer Tests
-0.6 -0.4 -0.2 0 0.2 0.4 0.6-10
-8
-6
-4
-2
0
2
4
6
8
10
Ay (g)
Rol
l Ang
le (d
eg)
Vehicle F - ROHVA Constant Steer Tests
Appendix A: Results From Constant Steer Tests
A-7
0 10 20 30 40 500
5
10
15
20
Spe
ed (m
ph)
Runs: 1910, 1913, 1914, 1915 and 1920
0 10 20 30 40 50
0
50
100
150
200
Ste
er A
ngle
(deg
)
Vehicle J - ROHVA CW Constant Steer Tests
0 10 20 30 40 50
0
0.1
0.2
0.3
0.4
0.5
0.6
Late
ral A
ccel
erat
ion
(g)
Time (sec)
0 10 20 30 40 50-20
-15
-10
-5
0
5
Rol
l Ang
le (d
eg)
Outrigger ContactAll Runs
Outrigger ContactAll Runs
Outrigger ContactAll Runs
Outrigger ContactAll Runs
Outrigger ContactAll Runs
0 10 20 30 40 50
0
20
40
60
Yaw
Rat
e (d
eg/s
ec)
Time (sec)

Appendix A: Results From Constant Steer Tests
A-8
0 10 20 30 40 500
5
10
15
20
Spe
ed (m
ph)
Runs: 1916, 1917, 1918 and 1919
0 10 20 30 40 50-200
-150
-100
-50
0
Ste
er A
ngle
(deg
)
Vehicle J - ROHVA CCW Constant Steer Tests
0 10 20 30 40 50
-0.6
-0.5
-0.4
-0.3
-0.2
-0.1
0
Late
ral A
ccel
erat
ion
(g)
Time (sec)
0 10 20 30 40 50-5
0
5
10
15
20
Rol
l Ang
le (d
eg)
0 10 20 30 40 50-150
-100
-50
0
Yaw
Rat
e (d
eg/s
ec)
Time (sec)
SpinoutAll RunsSpinoutAll RunsSpinoutAll RunsSpinoutAll Runs

Appendix A: Results From Constant Steer Tests
A-9
-0.6 -0.4 -0.2 0 0.2 0.4 0.6-40
-30
-20
-10
0
10
20
30
40
Ay (g)
Rad
ius
(ft)
Vehicle J - ROHVA Constant Steer Tests
-0.6 -0.4 -0.2 0 0.2 0.4 0.6-10
-8
-6
-4
-2
0
2
4
6
8
10
Ay (g)
Rol
l Ang
le (d
eg)
Vehicle J - ROHVA Constant Steer Tests
Appendix B: Results From Dropped Throttle J-Turn Tests
B-1
0 2 4 6
0
50
100
150
200
Ste
er A
ngle
(de
g)
Time (sec)
Vehicle A - J-Turn Right
0 2 4 6-0.1
0
0.1
0.2
0.3
0.4
0.5
0.6
0.7
Late
ral A
ccel
erat
ion
(g)
Time (sec)
0 2 4 60
10
20
30
Spe
ed (m
ph)
Runs: 126, 127 and 128
0 2 4 6-15
-10
-5
0
5
Rol
l Ang
le (d
eg)
0 2 4 6
0
20
40
60
Yaw
Rat
e (d
eg/s
ec)
Time (sec)
20 mph: Rear WL20 mph: Rear WL20 mph: Rear WL

Appendix B: Results From Dropped Throttle J-Turn Tests
B-2
0 2 4 6
0
50
100
150
200
Ste
er A
ngle
(de
g)
Time (sec)
Vehicle A - J-Turn Right
0 2 4 6-0.1
0
0.1
0.2
0.3
0.4
0.5
0.6
0.7
Late
ral A
ccel
erat
ion
(g)
Time (sec)
0 2 4 60
10
20
30
Spe
ed (m
ph)
Runs: 128, 129 and 130
0 2 4 6-15
-10
-5
0
5
Rol
l Ang
le (d
eg)
0 2 4 6
0
20
40
60
Yaw
Rat
e (d
eg/s
ec)
Time (sec)
20 mph: Rear WL21 mph: Slight 2WL22 mph: Outrigger

Appendix B: Results From Dropped Throttle J-Turn Tests
B-3
0 2 4 6-200
-150
-100
-50
0
Ste
er A
ngle
(de
g)
Time (sec)
Vehicle A - J-Turn Left
0 2 4 6-0.8
-0.7
-0.6
-0.5
-0.4
-0.3
-0.2
-0.1
0
0.1
Late
ral A
ccel
erat
ion
(g)
Time (sec)
0 2 4 60
10
20
30
Spe
ed (m
ph)
Runs: 132, 133 and 134
0 2 4 6-5
0
5
10
15
Rol
l Ang
le (d
eg)
0 2 4 6-60
-40
-20
0
Yaw
Rat
e (d
eg/s
ec)
Time (sec)
20 mph: Slight 2WL20 mph: Slight 2WL20 mph: Slight 2WL

Appendix B: Results From Dropped Throttle J-Turn Tests
B-4
0 2 4 6-200
-150
-100
-50
0
Ste
er A
ngle
(de
g)
Time (sec)
Vehicle A - J-Turn Left
0 2 4 6-0.8
-0.7
-0.6
-0.5
-0.4
-0.3
-0.2
-0.1
0
0.1
Late
ral A
ccel
erat
ion
(g)
Time (sec)
0 2 4 60
10
20
30
Spe
ed (m
ph)
Runs: 134, 135 and 136
0 2 4 6-5
0
5
10
15
Rol
l Ang
le (d
eg)
0 2 4 6-60
-40
-20
0
Yaw
Rat
e (d
eg/s
ec)
Time (sec)
20 mph: Slight 2WL21 mph: Outrigger22 mph: Outrigger

Appendix B: Results From Dropped Throttle J-Turn Tests
B-5
0 2 4 6
0
50
100
150
200
Ste
er A
ngle
(deg
)
Time (sec)
Vehicle F - J-Turn Right
0 2 4 6-0.1
0
0.1
0.2
0.3
0.4
0.5
0.6
0.7
Late
ral A
ccel
erat
ion
(g)
Time (sec)
0 2 4 60
10
20
30
Spe
ed (m
ph)
Runs: 227, 228 and 229
0 2 4 6-15
-10
-5
0
5
Rol
l Ang
le (
deg)
0 2 4 6
0
20
40
60
Yaw
Rat
e (d
eg/s
ec)
Time (sec)
20 mph: Rear WL20 mph: Rear WL20 mph: Rear WL

Appendix B: Results From Dropped Throttle J-Turn Tests
B-6
0 2 4 6
0
50
100
150
200
Ste
er A
ngle
(de
g)
Time (sec)
Vehicle F - J-Turn Right
0 2 4 6-0.1
0
0.1
0.2
0.3
0.4
0.5
0.6
0.7
Late
ral A
ccel
erat
ion
(g)
Time (sec)
0 2 4 60
10
20
30
Spe
ed (m
ph)
Runs: 229, 230 and 231
0 2 4 6-15
-10
-5
0
5
Rol
l Ang
le (d
eg)
0 2 4 6
0
20
40
60
Yaw
Rat
e (d
eg/s
ec)
Time (sec)
20 mph: Rear WL21 mph: 2WL22 mph: Outrigger

Appendix B: Results From Dropped Throttle J-Turn Tests
B-7
0 2 4 6-200
-150
-100
-50
0
Ste
er A
ngle
(deg
)
Time (sec)
Vehicle F - J-Turn Left
0 2 4 6-0.8
-0.7
-0.6
-0.5
-0.4
-0.3
-0.2
-0.1
0
0.1
Late
ral A
ccel
erat
ion
(g)
Time (sec)
0 2 4 60
10
20
30
Spe
ed (m
ph)
Runs: 232, 233 and 234
0 2 4 6-5
0
5
10
15
Rol
l Ang
le (
deg)
0 2 4 6-60
-40
-20
0
Yaw
Rat
e (d
eg/s
ec)
Time (sec)
20 mph: Rear WL20 mph: Rear WL20 mph: Rear WL

Appendix B: Results From Dropped Throttle J-Turn Tests
B-8
0 2 4 6-200
-150
-100
-50
0
Ste
er A
ngle
(de
g)
Time (sec)
Vehicle F - J-Turn Left
0 2 4 6-0.8
-0.7
-0.6
-0.5
-0.4
-0.3
-0.2
-0.1
0
0.1
Late
ral A
ccel
erat
ion
(g)
Time (sec)
0 2 4 60
10
20
30
Spe
ed (m
ph)
Runs: 234, 235 and 236
0 2 4 6-5
0
5
10
15
Rol
l Ang
le (d
eg)
0 2 4 6-60
-40
-20
0
Yaw
Rat
e (d
eg/s
ec)
Time (sec)
20 mph: Rear WL21 mph: Slight 2WL22 mph: Outrigger

Appendix B: Results From Dropped Throttle J-Turn Tests
B-9
0 2 4 6
0
50
100
150
200
Ste
er A
ngle
(de
g)
Time (sec)
Vehicle J - J-Turn Right
0 2 4 6-0.1
0
0.1
0.2
0.3
0.4
0.5
0.6
0.7
Late
ral A
ccel
erat
ion
(g)
Time (sec)
0 2 4 60
10
20
30
Spe
ed (m
ph)
Runs: 1984, 1985 and 1956
0 2 4 6-15
-10
-5
0
5
Rol
l Ang
le (d
eg)
0 2 4 6
0
20
40
60
Yaw
Rat
e (d
eg/s
ec)
Time (sec)
20 mph: Rear WL21 mph: 2WL22 mph: Outrigger

Appendix B: Results From Dropped Throttle J-Turn Tests
B-10
0 2 4 6-200
-150
-100
-50
0
Ste
er A
ngle
(de
g)
Time (sec)
Vehicle J - J-Turn Left
0 2 4 6-0.8
-0.7
-0.6
-0.5
-0.4
-0.3
-0.2
-0.1
0
0.1
Late
ral A
ccel
erat
ion
(g)
Time (sec)
0 2 4 60
10
20
30
Spe
ed (m
ph)
Runs: 1986, 1987 and 1988
0 2 4 6-5
0
5
10
15R
oll A
ngle
(deg
)
0 2 4 6-60
-40
-20
0
Yaw
Rat
e (d
eg/s
ec)
Time (sec)
20 mph: Rear WL23 mph: 2WL24 mph: Outrigger

Appendix C: Measurements Used to Determine Target Steering Wheel Angles for ROHVA Constant Steer Tests
C-1
-400 -300 -200 -100 0 100 200 300 400-40
-30
-20
-10
0
10
20
30
40
Rig
ht W
heel
Ste
er A
ngle
(d
eg)
Vehicle A - Steering Ratio - ROHVA Method - 25 ft Radius Circle
Right Steering = 182.4 deg
Left Steering = -193.1 deg
Wheelbase = 6.26 ft
Circle Radius = 25.0 ft
Ackerman Angle = 14.1 deg
-400 -300 -200 -100 0 100 200 300 400-40
-30
-20
-10
0
10
20
30
40
Steering Wheel Angle (deg)
Left
Whe
el S
teer
Ang
le (
deg) Right Steering = 192.1 deg
Left Steering = -182.6 deg
Target Steering Wheel Angle = 187.5 deg

Appendix C: Measurements Used to Determine Target Steering Wheel Angles for ROHVA Constant Steer Tests
C-2
-400 -300 -200 -100 0 100 200 300 400-40
-30
-20
-10
0
10
20
30
40
Rig
ht W
heel
Ste
er A
ngle
(d
eg)
Vehicle F - Steering Ratio - ROHVA Method - 25 ft Radius Circle
Right Steering = 210.6 deg
Left Steering = -220.6 deg
Wheelbase = 6.25 ft
Circle Radius = 25.0 ft
Ackerman Angle = 14.0 deg
-400 -300 -200 -100 0 100 200 300 400-40
-30
-20
-10
0
10
20
30
40
Steering Wheel Angle (deg)
Left
Whe
el S
teer
Ang
le (
deg) Right Steering = 218.4 deg
Left Steering = -209.7 deg
Target Steering Wheel Angle = 214.8 deg

Appendix C: Measurements Used to Determine Target Steering Wheel Angles for ROHVA Constant Steer Tests
C-3
-400 -300 -200 -100 0 100 200 300 400-40
-30
-20
-10
0
10
20
30
40
Rig
ht W
heel
Ste
er A
ngle
(d
eg)
Vehicle J - Steering Ratio - ROHVA Method - 25 ft Radius Circle
Right Steering = 179.3 deg
Left Steering = -196.5 deg
Wheelbase = 6.35 ft
Circle Radius = 25.0 ft
Ackerman Angle = 14.3 deg
-400 -300 -200 -100 0 100 200 300 400-40
-30
-20
-10
0
10
20
30
40
Steering Wheel Angle (deg)
Left
Whe
el S
teer
Ang
le (
deg) Right Steering = 202.0 deg
Left Steering = -186.7 deg
Target Steering Wheel Angle = 191.1 deg
![presentacion graduandos y egresados [Read-Only]docs.upra.edu/opei/pdf/estudios_institucionales/presentacion... · Prof. Soriel V. Santiago Gerena Directora, OPEI Presentación al](https://static.fdocuments.net/doc/165x107/5fc350af89b8f7293d5b9910/presentacion-graduandos-y-egresados-read-onlydocsupraeduopeipdfestudiosinstitucionalespresentacion.jpg)


![2Egresados 2006[1] PUBLICAR EN opei HOMEPAGE](https://static.fdocuments.net/doc/165x107/6173ab32c9a23f1a79521b36/2egresados-20061-publicar-en-opei-homepage.jpg)