SOCIAL ECONOMIC CHARACTERISTICS OF THE STUDY POPULATIONS Household Composition Employment …

RESULTS
ATTRIBUTES OF FISH POPULATIONS
Species Composition
A total of 26 species of fish (kokanee and sockeye salmon counted
separately) were taken during the 1971 sampling program on the Okanagan basin
lakes (Table 1). Several other species are known to occur in the system, but
were not found in our survey. These include the bridgelip sucker (Catostomus
columbianus) which is recorded from Osoyoos Lake (and may have been confounded
with the longnose sucker in our records), tench (Tinca tinca) also from
Osoyoos Lake, and lake chub (Couesius plumbeus) from Okanagan Lake. Other
species possibly present but without definite record of occurrence include the
white sturgeon (Acipenser transroontanus), brook trout (Salvelinus fontinalis)
and coho salmon (Oncorhynchus kisutch).
At least 9 of the 26 species were caught in all of the lakes sampled

(Table 1), namely mountain whitefish, rainbow trout, kokanee, largescale
sucker, carp, squawfish, peamouth chub, chiselmouth and prickly sculpin.
Lake whitefish, which were introduced to the system in 1894, were not taken
during 1971 in Wood or Kalamalka lakes, nor were any caught there by netting
in 1929 or 1935 (Clemens et al. 1939). Only two pygmy whitefish were taken,
one from Skaha and one from Osoyoos Lake. This species had not been
recorded previously from the Okanagan system. Lake trout caught in
Kalamalka came from 1500 hatchery reared stock (Riding Mountain Park,
Manitoba via Jasper Hatchery). They were nearly 3 years of age when
introduced to the lake in October, 1970. Three juvenile chinook salmon were
caught in Osoyoos Lake, as well as four adult sockeye salmon.
Representatives of the catfish, perch, bass and sunfish families were
confined to the lower two lakes in the system except for pumpkinseed which
were found in Skaha as well. Pumpkinseed were not taken in Skaha during
extensive summer collections in 1948. Smallmouth bass have not been
recorded before from the system. Burbot were frequently caught in Okanagan
and Skaha but never in the other lakes. The slimy sculpin, seined from
Kalamalka and Okanagan lakes, had not been recorded previously in the
drainage.
Relative Abundance
1. Within-lake comparisons, 1971
Comparisons of relative abundance are possible between the two stations
in Kalamalka and in Skaha as well as between the eight Okanagan Lake
stations (Table 2). At Kalamalka, the south station consistently showed
larger catches than did the north for each of the seasons and for most of
the species, especially peamouth chub. Chi-square analyses showed

Table 1. Species1 of fish taken from Okanagan basin lakes at designated stations2 during the 1971 survey
1 listed as given in Carl et al. (1967) except for kokanee which herein is recognized
as a distinct form. 2 see Figure 1 for name and location

Table 2. Number of fish taken in combined spring, summer and autumn (standard) net sets at designated stations in Kalamalka, Okanagan and Skaha lakes.

that the differences in relative abundance of species were highly signi-
ficant (p < 0.001).
Although the north Okanagan station had the highest total catch,
this was chiefly a result of large kokanee catches in the autumn and of
lake whitefish throughout the netting period. Centre, Kelowna and Peach-
land stations were among the lowest in total catch. Indeed had not the
latter station shown an especially large kokanee catch in the autumn
(probably a result of its location near the mouth of a kokanee spawning
stream), it would have exhibited the lowest total catch. After excluding
kokanee and peamouth chub (schooling species probably not caught in gill
nets as independent individuals), a series of chi-square and F tests (by
chi-square rations; p = 0.05) were run on the Okanagan Lake stations to
determine appropriate within-lake groupings. Relative abundance of
species in catches at Whiteman and Centre were not significantly different
but together were so when compared with North or Peachland. Catches
combined for Kelowna and Mission did not differ significantly in relative
abundance from those at Peachland, whereas those at Hatchery and South did
when compared either to Peachland or to Kelowna. Catches of rainbow
trout, mountain whitefish and lake whitefish were generally higher in the
southern stations than those in central or northern regions of Okanagan
Lake. Thus combinations of northern (N, W, C), central (K, M, P) and
southern (H, S) stations would seem reasonable.
Although there were not large differences in total catch between
north and south Skaha Lake stations, those for rainbow trout, largescale

suckers and squawfish were higher in the north while the reverse was evident
for mountain whitefish and lake whitefish. Relative abundance of species
(with or without kokanee and peamouth chub) was significantly different (p <
0.001) between the two stations.
2. Between-lake comparisons, 1971
There were marked differences between the lakes in the total number
of fish caught in the standard net sets (Fig. 2). The lowest total catch was
from Wood Lake, followed by that at the south Kalamalka station. Those at
Kalamalka north as well as Okanagan C and K were only slightly higher, while
the highest catches in Okanagan itself came from the northern and southern
ends. Catches at both Skaha stations, the highest in the system except for
Vaseux, were nearly double those for most Okanagan stations. Those at Osoyoos
were lower than Skaha or Vaseux but higher than most from Okanagan Lake.
Summer catches in general were much lower than those in spring or autumn. In
some cases, notably some central Okanagan stations (M, P) autumn catches
(dominated by mature kokanee) far exceeded those in spring and summer
combined.
An independent measure of total fish abundance may be inferred from
echo sounder tracings (Fig. 3). These tracings show numerous inverted V
marks, most of which probably represent individual fish (Northcote et al.,
1964). Counts of such marks (Fig. 4) again show the Wood Lake station to be
the lowest, followed by those on Kalamalka. As previously indicated by
netting, the highest abundance of "fish" (marks) on Okanagan Lake occur near
its north and south ends. Surprisingly, the echo soundings did not

Fig. 2. Catch of fish in standard net sets at designated stations in
Okanagan basin lakes, 1971. The histogram shows total and
seasonal catch of all species; upper graph shows percent catch
of selected groups (salmonoids = Salmonidae + Coregonidae;
whitefish = mountain + lake + pygmy).

Fig. 3. Evening echo sounder traces at designated stations in the Okanagan basin lakes in summer, 1971. Time (Pacific Standard) tracing started shown below date; vertical line near offshore end indicates outer limit of netting station, depths in feet given at right of tracing; upper 3 meters not recorded by sounder.

Fig. 4. Number of "targets" (fish marks) counted on evening echo sounder
profiles at designated stations in Okanagan basin lakes, 1971.

record particularly large numbers of fish in either Skaha or Vaseux lakes.
Peamouth chub, which are especially numerous in the latter lake and which
migrate into near-surface layers in the evening (Northcote et al., 1964) in
some lakes, may not have been recorded by the sounder.
The relative abundance of salmonoids (as opposed to "coarse fish"
- largely catostomids and cyprinids) taken by netting in the basin lakes is
given in Fig. 2. Lowest percentages of salmonoids were taken in Wood and
Vaseux lakes (about 12 and 19 percent, respectively). In Kalamalka and in
all Okanagan stations except at the south end, salmonoids made up well over
40 percent of the total catch and usually over half of it. Their
contribution dropped to about a third in Skaha, but rose again to 40
percent in Osoyoos, largely a result of sizable kokanee catches there.
Whitefish were scarce in catches from Wood or Kalamalka lakes (Fig. 2) but
in the other lakes ranged between 8 and 25 percent of the total. Rainbow
trout contributed significantly to the catch at both Kalamalka stations and
as well to stations H and S at the southern end of Okanagan; elsewhere they
usually made up less than 2 percent of the total.
Three species of salmonoids (rainbow trout, kokanee, mountain whitefish)
and four of "coarse fish" were common to gill net catches from the major
basin lakes (Fig. 5). Highest and second highest total catches of
salmonoids invariably were taken in either Okanagan or Kalamalka lakes
whereas those for coarse fish always came from Skaha, Vaseux or Osoyoos
lakes. This trend generally applied to catches from each of the three
seasons considered separately (Fig. 5).

Fig. 5. Catch in standard gill net sets at designated stations (averaged for combinations shown) of seven species of fish common to the Okanagan basin lakes, 1971.

Lack of replication restricted opportunities to statistically
compare differences in relative abundance of species between the basin
lakes. An appropriate test was determination of F from the ratio of chi-
square values calculated between lakes and within lakes (Table 3).
Differences in relative abundance of species within the two stations for
Kalamalka and Skaha were large so that rarely could a statistically
significant difference be demonstrated between these stations and those
for other lakes. Okanagan Lake northern (W, C), central (K, M) and
southern (H, S) stations all showed significant differences in relative
abundance when compared with Skaha, Vaseux and Osoyoos stations.
Inspection of the contingency tables showed that larger catches of coarse
fish species relative to salmonoids in the latter lakes probably accounted
for most of the differences.
3. 1948 to 1971 comparisons
(a) Skaha Lake
Comparisons of species relative abundance between the 1971 netting program
and data collected by Ferguson (MS 1949) from Skaha Lake in the summer of
1948 can be made, but not without considerable adjustment for differences
in amount of net used, in depth distribution of the sets, and in type of
net webbing (cotton in 1948; monofilament nylon in 1971). Approximately the
same sequence of mesh sizes were fished in 1948 and 1971 but different
depths and lengths of net were used. The catch data from 1948 was
appropriately weighted to allow for differences in area of net fished.
Then for comparison with 1948 data, the most similar combination of depth
intervals from 1971 were selected and only catches from those sets

Table 3. Differences1 in relative abundance of species caught in standard
net sets in Okanagan basin lakes, 1971
1N.S. = not significant, p > 0.05; * = significant @ p < 0.05; ** = significant @ p < 0.01.

considered. Finally to adjust for differences in efficiency between
monofilament nylon and cotton webbing, the 1948 catches were quadrupled.
Molin (1953) gives data comparing catches in monofilament nylon nets
similar to those used in the 1971 Okanagan study with cotton nets. For
several Swedish lakes he showed that monofilament nylon nets usually took
more than 7 times the total catch of cotton nets, and 3.7 times more for
the three lakes roughly similar to Okanagan basin lakes in species
composition and other characteristics.
From the series of netting data available for 1948 (Ferguson, MS 1949) the
two sets were selected which most nearly approximated those made at the
north and south stations in summer, 1971. Then the 1948 catches were
appropriately adjusted for differences in net area and efficiency as
outlined above, and compared with the 1971 data (Table 4). Chi-square
tests show the difference between years (1948 > 1971) to be highly signi-
ficant (p < 0.001), although the data are sparse. Numbers of mountain
whitefish appear much lower in 1971 than 1948 at both stations. Also, no
carp were taken in any of the lake net sets (8 different series in all)
during the summer of 1948, although one was netted from the Okanagan River
nearby. Several were caught by lake netting in 1971. The combined catch
for both stations was somewhat lower in 1971 than in 1948 (adjusted
catches). Furthermore the contribution of salmonoids was considerably
lower in 1971 compared to 1948 (4.6% vs. 14.8%, respectively).
4. 1935 to 1971 comparisons
(a) Wood and Okanagan lakes
Adjustments similar to those described above for 1948 netting

Table 4. Number of fish taken in standard summer net sets near designated stations in Skaha Lake, 1948 and 1971
1 actual catch x 3 (net area adjustment) x 4 (webbing type adjustment). 2 actual catch x 2 (net area adjustment) x 4 (webbing type adjustment).

data from Skaha Lake were required for the 1935 data of Clemens et al.,
(1939) from Wood and Okanagan lakes (Table 5). There apparently were marked
differences in relative abundance at Wood Lake between years (pooled chi-
square significant @ p < 0.001), and even if adjustment factors are only
approximately correct, the 1935 catch would still far exceed that in 1971.
No carp were netted in the summer 1935 sets (although they were certainly in
the lake then) but 12 were caught in 1971. However, comparisons are based
on single sets with large adjustments required for 1935 data, so again the
changes apparent cannot be taken as any more than suggestive. The
contribution of salmonoids to total catch on each year was about the same
(2.3 and 2.4% for 1935 and 1971 respectively.
Somewhat more reliable comparisons of relative abundance can be
made between 1935 and 1971 for Okanagan Lake because more netting data are
available for the former year. There is little difference in total catch
(combined stations) between the two years (Table 5), although a pooled chi-
square test showed relative abundance by species to be significantly
different (p < 0.001). No carp were netted at any of the stations shown for
1935 (only one was caught in nets all that summer) whereas single summer
sets in 1971 took carp at three of the four 1971 stations shown (Table 5).
Otherwise little consistent difference is apparent in relative abundance
between each of the stations for 1935 and 1971.
Length-Frequency Distribution
1. Within-lake comparisons, 1971
There was no significant differences (p < 0.05) between the two
Kalamalka stations in average lengths of netted rainbow trout, mountain

Table 5. Number of fish taken in standard summer net sets near designated stations in Wood and Okanagan
lakes, 1935 and 1971
1 actual catch x 4.9 (net area adjustment) x 4 (webbing type adjustment) 2 actual catch x 3.4 (net area adjustment) x 4 (webbing type adjustment) 3 actual catch for [23 July (x 1.9 net area adjustment) + 24 July (x 1.5 net area adjustment) averaged with 20
August (x 1.9 net area adjustment) + 21 August (x 4.5 net area adjustment)] x 4 (webbing type adjustment) 4 actual catch for [11 August (x 0.4 net area adjustment) + 24 August (x 3.0 net area adjustment) + 26 August
(x 1.9 net area adjustment)] x 4 (webbing type adjustment) 5 actual catch x 3.0 (net area adjustment) x 4 (webbing type adjustment)

whitefish, largescale suckers, carp, peamouth chub or squawfish.
Kokanee and lake trout were the only species showing significant
differences, those from the southern station being larger.
For the Okanagan Lake stations where numbers were adequate to
permit comparisons (Fig. 6), there were no significant differences in
average length of rainbow trout caught. Kokanee from southern
stations (H, S) were significantly smaller than those from all other
stations, whereas for mountain and lake whitefish, largescale
suckers, peamouth chub and squawfish those from southern stations
were significantly larger than those from most other localities
sampled in Okanagan Lake.
For the two Skaha Lake stations no consistent pattern of differences
in size emerged, some species (kokanee mountain whitefish, peamouth
chub and squawfish) being significantly larger in the north, some
(lake whitefish and carp) being significantly larger in the south,
and others (rainbow trout and largescale sucker) showing no
significant differences.
2. Between-lake comparisons, 1971
Differences in average length of 8 species captured by netting in the
basin lakes (Fig. 6) were compared statistically; only some of these
will be noted specifically. Rainbow trout caught in Kalamalka were
significantly smaller than those from Okanagan stations (W, C, N, K,
M, P, H, S) but not Skaha or Osoyoos. Kokanee from Wood and
Kalamalka were significantly smaller than those from any of the other
lakes in the system except Osoyoos. Those from Skaha were the largest
in the system. The average length of mountain whitefish from
Okanagan increased towards the south; those from

Fig. 6. Length characteristics (based on 10 mm class intervals) of fish taken at standard net sets from Okanagan basin lakes at designated stations (arranged from uppermost to lowermost in the drainage system), 1971. Symbols:
= range; • = average; = 95% confidence intervals, where sample size (given at left) > 10; * = average length for lakes with 2 or more stations.
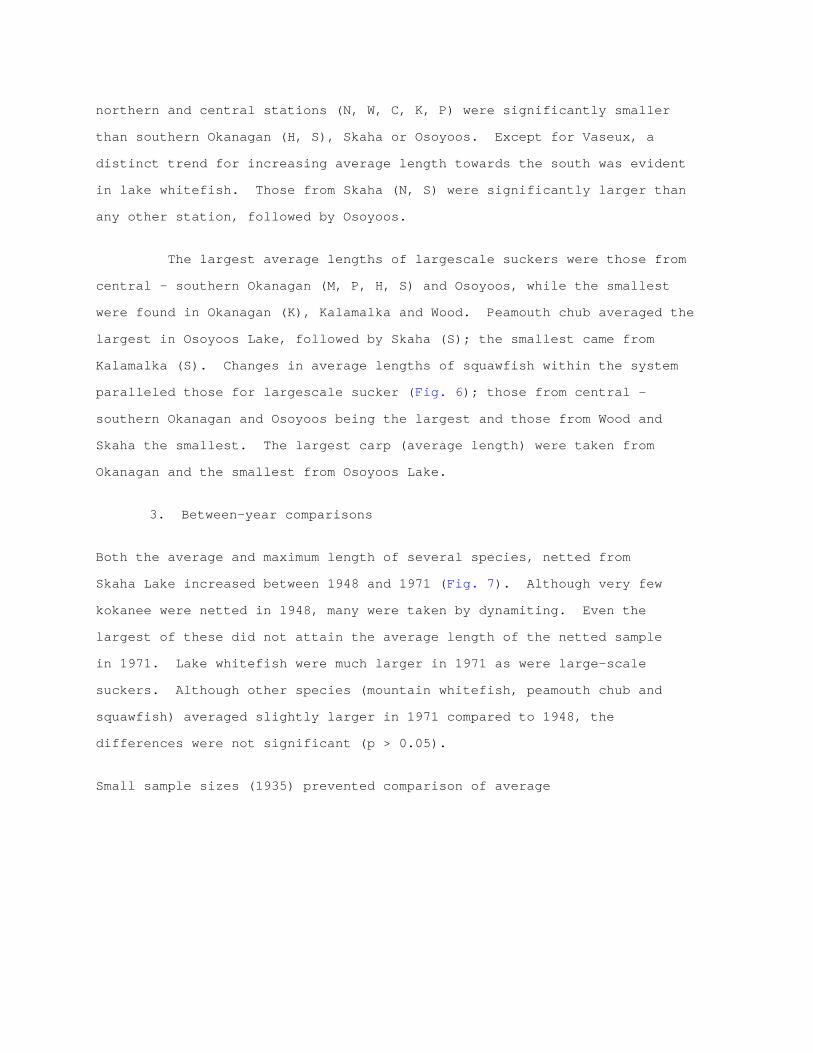
northern and central stations (N, W, C, K, P) were significantly smaller
than southern Okanagan (H, S), Skaha or Osoyoos. Except for Vaseux, a
distinct trend for increasing average length towards the south was evident
in lake whitefish. Those from Skaha (N, S) were significantly larger than
any other station, followed by Osoyoos.
The largest average lengths of largescale suckers were those from
central - southern Okanagan (M, P, H, S) and Osoyoos, while the smallest
were found in Okanagan (K), Kalamalka and Wood. Peamouth chub averaged the
largest in Osoyoos Lake, followed by Skaha (S); the smallest came from
Kalamalka (S). Changes in average lengths of squawfish within the system
paralleled those for largescale sucker (Fig. 6); those from central -
southern Okanagan and Osoyoos being the largest and those from Wood and
Skaha the smallest. The largest carp (average length) were taken from
Okanagan and the smallest from Osoyoos Lake.
3. Between-year comparisons
Both the average and maximum length of several species, netted from
Skaha Lake increased between 1948 and 1971 (Fig. 7). Although very few
kokanee were netted in 1948, many were taken by dynamiting. Even the
largest of these did not attain the average length of the netted sample
in 1971. Lake whitefish were much larger in 1971 as were large-scale
suckers. Although other species (mountain whitefish, peamouth chub and
squawfish) averaged slightly larger in 1971 compared to 1948, the
differences were not significant (p > 0.05).
Small sample sizes (1935) prevented comparison of average

Fig. 7. Average (•) and range ( ) in length of fish caught by standard net sets in Skaha Lake (Station N) in summer 1971 (upper) and 1948 (lower). Vertical marks on range line show 95% fiducial limits; sample size given at left; broken range line show statistics for 102 kokanee taken by dynamite blasting, summer 1948.

length of most species netted in standard sets from Wood or Okanagan lakesin
1935 and 1971. For peamouth chub (Fig. 8), a slight increase was indicated in
the 1971 Okanagan sample.
Weight-Length Relationships
1. Within-lake comparisons, 1971
Weight-length regressions (log10 data) were compared for the
salmonoids (kokanee, rainbow trout, mountain whitefish, lake whitefish) and
coarse fish (largescale suckers, peamouth chub, squawfish, carp) at north
and south stations in Kalamalka and Skaha lakes as well as for the 8
Okanagan Lake stations. Statistically significant differences (p < 0.05)
in slope of the weight-length regressions were found only for rainbow trout
(N > S) and peamouth chub (S > N) in Kalamalka Lake and for lake whitefish
(S > N) and largescale suckers (S > N) in Skaha Lake. Within Okanagan the
species showing the largest difference between stations was kokanee. Those
from stations K and M, while themselves not significantly different were
lighter in weight at the same length compared to the other 6 stations
(i.e., they had a lower regression slope). Although two other species,
mountain whitefish and squawfish, exhibited some significant differences in
slope of weight-length regressions, these were often a result of comparing
groups with widely disparate individuals.
2. Between-lake comparisons, 1971
Only 3 of the 4 salmonoids common to the lakes could be used for
comparisons with Wood Lake because of the small number of rainbow trout
taken there. In many (17 out of 27) of the comparisons with other lakes

Fig. 8. Average (•) and range ( ) in length of peamouth chub caught by
standard gill net sets in Wood Lake and Okanagan Lake (Stations K, M) in
summer, 1971 (upper) and 1935 (lower). Vertical marks on range line show
95% fiducial limits; sample size given at left.

where sample size was adequate, Wood Lake salmonoids and coarse fish either
had a lower weight-length regression slope or were distinctly lighter in
weight over most of the length range considered (i.e., showed negative
displacement). In no case did Wood Lake fish show higher regression slopes
or positive displacement compared with other lakes. Figure 9 shows a
typical example of a lower regression slope for Wood Lake kokanee compared
to those from Osoyoos Lake and of a negative displacement of the weight-
length regression for Wood compared to Skaha Lake carp (1971). Weight-
length regressions for Kalamalka fish were either lower than those in other
lakes (by slope or displacement) or showed no significant difference as in
that for squawfish in Figure 9. The only exception was shown in comparison
between Kalamalka and Wood lake regressions where in 4 of the 6 cases
Kalamalka had higher slope than Wood, and not significantly different in
the remaining 2. Weight-length regression lines for Okanagan species were
the same or higher than those for all lakes except Skaha. In most cases
fish from Skaha had the highest weight-length regression slope or positive
displacement; lake whitefish showed this most clearly (Fig. 9).
Regressions for Vaseux fish tended to fall below those for Okanagan, Skaha
and Osoyoos but were usually higher than Wood or Kalamalka. Those for
Osoyoos followed the same trend as Okanagan but with more cases of little
or no difference in slope or displacement.
3. Between-year comparisons
Weight-length regressions for Skaha kokanee, lake whitefish, (Fig.
9) peamouth chub and squawfish in 1971 showed significantly higher

Fig. 9. Typical weight-length regressions for selected species of fish from
the Okanagan basin lakes.

slopes or displacement than those in 1948. There was either no significant
difference in other species or data were inadequate for comparisons (carp).
The weight-length data for Wood Lake carp in 1935 suggest that
they then had a regression slope similar to that for Skaha in 1971 and
not nearly as low as that shown by present day Wood Lake carp (Fig. 9).
There has been no significant change in the weight-length regression
for Okanagan rainbow trout between 1935 and 1971 (Fig. 10).
Age-Length Relationships
1. Within-lake comparisons, 1971
For Kalamalka Lake there were no significant differences
between stations N and S in length for age groups where numbers were
large enough to permit comparison (age 4, 4 rainbow trout; age 3, 4
kokanee). Okanagan data were grouped into 3 regions - north (stations
N, W, C), central (stations K, M, P) and south (stations H, S). For
several age groups of rainbow trout and mountain whitefish there was a
trend towards increasing size from north to south in Okanagan Lake
(Fig. 11). Differences in average size of age groups were significant
for some of the trout comparisons (ages 2 and 5 between central and
south areas) and most of those for mountain whitefish (ages 3 and 4
between north, central and south areas), In contrast, 3 year old
kokanee were largest in the north area, especially those from stations
N and C; central and south areas kokanee were not significantly
different in size at age 3. There were no significant differences in
size of various age groups of lake whitefish between the three regions
of Okanagan Lake. Because of insufficient data no comparisons could be
made between Skaha Lake stations N and S except for 2 year old

Fig. 10. Weight-length regression of Okanagan Lake rainbow trout.

Fig. 11. Average size of different age groups of four Okanagan basin lake salmonoids in 1971. Sample size for age groups given at left; Okanagan north = Stations N + W + C; central = Stations K + M + P; south = Stations H + S.

kokanee; they showed no significant difference in average size.
2. Between-lake comparisons, 1971
Wherever sample size permitted, the average length of the various age
groups shown for the species in Figure 11 were compared statistically
between lakes or major lake areas (Okanagan). Most age groups of trout and
whitefish showed an obvious trend for increasing size from north to south.
Kalamalka trout (ages 3, 4, 5) were significantly smaller than those from
north and central Okanagan combined or from south Okanagan. Age 2 and 3
mountain whitefish from Skaha were significantly larger than those from
Okanagan Lake, as were all age groups of lake whitefish tested (ages 2-6).
The average size of whitefish, especially lake whitefish, sharply decreased
in Vaseux, compared to Skaha or Osoyoos lakes. Kokanee had the smallest
average size in Kalamalka and the largest in Skaha for all age groups (1-3)
where comparisons could be tested.
3. Between-year comparisons
All four Skaha Lake salmonoids showed significant increases in average
length especially in older age groups between 1948 and 1971 (Fig. 12),
despite small sample sizes on both years. Two year old mountain and lake
whitefish in 1971 averaged nearly as large as their respective 4 year olds
in 1948. No 3 or 4 year old kokanee caught in 1948 exceeded 240 mm in
length whereas in 1971 none was less than 290 mm, and many were over 350 mm
(some even at 2 years of age).
There has apparently been little change in the average length attained
by the various age classes of Okanagan mountain whitefish, lake

Fig. 12. Average and range (vertical lines) in length for designated age groups of Skaha Lake fish in 1948 (o) and 1971 (•). Sample size given near respective average. 1 refers to full years completed.
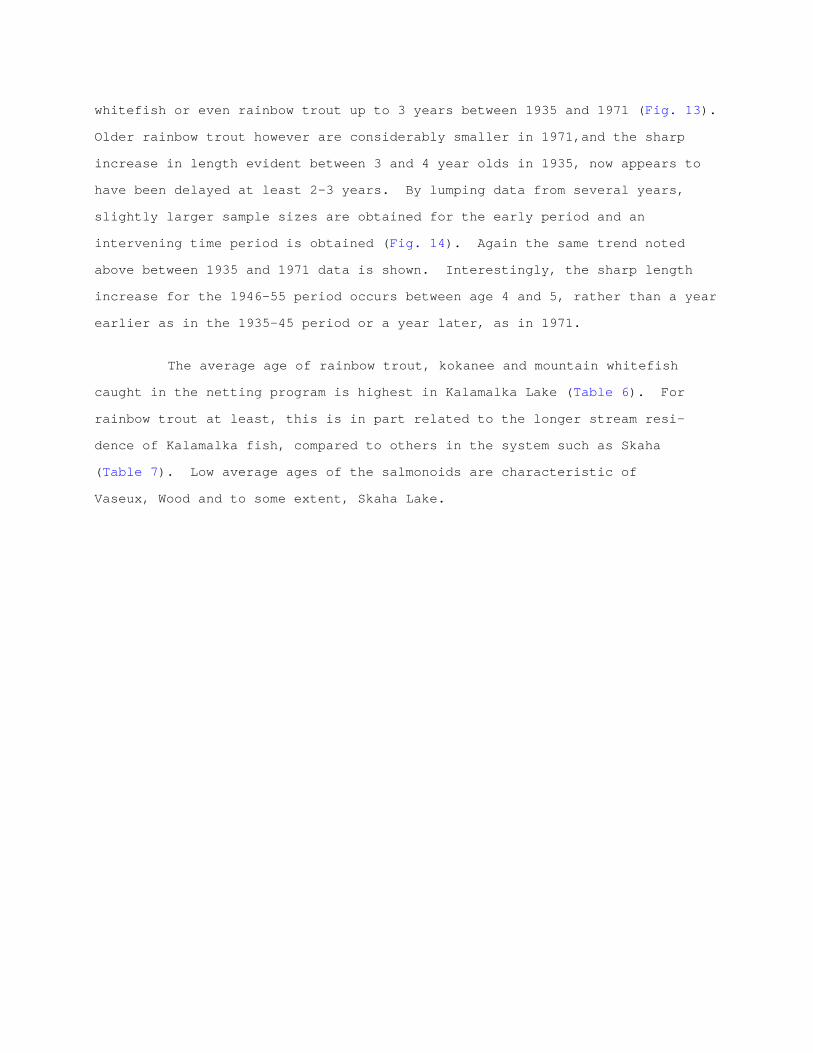
whitefish or even rainbow trout up to 3 years between 1935 and 1971 (Fig. 13).
Older rainbow trout however are considerably smaller in 1971,and the sharp
increase in length evident between 3 and 4 year olds in 1935, now appears to
have been delayed at least 2-3 years. By lumping data from several years,
slightly larger sample sizes are obtained for the early period and an
intervening time period is obtained (Fig. 14). Again the same trend noted
above between 1935 and 1971 data is shown. Interestingly, the sharp length
increase for the 1946-55 period occurs between age 4 and 5, rather than a year
earlier as in the 1935-45 period or a year later, as in 1971.
The average age of rainbow trout, kokanee and mountain whitefish
caught in the netting program is highest in Kalamalka Lake (Table 6). For
rainbow trout at least, this is in part related to the longer stream resi-
dence of Kalamalka fish, compared to others in the system such as Skaha
(Table 7). Low average ages of the salmonoids are characteristic of
Vaseux, Wood and to some extent, Skaha Lake.

Fig. 13. Average and range (vertical lines) in length for designated
age groups of Okanagan Lake fish in 1935 (o) and 1971 (•}. Sample size given near respective average. 1 refers to full years completed.

Fig. 14. Average and range (vertical lines) in length for the first six age groups of Okanagan Lake rainbow trout for three time periods. Sample size given near respective averages; 95% fiducial limits indicated on range lines. 1 refers to full years completed.

Table 6. Average age of four salmonoids caught in standard gill net sets in Okanagan basin lakes, spring autumn, 1971

Table 7. Differences in minimum number of years which Okanagan basin rainbow trout reside in streams before lake entry (based on scale reading evidence).
KOKANEE SPAWNING ENUMERATION
Stream Spawners
Kokanee in spawning condition were observed in relatively few numbers
(less than 2000) in the Okanagan River between Okanagan Falls and Vaseux Lake
(Fig. 15). Spawning kokanee also were observed in the Okanagan River
downstream from Maclntyre Dam, the upstream limit for fish coming from Osoyoos
Lake. Because they were mixed with sockeye salmon spawning at the same time,
it was impossible to obtain a good estimate but several

Fig. 15. Spawning habitat and estimated populations of spawning kokanee in the Okanagan
basin lakes and streams in 1971. 1 Estimation Method 1. 2 Estimation Method 2. 3 Count in one day only. 4 Very approximate estimates. (+++++) streams with > 500 spawning kokanee; (•) limit of accessable spawning habitat in those streams.( ) streams with < 500 spawning kokanee; (XXXX) shore spawning areas.

thousand kokanee from Osoyoos Lake probably spawn in that section of the
river.
Of the 11 streams where spawner estimates were made, Mission
Creek with over 300,000 kokanee, was by far the most important (Fig. 15).
A total of slightly over 500,000 kokanee were estimated to have spawned in
streams tributary to Okanagan basin lakes in 1971. This does not include
a number of small spawning populations, each less than 500 fish, utilizing
other tributaries (eg. Penticton, Trout, Lambly, Shorts, Deep creeks)
shown in Figure 15. Nor does it include creeks intermittently supporting
small spawning populations, depending on available water (eg. Naramata
Creek).
Shore Spawners
Although reports from local residents indicated the presence of shore
spawners in Wood and Okanagan lakes in previous years, they were observed
only in Okanagan Lake during the period of investigation in 1971.
An estimate of 40 kokanee per square meter was made from the beach seine
count and visual estimates from shore. The aerial photographs failed to
provide enough clear detail to use for enumeration purposes. The
estimated numbers were therefore dependent on the visual estimates of the
area covered by each spawning group.
There were about 135,000 spawners distributed in distinct groups between
Squally Point and Bellevue Creek. In the north end of Okanagan Lake there
were about 60,000 fish between Lambly and Shorts creeks. Approximately
323,000 used the east side from about Brandt's Creek (City of Kelowna) to
Vernon Creek (Fig. 15). The estimated total shore spawning population in
Okanagan Lake was 518,000 which is considered conservative.

Because the estimate of total numbers of shore spawners is based on only
one observation from the air, it is probably a minimum number. The
estimate was probably made prior to the peak of the spawning period because
only about 6-10 dead kokanee were observed in one area, just prior to
making the estimates. If shore spawning kokanee follow the same pattern as
stream spawning fish, one would see comparatively more dead spawners near
the peak of spawning. It is therefore likely that maximum numbers were
present after the count was made.
The tagged fish were observed 13 days after being tagged and the majority
of them were over the same spawning site.
The substrate utilized by shore spawning kokanee differs dramatically from
that used by stream spawners. The stones on the beaches appeared to be
fractured material and had jagged, rough edges. The stones were loosely
stacked without smaller gravels in the interstices. Several areas
investigated with SCUBA gear, were composed of stones approximately 5 - 13
cm in diameter while other sites were composed of small boulders from about
20 to 40 cm in size. In both kinds of areas, live eggs were found down to
a depth of about 30 cm. There was no evidence of redd construction such as
one observes in stream spawning; eggs appeared to have trickled down into
the interstices.
No spawners were observed in deep areas (10 m) bordering shore spawning
sites; all those observed were in 0.5 to 2.5 meters and over 80 percent of
all groups used areas 0.6 to 1.5 meters deep.
PESTICIDE AND HEAVY METAL ANALYSES
In 1970 fish samples were analyzed for chlorinated hydrocarbons by

the B. C. Fish and Wildlife Branch and the B. C. Department of Health at the
same laboratory. Some species from the 6 basin lakes were analyzed but not
all species from all lakes. A number of analyses of individual fish from 3 of
the lakes made it possible to calculate mean concentration and ranges (Table
8). Out of 75 analyses which included 10 species of fish, including those in
Table 8, only one, a rainbow trout from Osoyoos Lake, exceeded the maximum
allowable concentration (5.0 ppm) of total DDT. Concentrations of total DDT
in these samples ranged from 0.03 ppm (a mountain whitefish from Okanagan
Lake) to 6.85 ppm (a rainbow trout from Osoyoos Lake). Analyses of musculature
collected from Okanagan Lake kokanee in 1966 (16 individuals and 11 analyses)
indicated a range of total DDT from 1.99 to 5.00 ppm.
Analyses conducted in 1971 showed total residues of the DDT group to be
extremely high in samples of the three principal sports fishes in Kalamalka
Lake; samples of rainbow trout and squawfish in Okanagan Lake exceeded limits
for total DDT residues as did lake whitefish in Skaha Lake (Table 9). Limits
for mercury were exceeded in samples of rainbow trout from Okanagan Lake and
in squawfish from Okanagan, Skaha and Osoyoos lakes. Of all analyses
conducted on samples of main basin lakes in 1971, 22 percent (24 out of 107)
showed concentrations of one of the heavy metals or total DDT or a
combination of both in excess of set limits (Table 9). Organophosphates,
herbicides, fungicides and P.C.B.'s were not detected.
Comparisons of analyses of fish collected 14 to 24 years ago with similar-
sized fish collected in 1971 are probably too few in number to indicate any
meaningful trend in time. Although a rainbow trout caught

Table 8. Mean concentration and range of total DDT in muscle tissue of mountain whitefish (Wood Lake), rainbow trout (Okanagan Lake) and kokanee (Skaha Lake) collected in 1970

Table 9. Concentration (parts per million wet tissue weight) of heavy metals and chlorinated hydrocarbons in samples of fish musculature, including skin and adipose tissue, in fish from Okanagan Basin lakes. NA = not analyzed; ND = not detected; *Cadmium - undetermined error in analysis; *Copper - error in analysis; *Zinc - values probably overestimated by about 30%. Enclosed ( ) numbers exceed limits (given in bold face at head of table) for marine and fresh water animal products set by Canada Food and Drug Directorate.
a,b

Table 9 (cont'd)

Table 9 (cont'd)

in Kalamalka in 1956 was smaller than the average of comparable rainbow
trout analyzed in 1971, it had higher concentrations of total DDT, zinc,
mercury and copper (Table 10). A single carp, caught in Osoyoos Lake 16
years ago, had a higher concentration of total DDT than the average of 2
carp caught in 1971; there was little difference in the concentrations of
heavy metals. Three smallmouth bass collected in Osoyoos Lake in 1951 and
1956 had somewhat higher concentrations of total DDT than the average of 2
collected in 1971, however the 1971 fish were considerably smaller.
Similarly, perch from Osoyoos showed higher concentrations of total DDT in
1951 than in 1971. There was little difference in concentration of heavy
metals between years (Table 10).
Rainbow trout from some headwater lakes were compared with
similar sized trout from Wood and Okanagan lakes into which they drain
(Table 11). Concentrations of copper and zinc were higher in fish from Wood
than the 2 tributary lakes; there was little difference in mercury but,
surprisingly, total DDT levels found in Wood Lake fish were lower than
concentrations in headwater fish. Levels of copper and mercury in trout
from tributary headwater lakes were higher than those of the respective
basin lakes but zinc and total DDT residues were lower.

Table 10. Concentration (parts per million wet tissue weight) of heavy metals and chlorinated hydrocarbons in samples of fish musculature in fish from Okanagan Basin lakes. These fish were collected from 1948 to 1956 and were stored in the Museum of Fishes at the University of British Columbia; 1971 data added for comparison. See Table 9 for limits set by Canada Food and Drug Directorate and details regarding analysis.
Table 11. A comparison of ranges of heavy metal and total DDT concentrations in rainbow trout from some headwater and main-basin Okanagan lakes, Trout from each system range from about 200 to 400 mm in length. Concentrations in ppm wet tissue weight.