Results 2014 of Metsä Board, presentation
27
Metsä Board Metsä Board Results 2014
-
Upload
metsae-board -
Category
Investor Relations
-
view
150 -
download
0
Transcript of Results 2014 of Metsä Board, presentation

Metsä Board
Metsä Board Results 2014

Metsä Board
Highlights in 2014
2
‒ Profitability improved from previous year
‒ Cash flow was strong and net debt reduced clearly to EUR 427 million
‒ Paperboard delivery volume increased significantly and price levels were stable
‒ Metsä Board’s folding boxboard was successfully launched to North America
and to the global food service segment
‒ Production volumes and efficiencies improved
‒ Final steps in transformation to a paperboard company were introduced
‒ Mika Joukio started as the new CEO in October and the organization was renewed as of 1 Jan 2015

Metsä Board
0,17
0,27
0
0,1
0,2
0,3
0,4
2013 2014
Metsä Board’s Profitability Improved in 2014
5878
0
25
50
75
100
2013 2014
6,4
9,1
0
3
6
9
12
2013 2014
2019 2008
0
1000
2000
3000
2013 2014
104
137
0
40
80
120
160
2013 2014
Sales Operating result, excl. non-
rec. items
Result before taxes, excl.
non-rec. items
m€ m€
m€
114117
0
40
80
120
160
2013 2014
Operating result
m€
Result before taxes
m€
ROCE, excl. non-
rec. items
%
Board of Directors is proposing to the AGM a dividend of EUR 0.12 per share for the financial year 2014
3
Earnigs per share, excl.
non-rec. items
€ per share
49
100
0
25
50
75
100
125
2013 2014

Metsä Board
30
1929 28
6
2520
24 2636 35 37
0
10
20
30
40
50
1Q12 2Q12 3Q12 4Q12 1Q13 2Q13 3Q13 4Q13 1Q14 2Q14 3Q14 4Q14
545 522 532 509 535 503 514479502 501499494
0
200
400
600
800
1Q12 2Q12 3Q12 4Q12 1Q13 2Q13 3Q13 4Q13 1Q14 2Q14 3Q14 4Q14
-9
1710 9
1927
32
918
4
2021
-10
0
10
20
30
40
1Q12 2Q12 3Q12 4Q12 1Q13 2Q13 3Q13 4Q13 1Q14 2Q14 3Q14 4Q14
Sales Operating result excl. non-rec. items
Result before taxes excl. non-rec. items
Operating Result in 4Q 2014 Roughly at Previous Quarter Level
4
EUR million EUR million
EUR million

Metsä Board
‒ Folding boxboard deliveries decreased seasonally slightly in 4Q 2014
‒ Market prices were stable but stronger USD improved average price
‒ Good progress in North America and in the food service segment continued
‒ Result was weakened by decreased speciality paper deliveries partly
due to political and economic uncertainties in Ukraine and Russia
‒ No material price changes in folding boxboard 2015 annual contracts
compared to previous year
5
EBIT, excl. non-recurring items
Sales
No Material Change in Cartonboard Business Area’s
Profitability in 4Q 2014
EUR million
EUR million
1820
1817
20
1215
10
0
6
12
18
24
30
1Q13 2Q13 3Q13 4Q13 1Q14 2Q14 3Q14 4Q14
224230219214208220218
222
0
50
100
150
200
250
1Q13 2Q13 3Q13 4Q13 1Q14 2Q14 3Q14 4Q14

Metsä Board
Linerboard and Paper’s Result Improved Clearly in 4Q 2014
‒ Result was improved by higher fresh forest fibre linerboard average price due
to strengthened USD
‒ Linerboard deliveries decreased seasonally slightly in 4Q 2014
‒ Uncoated fine paper delivery volume increased and price level was
unchanged. Coated paper delivery volume and average price decreased
‒ Market pulp volumes were slightly lower but price increased due to USD
‒ Sales of CO2 rights had a positive result impact
‒ Linerboard deliveries are in 1Q 2015 expected to improve. No major price
changes in sight
‒ Paper deliveries are in 1Q forecast to increase but average price decrease
‒ No material market related changes foreseen in pulp business in 1Q
6
EBIT, excl non-recurring items
EUR million
EUR million
Sales
20
15
24
32
1516
7
20
0
6
12
18
24
30
36
1Q13 2Q13 3Q13 4Q13 1Q14 2Q14 3Q14 4Q14
271262
271 265288
269 267250
0
50
100
150
200
250
300
350
1Q13 2Q13 3Q13 4Q13 1Q14 2Q14 3Q14 4Q14

Metsä Board
EUR -30 Million in Net Non-Recurring Items Booked in 4Q 2014
Main items:
‒ EUR 26 million impairment of fixed assets in the Cartonboard business area related to
the loss-making Gohrsmühle mill in Germany
‒ EUR 13 million cost provision in the Linerboard and Paper business
area related to planned discontinuation of paper production at Husum
‒ EUR 7 million sales gain related to Niemenranta property in Tampere, Finland
7
Total non-recurring items in 2014 EBIT were EUR -20 million

Metsä Board
Net Debt Reduced to EUR 427 Million Thanks to Strong Cash Flow
‒ Cash flow from operations EUR 83 million in 4Q and
EUR 210 million in 2014 (EUR 127 million in 2013)
‒ Gross debt EUR 684 million and net debt EUR 427 million at end 2014
( EUR 597 million at end 2013)
‒ Net gearing 51 % (70 %), equity ratio 39 % (41 %) and average
interest rate 4,0 % (4,8 %) at the end of 2014
‒ Net debt to EBITDA dropped to below 2
‒ Strong liquidity position
‒ Moody’s raised Metsä Board’s credit rating to B1 in 4Q 2014
8
Net Debt / EBITDA
Net Debt
427
827
0
250
500
750
1000
2010 2011 2012 2013 2014
1,8
2,7
0
1
2
3
4
5
2010 2011 2012 2013 2014
EUR million

Metsä Board
Short-Term Profitability Outlook
9
‒ Metsä Board’s operating result excluding non-
recurring items is in the first quarter of 2015
expected to improve slightly compared to the last
quarter of 2014

Metsä Board
Metsä Board’s Paperboard Deliveries Increased by 10 % in 2014
10
+ 7 %
169 176 185 185 189 192 197185 191 197
210 203
8085
93 8594 93
95
91
110108
118109
0
60
120
180
240
300
1Q12 2Q12 3Q12 4Q12 1Q13 2Q13 3Q13 4Q13 1Q14 2Q14 3Q14 4Q14
Fresh forest fibre linerboard
Folding boxboard
+ 10 % 1000 tonnes

Metsä Board
11
‒ USD and SEK vs. Euro has moved to favourable direction from Metsä Board’s viewpoint in 2H 2014
and in early 2015
‒ Hedging of the main foreign currency flows is 5-7 months
‒ Positive net EBIT impact after hedges in 2014 was EUR 15 million vs. 2013
‒ Incremental positive impact expected in 2015
‒ Annual unhedged EBIT sensitivity of 10 % change vs. euro
‒ EUR 45 million in USD
‒ EUR 20 million in GBP
‒ Reversed EUR 30 million SEK
‒ Segment numbers reflect exchange rate changes rapidly
but hedge accounting result in Other operations balance the impact
Exchange Rates Changes Favourable for Metsä Board

Metsä Board
Metsä Board Grows Its Paperboard Business, Plans to Fully Exit Paper Production and Considers a Rights Issue
‒ Major growth step in the folding boxboard business thanks to EUR 170 million
investment in a new production line and related infra at Husum mill in Sweden
‒ Linerboard volumes from Husum to be tripled from 2014 level to close to
300 000 tonnes fully from 2018
‒ Planned discontinuation of Husum mill’s paper production mostly by
the end of 2015 and fully by the end of 2017
‒ Measures to eliminate losses of Gohrsmühle mill in Germany in process
‒ These final steps of transformation expected to be financed by current liquidity,
operating cash flow and potentially also by a rights issue in 1Q 2015
12

Metsä Board
New Volumes to be Sold Mainly to North America, Where Metsä
Board’s Paperboard Volumes Increased Over 40% in 2014
13
Fresh forest fibre linerboard deliveries to
North America, 1,000 tonnes
0
30
60
90
120
150
180
2009 2010 2011 2012 2013 2014
FBB deliveries to North America, 1,000 tonnes
0
5
10
15
20
25
30
2Q13 3Q13 4Q13 1Q14 2Q14 3Q14 4Q14
FBB volume target in North America is
over 300 000 t/a in mid-term
Linerboard volume target in North
America is over 250 000 t/a in mid-term

Metsä Board
New Function Based Organization in Place As of 1 January 2015
‒ Reporting segments are from 1Q 2015 onwards the following:
‒ Paperboard
‒ Non-core operations
‒ Paperboard segment includes folding boxboard, fresh forest fibre linerboard, wallpaper base and
market pulp businesses. Metsä Fibre result share will be allocated to Paperboard
‒ Non-core operations include Husum and Gohrsmühle mills’ paper businesses
‒ The restated historical figures will be released during February 2015
14
Metsä Board
Significant Financial Improvements Thanks to Finalization of the Transformation
‒ Based on growth of paperboard business and discontinuation of Husum’s paper
production, Metsä Board’s annual sales is expected to remain rather stable
‒ Operating result excluding non-recurring items expected to improve by
approximately EUR 50 million compared to 2014
‒ Mostly in 2017 and fully in 2018
‒ Investment shutdown and accelerated depreciations in Husum is forecast to
impact operating result negatively roughly by EUR 20 million in 2015
‒ Additionally, elimination of Gohrsmühle mill’s losses would lead to:
‒ Annual sales reduction of approximately EUR 90 million
‒ Operating result improvement of approximately EUR 20 million
15

Metsä Board
Metsä Board Updates Its Long-Term Financial Targets
New targets:
Return on Capital Employed (ROCE) minimum 12 per cent from 2017 onwards
Net gearing maximum 70 per cent
‒ Old targets were ROCE minimum 10 per cent and net gearing maximum 100 per cent
‒ Dividend policy remains unchanged. The aim is to pay a dividend of at least 1/3 of the
EPS, taking into account the net gearing target
16

Metsä Board
Key Priorities in 2015
‒ Grow profitably the paperboard businesses globally
‒ Successful implementation of the investment projects in Husum
‒ Secure good price levels
‒ Further improve best in class product quality and supply chain
‒ Develop new products for existing and new end uses
‒ Elimination of the losses from Gohrsmühle mill
‒ Continue productivity improvements and cost savings
17
6,4
4,8
3,4
7,6
-5,6
9,1
-6
-3
0
3
6
9
12
15
2009 2010 2011 2012 2013 2014
Target min. 12 % from 2017 onwards
ROCE, excl. non-recurring items
%

Metsä Board
Appendix

Metsä Board
6,4
4,8
3,4
7,6
-5,6
9,1
-6
-3
0
3
6
9
12
15
2009 2010 2011 2012 2013 2014
ROCE % and EBIT, % of Sales
19
EBIT % of sales excl. non-recuring items ROCE %, excl. non-recurring items
6,8
-6,2
6,6
2,4
3,6
5,2
-8
-6
-4
-2
0
2
4
6
8
10
2009 2010 2011 2012 2013 2014
Target min. 12 % from 2017 onwards

Metsä Board
EBITDA Development
20
EBITDA excl. non-recurring items
236
208
186179
305
44
0
60
120
180
240
300
2009 2010 2011 2012 2013 2014
EUR million

Metsä Board
Business Area Performance – Comparison to Previous Quarter
Sales
4Q 2014 3Q 2014
21
230
271
224
265
0
50
100
150
200
250
300
Cartonboard Linerboard andPaper
18
24
17
32
0
7
14
21
28
35
Cartonboard Linerboard andPaper
Operating result, excluding non-recurring items EUR million EUR million
Metsä Board
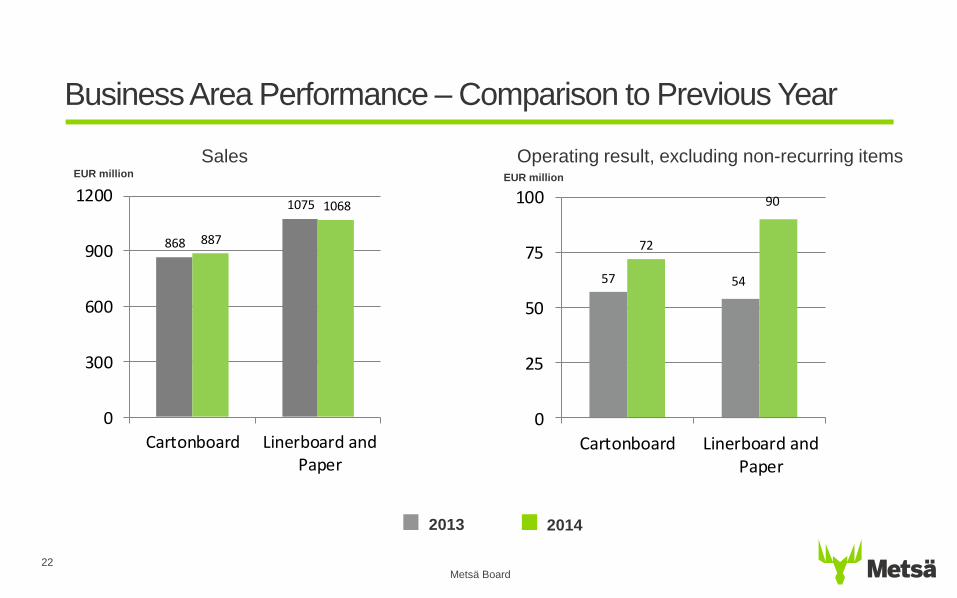
Business Area Performance – Comparison to Previous Year
2014 2013
22
868
1075
887
1068
0
300
600
900
1200
Cartonboard Linerboard andPaper
57 54
72
90
0
25
50
75
100
Cartonboard Linerboard andPaper
Sales Operating result, excluding non-recurring items EUR million EUR million
Metsä Board
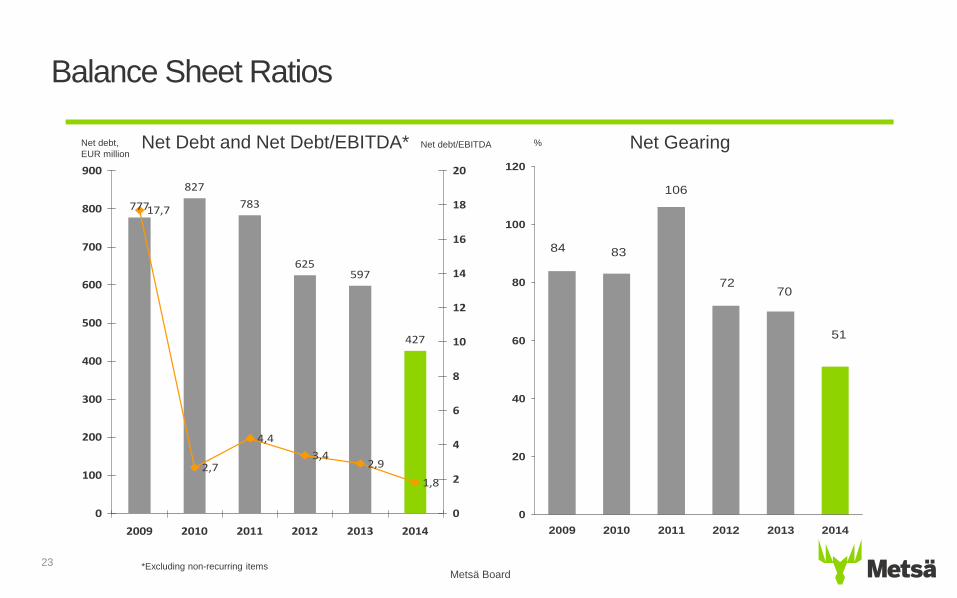
Balance Sheet Ratios
23
777
827
783
625597
427
17,7
2,7
4,4
3,42,9
1,8
0
100
200
300
400
500
600
700
800
900
2009 2010 2011 2012 2013 2014
0
2
4
6
8
10
12
14
16
18
20
Net Debt and Net Debt/EBITDA* Net Gearing
51
84 83
106
7270
0
20
40
60
80
100
120
2009 2010 2011 2012 2013 2014
Net debt,
EUR million Net debt/EBITDA
*Excluding non-recurring items
%

Metsä Board
EUR / tonne
Folding Boxboard Market Price in Europe
2004 – 2014
24
Source: Pöyry Management Consulting
800
900
1000
1100
2009 2010 2011 2012 2013 2014

Metsä Board
500
600
700
800
900
2009 2010 2011 2012 2013 2014
25
Uncoated White-Top Kraftliner Market Price in Europe
2009 – 2014
Source: Foex
EUR / tonne

Metsä Board
EUR / tonne
Paper and Pulp Market Price in Europe
1998 – 2014
Coated fine paper (100 g)
Uncoated fine paper (B-copy, 80 g)
Softwood pulp NBSK
Coated magazine paper LWC (60g)
Source: Foex, Reuters
EUR/USD
EUR/USD
400
500
600
700
800
900
1000
1100
2000 2001 2002 2003 2004 2005 2006 2007 2008 2009 2010 2011 2012 2013 2014
0,8
0,9
1
1,1
1,2
1,3
1,4
1,5
1,6
1,7
26

Metsä Board
Ownership Structure 31.12.2014
Shares Votes
Source: Euroland 27