Resultados Grupo Pão de Açúcar - GPA · ABOUT GRUPO PÃO DE AÇÚCAR 2 1 2011 Estimated 2 In the...
54
CORPORATE PRESENTATION Grupo Pão de Açúcar and Globex Utilidades October, 2011
Transcript of Resultados Grupo Pão de Açúcar - GPA · ABOUT GRUPO PÃO DE AÇÚCAR 2 1 2011 Estimated 2 In the...

CORPORATE
PRESENTATION
Grupo Pão de Açúcar and Globex Utilidades
October, 2011

ABOUT GRUPO PÃO DE AÇÚCAR
2
1 2011 Estimated 2 In the past 12 quarters, according to Brazilian Supermarket Association (ABRAS)
> Key figures
> R$ 50+ bi Sales1
> #1 Retailer in Brazil
> Growth higher than
the 2nd player’s2
> 160k employees
> Operational
> 1.8k points of sales, located in
19 States and the Federal District
> Multi-format distribution
> 600 million tickets per year
> 2.8 million m² of sales area

NEW MANAGEMENT MODEL ADJUSTED IN 2011
3
Metric Commercial/
Supply Chain
and IT
Corporate
Services /
Finance
People
Retail Cash &
Carry
Metric Metric Metric Metric Metric
Metric
Metric
Metrics: 1. Net Income
2. Valuation/EVA
3. ROCE
4. Growth/Expansion
5. Customer satisfaction
6. Our people satisfaction
Corporate Relations
Market Strategy
Management Control
CEO Nova
PontoCom Specialized Electronics

MAIN INDICATORS
4
1 Nova Casas Bahia consolidation as of Nov, 2010. Annualized gross sales of R$44 billion.
ECONOMIC-FINANCIAL 2006 2007 2008 2009 2010 (1)
(R$ million)
Gross Sales 16,460.3 17,642.6 20,856.8 26,219.1 36,144.4
Same-store growth -0.1% 2.8% 8.5% 9.6% 12.1%
EBITDA 886.4 992.4 1,322.5 1,504.1 2,068.1
EBITDA margin 6.4% 6.7% 7.3% 6.5% 6.4%
Net income 85.5 185.7 260.4 644.7 722.4
Gross margin 28.2% 28.0% 26.4% 24.8% 24.5%
Net margin 0.6% 1.3% 1.4% 2.8% 2.3%
Net debt/EBITDA 0.7x 1.3x 0.6x 0.4x 0.6x
EPS (R$/thousand shares) 0.8109 0.8151 1.1070 2.5333 2.8051
OPERATIONAL 2006 2007 2008 2009 2010
Total stores (number) 549 575 597 1,080 1,647
Selling area (m2) 1,217,984 1,338,329 1,360,706 1,744,653 2,811,103
Area increase 1.0% 9.9% 1.7% 28.2% 61.1%
Number of employees 63,607 66,165 70,656 85,244 144,914

COMPANY CHANGES AS THE ENVIRONMENT
MOVES
5
Brazil
2005
Population in each social class (in million)
GPA: limited
offering (only
Food, 556 stores)
GPA: multiformat
business for both Food
and Electro, 1,646 stores
Brazil 2010 32mn emerged
only in 2010
2005 2010
92,9MM
D/E
101,7MM
C
A/B
26,4MM
62,7MM
C
A/B
42,2MM
47,9MM
D/E
E-C
OM
MER
CE
FO
OD
CA
SH
& C
AR
RY

COMPANY CHANGES AS THE ENVIRONMENT
MOVES
6
Source: IBGE, BACEN, Ipsos/Cetelem, Exame
magazine - June 29, 2011
10,1% 10,3% 9,6% 8,0% 8,4%
6,7%
2005 2006 2007 2008 2009 2010
Unemployment rate
Credit available to population (As % of GDP)
8,8% 9,7% 11,2% 12,8% 15,0% 15,7%
2005 2006 2007 2008 2009 2010
1,2%
4,0% 3,2% 3,4% 3,2% 3,5%
2005 2006 2007 2008 2009 2010
Real income growth
Available income1 (monthly)
Social Class
2009 2010 % Change
A/B R$ 680 R$ 991 46%
C R$ 204 R$ 243 19%
D/E R$ 61 R$ 104 70%
Total R$ 230 R$ 368 60%
1 Total income less all family expenses
Social Class Income (monthy)
A Above R$9,050
B From R$6,941 to R$9,050
C From R$1,610 to R$6,941
D From R$1,008 to R$1,610
E Below R$1,008
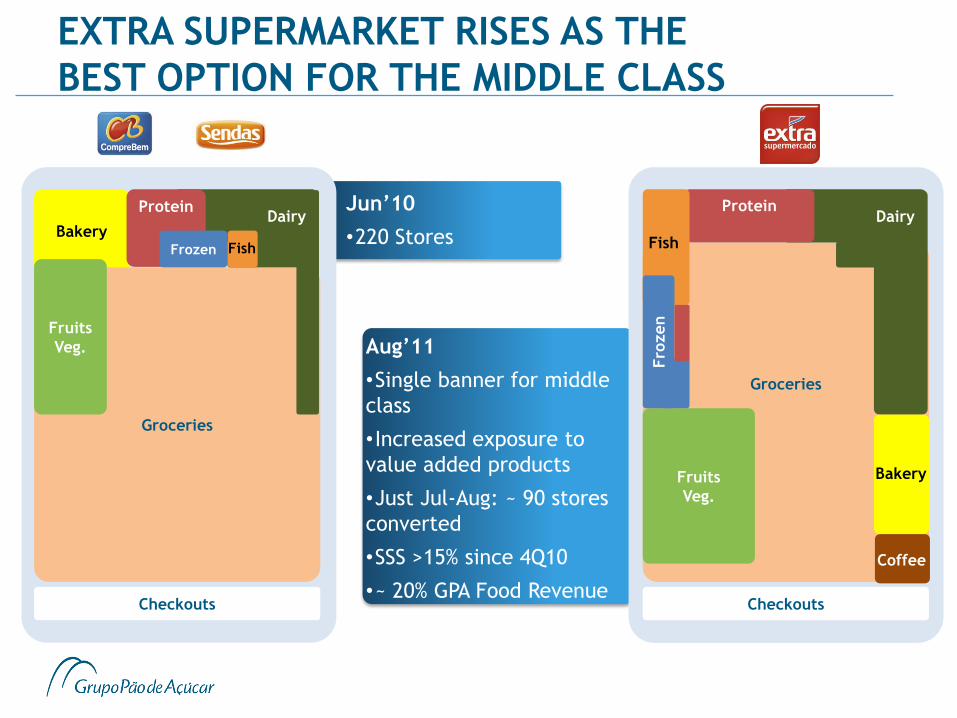
EXTRA SUPERMARKET RISES AS THE
BEST OPTION FOR THE MIDDLE CLASS
Bakery
Checkouts
Groceries
Fruits
Veg.
Dairy Protein
Frozen Fish
Jun‟10
•220 Stores
Checkouts
Groceries
Fruits
Veg.
Dairy Protein
Fish
Bakery
Coffee
Fro
zen
Aug‟11
•Single banner for middle
class
• Increased exposure to
value added products
•Just Jul-Aug: ~ 90 stores
converted
•SSS >15% since 4Q10
•~ 20% GPA Food Revenue

R$25.0 BN OF GROSS SALES IN 1H11
8
• 2010: 24.5%
Nova Casas Bahia consolidation as of Nov, 2010
• 1H11: 26.4%
GPA Food1: 25.4%
Globex2: 27.5%
• 2010: R$ 36.1 bn
„Same-store‟ sales moved up by 12.1%
Nova Casas Bahia consolidation as of Nov, 2010
• 1H11: R$25.0 bn
„Same-store‟ sales increased by 8.5%
Gross
Sales
Gross
Margin
1 Refers to GPA consolidated excluding Globex 2 Includes Nova Casas Bahia and Nova Pontocom

EBITDA OF R$1,2 BN IN 1H11
9
EBITDA
Net Income
• 2010: R$2.1 bn 37.5% (margin of 6.4%)
Nova Casas Bahia consolidation as of Nov, 2010
• 1H11: R$1.2 bn 50.8% (margin of 5.5%)
GPA Food1:R$841.3 mn (margin of 6.9%)
Globex2: R$382.7 mn (margin of 3.9%)
• 2010: R$722.4 mn (margin of 2.3%)
Nova Casas Bahia consolidation as of Nov, 2010
• 1H11 adjusted net income: R$296.6 mn (margin of 1.3%)
1 Refers to GPA consolidated excluding Globex 2 Includes Nova Casas Bahia and Nova Pontocom

GROWTH HIGHER THAN THE 2ND PLAYER
10
Same Store Sales
8.5%
4.3%
10.3% 10.4%
4.6%
13.2%
9.7%
10.6%
15.0%
9,9%
12,5%
11,5%
6,8%
10,1%
7.1%
8.6% 8.4%
7.8%
2.3%
7.2%
3.9% 4.8%
8.7%
2,9%
5,2%
5,6%
5,0%
7,1%
1Q08 2Q08 3Q08 4Q08 1Q09 2Q09 3Q09 4Q09 1Q10 2Q10 3Q10 4Q10 1Q11 2Q11
2nd player
12 Quarters

11
GUIDANCE FOR NEW GLOBEX ELECTRO – BRICKS AND MORTAR OPERATION
GROSS SALES (R$) Above
R$ 20 billion
Growth (SSS)
above the market
GROSS MARGIN(1)
EBITDA MARGIN(1) (2) 4.0 to 5.5% Higher than 7.0%
Higher than 25.5% Higher than 26.5%
CAPEX R$ 100 mn to
R$ 120 mn
FINANCIAL RESULT(1) -3.5 to -4.5% Up to -4.0%
1 of net sales. Projections include estimated synergies. 2 The guidance for EBITDA margin was adjusted due to reclassification of “profit sharing” expenses in
the 2Q11. Under the previous accounting criterion, the guidance for 2011 would be between 4.5% and
6.0%, and for year model it would be 7.5%, as disclosed in 2H10.
2011E Year Model

12
MAIN SYNERGIES ELECTRO1
1 – Commercial and operating
management
2 – Management of infrastructure and
back-office
3 – Management of
financial and capital
structure
‣ Integrate the Ponto Frio operating management to Casas Bahia model
with margin and sales gains
‣ Centralization of purchase management with margin gains;
‣ Improvement of sales and pricing mix;
‣ Increase the penetration of services sales;
‣ Repositioning of Ponto Frio brand and maintaining strong the Casas Bahia
brand
‣ Centralization of the companies’ inventories and stock ups;
‣ Utilization of GPA’s back-office platform with Shared Services Center and
total integration among Casas Bahia, Ponto Frio and the other areas;
‣ Refine the operational processes;
‣ Take advantage of other synergies with GPA (logistics, IT etc);
‣ Manage the cash / Working Capital inside GPA platform;
‣ Reduction in funding costs / negotiation of financing instruments and
lines at GPA cost;
1 Includes Electronics, Home Appliance and Furniture operations

13
SYNERGIES GLOBEX
1.0% - 2.0%
(R$ 170 - 340 mn)
1.5% - 2.0%
(R$ 255 - 340 mn)
0.5% - 1.0%
(R$ 85 - 170 mn)
3.0% - 5.0%
(R$ 510 - 850 mn)
Potential per year – after total capture of synergies(1)
1 Synergy calculated over the net sales. 2 Includes Electronics, Home Appliance and Furniture operations
1 – Commercial and operating management
2 – Management of infra-structure and back-office
3 – Management of
financial and capital
structure
Total

14
OWNERSHIP STRUCTURE
32%
68%
47% 53%
50%
Globex
NovaPontoCom
6%
44%
Nova Casas
Bahia
100%
FIC Financial JV
14%
36%
Banco Itaú
50%
Free Float
Controlling Group
Casas Bahia Founders
Klein Family
Management
As of October 06, 2011.

Formats

16
GPA STORES AND FORMATS G
PA F
OO
D
ELEC
TR
ON
ICS /
HO
ME
APPLIA
NC
E
Supermarkets (*)
Cash & Carry
Hypermarket
Proximity
Gas stations and
Drugstores
Specialized
Stores
B2C B2B
374
59
115
67
231
989
# Stores
(*) Includes the Sendas and CompreBem stores still not converted.
Stores as of 2Q11.

17
GPA FOOD RETAIL STORES CHARACTERISTICS GPA FOOD
Public Stores 2Q11
Additions
Avg Sales Area
(m2)
ABCD classes 115 +1 6,000
AB classes 151 - 1,500
BCD classes 129 +11 1,500
Transformers Food service
59 - 4,000
ABCD classes 67 - 300
18
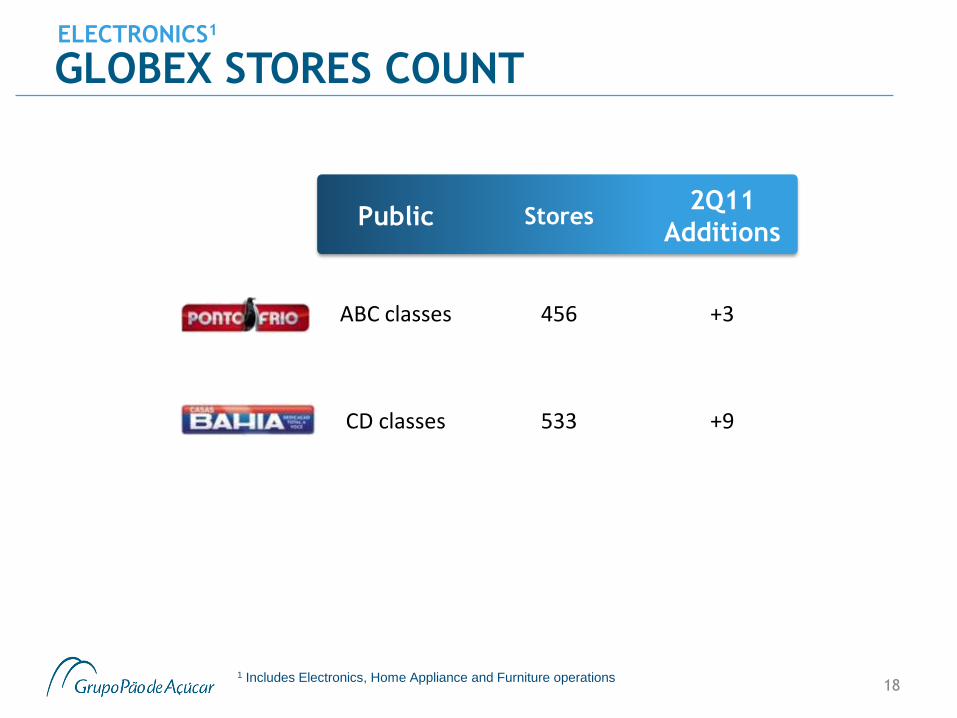
GLOBEX STORES COUNT ELECTRONICS1
Public Stores 2Q11
Additions
ABC classes 456 +3
CD classes 533 +9
1 Includes Electronics, Home Appliance and Furniture operations

19
REGIONAL PRESENCE (STORES)
North
Super: 0
Hyper: 1
Electro: 0
Cash & Carry: 1
Proximity: 0
Total: 2
GDP: 5.1%
Middle-West
Super: 13
Hyper: 11
Electro: 83
Cash & Carry: 3
Proximity: 0
Total:11017 GDP: 9.2%
Stores as of 2Q11
GDP: 13.1%
GDP: 56.0%
GDP: 16.6%
North-East
Super: 29
Hyper: 16
Electro: 29
Cash & Carry: 6
Proximity: 0
Total: 80
South-East
Super: 328
Hyper: 85
Electro: 762
Cash & Carry: 49
Proximity: 67
Total: 1,291
South
Super: 4
Hyper: 2
Electro: 115
Cash & Carry: 0
Proximity: 0
Total: 121

20
REGIONAL PRESENCE (DISTRIBUTION CENTERS)
Distribution Centers - Total
SP - São Paulo 18
RJ - Rio de Janeiro 5
DF - Distrito Federal 4
PR - Paraná 4
MG - Minas Gerais 3
PE - Pernambuco 3
BA - Bahia 2
ES - Espírito Santo 2
GO - Goiás 2
MT - Mato Grosso 2
SC - Santa Catarina 2
CE - Ceará 1
MS - Mato Grosso do Sul 1
RS - Rio Grande do Sul 1
Total 50 As of 2Q11

Nova Pontocom

BRAZILIAN MARKET IN EXPANSION
22
44% 56%
2010
67%
33%
2014 E
Access
No Access
Internet access – “C” class
E-commerce revenue in R$ billion
Source: e-Bit and Estado de SP July 31, 2011
1.7 2.7
Nova Pontocom annualized
Brazilian e-commerce
1 E-bit estimate
16% 18% 19%
Nova Pontocom mkt share

23
CONSISTENT SALES GROWTH NOVA PONTOCOM

24
IMPROVEMENT IN OPERATING PROFITABILITY NOVA PONTOCOM
* Amounts without Stock Option non-cash expenses.
Gross Profit (R$ Mn)
100
328
2009 2010
18,6% 19,2%
Operating Expenses (R$ Mn)*
17,6%
14,5%
95
248
2009 2010
Gross margin has grown, despite VAT tax
change (“Substituição Tributária”)
• Better negotiations / beginning of the
expansion of the assortment
• Still little synergy from groups commercial
conditions
Expenses reduction of more than 3 p.p. in 2010
• Strong fixed expenses dilution
• Greater variable expenses efficiency
• Synergies with the group

25
INCREASING EBITDA AND BREAK-EVEN IN NET INCOME
NOVA PONTOCOM
EBITDA (R$ Mn)*
EBITDA has approached 5% in 2010 with
gains in both margin and expenses
5
80
2009 2010
1,0%
4,7%
Net income (R$ Mn)**
Operation in the break-even point
of net income
0,2
0,0%
-2,3%
2009
2010
* Amounts without Stock Option non-cash expenses.
** Amounts without Stock Option non-cash expenses; 2009 pro-forma: adjusted amounts for the
current deferral accounting practice.
26
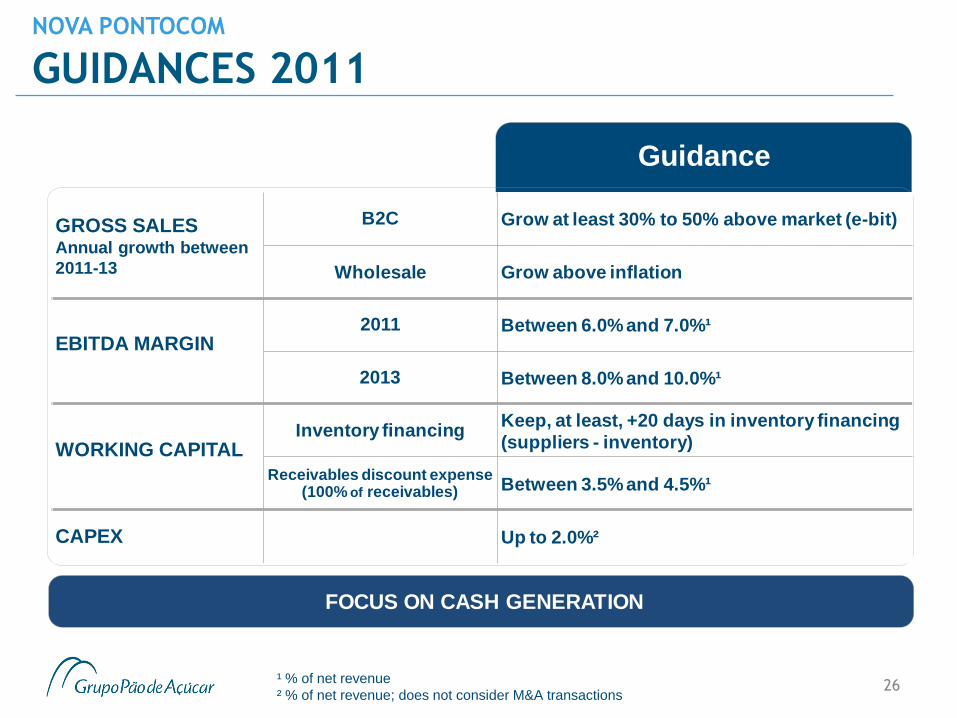
GUIDANCES 2011 NOVA PONTOCOM
Guidance
GROSS SALESAnnual growth between
2011-13
B2C Grow at least 30% to 50% above market (e-bit)
Wholesale Grow above inflation
EBITDA MARGIN2011 Between 6.0% and 7.0%¹
2013 Between 8.0% and 10.0%¹
WORKING CAPITALInventory financing
Keep, at least, +20 days in inventory financing
(suppliers - inventory)
Receivables discount expense (100% of receivables) Between 3.5% and 4.5%¹
CAPEX Up to 2.0%²
FOCUS ON CASH GENERATION
¹ % of net revenue
² % of net revenue; does not consider M&A transactions

2Q11 Results

2Q11 HIGHLIGHTS
> IPCA 12 months: +6.7%
> GPA Food real growth: +2.3%
> Increase in Selic1 rate from 11.75% to 12.25%
> „Same-store‟ growth:
> GPA Food2: +9.3%, Globex2:+17.6%
> Results: increase in market share, profitability with
competitiveness and permanent control of expenses
> EBITDA: +20% Food, +38% Globex
> EPS: +64% Consolidated
28
Macroeconomic impact
1 End of periods 1Q11 and 2Q11, respectively 2 Net Sales
Performance in businesses

GPA CONSOLIDATED IN THE 2Q11: GROSS
SALES OF R$ 12.6 BN
29
>GROSS SALES: R$ 12.6 bn + 61.3% vs. 2Q10
GPA Food1: Same-store growth of 9.1% in 2Q11
Globex2: Same-store growth of 14.1% in 2Q11
>GROSS PROFIT: R$ 3.0 bn +82.8% vs. 2Q10
Margins: GPA Food1: 25.2% +40 bps vs. 2Q10
Globex2: 28.1% +130 bps vs. 1Q11
>EBITDA: R$ 641 mn +66.3% vs. 2Q10
Margins: GPA Food1: 6.7% +50 bps vs. 2Q10
Globex2: 4.4% +110 bps vs. 1Q11
1 Refers to GPA Consolidated without Globex. 2 Considers Ponto Frio and e-commerce, excluding Casasbahia.com.br
The figures presented in this document already reflect the IFRS change in 2010 and 2011 and it
changes Company’s already published figures.
Globex’s numbers are not comparable between 2Q11 and 2Q10 due to the consolidation of Casas
Bahia as of November, 2010.

AGENDA – 2Q11 RESULTS
30
GPA F
OO
D
Supermarkets
Cash & Carry
Hypermarket
Proximity
Gas Stations and Drugstores

GROSS SALES OF R$ 6.9 BN, SAME-STORE SALES INCREASE
9.1% IN THE QUARTER
31
> Same-store growth
> In the 2Q11, higher than the 2nd player
for 3 years in a row
> In the 1H11, +7.4%, the upward trend
observed in previous quarters is
maintained
GPA FOOD
6,286 6,928
12,629 13,569
2Q10 2Q11 1H10 1H11
Gross Sales (R$ mn)
(without Globex)
7.7% 7.2%
5.7%
9.1%
3Q10 4Q10 1Q11 2Q11
Same-store growth (without Globex)
Highlights with same-
store growth > 15%
10.2%
7.4%
7.4%
1H11
The shopping period for Easter took place
in the 1Q10 and 2Q11. The analysis of
growth in the first 6 months isolates this
effect.

GROSS PROFIT CLIMBS BY 12.3%
32
> Margin expansion is related mainly to : > Product mix with higher margin
GPA FOOD
1 Cash-and-carry operation share in GPA Food net sales.
1,397 1,569
2,803 3,106
2Q10 2Q11 1H10 1H11
12.3%
Aligned with the strategy of
conversion to Extra
Supermercado, which allocates
larger area for these categories
10.8%
General
Merchandise and Perishables
% of Net Sales
25.2% 24.8%
Cash & Carry1
11.9% 14.8%
25.4% 24.7%
Gross Profit (R$ mn)
(without Globex)

33
GPA FOOD
Operating Expenses (R$ mn)
(without Globex)
1,047 1,150
2Q10 2Q11
18.5% 18.6%
% of Net Sales
OPERATING EXPENSES OF R$ 1.1 BN IN THE 2Q11
> Maintenance of the same level
of operating expenses as a
percentage of net sales in 2Q10
Creation of the
Management Control with
the administration of the
expenses groups
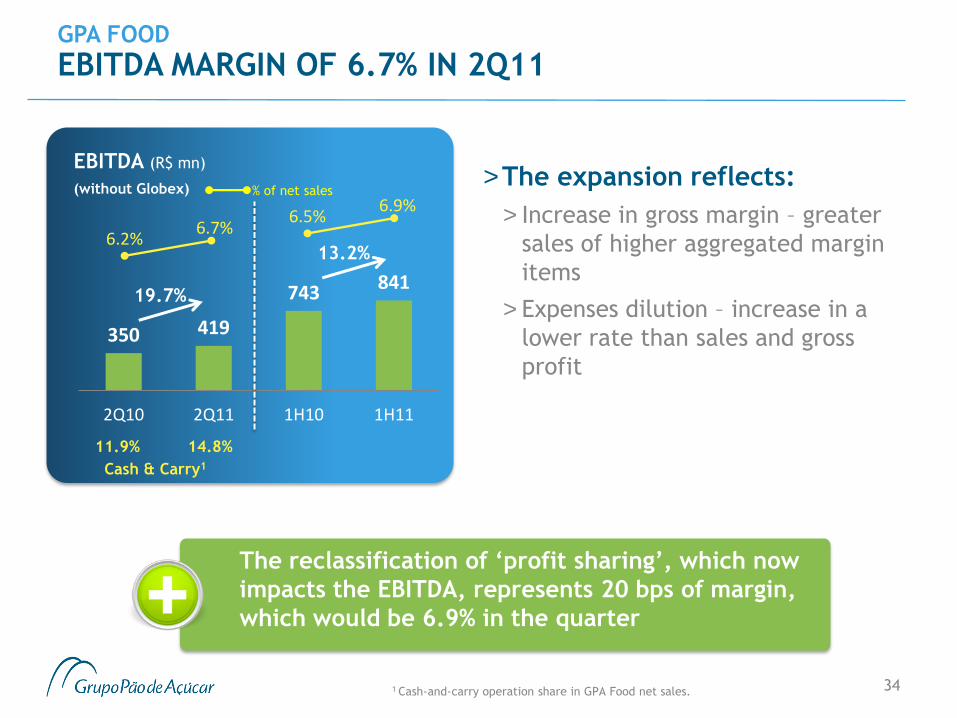
EBITDA MARGIN OF 6.7% IN 2Q11
34
GPA FOOD
EBITDA (R$ mn)
(without Globex)
350 419
743 841
2Q10 2Q11 1H10 1H11
19.7%
The reclassification of „profit sharing‟, which now
impacts the EBITDA, represents 20 bps of margin,
which would be 6.9% in the quarter
13.2%
6.7% 6.2%
6.9% 6.5%
% of net sales >The expansion reflects:
> Increase in gross margin – greater
sales of higher aggregated margin
items
> Expenses dilution – increase in a
lower rate than sales and gross
profit
11.9% 14.8%
Cash & Carry1
1 Cash-and-carry operation share in GPA Food net sales.

NET FINANCIAL EXPENSE KEEPS REPRESENTING
2.7% OF SALES
35
GPA FOOD
>Maintained level of 2.7% of
net sales, despite the higher
Selic rate
>Breakdown:
> 1.1%: Charges on bank net debt
(R$67.6 mn)
> 0.6%: Charges of discounted
receivables (R$34.3 mn)
> 1.0%: Adjustment by CDI of other
assets and liabilities(R$64.4 mi)
Net Financial Expense (R$ mn)
(without Globex)
162 166
1Q11 2Q11
2.7% 2.7%
% of net sales

AGENDA – 2Q11 RESULTS
36
Due to the consolidation of Casas Bahia’s results as of November, 2010, we use the 1Q11 as a
reference for better comparison.
Expenses from “profit sharing”, previously recognized after “operating profit before income
tax”, are now recognized in the “general and administrative expenses” line, as part of the
adjustment to the new accounting standards (IFRS).
ELEC
TR
ON
ICS
Specialized Stores
E-commerce B2B

37
PERSPECTIVE OF THE CONSUMER ELECTRONICS
MARKET IN BRAZIL
Market with high growth rate for electronics, home
appliances and furniture > Increasing access to credit
> Urban population growth and reduction of electric exclusion –
“Programa Luz para Todos” (Light for All Program)
> Maturation of the age pyramid with more participation of the
economically active population in total population
> Higher real incomes in all social classes - especially with the growth of
“C” class
> Lower unemployment level – with increase in the number of women in
the work place

GLOBEX 2Q11 HIGHLIGHTS
> Positive results of the integration process:
> Commercial margin gains
> Control of non-interest-bearing sales and increased
interest-bearing sales
> Maintenance of financial expense
> Return of organic growth (12 new stores)
38
The Company will consistently deliver the
guidance presented to the market

GLOBEX 2Q11 HIGHLIGHTS
39
> Nova Pontocom (2Q11 vs 2Q10):
> Sales 1 : growth of 58.0%
> 50% higher than the market growth
> Highlight for CasasBahia.com.br, 3-digit growth
> EBITDA: growth above 50%
> Margin between 6% and 7%
> SAC 2.0
> Logistics 2020
(1) In addition to the PontoFrio.com.br and Extra.com.br websites and the wholesale
operation, this figure includes the pro-forma of CasasBahia.com.br and is the basis
for the guidance given for the year.

GLOBEX 2Q11 HIGHLIGHTS
40
Before

GLOBEX 2Q11 HIGHLIGHTS
41
After

NET SALES OF R$ 5.0 BN, SAME-STORE CLIMB BY 17.6%
42
GLOBEX
1 Comparable basis (Casasbahia.com.br and wholesale are not included)
HIGHLIGHTS
SAME-STORE
gross sales
4,884 5,041
1Q11 2Q11
Net Revenue (R$ mn)
Globex
> Same-store growth vs. 2Q10:
>Even vs. World Cup period (2Q10)
>Control of non-interest-bearing sales
and increased interest-bearing sales
e-commerce 1
:
+39.4%
3.2%
Bricks-and-mortar:
+8.1%

43
> Gains in commercial efficiency:
> Better price policy
> Better commercial conditions
associated with a better
product mix
GLOBEX
Gross Profit (R$ mn)
Globex
1,312 1,418
1Q11 2Q11
+8.1%
Reduction of logistics
expenses : Result of
the combination of two
operations under a
single structure
% of Net Sales
26.9%
28.1%
GROSS PROFIT OF R$ 1.4 BN IN THE 2Q11, MARGIN OF 28.1%

1.151 1.196
1Q11 2Q11
OPERATING EXPENSES REPRESENTED 23.7% OF NET
SALES IN THE 2Q11
44
GLOBEX
„Profit sharing‟ is now considered
Operating Expense under IFRS
Operating Expenses (R$ mn)
Globex % of Net Sales
23.6% 23.7%
> Maintenance of the expenses level
> Impact of non-recurring items
(R$ 25.7 mn): > Software maintenance agreement, R$11.5
mn
> Adjustment of benefits and charges
R$10,0 mn
> Adjustment of provisions for profit
sharing, R$4.2 mn
> Excluding the items above, expenses
would have come to 23.2% of net
sales
23.2%
Adjusted by non-recurring items
> The process of synergies gains in
expenses advances in the 2H11

45
> Advance in EBITDA margin
> Gross margin increase
GLOBEX
EBITDA (R$ mn)
Globex % of Net Sales
161
222
1Q11 2Q11
EBITDA in 2011:
We reaffirm the margin
guidance
EBITDA OF R$ 222 MN IN THE 2Q11, WITH MARGIN OF 4.4%
+38.2%
Reclassification of „profit
sharing‟, which starts to
impact EBITDA, represents
0.6% of the margin
3.3% 4.4%
Adjusted by IFRS
3.6% 5.0%
2011 EBITDA Margin
guidance, now in IFRS
basis, is equivalent to
margin between 4.0%
and 5.5%

NET FINANCIAL EXPENSE REPRESENTED 3.4%
OF NET SALES
46
GLOBEX
> Maintenance of financial
expenses level, even with the
Selic increase in the period
> Maintenance in the average
payment period
> Greater use of FIDC (Nova
Pontocom)
> Increase in the share of interest-
bearing sales
Net Financial Expense1 (R$ mn)
Globex % of net sales
3Q10 4Q10 1Q11 2Q11
4.9%
3.4%
5.9%
The financial expense as net sales percentage
remains below the guidance for 2011 (between 3.5%
and 4.5%)
3.4%
1 NCB is included as of November, 2010.

AGENDA – 2Q11 RESULTS
47
GPA F
OO
D
ELEC
TR
ON
ICS
Supermarkets
Cash & Carry
Hypermarket
Proximity
Gas Stations and Drugstores
Specialized Stores
E-commerce B2B

FIC IN 2Q11
48
Private label share in sales
GRUPO PÃO DE AÇÚCAR
Globex % of net sales
4.1% 4.6%
9.3% 10.5%
1Q11 2Q11
13.4% 15.1%
No interest
With interest
> Equity income result: R$ 2.7 mn
in 2Q11
> GPA Food: R$ (1.0) mn
> Globex (Ponto Frio): R$ 3.7 mn
> The change into cards with chip
generated R$9.2 mn (non-recurring)
Globex interest-free
sales represented in
the 2Q11 less than
50% of sales 1 The best credit tool:
> Longer term
> Lower comission cost
> Discount of receivables at FIDC cost

2Q11 CONSOLIDATED NET RESULT
49
GRUPO PÃO DE AÇÚCAR
1 End of period.
Adjusted Net Income (R$ mn)
93
158
2Q10 2Q11
% of net sales
> Adjusted net income grows by 70.2%,
totaling R$158 mn
> Considering non-recurring effects with
REFIS, adoption of IFRS and integration
expenses
> Operational strengthening and EBITDA
margin advance in Food
> Recovery of the Globex’s operation,
which comes close to break-even
> Accounting net income climbs by 64%
(R$56 mn in the 2Q10 to R$91 mn)
> Growth despite the increase in
financial expenses (Selic advances
from 10.25% to 12.25% p.a.1)
1.3% 1.4%
+70.2%

CONSOLIDATED NET DEBT
50
GRUPO PÃO DE AÇÚCAR
> The reduction on net debt is
associated with:
> Reduction of debt in Globex’s
operation
> Debt level maintenance in GPA
Food
Evolution of Consolidated Net Debt (R$ bn)
2.3 2.0
1Q11 2Q11
Net Debt / EBITDA
1.05x 0.81x

2Q11 INVESTMENTS
51
GRUPO PÃO DE AÇÚCAR G
PA FO
OD
New stores and lands
AMOUNT INVESTED STORES
12 c
onvers
ions
> 10 CompreBem to Extra
Supermercado
> 1 CompreBem to Extra
Hipermercado
> 1 Sendas to Extra
Supermercado
ELEC
TR
ON
ICS
Infrastructure > Fleet
> Technology
12 n
ew
sto
res
> 9 Casas Bahia
> 3 Ponto Frio
1H11: +03 stores, 35 conversions
1H11: +12 traditional stores
R$ 21.7 mn
2Q11 1H11
Total R$ 205.7 mn R$ 454.8 mn
Infrastructure and other
Total
Renovations and conversions R$ 88.6 mn
R$ 95.4 mn
R$ 84.4 mn
R$ 224.9 mn
R$ 145.4 mn
New stores and lands
Renovations and conversions
Other
R$ 10.5 mn
R$ 84.1 mn R$ 118.0 mn
R$ 17.9 mn
R$ 40.4 mn
R$ 26.2 mn
R$ 20.2 mn
R$ 52.2 mn R$ 15.9 mn R$ 19.4 mn
R$ 24.5 mn R$ 32.7 mn
R$ 15.3 mn R$ 19.4 mn

WHAT LIES AHEAD
52
> A multibusiness company with sales over R$50 billion
> Right people in the correct places with processes and systems
> Integration with synergy‟s capture of Ponto Frio and Nova Casas Bahia
reaching guidance
> Consolidation and expansion of cash-and-carry, supermarkets,
hypermarkets, proximity stores, specialized businesses, electronics
stores and e-commerce formats taking advantage of the Brazilian
middle class growth

MAIN ECONOMIC INDICATORS
53 Source: CDI, IGP-M and IPCA: FGV / Selic and Dólar: Bacen / TJLP: BNDES
2009
2010
Last 12 months (jul/10 - jun/11)
Interbank Deposit Certificate (CDI) 9.88% 9.75% 11.05%
General Price Index - Market (IGP-M) -1.72% 11.32% 8.64%
IPCA 4.3% 5.9% 6.7%
Federal Government Long-Term Interest Rate (TJLP) 6.2% 6.0% 6.1%
Dec 2009 Dec 2010 Jun 2011
Basic Selic Rate Copom 8.75% 10.75% 12.25%
Dollar Exchange Rate - in R$ 1.74 1.67 1.56
Dollar Exchange Rate - variation in 12 months -25.5% -4.3% -13.3%

54
Grupo Pão de Açúcar (GPA)
Globex Utilidades S.A.
Investor Relations Team
Phone: +55 (11) 3886-0421
Fax: +55 (11) 3884-2677
www.gpari.com.br
> FORWARD –LOOKING STATEMENTS
The forward-looking statements contained herein are based on our management’s current assumptions and estimates, which may result in material differences regarding future results, performance and events. Actual results, performance and events may differ substantially from those expressed or implied in these forward-looking statements due to a variety of factors, such as general economic conditions in Brazil and other countries, interest and exchange rate levels, legal and regulatory changes and general competitive factors (whether global, regional, or national).
CONTACT – INVESTOR RELATIONS