RESOURCES W. Brody
113
Technical Publicaon 5]94-2 VOLE 6 OF THE LOWER ST. JOHNS RIR BASIN RECOAISSANCE BIOlOGICAL RESOURCES by Robert W. Brody St. Johns River \Vater Management District Palatka, orida 1994
Transcript of RESOURCES W. Brody
Technical Publication 5]94-2
VOLUME 6 OF THE
LOWER ST. JOHNS RIVER BASIN RECONNAISSANCE
BIOlOGICAL RESOURCES
by
Robert W. Brody
St. Johns River \Vater Management District Palatka, Florida
1994
Northwest Florida-----.------..........
Water Management District
St • ..Johna River Water Management. Dlstrlc::t
Suwannee River Water Management
District
South Florida Water Management
District
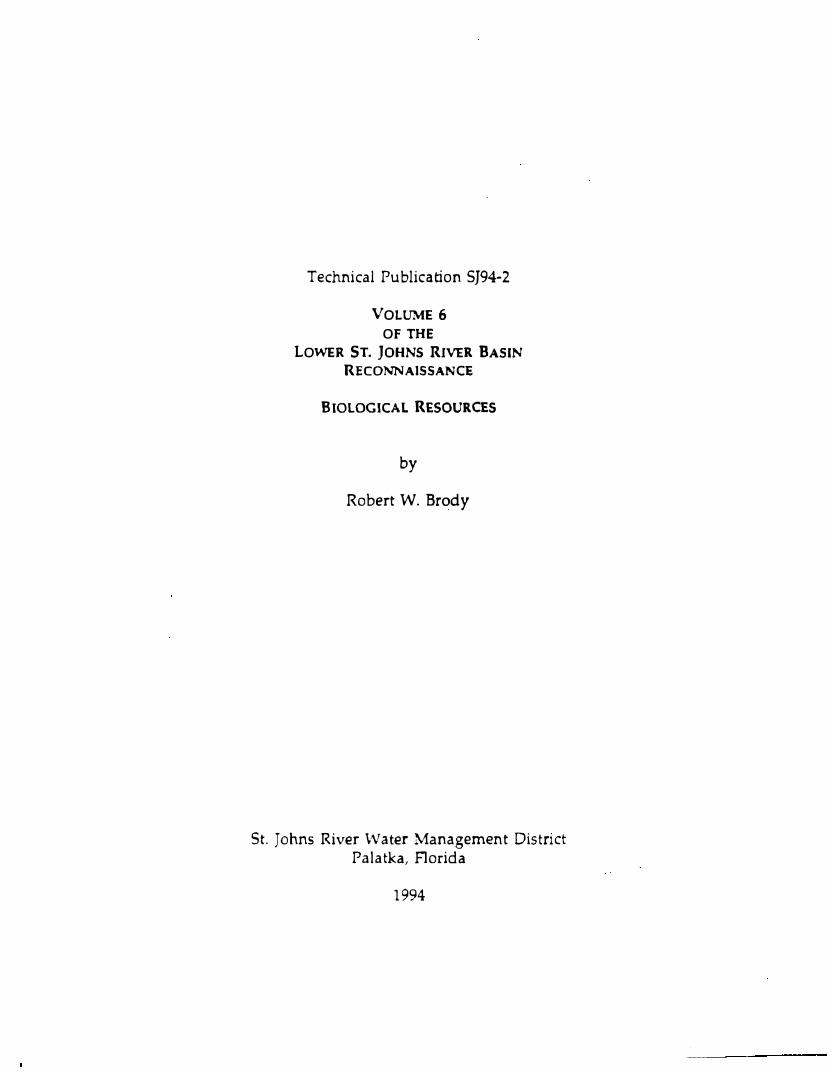
The St. Johns River Water Management District (SJRWMD) was created by the Florida Legislature in 1972 to be one of five water management districts in Florida. It includes all or part of 19 counties in northeast Florida. The mission of SJRWMD is to manage water resources to ensure their continued availability while maximizing environmental and economic benefits. It accomplishes its mission through regulation; applied research; assistance to federal, state, and local governments; operation and maintenance of water control works; and land acquisition and management.
Technical reports are published to disseminate information collected by SJRWMD in pursuit of its mission. Copies of this report can be obtained from:
�--------------------------------� Library
St. Johns River Water Management District P.O. Box 1429
Palatka, FL 32178-1429
Phone: (904) 329-4132
Contents
CONTENTS
List of Figures . . . . . . . . . . . . . . . . .. . . . . . . . .. . . . .. . . . . . vu
List of Tables . . . . . . . . . . . . . . . . . . . . . . . . . . . . . . . . . . . . . viii
ABSTRACT . . . . . . . . . . . . . . . . . . . . . . . . . . . . . . . . . . . . . . . . 1
INTRODUCTION . . . . . . . . . . . . . . . . . . . . . . . . . . . . . . . . . . . 7
PHYSICAL SETTING . . . . . . . . . . . . . . . . . . . . . . . . . . . . . . . . 15 Post-Miocene Geologic History . . . . . . . . . . . . . . . . . . . . . 15 Climate . . . . . . . . . . . . . . . . . . . . . . . . . . . . . . . . . . . . . . . 16 Physical Environment . . . . . . . . . . . . . . . . . . . . . . . . . . . . 18 Chemistry . . . . . . . . . . . . . . . . . . . . . . . . . . . . . . . . . . . . . 19
PLANTS AND PLANT COMMUNITIES . . . . . . . . . . . . . . . . . 21 Upland Associations . . . . . . . . . . . . . . . . . . . . . . . . . . . . . 22 Upland-Wetland Transition Associations . . . . . . . . . . . . . 24 Wetland and Emergent Aquatic Associations . . . . . . . . . . 26 Submerged Plant Associations . . . . . . . . . . . . . . . . . . . . . 34
Freshwater Grasses . . . . . . . . . . . . . . . . . . . . . . . . . . . 37 Seagrasses . . . . . . . . . . . . . . . . . . . . . . . . . . . . . . . . . 37
Phytoplankton and Primary Productivity . . . . . . . . . . . . . 40 Phytoplankton Studies . . . . . . . . . . . . . . . . . . . . . . . . 40 Primary Prod ucti vi ty . . . . . . . . . . . . . . . . . . . . . . . . . 43 Water Color and Turbidity . . . . . . . . . . . . . . . . . . . . . 44
FAUNA . . . . . . . . . . . . . . . . . . . . . . . . . . . . . . . . . . . . . . . . . . 46 Invertebrate Fisheries Resources . . . . . . . . . . . . . . . . . . . . 46
Blue Crab . . . . . . . . . . . . . . . . . . . . . . . . . . . . . . . . . . 46 Shrimp . . . . . . . . . . . . . . . . . . . . . . . . . . . . . . . . . . . . 50 Molluscs . . . . . . . . . . . . . . . . . . . . . . . . . . . . . . . . . . . 55
Finfish Fisheries Resources . . . . . . . . . . . . . . . . . . . . . . . . 56 Sport Fisheries Investigations . . . . . . . . . . . . . . . . . . . 56 Commercial Fisheries Investigations . . . . . . . . . . . . . . 59 Fisheries Landings Statistics . . . . . . . . . . . . . . . . . . . . 61 Shad Studies . . . . . . . . . . . . . . . . . . . . . . . . . . . . . . . . 62
St. Johns River Water Management District v
B IOLOG ICAL RESOU RCES
Ulcerative Disease Syndrome . . . . . . . . . . . . . . . . . . . 63 Habitat Assessment . . . . . . . . . . . . . . . . . .. . . . . . . . 64 Ongoing Research . . . . . . . . . . . . . . . . . . . . . . . . . . . 65
Aquaculture . . . . . . . . . . . . . . . . . . . . . . . . . . . . . . . . . . . 66
ECONOMIC IMP ACT OF FISHERIES . . . . . . . . . . . . . . . . . . . 68 Commercial Fisheries . . . . . . . . . . . . . . . . . . . . . . . . . . . . 68 Recreational Fisheries . . . . . . . . . . . . . . . . . . . . . . . . . . . . . 69
PROTECTION FOR BIOLOGICAL RESOURCES . . . . . . . . . . . 71 Species of Special Concern . . . . . . . . . . . . . . . . . . . . . . . . 71
Manatee Protection . . . . . . . . . . . . . . . . . . . . . . . . . . . 72 Endemic Species . . . . . . . . . . . . . . . . . . . . . . . . . . . . . 75
Aquatic Habitats . . . . . . . . . . . . . . . . . . . . . . . . . . . . . . . . 77 Classified Surface Waters . . . . . . . . . . . . . . . . . . . . . . 77 Outstanding Florida Waters . . . . . . . . . . . . . . . . . . . . 78 Aquatic Preserves . . . . . . . . . . . . . . . . . . . . . . . . . . . . 80
Fisheries Law Enforcement . . . . . . . . . . . . . . . . . . . . . . . . 80 Bioassessrnent Program . . . . . . . . . . . . . . . . . . . . . . . . . . 81
SUMMARY . . . . . . . . . . . . . . . . . . . . . . . . . . . . . . . . . . . . . . . 82 Hydrology . . . . . . . . . . . . . . . .. . . . . . . . .. . . .. . . . .. . 82 Salinity . . . . . . . . . . . . . . . . . . . . . . . . . . . . . . . . . . . . . . . 82 Blackwater . . . . . . . . . . . . . . . . . . . . . . . . . . . . . . . . . . . . 83 Plant Communities . . . . . . . . . . . . . .. . ..... . .. . . . . . . 84
Saltmarsh Communities . . . . . . . . . . . . . . . . . . . . . . . 84 Submerged Plants . . . . . . . . . . . . . . . . . . . . . . . . . . . . 84 Phytoplankton . . . . . . . . . . . . . . . . .. . . . . . . . . . . . . 85
Shrimping . . . . . . . . . . . . . . . . . . . . . . . . . . . . . . . . . . . . 85 Mollusc Populations . . . . . . . . . . . . . . . . . . . . . . . . . . . . . 86 Finfish Populations . . . . . . . . . . . . . . . . . . . . . . . . . . . . . . 86 Fisheries . . . . . . . . . . . . . . . . . . . . . . . . . . . . . . . . . . . . . . 87
Commercial Fishing . . . . . . . . . . . . . . . . . . . . . . . . . . 87 Sport Fishing . . . . . . . . . . . . . . . . . . . . . . . . . . . . . . . 88
RECOMMENDATIONS . . . . .. . . . . . . . . . . . . . . . . . . . . . . . . 89
References . . . . . . . . . . . . . . . . . . . . . . . . . . . . . . . . . . . . . . . . 93
St. Johns River Water Management District Vl
List of Figures
LIST OF FIGURES
1 Major surface water basins within the St. Johns River Water Management District . . . . . . . . . . . . . . . . . . . . . . . . . . . . . 8
2 Lower St. Johns River surface water basin . . . . . . . . . . . . . 9
3 Lower St. Johns River surface water tributary basins . . . . 11
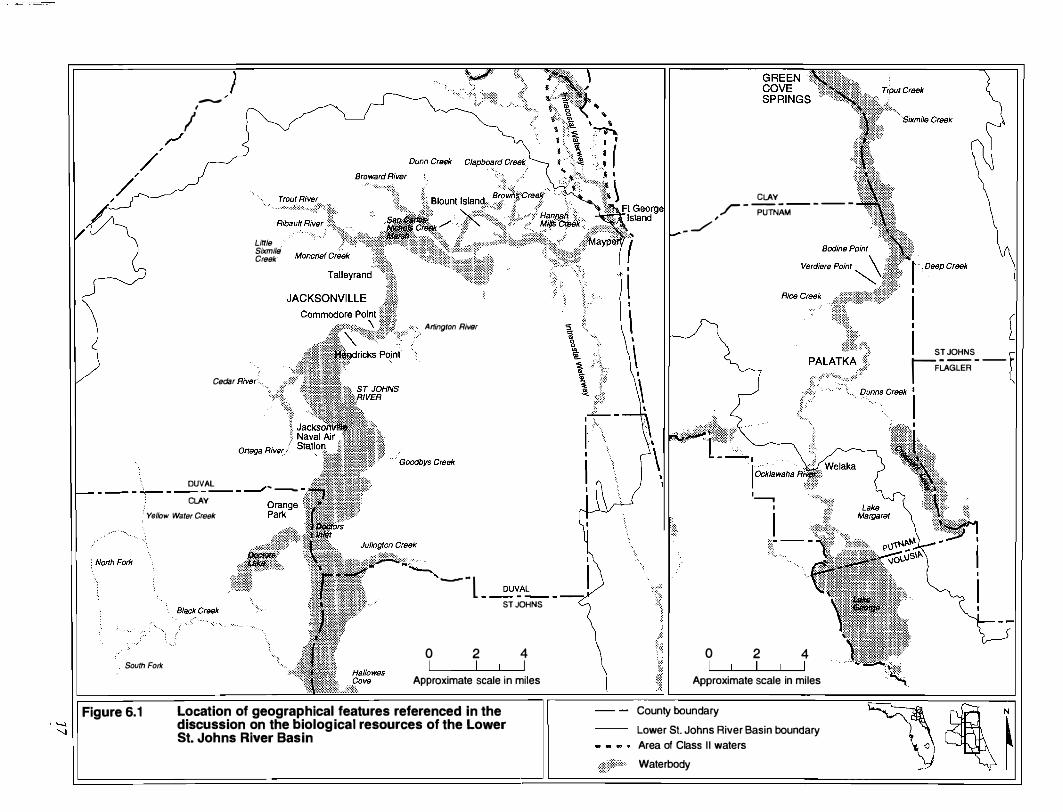
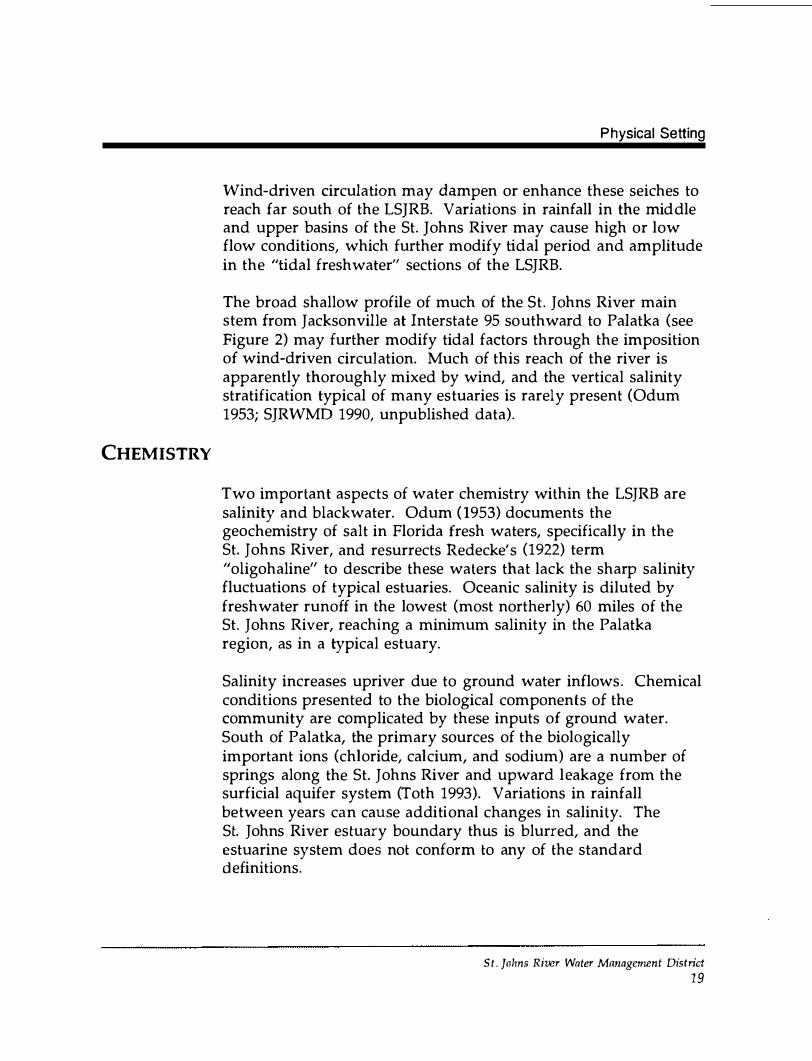
6.1 Location of geographical features referenced in the discussion on the biological resources of the Lower St. Johns River Basin . . . . . . . . . . . . . . . . . . . . . . . . . . . . . . . . . . . . 1 7
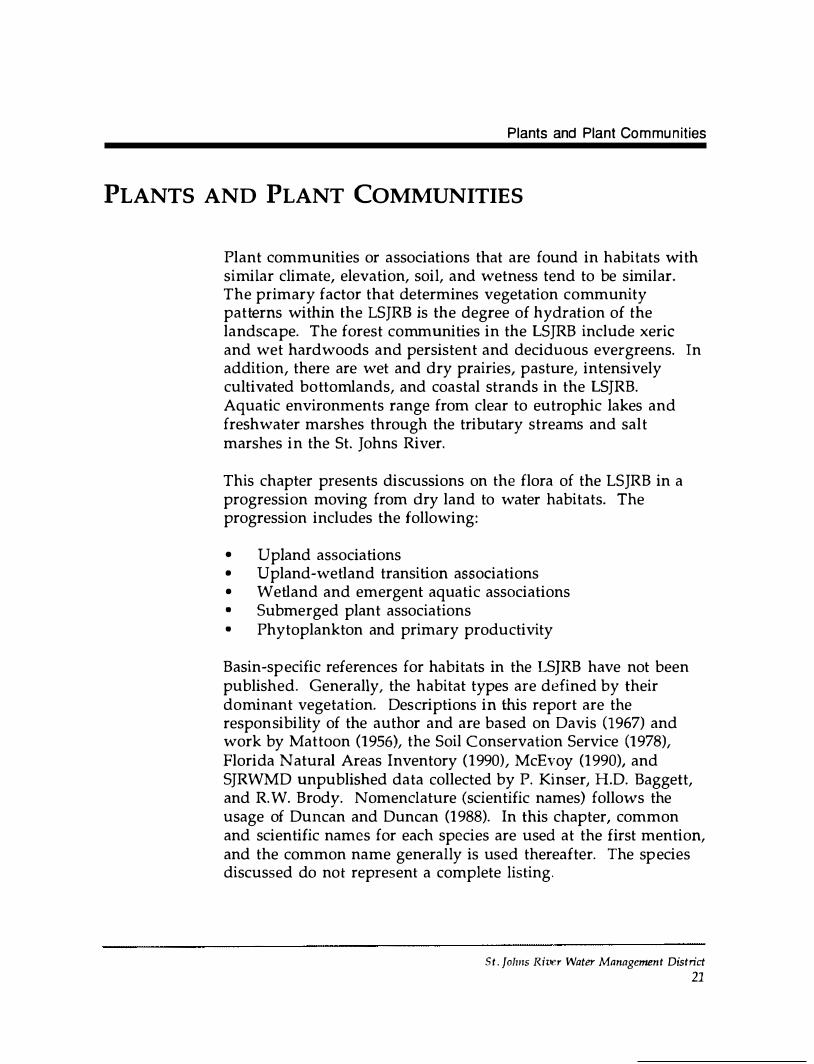
6.2 Lower St. Johns River Basin vegetative cover and land use 35
6.3 Outstanding Florida Waters in the Lower St. Johns River Basin . . . . . . . . . . . . . . . . . . . . . . . . . . . . . . . . . . . . . . . . 79
St. Johns River Water Management District vii
B IOLOGICAL R ESOU RCES
LIST OF TABLES
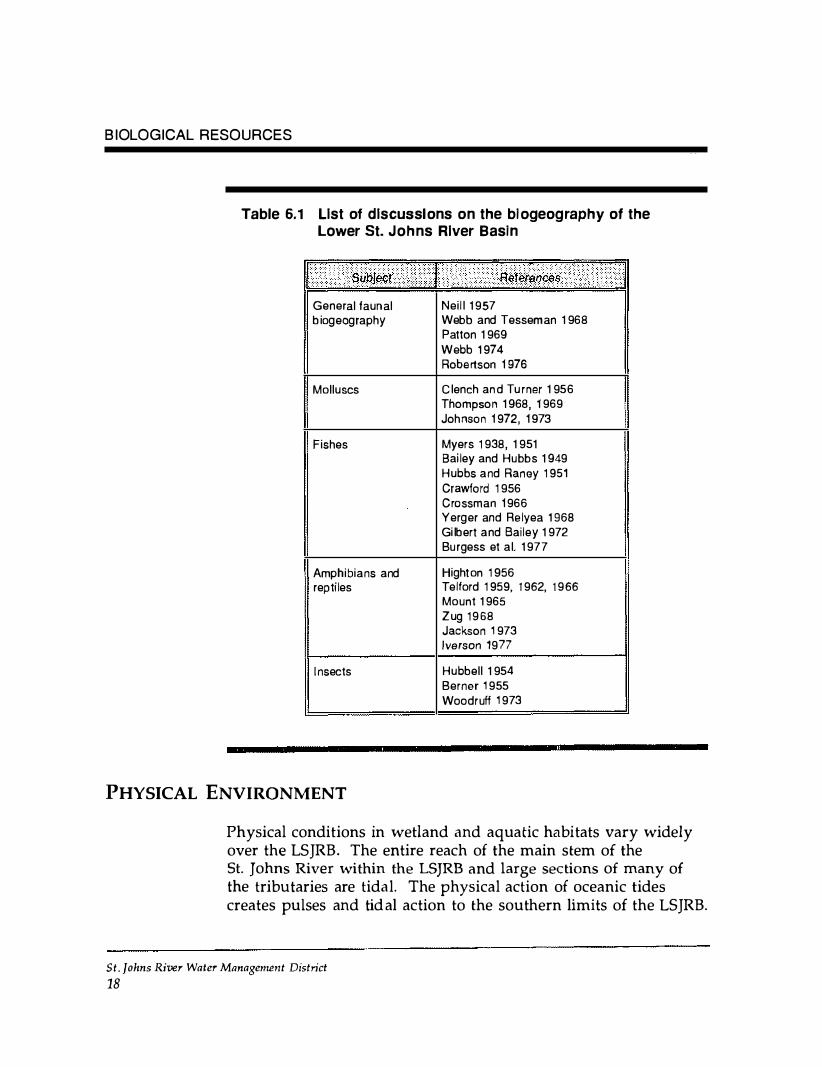
6.1 List of discussions on the biogeography of the Lower St. Johns River Basin . . . . . . . . . . . . . . . . . . . . . . . . . . . . 18
6.2 Wetland and aquatic plants of the Lower St. Johns River Basin . . . . . . . . . . . . . . . . . . . . . . . . . . . . . . . . . . . . . . . . 28
6.3 Common plants in saltmarsh communities in the Lower St. Johns River Basin . . . . . . . . . . . . . . . . . . . . . . . . . . . . 31
6.4 Blue crab landings . . . . . . . . . . . . . . . . . . . . . . . . . . . . . . 49
6.5 Penaeid shrimp landings, Duval County . . . . . . . . . . . .. 54
6.6 Commercial finfish landings, St. Johns River, 1982-88 . . . 61
6.7 Plant species in the Lower St. Johns River Basin listed as endangered, threatened, or rare . . . . . . . . . . . . . . . . . . . . 72
6.8 Fauna in the Lower St. Johns River Basin lis ted as endangered, threatened, species of special concern, or rare, or status undetermined . . . . . . . . . . . . . . . . . . . . . . . . . . . . . 73
St. Johns River Water Management District viii
Abstract
ABSTRACT
This report is Volume 6 in a series of reconnaissance reports about the Lower St. Johns River Basin (LSJRB). The lower St. Johns River is the northern part of the St. Johns River from the mouth of the Ocklawaha River in Putnam County to the inlet at the Atlantic Ocean in Duval County. The LSJRB includes nine counties in northeast Florida. The reconnaissance reports compile information and make recommendations to help resource managers identify priority needs for research into and management of the LSJRB. These reports are part of the research funded under the Surface Water Improvement and Management Act (SWIM) of 1987 (Sections 373.451-373.4595, Florida Statues).
Understanding and managing biological resources as part of the holistic natural system is an important SWIM Program goal. This volume has two purposes: (1) to review and summarize prior and ongoing work relating to aquatic and wetland biological communities in the LSJRB and (2) to develop a list of future informational needs. Information is analyzed through 1 990 literature.
The LSJRB is located at the boundary of the temperate and subtropical regions at the southern limits of the Carolinian biotic province. The post-Miocene history of this area includes a lternate exposure and oceanic inundation of large areas. These variations have shaped the elevations, soil exposures, and drainage patterns and largely control habitat differences. Prior sea levels also have caused several endemic species complexes to form (Black Creek complex; St. Johns-Ocklawaha river complex; St. Johns-Suwanee river complex), especially in lotic freshwater habitats.
"Blackwater" color and high turbidity limit light penetration in freshwater, oligohaline and estuarine reaches of the LSJRB, limiting submerged macrophyte and phytoplankton productivity and perhaps controlling sediment carbon, sulphur, and oxygen fluxes.
St. Johns River Water Management District
1
BIOLOG ICAL R ESOU RCES
The entire reach of the main stem within the LSJRB and large secfions of many of the major tributaries are tidal. Wind-driven circulation in the LSJRB and variations in rainfall in the middle and upper basins of the St. Johns system may modify tidal period and amplitude throughout the LSJRB. Ground water inflows, rich in chloride, calcium, and sodium upstream of the LSJRB, couple with tide to blur the estuarine biological boundary-the distribution of many marine fish and several invertebrate species far south of the LSJRB is documented. Physiologically appropriate salinities supplement traditional freshwater bass, bream, and catfish stocks by adding important fisheries and nursery areas (blue crab, shrimp, croaker, channel bass) in the oligohaline reaches. Extensive sport and commercial harvest of these and many other species occurs in the estuarine river and on the nearshore continental shelf. Salinity stratification is limited to the estuarine (seaward-most 25-mile) segment; wind mixes the water column upstream.
The primary determinant of vegetation community patterns in the LSJRB is the degree of hydration of the landscape. Forest communities include xeric and hydrophytic hardwoods and persistent and deciduous evergreens. Uplands are dominated by pine flatwoods, with considerable sandhill (old dune) habitat, also pine dominated, at higher elevations; a variety of oak species is present, but fire and fire management by humans in the past 1 0,000 years have maximized dominance by the pine species. Virtually all of the uplands have been timbered-off several times, and much of the area remains in silvaculture. Extensive areas of the bottomlands and former pine flatwoods of the St. Johns River valley have been under intensive management for agriculture since 1520. A major potato and cabbage crop is harvested from the LSJRB, as are ornamental plants and ferns, especially from areas along the river where irrigation is available from the Floridan aquifer system.
Tributary and mainstem wetlands in the LSJRB are dominated by wetland-hardwood forests; slight variations in elevation determine variations in soil hydration and species dominance, defining hardwood hammock, bay head, cypress swamp, and
St. Johns River Water Management District 2
Abstract
cypress dome associations within these forests. Freshwater marshes and wet prairies are minor components of the LSJRB vegetative cover because northeastern Florida's increased variations in elevation limit sheet flow. In addition to the wetland-hardwood forest, shoreline plant associations include cattail-, bulrush-, maidencane-, sedge-, and rush-dominated freshwater associations; water lily, pickerel weed, and arrowhead may dominate emergent vegetation with freshwater eelgrass (Vallisneria americana) as the dominant submerged macrophyte. Cordgrass and black needle rush dominate the emergent vegetation in salt marshes, but high tidal energies couple with biogeographic factors to prevent any of the marine seagrasses from colonizing the LSJRB. No references specific to the LSJRB for any of the foregoing communities appear in the referenced literature.
Research describing variations in phytoplankton speciation and plankton community nutrient dynamics over an annual cycle in the LSJRB is limited to two studies (1947 and 1985). Diatoms dominate the phytoplankton community in both studies, with a springtime "bloom" of green and blue-green algae. Primary productivity, diel oxygen balance, color-turbidity-light penetration interactions, and several other important factors from which nutrient budgets, effluent limitations, or pollution load reduction goals might be calculated are unreported for most reaches of the LSJRB.
Invertebrate fisheries resources within the LSJRB include blue crab, shrimp, and, of much lesser economic importance, molluscs (oysters, clams, and mussels). The blue crab fishery extends from the inlet at Mayport upstream through the LSJRB and at least as far south as Lake George (river mile 120); commercial landings vary from just below 1 million to nearly 3 million pounds per year over the past 10 years, with no clear indications of decline. Crabs mate from March to December throughout the St. Johns River, with spawning (February to October) occurring in the most seaward areas of the estuary; larvae are distributed by the tides, and post-larval crabs are found upstream within 6 to 10 weeks.
St. Jol!ns River Water Management District
3
B I OLOG ICAL RESOU RCES
Few St. Johns River crabs survive more than 1 year after reaching maturity.
Penaeid shrimp of three commercially important species (white, brown, and pink) enter the LSJRB after ocean spawning and larval development. All three species use the estuary as a nursery area, ascending into fresh water to varying degrees. Most abundant (and ascending furthest upstream) are white shrimp, which enter the St. Johns River (April through November), ascend as far as Palatka within 1 month, and may eventually move as far south as Astor, 130 miles from the ocean. Brown and pink shrimp do not typically ascend the St. Johns as far as the oligohaline reach; as temperatures decline in November, all species of shrimp leave the river. Total penaeid shrimp landings vary from about 0.9 million to 1.6 million pounds per year over the past 10 years, with white shrimp always comprising 90 percent or more of the total and pink shrimp never more than 3 percent; changes in reporting systems, seasons, and gear regulations preclude more detailed trend analysis of these data.
Finfish of the freshwater and oligohaline reaches are perhaps the best-studied biological resources of the LSJRB. The combined species list of modern authors identifies 170 species for the entire St. Johns River; only a few of the freshwater species on this list are absent from the LSJRB. Management and regulation of most biological resources in fresh water are the responsibility of the Florida Game and Fresh Water Fish Commission (FGFWFC); because marine species regulated by the Florida Department of Natural Resources (FDNR) are also common in oligohaline reaches of the LSJRB, FGFWFC law enforcement agents face complex responsibilities.
Freshwater sport fisheries investigations are reported since 1947, with a wide variety of studies undertaken. Largemouth bass, black crappie, other sunfishes, and catfish remain the most pursued gamefish species, with relatively stable levels of abundance (total biomass, number of species, numbers of game fish, and commercial fish) reported. Where submerged and emergent vegetation appear reduced, gamefish populations are
St. Johns River Water Management District 4
Abstract
diminished; however, no long-term (e.g., multi-year) vegetation analyses are reported . Variations in water levels (caused by variations in rainfall, irrigation, and flood control) are seen as very important in modifying gamefish (and commercial finfish) populations. Endemic striped bass are having only very limited reproductive success, if any: no native striped bass young-of-theyear have been reported during several surveys, and hatcheryreared juvenile stripers and sunshine bass (hybrids) maintain the fishery. Preliminary estimation of the mean economic activity generated by recreational fishing in the LS}RB in 1990 was $81.1 million (range $4.1-159.5 million).
Freshwater commercial finfish harvest (American eel, American shad, mullet, freshwater catfishes) is a carefully regulated enterprise in the LSJRB, with annual landings variable, but within a stable range, for each species. Decline of fisheries from overharvest, spawning habitat alteration or loss, destruction of marsh and floodplain, and deteriorating water quality from industrial and sewage effluent has not been demonstrated in existing reports. Although many authors suggest reduced juvenile recruitment is attributable to these factors, none of the commercial landings, fish population, or environmental data have been analyzed to test these assertions. The commercial fishing methods presently permitted in the LSJRB have a very small negative effect on gamefish species and sportfishing harvest: studies of all types of gear (wire traps, hoopnets, and gillnets) showed negligible mortality to these species when commercial fishing regulations were followed. Mean total economic activity for freshwater commercial fishing (1990) was $22.8 million (range $12.6-33 million) based on a dockside-landings value of $4.2 million.
Marine species and marine and estuarine habitats in the LSJRB are managed through statewide programs of FDNR; this agency has no fisheries research studies or biological data monitoring programs currently active in the LSJRB. Trip-ticket monitoring of Seafood Harvester licenseholders' reports produces part of the FDNR Marine Fisheries Information System database, but these records provide only economic (landings) data. Law enforcement
St.Jolms River Water Management District 5
B IOLOGICAL RESOURCES
in estuarine areas of the LSJRB is the responsibility of the Florida Marine Patrol. Agency studies (Florida Department of Environmental Regulation [FDER], St. Johns River Water Management District) of ulcerative disease syndrome and toxic contaminant tissue burden in estuarine fish are ongoing, but no definitive data are reported.
At least 15 active freshwater aquaculture enterprises are in the LSJRB, especially where Floridan aquifer system water is available, including catfish farms, baitfish rearing, and striped bass and American eel growout facilities. LSJRB mariculture is presently limited to nine oyster leases in Duval County. Streamlining of aquaculture permit processing (by six state and four federal agencies) during 1990-91 may encourage new seafood culture production.
The State of Florida has classified surface waters according to Chapter 1 7-3 Florida Administrative Code; all waters of the LSJRB are "Class III-Recreation and Propagation and Maintenance of a Healthy, Well-Balanced Population of Fish and Wildlife," with the exception of a small area of "Class 11-Shellfish Propagation or Harvesting" waters in Duval County. Several programs mandating special protection for species and habitats are active within the LSJRB; at least 14 plant species and 35 animal species are listed for special consideration by a variety of agencies. There are six Outstanding Florida Waters in the LSJRB, where restrictions on new FDER permits pertain. An ongoing FDER macroinvertebrate biological assessment program is being refined to develop a biological component of water quality evaluations; this program is presently focused on small freshwater streams but will ultimately extend to all Florida waters.
At present, there is a paucity of information from which to develop valid recommendations for improvement and management strategies for the LSJRB SWIM initiative. The primary need is additional data; virtually all types of research on the aquatic and estuarine biota and their environment are necessary. A list of specific recommendations is provided.
St. Johns River Water Management District
6
Introduction
INTRODUCTION
This report is Volume 6 in a series of reconnaissance reports about the Lower St. Johns River Basin (LSJRB). This compilation of information and recommendations provides resource managers with a basis for identifying priority needs for future research and actions regarding the LSJRB. The reconnaissance reports are part of the research funded under the Surface Water Improvement and Management (SWIM) Act of 1987 (Sections 373.451-373.4595, Florida Statutes).
The SWIM Act declares that many natural surface water systems in Florida have been or are in danger of becoming degraded from point and nonpoint sources of pollution and from the destruction of natural systems. The state's five water management districts, in cooperation with state agencies and local governments, were directed to set priorities for waterbodies of regional or statewide significance and to design plans for surface water improvement and management. Six waterbodies were named for immediate action, including the LSJRB.
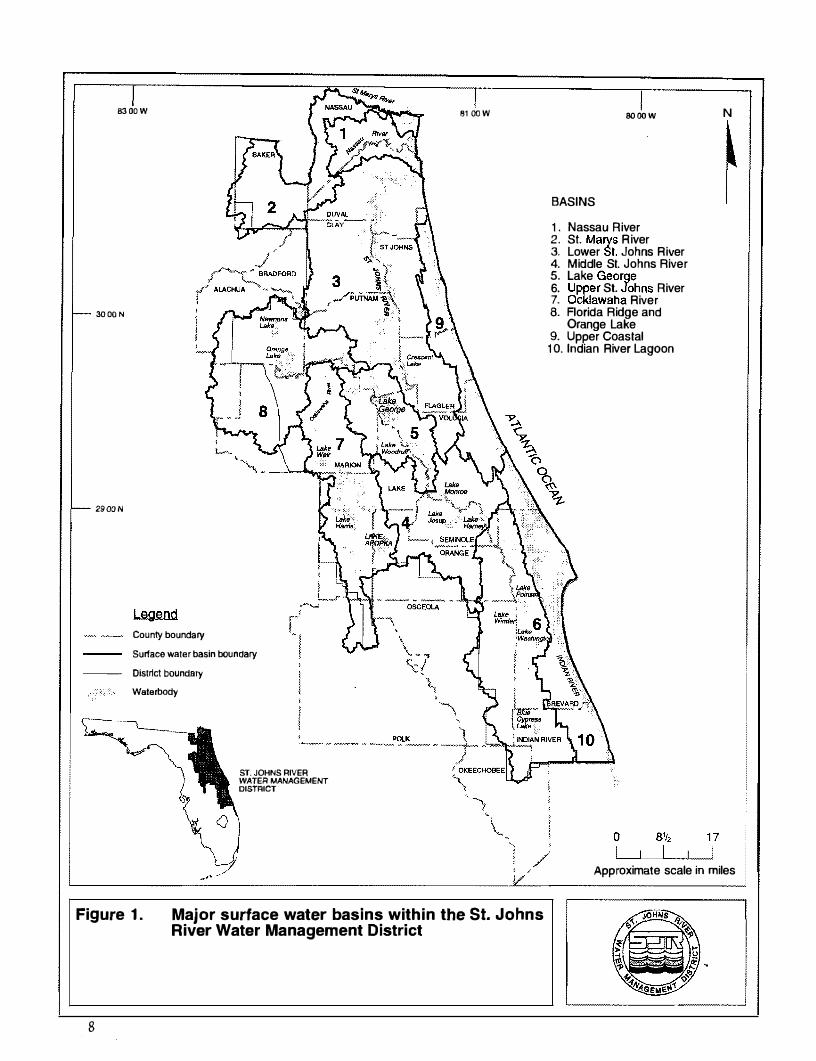
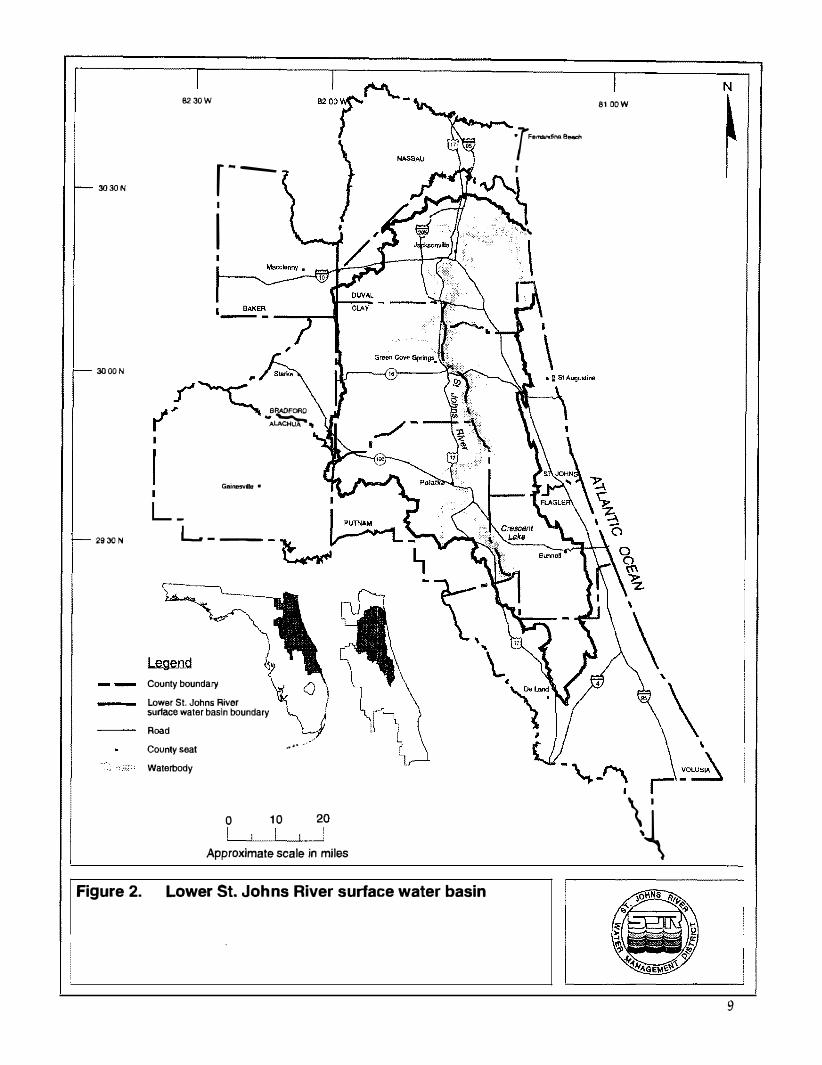
The LSJRB is one of ten surface water basins of the St. Johns River Water Management District (SJRWMD) (Figure 1). The LSJRB is located in northeast Florida and represents about 22 percent of the area within the boundaries of SJRWMD. The LSJRB extends from the City of De Land, in the south, to the inlet of the St. Johns River at the Atlantic Ocean. The LSJRB includes parts of nine counties: Clay, Duval, Flagler, Putnam, St. Johns, Volusia, Alachua, Baker, and Bradford (Figure 2).
The LSJRB is located in a transition area between the subtropical climate of southern Florida and the humid continental climate of the southeastern United States. The climate of the LSJRB is classified as humid subtropical, with an average summer maximum daily temperature of 32.2°C (90°F). In the winter, the LSJRB experiences below-freezing temperatures an average of 10 to 15 times per year. Average annual rainfall in the LSJRB is approximately 132 centimeters (52 inches). A large portion of the
St. Jolms Riner Water Management District 7
8300W
3000 N
2900N
Legend
County boundary
Surface water basin boundary
District boundary
Waterbody
ST. JOHNS RIVER WATER MANAGEMENT DISTRICT
B1 DOW
Figure 1. Major surface water basins within the St. Johns River Water Management District
8
BOOOW
BASINS
1 . Nassau River 2. St. Marys River 3. Lower St. Johns River 4. Middle St. Johns River 5. Lake George 6. Upper St. Johns River 7. Ocklawaha River 8. Florida Ridge and
Orange Lake 9. Upper Coastal
1 0. Indian River Lagoon
N
Approximate scale in miles
3030N
3000N
2930 N
Figure 2.
B230W
r---•
I
J'!-<. ·��·
r .. A� .. I
Gainesville •
L_ L- --
Legend County boundary
Lower St. Johns River surface water basin boundary
Road
County seat
Waterbody
... ,��. �·
0 10 20 I I I I
Approximate scale in miles
·T Fernardina Beach
I
......,.,...!_. � ''·.,,
\
Lower St. Johns River surface water basin
N 81 oow
\
VOlUS�
r-\. '�
9
BIOLOG ICAL RESOURCES
annual precipitation falls between June and September when convective activity generates showers and thunderstorms.
Landscape features within the LSJRB are rela ti vel y low and flat. Three ridge systems border the drainage area. Surface elevations range from sea level at the inlet to greater than 61 meters (m) (200 feet [ft]) in the western part of the LSJRB.
The St. Johns River is an elongated, shallow estuary with an extensive floodplain. The elevation of the St. Johns River at the mouth of the Ocklawaha River is less than 3.0 m (10 ft) above sea level, and the average gradient of the main river channel is only 0.022 meters per kilometer (0.1 feet per mile). Average annual tidal amplitude is 1.5 m (4.9 ft) at the ocean inlet and varies unequally upstream due to channel morphology. Due to the low gradient of the river, however, tides affect the entire LSJRB, along with the lower reaches of its tributaries. The mixing of salt water and fresh water has an influence on water quality as well as on the quantity and characteristics of sediments deposited in the LSJRB. Water quality conditions for the LSJRB range from good in the sparsely populated southern end of the basin to poor in the urban reaches of Jacksonville (Hand and Paulk 1992).
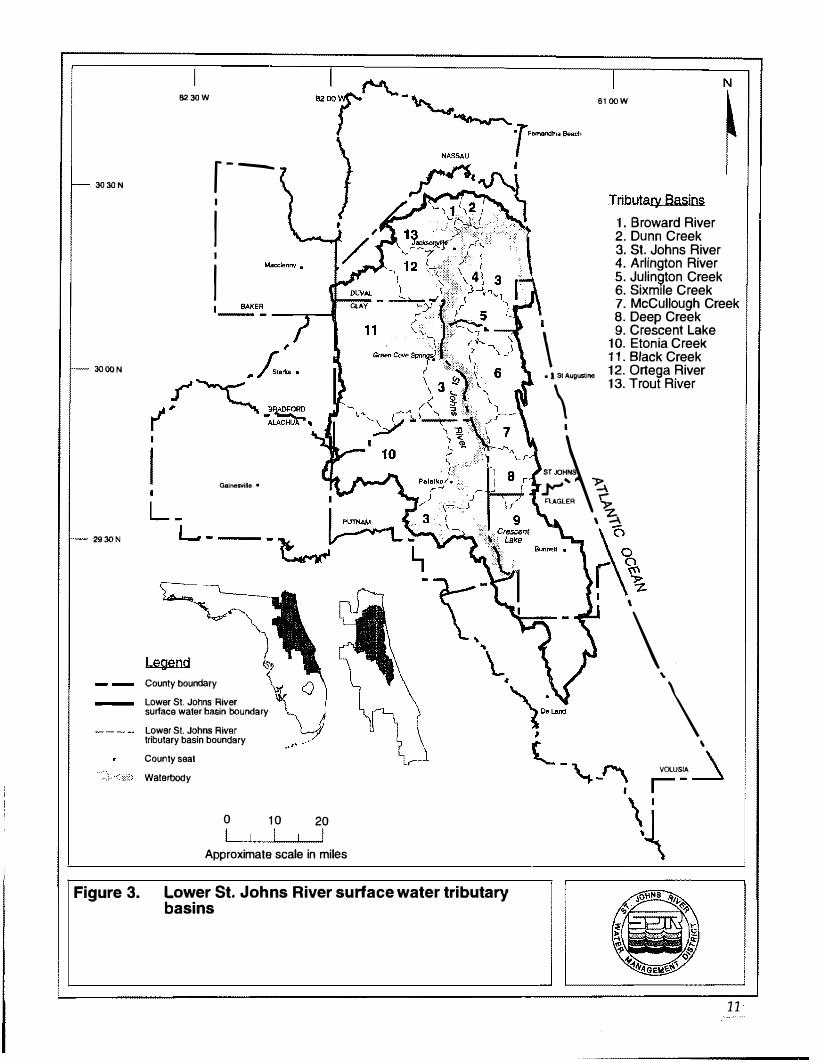
The LSJRB is drained by 12 major tributaries. The drainage basins of the tributaries are called tributary basins (Figure 3), and each bears the name of the major tributary flowing through it. A thirteenth tributary basin (the St. Johns River tributary basin) represents the minor tributaries draining directly into the St. Johns River.
The Lower St. Johns River Basin reconnaissance report provides a synthesis of what is known about the condition of the lower St. Johns River and its tributaries from three perspectives: hydrologic, environmental, and socioeconomic. Volume 1, Hydrogeologtj, presents information on the ground water flow system in the basin and its connection to surface waterbodies. Volume 2, Surface water hydrology, discusses the surface water system, including hydrologic and hydraulic data collection networks. Volume 3, Hydrodynamics and salinity of surface water,
St. Johns River Water Management District 10
3030N
3000N
2930N
Figure 3.
B230W
r---•
I I
I
Gainesville •
Legend County boundary
Lower St. Johns River surface water basin boundary
Lower St. Johns River tributary basin boundary
County seat
Wa!erbody
0 1 0 20 I I I I I
Approximate scale in miles
Lower St. Johns River surface water tributary basins
N 61 oow
Tributary Basins 1. Broward River 2. Dunn Creek 3. St. Johns River 4. Arlington River 5. JulinQton Creek 6. Sixm1le Creek 7. McCullough Creek
\ • I 51 Augustine
\ I
8. Deep Creek 9. Crescent Lake
10. Etonia Creek 11 . Black Creek 12. Ortega River 13. Trout River
STJOH�
............ -p FLAGLER t
\�
�\ I \
\ '
\ \
VOLUSIA \ ,-�
11
BIOLOG ICAL RESOU RCES
describes relationships between river water levels, velocity, flow, storage, and salinity and reviews previous hydrodynamic modeling studies. Volume 4, Surface water quality, and Volume 5, Sediment characteristics and quality, present details on the levels and trends of chemical contaminants present in the water column and in the bottom sediments. Volume 6, Biological resources, describes plant communities and fish, shellfish, and marine animal communities. Volume 7, Population, land use, and water use, ties population estimates and projections to land use and residential, commercial, industrial, and agricultural water use. Volume 8, Economic values, discusses the commercial, recreational, and aesthetic values of the river. Finally, Volume 9, Intergovernmental management, discusses jurisdictional boundaries, regulatory authorities, and management efforts of governmental agencies, offices, and commissions involved in restoration or protection of water quality and habitat.
This volume, B iological resources, focuses on the water-related resources of the LSJRB. It lists many of the plant and animal species present in the LSJRB and examines the associations or communities of species that form as a result of interactions of the organisms with each other and their habitat. This volume has two purposes: (1) to review and summarize prior and ongoing work relating to the aquatic and wetland biological communities and (2) to develop a list of future informational needs.
Understanding and managing biological resources as part of the holistic natural system is an important SWIM program goal. Many of the resources in the LSJRB are harvested: fish and shellfish for food, trees for timber or paper. Use of some resources is more subtle, and the resource value, therefore, is more difficult to calculate. For example, the capacity of a wetland community to utilize nutrients and the sediments produced by anthropogenic sources is a biological resource. The ability of certain marine fish and invertebrates to adapt to mineral-rich fresh waters of the St. Johns River, extending their range (and increasing the fishery) to 200 miles upstream of the Atlantic, is a different type of biological resource. A diverse avian fauna or the presence of an endangered bird species may
St. Johns River Water Mmmgement District
12
I ntroduction
delight a bird watcher and provide a valuable recreational biological resource.
Our regulatory and environmental management efforts may seek to define general classifications ("healthy" environments or "eutrophic" tributaries) or to set specific chemical standards (e.g., dissolved oxygen concentration above 5 milligrams per liter [mg/ L]), but ultimately all are aimed at protection of the biological constituents of the system.
The LSJRB has been inhabited continuously by man for at least 10,000 years and has been the home of people of European descent since 1562. Despite this pattern of cultural utilization, little information on the river's biological resources has been recorded in the scientific literature, and no recent summary exists. For instance, there are only four phytoplankton and two saltmarsh studies for the LSJRB, and few resource studies exist for most of the major biological communities in the basin.
Computer literature searches of several databases produced references to some reports, and all references mentioned in those reports were researched. Further references were obtained through the LSJRB Biology Work Group, a SWIM-sponsored interagency committee composed of individuals from local, state, and federal agencies and academia. References also were obtained through other academic and agency colleagues.
Few of the biological resource investigations carried out in the LSJRB have been reported in peer-reviewed journals. Local, state, and federal agencies responsible for environmental monitoring and regulation actions and a few academic researchers working in this region have collected a large body of data that has never been analyzed or published. This information could not feasibly be included in this review. Several contracts have been let by SJRWMD to some of these researchers in an attempt to upgrade the information database; this data should be published during the next 3 years. Reports, newspapers, and popular magazines were not included in this review.
St. Johns River Water Management District 13
BIOLOGICAL RESOURCES
Only studies specifically carried out in the LSJRB are included in this report. Kurz and Wagner's 1957 repo rt, Tidal marshes of the
Gulf and Atlantic coasts of northern Florida and Charleston, South Carolina, for example, is not reviewed because that study was carried out in the Nassau River and South Carolina habitats, not in the St. Johns River. Comprehensive consideration of upland communities also is beyond the scope of this report.
St. Johns River Water Management District
14
Physical Setting
PHYSICAL SETTING
This chapter describes the physical-chemical-climatological factors that delimit biological distributions within the LSJRB and reviews biogeographic evidence for past and present patterns.
POST-MIOCENE GEOLOGIC HISTORY
Changes in sea level due to glaciation and tectonic activity periodically have alternately inundated or exposed large areas of the Florida peninsula and caused variations in the distribution of many organisms in the LSJRB.
The work of Cooke and Mossom (1925), Cooke (1939), and Carr (1940) provided summaries about the Pliocene-Pleistocene age geology of peninsular Florida and were the context upon which many zoogeographic studies were based. Burgess and Franz (1978) reviewed these and several more recent papers on geology: Cooke (1945), Alt and Brooks (1965), Alt (1 968), and Pirkle et al. (1974). Burgess and Franz (1978) also reviewed the zoogeography of the aquatic fauna of the St. Johns River system and identified several species complexes endemic to the Black Creek Basin, the St. Johns and Ocklawaha rivers, the St. Johns River-Suwannee River system, or as disjunct populations in the St. Johns River or Santa Fe River-St. Johns River system (see Figures 1 and 3). The Suwannee River and the Santa Fe River are outside the SJRWMD boundaries.
Organisms representing a number of lotic freshwater groups probably migrated into Florida sometime in the Pliocene Epoch and may well have survived on the "Ocala Island," the submergence of the bulk of the peninsula by the Atlantic in the late Pliocene Epoch. During the Wicomico interglacial period, the Ocala Island was separated from the continental Piedmont by the Suwannee Straits, which prevented migration of most continental freshwater forms until well into the Pleistocene Epoch. Other freshwater faunal elements may have survived on offshore
St. Johns River Water Management District 15
B IOLOG ICAL RESOURC ES
CLIMATE
islands in the present Brooksville, Lakeland, and Lake Wales areas. Burgess and Franz (1978) presented faunistic evidence that subsequent fluctuations of sea level and solution erosion in the Santa Fe River Basin separated the lotic fauna of the Ocala Island into the present freshwater populations of the Santa Fe RiverSuwannee River drainage system and those now present in the St. Johns and Ocklawaha rivers.
Black Creek (Clay County)., Yellow Water Creek (Duval County), and Rice Creek (Putnam County) (Figure 6.1) are easterly flowing streams which are located in the region of the former Ocala Island. These streams emptied directly into the Atlantic Ocean until at least as late as the Pamlico glaciation in the midPleistocene Epoch (Cooke 1945), when the present St. Johns River channel was formed. Kingsley Lake, one of the few remaining oligotrophic lakes in the state, feeds Black Creek on the Trail Ridge (see Bergman 1992 for a discussion of the LSJRB physiography). Elevations over 100 ft above present sea level have been exposed since the late Pliocene Epoch and are thus among the oldest terrestrial/freshwater habitats in the state. Several endemic species apparently were isolated in this region during interglacial periods of higher sea leveL
Several authors reviewed the distributional evidence and provided biogeographic discussions of a number of different groups of animals present in the LSJRB or adjacent areas (Table 6.1) . These works were not reviewed in this report, but they are listed in the references.
The LSJRB is situated at the boundary of the warm temperate and subtropical regions of the United States east coast, near the southern limits of the "Carolinian" biotic province (Cape Hatteras to Cape Canaveral) of Cowardin et al. (1979). A number of organisms reach their northern or southern limits of distribution in this area.
St. Johns River Water Management District
1 6
�
-'
I
Cedar
Little Sixmillii Creek
\ DUVAL � - -- - -.- - ----- - --" -CLAY ' Yellow Water Creek
South Forie
Arlington River
-
Ml - �v_A_L __ _
ST JOHNS
0 2 4
Approximate scale in miles
Figure 6.1 Location of geographical features referenced in the discussion on the biological resources of the Lower St. Johns River Basin
_ .../ ,
0
CLAY r - MNAM-- --- -
I ---, I
I
2 4 Approximate scale in miles
County boundary
Lower St. Johns River Basin boundary
Area of Class II w aters
Waterbody
ST JOHNS
rFi:Am---
B IOLOGICAL RESOURCES
Table 6.1 List of discussi ons on the biogeography of the Lower St. Johns River Basin
General faunal biogeography
Molluscs
Fishes
Amphibian s and reptiles
In sects
Neil l 1 95 7 Webb and Tesseman 1 96 8 Patton 1 969 Webb 1974
Robertson 1976
Clench and Tu rner 1 956 Thompson 1 96 8, 1969 Johnson 1972, 1973
Myers 193 8, 1 951 Bailey and Hu bbs 1 949 H u b b s and Raney 1951
Crawford 1956 Cro ssman 1966 Yerger and Re lyea 1968
Gilbert and Bailey 1 97 2 Bu rgess et al. 1 977
Highton 1956 Tel ford 1959, 1962, 1966 Mount 1 96 5 Zug 1968 Jackson 1 973 Iverson 1977
Hu bbell 1 954 Bern er 1955 Woodruff 1973
PHYSICAL ENVIRONMENT
Physical conditions in wetland and aquatic habitats vary widely over the LSJRB. The entire reach of the main stem of the St. Johns River within the LSJRB and large sections of many of the tributaries are tidal. The physical action of oceanic tides creates pulses and tid al action to the southern limits of the LSJRB.
St. Johns River Water Managemertt District 18
CHEMISTRY
Physical Setting
Wind-driven circulation may dampen or enhance these seiches to reach far south of the LSJRB. Variations in rainfall in the middle and upper basins of the St. Johns River may cause high or low flow conditions, which further modify tidal period and amplitude in the "tidal freshwater" sections of the LSJRB.
The broad shallow profile of much of the St. Johns River main stem from Jacksonville at Interstate 95 southward to Palatka (see Figure 2) may further modify tidal factors through the imposition of wind-driven circulation. Much of this reach of the river is apparently thoroughly mixed by wind, and the vertical salinity stratification typical of many estuaries is rarely present (Odum 1953; SJRWMD 1990, unpublished data).
Two important aspects of water chemistry within the LSJRB are salinity and blackwater. Odum (1953) documents the geochemistry of salt in Florida fresh waters, specifically in the St. Johns River, and resurrects Redecke's (1922) term "oligohaline" to describe these waters that lack the sharp salinity fluctuations of typical estuaries. Oceanic salinity is diluted by freshwater runoff in the lowest (most northerly) 60 miles of the St. Johns River, reaching a minimum salinity in the Palatka region, as in a typical estuary.
Salinity increases upriver due to ground water inflows. Chemical conditions presented to the biological components of the community are complicated by these inputs of ground water. South of Palatka, the primary sources of the biologically important ions (chloride, calcium, and sodium) are a number of springs along the St. Johns River and upward leakage from the surficial aquifer system (Toth 1993). Variations in rainfall between years can cause additional changes in salinity. The St. Johns River estuary boundary thus is blurred, and the estuarine system does not conform to any of the standard definitions.
St. Johns River Water Management District 19
BIOLOG ICAL RESOU RCES
Since the bottom of the river channel is below sea level, seawater may well be forced up the estuary along the bottom throughout the main stem in the LSJRB and into the tributaries. Odum (1953) states: "How far marine salt comes upstream as wedges of bottom water in the St. Johns river is not yet known" (p. 141) . In 1992, that question remained unanswered.
The distribution of many marine fish and several invertebrate species south of the upstream limit of the LSJRB has been noted by several authors (Carr 1937; Gunter 1942; McLane 1955). Odum (1953) provided experimental evidence that chlorinities between 0.1 and 1.0 parts per thousand (%o) in otherwise fresh water are important to the survival of the blue crab (Callinectes sapidus). Evidence for other marine species (e.g., croaker [Micropogon ], sting rays [Dasyatis], channel bass [S ciaenops]) south of the LSJRB also is reported (Odum 1953). Appropriate salinities affect the important commercial blue crab fishery, the extensive oligohaline nursery area for post-larval shrimp, and the sport and commercial harvesting of several finfish species in the LSJRB.
As of 1990, no further research specific to the LSJRB habitats regarding the nature of this geochemical resource (i.e., ground water inflows) nor the changes that extensive development may have upon the chemistry of the oligohaline system had been published.
The St. Johns River and most of its tributaries within the LSJRB are "blackwater" systems. The color results from high loads of suspended material and tannins (non-volatile polymeric carboxylic acids) from the breakdown of forest leaf litter. The dark color and turbidity limit light penetration and probably limit sessile plant growth to the shallows. Limited light penetration also may reduce the extent of the euphotic zone available to the phytoplankton community. This blackwater system (the LSJRB) probably includes high bacterial, organic, and inorganic chemical oxygen demand, but these aspects of the river's ecosystem have not been studied.
St. Johns River Water Management District
20
Plants and Plant Communities
PLANTS AND PLANT COMMUNITIES
Plant communities or associations that are found in habitats with similar climate, elevation, soil, and wetness tend to be similar. The primary factor that determines vegetation community patterns within the LSJRB is the degree of hydration of the landscape. The forest communities in the LSJRB include xeric and wet hardwoods and persistent and deciduous evergreens. In addition, there are wet and dry prairies, pasture, intensively cultivated bottomlands, and coastal strands in the LSJRB. Aquatic environments range from clear to eutrophic lakes and freshwater marshes through the tributary streams and salt marshes in the St. Johns River.
This chapter presents discussions on the flora of the LSJRB in a progression moving from dry land to water habitats. The progression includes the following:
• Upland associations • Upland-wetland transition associations • Wetland and emergent aquatic associations • Submerged plant associations • Phytoplankton and primary productivity
Basin-specific references for habitats in the LSJRB have not been published. Generally, the habitat types are defined by their dominant vegetation. Descriptions in this report are the responsibility of the author and are based on Davis (1967) and work by Mattoon (1956), the Soil Conservation Service (1978), Florida Natural Areas Inventory (1990), McEvoy (1990), and SJRWMD unpublished data collected by P. Kinser, H.D. Baggett, and R. W. Brody. Nomenclature (scientific names) follows the usage of Duncan and Duncan (1988). In this chapter, common and scientific names for each species are used at the first mention, and the common name generally is used thereafter. The species discussed do not represent a complete listing.
St. Jolms River Water Management District
21

B I OLOGICAL RESOURCES
Several plant guides exist for the wetland areas of Florida in general and are useful for identification of the LSJRB species. Dressler et al. (1987) is considered the most legally authoritative because it is used for defining boundaries in jurisdictional wetlands of Florida. Other useful wetland plant guides from government agencies include Tarver et al. (1978) and Pierce (1977). Federal wetland delineation procedures have been re-organized and are presented in the Wetland Training Institute (1989) manual, but this manual is not specific to Florida.
UPLAND ASSOCIATIONS
Undeveloped uplands of the LSJRB are primarily pine woods. The most important dominant species at the time of the first systematic cataloging of this area (Nash 1895) were longleaf pine (Pinus palustris) and slash pine (P. elliotii) . These two species tend to be most common on the higher, better drained soils of the areas west of the St. Johns River. Natural conditions in Florida favored the more fire-resistant longleaf pine; current silvaculture practices throughout the LSJRB favor the faster growing slash pine.
Open woodlands, called flatwoods, form a large part of the upland habitat of the LSJRB and are typically composed of one to three species of pine (longleaf, slash, and pond pine [Pinus serotina] ) with small trees, shrubs, saw palmetto (Serenoa repens), and herbs forming the understory. These flatwood areas may also include cypress and bay swamps, small hardwood forests, prairies, and marshes. Typical pine flatwoods west of the St. Johns River are dominated by slash pine. Pond pine is the naturally dominant species in the poorly drained, sandy soils of many areas east of the St. Johns River. In pond pine woods, one or more species of bay tree are often present.
In "sand hill" areas, typically at higher localized elevations on old dunes, longleaf pine may dominate. In these habitats, the understory is dominated by xerophytic (dry site) oaks, particularly turkey oak (Quercus laevis), with blue-jack oak (Q. incana) and sand post oak (Q. margaretta) sometimes present.
St. Johns River Water Management District 22
Plants and Plant Communities
The other dominant understory species in this upland pine forest is wiregrass (Aristida stricta).
Sand pine (P. clausa) is natively dominant on the better drained, deep sandy soils of the old dunes in the coastal strand and in the relict dunes near the St. Johns River. Common understory trees in the sand pine scrub community may include myrtle oak (Q. myrtifolia), sand live oak (Q. geminata), and chapman oak (Q. chapmanii).
Extensive areas of the bottomlands and former pine flatwoods east of the St. Johns River have been under intensive management for agriculture since the arrival of European settlers. Rich alluvial soil and warm temperate climate combine with improved drainage, grading, and availability of Floridan aquifer system water to permit a large part of St. Johns, eastern Putnam, and western Flagler counties to be planted in a variety of vegetable crops, principally potatoes and cabbage in winter, with sweet corn and other market species-including ornamental plants-grown as early summer crops.
Fire management in the past few centuries has changed the natural vegetation patterns. Silvaculture practices include managed burning to reduce understory and reduce competition for nutrients between the conifer species and the deciduous hardwoods. Managed burning tends to be carried out during winter, while natural wildfires are more frequent during summer thunderstorm periods. Present efforts to extinguish natural wildfires (to protect human economic interests) and to limit burning to conifer tree-farms encourage hardwood species to infiltrate the unmanaged pine forests. Once a hardwood forest has become established, cooler and more humid conditions prevail, reducing the likelihood of extensive fire. Diversity of vegetation structure tends to increase, with a concurrent increase in animal species diversity. However, in Florida's sand environments, the increase in accumulation of organic materials, such as humus (and the consequent increase in plant species diversity found in continental forests), does not occur rapidly.
St. Johns River Water Management District 23
B IOLOG ICAL RESOU RCES
The upland forest systems may be returning to an appearance of prehistorical habitats, however. Following the last glacial period, northern Florida was largely covered by oak-dominated forests, with patches of prairie. Pollen studies of Holocene Epoch lake sediment cores suggest that about 7,000 B.P., precipitation increased and temperature decreased (Watts 1971 ). This climatic change with increased rainfall may have been accompanied by increased incidence of thunderstorms and lightning. Charcoal fragments in the lake sediment cores demonstrate an increased incidence of fire. Meso-Indian cul tures, using fire to drive game, may have helped to reduce the oak/prairie habitat and caused its replacement by pines (McEvoy 1990). Bartram (1791) confirms the then-current practice of driving game with fire (p. 107). His book also suggests, although in no quantitative manner, the preponderance of oak-mixed hardwood communities in the mid-1700s and rarely described pine forests in the LSJRB. This may, however, be a result of Bartram' s itinerary: he traveled mostly by small sailing boat and would have been limited largely to viewing the wetland-hardwood swamp communities during his LSJRB journeys.
Some remnants of the Holocene Epoch oak forest associations, more characteristic of the continental United States Piedmont region, are present in the LSJRB. These forests are typically isolated in the higher elevations of Duval, Clay, and northern Putnam counties . These habitats are termed "upland hardwood hammocks," a diverse warm-temperate/piedmont community which can include black cherry (Prunus serotina), pignut hickory (Carya glabra), southern magnolia (Magnolia grandiflora), and a variety of oaks (Quercus spp. ), especially live oak (Q. virginiana). The live-oak/magnolia forest community has recently been reviewed by Daubenmire (1990) from data gathered outside the LSJRB.
UPLAND-WETLAND TRANSITION ASSOCIATI ONS
There is no abrupt demarcation between upland and wetland plant communities; rather, the transition is controlled by the periodic inundation of the habitat by seasonal rainfall or flooding
St. Johns River Water Management District
24
Plants and Plant Communities
from rivers and streams. The length of time that water remains in the particular site (wetland hydrology) will in part determine soil chemistry by creating anaerobic conditions (hydric soils). These factors in turn determine the nature of the plant community found at a particular place and the proportion of hydrophytic vegetation classes (obligate wetland plants, facultative wetland plants, and / or facultative plants) that may exist (Wetland Training Institute 1989). Because abrupt demarcation is usually absent, wetland determination, in the legal sense, is carried out using all three criteria (hydrology, soils, and plant species).
An important habitat type in the LSJRB is the stream and its river swamp forest, generally termed "wetland-hardwood forest." This is a periodic wetland habitat with inundation ranging from a few weeks per year to daily, tide-driven soil hydration. A very wide variety of hydrophytic (wet-site) trees can be found here, including pond and bald cypress (Taxodium ascendens and T. distichum), red maple (Acer rubrum), sweet gum (Liquidambar styraciflua), river birch (Betula n igra), water hickory (Carya aquatica), and one or more of the tupelo (Nyssa), willow (Salix), or oak (Quercus) species.
Most typical wetland-hardwood forests in the LSJRB contain hardwood "hammocks" : areas of slightly higher elevation dominated by mesophytic (moist-site) oaks, including willow oak (Quercus phellos), laurel oak (Q. hemisphaerica), and live oak. Swamp chestnut oak (Q. michauxii) and many of the hydrophytic species mentioned above are also found sometimes on the hammocks. In floodplain areas of wetland-hardwood forests, diamond-leaf oak (Q. laurifolia) and water oak (Q. nigra) are not uncommon. Loblolly pine (P. taeda) is present in varying abundance in specific localities, particularly along tributary streams and rivers where good quality, alluvial soil is found. Pond pine and occasionally other pine species are also present in areas where flooding is shallow and of brief duration.
Bay swamp or ''bay head" (also termed "bay gall") habitats may be found in higher-moisture conditions, with wetter, more
St. Johns River Water Management District 25
B IOLOG ICAL RESOURCES
organic soils than the hardwood hammock habitat. These habitats are dominated by trees such as loblolly bay (Gordonia lasianthus), sweet bay (Magnolia virginiana), red bay (Persea borbonia), and slash pine. Typical understory plants may include wax myrtle (Myrica cerifera), large gallberry (Ilex myrtifolia), swamp titi (Cyrilla racemiflora), and black titi (Cliftonia monophylla). Somewhat similar habitats with a high concentration of black titi and swamp titi may be termed "titi swamps." In both types of swamps, cypress and hydrophytic hardwoods also may be present.
Cypress may form pure stands or predominate in an association termed a "cypress dome" in flatwood areas or in the wettest sections of otherwise well-drained uplands. The LSJRB formerly had extensive areas of cypress "swamp" in the bottomlands of the river and its tributaries. Logging in the nineteenth and early twentieth centuries all but eliminated cypress swamps as nearmonocultures. This habitat now is largely a wetland-hardwood community. The two forms of cypress (pond cypress [Taxodium ascendensJ and bald cypress [T. distichumJ) are defined as subspecies of a single species by some authors, but as two distinct species by most. In mixed stands where cypress is the dominant tree form, both bald and pond cypress may be found with some representatives of any of the hydrophytic hardwood species or with slash pine. In some drier localities, bald cypress is also found associated with laurel oak, sweet gum, and sweet bay.
WETLAND AND EMERGENT AQUATIC ASSOCIATIONS
There are three major wetland community types in the LSJRB: freshwater marsh, wet prairie, and salt marsh. No comprehensive list of the saltmarsh plants or submerged and emergent aquatic macrophytes specific to the basin has previously been compiled and published. A few site-specific plant lists are found in the literature, primarily in environmental impact statements (for a variety of projects such as power plant siting and housing and marina developments) and in Florida Game and Fresh Water Fish Commission (FGFWFC) and Florida Department
St. Johns River Water Management District
26
Plants and Plant Commu nities
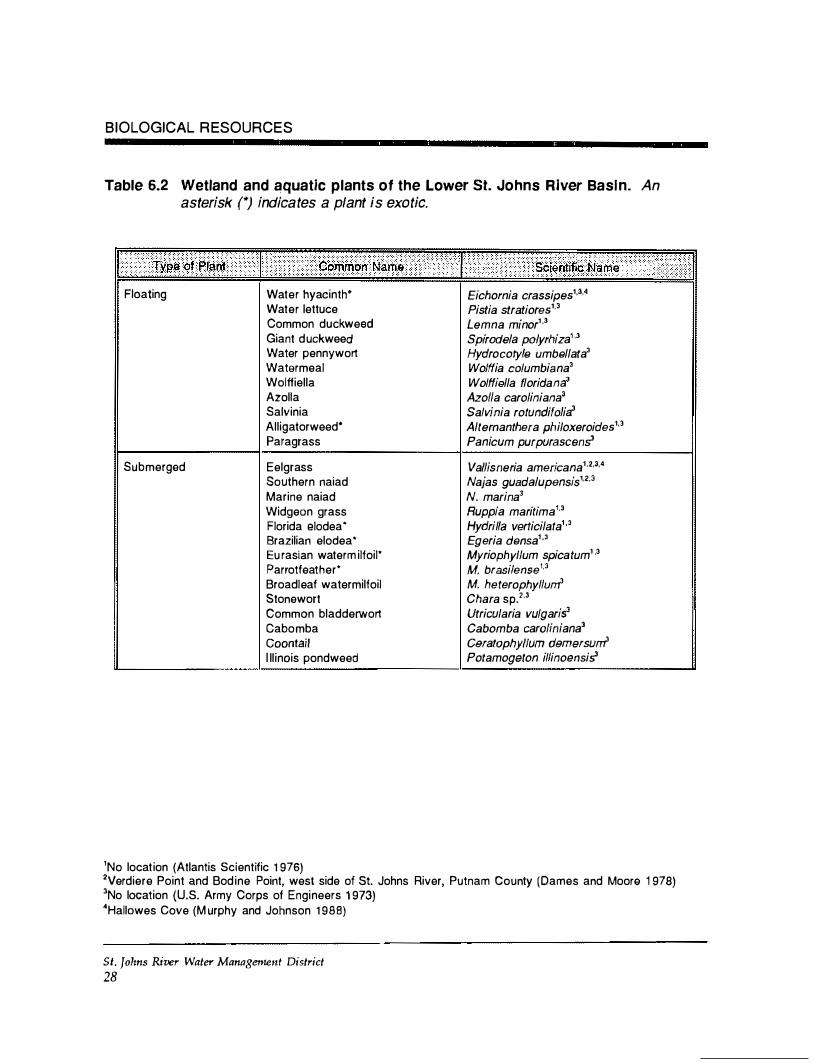
of Natural Resources (FDNR) reports. These reports include Joyce (1965), Rehm et al. (1975), Atlantis Scientific (1976), Dames and Moore (1978), DeMort (1984), and Murphy and Johnson (1988). Many of the emergent species lis ted in Table 6.2 will be found in wetlands associated with the LSJRB.
The LSJRB, unlike the south and central basins of the river, does not have extensive freshwater marshes or wet prairies, which are dominated by grasses, sedges, and emergent aquatic vegetation. Freshwater marsh and wet prairie associations are limited by the greater variations in elevations in the LSJRB than in the south and central basins. Higher elevations increase the water runoff rate and limit sheet-flow. The seasonal pattern of rainfall that alternates high and low water levels in the floodplain also limits potential habitat for freshwater marshes in the LSJRB. Streambanks and shorelines of the St. Johns River and its tributaries are populated by a variety of submerged and emergent aquatic vegetation and associated fauna.
Where freshwater marshes occur, one or more of the following genera may dominate: bulrush (Scirpus), cattail (Typha), cordgrass (Spartina), maidencane (Panicum), flat sedge (Cyperus), spike rush (Eleocharis), rush (]uncus), saw grass (Cladium), and common reed (Phragmites); several other genera may occur. The wettest areas of the marsh may also include water lily (Nymphea), pickerel weed (Pontederia), arrowhead (Sagittaria), and many other emergent aquatic genera (see Table 6.2). No additional literature at present supports a more definitive description of the LSJRB freshwater marshes.
Wet prairies are generally distinguished from freshwater marshes by having less water and shorter vegetation. There are few natural prairies in the LSJRB. The prairie habitat was formerly maintained by periodic wildfires; at present it is maintained largely by grazing cattle and periodic management (e.g., mowing, spraying, fire) to remove the shrub and tree species that would otherwise succeed the grasses.
St. Johns River W11ter Management District 27
BIOLOGICAL R ESOURCES
Table 6.2 Wetland and aquatic plants of the Lower St. Johns River Basi n. An asterisk (*) indicates a plant is exotic.
Floating
Submerged
Water hyacinth• Water lettuce Common duckweed Giant duckweed Water pennywort Watermeal Wolffiella Azelia Salvinia Alligatorweed* Paragrass
Eelgrass Southern naiad Marine naiad Widgeon grass Florida elodea• Brazilian elodea• Eu rasian waterm ilfoil* Parrotfeather* Broadleaf watermilfoil Stonewort Common bladderwort Cabo mba Coontail I ll inois pondweed
Eichornia crassipes1•3•4 Pistia stratiores1·3 Lemna minor1 •3 Spirodela polyrhiza1 •3 Hydrocotyle umbellata3 Wolffia co!umbiana3 Wo/ffiella floridaml Azolla caroliniana3 SaJvjnia rotundifoli� Altemanthera philoxeroides1•3 Panicum purpurascen�
Vallisneria americana1•2•3•4 Najas guadalupensis1•2•3 N. marina3 Ruppia maritima1·3 Hydrilla verticilata1 '3 Egeria densa1 '3 Myriophyllum spicatum1 ·3 M. brasilense1•3 M. heterophyllud Chara sp. 2•3 Utricularia vu/garis3 Cabomba caroliniana3 Ceratophy/lum demersud Potamogeton i/linoensi�
1No locat ion {Atlantis Scientific 1 976) 2Verdiere Point and Bod ine Point, west side of St. Johns River, Putnam County (Dames and Moore 1 978) 3No location (U.S. Army Corps of Engineers 1 973) 4Hallowes Cove {M urphy and Johnson 1 988)
St. Johns River Water Management District
28
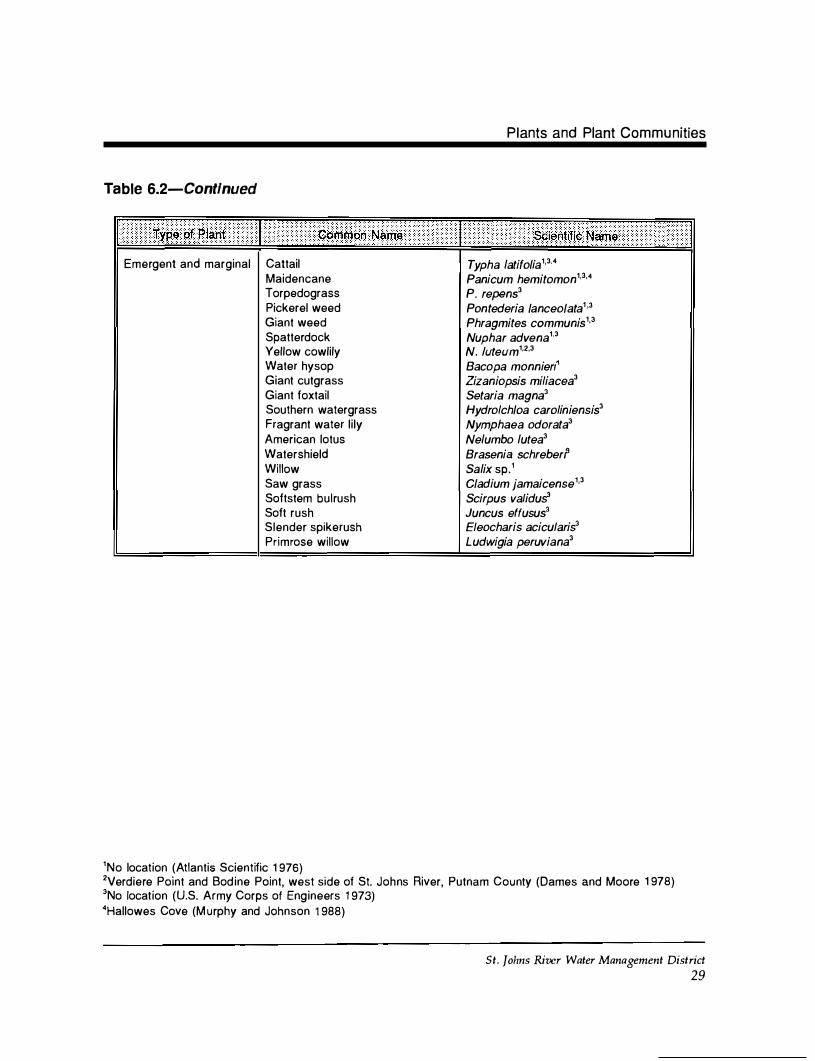
Table 6.2-Contlnued
Emergent and marginal Cattail Maidencane Torpedograss Pickerel weed Giant weed Spatterdock Yellow cowlily Water hysop Giant cutgrass Giant foxtail Southern watergrass Fragrant water l i ly American lotus Watershield Willow Saw grass Softstem bulrush Soft rush Slender spikerush Primrose willow
Plants and Plant Commu nities
Typha latifo/ia1•3·4 Panicum hemitomon1•3•4 P. repens3 Pontederia /anceo/ata1 •3 Phragmites communis1•3 Nuphar advena1•3 N. luteum1•2•3 Bacopa monniert1 Zizaniopsis miliacea3 Setaria magna3 Hydrolch/oa caroliniensis3 Nymphaea odorata3 Nelumbo lutea3 Brasenia schreberr Salix sp .1 C/adium jamaicense1•3 Scirpus validu� Juncus effusus3 Eleocharis acicularis3 Ludwigia peruviana3
1No location (Atlantis Scientific 1 976) 2Verdiere Point and Bod ine Point, west side of St. Johns River, Putnam County (Dames and Moore 1 978) 3No location (U.S. Army Corps of Engineers 1 973) 4Hallowes Cove (M urphy and Johnson 1 988)
St. Johns River Water Management District
29

B IOLOG ICAL RESOURCES
Introduction of grazing animals maintains a variety of rangeland habitat types in the LSJRB. Herbaceous rangeland occurs at the upland margins of wetlands; periodically, rangeland may be inundated. The wetter areas may be dominated by sedges, rushes, and herbs, with the dryer sites predominately dominated by saw palmetto and wiregrasses. Shrub and brushland range tend to be dominated by saw palmetto, with a variety of scrub forest plants present, including sand pine, scrub oak, and various short grasses. Rangeland generally is not fertilized, irrigated, or cultivated. More intensively managed grazing land may include improved pastures, where drainage, fertilization, and seeding of a variety of grasses and legumes is practiced to increase yield and permit higher density of animal stock. A considerable amount of the LSJRB land west of the St. Johns River is devoted to pasture and rangeland for dairy and beef cattle, horses, and other livestock.
The true coastal strand habitat, a transition between salt marshes and upland communities, displays a zoned vegetation on sand (and, in a few places, lithified ''beach rock"), with salt-tolerant herbs and shrubs close to the shore and a scrub and forest zone further inland. This habitat type is a very minor component of the LSJRB-it is found primarily in the Upper Coastal Basin east of the LSJRB (see Figure 1 ) . In several LSJRB tributary basins (Arlington, Trout, and Broward rivers and Dunn Creek; see Figure 3), salt marshes merge with (and are replaced by) freshwater marsh species where salinity decreases with distance upstream.
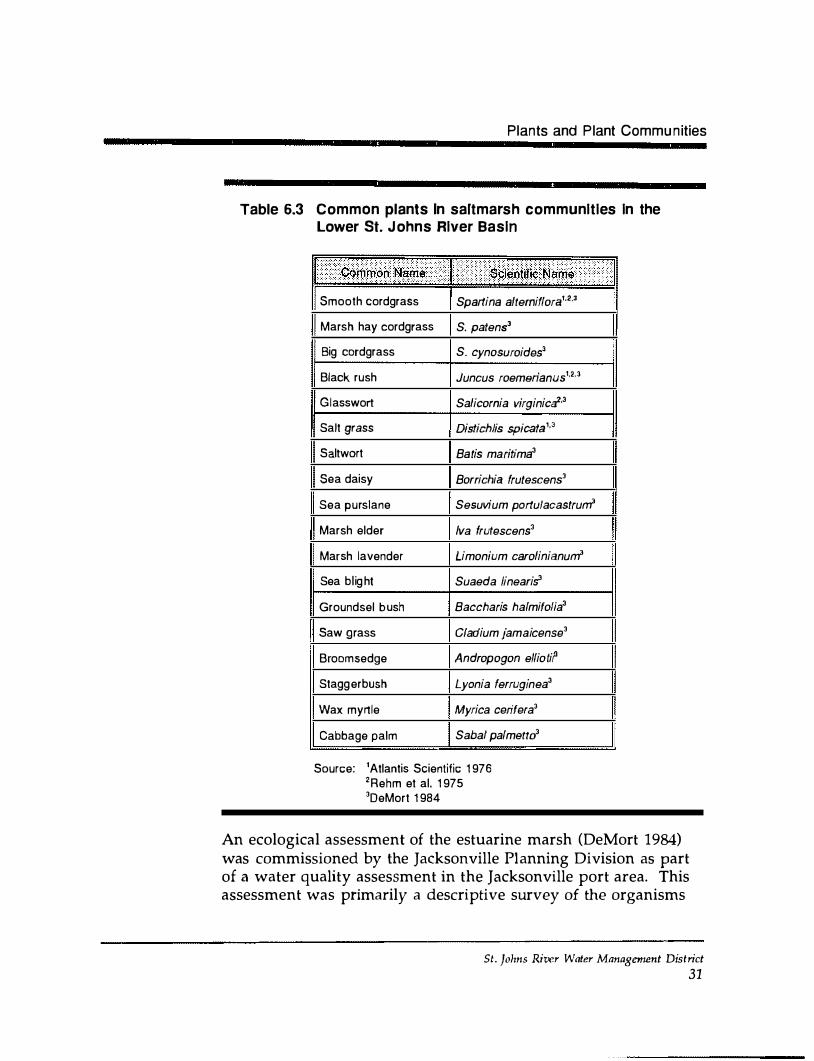
Teal and Teal (1969) is among the best books on salt marshes in general. Kurz and Wagner (1957) compare the marshes of Nassau River, Florida, with the marshes of Charleston, South Carolina. The work of Odum (1971 ) and Teal (1962) on Georgia salt marshes and general saltmarsh reviews by Gosselink et al. (1971 ) and Keefe (1972) provide pertinent information from nearby systems. Saltmarsh species reported by DeMort (1984), Atlantis Scientific (1976), and Rehm et al. (1975) are listed in Table 6.3. Works by DeMort (1984), Rehm et al. (1975), and Durako et al. (1988) are reviewed.
St. Johns River Water Management District
30
Plants and Plant Communities
Table 6.3 Common plants In sartmarsh communities in the Lower St. Johns River Basin
Smooth cordgrass Spartina altemiffora1•2•3
Marsh hay cordgrass S. paten$3
Big cordgrass S. cynosuroidesl
Black rush Juncus roemerianus1•2•3
Glasswort Salicornia virginica2·3
Salt grass Distich/is spicata1•3
Saltwort Batis maritima3
Sea daisy Borrichia frutescens3
Sea purslane Sesuvium portulacastruM
Marsh elder Iva frutescens3
Marsh lavender Limonium carolinianuM
Sea bl ig ht Suaeda linearis"
Groundsel bush Baccharis halmifolia3
Saw grass Cladium jamaicense3
Broomsedge Andropogon elliotir
Stagg erbush Lyonia ferruginea3
Wax myrtle Myrica cerifera3
Cabbage palm Saba/ palmettd
Source: 1Atlantis Scientific 1 976 2Rehm et al. 1 975 3DeMort 1 984
An ecological assessment of the estuarine marsh (DeMort 1984) was commissioned by the Jacksonville Planning Division as part of a water quality assessment in the Jacksonville port area. This assessment was primarily a descriptive survey of the organisms
St. Johns River Water Management District 31
B IOLOG ICAL R ESOURCES
observed at 21 stations in Duval and Nassau counties (8 in the Nassau River [see Figure 1], 2 on Fort George Island, 8 in the Intracoastal Waterway [ICW]-Hannah Mills Creek area, and 3 in the Blount Island-Browns Creek area [see Figure 6 .1 ] ). Lists of plants, birds, fishes, and mammals were presented. Some of these listings are confusing. DeMort (1 984, p. 46) included the species Typha angustifolia and Andropogon elliotii in a list of typical species, yet these two species were not shown at all in the summary list of species found during the study (Table 1, p. 42-43). The species lists were not locality specific, which would be desirable since this study covered the Nassau River, ICW, and coastal island habitats, as well as some St. Johns River tributaries.
DeMort (1 984, p. 54) presented several habitat distribution patterns for the dominant plants. The low salt marsh (regularly flooded by tides) was dominated by Spartina alterniflora, the high salt marsh by ]uncus roemerianus. Spartina patens was most abundant in the Nassau River area, with S. cynosuroides abundant only at the Inconstantion Creek location, which is near the Nassau River (see Figure 1) . Descriptive transect profiles are presented for three habitats with four "vegetation maps" for selected square-meter quadrats. "Several square meter quadrats were measured within each sample location, depending on the number of different community types present at the site" (DeMort 1984, p. 38), but the quantitative data were not presented for most of the locations surveyed.
As part of the same study, plankton tows made in two environments (Pumpkin Hill Creek [north of the LSJRB near the Nassau River] and Sisters Creek [the ICW north of the St. Johns River] ) showed copepods to be the dominant zooplankton organisms (cyclopoid in the former, calanoid in the latter). The higher salinity zooplankton station (Sisters Creek) is noted to have more species, with a larger number of planktonic forms identified, but no numbers of species are reported for either station. The report as published did not include promised plankton or invertebrate lists, nor was literature cited in the body of the paper presented in a list of references.
St. Johns River Water Management District
32
Plants and Plant Commu nities
DeMort (1984) is a preliminary investigation, which points out the need for more detailed, quantitative work in the LSJRB salt marshes . Much of the work on similar systems in the Nassau River and south Georgia (especially quanti tative studies that detail energy flow, nursery value, and productivity) might be applied to the LSJRB system if the plant and animal communities were enumerated more completely.
Rehm et al. (1975) studied biomass of the hvo dominant marsh grass species (Spartina alterniflora and Juncus roemerianus) in the San Carlos-Nichols Creek marsh (see Figure 6.1 ) as part of a study of the impacts of thermal releases from the Northside Power Generating Station. Stations were not necessarily sampled every quarter; the sample size changed from 625 square centimeters in August to 1 square meter in the remaining quarters. Some stations showed one species in August, the other species in December, April, and July; no description or map of the sampling stations was presented. In brief, the sampling was too inadequate and variable for any valid conclusions to be drawn.
Durako et al. (1988), through aerial and satellite photointerpretation, presented some interesting estimates of alterations in saltmarsh habitats as the result of dredge-and-fill projects for the ICW and Jacksonville ship channel construction. A 36 percent reduction in saltmarsh area since 1943 is demonstrable, and an even larger loss from the initial construction of the ICW in the early 1900s is probable.
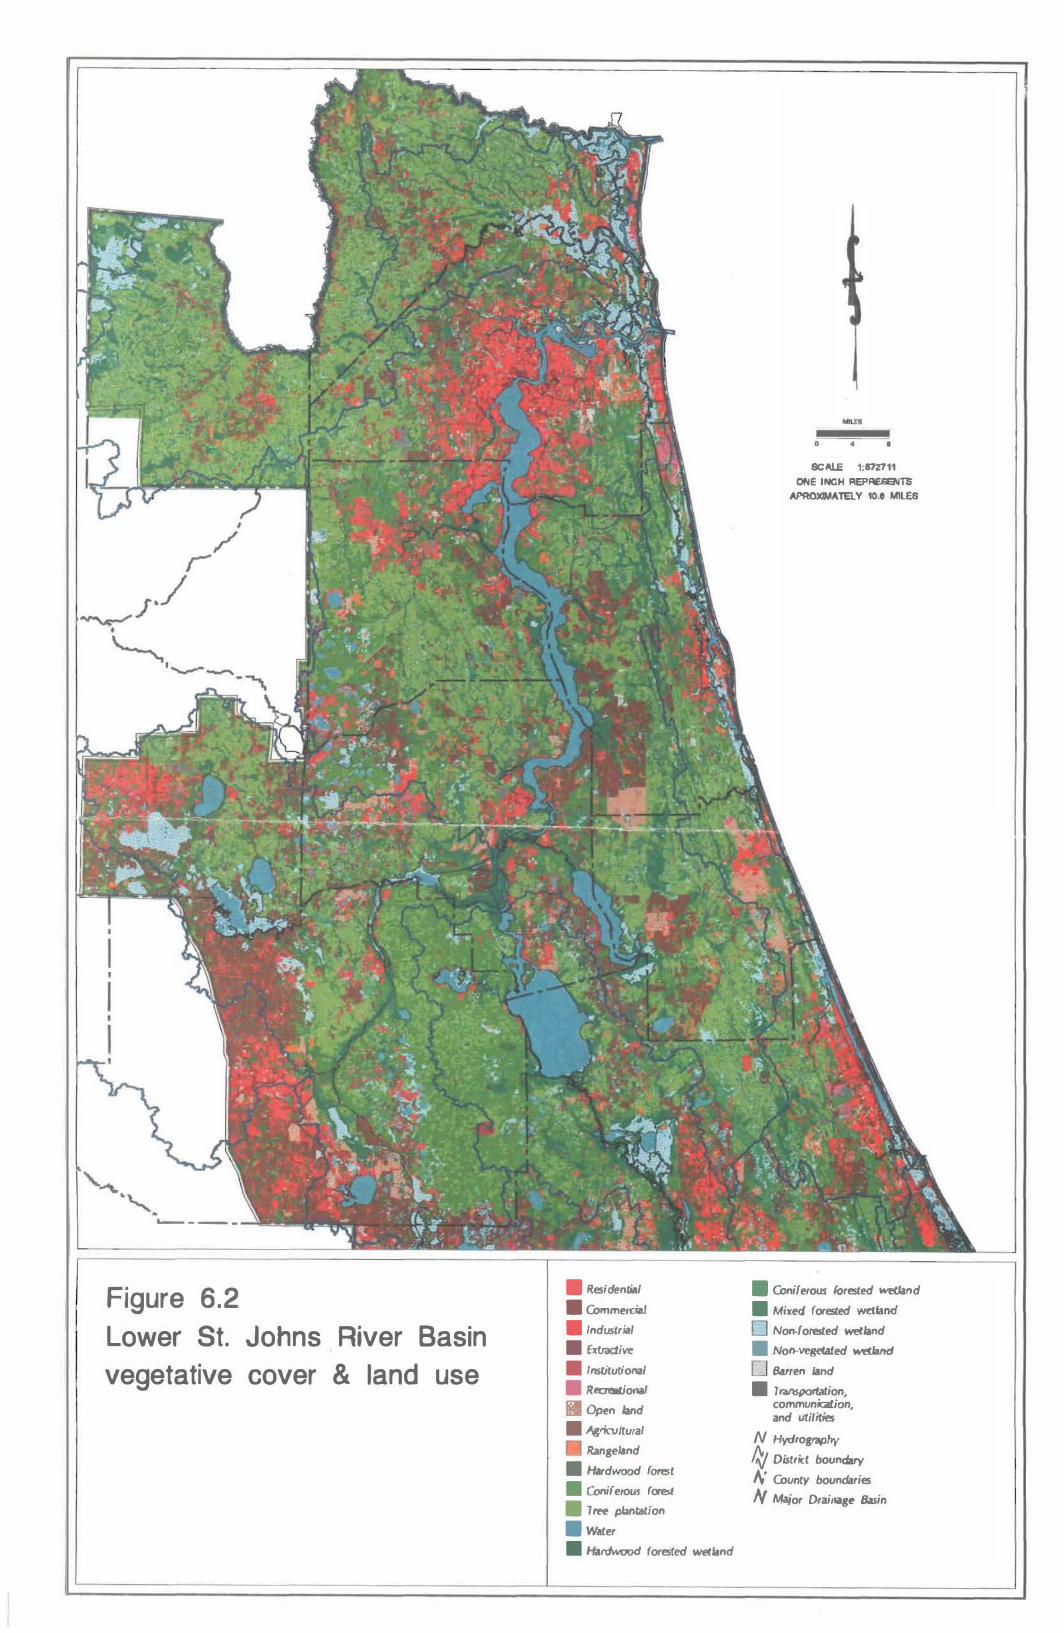
The areal coverage of all of the various floral components of the LSJRB biota has not been accurately estimated. However, a "Land Use and Vegetative Cover" map from aerial photography recently has been completed for the entire LSJRB. This LSJRB SWIM project produced a series of maps from photointerpretation of Florida Department of Transportation (DOT) 1 :24,000-scale aerial photographs. Photointerpreters identified land use and vegetative cover type as polygons and coded the polygons according to the DOT Florida Land Use Classification System (FLUCS); the FLUCS coding scheme used identifies the dominant
St. Johns River Water Manngement District 33
BIOLOG ICAL RESOU RCES
vegetation types. Submerged and emergent aquatic vegetation cannot be delineated reliably from this particular type of photography in the LSJRB's blackwater regions and will not be plotted. Coded polygons have been scanned and digitized into the ARC/INFO computer program, which allows production of maps (Figure 6.2) from the SJRWMD Geographic Information System (GIS). Additional coverage layers presently on GIS include such data as soil types, geologic formations, topography, stream and basin boundaries, and jurisdictional and political boundaries, any of which may be combined to produce the desired map product.
S UBMERGED PLANT ASSOCIATIONS
No literature specific to the LSJRB records the submerged macrophytes, drift algae, or benthic macroalgae of the open water habitats of the St. Johns River east of Jacksonville; only a few mentions of these vegetative communities have been published for the remainder of the LSJRB, typically, as part of sampling site descriptions in FDNR and FGFWFC reports. Joyce (1965, p. 31) reported, as an example, that "depth ranged from 8 to 15 ft, and the vegetation, when present, was primarily Myriophyllum with some eel grass." This description of his station at the Duval-Clay county line contained the most complete description of vegetation at any of his 17 St. Johns River shrimp sampling sites.
There is currently no literature that discusses the ecology, physiology, or reproduction of the aquatic pl ants found in the LSJRB in terms of their adaptations to the LSJRB.
Neither the areal extent of submerged macrophytic plants nor the depth to which aquatic plants are found in tidal freshwater has been studied in the LSJRB. The blackwater color and turbidity in the LSJRB waters tend to limit light penetration and probably restrict submerged aquatic plant growth to the shallows (maximum 1 .5-2.0 m depth). Light penetration also limits the photosynthetic processes of phytoplankton organisms. Salinity tolerance of the typically freshwater aquatic species is unreported for the St. Johns River, and the extent of the distribution of these
St. Johns River Water Management District 34
..__ _ _ _
Figure 6.2
Lower St. Johns River Basin
vegetative cover & land use
• Residential
• CommeteiaJ
• Industrial
• Extraaive
• Institutional
• Recreal.ional
[] Open land
• A&ricultural
Rangeland
• Hardwood forest
• Coniferous forest
• 1 ree plantation
• Water
• Hardwood forested werland
0 •
SCALE 1:872711
ONE INCH REPRESENTS
APROXJMATel.Y 10.8 MILES
• Coniferous forested wet:Jand
• Mixed forested wetland
0 Non-forested wetland
• Non-vegetated wetland
0 Bauen land
• 1 ransporlalion, communia!tion, and utilities
N Hydrography
kJ District bounda!y
!,' County boundaries
N Major Drainage Basin
Plants and Plant Communities
species in the more saline sections of the river has not been reported.
The sand/mud benthic habitats in tidal areas of the LSJRB have not been described in the literature. Dredge spoil islands, a prominent feature of the ICW and main stem of the St. Johns River between Mayport and downtown Jacksonville, are likewise neglected.
Freshwater Grasses
Seagrasses
The most abundant aquatic grass species in the St. Johns River is Vallisneria americana, a freshwater species reaching its limit of salinity tolerance in the estuary. Recent experimental evidence from the Chesapeake Bay suggests that Vallisneria tolerates salinities up to 12%o (Twilley and Barko 1990). This species can form extensive "beds/' which may carry out the ecological role of "nursery area" for many important invertebrate and fish species.
Although well established in the oligohaline reaches of the LSJRB, distribution of Vallisneria americana in the more saline reaches of the LSJRB has not been investigated. To date, there is no scientific report to indicate which sessile estuarine plant taxa are present in the St. Johns River estuary east of Jacksonville.
The LSJRB SWIM program is currently using satellite and aerial color photographs as a basis for development of a map of submerged aquatic vegetation beds from downtown Jacksonville south. Selected photographs from low-level aerial missions will augment the existing imagery. Stereoscopic photointerpretation will combine with extensive field verification to produce maps suitable for digitization and GIS inputs.
The literature on marine phanerogam species suggests that true seagrasses are probably not present in abundance in the more marine sections of the LSJRB, but the presence or absence of these submerged macrophytes has not been investigated.
St. Johns River Water Management District 37
B IOLOGICAL RESOURCES
True seagrass distribution in the LSJRB is a subject of some confusion. One good example is in the literature regarding Thallassia testudinum, a marine perennial herb. Commonly called turtle grass, Thallassia was described by Dressler et aL (1987, p. 107) along with " . . . dis tribution: throughout coastal Florida . . . " and a range map which included all east coast and nonpanhandle Gulf coast counties from Flagler County north. Although the introduction no ted: "The simplified maps that accompany each description indicate only the presence of a given plant in at least one county of the sector marked, but more details are provided where appropriate" (p. vi), no such details were provided for this species. No east coast record of Thallassia north of Brevard County can be found in the literature. The Florida Museum of Natural History Vascular Plant Herbarium (University of Florida [UF], Gainesville) does not include specimens from the east coast north of Palm Beach County. The sector map reference was intended to represent a collection recorded from Levy County on the Gulf coast (K.D. Perkins [one of the Dressler et al. 1987 authors], UF Herbarium, pers. com.). Thnllassia on the east coast of Florida north of Volusia County is most unlikely (R. Virnstein, SJRWMD, pers. com.).
The incorrect (or at best, unconfirmed) report in Dressler et al. (1987) became an erroneous basis for a section included in a draft Conservation Plan for a North Florida county. This discussion combined the commonly expressed importance of submerged aquatic plants as nursery areas for juvenile fish and invertebrates with the Dressler et al. distribution record of Thallassia. The authors of the draft plan concluded that seagrasses, especially Thallassia, were an important component of the northeastern Florida estuarine ecosystem. Uncorrected, a number of important decisions might have been based upon this error, which stemmed from the assumption that interpretation of environmental data from one area should be applicable to another, nearby site.
Another example of confusion about seagrass distribution involves eel grass. One common name for Vallisneria is eel grass. This provides a potential source of confusion, since this common name is also applied to Zostera marina, the marine seagrass
St. Johns River Water Management District 38
Plants and Plant Commu nities
occupying a similar ecological niche in estuaries from the Carolinas north to Greenland (Dawson 1966). One recent report (Murphy and Johnson 1988) made exactly this error, recording Zostera marina as the "eel grass" species found in Hallowes Cove, St. Johns County (see Figure 6.1); however, Zostera is not found south of northern South Carolina.
In addition to the absence of the seagrasses Thallassia and Zostera in the LSJRB, there is an interesting discontinuity of distribution of Halodule (shoal grass), another marine seagrass genus. This genus is moderately abundant in the Indian River Lagoon and as far north as the Daytona Beach area. It appears only in sparse patches north of there and is absent from St. Johns County. It is found in the Carolinas but is apparently absent from the St. Johns River and tributaries and coastal Georgia . The increased tidal range in the area from St. Johns County to South Carolina apparently produces a high-energy environment which increases turbidity, sedimentation, and, coupled with dark-colored waters in the estuaries, reduced light penetration. These factors seemingly deny Halodule an acceptable environment in the LSJRB (R. Virnstein, pers. com.).
Widgeon grass (Ruppia maritima), a species with reported tolerance of both freshwater and saltwater environments, may be present in the LSJRB. Widgeon grass was reported without locality data (Atlantis Scientific 1976; U.S. Army Corps of Engineers [USACE] 1973). Its abundance and distribution have not been studied.
With wintertime temperatures too low for Thallassia, summertime too warm for Zostera, and condi tions improper for Halodule, the LSJRB estuary probably has no abundance of true seagrasses.
St. Jolms River Water Management District 39
B IOLOG ICAL RESOU RCES
PHYTOPLANKTON AND PRIMARY PRODUCTIVITY
Phytoplankton Studies
Research describing phytoplankton communities, nutrients, and primary production is limited to four studies in the LSJRB: Pierce 1947, DeMort and Bowman 1985, FGFWFC 1977-80, and Dames and Moore 1978. The species composition of the phytoplankton community and the associated water chemistry during a complete annual cycle has been reported in only two papers (published nearly 40 years apart) on two very different reaches of the St. Johns River within the LSJRB. The early study (Pierce 1947) focused on phytoplankton at the tidal freshwater, upstream boundary of the LSJRB. The second (DeMort and Bowman 1985) examined phytoplankton from Jacksonville east to the ICW. Phytoplankton present in a single sample at multiple stations taken once each year were reported in a series of annual DingellJohnson Project Reports published by FGFWFC (1 977-80). Dames and Moore (1 978) reported on phytoplankton collected from the Rice Creek area (Putnam County) on two dates.
The Dames and Moore (1978) phytoplankton study was intended to provide a single snapshot of the St. Johns River environment at four sites that were candidates for effluent discharge from the Seminole Electric Cooperative power plant. The dataset included phytoplankton reported by species with summaries on densities, numbers of taxa, and species diversity. This report provided no other analysis and temporally is too limited to permit an understanding of the plankton community in this Putnam County area.
The phytoplankton data from the FGFWFC reports (1977-81) were from limited samples, taken at varying times of the year; thus, comparative analysis is difficult. Phytoplankton were identified to the genus level. The LSJRB samples were taken in March 1977, June 1978, and May 1980 at Crescent Lake, Rice Creek, and Hallowes Cove (see Figure 6.1) and at a number of other stations south of the LSJRB to the headwater regions; 1979 samples were taken but apparently not analyzed. Chlorophyta
St. Johns River Water Management District
40
Plants and Plant Communities
and Cyanophyta were dominant in all samples (93 percent or more). Coscinodiscus was the only diatom comprising more than 5 percent of any sample. Water quality parameter measurements were not coincident with the plankton sampling and thus cannot be correlated.
Pierce (1947) observed the phyto- and zooplankton for 15 months during 1939-40 at three stations at the southernmost limit of the LSJRB (in the St. Johns River upstream and downstream of the mouth of the Ocklawaha River and in the Ocklawaha River just west of the St. Johns River), in Lake Margaret, and in a pond at the UF Conservation Reserve at Welaka (see Figure 6. 1). Samples were taken monthly, and the plankton were identified to the genus level and counted. Water samples drawn coincident with the plankton sampling effort were analyzed for temperature, dissolved oxygen, pH, alkalinity (HC03), nitrite, nitrate and ammonia, chloride, and total dissolved solids. Notably absent is any analysis for phosphorus or silica.
Diatoms were the predominant phytoplankters at the St. Johns River stations, principally of the genera Coscinodiscus and Melosira; diatom populations reached peak levels in February (1 .78 million Coscinodiscus per liter). In summer, at these same stations, blue-green algae (Anabaena, Raphidiopsis, Microcystis) formed dense "blooms" (as high as 36 million Raphidiopsis per liter) and diatom concentrations were reduced. Pierce (1947) noted nitrogen (as nitrate) values decreased to levels below 0.04 parts per million (ppm) at times of greatest diatom abundance, then recovered over the following 3 months. Nitrate values again fell during the blue-green algal blooms of summer and remained below levels of detection (less than 0.001 ppm) through November, the end of the study. Although there was an obvious temporal correlation between changes in the phytoplankton and nitrate, Pierce (1947) recognized that " . . . there were too many other unmeasured quanti ties in the environment to permit selection of nitrates as the limiting factor in the phytoplankton population" (p. 32).
St. ]olms River Water Management District 41
B IOLOGICAL RESOURCES
DeMort and Bowman (1985) observed two annual cycles (1975-77) of phytoplankton and measured temperature, salinity, nutrients, and total chlorophyll at seven stations in the lower 42 kilometers (km) of the St. Johns River. Phytoplankton and chlorophyll samples were taken at monthly intervals; data for four of the stations (from the ICW upstream to Commodore Point/Main Street Bridge [see Figure 6.1]) are reported as pooled quarterly values. The authors listed the following ten species in decreasing order of abundance: Skeletonema costatum, Chaetoceros decipiens, Rhizosolenia alata, Nitzschia seriata, Melosira italica, Chaetoceros debile, Coscinodiscus lineatus, Thalassionema n itzschiodes, Thallassiothrix fraunfeldii, and Gyrosigma sp. Skeletonema costatum was the most abundant diatom species but did not dominate throughout the year at all stations. The number of Bacillariophyta (diatoms) decreased with decreasing salinity as numbers of Chlorophyta and Cyanophyta increased and peaked in summer at all stations. The authors imply that the diatom genus Melosira reached its limit of salinity tolerance at the upstream station in this study (Main Street Bridge, Jacksonville) (salini ty 0.0-15.5 %o) .
Water samples from 1 m depth (taken concurrent with the phytoplankton samples) were analyzed for the following nutrients: total phosphorus, orthophosphate, nitrate, ammonia, iron, and copper. Nitrate concentrations varied from 0.80 to 10.60 mg/L; total phosphorus varied from 0.01 to 5.80 mg/L. Nitrogen to phosphorus ratios ranged from 14.2:1 to 27.7:1; these ranges are above those reported from other east coast estuaries. The authors (DeMort and Bowman 1985) suggested that the high nitrogen values result from prolonged retention time of water in the lower St. Johns River, coupled with rapid breakdown of organic nitrogen (evidenced by low ammonia concentrations detected during the study). They further asserted that "phosphorous appears to be the limiting nutrient in the St. Johns River estuary" and also stated that "the increase in chlorophyll concentration appears to be correlated with a decrease in salinity and in pH. This may bring about a change in membrane permeability or in the rate of active transport across the membrane, perhaps involving minor nutrients such as iron rather than the major nutrients11 (DeMort and Bowman 1985, p. 106).
St . Johns River Water Management District
42
Plants and Plant Communities
Recent review articles (Hecky and Kilham 1988; Cherfas 1990) stress the importance of silica and micronutrients in limiting phytoplankton cycles. Silica, a macronutrient present in equal or greater amounts than either nitrogen or phosphorus in some algal cells (Healey 1973; Parsons et al. 1961; Reynolds 1984), may be more important as a limiting factor than either nitrogen or phosphorus, especially in diatom-dominated estuarine systems. Since the most abundant phytoplankters in both the Pierce (1947) and DeMort and Bowman (1985) studies were siliceous diatom species, variations in available silica concentrations in the St. Johns River need to be understood before drawing conclusions on nitrogen or phosphorus as the limiting nutrient. Measurements of available silica have not been part of any of the studies of phytoplankton in the LSJRB and only became a part of SJRWMD routine water quality monitoring programs in 1991.
Primary Productivity
A wide variety of literature exists on the photosynthetic process and primary production from many Florida localities. This information has been used in other areas to produce estimates of standing crops of the plant community and potential value of natural systems as nursery areas for recreational and commercial fisheries production. As of 1990, there were no studies of this important process published for any of the communities of the LSJRB.
A few light-dark bottle studies to estimate phytoplankton oxygen production and plankton community respiration were undertaken by the Florida Department of Environmental Regulation (FDER) in Duval County during the 1970s (L. Banks, FDER, pers . corn.), but this research has not been published, nor has this kind of investigation continued.
There is no literature to suggest that phytoplankton primary production has been directly measured through radiocarbon uptake studies. Data " . . . courtesy of C.L. DeMort and R. Bowman, University of North Florida, Jacksonville" are reported in Atlantis Scientific 1976 (p. XI-27a) that indicate a range of carbon fixation
St. Johns River Water Management District 43
B IOLOG ICAL RESOURCES
from 13.6 to 52.08 milligrams per cubic meter per hour at one station sampled monthly from October 1974 to February 1975; no methodology was presented. This work may be a preliminary report from the following study (Bowman n.d.).
Community respiration and photosynthetic oxygen production were measured in situ during 24-hour observations by Bowman in 1977-78 (Bowman n.d.). These studies were carried out at ten substations at each of the following locations: Mayport, Cedar River, Julington Creek, Green Cove Springs, and Lake George (see Figure 6 .1 ) . Bowman (n.d.) concluded that high respiration rates caused a large excess of respiration over photosynthesis, making the St. Johns River a net consumer of oxygen. Low oxygen levels (typically 60 to 80 percent of saturation, lower where pollutant inputs were present) were noted at almost all of Bowman's study stations. Low oxygen levels are not unusual in blackwater systems such as the St. Johns River, where reduced light penetration and shallow euphotic zone can combine with high biological and chemical oxygen use. Bowman now questions the usefulness of some of his methodologies in determining community metabolism and believes that this study was inconclusive (RD. Bowman, Universi ty of North Florida, pers. com.).
Water Color and Turbidity
Water color and turbidity affect light extinction and thus affect the photosynthetic capability of phytoplankton and submerged macrophytes. Some of the methods used in measurements that relate light to photosynthesis in studies already mentioned and in other, unreviewed water quality programs in the LSJRB may warrant scrutiny.
Turbidity currently is measured electronically; however, water color frequently is estimated by a visual comparison with a limited series of standards. These standards are not designed to recognize potentially important variations in water color present in blackwater streams and discriminate between colors by arbitrary ranges of spectral characteristics. The method is subject
St. Johns River Water Management District
44
Plants and Plant Commu nities
to variability amongst different technicians who may use the equipment. Color determinations should measure absorbance at standardized wavelengths with a spectrophotometer (Koenings et al. 1987).
Light extinction is routinely measured with Secchi disk (SD) readings. These readings may have some value as a trend analysis tool, comparing light penetration at one specific sampling site in a non-tidal system. However, outside of the clear, blue, ocean waters for which they were conceived (and for similarly colorless oligotrophic lakes), SD measurements alone do not quantify the light available to plants. Koenings and Edmundson (1991) have shown that photosynthetically active radiation attenuation is affected equally by stain (color) and turbidity, whereas SD visibility is more affected by turbidity than color. In inshore and estuarine systems, much of the light available to plants (wavelengths below 550 nannometers [nm]) is attenuated by turbidity and water color (McPherson and Miller 1987). The sensitivity of the human eye peaks at about 550 nm; the SD technique thus measures light attenuation in human terms, not in terms of light available for photosynthesis (Kirk 1988). Using SD readings to establish an extinction coefficient (the light level below which photosynthesis is presumed to be inhibited) thus has limited value in a blackwater system like the LSJRB. Extinction coefficients should be derived from direct submarine photometer measurements.
Water quality monitoring schemes also may seek to estimate phytoplankton populations by measuring chlorophyll and phaeophytin pigments. In many monitoring programs, however, the samples are not drawn from a sufficient range of depths to accurately profile the entire water column; frequently, the single depth at which the chlorophyll samples are taken is calculated from SD readings. The plant pigment data obtained from these samples are sometimes used to derive estimations of phytoplankton abundance, which is not necessarily a valid procedure.
St. Johns River Water Management District 45
B IOLOGICAL R ESOURCES
FAUNA
This chapter presents discussions on the fauna of the LSJRB. The animal species within the LSJRB that are wetland or submergedland dependent include invertebrates, such as crustaceans (i.e., shrimp and crabs) and molluscs (i .e., clams, mussels, and oysters), and finfish. Aquaculture and water-dwelling faunal species of concern specific to the LSJRB also are important resources of the LSJRB.
INVERTEBRATE FISHERIES RESOURCES
Blue Crab
Three groups of invertebrate animals are important to the fisheries of the LSJRB: blue crabs, shrimp, and, to a much lesser extent, molluscs (i.e., oysters, clams, and mussels).
The blue crab (Callinectes sapidus) fishery of the St. Johns River was studied by Tagatz (1965), who later published additional data on blue crab biology (1968a) and growth (1968b). No published research on blue crab biology documents any changes or year-to-year variations which may have occurred in the period since the Tagatz observations. Aspects of the crab commercial fishery, however, have been monitored by the FGFWFC through the Commercial Fisheries Investigations project (Hale et al. 1982-88). The FDNR Marine Fisheries Information System (MarFis) commercial fisheries landings reports for this species are available for Duval County (FDNR 1991 ).
Crab Biology. The following information is derived entirely from Tagatz' reports (1968a, 1968b, 1968c) and is specific to the St. Johns River in 1961-62.
The blue crab mating period is March to December throughout the St. Johns River; females then descend the estuary to the lowest 30 km, where spawning takes place. Eggs are transported
St. Johns River Water Management District
46
Fauna
to sea by tidal currents, where they hatch within 6 km of shore. Spawning begins as early as February and continues through October. Within 15 days after the eggs hatch, many females re-enter the St. Johns River for a second spawning. Many females tagged in the ocean were recaptured in inland waters throughout the year. Relatively few blue crabs survive more than 1 year after reaching maturity.
Callinectes larvae were collected as far as 40 km inland; the transition through two larval forms (seven zoea stages and one megalops) was completed in 5-1 0 weeks, depending on a variety of environmental factors. Small post-larval crabs were collected as far upstream as 135 km.
Crab stomachs were found to contain a wide variety of foods, including molluscs (32 percent of stomach contents), crustaceans (19 percent), organic debris (17 percent), fish (16 percent), plants (9 percent), and other invertebrates (7 percent).
Tagatz (1968b) studied the growth of post·larval crabs at two locations along the St. Johns River-Cedar Point Creek and Green Cove Springs . Cedar Point Creek (a tributary of Clapboard Creek [see Figure 6.1J) is classified as salt water-summer mean salinity was 18.8%o (range 7.5-25.8%o) and winter mean salinity was 14.5%o (range 6.0-23.3%o). At Green Cove Springs (classified as fresh water), salinities always were less than 1 %o. Males and females showed significant differences in growth between salt and fresh water; each sex averaged the most growth per molt in salt water. The mean increase in size ranged from 20.9 percent in small male crabs to 34.2 percent in large females. Relative growth per molt was similar in summer and winter, varying from 7.8 to 50 percent. The time between molts, however, was three to four times as long in winter as in summer. Tagatz estimated that most blue crabs reached harvestable size within 1 year after hatching. The oft reported observation that "larger crabs are found in less salty waters" may be correct, but the analysis of Tagatz' data indicates that some factor other than salinity must account for the observation; decrease in salini ty at the terminal molt did not produce an increase in size.
St. Johns River Water Management District
47
BIOLOG ICAL RESOURCES
Mortality at ecdysis (molting) was only 36 crabs out of a total of 2,782 molts, suggesting that ecdysis may not be an important cause of death. In the natural environment, however, the newly shed soft-shell crab is probably at significant risk from predation (Tagatz 1968b).
Crab Harvest. Blue crab harvest data compiled from wholesale buyers for the St. Johns River area from Jacksonville south are available from 1981 to 1988 through Commercial Fisheries Investigations reports (Hale et al. 1982-88). These data were collected by requesting information on landings from fish dealers in counties bordering the St. Johns River; data are not specific to the LSJRB. Changing water levels (due to variations in rainfall in the Upper St. Johns River Basin) may expand or contract the extent and production of the crab fishery.
No long-term program has been implemented to monitor the crab harvesters for catch, the effort expended in producing the catch, or the gear type and locality of fishing effort, although questionnaire surveys have been instituted by FGFWFC from time to time to obtain this information. An unquantified amount of blue crabs are harvested by recreational (unlicensed) persons; some of these landings may be unlawfully sold. Economic data (Table 6.4) represent dollars paid directly to harvesters; however, various multipliers can be applied to these data to estimate the economic impact of the fishery to the LSJRB (see p. 68-70).
The Hale (1982-88) data cannot be compared with landing data reported by Tagatz (1 965) because several important variables are so significantly different that comparisons would be unsound. These variables are the methods of sampling, areas where the samples were taken, and gear types. Tagatz directly recorded the sales-slip data from the individual fishermen and provided log books to those crabbers who retailed their own catch and who transported both their own catch and that of other fishermen to markets on the east and west coasts of Aorida. "Records of all St. Johns River crabbers were obtained with the possible exception of casual fishermen who fished a few pots" (Tagatz 1965, p. 4). Tagatz (1965) data included the amount of crabs
St. Johns River Water Management District
48
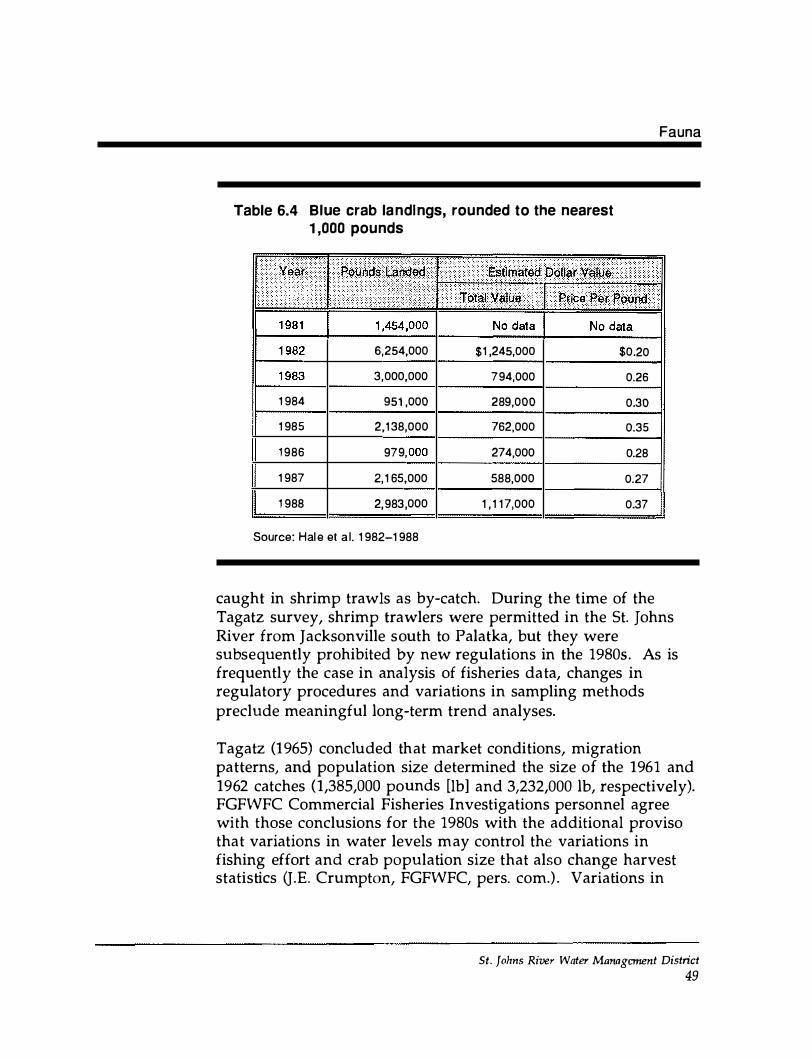
Table 6.4 Blue crab landings, rounded to the nearest 1 ,000 pounds
6,254,000 $1 ,245,000
3,000,000 794,000
1984 951 ,000 289,000
1985 2,138,000 762,000
1986 979, 274,000
1987 2,1 65,000 588,000
1 988 2,983,000 1 , 1 17,000
Source: H al e et al. 1982-1988
Fauna
$0.20
0.26
0.30
0.35
0.28
0.27
0.37
caught in shrimp trawls as by-catch. During the time of the Tagatz survey, shrimp trawlers were permitted in the St. Johns River from Jacksonville south to Palatka, but they were subsequently prohibited by new regulations in the 1980s. As is frequently the case in analysis of fisheries data, changes in regulatory procedures and variations in sampling methods preclude meaningful long-term trend analyses.
Tagatz (1965) concluded that market conditions, migration patterns, and population size determined the size of the 1961 and 1962 catches (1,385,000 pounds [lb] and 3,232,000 lb, respectively). FGFWFC Commercial Fisheries Investigations personnel agree with those conclusions for the 1980s with the additional proviso that variations in water levels may control the variations in fishing effort and crab population size that also change harvest statistics (J.E. Crumpton, FGFWFC, pers. com.) . Variations in
St. Johns River Water Management District
49
B IOLOG ICAL R ESO URCES
Shrimp
blue crab harvest do not at present suggest that this fishery is declining.
An additional dataset for blue crab landings (and other species, FDNR 1991) is available through the Fisheries Statistics Section of the FDNR Marine Research Institute in the MarFis computer database, although this information is not St. Johns River specific. These data are reported by species in several different formats (annual summaries in statewide, coast, and county areas; annual landings by months) for all fish and invertebrates covered by FDNR regulations; the data are collected off of trip tickets (individual sales transactions). The trip ticket includes date purchased, fisherman's saltwater products license number, dealer's license number, the county in which the catch was landed, the number of hours fished, and the pounds of each species landed per trip. Although all of these data are not included in the landings summaries, the computer system provides an excellent database for fisheries-dependent statistics. MarFis eventually will combine this information with boat registration, fishery resource license, and fisheries-independent data for stock assessments and will provide inquiry facilities for public modem access. FDNR took over the responsibility of gathering landings data from the National Marine Fisheries Service in 1985.
Modern scientific literature on the commercially harvested shrimps in the LSJRB is limited to a single comprehensive study by Joyce (1965). Earlier works by Pearson (1939) on life histories and Lindner and Anderson (1956) on growth, migrations, spawning, and size distribution of shrimp are not LSJRB specific. DeSylva (1954) described the bait-shrimping industry of the northeast Florida coast but did not concentrate his efforts on the St. Johns River harvest.
Joyce (1965) stated:
. . . the St. Johns River system is probably the most important single geographical feature affecting the shrimp population of the northeast coast of Florida . . . This study was
St. Johns River Water Management District 50
Fauna
conducted in an effort to learn the basic fundamentals of the shrimp populations in this area. It is believed that this has been accomplished. There are, however, many questions yet unanswered. It is hoped that this work may serve as a stepping stone to more detailed research.
No research on the biology of shrimps in the St. Johns River has been published since the Joyce study. Much of Joyce's data (less than 2 years) is potentially not applicable to conditions in years of different rainfall conditions; also, year-to-year fluctuations in winter temperatures, frequency of tropical storms and cold fronts, and 'Wind conditions undoubtedly change the pa tterns Joyce observed.
Shrimp Biology. Joyce (1 965) described the shrimp fishery as based upon three species: Penaeus fluviatilis (white shrimp), P. aztecus (brown shrimp), and P. duorarum (termed pink, green, pushed, or hopper shrimp by various authors and local fishermen). His inshore sampling produced a minor component (3.7 percent of total) of other shrimp species, including Trachypeneus constrictus, Xiphopeneus kroyeri, and two rock shrimp species, Sicyonia brevirostris and 5. dorsalis. The large freshwater shrimp Macrobrachium and several species of the grass shrimp (Paleomonetes spp.) are also found in the St. Johns River. The three species of Penaeus are the primary subject of this review on shrimp.
A taxonomic argument went on for many years regarding the proper scientific name for the North American white shrimp (Penaeus fluviatilis). Originally described as Penaeus setiferus by Linnaeus, this species also has been described in the literature as P. fluviatilis Say and P. schmitti Burkenroad. At the time Joyce published his 1965 paper, the Florida Board of Conservation Division of Salt Water Fisheries had adopted P. fluvintilis as the correct nomenclature; later work from this same laboratory (by then the Marine Resources Institute of FDNR) reverts to P. setiferus. To avoid further confusion, this report will use the common name "white shrimp."
All three commercially important shrimp species spawn offshore, where their eggs and larvae develop before moving inshore.
St. Johns River Water Management District
51
B IOLOGICAL R ESOU RCES
Brown shrimp spawning peaks in late winter, with maximum juvenile recruitment to the estuary occurring in late February and March. White shrimp spawn somewhat later than brown shrimpJ with recruitment of shrimp to the inshore areas peaking in May and June. Pink shrimp apparently spawn year-round, with a peak in early spring. All three species use the estuary as a nursery ground, ascending into fresh water to different latitudes.
White shrimp move furthest upstream, with many individuals migrating to a point south of Palatka within 1 month of their appearance in the lowest most downstream areas of the St. Johns River. In Joyce's 1 963 fieldwork, migration reached a point just north of Astor, 130 miles from the mouth of the St. Johns River. The earliest upstream migrants matured by late August (average size 1 20 millimeters [mm]) and began descending the river, and some small shrimp continued to move upstream as late as November. As temperatures began to decline in November, shrimp left the low salinity areas of the river.
Brown shrimp had a similar migration pattern, but of less duration and magnitude than white shrimp. Brown shrimp moved into the St. Johns River in June, pene tration peaked at Rice Creek (Putnam County) by July, and then the shrimp largely left the river by late August.
Pink shrimp also entered the St. Johns River during summer, but in Joyce's study did not move further upstream than the Green Cove Springs area.
All three species apparently control their horizontal distribution in the St. Johns River by rising in the water column during the tide of preferred direction and descending to the bottom during the tide in the opposite direction. Year-to-year variations in rainfall (and thus salinity) probably control the extent of the upstream migrations of these species.
Diel behavior in all three shrimp species also was studied by Joyce (1965). White shrimp are primarily diurnal, and the majority of this species were taken by Joyce in daytime samples.
St. Johns River Water Management District 52
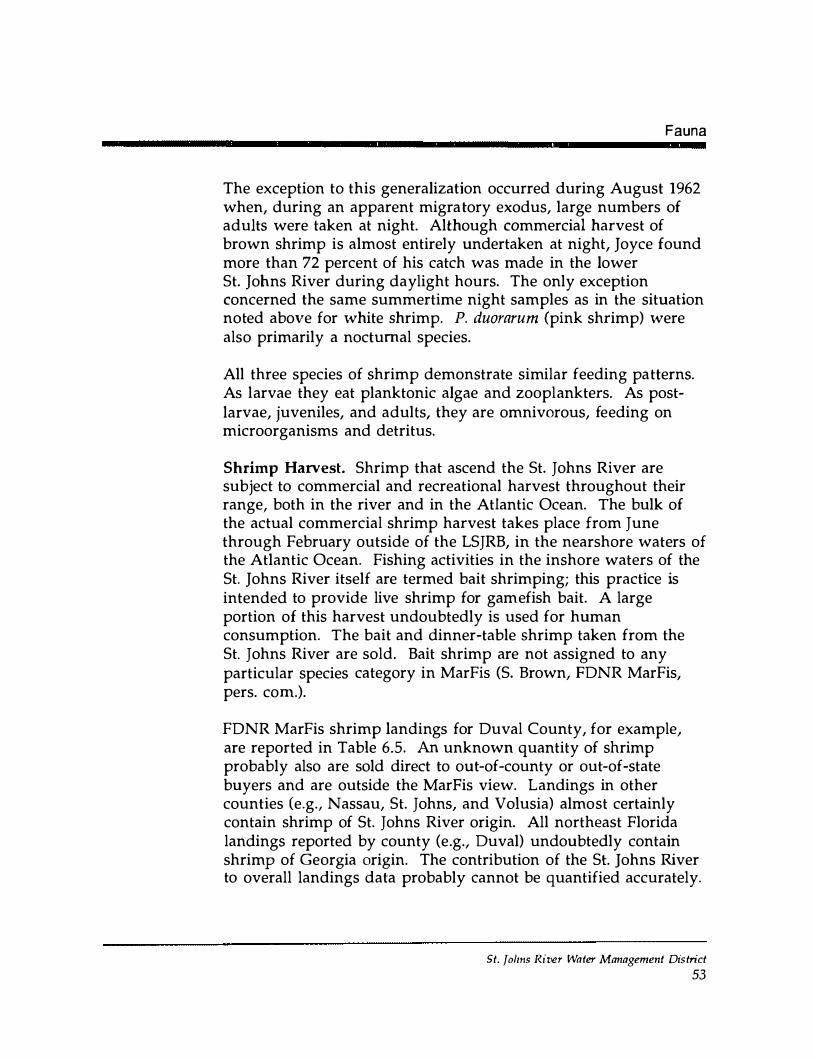
Fauna
The exception to this generalization occurred during August 1962 when, during an apparent migra tory exodus, large numbers of adults were taken at night. Although commercial harvest of brown shrimp is almost entirely undertaken at night, Joyce found more than 72 percent of his catch was made in the lower St. Johns River during daylight hours. The only exception concerned the same summertime night samples as in the situation noted above for white shrimp. P. duorarum (pink shrimp) were also primarily a nocturnal species.
All three species of shrimp demonstrate similar feeding patterns. As larvae they eat planktonic algae and zooplankters. As postlarvae, juveniles, and adults, they are omnivorous, feeding on microorganisms and detritus.
Shrimp Harvest. Shrimp that ascend the St. Johns River are subject to commercial and recreational harvest throughout their range, both in the river and in the Atlantic Ocean. The bulk of the actual commercial shrimp harvest takes place from June through February outside of the LSJRB, in the nearshore waters of the Atlantic Ocean. Fishing activities in the inshore waters of the St. Johns River itself are termed bait shrimping; this practice is intended to provide live shrimp for gamefish bait. A large portion of this harvest undoubtedly is used for human consumption. The bait and dinner-table shrimp taken from the St. Johns River are sold. Bait shrimp are not assigned to any particular species category in MarFis (S. Brown, FDNR MarFis, pers. corn.).
FDNR MarFis shrimp landings for Duval County, for example, are reported in Table 6.5. An unknown quantity of shrimp probably also are sold direct to out-of-county or out-of-state buyers and are outside the MarFis view. Landings in other counties (e.g., Nassau, St. Johns, and Volusia) almost certainly contain shrimp of St. Johns River origin. All northeast Florida landings reported by county (e.g., Duval) undoubtedly contain shrimp of Georgia origin. The contribution of the St. Johns River to overall landings data probably cannot be quantified accurately.
St. Johns River Water Management District
53
B IOLOG ICAL RESO U RCES
Table 6.5 Penaeld shrimp landings, D uval County, Florida, In pounds
1 981 1 ,522,1 67
1982 · 1 ,240,1 32
1983 1 ,323,1 12
1984 897,407
1985 1 ,618,145
7,888 829,733 875,183
4,772 983,148 1 ,285,335
48, ,243,094 1 ,356,322
Note: --- indicates no specific data
Source: 1981-85 data from NOAA, National Marine Fisheries Service 1986-88 data from FDNR, Marine Fisheries Inform ation System
31 ,899
54,984
3,054
2,021
5,643
4,391
1 3,1 87
In addition, an unquantified poundage of shrimp is taken with castnets for bait and household use. Individuals may legally catch up to 99 lb per day without a commercial license. More than 150 boats with more than 320 persons aboard have been observed between Palatka and the Duval-Clay county line (Brody 1990a). Because they do not sell to wholesalers, the catch by these individuals is thus outside the statistical reporting system. Some of this "recreational" catch may be sold illegally.
Variations in data-gathering methodologies, data analysis, and data presentation, along with changes in regulations concerning the season during which, areas from which, and fishing gear with which shrimp may be caught, preclude trend analysis of the shrimp populations from landings data such as those in Table 6.5.
St. Johns River Water Management District 54
Molluscs
Fauna
The mollusc populations of the near-oceanic salinity areas of eastern Duval County have not been the subject of any reports in the scientific literature; the available information comes largely from Adamus et al. ( 1987). This report was part of the U.S. Public Health Service Interstate Shellfish Sanitation Program mandated survey of shellfish harvesting areas. This work was produced by the FDNR Shellfish Environmental Assessment section. This section's primary role is to monitor the public health aspects of water quali ty in shellfish harvesting areas (e.g., pathogens, parasites, chemical contaminants) and to establish specific localities where harvesting may take place (Class II Waters). Adamus et al. (1987) noted only one FDNR-licensed shellfish dealer in Duval County. In 1990, that remained true (S. Brown, FDNR MarFis, pers. com.).
Landing data are not available for either clams or mussels. Clams (Mercenaria spp.) are harvested primarily for "recreational use" by digging or "treading" (feeling for the shellfish with bare feet) (Adamus et al. 1987). There is no dosed season for clams; clams smaller than l-inch hinge-width may be harvested only for mariculture. Mercenaria mercenaria and M. campechiensis are probably present in the Duval County area, and hybrids between the two are likely to occur in Florida (Stewart 1981); no study of the actual distribution of these species is reported for the LSJRB area. Mussels (Mytilus spp.) are probably taken for private consumption in rela tively small quantities.
The commercial oyster (Crassostrea virginica) is harvested primarily by "hogging" (ga thering oyster clumps from exposed tidal bars during low tides). Harvest on public oyster beds is legal from September 1 through May 31; year-round harvest is permissible by the lessee on privately leased beds. As of 1987, nine oyster leases had been issued in the Duval County shellfish harvesting area (Adamus et al. 1987). Oysters must be at least 3 inches long to be taken legally; 15 percent of any one bushel may be under this size, if the undersized individuals are so closely attached to legal-sized oysters that culling would cause
St. Johns River Water Management District 55
B I OLOG ICAL R ESOU RCES
damage to either. Duval County oyster landings data are reported by Adamus et al. (1 987) for 1961 through 1985 (with no data reported for 1963-65, 1968-70, 1978, and 1980). Reported landings during this period varied from an anomalous low of 757 lb (in 1979; no other year reports fewer than 1 6,925 lb) to an unbelievably consistent 49,218 lb in 1981, 1982, 1 983, and 1984.
FINFISH FISHERIES RESOURCES
The fishes of the LSJRB are perhaps the best studied and most completely reported-on of the biological resources of the LSJRB.
Historic references begin with Jean Ribaut (1563) [many authors spell this name "Ribault" : the original edition uses the Ribaut spelling] who commented that the River of May was " ... teeming with fish." The French Huguenots established their colony at Fort Caroline on May Day and so-named the river. Most writers between Ribaut' s era and the twentieth century made similar comments about the St. Johns River; a few made valid scientific observations, typically describing new species. A complete review of the history of ichthyology of Florida has been compiled by Gilbert (1989).
The major review and checklist compiled by Evermann and Kendall (1900), the key to the freshwater fishes of Florida by Carr ( 1937), the doctoral thesis of McLane (1955), and the synoptic listing by Tagatz (1968c) are the most complete species lis tings for the St. Johns River and its tributaries. A combined species list of these authors (primarily from McLane [1955] and Tagatz [1968c]) would identify 170 species for the entire St. Johns River; not all of these species are present in the LSJRB.
Sport Fisheries Investigations
FGF\VFC has been gathering data on the St. Johns River fisheries since 1947. The FGFWFC information is separable into two primary types of projects: ( 1 ) fishery resources (sport fisheries and habitat) and (2) commercial fisheries.
St. Johns River Water Management District
56
Fauna
The primary source of funding for sport fisheries and habitat research is federal aid from the Sport Fish Restoration Program (Dingell-Johnson and Wallop-Breaux). These federal aid projects typically are funded on a 5-year plan basis. Annual progress reports and a final report (the completion report) are required. However, the data collection methodologies summarized in the completion reports typically have not been designed for trend analyses by station or by reaches of the river, such as the lower St. Johns River. In general, these s tudies were designed to provide information on the importance of sport fish or commercially harvested species rather than the entire fish communities and habitats. The design of the FGFWFC studies reflects a lack of consistency in sampling periods, variations in sampling techniques, or weak or non-existent statistical analysis (frequently due to small sample size).
Despite the lack of trend analysis, FGFWFC sport fisheries reports contain a variety of valuable information (FGFWFC 1977-84). The F-33 project has been in effect since 1 976 and includes the following studies:
• Study I (1976-81 )-Ecological Aspects of the Fishery. This study included the following topics: river stage dynamics, rainfall, water chemistry, plankton, macroinvertebrates, fish populations and food habits, and fisherman effort through a creel census.
• Study II focused on biological effects of water fluctuation outside the LSJRB in the upper reach of the St. Johns River.
• Study III (1 982-84)-Relationships of Fish Populations to Habitat Types in the Lower St. Johns River. This study determined the composition and abundance of zooplankton, macroinvertebrates, and game and forage fishes in major aquatic vegetation communities.
• Study IV-Creel Census. This ongoing project covers the lower St. Johns River.
St. Johns River Water Management District 57
BIOLOGICAL RESOU RCES
• Studies V through VII are ongoing species-specific investigations of black crappie or speckled perch (Pomoxis nigromaculatus), largemouth bass (Micropterus salmoides), and white bass-striped bass hybrids (Marone chrysops X Marone saxatilus).
A complete analysis of all of the FGFWFC sport fisheries reports is beyond the scope of this paper. Much of the raw data are not published and FGFWFC personnel who are familiar with the field techniques, datasets, and limitations of the projects are best equipped to prepare this sort of analysis. The LSJRB is not one of the areas of the river that has been prioritized in past FGFWFC research. Projects that have been more carefully focused on are sections of the main stem that receive more intensive recreational fishing effort such as Lake George (see Figure 1) . However, some generalizations regarding the sport fisheries in the LSJRB are possible.
• Largemouth bass, black crappie, other centrarchids (sunfishes), and catfish remain the freshwater species most pursued by anglers. These sought-after game fish seem to be at relatively stable levels of abundance, with a few exceptions. The native, perhaps endemic, population of striped bass in the St. Johns River is having only very limited reproductive success, if any; no native young of the year have been found during several surveys. Stocking of hatchery-reared juvenile striped bass and sunshine-striped bass hybrids maintains the fishery.
• Estimates of sportfishing effort from creel census data are limited for the LSJRB, and datasets for harvest rates (number of fish caught per hour) by sport fishermen are temporally too small for trend analysis.
• Resource monitoring projects utilizing a variety of collection gear (block nets, trawls, electrofishing) have established patterns of species abundance and diversity at a number of stations in the LSJRB. Where submerged and emergent aquatic vegetation are reduced, gamefish populations are
St. Johns River Water Management Dist rict 58
Fauna
diminished. In those areas outside the LSJRB where severe habitat degradation has occurred (e.g., Lake Apopka [see Figure 1 ] ), gamefish populations have drastically declined; the evidence is not so clear for the LSJRB, perhaps because data are lacking.
One trend analysis paper produced by FGFWFC as testimony to a public hearing (Moody 1970) summarized Lake George fisheries (south of the boundary of the LSJRB) and water quality information. This work could serve as a model for a future FGFWFC project in the LSJRB or any other specific waterbody.
An analysis of FGFWFC electrofishing data from 1 983 to 1 987 by Bass (1990) compared annual samples from 1 1 rivers around the state. The area from Lake Monroe (see Figure 1 ) north to Green Cove Springs consistently displays high values for catch per unit effort, in comparison with other rivers. Although data varies between years, no decline is apparent in the total biomass, number of species, numbers of gamefish and commercial fishes, or number of largemouth bass. Bass sees this dataset as the beginning of a long-term monitoring program which may detect and quantify ecological perturbations that could yield an understanding of the changes in populations and community stability. The small sample size (one sample per river per year) and probable sampling bias of the fishing gear (electrofishing) limits statistical analysis of Bass' data.
FGFWFC has been continuing its programs of sport and commercial fisheries research in the LSJRB. In 1990, the sport fisheries research program on the St. Johns River was divided into three distinct project areas (upper, middle, and lower), replacing the former two areas (upper and lower). The increased level of research effort in the LSJRB concomitant with this reorganization should offer an improved LSJRB database.
Commercial Fisheries Investigations
Commercial fisheries research is funded directly by the Florida State Game Trust Fund; these projects have produced annual
St. Johns River Water Management District
59
B IOLOGI CAL RESOU RCES
reports since 1981. The FGFWFC Commercial Fisheries Investigations Reports series summarizes a number of studies carried out from 1981 to the present. These projects included:
•
•
•
•
•
•
•
Wholesale Dealer Catch and Effort Data Reporting Biological Sampling of Commercial Catches Commercial Fisheries Resource Monitoring ( trawl sample collections) Experimental Gear Testing (hoop nets) Observation of Commercial Fishing Operations (hoop nets, gillnets, fish traps) Fish Tagging Investigations (catfish movements, age, and growth) Other short-term projects
General conclusions of the commercial fisheries research are summarized as follows:
• Freshwater commercial fishing in the St. Johns River from Duval County south to Lake Harney (see Figure 6.1 ) (including the estuarine and freshwater harvest of freshwater species such as American eel, American shad, blue crab, mullet, and all species of catfish) continues to be a viable enterprise. Year-to-year variations in commercial landings (Table 6.6) may be due to variations in rainfall (hence water level and, in the lower St. Johns River, salinity), fishing effort, market conditions, and reporting errors. Factors that cause these variations have not been quantified. Actual decline of the fisheries due to habitat loss or over-harvesting cannot be demonstrated from the present reports. None of these landing data have been analyzed to derive a dataset for the LSJRB as a separate analysis unit.
• The commercial fishing methods presently permitted in the St. Johns River apparently have a very small negative impact on gamefish species and sportfishing harvest. Studies on the use of wire traps, gillnets, and hoop nets all showed negligible mortality to gamefish species when commercial fishing regulations were followed.
St. Johns River Water Management District
60
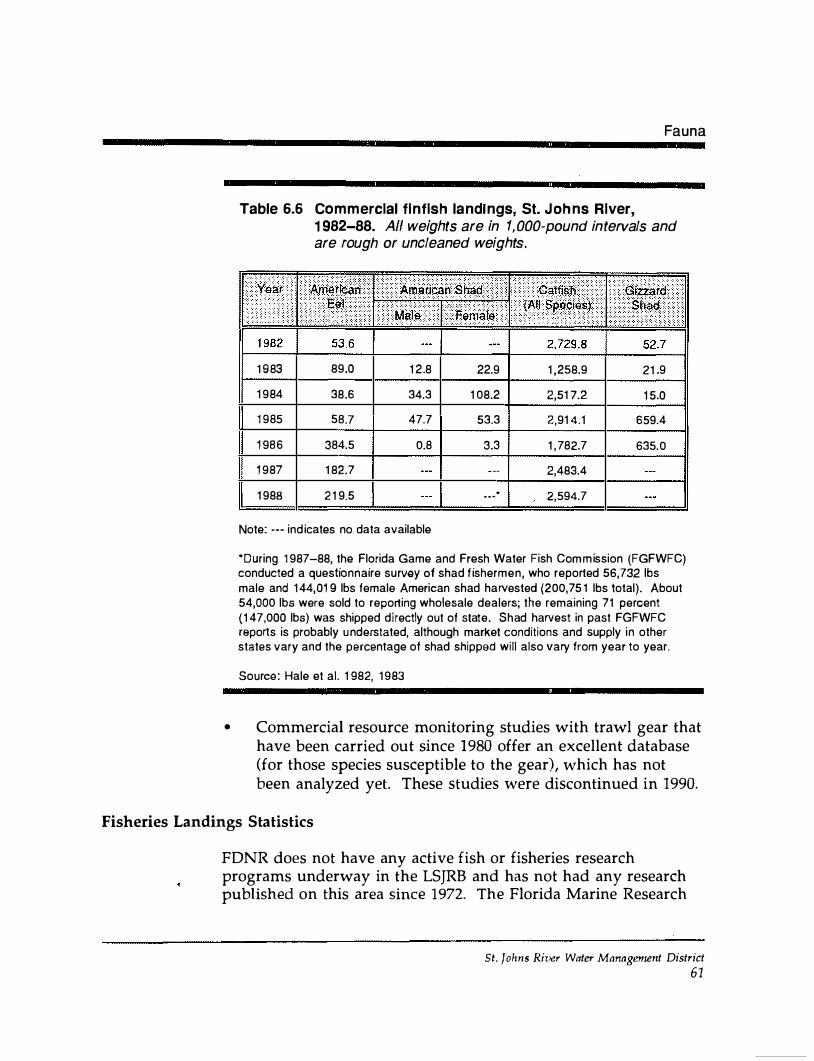
Fauna
Table 6.6 Commercial finfish landings, St. Johns River, 1 982-88. All weights are in 1, 000-pound intervals and are rough or uncleaned weights.
1 9 83 89 .0 1 2.8 22.9 1 ,258.9 21 .9
1 984 38.6 34.3 1 08.2 2,51 7.2 1 5.0
1 985 58.7 47.7 53.3 2,91 4.1 659.4
1 986 384.5 0.8 3.3 1 , 782.7 635.0
1 987 1 82.7 2,483.4
1 988 2 1 9.5 . . . * 2,594.7
Note: --- ind icates no data available
*During 1 987-88, the Florida Game and Fresh Water Fish Com m ission (FGFWFC) conducted a questionnaire survey of shad f ishermen, who reported 56,732 lbs male and 1 44,01 9 lbs female American shad harvested (200, 75 1 lbs total) . About 54,000 lbs were sold to reporting wholesale dealers; the remaining 71 percent ( 1 47,000 lbs) was shipped directly out of state. Shad harvest in past FGFWFC reports is probably u nderstated, although market conditions and supply in other states vary and the percentage of shad shipped will also vary from year to year.
SourcG : Hale et al. 1 982, 1 983
• Commercial resource monitoring studies with trawl gear that have been carried out since 1980 offer an excellent database (for those species susceptible to the gear), which has not been analyzed yet. These studies were discontinued in 1990.
Fisheries Landings Statistics
FDNR does not have any active fish or fisheries research programs underway in the LSJRB and has not had any research published on this area since 1972. The Florida Marine Research
St. Johns River Water Management District 61
B IOLOG ICAL RESOURCES
Shad Studies
Institute's (FMRI) (operated by FDNR) 5-year research plan for 1989 to 1994 (Steidinger 1989) does not indicate any projects proposed for the St. Johns River area.
As noted in the subsections on blue crab, shrimp, and mollusc fisheries, FDNR landings reports are processed through the MarFis program; finfish landings are similarly reported. These data do not produce statistics that accurately estimate fish stock abundance or population health. Without properly designed data collection on the fishing effort (number of hours spent using a specific fishing gear), the locality of the catch, and the catch per unit of effort, these fisheries-dependent data cannot be used to produce valid trend analyses. A research program to develop fisheries-independent (derived from scientifically based stratified random samples from biologists' proven sampling gear rather than from fishermen's records) statistics will be required to estimate spawning success, to monitor juvenile growth, and to predict recruitment, natural (non-fishing) mortalities, and the potential harvest of any particular species (FMRI 1989) . FDNR has no announced plans to begin monitoring the St. Johns River, although Fisheries Independent Monitoring Programs in Tampa Bay, Charlotte Harbor, and the Indian River Lagoon are underway.
Two studies of American shad (Alosa sapidissima) were carried out during a period of coastwide (Canada-Florida) decline in the fishery. U.S. Bureau of Commercial Fisheries studies from 1952 to 1958 were summarized by Walburg (1960), who produced age and growth information, fecundity and recruitment estimates, and quantified the sport and commercial harvests. Shad in the St. Johns River, unlike the remaining coastwide populations, spawn only once, and the significance of selective harvest of females on successful spawning may be different from more northerly populations.
Williams and Bruger (1972) established a clear definition of American shad spawning grounds (Crows Bluff south of Lake
St. Johns River Water Management District
62
Fauna
Woodruff on the St. Johns River to U.S. 192, west of Melbourne) and studied movement, growth, and food habits of juvenile shad. They also attempted to evaluate the effects of the fisheries and environmental alterations on the shad population. Williams and Bruger suggested that over-fishing of St. Johns River stocks might have been responsible for a declining catch during 1960-71 . However, the disproportionate female:male ratio and the decreasing sport and commercial fisheries harvest may reflect differences in year-class abundance or increased natural mortality to females based upon slower maturation. The authors recommended a decrease in legal mesh size of gillnets to balance the sex ratio in shad harvest, limitation of total gillnet yardage, reduction in or elimination of haul seine harvesting, decrease in the sport catch, and improved monitoring of the commercial harvest catch and effort. The recommended elimination of haul seines (which in the 1950s took between 60 to 85 percent of the shad harvest) has been implemented. The 1988 reported shad harvest (200,000 lb), however, was at a level similar to the lowest reduced harvest years of the 1953-71 period (1957 = 261,000 lb; 1971 = 233,000 lb). Because gillnets account for the majority of 1988 shad landings, some factor other than fishing mortality must be responsible for the reduced harvest.
Williams and Bruger (1 972) suggested that spawning habitat alteration through reductions of water level by diversion, loss and destruction of marsh and floodplains, and deteriorating water quality from sewage and industrial effluent almost certainly contributed to reduced recruitment of juveniles. As of 1990, most fisheries scientists still maintained this belief, but the actual contribution of any of these sources has not been quantified in the LSJRB.
Ulcerative Disease Syndrome
During 1983 and 1984, reports of large numbers of several species of fish with Ulcerative Disease Syndrome (UDS) in the LSJRB caused FDER to request an ichthyofaunal study to provide baseline data on fish populations and to document the level of occurrence of UDS. Continental Shelf Associates (CSA)
St. Johns Rh>er Water Management District 63
BIOLOGICAL RESOURCES
conducted this study from April 1987 to March 1988. Using trawl and gillnet, CSA sampled six stations between Clapboard Creek and Palatka at monthly intervals. Data for the fish population sampling are provided in the report, along with water quality parameters and UDS information. CSA (1988) concluded that UDS was of minor importance to the system as a whole (73 lesioned fishes out of 69,51 0 sampled, or 0.1 1 percent). However, two monthly samples in the Talleyrand area, near downtown Jacksonville, revealed a "hot spot," with 14 fishes out of 277 sampled (5.1 percent) showing obvious open lesions. The authors suggested that localized UDS outbreaks such as this may have a pollution-related origin, most likely from heavy metals. They recommended year-round fish sampling in the Talleyrand area " . . . with detailed water sediment chemistry analysis to pinpoint the source(s) of the problem so that some solutions to UDS may be formulated" (CSA 1 988, p. 77). The data from the ichthyofaunal study will be published with more extensive analysis in peer-reviewed literature (D. Snyder, CSA, pers. com.).
The microbiological studies of lesions from UDS samples obtained in the CSA study were published separately (Lin and Te Strake 1988). Most lesions were the result of bacterial infections (Aeromonas and Vibrio); only 0.02 percent of the total fish sampled tested positive for fungi. The bacteria present were fish pathogens commonly found in many estuarine systems, and the UDS outbreak may represent an immune system suppression response from environmental factors more than representing an epidemic bacterial infection. No further sampling or studies of UDS have been published.
Habitat Assessment
A FDNR review paper (Durako et al. 1988; an earlier version of this paper appears as Ourako et al. 1 987) summarized a large body of information on habitats, estuarine communities, and species. The 1988 paper presents an excellent regional (northeast Florida) perspective and contains a thorough bibliography. The report and the bibliography contain very few references specific to the LSJRB. Much of this assessment is based upon
St. Johns River Water Ma1tagement District 64
Fauna
generalization from research carried out in other areas and, although conceptually correct, has limited quantitative application to the St. Johns River.
Ongoing Research
SJRWMD, in cooperation with FGFWFC, has undertaken a pilot study to determine the feasibility of using an Index of Biological Integrity (IBI) for fish populations in the LSJRB (Brody and Schell 1990). IBI studies will attempt to develop a biological methodology for examining water quality to complement the physical, chemical, and biochemical methods already in use. The pilot project uses a series of metrics (estimators) to score the species diversity and trophic structure of sites where water quality is impacted (degraded from natural conditions) in comparison with a pristine or regionally minimally impacted sites. The methodology evolves from similar indices developed for cool, freshwater streams by Karr (1981 ) and for estuarine systems by Thompson and Fitzhugh (1985). The U.S. Environmental Protection Agency (EPA) has mandated that states develop and use bioassessment techniques, such as IBI, in estuaries by late 1993 (EPA 1989). Sampling for the pilot IBI project began in September 1990.
Schell and Brody (1990) designed a project to study the toxic chemicals present in fish tissue. This project is funded through the SWIM program; it will identify as problem pollutants those contaminants known to be present in the water and sediment by the presence of these contaminants in fish tissue. Species were selected based on distribution throughout the LSJRB, reported life histories, and the limited home range and high fat content of the fish. These species include spotted seatrout, American eel, largemouth bass, brown bullhead, and white catfish. Ten general locations were chosen for sampling these species, based on reports in the literature indicating known chemical contamination of the sediments. Fish samples are collected by SJRWMD in cooperation with FGFWFC and Organized Fishermen of Florida (a commercial fisherman's group). Bio-Environmental Services Division of the City of Jacksonville, under contract with
St. Johns RiPer Water Management District
65
B IOLOG ICAL RESOURCES
SJRWMD, will analyze muscle and lipophilic tissues (liver, gonad, and adipose tissue) for total polychlorinated biphenyls, organic mercury, chlorinated pesticides, and polycyclic aromatic hydrocarbons and screen for chlorinated dibenzo-dioxins and chlorinated dibenzo-furans.
AQUACULTURE
Aquaculture (farming of freshwater organisms) in the LSJRB is a small but growing enterprise utilizing the LSJRB biological resources. Florida Agriculture Statistics Service (1990) reports at least 15 active aquaculture producers in the LSJRB in 1990, a 20 percent increase over 1988 estimates. Aquaculture ventures include catfish farms, baitfish rearing, and eel and hybrid striped bass growout facilities. Individuals who use private ponds for recreational fish stocking and harvest are not included in the Florida Agriculture Statistics Service (1990) report. Several "fee fishing" operations exist where the public may pay to catch farmraised fish. Conditions in the LSJRB, particularly where Floridan aquifer system water is available, are adequate for culturing several species (catfish, eel, hybrid striped bass, baitfish).
Mariculture (farming of saltwater organisms) in the LSJRB is limited to nine oyster leases in the Duval County shellfish harvesting area (Adamus et al. 1987). A series of legal challenges of FDNR rules to the Marine Resources Commission has recently modified the regulations on oyster lease harvesting, and this form of mariculture may receive revived attention in the LSJRB in the future (Florida Aquaculture Association 1990).
Several regulatory agencies have jurisdiction or partial authority over aquaculture activities, and the resulting confusion has stifled development of aquaculture enterprises in the past. At present, the Florida Department of Agriculture and Consumer Services (FDACS), FGFWFC, FDNR, FDER, SJRWMD, and the Florida Department of Health and Rehabilitative Services all have some regulatory responsibility at the state, regional, or local level. USACE, EPA, the U.S. Fish and Wildlife Service, and the U.S. Food and Drug Administration generally delegate their
St. Johns River Water Management District 66
Fauna
responsibilities to state agencies on intrastate issues, but still require separate compliance for interstate activities and shipment of aquaculture products (FDACS 1990). The Florida Aquaculture Association has recently promoted the "aquaculture is agriculture" concept and takes an active role in attempting to restructure the state bureaucracy to streamline regulation and remove aquaculture products from the jurisdiction of agencies, the primary mission of which is the protection of wild stocks. The current FGFWFC restrictions on rearing non-local species of crayfish, requirements for individual tagging of farm-raised gamefish, and collection permits for juvenile non-gamefish are the subject of current discussions. Aquaculture industry reaction to classification of fish-farm effluent as industrial waste by FDER has prompted interagency research to better understand the problem. Streamlining of water management district permitting has evoked praise from aquaculture proponents (Florida Aquaculture Association 1990).
St. Johns River Water Management Distrid 67
B I OLOG ICAL RESOURCES
ECONOMIC IMP ACT OF FISHERIES
Economic impacts of recreational and commercial fisheries have only approximate values as of 1990. Data on marine fisheries landings collected by FDNR MarFis provide total poundage reported for each species in a particular county and total dollars paid to commercial fishermen (dockside or ex-vessel value) on a statewide (but not at the county) level. FGFWFC Commercial Fisheries Investigations Reports provide total ex-vessel value and derive average prices paid per pound for several freshwater species in the St. Johns River area. Neither of the published datasets can be manipulated to produce an estimation for the LSJRB alone. These data can be combined with estimates of fishermen's expenditures on goods and services; wholesale dealer markup; wages; and expenses of fish processors, wholesalers, transportation agents, and similar businesses to produce estimations of economic impact to the economy of a particular area. Various economic multipliers (factors that sum the effects noted above) derived for areas outside the St. Johns River can produce regional economic impact and, separately, total economic activity (S. Hardin, FGFWFC, pers. com.; Cato and Prochaska 1980; Bell et al. 1982). These multipliers offer an order of magnitude estimate (but not a precise value) when used outside of the area for which they were derived.
COMMERCIAL FISHERIES
Using a variety of multipliers (Cato and Prochaska 1980; Bell 1979) and the 1987-88 FGFWFC data for all reported commercial landings on the entire St. Johns River and Lake Apopka, a dockside value of $4.2 million produced a range of probable regional economic impact of $8.4 million to $12.6 million (Brody 1990a). Total economic activity (an estimation of the flow of money into the state that would not occur if there were no commercial fishery) is produced with different multipliers; the estimate for the same St. Johns River data was $12.6 million to $33.0 million (Brody 1990a).
St. Johns River Water Management District
68
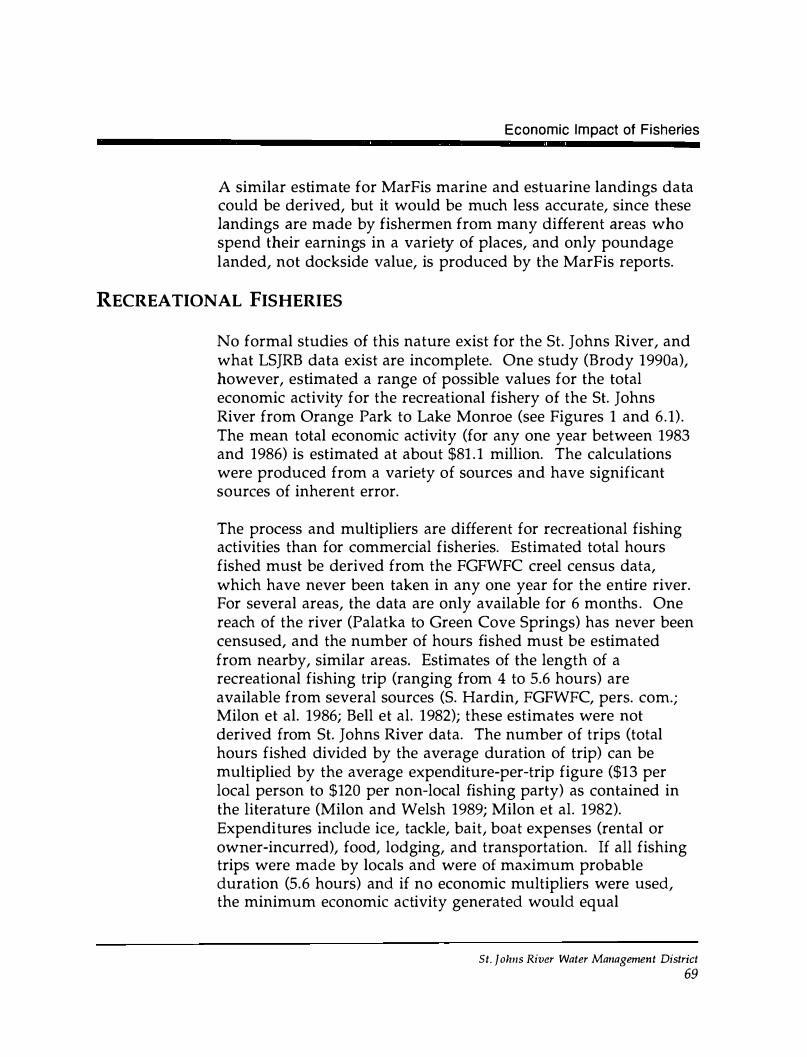
Economic Impact of Fisheries
A similar estimate for MarFis marine and estuarine landings data could be derived, but it would be much less accurate, since these landings are made by fishermen from many different areas who spend their earnings in a variety of places, and only poundage landed, not dockside value, is produced by the MarFis reports.
RECREATIONAL FISHERIES
No formal studies of this nature exist for the St. Johns River, and what LSJRB data exist are incomplete. One study (Brody 1990a), however, estimated a range of possible values for the total economic activity for the recreational fishery of the St. Johns River from Orange Park to Lake Monroe (see Figures 1 and 6.1) . The mean total economic activity (for any one year between 1983 and 1986) is estimated at about $81 .1 million. The calculations were produced from a variety of sources and have significant sources of inherent error.
The process and multipliers are different for recreational fishing activities than for commercial fisheries. Estimated total hours fished must be derived from the FGFWFC creel census data, which have never been taken in any one year for the entire river. For several areas, the data are only available for 6 months . One reach of the river (Palatka to Green Cove Springs) has never been censused, and the number of hours fished must be estimated from nearby, similar areas. Estimates of the length of a recreational fishing trip (ranging from 4 to 5.6 hours) are available from several sources (S. Hardin, FGFWFC, pers. corn.; Milon et al. 1986; Bell et al. 1982); these estimates were not derived from St. Johns River data. The number of trips (total hours fished divided by the average duration of trip) can be multiplied by the average expenditure-per-trip figure ($13 per local person to $120 per non-local fishing party) as contained in the literature (Milon and Welsh 1989; Milon et al. 1982). Expenditures include ice, tackle, bait, boat expenses (rental or owner-incurred), food, lodging, and transportation. If all fishing trips were made by locals and were of maximum probable duration (5.6 hours) and if no economic multipliers were used, the minimum economic activity generated would equal
St. Johns River Water Management District
69
B I OLOGICAL RESOURCES
$4. 1 million. If all trips were made by non-locals and were of shortest probable duration (4 hours) and if the maximum multiplier was used, maximum economic activity generated would be $159.5 million (Brody 1990a).
Obviously, neither of these recreational fishery scenarios is precisely correct. Calculations using the mean of the factors and multipliers produce a mean economic activity estimate of $81 . 1 million for the freshwater portion of the St. Johns River. A similar estimate might be calculated for the entire LSJRB, both freshwater and estuarine segments, but most of the factors and multipliers used would suffer additional loss of precision by restricting the size of the region.
St. Johns River Water Management District
70
- - - -----------
Protection for Biolog ical Resources
PROTECTION FOR BIOLOGICAL RESOURCES
Protecting the biological resources of the LSJRB can occur through various mechanisms, such as designating species as species of special concern, designating aquatic habitats as special areas, and enforcing laws that protect species or habitats.
SPECIES OF SPECIAL CONCERN
A number of species within the LSJRB have been designated by state or federal agencies to receive special consideration because the present populations were significantly limited, either through the influences of man or by the natural distribution patterns. The literature for the endangered and threatened species within the LSJRB is substantial and will not be reviewed in detail. A series of six volumes sponsored by the Florida Audubon Society and the Florida Defenders of the Environment was published from 1978-81 (Florida Committee on Rare and Endangered Plants and Animals); a revision is in progress. For every species recognized by the committee, these volumes offer short reviews of range, habitat, life history, and ecology; a basis of status classification; recommendations; and a selected bibliography.
A list of species classified as Endangered, Threatened, Species of Special Concern, or Rare is published and revised yearly by FGFW'FC (Wood 1990). Fourteen plant species and thirty-five animal species are found in the LSJRB (Tables 6.7 and 6.8, respectively).
Endangered organisms such as manatees, sturgeons, and other fishes are found throughout the St. Johns River. Organisms commensal with threatened species such as gopher tortoises or fox squirrels are frequently endangered themselves, but their habitat (actually the habitat of their hosts) is not localized. FGFWFC carries out a series of studies under the Threatened and Endangered Bird Research Project (Nesbitt 1990) in which
St. johns River Water Management District 71
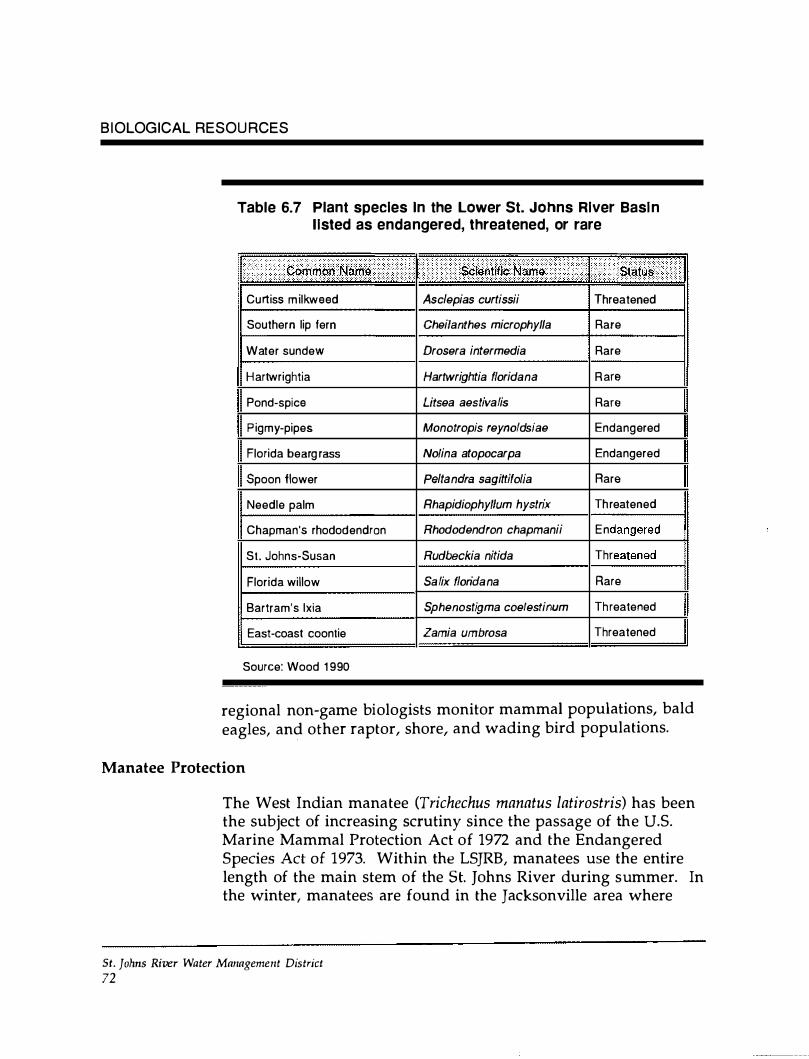
B I OLOGICAL RESOU RCES
Table 6.7 Plant species In the Lower St. Johns River Basi n l isted as endangered, threatened, or rare
.....•..•.••... ..... . .... ·.1���;11111 ·································� �:t1!�m� .••••••••• . ...... �f
Curtiss m ilkweed Asclepias curtissii Threatened
Southern lip fern Cheilanthes microphylla Rare
Water sundew Drosera intermedia I Rare
H artwrightia Hartwrightia f/oridana R are
Pond-spice Utsea aestivalis Rare
P igmy-pipes Monotropis reynoldsiae Endangered
Florida bearg rass No/ina atopocarpa Endangered
Spoon flower Peltandra sagittifolia Rare
Needle palm Rhapidiophy!lum hystrix Th reatened
Chapman's rhododendron Rhododendron chapmanii En
St. Johns-Susan Rudbeckia nitida Thr
Florida willow Salix floridana Rare
Bartram's lxia Sphenostigma coelestinum Th reatened
East-coast coontie Zamia umbrosa Threatened
Source: Wood 1990
ll II
regional non-game biologists monitor mammal populations, bald eagles, and other raptor, shore, and wading bird populations.
Manatee Protection
The West Indian manatee (Trichechus manatus latirostris) has been the subject of increasing scrutiny since the passage of the U.S. Marine Mammal Protection Act of 1972 and the Endangered Species Act of 1973. Within the LSJRB, manatees use the entire length of the main stem of the St. Johns River during summer. In the winter, manatees are found in the Jacksonville area where
St. Johns River Water Management District 72
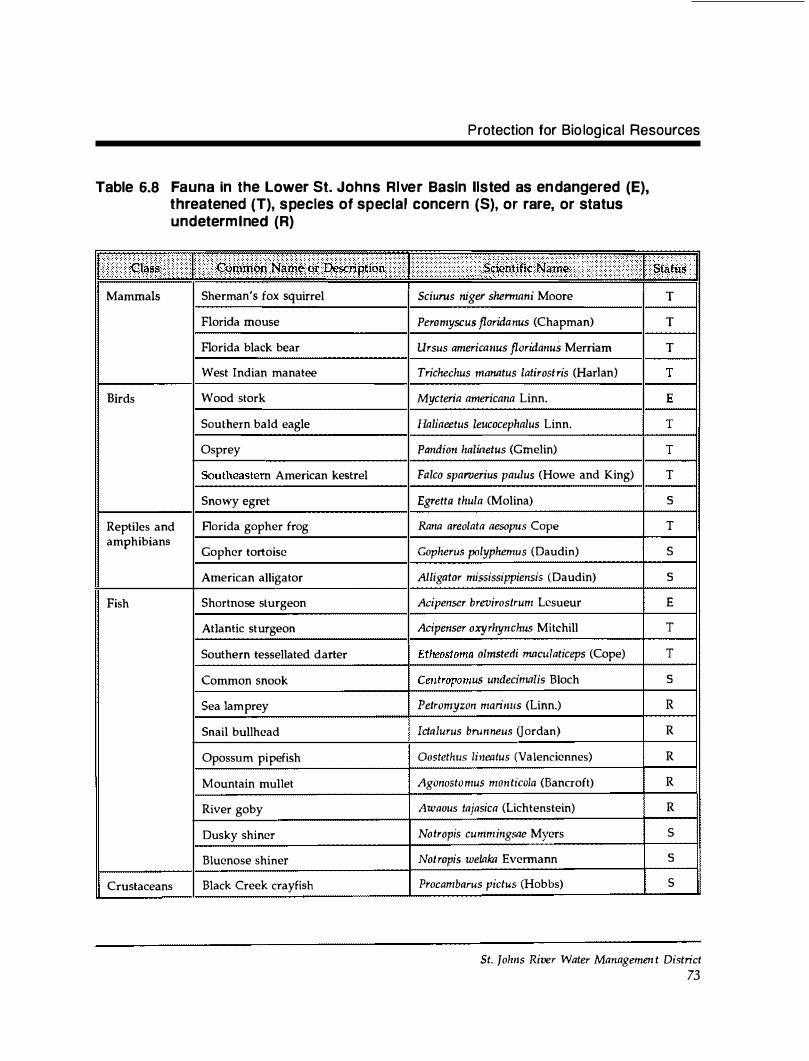
Protection for Bio logical Resources
Table 6.8 Fauna In the Lower St. Johns River Basin listed as en dangered (E), threatened (T), s pecies of special concern (S), or rare, or status undeterm ined (R)
Mammals Sherman's fox squirrel Sciurns niger shennani Moore
Florida mouse Peromyscus floridanus (Chapman)
Florida black bear Ursus americanus floridanus Merriam
West Indian manatee Trichechus manatus latirost ris (Harlan)
Birds Wood stork Mycteria americana Linn.
Southern bald eagle Haliaeetus leucocephalus Linn.
Osprey Pandion hali/letus (Gmelin)
n American kestrel Falco sparverius paulus (Howe and King)
Snowy egret Egretta thula (Molina)
Reptiles and Florida gopher frog Rana areolata aesopus Cope amphibians
Gopher tortoise Gopherus polyphemus (Daudin)
American alligator Alligator mississippiensis (Daudin)
Fish Shortnose sturgeon Acipenser brevirostrum Lesueur
Atlantic sturgeon Acipenser oxyrhynchus Mitchill
Southern tessellated darter olmsterli macu/aticeps (Cope)
Common snook us undecimalis Bloch
Sea lamprey Petromyzon marinus (Linn.)
Snail bullhead Ictalurus brnn neus Gordan)
Opossum pipefish Oostethus lineatus (Valenciennes)
Mountain mullet Agonosto mus monticola (Bancroft)
River goby Awaous tajasica (Lichtenstein)
Dusky shiner Notropis cummingsae Myers
Bluenose shiner Not ropis welnka Evermann
Crustaceans Black Creek crayfish Procambarus pictus (Hobbs)
T
T
T
T
5
T
s
5
E
T
T
5
R R
R
R
R
s
5
s
St. Johns River Water Managemen t District 73
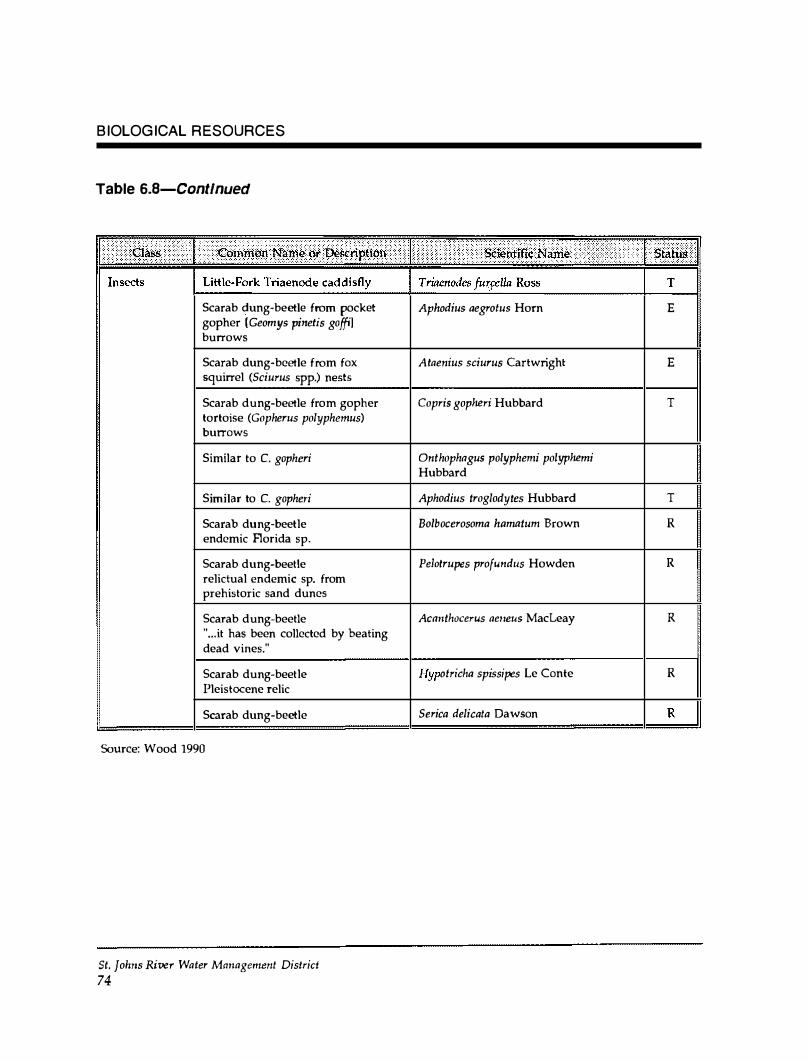
B IOLOG ICAL R ESOURCES
Table 6.8-Contlnued
Scarab dung-beetle from pocket gopher (Geomys pinetis goffil burrows
Scarab dung-beetle from fox squirrel (Sciurus spp.) nests Scarab dung-beetle from gopher tortoise (Gopherus polyphemus) burrows
Similar to C. gopheri
Similar to C. gopheri
Scarab dung-beetle endemic Florida sp.
Scarab dung-beetle relictual endemic sp. from prehistoric sand dunes
Scarab dung-beetle " ... it has been collected by beating dead vines."
Scarab dung-beetle Pleistocene relic
Scarab dung-beetle
Source: Wood 1990
St. Johns River Water Management District 74
Aphodius aegrotus Horn
Ataenius sciurus Cartwright
Copris gopheri Hubbard
Onthophngus polyphemi polyphemi Hubbard
Aphodius troglodytes Hubbard
Bolbocerosoma hnmatum Brown
Pelotrupes profundus Howden
Acnnthocerus aeneus MacLeay
otricha spissipes Le Conte
Serica delicata Dawson
E
E
T
T
R
R
R
R
R
Protection for Bio logical Resou rces
warm-water effluents come from power plants. In the best summary of manatee information currently available, Beeler and O'Shea (1988) reviewed data from tens of thousands of sightings and mortality data from nearly 1 ,000 animals. Beeler and O'Shea (1988) proposed a number of research programs and regulatory actions. Valade (1989) proposed specific regulatory efforts for the LSJRB, which have yet to be acted upon. FDNR publishes a series of manatee status reports and promotes manatee protection zones. Many shoreline areas are currently posted with manatee warning signs provided by the FDNR manatee project (B. Ackerman, FDNR, pers. com.).
West Indian manatees within the LSJRB are under severe threat from propeller-inflicted wounds (rarely fatal) and collisions with boats (frequently the cause of mortalities) (Beeler and O'Shea 1 988) . Local governments have proposed boating speed restrictions, which would help protect the sirenians; however, as of November 1990, no speed zones had yet been established by local governments. Although listed as endangered and protected under Chapter 39-27 Florida Administrative Code (F.A.C.) ("No person shall kill, attempt to kill, or wound any endangered or threatened species"; violators are subject to fine or imprisonment), a number of manatees in this declining population are harmed by humans every year.
In mid-1990, FMRI opened a marine mammal field research facility in Duval County to focus on manatee and right-whale biology and the regula tory actions required in order to better manage these species (J. Valade, FDNR, pers. com.).
Endemic Species
The endemic or disjunct distribution of a number of species in the LSJRB is the major reason these species are listed as rare or of special concern. Regionally endemic species with distribution overlapping the LSJRB are discussed by Burgess and Franz (1978) (see p. 15).
St. Jolms River Water Management District 75
B IOLOG ICAL RESOURCES
The endemic distribution of the Black Creek crayfish (Procambarus pictus) and three species of chironomid flies in Black Creek confirm the isolation of this drainage (see Figure 3 for location of Black Creek). Most authors agree that P. pictus may be the earliest surface-dwelling crayfish to colonize peninsular Florida and survive to the present date. This LSJRB endemic species has been the subject of several studies .
Procambarus pictus was described originally in the literature by Hobbs (1940), who later revised its taxonomic position among the crayfish of Florida (1942). He proposed an evolutionary scheme (1958) and noted phylogenetic relationships to a number of troglobitic (cave-dwelling) forms (Hobbs et al. 1977). Following the discovery of several new species, evolution and distribution of the troglobitic crayfish were defined further by Franz and Lee (1982) .
Franz and Franz (1979) carried out extensive field work in Duval, Clay, Putnam, Alachua, and Marion counties. They were unable to collect P. pictus outside of the Black Creek drainage, finding it only in the cool, fast-flowing, tannin-stained reaches of the North and South Forks of Black Creek (see Figure 6.1) and a few direct tributaries to the lower sections of the main stem of Black Creek. They thus confirmed the endemicity of P. pictus. Franz and Franz (1979) also suggested that this species be considered a species of special concern because it was noticeably absent from most sections of Black Creek where anthropogenic activity has caused siltation, excessive enrichment of nutrients, or channelization with reduced stream flow.
The North Fork of Black Creek habitats and populations of Procambarus pictus (an endemic species) were recently revisited by Brody (1990b), who found the species absent from several of the Franz and Franz (1979) collection sites. At these sites, development has been intensive. Kingsley Lake and the North Fork of Black Creek within the boundaries of Camp Blanding Wildlife Management Area have been accorded Outstanding Florida Water (OFW) status, partly as a result of the Brody
St. Johns River Water Management District 76
Protection for Biological Resou rces
studies, which recommended approval of OFW designations as a means of maintaining viable P. pictus stocks.
AQUATIC HABITATS
The State of Florida has designated certain areas within the LSJRB where natural habitat values can be preserved concurrent with permitted compatible uses by humankind. These area designations include Classified Surface Waters, OFW, and Aquatic Preserves.
Classified Surface Waters
The State of Florida has classified surface waters according to designated uses, as prescribed in Chapter 17-3, F.A.C. The classifications are
• Class I-Potable Water Supplies o Class II-Shellfish Propagation or Harvesting • Class III-Recreation and Propagation and Maintenance of a
Healthy, Well-Balanced Population of Fish and Wildlife • Class IV-Agricultural Water Supplies • Class V-Navigation, Utility, and Industrial Use
All waters of the LSJRB are classified as either Class II or Class III.
Class II areas are under the jurisdiction of FDNR. Under Chapter 1 6B-28, F.A.C., FDNR regulates harvesting, processing, and shipment of shellfish according to the National Shellfish Sanitation Program standards and guidelines. These guidelines require that shellfish harvesting areas be surveyed and that the sanitary quality of the water (bacterial, viral, and priority pollutant contamination) be evaluated on a regular basis. Those areas that meet sanitary requirements are then identified as shellfish harvesting areas. The only site evaluated and designated as Class II water within the LSJRB is the Duval County shellfish harvesting area at the mouth of the St. Johns River (see Figure 6.1) (Adamus et al . 1987, Figure 5).
St. Johns River Water Management District 77
B IOLOGICAL RESOURCES
There are no data on shellfish harvesting in Class III waters.
Outstanding Florida Waters
Chapter 17-3, F.A.C., also establishes special protection for waterbodies designated OFW by the Florida Environmental Regulation Commission. The OFW designation, administered by FDER1 directly affects only those activities that require an FDER permit. Existing permits are not affected. New direct pollutant discharges to OFW must not lower existing ambient water quality. New indirect pollutant discharges to waters that influence OFW must not significantly degrade the nearby OFW.
Areas designated as OFW are identified in Section 17-302.700, F.A.C.; they include waters within state parks, preserves, and wildlife refuges (but not necessarily Wildlife Management Areas). FDER considers waters within rivers designated under the Florida Scenic and Wild Rivers Program and Federal Wild and Scenic Rivers Act and waters within areas purchased under the Environmentally Endangered Lands, Conservation and Recreational Lands, Land Acquisition Trust Fund, Conservation 2000, and Save Our Coast programs as OFW until formal OFW designation is obtained.
Six waterbodies in the LSJRB are designated as OFW (Figure 6.3):
• Nassau River-St. Johns River Marsh Aquatic Preserve (contains the Amelia Island State Recreation Area, Big Talbot Island, and Little Talbot Island State Park)
• Kingsley Lake and that part of the North Fork of Black Creek within the boundaries of Camp Blanding Wildlife Management Area (see Figure 6. 1)
• Mike Roess Gold Head Branch State Park (Keystone Heights)
• Ravine Gardens State Park (Palatka)
St. Johns River Water Management District 78
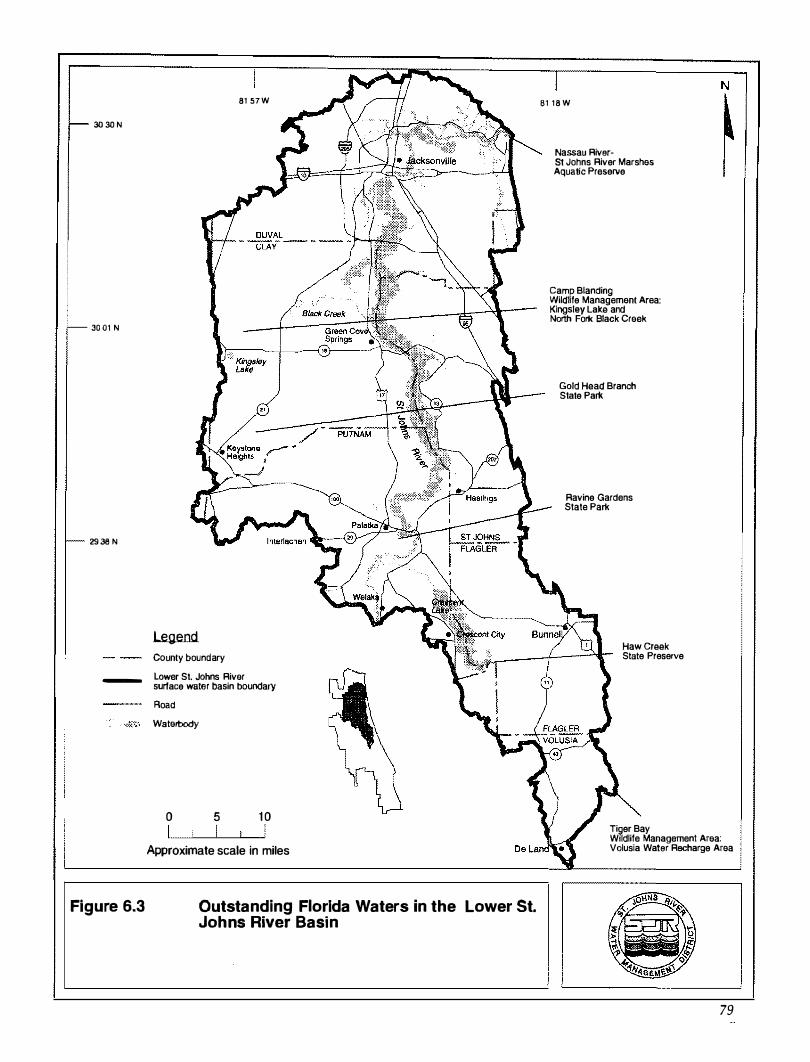
3030 N
30 01 N
29 38 N
-
Figure 6.3
81 57W
Legend County boundary
Lower St. Johns River surface water basin boundary
Road
Waterbody
0 5 1 0
Approximate scale in miles
Outstanding Florida Waters in the Lower St. Johns River Basin
81 1 8 W
Nassau River-51 Johns River Marshes Aquatic Preserve
Camp Blanding Wildlife Management Area: Kingsley Lake and North Fork Black Creek
Gold Head Branch S1ate Park
Ravine Gardens State Park
Haw Creek State Preserve
N
Ti�er Bay Wildlife Management Area: Volusia Water Recharge Area
79
B IOLOG ICAL RESO U RC ES
•
•
Aquatic Preserves
Haw Creek State Preserve (near the southern tip of Crescent Lake)
Volusia Water Recharge Area (part of the Tiger Bay Wildlife Management Area)
The Florida Aquatic Preserve Act (Chapter 258, Florida Statutes) sets aside state-owned lands to be preserved in an essentially natural or existing condition so that the aesthetic and scientific values of the land may endure for future generations. Aquatic Preserves are managed by FDNR, Division of Recreation and Parks, Bureau of Land and Aquatic Resource Management. The Nassau River-St. Johns River Marsh Aquatic Preserve is the only designated Aquatic Preserve within the LSJRB (Figure 6.3).
FISHERIES LAW ENFORCEMENT
At present, a jurisdictional boundary limits the work of the two primary state agencies responsible for enforcing laws regarding fish and fisheries to discrete areas on the main stern. Of these agencies, FDNR is responsible for the area from the Interstate 295 (Buckman) bridge north and east to the Atlantic Ocean. FGFWFC is responsible for the area from the Buckman Bridge south. FDNR Marine Patrol and FGFWFC wildlife officers enforce laws relating to both marine and freshwater species in their respective areas of the St. Johns River. Since many species of each type transcend the administrative boundary, law enforcement is complex. Many changes in regulations and licensing occur and can be confusing. The recently created FDNR Salt Water Recreational Fishing License has been particularly difficult for the estuarine sportsmen, commercial fishermen, and law enforcement agents to deal with because several marine species are regulated by FGFWFC officers for the first time in freshwater areas.
St. Johns River Water Management District
80
Protection for Biological Resources
BIOASSESSMENT PROGRAM
EPA and FDER will develop biological assessment protocols which define environmental quality (EPA 1989). A bioassessment program utilizing macroinvertebrate organisms (those retained by a 1 -mm sieve) has been in place in Florida since 1973. This "Biological Aspects of Water Quali ty'' program, conducted by FDER, monitors the invertebrate communities as a direct indicator of the effects of nonpoint pollutants on the biota. The program currently is being modified in response to EPA requirements for biological monitoring (EPA 1989). The program is based on observations of three different measures of the quality of the macroinvertebrate community: diversity on artificial substrates (e.g., specially designed samplers), diversity on natural substrates (usually mud or sand), and the Biotic Index (since 1977, also termed Florida Index). This Index, a modified Shannon-Weiner diversity calculation, is specifically applicable to fresh waters of Florida, and
" . . . comparisons between stations are not advisable and the Index should be considered better as an indicator of the presence of organic pollution (low values) than the absence of it (high values)" (Ross and Jones 1979).
The naturally occurring variations between the macroinvertebrate populations at any two stations along an estuarine gradient preclude this Index from being used for the LSJRB; data from any one station, however, might be used to produce trend analyses. FDER has produced a series of data reports of annual survey results (Banks 1987), but no long-term summary or trend analyses have appeared to this date. These data must await interpretation by the appropriate specialists.
St. Johns River Water Management District
81
B IOLOGICAL RESOURCES
SUMMARY
Through this study, the scientific literature for the LSJRB has been reviewed. At present, there is a paucity of information from which to develop valid recommendations for improvement strategies and management strategies for the LSJRB SWIM initiative. The majority of sampling of the biological resources carried out in the LSJRB has not been reported in peer-reviewed journals. Many of the data gathered are available only in projectspecific documents, government reports, and consultant reports and are often not easily obtainable. Much of the governmentsupported research that is available has taken a species-specific or problem-solving approach without extensive consideration of the biologic community as a whole. The primary need for the LSJRB is additional data. Virtually all types of research on the aquatic and estuarine biota and their environment are necessary.
HYDROLOGY
SALINITY
The hydrology of the St. Johns River system drives the migrations of its most important fisheries resources, distributes natural and anthropogenic sources of nutrition, and determines the fate of pollutants entering the system. Remedial measures for the LSJRB can be most effectively undertaken with better understanding of the ebb and flow of its waters.
The St. Johns River is tidal throughout the LSJRB, and a large portion of the system maintains oligohaline conditions. The St. Johns River estuary is unique in that it does not conform to any of the standard definitions: oceanic salinity is diluted by freshwater runoff in the lowest (most northerly) 60 miles of the river, reaching a minimum salinity in the Palatka region, as in a typical estuary. Then salinity increases upriver due to ground water inflows from springs and upward leakage from the surficial aquifer system. This spring water contains large amounts of
St. Johns River Water Managernent District 82
Summary
dissolved sodium, calcium, and chloride ions. Thus, the boundary of the estuary is blurred; variations in rainfall between years can cause even greater perturbations. The biological effect of increasing ionic concentration in the upstream reaches of the LSJRB is to extend the range of a number of typically marine fish and invertebrates as far upstream as 160 miles from the Atlantic Ocean. No quantification of the ionic inputs from ground water sources has been attempted in the 40 years since the Odum report (1953). Limits to the influence of oceanic salinity in the LSJRB have not been established.
B LACKWATER
The bacterial and biochemical consumption of oxygen needs to be better understood in the LSJRB. High levels of suspended solids in forest and marsh runoff couple with low flushing rates (due to minimal stream gradients) and anthropogenic eutrophication (from agriculture and wastewater discharge) to produce very high primary nutrient concentrations.
The blackwater color of the St. Johns River, a result of high loads of suspended material and organic acids from the breakdown of forest leaf litter, attenuates light and probably limits submerged sessile plant growth to the shallows and creates several unique biological communities. Some of the characteristics of this blackwater system are high bacterial and organic and inorganic chemical oxygen demand, but these aspects of the ecosystem of the St. Johns River have not been studied from a biological community perspective.
At the present time, data are not available for an evaluation of the normal diurnal range of oxygen concentrations in the LSJRB system. Although oxygen concentrations are a primary water quality criterion in evaluating impacts of pollution, samples are rarely taken outside of the period of greatest photosynthetic activity (9 A.M. to 3 P.M.).
The impact of light penetration variations due to water color and suspended solids needs to be better understood. The limits of
St. Joltns River Water Management District
83
B IOLOG I CAL RESOURCES
depth to which submerged aquatic plants may grow as a result of reduced light penetration have not been studied.
PLANT COMMUNITIES
Increased capabilities for mapping vegetation based on aerial or satellite imagery have produced a partial estimate of saltmarsh habitat lost to dredge and fill activities, but this type of analysis has not been carried out for other major plant communities in the LSJRB. Because of the lack of baseline information that would establish the abundance and density of plant species in the wetland, aquatic, and estuarine habitats of the LSJRB, the current status of the plant communities in the LSJRB cannot be assessed properly. Data, in the literature, are not available on most habitats to produce trend analyses that would estimate the magnitude or rate of change that these communities are undergoing as a result of anthropogenic influences.
Saltmarsh Communities
Quantitative data on the composition and dynamics of the saltmarsh communities of the LSJRB are minimal, and the extensive literature on bioenergetics and nursery values developed in other areas cannot be applied to the St. Johns River until this information is available.
Submerged Plants
Submerged and emergent aquatic freshwater vegetation is recorded from many near-shore areas of the littoral zone in the oligohaline region of the LSJRB. The areal distribution of these plants has not been mapped: present photointerpretive efforts will not attempt to produce this product, due to reduced image quality caused by poor light penetration in this blackwater system. The distribution of species relative to the salinity regime of the estuary is not presently known.
St. Johns River Water Management District
84
Phytoplankton
S HRIMPING
Summary
A major component of the river's primary production (energy conversion by photosynthesis) is due to phytoplankton.
The levels of primary productivity (photosynthesis) documented in the literature represent such small samples over such short time periods that quantification is ill-advised. A long-term analysis of phytoplankton species, variations in abundance, and factors limiting phytoplankton communities has not been undertaken. The contribution of the phytoplankton community to carbon fixation through photosynthetic activity also needs to be quantified.
Although the number of s tudies is too small for proper generalization (two studies each of 1 -year duration in the past 40 years), the dominant phytoplankton organisms during most of the annual cycle appear to be siliceous diatom species. Silicate, the nutrient reported to limit these organisms more restrictively than phosphorus or nitrogen in other estuarine systems, has not been studied in the LSJRB. The role of nitrate (N) and phosphate (P) in this system is also unclear; N:P ratios reported in the literature are distinctly higher than in other Florida estuaries, but the reason for this difference has not been investigated.
Knowledge of the shrimp populations using the St. Johns River estuary is limited to a single study nearly 30 years old. This multimillion dollar resource should not be permitted to suffer the effects of continued development in the LSJRB without an understanding of the possible consequences that development may have on the fishery. Several issues regarding shrimp harvest are raised nearly every year by commercial fishing interests and conservationists, issues for which no data are available from the LSJRB. These issues are: What is the nature of shrimp netted bycatch? Does this by-catch have an impact on finfish species, and what is that impact? Do shrimp trawls cause disruption of benthic communities? Does the present level (or predictable
St. Johns River Water Management District 85
B IOLOGICAL RESOU RCES
future level) of shrimp harvest by commercial or recreational users have a long-term negative impact on shrimp stocks? Any answer offered for these questions currently must be based upon data from other estuarine systems and cannot represent more than a guess at the situation in the St. Johns River.
MOLLUSC POPULATIONS
Potential habitats of edible mollusc species of the LSJRB have been reduced severely as a result of dredge and fill activities in construction and maintenance of the ICW and St. Johns River ship channel. Although the St. Johns River has not had a large coastal embayment since at least the Pleistocene Epoch, much of the area from the Trout River-St. Johns River confluence eastward was undoubtedly productive shellfish bottom prior to deepening the channel, depositing spoil overboard, and conducting routine maintenance dredging. The presence of pathogens from wastewater sources in some of the remaining habitat along the ICW reduces potential harvest even further, because these areas are closed on a seasonal or permanent basis.
FINFISH POPULATIONS
At present, there is very little information that would indicate a significant change has taken place in the fish populations of the St. Johns River, but this may be entirely a matter of no research having been undertaken to document such a change. The identification of phytoplankton as dominant primary producers in the St. Johns River may be a result of change from the native status where submerged and emergent aquatic plants were more important. This type of systemic change has been noted elsewhere where increased nutrient inputs have occurred. Total fish biomass is likely to increase as a result of eutrophication of a system; fish community structure, however, is almost certain to become less complex, with higher numbers of individuals of some species, fewer numbers of species, reduced diversity of trophic structuref and change in dominant species. Many of these changes may reduce abundance of currently ��desirable" species.
St. Johns River Water Management District 86
FISHERIES
Summary
A wide variety of data on fish populations and associated habitat exist in FGFWFC files; many of these databases span several decades of field sampling.
Many questions regarding the status of fish, crab, and shrimp populations in the LSJRB could be answered by a fisheriesindependent monitoring program evaluating young-of-the-year survival, patterns of natural mortality, and potential recruitment to recreational and commercial fisheries. With the exception of largemouth bass, striped bass, and crappie, FGFWFC does not currently monitor the strength of the year-class or other statistics of population dynamics of the majority of fish species (or the entire fish community) in the LSJRB. FDNR does not have any active fisheries research programs in the LSJRB. A program such as the FDNR Fisheries Independent Monitoring Program (currently in place in Tampa Bay and elsewhere) will need to be adapted to the LSJRB system (by both FDNR and FGFWFC) if these data are to become available. The Index of Biological Integrity pilot studies currently under development may offer techniques for a biological assessment of water quality, but do not describe fish population dynamics.
Commercial Fishing
Reported commercial fishing harvest for shrimp, blue crab, catfish, and American eel may display wide fluctuations in annual catch totals. The variations in these landings reflect a combination of varying strength of the year-class and distribution of stocks, changes in fishing effort due to economic alterna tives chosen by the harvesters, perturbations in market demand based on harvests in other regions, and a host of other variables. Certain species (mullet, shrimp, blue crab) are more resistant to overharvest from fishing pressures because these species have a short life span and high reproductive success. In some cases (red drum and spo tted sea trout are examples, although data are lacking for the St. Johns River populations), restriction of harvest may be necessary. Allowing a year-class to reach spawning size
St. Jolms River Water Management District 87
B IOLOG ICAL RESOU RCES
Sport Fishing
before legal harvest has proven an effective management tool: most size restrictions in gamefish harvest are based upon this principle.
The quali ty of fisheries-dependent statistics (effort and catch) data should be improved. Without good data on fishing effort, reported landings have very little value for fish stock assessment. For example, in the crab industry, the number of crabs (or poundage) caught from a specific number of traps fished after a specified period of time in the water gives a much more precise measure of fishing pressure and harvest than merely the poundage bought by a wholesaler. Similarly, the poundage of shad caught in a specified length of a gillnet of specified mesh size fished for a known time interval offers much better probability of producing data that can provide management alternatives than simply gathering total landings tonnages.
The finfish populations of the LSJRB presently appear to be producing a relatively stable level of harvest. Most abundant data for gamefish come from FGFWFC resource monitoring studies based on trawt electrofishing, and blocknet samples. These datasets were not collected to produce trend analyses. The reduced sportfishing harvest that some fishermen perceive may reflect one of two pie scenarios: either we are seeing a smaller pie (= fish population), or we are seeing the same size pie cut into smaller portions (= increased fishing effort on a stable population). There are insufficient creel census data from sport fishermen to determine whether catch per unit of effort values have decreased, or whether the anecdotal experience of any particular individual who believes there are fewer fish reflects more fishing effort by more individuals.
Most sport fishermen and all commercial fishermen are now required to purchase licenses, and a dedicated federal surtax is charged for sportfishing equipment. Both recreational and commercial fishermen believe that user fees should be spent to maintain and improve the fisheries; this faction is increasingly active in demanding more responsive fisheries management.
St. Johns River Water Management District 88
Recomm endations
RECOMMENDATIONS
A review of the available literature on the biological resources of the LSJRB indicates a need for additional biological information that is basin-specific. The following activities, therefore, are recommended.
•
•
•
•
•
•
Measure necessary hydrographic, physical, and chemical parameters at several depths in the water column, from the surface to the bottom, in order to discover the presence of stratification and the po tential influences of both oceanic salinity and ground water ionic inputs.
Expand traditional water quality monitoring programs in order to evaluate sodium, potassium, and calcium chloride concentrations from areas where ground water enters the surface water system of the LSJRB from the Jacksonville area upstream to the southern boundary of the LSJRB and beyond.
Conduct chemical analysis and update the volume of ground water input to the St. Johns River in the upstream areas of the LSJRB.
Measure oxygen concentrations for 24-hour intervals at representative stations throughout the LSJRB, both in areas where the system is relatively unimpacted and at sites of high wastewater or nonpoint source loading.
Measure direct and indirect photosynthetic carbon fixation and oxygen production by the plant community. The single study of community oxygen production and respiration suggests that the lower St. Johns River. is a net consumer of oxygen. Long-term studies may modify this conclusion.
Measure light penetration, temperature, pH, salinity, and oxygen on at least a monthly basis. These parameters should be measured over the long term in order to understand
St. ]alms RiPer Water Management District
89
B IOLOG ICAL R ESOURCES
variations caused by prolonged drought or above-normal rainfall conditions and to understand plankton and submerged aquatic plant photosynthesis relative to specific storm rainfall or wind-driven effects. For studies of plankton or submerged aquatic plant photosynthesis, a continuous monitoring system for important parameters (light, pH, temperature, salinity, oxygen) will be required.
• Evaluate light penetration by direct submarine photometer measurements rather than by Secchi disk readings, with vertical light profiles recorded coincident with chemical and physical water sampling.
• Refine water color determination to reduce or eliminate technician subjectivity and to evaluate variations within the spectral transmissivity found in blackwater systems.
• Conduct a study of the population density and bioenergetics of the saltmarsh communities in the LSJRB. A study based on principles already developed for Georgia, South Carolina, and other Florida marshes could produce sufficient data to permit evaluation of the role these salt marshes play in fish, mollusc, and wildlife populations.
• Map the distribution and density of submerged aquatic plant communities in the LSJRB to better understand these important primary producers and to provide a baseline upon which potential future change in these areas can be evaluated.
• Conduct experiments on the physiological adaptations of submerged plants to water color, suspended solids, salinity, and nutrient conditions present in the LSJRB; on the contribution of submerged plants to primary production through photosynthesis; and on the role of the submerged plant community as a nursery habitat for fish and invertebrates.
St. Johns River Water Managemeut District
90
•
•
•
Recommendations
Monitor available silicate concentrations to determine the role of this nutrient. Experimentally determine how nutrients are responsible for limiting phytoplankton community dynamics.
Monitor variations in phytoplankton species abundance and concentrations whenever routine water quality is monitored.
Conduct phytoplankton studies throughout the LSJRB, sampling at least at monthly intervals. These studies need to be long term in order to evaluate the plankton population over the range of freshwater flows the river system experiences.
• Document by-catch, benthic community, and inshore versus offshore harvest impacts in the shrimp fishery of the northeast Florida region.
• Survey the biological resources available in dredge spoil islands and nearby open water habitats.
• Restore mollusc populations extirpated by dredging projects.
• Produce a series of trend analyses on finfish populations in the LSJRB using existing FGFWFC data.
• Develop fisheries-independent research /monitoring projects for the St. Johns River.
• Develop trip-ticket systems of evaluating harvest. Monitoring wholesale buyers alone does not accurately evaluate this industry. All state agencies should undertake this activity.
• Develop fishing effort data specific to the particular species harvested. All state agencies that manage species or areas in the LSJRB should undertake this activity.
St. Johns River Water Management District 91
B IOLOG ICAL RESOURCES
•
•
•
•
Continue to measure recreational fishing effort through creel census and expand the areas from which data are collected.
Study the economic impacts of fishing (both commercial and recreational) in this basin to update the generic fisheries economic multipliers developed for other areas of Florida.
Model the hydrographic structure of the river system .
Field-verify and plot the variety of wind, rainfall, and tidal cycle conditions present in the LSJRB. The complexities of the wind, tide, and ground water-rainwater runoff may prevent a pure model from attaining predictive accuracy.
St. Johns River Water Management District
92
References
REFERENCES
Adamus, C., D. Arnold, B. Poole, and J. Royal. 1987. Comprehensive shellfish harvesting area survey, Duval County, Florida. Shellfish Environmental Assessment Section. Tallahassee, Fla.: Florida Dept. of Natural Resources.
Alt, D. 1968. Pattern of post-Miocene eustatic fluctuation of sea level. Paleogeography Paleoclimatology Paleoecology 5:87-97.
Alt, D., and H.K. Brooks. 1965. Age of Florida marine terraces. J. Geology 73:406-411.
Atlantis Scientific. 1976. Environmental impact assessment, Water quality analysis, St. Johns River (Florida). Report NCWQ 75/81. Washington, D.C.: National Commission on Water Quality.
Bailey, R.M., and C.L. Hubbs. 1949. The black basses (Micropterus) of Florida with description of a new species. Occas. Pap. Mus. Zool. Univ. Mich. 516:1--40.
Banks, L. 1987. (unpublished ms) Lower St. fohns River survey study plan, FY '87 & FY '88. Florida Dept. of Environmental Regulation, Northeast District, Jacksonville, Fla.
Bartram, W. 1791 . Travels through North & South Carolina, Georgia, east and west Florida. Unabridged edition. Ed. by Mark Van Doren, Macy-Masius. New York: Dover Publications.
Bass, D.G. 1 990. Monitoring Florida's riverine fish communities. Quart. Jour. Fla. Acad. Sci. 53(1 ): 1-10.
Beeler, I.E. , and T .J. O'Shea. 1988. Distribution and mortality of the West Indian manatee (Trichechus manatus) in the southeastern United States: A compilation and review of recent information.
St. Johns River Water Management District 93
BIOLOG ICAL RESOU RCES
Vol. 1: The Atlantic Coast. Report 88-09. Gainesville� Fla.: National Ecology Research Center.
Bell, F.W. 1979. Recreational versus commercial fishing in Florida: An economic impact analysis 1 979. Policy Sciences Program. Tallahassee, F1a.: Florida State Univ.
Bell, F.W., P.E. Sorenson, and V.R. Leeworthy. 1982. The economic impact and valuation of saltwater recreational fisheries in Florida. Report 47. Gainesville, Fla.: Florida Sea Grant College.
Berner, L. 1955. The southeastern species of Baetisca (Ephemeroptera: Baetiscidae). Quar. Jour. Fla. Acad. Sci. 18:1-1 9.
Bergman, M.J. 1992. Volume 2 of the Lower St. Johns River Basin reconnaissance: Surface water hydrology. Technical Publication SJ92-1 . Palatka, Fla. : St. Johns River Water Management District.
Bowman, R.D. n.d. (unpublished report) Diurnal metabolism in the St. Johns River, Florida, a blackwater estuary. Univ. N. Florida, Jacksonville, Fla.
Brody, R.W. 1990a. (unpublished ms) Economic impact analysis of commercial and recreational fisheries, lower St. Johns River. St. Johns River Water Management District, Palatka, Fla.
--. 1990b. (unpublished ms) Status of habitat and populations of Procambarus pictus in the North Fork of Black Creek. St. Johns River Water Management District, Palatka, Fla .
Brody, R.W., and J.D. Schell. 1990. (unpublished) St. Johns River Index of Biological In tegrity pilot project: scope of work. St. Johns River Water Management District, Palatka, Fla.
Burgess, G.H., and R. Franz. 1978. Zoogeography of aquatic fauna of the St. Johns River system with comments on
St. Johns River Water Management District 94
References
adjacent peninsular faunas. Amer. Midland Naturalist 100(1 ) :1 60-170.
Burgess, G.H., C.R. Gilbert, V. Guillory, and D.C. Taphom. 1977. Distributional notes on some north Florida freshwater fishes . Rep. Invest. No. 35. Tallahssee, Fla . : Florida Geological Survey.
Carr, A. 1937. A key to the fresh-water fishes of Florida. Proc. Fla. Acad. Sci. 1 :72-86.
---. 1940. A contribution to the herpetology of Florida. Univ. Fla. Pub., Bioi . Sci. Ser. 3(1 ) :1-1 18.
Cato, J.C., and F.J. Prochaska. 1980. Economic impact estimates for Florida's commercial fisheries: 1 978. Food and Resource Economics Dept., Institute for Food and Agricultural Sciences. Gainesville, Fla. : Univ. Fla.
Cherfas, J. 1990. The fringe of the ocean-under siege from the land. Science 24: 163-1 65.
Clench, W.J., and R.D. Turner. 1956. Freshwater mollusks of Alabama, Georgia and Florida from the Escambia to the Suwannee River. Bull. Fla. State. Mus., Bioi. Ser. 1 :97-239.
CSA. 1988. A final report for St. Johns River ichthyofaunal survey. Jupiter, Fla. : Continental Shelf Associates.
Cooke, C.W. 1939. Scenery of Florida interpreted by a geologist. Geol. Bull. No. 17, Tallahassee, Fla.
1945. Geology of Florida. Geol. Bull. No. 29. Tallahassee, Fla.
Cooke, S.W., and S. Mossom. 1925. Geology of Florida. 20th Annual Report, Florida State Geological Survey, Tallahassee, Fla .
St. Johns River Water Management District 95
BIOLOG I CAL RESOURCES
Cowardin, L.M., V. Carter, F.C. Golet, and E.T. LaRoe. 1979. Classification of wetlands and deepwater habitats of the United States. Washington, D.C.: U.S. Fish and Wildlife Service.
Crawford, R.W. 1956. A study of the distribution and taxonomy of the percid Percina nigrofasciata (Agassiz). Tulane Stud. Zool. 4:3-55.
Crossman, E.J. 1966. A taxonomic study of Esox americanus and its subspecies in eastern North America. Copeia 1-20.
Dames and Moore. 1978. Site certification application and environmental analysis, Seminole Plant units No. 1 & No. 2. Vol. 3, Appendices. Appendix B: Aquatic Ecology. Tallahassee, Fla.
Daubenmire, R. 1990. The Magnolia grandiflora-Quercus virginiana forest of Florida. Amer. Midland Naturalist 123(2):331-347.
Davis, J.H. 1967. General map of natural vegetation of Florida. Agric. Exper. Stations, Institute for Food and Agricultural Sciences. Gainesville, Fla.: Univ. Fla.
Dawson, E.Y. 1966. Marine botany: An introduction. New York: Holt, Rinehart and Winston, Inc.
DeMort, C. 1984. Ecological assessment of the salt marsh. In Water quality assessment in the Jacksonville port area with analysis and plan for the estuarine marsh system, 55-64. Planning Div. Jacksonville, Fla.: City of Jacksonville.
DeMort, C., and R.D. Bowman. 1985. Seasonal cycles of phytoplankton and total chlorophyll of the lower St. Johns River estuary, Florida. Florida Scientist 48(2):96-107.
DeSylva, D.P. 1954. The live bait shrimp fishery of the northeast coast of Florida. Florida St. Bd. Conserv., Tech. Ser. 1 1 :1-35.
St. Johns River Water Management District 96
References
Dressler, R.L., D.W. Hall, K.D. Perkins, and N.H. Williams. 1987. Identification manual for wetland plant species of Florida. Institute for Food and Agricultural Sciences. Gainesville, Fla.: Univ. Fla.
Duncan, W.H., and M.D. Duncan. 1988. Trees of the southeastern United States. Athens, Ga.: Univ. Ga. Press.
Durako, M.J., M.D. Murphy, and K.D. Haddad. 1987. Coastal habitats and fisheries of N.E. Florida-issues and impacts. In Proceedings of fish habitat symposium: Growth impacts on coastal N.E. Florida and Georgia. C.L. DeMort and A.Q. White, eds. Report No. 81. Gainesville, Fla. : Florida Sea Grant College.
---. 1988. Assessment of fisheries habitat: Northeast Florida. Bureau of Marine Research, Florida Marine Research Publication No. 45. St. Petersburg, Fla. : Florida Dept. Nat. Resources.
EPA. 1989. Rapid bioassessment protocols for use in streams and rivers: Benthic macroinvertebrates and fish. EPA / 444/4-89-001 Office of Water. Washington, D.C.: U.S. Environmental Protection Agency.
Evermann, B.W., and W.C. Kendall. 1900. Check-list of the fishes of Florida. Washington, D.C.: U.S. Comm. Fish and Fisheries .
Florida Agricultural Statistics Service. 1990. Aquaculture: Florida agriculture. Orlando, Fla.
Florida Aquaculture Association. 1990. Florida Aquaculture Association newsletter. March issue, 15-1 6. Tallahassee, Fla.
Florida Committee on Rare and Endangered Plants and Animals. 1978---81 . Rare and endangered biota of Florida. v.1-mammals; v.2-birds; v.3-amphibians; v.4-fishes; v.S-plants; v.6-invertebrates. Gainesville, Fla. : Univ. Presses of Florida.
St. Johns River Water Management District
97
B IOLOGICAL RESOUR CES
FDACS. 1990. Florida aquaculture information directory. Aquaculture Program, Division of Marketing. Tallahassee, Fla.: Florida Department of Agriculture and Consumer Services.
FDNR. 1991 . Annual landings summary explanatory notes. Florida Marine Research Institute. St. Petersburg, Fla.: Florida Dept. of Natural Resources.
FGFWFC. 1977. 1976-77 Annual progress report for research project F-33-1, St. Johns fisheries resources. Melbourne, Fla. : Florida Game and Fresh Water Fish Commission.
---. 1978. 1 977-78 An nual progress report for research project F-33-2, St. Johns fisheries resources. Melbourne, Fla.: Florida Game and Fresh Water Fish Commission.
1979. 1978-79 Annual progress report for research project F-33-3, St. Johns fisheries resources. Melbourne, Fla.: Florida Game and Fresh Water Fish Commission.
---. 1980. 1 979-80 Annual progress report for research project F-33-4, St. Johns fisheries resources. Melbourne, Fla.: Florida Game and Fresh Water Fish Commission.
---. 1981 . Completion report for investigations project F-33, St . Johns River fisheries resources. Study I: Ecological aspects of the fishery. Melbourne, Fla.: Florida Game and Fresh Water Fish Commission.
---. 1984. Final Report for Investigations Project F-33: Study III: Relationships of Fish Populations to Habitat Types in the LOVJer St. Johns River. Melbourne, Fla.: Florida Game and Fresh Water Fish Commission.
FMRL 1989. Florida's fisheries independent monitoring program annual report. St. Petersburg, Fla.: Florida Marine Resource Institute.
St. Johns River Water Management District 98
References
Florida Natural Areas Inventory. 1990. Guide to the Natural Communities of Florida. Fla. Nat. Areas Invent. and Fla. Dept. Nat. Resources, Tallahassee, Fla.
Franz, R., and L.M. Franz. 1979. Distribution, habitat preference and status of populations of the Black Creek crayfish Procambarus (Ortmannicus) pictus (Decapoda: Cambaridae). Fla. Scientist 42(1) : 13-17.
Franz, R., and D.S. Lee. 1982. Distribution and evolution of Florida's troglobitic crayfishes. Bull. Fla. St. Mus., B ioi. Sci. 28(3):53-78.
Gilbert, C.R. 1989. (unpublished ms) History of ichthyology of Florida. In Freshwater fishes of Florida, C.R. Gilbert and J. Williams (unpublished book). Gainesville, Fla.
Gilbert, C.R., and R.M. Bailey. 1972. Systematics and zoogeography of the American cyprinid fish Notropis (Opsopoedus) emiliae. Occas . Pap. Mus. Zool. Un iv . Mich. 664:1-35.
Gosselink, J .C., E.P. Odurn, and R.M. Pope. 1 971 . The value of the tidal marsh. Center for Wetland Resources, Pub. No. LSU-SG-74-03. Baton Rouge, La.: Louisiana State Univ.
Gunter, G. 1942. A list of fishes from the mainland of North and Middle America recorded from both freshwater and saltwater. Amer. Midland. Naturalist 28:305-326.
Hale, M.M., J.E. Crumpton, and D.J. Renfro. 1982. Florida Game and Fresh Water Fish Commission 1 981-82 commercial fisheries investigations report . Eustis, Fla. : Florida Game and Fresh Water Fish Commission.
---. 1983. Florida Game and Fresh Water Fish Commission 1982-83 commercial fisheries investigations report. Eustis, Fla.: Florida Game and Fresh Water Fish Commission.
St. Joh11s River Water Management District
99
B IOLOG ICAL R ESOU RCES
---. 1984. Florida Game and Fresh Water Fish Commission 1983-84 commercial fisheries investigations report. Eustis, Fla.: Florida Game and Fresh Water Fish Commission.
---. 1985. Florida Game and Fresh Water Fish Commission 1984-85 commercial fisheries investigations report. Eustis, Fla.: Florida Game and Fresh Water Fish Commission.
---. 1986. Florida Game and Fresh Water Fish Commission 1 985-86 commercial fisheries investigations report. Eustis, Fla. : Florida Game and Fresh Water Fish Commission.
---. 1987. Florida Game and Fresh Water Fish Commission 1 986-87 commercial fisheries investigations report. Eustis, Fla.: Florida G ame and Fresh Water Fish Commission.
---. 1988. Florida Game and Fresh Water Fish Commission 1987-88 commercial fisheries investigations report. Eustis, Fla. : Florida Game and Fresh Water Fish Commission.
Hand, J., and M. Paulic. 1 992. 1 992 Florida water quality assessmen t 305(b) technical appendix. Bureau of Surface Water Management. Tallahassee, Fla. : Florida Department of Environmental Regulation.
Healey, F.P. 1973. Inorganic nutrient uptake and deficiency in algae. Crit. Rev. Microbial. 43:69-1 13.
Hecky, R.E., and P. Kilham. 1988. Nutrient limitation of phytoplankton in freshwater and marine environments: A review of recent evidence on the effects of enrichment. Limnol. Oceanog. 33(4), part 2:796-822.
Highton, R. 1956. Systematics and variation of the endemic Florida snake genus Stilosoma. Bull. Fla . St. Mus. 1 :73-96.
Hobbs, H.H. 1940. Seven new crayfishes of the genus Cambarus from Florida, 'With notes on other species. Proc. U.S. Nat. Mus. 83:387-423.
St. Johns River Water Manngement District
1 00
References
---. 1942. A generic revision of the crayfishes of the subfamily Cambarinae (Decapoda: Astacidae) with the description of a new genus and species. Amer. Midland Naturalist 28:334-357.
---. 1958. The evolutionary history of the pictus group of the crayfish genus Procambarus. Quart. ]our. Florida Acad. Sci. 34(2):11 4-1 24.
Hobbs, H.H., H.H. Hobbs III, and M.A. Daniel. 1977. A review of the troglobitic decapod crustaceans of the Americas. Smithsonian Contrib. Zool. No. 244.
Hubbell, T.H. 1954. Relationships and distribution of Mycotrupes. In The burrowing beetles of the genus Mycotrupes, p. 39-51, eds. A.L. Olson et al . Misc. Publ. Mus. Zool. 84:1-59. Univ. Mich.
Hubbs, C.L., and E.C. Raney. 1951 . Status, subspecies and variation of Notropis cummingsae, a cyprinid fish of the southeastern United States. Occas. Pap. Mus. Zool. Univ. Mich. 235:1-25.
Iverson, J.B. 1977. Geographic variation in the musk turtle Sternotherus minor. Copeia 502-517.
Jackson, J.F. 1973. Distribution and population phenetics of the Florida scrub lizard, Sceloporus woodi. Copeia 746-761 .
Johnson, R.I. 1972. The Unionidae (Mollusca: Bivalvia) of peninsular Florida. Bull. Fla. St. Mus. 16:181-249.
---. 1973. Distribution of the Hydrobiidae, a family of fresh and brackish water gastropods, in peninsular Florida. Occas. Pap. Mollusks Mus. Camp. Zool. Harv. Univ. 3:281-303.
Joyce, E.A. 1965. The Commercial shrimps of the northeast coast of Florida. Professional Papers Series No. 6. St. Petersburg, Fla.: Florida Board of Conservation Marine Laboratory.
St. Johns River Water Management District
1 01
BIOLOGICAL RESOU RCES
Karr, J.R. 1981 . Assessment of biotic integrity using fish communities. Fisheries 6(6):21-27.
Keefe, C.W. 1972. Marsh production: A summary of the literature. Publ. Inst. Mar. Sci., Univ. Texas 16 :163-181.
Kirk, J.T.O. 1988. Optical water quality-what does it mean and how should we measure it? J. Water Pollution Control 60(2): 194-1 97.
Koenings, J.P., and J.A. Edmundson. 1991 . Secchi disk and photometer estimates of light regimes in Alaskan lakes: Effects of yellow color and turbidity. Limnol. Oceanog. 36(1 ) :91-105.
Koenings, J.P., J.A. Edmundson, G.B. Kyle, and J.M. Edmundson. 1987. Limnology field and laboratory manual: Methods for assessing aquatic production. Rep. Ser. 71 . FRED Div. ____ _, Alaska: Department of Fish Game.
Kurz, H., and K. Wagner. 1957. Tidal marshes of the Gulf and Atlantic coasts of northern Florida and Charleston, South Carolina. Florida State University Studies, No. 24. Tallahassee, F1a.: Fla. State Univ.
Lin, D.V., and D. Te Strake. 1988. Studies of pathogens causing ulcerative disease syndrome (UDS) in fish in the St. Johns River. FDER report on contract SP 129. Tallahassee, Fla. : Florida Department of Environmental Regulation.
Lindner, M.J., and W.W. Anderson. 1956. Growth, migrations, spawning and size distribution of shrimp Penaeus setiferus. U. S. Fish and Wildl. Ser., Fisheries Bull. 106:55--645.
Mattoon, W.R. 1956. Common forest trees of Florida. 6th edition. Tallahassee, F1a.: Florida Board of Forestry.
McEvoy, T.J. 1990. (unpublished ms) An introduction to the ecology and management of Florida's hardwood forests. Univ.
St. Johns River Water Management District 102
.....
References
Fla., Institute for Food and Agricultural Sciences, Gainesville, Fla.
McLane, W.M. 1955. The fishes of the St. johns River system. Ph.D. dissertation, Univ. Fla., Gainesville, Fla.
McPherson, B.F., and R.L. Miller. 1987. The vertical attenuation of light in Charlotte Harbor, a shallow, subtropical estuary, south-western Florida. Estuarine, Coastal and Shelf Science 25:721-737.
Milan, J.W., and R.W. Welsh. 1989. An economic analysis of sport fishing and the effects of hydrilla management in Lake County, Florida. Food and Resource Economics Department, Institute for Food and Agricultural Sciences, Economics Report No. 1 1 8. Gainesville, Fla.: Univ. Fla.
Milan, J.W., W.D. Mulkey, and M.J. Ellerbrock. 1982. Regional impact analysis and recreation multipliers. Review of Regional Studies 12:1 1-21.
Milan, J.W., J. Yingling, and J.E. Reynolds. 1986. An economic analysis of the benefits of aquatic weed control in north central Florida. Food and Resource Economics Department, Institute of Food and Agricultural Sciences, Economics Report No. 1 1 3. Gainesville, Fla. : Univ. Fla.
Moody, H.L. 1970. Factors in the decline of the fishery of the St. johns River, Florida. St. Johns River Hearing, 1 1 February 1970, presented to the Dept. of Air and Water Pollution Control by the Fla. Game and Fresh Water Fish Commission.
Mount, R.H. 1965. Variation and systematics of the scincoid lizard Eumeces egregius (Baird). Bull. Fla. St. Mus. 9:183-213.
Murphy, J., and J. Johnson. 1988. Hallowe 's [sic] Cove: An evaluation of the ecosystem. Senior Seminar Report. Jacksonville, Fla.: Univ. North Fla.
St. Johns River Water Management District
1 03
B IOLOG ICAL RESOU RCES
Myers, G.S. 1938. Fresh-water fishes and East Indian zoogeography. Smithson . Inst. Ann. Rep. 339-364.
---. 1951 . Fresh-water fishes and East Indian zoogeography. Stanford Ichthyol. Bull. 4:1 1-21 .
Nash, G.V. 1895. Notes on some Aorida plants. Bull. Torrey Botan. Club 22:141-161 .
Neill, W.T. 1957. Historical biogeography of present-day Aorida. Bull. Fla. St. Mus. 2:175-220.
Nesbitt, S.A. 1990. Annual performance report: Statewide wildlife research. Tallahassee, Fla. : Florida Game and Fresh Water Fish Commission.
Odum, E.P. 1971 . Fundamentals of ecology. Third Edition. Philadelphia, Pa.: W.B. Saunders Co.
Odum, H.T. 1953. Factors controlling marine invasion into Florida fresh waters. Bull. Mar. Sci. 2(2:)134--156.
Parsons, T.R., K. Stevens, and J.D.H. Strickland. 1961 . On the chemical composition of eleven species of marine phytoplankters. J. Fish. Res. Bd. Canada 18:1001-101 6.
Patton, T.H. 1969. An Oligocene land vertebrate fauna from Florida. J. Palemztol. 43:543-546.
Pearson, J.C. 1939. The early life histories of some American Penaeidae, chiefly the commercial shrimp, Penaeus setiferus (Linn.). Bull. U.S. Bur. Fish . XLIX(3):1-73.
Pierce, E.L. 1947. An annual cycle of the plankton and chemistry of four aquatic habitats in northern Florida. Univ. Fla. Studies, Biol. Sci. Ser. IV(3).
St. fohns River Water Management District
1 04
References
Pierce; R.J . 1977. Wetlands plants of the eastern United States. NADP 200-1-1, North Atlantic Division. New York: U.S. Army Corps of Engineers.
Pirkle, E.C., W.A. Pirkle, and W.H. Yoho. 1974. The Green Cove Springs and Boulougne heavy-mineral sand deposits of Florida. Econ. Geol. 69: 1 1 29-1 137.
Redecke, H.C. 1922. Hydrobiologie van Nederland de Zoete Wateren. D. Amsterdam: De Boer.
Rehm, A.E.; F.C. Tone, and J.B. Kirkwood. 1 975. Final report on biological assessment of water and marsh areas of the St. Johns River. Battelle Columbus Laboratories, Rpt. No. 14591 . Duxbury, Mass. : Wm. F. Clapp Lab., Inc.
Reynolds, C.S. 1984. Ecology of freshwater phytoplankton . New York: Cambridge.
Ribaut, J. 1563. The whole and true discouerye of terra Florida (facsimile reprint of the London edition of 1 563; 1927). De Land, Fla. : Fla. St. Histor. Soc.
Robertson, J.S. 1976. Latest Pliocene land mammals from Haile XV A, Alachua County, Florida. B ull. Fla. St. Mus. 20:11 1-1 86.
Ross, L.T., and D.A. Jones . 1979. Biological aspects of water quality in Florida, Part II: Nassau-St. Marys, St. Johns, and east coast drainage basins. Dept. Environ. Reg. Tech. Series, 4(3).
Schell, J.D., and R.W. Brody. 1990 (unpublished). Survey of toxic chemicals present in the local fish populations of the lower St. Johns River: Scope of work. St. Johns River Water Management District, Palatka, Fla.
Soil Conservation Service. 1978. 26 Ecological commu nities of Florida. Soil Conservation Service. Gainesville, Fla. : U.S. Dept. of Agriculture.
St. Johns River Water Management District 105
B IOLOG ICAL RESOURCES
Steidinger, K. 1989. Florida Marine Research Institute research plan 1 989-1994. Tallahassee, Fla.: Fla. Dept. Nat. Resources.
Stewart, V.N. 1981 . Sea-stats no. 7, Clams. St. Petersburg, Fla.: Florida Dept. of Nat. Resources.
Tagatz, M.E. 1965. The fishery for blue crabs in the St. johns River, Florida, with spec ial reference to fluctuations in yield between 1961 and 1 962 . Spec. Sci. Rpt. Fish. No. 501 . Washington, D.C.: U.S. Fish and Wildl. Serv.
1968a. Biology of the blue crab Callinectes sapidus Rathbun, in the St. Johns River, Florida. U.S. Fish and Wildl. Serv. Fishery Bull. 67(1).
---. 1968b. Growth of juvenile blue crabs, Callinectes sapidus Rathbun, in the St. Johns River, Florida. U.S. Fish and Wildl. Serv. Fishery Bull. 67(2).
---. 1968c. Fishes of the St. Johns River, Florida. Quart. Jour. Florida Acad. Sci. 30(1 ).
Tarver, D.P., J.A. Rodgers, M.J. Mahler, and R.L. Lazor. 1978. Aquatic and wetland plants of Florida. Tallahassee, Fla.: Florida Dept. Nat. Resources.
Teal, J.M. 1962. Energy flow in the salt marsh ecosystem of Georgia. Ecologtj 43:614.
Teat J., and M. TeaL 1969. Life and death of the saltmarsh. New York: Little, Brown and Co.
Telford, S.R. 1959. A study of the sand skink Neoseps reynoldsi Stejneger. Copeia 110-119.
---. 1962. New locality record for the sand skink (Neopsis reynoldsi) in central Florida, with comments on the habitat. Quar. Jour. Fla. Acad. Sci. 25:76-77.
St. Johns River Water Manageme11t District 106

References
---. 1966. Variation among the southeastern crowned snakes, genus Tantilla. Bull. Fla. St. Mus. 1 0:261-265.
Thompson, B.A., and G .R. Fitzhugh. 1985. A use attainability study: An evaluation of fish and macroinvertebrate assemblages of the Lower Calcasieu River, Louisiana. Center for Wetland Resources, Rpt. No. LSU-CFI-85-29. Baton Rouge, La.: Louisiana St. Univ. Coastal Fisheries Inst.
Thomps on, F.G. 1968. The aquatic snails of the family Hydrobiidae of peninsular Florida. Gainesville, Fla. : Univ. Fla. Press.
---. 1969. Some hydrobiid snails from Georgia and Florida. Quar. Jour. Fla. Acad . Sci. 32:241-265.
Toth, D.J. 1993. Volume 1 of the Lower St. Johns River Basin reconnaissance: Hydrogeology. Technical Publication 5}93-7. Palatka, Fla .: St. Johns River Water Management District.
Twilley, R.R., and J.W. Barko. 1990. The growth of submerged macrophytes under experimental salinity and light conditions. Estuaries 13(3):31 1-321 .
U.S. Army Corp of Engineers. 1973 . Environmental impact statement: Aquatic plant control program for the State of Florida. Jacksonville, Fla.
Valade, J.A. 1989. Assessment of habitat protection needs for West Indian manatees on the east coast of Florida. Washington, D.C.: Marine Mammal Commission.
Walburg, C.H. 1960. Abundance and life history of shad, St. Johns River, Florida. U.S. Fish and Wildt. Serv. Fishery Bull. 60:486-501 .
Watts, W.A. 1971 . Postglacial and interglacial vegetation history of sou thern Georgia and central Florida. Ecology 51 (1 ):1 7-33.
St. Jahns River Water Management District 1 07

B I OLOG ICAL RESOU RCES
Webb, S.D. 1974. Chronology of Florida Pleistocene mammals. In Pleistocene mammals of Florida, ed. S.D. Webb, p. 4-31. Gainesville, Fla. : Univ. Fla. Press.
Webb, S.D., and N. Tesseman. 1968. A pliocene vertebrate fauna from Manatee County, Florida. Amer. Jour. Sci. 266:777-81 1 .
Wetland Training Institute, Inc. 1989. Field guide for wetland delineation United Federal Method. WTI 89-1 . Poolsville, Md.
Williams, R.O. , and G.E. Bruger. 1972. Investigations on American shad in the St. Johns River. Technical Series No. 66. St. Petersburg, Fla.: Florida Dept. of Natural Resources.
Wood, D. 1990. Official lists of endangered and potentially endangered fauna and flora in Florida. Tallahassee, Fla. : Florida Game and Fresh Water Fish Commission.
Woodruff, R.E. 1973. The scarab beetles of Florida, Vol. 8. In Arthropods of Florida and neighboring land areas. Div. Plant Industries. Tallahassee, Fla.: Fla. Dept. Agric. Consum. Serv.
Yerger, R.W., and K. Relyea. 1968. The flat-headed bullheads (Pisces: Ictaluridae) of the southeastern United States and a new species of lctalurus from the Gulf Coast. Copeia 361-382.
Zug, G.R. 1968. Geographic variation in Rhineura floridana (Reptilia: Amphisbaenidae). Bull. Fla. St. Mus. 12:185-212.
St. Johns River Water Management District 1 08