Resonator sensor technique for medical use - diva-portal.org139935/FULLTEXT01.pdf · nerve head and...
68
UMEÅ UNIVERSITY MEDICAL DISSERTATIONS New series No 801-ISSN 0346-6612 ISBN 91-7305-269-8 From the Department of Radiation Sciences, Umeå University, Sweden, Department of Biomedical Engineering and Informatics, Umeå University Hospital, Sweden, and Department of Applied Physics and Electronics, Umeå University, Sweden Resonator sensor technique for medical use An intraocular pressure measurement system by Anders Eklund Umeå University 2002
Transcript of Resonator sensor technique for medical use - diva-portal.org139935/FULLTEXT01.pdf · nerve head and...

UMEÅ UNIVERSITY MEDICAL DISSERTATIONS
New series No 801-ISSN 0346-6612 ISBN 91-7305-269-8
From the
Department of Radiation Sciences, Umeå University, Sweden,Department of Biomedical Engineering and Informatics,
Umeå University Hospital, Sweden, andDepartment of Applied Physics and Electronics,
Umeå University, Sweden
Resonator sensor technique for medical use
An intraocular pressure measurement system
by
Anders Eklund
Umeå University2002

2
Anders Eklund 2002
ISBN 91-7305-269-8
Printed by Grafiska enheten,
Västerbottens Läns Landsting,
Umeå, Sweden, 2001

3
”Mistakes are the friends of success.Deny them and they become the enemy.”Dartwill Aquila
To Maria, Anton and Sanna

4

5
AbstractIn the work of this doctoral dissertation a new resonator sensor technique,
first presented in 1989, has been further developed and evaluated with focuson technical characteristics and applications within the medical field.
In a first part a catheter-type tactile sensor using the resonator sensortechnique was evaluated in a silicone model and applied to human prostate invitro. The main finding was that different histological compositions ofprostate tissue correlated with the frequency shift, ∆fS, of the resonator sensorand that the common property was the hardness of the tissue. The resultsindicated that hardness of the prostate tissue, and maybe hardness of humantissue in general, can be expressed according to a cone penetration standard(DIN ISO 2137) and that the hardness can be measured with this tactile sensorsystem. The tissue hardness application for the resonator sensor technique hasto be further developed and evaluated in a larger study. The study alsoproduced results that has led to the basic understanding of the resonator sensorsystem. One important result was that ∆fS of the sensor system was related tothe contact area between sensor and sample. This indicated that the resonancesensor could be used for contact area measurement.
In a second part, containing three studies, the area-sensing capability fromthe first study was utilised in the development and evaluation of theapplanation resonator sensor (ARS) for measurement of intraocular pressure(IOP). For the purpose of evaluating IOP-tonometers, an in vitro pig-eyemodel was developed, and it was shown that a saline column connected to thevitreous chamber could be used successfully to induce variations in IOP.
A ARS sensor with a flat contact surface was applied onto the cornea withconstant force and ∆fS was measured. A mathematical model based on theImbert-Fick law and the assumption that ∆fS was linearly related to contactarea was proposed and verified with a convincing result. IOP measured withthe ARS correlated well (r=0.92, n=360) with the IOP elicited by a salinecolumn.
The ARS in a constant-force arrangement was evaluated on healthy humansubjects in vivo. The results verified the sensor principle but revealed a non-negligible source of error in off-centre positioning between the sensor andcornea. The sensor probe was redesigned and evaluated in the in vitro model.The new probe, with a spherical contact surface against the eye reduced thesensitivity to off-centre positioning. It was also shown that a ∆fS normalisationprocedure could reduce the between-eye differences.

6
The ARS method for IOP measurement was further developed usingcombined continuous force and area measurement during the dynamic phasewhen the sensor initially contacts the cornea. A force sensor was includedwith the resonator sensor in one probe. Evaluation was performed with the invitro pig-eye model. The hypothesis was that the IOP could be deduced fromthe differential change of force and area during that phase. The study showedgood accuracy and good reproducibility with a correlation of r=0.994 (n=414)between measured pressure in the vitreous chamber and IOP according to theARS. Measurement time was short, 77 ms after initial contact. Problems withinter-eye differences and low resolution at high pressures were reduced. TheARS method is the first to combine simultaneous, continuous sampling ofboth parameters included in the applanation principle. Consequently, there is apotential for reducing errors in the clinical IOP tonometry.

7
Original papersThis thesis is based on the following papers, which are referred to by their
Roman numerals in the text. Papers I and II are reprinted with permissionfrom the publishers.
I. ANDERS EKLUND, ANDERS BERGH AND OLOF LINDAHL (1999): ‘Acatheter tactile sensor for measuring hardness of soft tissue:measurement in a silicone model and in an in vitro human prostatemodel’, Medical and Biological, Engineering and Computing, 37, pp.618-624
II. ANDERS EKLUND, TOMAS BÄCKLUND AND OLOF LINDAHL (2000):‘A resonator sensor for measurement of intraocular pressure –evaluation in an in vitro pig-eye model’, Physiological Measurement,21, pp 355-367
III. ANDERS EKLUND, CHRISTINA LINDÉN, TOMAS BÄCKLUND, BRITTANDERSSON AND OLOF LINDAHL: ‘Evaluation of applanationresonator sensors for intraocular pressure measurement, results fromclinical and in vitro studies’, Submitted
IV. ANDERS EKLUND, PER HALLBERG, CHRISTINA LINDÉN, AND OLOFLINDAHL: ‘An applanation resonator sensor for measuringintraocular pressure using combined continuous force and areameasurement’, Submitted

8
List of abbreviations
ρ = Densityβ0, β1 = Coefficients in an ARS modelα = Acoustic resistance of an objectβ = Acoustic reactance of an object∆φSE = Change of phase shift over sensor element∆f = Frequency shift of a rod resonance topφFC = Phase shift over feedback circuit∆fS = Frequency shift for resonator sensor systemφSE = Phase shift over sensor elementω = Angular frequencyν = Poisson´s ratioA = Contact areaARS = Applanation resonator sensorCARS = Proportionality constant between frequency shift and areaCOffset = ConstantCTS = Catheter tip tactile sensorCx = Compliance related part of βE = Young´s modulusf = Frequencyf0 = Frequency of unloaded sensorf1 = Frequency of starting point for interval used in analysisf2 = Frequency of end point for interval used in analysisFC = Contact forceGAT = Goldmann applanation tonometryGPIB = General Purpose Interface BusIOP = Intraocular pressureIOPARS = IOP according to applanation resonator sensorIOPGAT = IOP according to Goldman applanation tonometerIOPSC = IOP according to saline columnIOPVC = IOP measured in vitreous chamberl = Length of a rodL = Indentation of the corneaL1 = Indentation at beginning of the interval used in the analysisL2 = Indentation at the end of the interval used in the analysisLp = Penetration depthmx = Mass related part of βn = Number of observationsNCT = Non-contact tonometersp = Probability valuePSA = Prostate specific antigenPZT = Lead zirconate titanate

9
r = Correlation coefficientr0 = Radius of catheterR2 = Degree of explanation of a modelStiffness = The ratio Fc/Lp for the sensor applied to an object (OMATA and
CONSTANTINOU, 1995)t = Time references to initial contactt1 = Starting time for interval used in analysist2 = End time for interval used in the analysisTcornea = Corneal thicknessV0 = Equivalent sound velocity in the sensor elementZ0 = Acoustic impedance of the sensor elementZx = Acoustic impedance of an object

10

11
Contents1 Introduction .................................................................. 13
2 Prostate hardness........................................................ 172.1 Anatomy of the human prostate ..................................... 172.2 Prostate cancer .............................................................. 17
3 Intraocular pressure .................................................... 193.1 Anatomy of the human eye ............................................ 193.2 Glaucoma....................................................................... 213.3 Intraocular pressure measurement methods ................. 21
4 Sensor theory ............................................................... 254.1 Resonator sensors in general ........................................ 254.2 Piezoelectricity ............................................................... 254.3 Resonator sensor principle ............................................ 274.4 Resonator sensors for diagnostic purposes................... 29
5 Aims of the study ......................................................... 31
6 Review of papers.......................................................... 336.1 Paper I............................................................................ 336.2 Paper II........................................................................... 336.3 Paper III.......................................................................... 336.4 Paper IV ......................................................................... 34
7 Material and methods .................................................. 357.1 Resonator sensor system .............................................. 357.2 Catheter tip sensor......................................................... 367.3 ARS sensors .................................................................. 367.4 In vitro experimental set-up............................................ 377.5 IOP clinical set-up .......................................................... 39
8 General results and discussion.................................. 418.1 A contact area measurement device.............................. 418.2 A hardness measurement device................................... 458.3 An intraocular pressure measurement system............... 48
9 General summary and conclusions ........................... 59
10 References.................................................................... 61
11 Acknowledgements ..................................................... 67
Papers I - IV

12

13
1 Introduction
Modern computer advancements open the door for new measuring andmonitoring methods with possibilities of extensive and complex input data.Research in the medical field is continuously expanding the knowledge ofhow different physiological variables relate to eachother and how they can beused for diagnostic purposes. A sensor is an essential part in a measurementsystem collecting data of a physiological variable. Sensors are thereforeplaying an increasingly important role in medical care. This dissertation dealswith a new sensor technique for medical use. The applications are focused onthe physiological variables of intraocular pressure (IOP) and tissue hardness.
Measurement of the IOP is a routine investigation in every eye department.The fluid system of the eye normally maintains an almost constant IOP atapproximately 16 mm Hg (LEYDHECKER et al., 1958). Continuous formation ofaqueous humour by the ciliary processes is balanced by the outflow throughthe trabecular meshwork and uveoscleral pathway. The IOP maintains the eyein a rigid shape and keeps a constant distance between cornea, lens and retina(GUYTON, 1991, TORTORA and GRABOWSKI, 1996), which is essential for theoptical properties of the eye. Glaucoma is an eye disease that may be definedas a progressive optic neuropathy with characteristic changes of the opticnerve head and visual field. The aetiology is not completely understood, butone of the major risk factors is elevated IOP (SOMMER, 1989), and alltreatment, this far, is focused on reduction of the IOP (LINDÉN, 1997). It istherefore important to have simple and reliable methods for measuring IOP,both for diagnostic purposes and for follow-up after treatment.
In the clinical setting measurement of IOP is performed in an indirect waywhere a force indents or flattens the cornea. The relationship between forceand indentation/contact area is used to estimate the internal pressure. TheGoldmann applanation tonometer (GOLDMANN, 1957) is currently the mostvalid and reliable method (CANTOR, 2000). Examples of other tonometers usedare Schiøtz indentation tonometer (FRIEDENWALD, 1937), Tono-Pen which is amicroprocessor-controlled, hand-held tonometer (MINCKLER et al., 1987) andnon-contact applanation tonometers (FORBES et al., 1974) which use an air pulseto flatten the cornea.
Two review papers (WHITACRE and STEIN, 1993, DOUGHTY and ZAMAN, 2000)address a number of sources of errors with the current tonometric methods.

14
For example, the optical principle of Goldmann applanation is sensitive toastigmatism and the Tono-Pen has been shown to overestimate at low and tounderestimate at high IOP (MIDELFART and WIGERS, 1994, WHITACRE and STEIN,1993, EISENBERG et al., 1998). Generally, there is a sensitivity to cornealthickness (DOUGHTY and ZAMAN, 2000, EHLERS et al., 1975). Therefore, furtherdevelopment and new methods in the area of clinical IOP measurement areneeded.
Tissue composition and consistency are often changed by disease. Forexample, malignant tumours are generally harder than the surrounding tissue,and this is the reason why tumours often can be detected by palpation. In thefemale, breast cancers are detected as harder regions imbedded in surroundingnormal gland. Suspicious areas in the breast can further be examined bymammography and biopsy. In the male, prostate cancer is often detected as afirm nodule in the prostate during rectal palpation. Prostate cancer is the mostcommon cancer in men in the European Union and the USA. Only in the US165,000 men are diagnosed with prostate cancer each year (US-DEPT-HHS-PUBL, 1993).
Prostate cancer is generally diagnosed by a high blood PSA (prostatespecific antigen) level, rectal palpation, and ultrasound examination of theprostate followed by histological examination of prostate biopsies. In manypatients with high PSA, palpation and ultrasound do not detect any tumourand biopsies are therefore taken at random (AARNINK et al., 1998, HODGE et al.,1989). Therefore, there is a need for improved, non-invasive methods to detectprostate tumours in a reliable and easy way.
In 1989 a tactile sensor based on vibration technology for measuringphysical properties such as stiffness or hardness of an object was presented(OMATA, 1989). The system is based on a ceramic piezoelectric element set inoscillation with an electronic feedback circuit (OMATA and TERUNUMA, 1992).When the element touches an object with a certain acoustic impedance theresonance frequency of the oscillating system changes. Preliminary resultsfrom measurements of living tissue by detecting the change in frequency havegiven promising results (OMATA and TERUNUMA, 1991, LINDAHL et al., 1998). Thetactile sensor technique has been evaluated both in a standardised siliconerubber model and in a rat testis model where it was compared with animpression method that measures interstitial pressure and water displacementin skin (LINDAHL and OMATA, 1995). It has also been evaluated for detection ofchanges in stiffness and elastic-related properties of the human skin (LINDAHL
et al., 1998). The results of these studies suggest that the sensor probe with the

15
measuring instrument can measure differences in stiffness of silicone and ispromising to provide information about the properties of skin stiffness andelasticity. Furthermore, a published study showed that lymph node stiffnessmeasured with the tactile sensor was a useful parameter for diagnosis ofmetastases in an in vitro setting (MIYAJI et al., 1997). Another study with acatheter type tactile sensor in an animal model indicated that directmeasurement of bladder stiffness may prove to be a useful tool in theevaluation of bladder and prostate biomechanics (WATANABE et al., 1997).
This dissertation investigated the theory and experimental resultsregarding frequency characteristics of the resonator sensor system describedabove, and how these characteristics are affected when the elements are set incontact with tissue of different kinds. A tissue hardness measurementapplication and an in vitro model for prostate tissue hardness measurementwere proposed and evaluated in Paper I. Within the scope of this dissertation anew application and a new design for the sensor system has been proposed.Under certain conditions the sensor has proven to be a very sensitive devicefor measuring area of contact between sensor and sample as shown in Paper I.That sensor property has been utilised in a new measurement method forintraocular pressure. For evaluation of IOP tonometry methods an in vitro pig-eye model was developed. Papers II, III and IV describe the development,evaluation and modelling of the Applanation Resonator Sensor (ARS) for IOPmeasurement.

16

17
2 Prostate hardness2.1 Anatomy of the human prostate
The prostate gland is a single, doughnut-shaped gland about the size of awalnut. It is inferior the urinary bladder and surrounds the prostatic urethra(Fig. 1) (TORTORA and GRABOWSKI, 1996, MOORE, 1992). The normal prostate ispartly glandular and partly fibromuscular. Secretion from the prostate glandenters the prostate urethra through many prostatic ducts. The secretion makesup about 25% of the semen and contributes to sperm motility and viability.
Figure 1. The prostate gland. Modified from Guyton (1991).
2.2 Prostate cancerProstate cancer is the most common cause of death from cancer in men in
the United States (TORTORA and GRABOWSKI, 1996). A blood test can measurethe level of prostate-specific antigen (PSA) in the blood. This substance is anenzyme produced only by prostate epithelial cells. The amount of PSAincreases with enlargement of the prostate gland and may indicate infection,benign enlargement, or prostate cancer. Tissue composition and consistencyare often changed by disease. For example, malignant tumours are generallyharder than the surrounding tissue. Examination of the prostate gland cantherefore be performed by a digital rectal exam, in which the physicianpalpates the gland through the rectum with a finger. Transrectalultrasonography, were a rectal ultrasound probe is used to image the prostate,is also used to detect tumours (TORTORA and GRABOWSKI, 1996). Theseinvestigations are followed by prostate biopsy. In many patients with high

18
PSA, palpation and ultrasound do not detect any tumour and biopsies aretherefore taken at random (AARNINK et al., 1998, HODGE et al., 1989). Therefore,there is a need for improved, non-invasive methods to detect prostate tumoursin a reliable and easy way. Maybe, a method for measuring tissue hardness inan objective way could be used to guide the physician when taking biopsies inareas suspicious for cancer. Treatment of prostate cancer involves surgery,radiation, hormonal therapy and chemotherapy.

19
3 Intraocular pressure3.1 Anatomy of the human eye
The adult eyeball is about 25 mm in diameter (TORTORA and GRABOWSKI,1996, MOORE, 1992). The wall of the eyeball can be divided into three layers, afibrous tunic, a vascular tunic and the retina, which is a nervous tunic (Fig. 2).The fibrous tunic is the superficial coat and consists of the anterior cornea andthe posterior sclera. The cornea is a nonvascular, transparent coat withsurfaces of squamos epithelium and a middle layer with collagen fibers andfibroblasts. The corneal thickness is approximately 0.53 mm (DOUGHTY andZAMAN, 2000). The sclera is the white of the eye, and is a coat of denseconnective tissue made up mostly of collagen fibers and fibroblasts. Thesclera covers the entire eyeball except the cornea, and it gives the shape of theeyeball and makes it rigid.
The vascular tunic, or uvea, is the middle layer of the wall and containschoroid, ciliary body and iris. The highly vascular choroid lines the innersurface of the sclera and provides nutrients to the retina. In the anteriorportion the choroid becomes the ciliary body. The ciliary body consists of aciliary muscle that alters the shape of the lens for focus and the ciliaryprocesses which contain blood capillaries that secrete a watery fluid calledaqueous humor. The iris is the coloured portion of the eyeball that regulatesthe amount of light entering into the eye through the pupil. The inner coat ofthe eyeball is the retina, which lines the inner three-quarters of the eyeball andis the beginning of the visual pathway. The retina is a thin delicate membranecomposed of two layers, a light sensitive neural layer and an outer pigmentcell layer. The optic disk (head) is the site where the optic nerve exits theeyeball.

20
Figure 2. The anathomy of the eye. Modified from Tortora and Grabowski(1996).
The interior of the eyeball is a space divided by the lens into two cavities,the anterior cavity, with the anterior and posterior chamber, and the vitreouschamber. The vitreous body is a jellylike substance that fills out the vitreouschamber. The substance contributes to prevent the eyeball from collapsing.
The anterior cavity is filled with aqueous humour that is continuallyfiltered from the ciliary processes and reabsorbed into the venous blood. It isthe balance between formation and reabsorption of the aqueous humour thatregulates the total volume and pressure of the intraocular fluid (GUYTON,1991). The formation rate is approximately 2-3 µl per minute and is almostentirely an active secretion. After formation the aqueous humour flows fromthe posterior chamber through the pupil and into the anterior chamber of theeye. Here the fluid exits the eye into the angle between the cornea and the irisand through the trabecular meshwork, finally entering into the canal of

21
Schlemm, which empties into the extraocular veins. A minor part of theaqueous humour leaves the eye through the uveoscleral pathway.
Normal intraocular pressure (IOP) is approximately 16 mm Hg(LEYDHECKER et al., 1958), and remains very constant in the normal eye,normally within about ± 2 mm Hg (GUYTON, 1991). The level of this pressureis determined by the formation rate and the resistance to outflow of aqueoushumour from the anterior chamber into the canal of Schlemm. The mainresistance is in the trabecular meshwork of, which only have minute openingsof 2 to 3 µm.
3.2 GlaucomaGlaucoma is an eye disease that may be defined as a progressive optic
neuropathy with characteristic changes of the optic nerve head and the visualfield (LINDÉN, 1997). The aetiology is not completely understood, but one ofthe major risk factors is elevated intraocular pressure (IOP). The relative riskfor glaucomatous optic nerve damage is shown to be 10 times higher forpatients whose IOP exceeded 23 mm Hg, compared to those with IOP below16 mm Hg (SOMMER, 1989). Open-angel glaucoma is a painless insidiousdisease. As long as the other eye is not affected, a person may experienceconsiderable retinal damage and visual loss before the condition is diagnosed(TORTORA and GRABOWSKI, 1996). The disease affects 5% of people over 65years (TORTORA and GRABOWSKI, 1996). All treatment, so far, is aimed atreducing IOP. The reduction if IOP is done by reducing the production ofaqueous humour or by increasing the outflow. Both pharmaceutical andsurgical methods are available. Therefore, for diagnostic purposes and forfollow-up after treatment, it is important to have simple and reliable methodsfor measuring the IOP. Today, tonometry is a standard procedure in allexaminations of the eye.
3.3 Intraocular pressure measurement methods3.3.1 History of tonometry
The first clinical applanation tonometers were introduced by WEBER (1867)and MAKLAKOFF (1885). The Maklakoff tonometer estimated the area of corneathat was flattened by a cylinder of known weight. IMBERT (1885) discussed theforces relevant to tonometry and gave a formula stating that the pressureexerted by a tonometer against the globe was equal to IOP plus the adhesionproduced by surface tension forces. FICK (1888) repeated the hypothesis that ifa small segment of a sphere was flattened the force flattening the sphere

22
corresponded to the pressure within the sphere. Shciøtz introduced hisindentation tonometer in 1906, which was then generally adopted as the mostuseful tonometer (FRIEDENWALD, 1937). In 1954 the more accurate Goldmannapplanation tonometer (GOLDMANN, 1957) was presented and it is still the mostpopular instrument for measurement of intraocular pressure (OTTAR, 1998).
3.3.2 Imbert-Ficks lawFor IOP measurement the applanation principle is generally described
through the Imbert-Fick law (WHITACRE and STEIN, 1993). It states that when aflat surface is pressed against a spherical surface of a container with a givenpressure, an equilibrium will be attained in which the force, FC, exertedagainst the spherical surface is balanced by the internal pressure, IOP, of thesphere exerted over the area of contact, A, between the sphere and flat surface.That is:
CF IOP A= ⋅ (1)
It is assumed that the sphere applanated by the flat surface is infinitelythin, perfectly elastic, perfectly flexible and that the only force acting againstit is the pressure of the applanated surface. It is further assumed that theapplanated area and subsequently the displaced volume is small in relation tothe total area and volume of the sphere.
3.3.3 Goldmann applanation tonometerThe Goldman applanation tonometer (GAT) is considered the most valid
and reliable method for measuring the IOP (CANTOR, 2000). In short the set-upcontains an optical head with a special prism. This head is mounted on a forcebalance, which in turn is mounted on a biomicroscope. The flat contactsurface of the optical head is pressed against the cornea. The operator adjuststhe contact force with the force balance. A predefined contact area is obtainedby adjusting the force until a certain pattern is viewed with the microscopethrough the prism. With a predefined area the IOP can be deduced from thecontact force FC according to equation(1). Thorburn has shown that the 95%confidence interval for the difference between two consecutive IOPmeasurements with GAT done by the same observer was -0.5 ± 1.7 mm Hg(THORBURN, 1978). For measurements performed by different observers theinterval increased to –0.7 ± 3.1 mm Hg.
3.3.4 Guard ring tonometersThe applanation method with a guard ring was proposed MACKAY and
MARG (1959). The applanating surface is divided into a central part and a

23
guard ring part, and the force is measured in the central part of the contactsurface. Tono-Pen is a hand-held guard ring applanation tonometer that uses amicro strain gauge transducer to measure the force on a central plunger with adiameter of 1.02 mm (MINCKLER et al., 1987). The guard ring has a 3.22 mmdiameter. The output from the force transducer when the cornea is applanatedis analysed by an on-board microprocessor and the IOP is calculated.Evaluation of Tono-Pen and ProTon, which is a similar instrument, incomparison to GAT has shown that the 95% limits of agreement betweenGAT and Tono-Pen are between –3 to +8 mm Hg and between GAT andProTon –4 to +5 mm Hg (MIDELFART and WIGERS, 1994).
3.3.5 PneumatonometerThe principle of the pneumatonometer, developed by Langham and co-
workers, has been described by MOSES and GRODZKI (1979). It is based on agas-operated servo system that propels a plunger, with air outflow through aspecial membrane tip, against the cornea. The outflow of gas is impeded atcontact, resulting in a pressure rise in the flow system and an increased forceon the plunger. This way a gas-operated servo system exists in which theforce of the plunger against the cornea is governed by the pressure in the gasflow system. The equilibrium pressure of the system is recorded, and it isproportional to the IOP. In a comparison study (QUIGLEY and LANGHAM, 1975)with GAT, 85% of the measurements were within ± 3 mm Hg (n=100).
3.3.6 Non-contact tonometersNon-contact tonometers (NCT), based on the applanation principle, that
measures the IOP without touching the eye, have been developed (FORBES etal., 1974). A central area of the cornea is deformed by a controlled air pulse oflinearly increasing force impinging on the cornea. A monitoring systemsenses the light reflected from the corneal surface and records the maximalsignal at the instant of applanation. In a comparative study with GAT, Forbeset al. showed a correlation of 0.9 and a SD of 2.86 mm Hg (n=570) betweenthe methods for differences between pairs(FORBES et al., 1974). Seven morerecent studies, partly summarised by Hansen (HANSEN, 1995), where NCT air-puff tonometers were compared with GAT, have shown a wide range of SD(1.12 to 2.93 mm Hg) for the difference between methods (HANSEN, 1995,PARKER et al., 2001).
3.3.7 Schøitz tonometerThe Schøitz method measures how deep a certain weight will indent the
cornea (FRIEDENWALD, 1937). The lower the IOP the greater the indentation.The instrument is placed on the cornea with a foot plate. The weight is placed
MTIFOU
Tabort dubbel ref

24
on a plunger and on a scale the operator can read the depth of the indentation.From calibration tables IOP in mm Hg can be estimated from the scale valueand the weight.

25
4 Sensor theory4.1 Resonator sensors in general
JORDAN (1985) suggested a general definition of resonator sensors. They aredevices based upon a principle whereby the resonant frequency or frequencydistribution produced in a mechanical structure is measured and related to thephysical property to be determined. In the sensor system there is a need for anelectronic drive circuit that maintains the oscillations; the frequencycharacteristics of this circuit will also affect the resonance frequency. Aresonator sensor can use variable stress in a mechanical structure to cause achange in its resonance frequency (LANGDON, 1985). For example, a stretchedstring connected to a diaphragm will change its tension depending on thepressure on the diaphragm (JORDAN, 1985). Other resonator principles aresensors that are affected by change in the system inertia with a mass change orchange in surrounding material. There are sensors for measuring liquid levelor liquid/gas density based on that principle (STEMME et al., 1983, LANGDON,1980). Decay time and phase variations are also examples of parameters thatcan be used in a resonator sensor system. Viscosity has long been beenmeasured with this technique (LANGDON, 1985).
Many resonator sensors use piezoelectric transducers mounted on thevibrating element to drive the oscillation and for pick-up of the vibration. Insome cases the whole vibrating element is made of quartz or a ceramicpiezoelectric material. The advantage of the piezoelectric material is that theyenables the vibration to be maintained and measured by a simple electricaldrive circuit.
4.2 PiezoelectricityThe piezoelectric effect was discovered in 1880 by Pierre and Jacques
Curie (IKEDA, 1990). Piezoelectricity involves the interaction betweenmechanical and electrical behaviour of the medium. The direct piezoelectriceffect is that electric polarisation is produced by mechanical stress, and theinverse piezoelectric effect is that the same materials deform when they areexposed to an electric field. The piezoelectric effect is found in naturallyoccurring crystals like quartz and tourmaline (WAANDERS, 1991).
For a crystal to exhibit this effect its structure should have no centre ofsymmetry. A stress applied to the crystal will alter the separation betweenpositive and negative charge sites in each elementary cell, leading to a net

26
polarisation at the crystal surface. This generates an electric field and avoltage over the crystal. The effect is practically linear and also reciprocal,that is, if the crystal is exposed to an electric field it will experience an elasticstrain causing its length to increase or decrease according to the field polarity.
Poolingaxis
+
-
F
+
-
F
-
+
+
-
+
-
+
-
+
-
+
-+
-
+
-
Figure 3. Example of the piezoelectric effect in a cylindrical element. F is theapplied force to the body. The pooling axis and the dipoles shows thepolarisation in the element. For ceramic piezoelectric material the poolingdirection is determined in the manufacturing process by applying a strongelectric field in that direction. The upper pictures shows how an electricalpotential, symbolised by voltmeters, is generated over the elements fromdeformation due to an applied force. The lower row of pictures shows how adeformation is generated by applying an electrical voltage over the element. Asinusoidal voltage variation will cause the element to oscillate.
Piezoelectric elements can also be produced in ceramic material(WAANDERS, 1991). The sensor elements used in the studies presented in thisdissertation were based on a ceramic piezoelectric material. These materialscan be considered as a mass of minute crystallites. Below the Curietemperature the elementary cell of these crystallites is not centrosymmetric,which creates a dipole. Neighbouring dipoles align with each other to domainsof local alignment. The ceramic is then made piezoelectric in a chosendirection by heating the sample to just below the Curie temperature andadding a strong electric field in that direction. This will make the domainswith dipoles in the field direction to grow on the expence of the domains withdipoles in other directions. When the electric field is turned off the dipolesremain locked in the approximate direction of the field, and there will be a netdipole moment and a remanent polarisation. There will also be a permanentdeformation related to the polarisation. The ceramic piezoelectric element will

27
now act the same way as the piezoelectric crystal; with a voltage over thesample if a force is applied, and with a deformation if a voltage is applied(Fig. 3). Lead Zirconate Titanate (PZT) is a ceramic piezoelectric material.
4.3 Resonator sensor principleIn the work of this dissertation a new type of resonator sensor was further
developed and evaluated. The sensor technique was first presented by OMATA
(1989). Three years later, OMATA and TERUNUMA (1992) presented the basicdescription of this resonator sensor system. It is based on a ceramicpiezoelectric element shaped like a rod or cylinder, made out of PZT and witha piezoelectric pick-up. When an alternating voltage is applied across itselectrodes the element will vibrate freely in the direction of its length. Thepick-up detects the vibration and feeds the alternating signal to a drivingamplifier in a feedback circuit. The circuit drives the PZT-element and thesystem oscillates at its resonance frequency. If the free end of the PZT-element, or a contact piece attached to that end, touches an object theresonance frequency characteristics and frequency of the system will change(Fig. 4). The amount of change depends on the acoustic impedance of theobject. The sensor system output signal is the shift of the oscillation frequencyfrom unloaded to loaded condition.
-15
-10
-5
0
5
58500 59500 60500 61500 62500 63500f (Hz)
Am
plitu
d ra
tio (d
B)
UnloadedLoaded
Figure 4. The amplitude frequency response characteristics for the sensorprobe used in Paper IV. Black curve displays the unloaded sensor and greycurve the response when the sensor was applied to a silicone sample. Thefigure shows how the whole frequency characteristic curve shifts to a lowerfrequency when the sensor is applied to the sample. It is, in principle, this shiftthat can be detected with the resonator sensor system.

28
4.3.1 Mechanical oscillations in a rodThe behaviour of the sensor system can be explained and approximated in
terms of the vibration mode of a finite rod (OMATA and TERUNUMA, 1992). If theend of a finite rod of length, l, is attached to an unknown impedance, Zx, thetheoretical treatment of a vibrating rod will predict the change in resonancefrequency from unloaded to loaded condition as:
0
02Vf
l Zβ
π∆ = − (2)
where Z0 is the acoustic impedance of the sensor element and V0 is theequivalent sound velocity in the sensor element. β is the reactance of theunknown impedance Zx:
xZ jα β= + (3)
with α as the resistive load. The reactance, β ,can be further divided into amass load part, described with mx, and a compliance term, described with Cx:
1x
x
mC
β ωω
= − (4)
where ω is the angular frequency. The two parts will depend on materialproperties of the measured object. OMATA and TERUNUMA (1992) alsosuggested that both mx and Cx are related to the contact area, A, between thesensor and the object:
( )
32
10 1xAm ρ
ν=
−(5)
21 12xC
A Eπ ν−
= (6)
where ρ is density of the object, ν is Poisson’s ratio and E is Young’smodulus.

29
4.4 Resonator sensors for diagnostic purposesIn the original paper OMATA and TERUNUMA (1992) demonstrated that a
tactile sensor using the resonator technique was capable of sensingcharacteristics like change in elasticity of the skin and muscle caused byacupuncture therapy. They concluded that for applications based on the newsensor, a lot of difficulty remained to be solved, but the feature of the sensorwas that it could sense hardness or softness of an object like the human handdoes. Since then, a number of tactile sensors based on the resonator sensortechnique have been developed and evaluated by Omata and co-workers.
To measure oedema, the tactile sensor technique has been compared to animpression technique (LINDAHL and OMATA, 1995). In that study, the evaluationwas performed in a silicone rubber model and in a rat testis model. Theyfound that frequency shift of the resonator sensor correlated with theestablished impression parameters for describing hardness of living tissue.Furthermore, their results (LINDAHL and OMATA, 1995) indicated that frequencyshift of their resonator sensor linearly related to softness of silicone accordingto an International standard (DIN ISO 2137).
It has been shown that small invisible nodules, that cannot be detectedfrom the lung surface, in patients undergoing thorascopic operation, werelocated successfully using a tactile sensor applied on a rod (OHTSUKA et al.,1995). In another study (MIYAJI et al., 1997), measurement of stiffness with acatheter type resonator sensor mounted in a counter balance arrangement(constant weight 2 g) and applied to resected lymph nodes from patients thatunderwent lobectomy or pneumonectomy was performed. Their studyconfirmed that stiffness, according to the frequency shift of the sensor, is anaccurate approach to diagnose lymph node metastases.
In another study with a tactile sensor mounted in a counterbalancearrangement, it was shown that the stiffness of excised rat prostate varied afterhormone treatment and could be differentiated using the sensor(OMATA andCONSTANTINOU, 1995). They also showed in a gelatin model that change infrequency could be calibrated against stiffness of gelatine, calculated from thecounterweight and the depression (OMATA and CONSTANTINOU, 1995). Bladderwall compliance based on cystometry was compared with stiffnessmeasurement with a resonator sensor in another rat model study (WATANABE etal., 1997). The findings indicated that the direct measurement of bladder wallstiffness may be a useful tool in the evaluation of bladder and prostatebiomechanics.

30
Lindahl et al. evaluated a tactile sensor for stiffness and elastic propertiesof human skin (LINDAHL et al., 1998). From measurements on 874 women´scheek´s skin, they concluded that the sensor system is promising for providinginformation on skin stiffness and elasticity.
In summary, the studies referred to above points towards a potential in thenew sensor technique. However, the basic relationships between frequencyshift and the physical parameters under investigation are not fullyunderstood(LINDAHL and OMATA, 1995), and the general opinion is that furtherresearch are needed (OMATA and TERUNUMA, 1992, LINDAHL and OMATA, 1995,WATANABE et al., 1997, LINDAHL et al., 1998).

31
5 Aims of the study
The aims of this study were:
• to determine which physical variables a resonator sensor will sense whenit is applied to an object, and how these variables relate to changes in themeasured resonance frequency.
• to take a first step towards a non-invasive method for prostate cancermeasurement, by developing an in vitro hardness measurement methodusing a catheter type tactile sensor and evaluate it on silicone samples andprostate tissue.
• to develop an applanation resonator sensor (ARS) for measurement ofIOP, and also to develop an in vitro model with which tonometry methodscould be evaluated.
• to further develop and evaluate the ARS system, in a clinical study and inan in vitro study, in order to improve the measurement accuracy towards aclinical application.
• to develop a new IOP measurement method based on a continuos forceand area recording during the initial applanating phase, and to furtherdevelop and evaluate the ARS system according to this new method.

32

33
6 Review of papers6.1 Paper I
A catheter-type tactile sensor based on resonator sensor technique wasevaluated in a silicone model and applied to human prostate in vitro. The mainfinding was that different histological compositions of prostate tissuecorrelated with the frequency shift of the resonator sensor and that thecommon property was the hardness of the tissue. The results indicated thathardness of the prostate tissue, and maybe hardness of human tissue ingeneral, can be expressed according to a cone penetration standard (DIN ISO2137) and that the hardness can be measured with this tactile sensor system.The tissue hardness application for the resonator sensor technique is yet to befurther developed and evaluated in a larger study. This paper also produced anumber of results that have led to the basic understanding of the resonatorsensor system. One important result was that change in contact area wascorrelated to change in phase shift over the resonator element. Frequency shiftof the sensor system, in turn, was shown to depend on this phase shift throughthe zero phase resonance condition. This indicated that the resonance sensorcould be used for area measurement.
6.2 Paper IIIn this paper the applanation resonator sensor (ARS) for measurement of
intraocular pressure (IOP) was introduced and evaluated. For this purpose anin vitro pig-eye model was developed, and it was shown that a saline columnconnected to the vitreous chamber of the pig-eye could be used successfully toinduce variations in IOP. The sensor was applied against the cornea withconstant force and frequency shift was measured. A mathematical modelbased on the Imbert-Fick law and the assumption that frequency shift waslinearly related to contact area was proposed and verified with convincingresult. IOP measured with the resonator sensor correlated well (r=0.92,n=360) with the IOP elicited by the saline column.
6.3 Paper IIIThe ARS in constant force application was evaluated on healthy in vivo
human eyes. The results verified the sensor principle but revealed a non-negligible source of error in off-centre positioning between the sensor and thecornea. The sensor probe was redesigned and evaluated with the in vitro pig-

34
eye model. The new probe, with a spherical contact surface against the eye,reduced the sensitivity to off-centre positioning. It was also showed that afrequency shift normalisation procedure could reduce the between-eyedifferences. It was concluded that a spherical contact surface should bepreferred and that further development towards a clinical instrument shouldfocus on probe design and signal analysis.
6.4 Paper IVThe applanation resonator sensor method for IOP measurement was further
developed using combined continuous force and area measurements duringthe dynamic phase when the sensor initially applanates the cornea. A forcesensor was included with the resonator sensor in one probe. Evaluation wasperformed with the in vitro pig-eye model. The hypothesis was that the IOPcould be deduced from the differential change of force and area during initialapplanating phase. There was good accuracy and good reproducibility with acorrelation of r=0.994 (n=414) between measured pressure in the vitreouschamber and IOP according to the ARS. Measurement time was short, 77 msafter initial contact. Problems with between-eye differences and lowresolution at high pressures were reduced. The ARS method is the first tocombine simultaneous, continuous sampling of both parameters included inthe applanation principle. Consequently, there is a potential for reducingerrors in the clinical IOP tonometry.
35
7 Material and methods7.1 Resonator sensor system
The resonator sensors used in this dissertation were based on vibratingpiezoelectric elements shaped in the form of a rod or a cylinder and made outof Lead Zirconate Titanate (PZT). The elements had a piezoelectric pick-upfor detection of the vibration. In each probe, the element was set in oscillation,at its resonance frequency, by means of an electronic feedback circuit (Fig. 5).This signal was first processed in a feedback circuit and then used forexcitation of the PZT element. The feedback circuit modified the sinusoidalsignal: first the signal was amplified to a constant amplitude signal, so thatonly the frequency and phase information of the signal were transferred. Thenthe signal was filtered in a band-pass filter to ensure that the PZT elementwould oscillate in its lowest longitudinal mode. The oscillator frequency wasthus solely determined by the zero-phase condition; the sum of the phaseshifts around the feedback loop (feedback circuit and PZT element) must bezero (FLOYD, 1988).
Frequencymesurement
Feedbackcircit
Eye
Piezoelectric-element
Amp
BPF
Pick-up
Figure 5. Resonator sensor system showing the principle, in an example formeasurement of eye pressure. The feedback circuit consists of an amplifier(Amp) and a band-pass filter (BPF).
The system output signal is the shift of the oscillation frequency fromunloaded to loaded condition, denoted ∆fS. As described in Paper I, the ∆fS
will be dependent on the acoustic impedance of the load, the frequencycharacteristics of the unloaded sensor element and the frequencycharacteristics of the feedback circuit through the zero-phase condition. In thestudies included in this dissertation four different resonator sensor probesbased on this technique have been used.

36
7.2 Catheter tip sensorThe catheter tip tactile sensor CTS (prototype by Axiom Co Ltd.,
Koriyama, Japan) was based on a cylindrical piezoelectric element made outof PZT, 7x∅1.2 mm, placed at the end of a catheter with a radius of r0=1.0mm. An integrated part of the element was used as a pick-up. At the tip, incontact with the element, a hemisphere of epoxy was placed, which sealed thecatheter. Its fundamental resonance frequency was approximately 200 kHz.
7.3 ARS sensorsThe first two applanation resonator sensors (ARS) used a rod-shaped (25 x
5 x 1 mm) PZT element. A small PZT pick-up glued on to the PZT elementdetected the vibrations. One end of the rod was tapered and a specially shapedcontact piece of nylon was fitted and glued onto the end. The element wasmounted with foam rubber in a plastic cylinder (Fig. 6).
For the first probe, the contact piece was formed as a hemisphere with aflat end (∅=7 mm) towards the cornea, this probe will be denoted flat probe(Fig. 6, left) (Papers II and III). For the second probe a spherical contact piecewith a diameter of 4.6 mm was glued to the end (Fig. 6, right). This probe willbe denoted spherical probe (Paper III). The resonance frequency of theunloaded oscillating system was approximately 82 kHz for the flat probe and66 kHz for the spherical probe.
Figure 6. The flat ARS probe and spherical ARS probe.
The third ARS probe (Paper IV) consisted of a non-tapared PZT rodshaped (23 x 5 x 1 mm). A bakelite piece, used for contact against the cornea,was glued onto one end of the PZT element. The contact surface of the piecewas convex with a 7 mm radius of curvature. The sensor was mounted with aplastic suspension and placed in a sensor module together with a forcetransducer (Fig. 8). Resonance frequency was approximately 61 kHz.
MTIFOU
Fig
MTIFOU
Fixa fig

37
7.4 In vitro experimental set-upAll four papers (I to IV) for evaluating the resonator sensor principle
included in vitro measurements. The experimental set-up for this purpose hasundergone a continuous development during the course of this work. Thebasic arrangement is shown in Figure 7. In the early papers (Papers I, II andIII) conventional instruments, frequency counter and balance were used, anddata were recorded into the computer through a GPIB and RS 232 interfaces.This system supported precise measurements of “steady state” conditions offrequency shift and contact force. Sampling rate was 1 to 10 Hz. In Paper III,a frequency-to-DC-voltage converter based on a phase-locked loop circuitwas developed to facilitate data-acquisition of frequency with a dataacquisition card and a sampling rate of 1 kHz.
BPF
Frequency counter
Feedbackcircuit
Amp
Pickupmotor
GPIB
PC
BalancePressuretransducer
Pneumatonometer
Saline column
Eyeball
Stop cock
PZT-element
Cannula
Figure 7. Experimental set-up for the measurements in Papers II, III and IV.With exception of the pressure-related parts and with the addition of a z-translator for controlled penetration depth, the same set-up was, in principle,used in Paper I for measurement on prostate tissue and silicone samples. Theresonator sensor probe varied between studies. The counter balancearrangement was used for constant contact force, FC, application. Thepneumatonometer was only used in Paper II.
Finally, for Paper IV, the set-up was extended with an inductiveindentation measurement device and a built-in force transducer in the probe(Fig. 8). The experimental set-up could now be used to continuously recordfrequency, force and indentation in a way that made it possible to closelyevaluate the fast dynamic phases such as the initial applanation phase whenthe sensor was applied to the cornea.

38
Support washer
35 mm
4.0 mm
���������������������������������������������������������������������������������������������������������������������������������������������������������������������������������������������������������������������������������
PZT element
Force sensor
Suspensions
Aluminium case
����
���������������������
Lever
Figure 8. For the experimental set-up of Paper IV a new sensor module forARS IOP measurement was developed. The module consisted of a resonatorelement for area measurement mounted on a force transducer. Indentation wasmeasured with an inductive position gauge on the lever. In this study acontrolled indentation and measured-force method was used.
7.4.1 Silicone model and prostate tissueThe CTS was evaluated in a silicone model and on human prostate in vitro.
For the silicone model a two-component silicon, Wacker SilGel 612 (Wacker-Chemie GmbH, München, Germany) was used. It was poured into standardPetri dishes. The silicone was vulcanised into 5 samples of different hardnessby changing the mixing ratio. For the in vitro human tissue measurements,prostate tissue was removed from a 72-year-old man suffering from benignprostate hyperplasia. A slice of the prostate, about 10 mm thick, was fixed informalin for 24 h (TOBOCMAN et al., 1997), then stored in 50% ethanol. Thetissue was used for evaluation of the CTS and for histological diagnosis.
7.4.2 IOP Pig-eye modelEyes from 3 to 6-month-old Landrace pigs were enucleated immediately
after the pigs were put to death, either after completed surgery related toanother research project (Papers II and III), or at the abattoir (SQM,Skellefteå, Sweden) (Papers III and IV). The eyes were mounted firmly in apetri dish with agar solution (15 g/l) that covered the eye to about 50%. Awinged, thin-walled cannula ∅0.8 x 19.0 (Terumo Corp., Tokyo, Japan) wasintroduced through the side of the eyeball into approximately the middle ofthe vitreous chamber (Fig. 7). The hole around the cannula was sealed withcyanoacrylate adhesive to avoid leakage (EISENBERG et al., 1998). The cannulawas connected to a saline column consisting of PVC tubing, a three-waystopcock, and at the distal end a partially saline-filled syringe open to air. The

39
syringe was movable mounted on a stable stand. The eye was pressurised for10 seconds by opening it to saline column. The pressure level was calculatedfrom the measured height of the saline column, IOPSC. Just beforemeasurement the stopcock was closed to create a closed system thatapproximated the normal state of the eye (EISENBERG et al., 1998). The IOP wasmeasured both with the applanation resonator sensor, IOPARS, with apneumatonometer (Paper II), and with a standard pressure transducerconnected to the infusion line, IOPVC. To avoid drying of the cornea the eyewas moistened before every pressurisation with room-tempered saline. Tosimulate blinking the saline was applied onto the eye with one sweep of a verysoft goat-hair brush, Kreatima 922 (Schormdanner Pinsel, Nürnberg,Germany).
7.5 IOP clinical set-upIn Paper III, a clinical evaluation of a flat-surfaced resonator sensor with
constant contact force against the cornea was performed. A standardbiomicroscope with the force balance of the GAT set-up was used. The flatresonator sensor probe was mounted in the position of the optic head used instandard GAT measurements. The force balance was fixed at a settingcorresponding to 15 mN of contact force, FC. Frequency was measured with auniversal counter and recorded into a PC with 10 Hz sampling frequency. Atotal of 24 volunteers, 4 male and 20 female, participated in the study. Theirmedian age was 46 years, range 16 to 56 years. All subjects were healthy.Measurements were taken on both eyes and additionally one time on one eyeafter massage. GAT was used as a reference method.

40

41
8 General results and discussion8.1 A contact area measurement device
Prior to the start of the research project presented in this dissertation theresonator sensor had been presented as a tactile sensor like the human hand(OMATA and TERUNUMA, 1992). The frequency shift, ∆fS, of the sensor systemwas shown to detect differences in hardness or softness of a measured objectin a general way. One of the aims was to determine what physical parametersthe sensor could sense, and how these affected the frequency characteristics ofthe sensor system and thereby created a change in the easily measuredresonance frequency.
In Paper I, this work was initiated by measuring on well-defined siliconesamples. A resonator sensor element, mounted in a catheter, was isolated fromthe feedback loop and its phase-frequency characteristics were determined bydriving the element with a frequency generator and measuring of phase shiftswith a universal counter.
-18
-16
-14
-12
-10
-8
-6
-4
-2
00 0.2 0.4 0.6 0.8 1 1.2
L p (mm)
∆φSE
(deg
)
4:3.75
4:3.5
4:3.2
4:3
4:2.5
Figure 9. Change in phase shift from unloaded to loaded condition, ∆φSE
(mean ± SEM, n=10), for a CTS-element, as a function of three penetrations,Lp. Measurements were done on five silicone samples of different hardness.The hardness presented by mixing ratio of the silicone, the higher the ratio theharder the silicone. The driving frequency was fixed at 190 kHz. The slope ofthe curves are approximately the same for all levels of hardness. (Data fromPaper I).

42
It was shown that change in phase shift, ∆φSE, over the resonator element,in that case the catheter tip sensor (CTS) with a spherical contact surface, waslinearly related to the penetration depth, Lp, into silicone samples of differenthardness (Fig. 9). It was also shown that the slopes of the relations wereindependent of sample hardness (with exception of the hardest sample) (PaperI).
-150
-100
-50
0
50
100
150
186.5 187 187.5 188 188.5 189 189.5 190 190.5 191frequency (kHz)
φ (d
eg)
FeedbackPZT-unloadedSum unloadedPZT-loadedSum loaded
φFC
φSE UnloadedΣφ UnloadedφSE LoadedΣφ Loaded
Figure 10. Example showing the relationship between resonance frequency ofthe sensor system and phase-frequency characteristics of the differentcomponents in the oscillating circuit. The two uppermost lines show phaseshift over the sensor element, φSE, for an unloaded sensor and a sensor appliedwith FC=9.94 ±0. 05 mN (mean±SD, n=6) to a silicone sample. Note thatphase-frequency curves were close to linear and that the change, ∆φSE, betweenloaded and unloaded was approximately constant. The bottom line showsphase shift over the feedback loop, φFC. Included are also calculated curves forthe total phase shift around the feedback loop, Σφ = φSE + φFC for the differentloads. The sensor system will resonance at the frequency where Σφ = 0. Theshift of the zero cross frequency due to the load was approximately 700 Hz inthis example. (From Paper I with permission.)
The CTS used had a spherically shaped contact surface with radius, r0, andwas applied to the flat surface of the silicone sample. The relationshipbetween contact area, A, and penetration is described (RÅDE and WESTERGREN,1990) by:
02 pA r Lπ= (7)

43
Thus, ∆φSE should be linearly related to contact area A:
SE C Aφ∆ = ⋅ (8)
In Paper I it was also shown that ∆fS depends on the change of phase shift,∆φSE, over the resonator sensor element through the condition that the phaseshift around the feedback loop must be zero (FLOYD, 1988) (Fig. 10).
The two results displayed in Figure 9 and Figure 10 led to the conclusionthat the frequency shift in some manner corresponds to the contact area. Themodel for this relationship was yet to be determined.
In Paper II the relationship between ∆fS and the phase frequencycharacteristics was modelled with the aim to measure contact area. From thezero phase shift condition(FLOYD, 1988) the sum of phase shifts should bezero:
( ) ( ) 0FC SEf fφ φ+ = (9)
where φFC(f) and φSE(f) are the phase-frequency characteristics of the feedbackcircuit and the sensor element, respectively. The zero phase condition statesthat the sensor will oscillate at the frequency at which equation(9) is satisfied.The results of Figure 9 and Figure 10 indicate that the application of thesensor tip against an object causes a net phase shift, ∆φSE, from the unloadedcondition, which according to equation (8) is dependent on contact area:
( ) ( ) ( )load unloadSE SE SEf f Aφ φ φ= + ∆ (10)
inserted in equation (9)
( ) ( ) ( ) 0unloadFC SE SEf f Aφ φ φ+ + ∆ = (11)
Assume that the derivatives of the phase-frequency characteristic for thesensor element, dφSE/df, and for the feedback circuit, dφFC/df, areapproximately constant in the interesting frequency range. Figure 10 indicatesthat this was valid for the CTS. The phase-frequency characteristics for bothsensor element and feedback loop could then be written in the form:

44
( ) ( )0 Sdf f fdfφφ φ= + ∆ (12)
were f0 is the resonance frequency of an unloaded sensor. Equation (12) forboth sensor element and feedback loop inserted in equation (11) gives:
( ) ( ) ( )0 0 0FC SEFC S SE S SE
d df f f f Adf dfφ φφ φ φ+ ∆ + + ∆ + ∆ = (13)
Using equation (9) for the unloaded frequency, that is φFC(f0)+φSE(f0)=0,and rearranging the expression yields:
( )SES
FC SE
Af d d
df df
φφ φ∆
∆ = −+
(14)
This was the model used in Paper II to explain the linear relationshipbetween ∆fS and ∆φSE. Together with the earlier indication, from Paper I, that∆φSE was linearly related to contact area between sensor and measured object,equation (8), it was proposed (Paper II) that ∆fS of the resonator sensor systemcould be used to estimate contact area and that the relationship should belinear. The high degree of explanation for individual eyes (R2 ≥ 0.95 n=60,Table 1) for an intraocular pressure model based on these assumptions furtherstrengthened the hypothesis that the resonator sensor can be used as asensitive contact area device with an approximately linear relation betweenarea and ∆fS.
In Paper IV frequency versus indentation was again evaluated. In thatstudy a resonator probe with a slightly convex sensor tip was applied againstthe cornea of pig eyes under continuous recording. It was shown, by analysingthe residual from a linear regression (Normality test, p>0.20, n=19959, PaperIV), that at an indentation interval of 0.19 mm to 0.49 mm the frequencychanged linearly with indentation. A geometric derivation indicated thatindentation was close to linearly related to contact area and that thecorresponding contact area interval was approximately 5.3 mm2 to 13.7 mm2.For smaller areas, fluid on the cornea will cause an initial fluid contact thataffects the frequency shift, and for larger areas the cornea will bend and thefull area of the tip will be reached.

45
In conclusion, there was strong evidence to support the idea that within acertain interval, the frequency change of the sensor system is close to linearlyrelated to the change in contact area. This assumption can be used in thedesign of experimental models. That is:
.Sdf ConstdA
= (15)
8.2 A hardness measurement deviceAs described in the section 4.4 a number of previus studies have indicated
that resonator sensors can be used for hardness or stiffness measurement of anobject. In this dissertation the CTS was evaluated for hardness measurementin a silicone model and in an in vitro prostate tissue model.
8.2.1 Silicone modelIn Paper I, the CTS with spherical contact surface was applied to silicone
samples of 5 different hardnesses. The variation in hardness was created byusing different mixing ratios of the two components when vulcanising thesilicone samples. The hardness of the samples was quoted in the form ofpenetration values, (mm/10) (DIN ISO 2137, 150g hollow cone. A specifiedcone is applied to the object with a standardised force and the penetrationvalue after a certain time is recorded. Decreasing penetration valuescorrespond to increasing hardness.). Constant force application of the sensorshowed that ∆fS correlated well with the cone penetration standard (Fig. 11)(Paper I). This can be explained through Figure 9 which showed that ∆φSE
was linearly related to penetration depth and equation (14) that linearlytransfers the ∆φSE to the measured frequency shift ∆fS.

46
y = -6.34x + 214R2 = 0.98
-1800
-1600
-1400
-1200
-1000
-800
-600
-400
-200
00 50 100 150 200 250 300 350
cone penetration softness (mm/10)∆f
S (H
z)
Cone Din ISO 2137Recalculated Cone
Figure 11. Results from Paper I (with permission). Frequency shift of theCTS, ∆fS (mean±SEM, n=10), vs. cone penetration (DIN ISO 2137) for the fivedifferent silicone mixtures. ∆fS is also plotted with regression line versusrecalculated cone penetration values. Contact force was 9.84±0.10 mN(mean±SD, n=50). Description of recalculated cone values is given in Paper I.
Therefore, similar to the way of measurement of the penetration depth withthe hollow cone in the DIN standard, the penetration depth, Lp, of the sensortip into the silicone was measured as a frequency shift of the sensor system.This explained the sensor´s capability to measure object hardness underconstant force application. The finding that the sensor system couldreproducibly differentiate hardness variations between silicone samples ofdifferent mixtures was in accordance with earlier reports (LINDAHL and OMATA,1995). The silicone experiments of Paper I further strengthened the hypothesisthat ∆fS measures hardness, and it opens the possibility of referencing themeasurement to a known and adopted standard. More importantly, however,was that it explained the physical relationship between ∆fS and hardness of athe measured object.
8.2.2 Prostate modelMalignant tumours are generally harder than the surrounding tissue, and
this is the reason why tumours often can be detected by palpation. In a recentstudy a tactile sensor was used to show that the stiffness of resected lymphnodes is an accurate approach to diagnosing lymph node metastases (MIYAJI etal., 1997). In Paper I the CTS was evaluated in an in vitro human prostatemodel. The measurements with constant-force application of the tactile sensoronto the surface of a prostate slice, from a patient suffering from benign

47
prostate hyperplasia, showed that there were large variations in the frequencyshift between measurement sites and small differences within sites (Paper I)(Fig. 12). Experience from the silicon model study (Paper I) indicates, that thedifferences between sites could be related to differences in hardness. Amorphometric analysis of the measurement sites showed that the prostatetissue was mainly composed of prostate gland tissue, stroma and prostatestones. It was assumed that the relative mixture of tissue components wouldbe related to the hardness. An equation (equation (16)) describing thehardness of the prostate tissue based on the relative amounts of glandulartissue (Gland%) and prostate stones (Stone%) was proposed and used:
% %TissuMix Gland D Stone= + ⋅ (16)
The best correlation between ∆fS and the tissue mix values was found withD=-34 (r=-0.96, p<0.001, n=60) (Fig. 12).
-2200
-2000
-1800
-1600
-1400
-1200
-1000
3 1 6 5 4 2
∆fS
(Hz)
-4
1
6
11
16
21
26
measurement site
tissu
e m
ixDf
Tissue Mix∆f Stissue mix
Figure 12. Frequency shift, ∆fS (mean±SEM, n=10), of the CTS applied withconstant force, FC=87.6± 1.0 mN (mean±SD, n=60), vary among the sixdifferent measurement sites on a prostate slice. Low SEM indicates that theresults were reproducible. TissueMix according to histological investigationand equation (16) are represented by dots. Softer tissue results in a greaternegative frequency shift. (From Paper I with permission.)
The study (Paper I) contributed to the work on human tissue hardnesssince the in vitro prostate results indicated that the relative hardness,

48
interpreted from ∆fS, was correlated to the morphometrically proposed relativetissue hardness. This finding is promising for a further development of a non-invasive tactile sensor for detecting prostate cancer. In the clinical situation itis important for a measurable quantity to have a well-defined, sensor-independent and easily interpreted unit. The DIN ISO 2137 standard used inPaper I might be suitable for defining hardness of human tissue.
8.3 An intraocular pressure measurement systemThe applanation principle for intraocular pressure measurement demands
knowledge of the contact force and the applanated area. Current methods usesome form of constant area and measurement of the force exerted on that area.The resonator sensor evaluated in Paper I was shown to have a frequencyshift, ∆fS, that was related to the contact area between the sensor tip and theobject it was applied to. This led to the idea to use the contact areameasurement capability of the resonator sensor in a new applanation methodfor IOP measurement.
In Paper II a new sensor for IOP measurement based on the resonatorsensor technique was developed and evaluated. It was named it ApplanationResonator Sensor (ARS). The sensor had a contact piece of nylon with a flatsurface against the cornea (Fig. 6, left). Enucleated eyes from pigs werepressurised with a saline column connected to the vitreous chamber through acannula (Fig. 7). The frequency shift (area) of the sensor, applied withconstant force against the cornea, was compared with the IOP according to theheight of the saline column (Fig. 13).
A model, equation (17), derived from the Imbert-Fick law and theassumption that ∆fS is proportional to the contact area, and that contact forcewas constant, was fitted against the data.
ARSS Offset
Cf CIOP
∆ = + (17)
For individual eyes the model showed a high degree of explanation, but forall eyes together R2 was reduced (Table 1).

49
-800
-700
-600
-500
-400
-300
-200
-100
05 10 15 20 25 30
IOP SC (mmHg)
∆fS
(Hz)
Eye No.4
Figure 13. Frequency shift (∆fS ,mean, n=10) for a flat-surfaced ARS appliedto pig-eye cornea with constant force (FC=87.6 mN) vs. manometric pressureaccording to saline column. Error bars represent the standard deviation.Measurements taken from a typical eye. (From Paper II with permission.)
Table 1. Estimated coefficients, CARS and COffset, and degree of explanation, R2,from the fitting of the model according to equation (17) to the ∆fS and IOPSCdata. Data from Paper II.
Eye No. COffset CARS R2 nEye 1 127 -5912 0.95 60Eye 2 123 -5807 0.97 60Eye 3 168 -6488 0.97 60Eye 4 111 -5750 0.99 60Eye 5 31 -4260 0.98 60Eye 6 -1 -5378 0.97 60All six eyes 93 -5599 0.92 360
The estimated coefficients for the data from all six eyes (last row Table 1)were used to calculate IOPARS from the ∆fS measurement. The overallcorrelation between IOPARS, measured with constant force application, andpressure elicited with the saline column, IOPSC, was r=0.92 (n=360, Paper II).The standard deviation for the differences between pairs was 2.6 mm Hg(n=360, Paper II).
In summary, the study presented in Paper II showed that the resonatorsensor principle could be used to measure intraocular pressure in an in vitro

50
pig-eye model. The sensor technique seem to be suitable for measurement ofcorneal contact area, and a new IOP measurement application based on theapplanation principle was possible. Properties such as good stability, highprecision within individual eyes, fast and distinct response of ∆fS, and thepossibility of a low contact force were all factors which were promising forthe future development. Another important conclusion was that the in vitropig-eye model with the saline column connected to the vitreous chambercould successfully be used to induce variations in IOP (Paper II).
At that stage the main challenges were the differences between eyes andthe low resolution at high pressure, when the contact area becomes very small.
In Paper III the same sensor as in Paper II was first evaluated in a clinicalstudy with 24 healthy volunteers. The sensor was applied to the cornea withconstant force and ∆fS were recorded. GAT was used as reference method. Asignificant correlation between ∆fS and 1/IOPGAT (r=-0.40, p<0.001, n=72,Paper III) was found. However, the high correlation of the in vitro study(Paper II) was not reproduced. There was an unexpectedly large variation inthe ∆fS of the ARS sensor when compared with subjects with the same IOPaccording to GAT. One large difference between the laboratory in vitroexperimental set-up and the experimental set-up in the clinical situation wasthe ability to apply the sensor so that the centre of the cornea coincided withthe centre of the sensor element contact surface. In the laboratory this can bedone very carefully while in the clinical setting the operator has to control thismanually. Therefore, the hypothesis that sensitivity to off-centre positioningmight be a major source of error was stated (Paper III).
In the same paper (Paper III), the flat probe sensitivity to off-centrepositioning was subsequently investigated with the pig-eye model. It showedthat even a small off-centre variation of 1 mm could induce variations in ∆fS
comparable to the variations found in the clinical evaluation. In an attempt toreduce this sensitivity, a probe with a spherical tip (radius=2.3 mm) wasdeveloped. The hypothesis was that for a small off-centre positioning, theconvexity of the contact surface would, in comparison with the flat probe,move the centre of contact surface on the sensor closer to the principal axis ofthe sensor element. The results from an in vitro evaluation of the sphericalprobe showed that the variation due to off-centre positioning was reducedsubstantially. With positioning within the 1-mm radius around the principalaxis the variation of ∆fS was within 11% for the spherical probe as comparedwith 89% for the flat probe (Paper III). In an evaluation with variation of IOP,the results of the spherical probe showed a high degree of explanation of the

51
model stated in equation (17) for the individual eyes (R2≥0.97, p<0.001, n=18,Paper III), but a reduction of R2 for all eyes together (R2=0.78, n=108,p<0.001, Paper III). This was in accordance with the results from Paper II andindicated that there was still an inter-eye variation. A normalisation procedureof ∆fS on each eye reduced the inter-eye differences. With the normaliseddata, the degree of explanation for the model was R2=0.98 (p<0.001, n=108,Paper III). Therefore, further development towards a method and/or signalanalysis that incorporates a self-calibration like the normalisation wassuggested (Paper III).
A convex tip will diverge from the Imbert-Fick law, which demands a flatcontact surface. Instead, the spherical probe method is more comparable to anindentation tonometer, in which a rod is applied to the cornea and theindentation depth is measured (FRIEDENWALD, 1937). For the ARS with thespherical probe the indentation is related to contact area measured through∆fS. The indentation of the cornea will produce a larger displacement of fluid(MOSES, 1958), a higher increase in IOP (related to the scleral rigidity) andrequire a larger contact force. The contact force needed was three timesgreater for the spherical probe than for the flat probe in order to reach thesame resolution. It was therefore suggested (Paper III) that, even though theoff-centre positioning results of the study (Paper III) supported a stronglyconvex contact surface, a larger radius of curvature should be considered inorder to reduce the penetration, and thereby reduce the needed contact force.
The Imbert-Fick law assumes that the cornea is infinitely thin, perfectlyelastic, perfectly flexible and that the only force acting against it is thepressure of the applanated surface (WHITACRE and STEIN, 1993). None of theseassumptions are true (WHITACRE and STEIN, 1993). The cornea is not amembrane without thickness and it offers resistance to indentation, varyingwith its curvature and thickness and the presence or absence of cornealoedema. The surface of the cornea is covered with a liquid film. During theapplanation of the cornea, a liquid ring is formed around the contact piece.This will cause capillary attraction or repulsion force between the contactpiece and the cornea which will interfere with the measurement (GOLDMANN,1957). The force term depends on the width of the ring, i.e., the amount offluid. In addition, the indentation during applanation will rise the IOP, varyingwith displaced volume and the scleral rigidity of the eye (FRIEDENWALD, 1937).

52
GOLDMANN (1957) incorporated these forces into an equation governingapplanation tonometry:
CFIOP M NA
′ ′+ = − (18)
where M ′ is the modulus of elasticity of corneal deformation and N ′ is theattractive force between the tonometer tip and the cornea. Empirical data ofGOLDMANN (1957) indicated that M ′ and N ′ cancelled out, reducing theequation to the Imbert-Fick law, when the contact diameter was between 2.5mm and 3.5 mm and optimally with a diameter of 3 mm. Other studies haveshown that the Imbert-Fick law is valid for an applanating diameter of 2.8 mmand another study that diameters of 3.53 mm and 3.06 mm produced equallyacceptable results (WHITACRE and STEIN, 1993). It seems that there is a contactdiameter interval within which the Imbert-Fick law is shown to be a goodapproximation. However, there are forces not related to IOP that are present,and the magnitude of these forces are dependent on properties such as cornealgeometry, amount of tear fluid and disease. These properties will change fromeye to eye and even from measurement to measurement. Therefore,measurement methods less dependent on the assumption that the forces cancelout should have a potential to reduce the error in IOP measurement withapplanation methods. In Figure 14 a suggestion on how a method usingcombined continuous measurement of contact area and contact force duringan applanation interval, and differential analysis of their relationship isindependent of offset forces in that interval.

53
0
5
10
15
20
25
30
35
40
0 2 4 6 8 10 12A (mm2)
FC
(mN
)
Goldmann Constant areaARS Constant ForceContinuous Force and Area
IOP = F C /A = Slope
Figure 14. Theoretical example of the difference between a one-point methodand a multi-point method for determining IOP. An hypothetic constant force of4 mN, not related to the IOP, is assumed to be measured in the applanation.IOP according to the Imbert-Fick law is interpreted as the slope of the curves.Both methods using one-point readings of force and contact area, Goldmannand ARS with constant force, assume intersection at origin and willoverestimate the pressure. A method with combined continuous force and areameasurement will be independent of constant forces since the slope is based onthe differential change of area and force.
In Paper IV, this new applanation method for IOP measurement whichused combined continuous force and area measurement was implemented.Continuous contact area was measured with a resonator sensor device andcontact force was measured with a force transducer, both mounted together inone probe. The new ARS was evaluated in our established (Papers II and III)in vitro pig-eye set-up. The analysis focused on the initial phase ofapplanation when the area and force were increasing (Fig.15).

54
5975060000602506050060750
-150 -100 -50 0 50 100 150 200 250 300t (ms)
f (H
z)
050
100150200
F (m
N)
0
0.5
1
1.5L
(mm
)
L 1
f 0
f 2
f 1
L 2
t 2 t 1
Figure 15. Typical measurement taken from the IOP=20 mm Hg level withindentation, L, force, FC, and frequency, f, as a function of time. It was theinitial applanation phase that was used in the analysis for estimating thepressure. The chosen interval is shown with vertical dotted lines placed at thef1=(f0 – 150) and f2=(f0 – 470) frequencies (Paper IV).
The resonator sensor property of linear relationship between frequencychange and area change along with the Imbert-Fick law led to a proposedmodel with IOP linearly related to the differential relationship between forceand frequency:
1 0CdFIOP
dfβ β= + (19)
β1 and β0 are general coefficients. Using the measured pressure in thevitreous chamber, IOPVC, as reference, the model was fitted against data fromsix eyes and showed a high degree of explanation (R2=0.989, n=414, 6 eyes,Fig. 16, Paper IV).

55
5
10
15
20
25
30
35
40
45
5 10 15 20 25 30 35 40 45IOP VC (mm Hg)
IOP
AR
S (m
m H
g)
Figure 16. IOPARS from the applanation resonator method plotted againstIOPVC (n=418). To get close to normally distributed residuals, fourmeasurements at the 40 mm Hg level, included in this plot, were regarded asoutliers in the evaluation of the model (Paper IV).
This corresponds to a correlation of r=0.994 (n=414, Paper IV) betweenIOPVC and IOPARS. A comparison with r=0.92 (n=360, 6 eyes, Paper II) for theARS constant force model in Paper II shows that the inter-eye variation wasmuch less with the new method. The overall standard deviation of theresiduals from the fit was 1.07 mm Hg (n=414, Paper IV) indicating that the95% confidence interval between the IOPARS and IOPVC was ± 2.1 mm Hg(n=414, Paper IV). This is in parity with results from Schmidt (SCHMIDT, 1957)for GAT on 4 fresh enucleated human eyes (Residual SD=0.85 mm Hg, n=20,calculated from Table II) (SCHMIDT, 1957). In addition, the problem withasymptotic behaviour at higher pressure, and corresponding loss of accuracy,associated with the constant force method in Paper II and Paper III, waseffectively reduced with the new ARS method that showed an approximatelysimilar accuracy at all pressure levels (Paper IV).
Dependency on off-centre alignment between sensor and cornea was alsoevaluated in Paper IV. The results showed that a 1 mm off-center alignmentcould result in a 4 mm Hg overestimation of the IOPARS at the 20 mm Hg level(Paper IV). This has to be taken into consideration in the future developmentof the ARS system.
As described by Friedenwald (FRIEDENWALD, 1937), volume displacementduring indentation/applanation will cause a rise in IOP and the magnitude isdependent on the scleral rigidity of the eye. For indentation methods like

56
Schiøtz, a relatively large volume will be displaced resulting in a pressureincrease during measurement (MOSES, 1958). With the GAT, the standardcontact area guarantees that the displaced volume is small and the pressure inthe eye will be elevated only slightly (MOSES, 1958). For handheld indentation-applanation methods with constant area and guard ring such as Tono-Pen,there is no control of the indentation and volume displacement since theoperator controls the indentation manually. The area measurement of the ARSmethod, and choice of area interval for analysis based on that measurement,ensured that the indentation, like the Goldmann method, was small. Thus, thescleral rigidity-related IOP-increase during measurement was controlled andshould be approximately the same for all measurements
In summary, Paper IV presented a new methodology for measuringintraocular pressure, to our knowledge never described before. Previoustonometry methods allow one or a few readings of force with constant area forestimating the IOP. The ARS method is the first to combine continuoussampling of both parameters during the application of the sensor onto thecornea, resulting in a linear curve for the force and area relationship. The IOPis then deduced from the slope of that curve, which is based on many pointsand independent of constant forces. The ARS was evaluated in an in vitro pig-eye model and showed good accuracy, good reproducibility with a shortmeasurement time. Consequently, there is a potential for reducing errors inthe clinical routine with the use of a device based on this method.
8.3.1 Future developmentAs described above, the multi-point technique of the new ARS is unique.
A comparison with other methods regarding errors due to constant forcesassociated with the applanation, and a determination of the full value of themethod is yet to be performed. However, the distinct improvement from theconstant force ARS method is very promising. Already today the accuracy ofthe ARS in the pig-eye evaluation is in parity with results from Schmidt(SCHMIDT, 1957) for GAT on 4 fresh enucleated human eyes.
There are two problems that must be solved before the ARS can becomean instrument for clinical practice. First, the off-centre sensitivity must befurther reduced. Secondly, the question regarding sterility procedure must beaddressed. The solutions of both of these problems should be feasible.
A study by Rosa et al. (ROSA et al., 1998) showed that GAT measurementafter myopic photorefractive keratectomy (PRK) underestimated IOP (meanunderestimate > 5 mm Hg, n=87) due to thinning of cornea and change incorneal curvature. They identified a risk that PRK patients developing

57
glaucoma would not be detected in time due to underestimation of IOP. Thealready convex surface of the ARS contact surface should make it lesssensitive to changes in corneal curvature, and it is therefore possible that PRKpatients would get a more accurate measurement with that method than with aflat-surfaced method.
Paper IV showed that, for the crucial phase used in the analysis, thecontinuous ARS only needed approximately 80 ms of contact with the cornea.Therefore, clinical application without requirement of anestethic may bepossible (TOGAWA et al., 1997). In addition, the sensor probe with a combinedresonator sensor and force sensor is very compact and easy to apply into ahandheld instrument. Since both parameters of the applanation principle aremeasured and therefore managed by the instrument, no operator adjustmentsor subjective estimates are needed. A user-friendly tonometer where theoperator simply has to touch the cornea with the sensor tip is therefore areasonable goal for the future research and development.

58
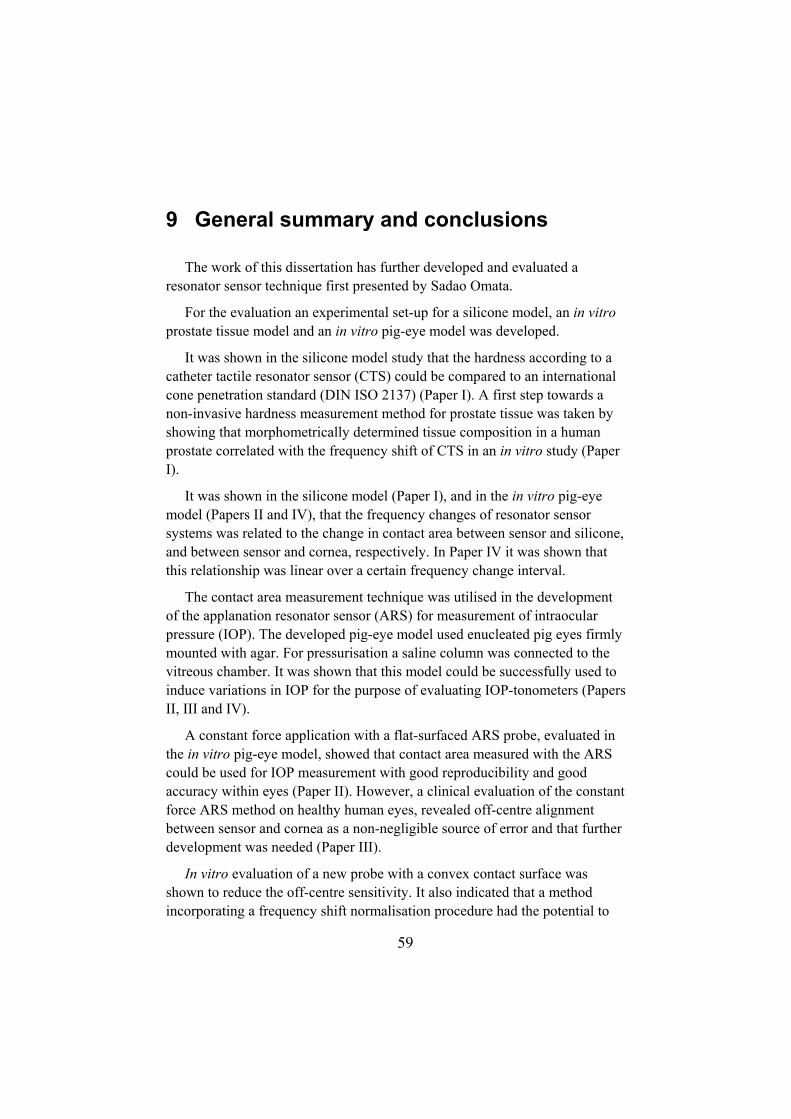
59
9 General summary and conclusions
The work of this dissertation has further developed and evaluated aresonator sensor technique first presented by Sadao Omata.
For the evaluation an experimental set-up for a silicone model, an in vitroprostate tissue model and an in vitro pig-eye model was developed.
It was shown in the silicone model study that the hardness according to acatheter tactile resonator sensor (CTS) could be compared to an internationalcone penetration standard (DIN ISO 2137) (Paper I). A first step towards anon-invasive hardness measurement method for prostate tissue was taken byshowing that morphometrically determined tissue composition in a humanprostate correlated with the frequency shift of CTS in an in vitro study (PaperI).
It was shown in the silicone model (Paper I), and in the in vitro pig-eyemodel (Papers II and IV), that the frequency changes of resonator sensorsystems was related to the change in contact area between sensor and silicone,and between sensor and cornea, respectively. In Paper IV it was shown thatthis relationship was linear over a certain frequency change interval.
The contact area measurement technique was utilised in the developmentof the applanation resonator sensor (ARS) for measurement of intraocularpressure (IOP). The developed pig-eye model used enucleated pig eyes firmlymounted with agar. For pressurisation a saline column was connected to thevitreous chamber. It was shown that this model could be successfully used toinduce variations in IOP for the purpose of evaluating IOP-tonometers (PapersII, III and IV).
A constant force application with a flat-surfaced ARS probe, evaluated inthe in vitro pig-eye model, showed that contact area measured with the ARScould be used for IOP measurement with good reproducibility and goodaccuracy within eyes (Paper II). However, a clinical evaluation of the constantforce ARS method on healthy human eyes, revealed off-centre alignmentbetween sensor and cornea as a non-negligible source of error and that furtherdevelopment was needed (Paper III).
In vitro evaluation of a new probe with a convex contact surface wasshown to reduce the off-centre sensitivity. It also indicated that a methodincorporating a frequency shift normalisation procedure had the potential to

60
reduce the between eye differences (Paper III). For that purpose a new ARSmethod for IOP measurement, using continuos force and area recordingduring the initial applanating phase, was developed and evaluated in the invitro model. It showed good accuracy, good reproducibility with a shortmeasurement time, and that the between-eye differences were reduced (PaperIV).
The results of this dissertation indicate that a new tonometer, using ARS-technique and continuos force and area recording during the initialapplanating phase, is practically possible. The methodology and the sensortechnique is new and therefore it has potential to simplify and reduce errors inthe clinical routine.
The continuous area measurement capability of the resonator sensorsystem, disclosed in this dissertation, is unique and there are many possiblefuture applications in medicine and engineering.

61
10 References
AARNINK, R. G., BEERLAGE, H. P., DE LA ROSETTE, J. J. M. C. H.,DEBRUYNE, F. M. J. and WIJKSTRA, H. (1998): 'Transrectalultrasound of the prostate: Innovations and future applications', JUrol, 159, pp. 1568-1579.
CANTOR, L. (2000): 'Glaucoma' (The foundation of the American Academy ofOphthalmology, San Fransisco, USA)
DOUGHTY, M. J. and ZAMAN, M. L. (2000): 'Human corneal thickness and itsimpact on intraocular pressure measures: a review and meta-analysis approach', Surv Ophthalmol, 44, pp. 367-408.
EHLERS, N., BRAHMSEN, T. and SPERLING, S. (1975): 'Applanation tonometryand central corneal thickness', Acta Ophthalmologica, 53, pp. 34-43.
EISENBERG, D. L., SHERMAN, B. G., MCKEOWN, C. A. and SCHUMAN, J. S.(1998): 'Tonometry in adults and children. A manometricevaluation of pneumatonometry, applanation, and TonoPen in vitroand in vivo', Ophthalmology, 105, pp. 1173-1181.
FICK, R. (1888): 'Ein neues ophthalmotonometer.', Pflygers Arch Ges Physiol,42, pp. 159-190.
FLOYD, T. L. (1988): 'Electronic Devices' (Merrill Publishing Company,Columbus, Ohio)
FORBES, M., PICO, G. and GROLMAN, B. (1974): 'A noncontact applanationtonometer. Description and clinical evaluation.', Arch Ophthalmol,91, pp. 134-140.
FRIEDENWALD, J. S. (1937): 'Contribution to the theory and practice oftonometry', Am J Ophthalmol, 20, pp. 985-1024.
GOLDMANN, H. (1957):'Applanation tonometry' Glucoma. Transactions of thesecond conference.(Ed, Newell, F. W.) Josiah Macy, Jr.Foundation,, pp. 167-220.
GUYTON, A. C. (1991): 'Textbook of Medical Physiology' (Saunders,Philadeplphia)

62
HANSEN, M. K. (1995): 'Clinical comparison of the XPERT non-contacttonometer and the conventional Goldmann applanationtonometer.', Acta Ophthalmol Scand, 73, pp. 176-180.
HODGE, K. K., MCNEAL, J. E., TERRIS, M. K. and STAMEY, T. A. (1989):'Random systematic versus directed ultrasound guided transrectalcore biopsies of the prostate.', J Urol, 142, pp. 71-74; discussion74-75.
IKEDA, T. (1990): 'Fundamentals of Piezoelectricity' (Oxford UniversityPress, Oxford)
IMBERT, A. (1885): 'Théorie des ophthalmotonométres', Arch Ophthalmol, 5,pp. 358-363.
JORDAN, G. R. (1985): 'Sensor technologies of the future', Journal of PhysicsE (Scientific Instruments), 18, pp. 729-735.
LANGDON, R. M. (1980): 'Vibratory process control transducers', MarconiReview, 43, pp. 156-175.
LANGDON, R. M. (1985): 'Resonator sensors-a review', Journal of Physics E(Scientific Instruments), 18, pp. 103-115.
LEYDHECKER, W., AKIYAMA, K. and NEUMANN, H. G. (1958): 'Derintraokulare Druck gesunder menschlicher Augen', Klin MonatsblAugenheilkd, 133, pp. 662-670.
LINDAHL, O. A. and OMATA, S. (1995): 'Impression technique for theassessment of oedema: comparison with a new tactile sensor thatmeasures physical properties of tissue', Med Biol Eng Comput, 33,pp. 27-32.
LINDAHL, O. A., OMATA, S. and ANGQUIST, K. A. (1998): 'A tactile sensorfor detection of physical properties of human skin in vivo', J MedEng Technol, 22, pp. 147-153.
LINDÉN, C. (1997):'Aspects on Prostanoid and Cholinergic Effects onAqueous Humour Dynamics in Human Eyes' Department ofOphthalmology Doctoral Dissertation No 519, Umeå University,Umeå.
MACKAY, R. S. and MARG, E. (1959): 'Fast, automatic, electronic tonometersbased on an exact theory', Acta Ophthalmol (Copenh), 37, pp. 495-507.

63
MAKLAKOFF, C. (1885): 'L'ophthalmotonometrie', Arch Ophthalmol, 5, pp.159-165.
MIDELFART, A. and WIGERS, A. (1994): 'Clinical comparison of the ProTonand Tono-Pen tonometers with the Goldmann applanationtonometer', Br J Ophthalmol, 78, pp. 895-898.
MINCKLER, D. S., BAERVELDT, G., HEUER, D. K., QUILLEN_THOMAS, B.,WALONKER, A. F. and WEINER, J. (1987): 'Clinical evaluation ofthe Oculab Tono-Pen.', Am J Ophthalmol, 104, pp. 168-173.
MIYAJI, K., FURUSE, A., NAKAJIMA, J., KOHNO, T., OHTSUKA, T., YAGYU,K., OKA, T. and OMATA, S. (1997): 'The stiffness of lymph nodescontaining lung carcinoma metastases: a new diagnostic parametermeasured by a tactile sensor', Cancer, 80, pp. 1920-1925.
MOORE, K. L. (1992): 'Clinically Oriented Anatomy' (Williams & Wilkins,Baltimore)
MOSES, R. A. (1958): 'The Goldmann applanation tonometer', Am JOphthalmol, 46, pp. 865-869.
MOSES, R. A. and GRODZKI, W. J. J. (1979): 'The pneumatonograph. Alaboratory study', Arch Ophthalmol, 97, pp. 547-552.
OHTSUKA, T., FURUSE, A., KOHNO, T., NAKAJIMA, J., YAGYU, K. andOMATA, S. (1995): 'Application of a new tactile sensor tothoracoscopic surgery: experimental and clinical study.', AnnThorac Surg, 60, pp. 610-613; discussion 614.
OMATA, S. (1989):'Development of new tactile sensor for detecting hardness'Tech Diagest 8:th Sensor Symp Japan, pp. 267-270.
OMATA, S. and CONSTANTINOU, C. E. (1995): 'Modeling of micturitioncharacteristics based on prostatic stiffness modulation inducedusing hormones and adrenergic antagonists', IEEE Trans BiomedEng, 42, pp. 843-848.
OMATA, S. and TERUNUMA, Y. (1991):'Measurement of skin elasticity usingnew type tactile sensor and its application to acupuncture therapy'3rd USA-China-Japan Conference on biomechanics Atalanta,Georgia, pp. 153-154.
OMATA, S. and TERUNUMA, Y. (1992): 'New tactile sensor like the humanhand and its applications', Sens. & Actuators, 35, pp. 9-15.

64
OTTAR, W. L. (1998): 'Tonometry', Insight, 23, pp. 11-17.
PARKER, V. A., HERRTAGE, J. and SARKIES, N. J. C. (2001): 'Clinicalcomparison of the Keeler Pulsair 3000 with the Goldmannapplanation tonometer', Br J Ophthalmol, 85, pp. 1303-1304.
QUIGLEY, H. A. and LANGHAM, M. E. (1975): 'Comparative intraocularpressure measurements with the pneumatonograph and Goldmanntonometer.', Am J Ophthalmol, 80, pp. 266-273.
ROSA, N., CENNAMO, G., BREVE, M. A. and LA_RANA, A. (1998):'Goldmann applanation tonometry after myopic photorefractivekeratectomy.', Acta Ophthalmol Scand, 76, pp. 550-554.
RÅDE, L. and WESTERGREN, B. (1990): 'Mathematics handbook'(Studentlitteratur, Lund, Sweden)
SCHMIDT, T. (1957): 'Zur Applanationtonometri an der Spaltlampe',Ophthalmologica, 133, pp. 337-342.
SOMMER, A. (1989): 'Intraocular pressure and glaucoma.', Am J Ophthalmol,107, pp. 186-188.
STEMME, E., EKELOF, J. and NORDIN, L. (1983): 'Measuring liquid densitywith a tuning-fork transducer', IEEE Transactions onInstrumentation and Measurement, IM-32, pp. 434-437.
THORBURN, W. (1978): 'The accuracy of clinical applanation tonometry.',Acta Ophthalmol (Copenh), 56, pp. 1-5.
TOBOCMAN, W., RESNICK, M. I. and PRETLOW, T. G. (1997): 'Ultrasoundreflections fail to reflect the histopathology of the prostate.',Prostate, 30, pp. 33-40.
TOGAWA, T., TAMURA, T. and ÖBERG, P. A. (1997): 'Biomedical Transducersand Instruments' (CRC Press, Boca Raton, Florida)
TORTORA, G. J. and GRABOWSKI, S. R. (1996): 'Principles of Anatomy andPhysiology' (Harper Collins Collage Publishers, New York, NY)
US-DEPT-HHS-PUBL (1993):'What You Need To Know About ProstateCancer'' #NIH 93-1576 US-Public-Health-Service-National-Institutes-of-Health.
WAANDERS, J. W. (1991): 'Piezoelectric Ceramics - Properties andApplications' (Philips Components, Eindhoven)

65
WATANABE, T., OMATA, S., LEE, J. Z. and CONSTANTINOU, C. E. (1997):'Comparative analysis of bladder wall compliance based oncystometry and biosensor measurements during the micturitioncycle of the rat', Neurourol Urodyn, 16, pp. 567-581.
WEBER, A. (1867): 'Neues tonometer', Albrecht von Graefes ArchOphthalmol, 13, pp. 203-209.
WHITACRE, M. M. and STEIN, R. (1993): 'Sources of error with use ofGoldmann-type tonometers', Surv Ophthalmol, 38, pp. 1-30.

66

67
11 Acknowledgements
I would like to express my sincere thanks to the following:
• Olof Lindahl, my tutor who has become a close friend. You have providedme with excellent guidance in the world of research and in the tricky worldoutside of science. In spite of your busy schedule you have always hadtime for me and our research project. Your experience and extensiveknowledge in biomedical engineering and your crystal clear values of rightand wrong in research have made my work easy and have taught me a lot.We had fun and it was just the start.
• Tomas Bäcklund, your vast knowledge in electronics, mechanics andbiomedical engineering, together with your superb practical commonsense, have been invaluable for this work. I will remember our discussions,teamwork and comradeship in the lab as one of the best parts of my PhD-student time.
• Stefan Karlsson, for uncompromised support of me and my work, and thewhole R&D group at Biomedical Engineering and Informatics, for creatinga stimulating, creative, competent and yet very friendly environment forresearch work. I would especially like to thank: Per Hallberg for hisdedicated work with the last stage of the ARS development, my FEM co-workers, Leif Nyström and Daniel Rönnbäck, Urban Wiklund for usefuldiscussions, and Nina Andersson for valuable comments and forenthusiastically keeping the pace on the hydrocephalus research.
• Christina Lindén, co-writer and ophthalmology coach, for believing in myideas and for inspiring discussions.
• My Japanese friends: with Sadao Omata, who developed the resonatorsensor technique, invited me to Koriyama, and taught me its fundamentals;Tim Miller and the rest of the people at Axiom who have all contributed tomaking this research project very special. The hospitality my family and Imet when we visited Japan was fantastic.
• Co-authors, Anders Bergh and Britt Andersson, for fruitful discussions andvaluable advice.
• Michael Hansson, for skilful assistance in the clinical study and for usefuldiscussions.

68
• Waldemar Nyström, for support without pressure.
• Marcus Nääs, for adding new angles into the development work.
• Present head of the Biomedical Engineering and Informatics department,Ronnie Lundström, and former head, Björn-Erik Erlandson, for providingme with resources and support for my research work.
• Jan Malm, although not directly involved in this research project, is worthyof a special thanks; you have been a mentor for me, introduced me toclinical research and continuously given me encouragement.
• NUTEK, VINNOVA, Objective 1 Norra Norrland - EU structural fund,Axiom Co Ltd and BioResonator AB for financial support.
• Britt-Mari Moström, mother-in-law, for your support during the hecticperiod when I was writing this manuscript.
• Mother and Father for always believing in my ideas and me.
• Finally and most importantly, I wish to thank my family, Maria, Anton andSanna, for love and support, for putting up with early mornings and latenights, for helping me organize when the tasks were many and the timewas limited, and for reminding me that there are other qualities in life thanwork and research.