RESIDENTIAL MARKET REPORT93ec74f88a4824b49de8-07809ee63e6a913f552d5f1c181b2439.r1.cf…Residential...
56
# P: 718-715-1758 www.PropertyShark.com [email protected] BROOKLYN RESIDENTIAL MARKET REPORT June 2016
Transcript of RESIDENTIAL MARKET REPORT93ec74f88a4824b49de8-07809ee63e6a913f552d5f1c181b2439.r1.cf…Residential...

#
P: 718-715-1758
www.PropertyShark.com
BROOKLYNRESIDENTIAL MARKET REPORT
June 2016
Residential Market Report Overview

Residential Market Report Overview
The Brooklyn Market Report is organized in six distinct sections and it is designed as a guide to the
borough’s residential market. The report includes key market stats, the most up-to-date monthly sales
data, and charts that give a clear picture of current market conditions.
The first section - Residential Market Overview - shows the borough’s median sale price per property and
per square foot, together with trends and changes over the past year. The second section informs on the
borough’s most expensive sales for each residential property type included: single-family homes, condo
and co-op units.
Then, the last four sections of the report take a closer look at Brooklyn’s neighborhoods: informative sales
maps are complemented by a section dedicated to the borough’s most expensive neighborhoods ranked
by median sales price per square foot. Each Brooklyn neighborhood has a dedicated one-page snapshot,
which includes a short description of the neighborhood’s profile, plus useful sales stats: median sale price,
median sale price per square foot, number of transactions and a breakdown by type of residential
properties sold.
Table of Contents
123456
Residential Market Overview
Top 10 Residential Sales
Map of Neighborhoods
Top Neighborhoods
Sales Maps
Stats by Neighborhood
P: 718-715-1758
www.PropertyShark.com
Residential Market Overview

P: 718-715-1758 www.PropertyShark.com [email protected]
Coop
Condo
Single family
0% YoY
No. of Transactions
-2% YoY
Median Price/Sq.ft.
9% YoY
Median Sale Price
Residential Market Overview
Brooklyn, June 2016
$620K $614 758
$455
$
$100
$200
$300
$400
$500Median price/sq.ft.
180$672K
0
50
100
150
200
250
0
$200K
$400K
$600K
$800KMedian price / No. of Transactions
$980
$$200$400$600$800
$1,000$1,200
Median price/sq.ft.328
$743K
0
100
200
300
400
$550K
$600K
$650K
$700K
$750K
$800KMedian price / No. of Transactions
$631
$
$200
$400
$600
$800Median price/sq.ft.
250
$400K
050100150200250300
0
$100K
$200K
$300K
$400K
$500KMedian price / No. of Transactions
1
Top 10 Residential Sales

P: 718-715-1758 www.PropertyShark.com [email protected]
Prospect Heights
10 19 Sterling Pl #2R $1,350,000 14-Jun-16 - - Park Slope
9 34 Plaza St E #307 $1,399,000 30-Jun-16 - -
Brooklyn Heights
8 420 12 St #B2 $1,600,000 20-Jun-16 - - Park Slope
7 21 Monroe Pl #1 $1,625,000 29-Jun-16 1,300 $1,250
Downtown Brooklyn
6 47 Plaza St W #5B $1,685,000 29-Jun-16 1,600 $1,053 Park Slope
5 99 Clinton St #4 $1,781,505 03-Jun-16 1,547 $1,152
Prospect Heights
4 25 Garden Pl #3 $1,825,000 28-Jun-16 1,356 $1,346 Brooklyn Heights
3 135 Eastern Pkwy #14A $1,825,000 09-Jun-16 - -
Brooklyn Heights
2 374 Clinton St #2 $1,925,000 02-Jun-16 - - Carroll Gardens
1 2 Grace Ct #2Y $2,185,150 29-Jun-16 - -
Brooklyn Heights
# Address Sale Price Sale Date Sq.ft. Price/Sq.ft. Neighborhood
10 322 Hicks Street #PH $2,395,000 24-Jun-16 1,602 $1,495
Gravesend
9 440 Kent Avenue #22A $2,457,000 10-Jun-16 1,790 $1,373 Williamsburg
8 400 Avenue U #PH6D $2,650,000 21-Jun-16 2,240 $1,183
Prospect Heights
7 9 College Place #3E $2,700,000 09-Jun-16 1,404 $1,923 Brooklyn Heights
6 1 Grand Army Plaza #7G $2,825,000 02-Jun-16 2,108 $1,340
Williamsburg
5 210 Pacific Street #3E $3,006,027 03-Jun-16 - - Boerum Hill
4 2 Northside Piers #16K $3,250,000 13-Jun-16 1,810 $1,796
Cobble Hill
3 365 Bridge Street #26B $3,385,000 14-Jun-16 2,761 $1,226 Downtown Brooklyn
2 229 De Graw Street #1 $4,320,000 27-Jun-16 4,386 $985
Neighborhood
1 72 Poplar Street #TH $7,102,294 14-Jun-16 4,445 $1,598 Brooklyn Heights
# Address Sale Price Sale Date Sq.ft. Price/Sq.ft.
Fort Greene
10 25 Clermont Ave $2,013,204 24-Jun-16 2,295 $877 Fort Greene
9 31 Clermont Ave $2,014,099 30-Jun-16 2,295 $878
Fort Greene
8 459 Rugby Rd $2,075,000 29-Jun-16 2,104 $986 Ditmas Park
7 21 Clermont Ave $2,110,500 29-Jun-16 2,295 $920
Bedford-Stuyvesant
6 57 Midwood St $2,250,000 20-Jun-16 3,848 $585 Prospect - Lefferts Gardens
5 164 Mac Donough St $2,500,000 21-Jun-16 2,628 $951
Midwood
4 363 5 St $2,750,000 23-Jun-16 2,690 $1,022 Park Slope
3 954 Ocean Pkwy $3,400,000 24-Jun-16 2,352 $1,446
Boerum Hill
2 190 State St $3,900,000 09-Jun-16 2,280 $1,711 Downtown Brooklyn
1 243 Dean St $4,900,000 09-Jun-16 3,360 $1,458
# Address Sale Price Sale Date Sq.ft. Price/Sq.ft. Neighborhood
Coop
Condo
Single family
Top 10 Residential Sales
Brooklyn, June 2016
2
Map of Neighborhoods

P: 718-715-1758 www.PropertyShark.com [email protected]
Map of Neighborhoods
Brooklyn, June 2016
3
Top Neighborhoods

P: 718-715-1758 www.PropertyShark.com [email protected]
- $905,000
40 Gerritsen Beach $347 $379,000 15 - $175,500 $395,000
39 Mill Basin $373 $905,000 8 -
$122,000 $376,000
38 Farragut $382 $479,000 6 - $152,500 $510,000
37 Flatlands $387 $319,000 12 -
$163,000 $480,000
36 Old Mill Basin $391 $500,000 7 - - $500,000
35 Wingate $395 $460,000 4 $520,000
$145,000 $622,500
34 Sheepshead Bay $425 $341,000 38 $535,475 $180,000 $720,000
33 Marine Park $454 $620,000 19 -
$250,000 $775,000
32 Bensonhurst $471 $670,000 8 $650,000 - $870,000
31 Bay Ridge $512 $458,000 15 $520,000
$257,000 $750,500
30 Midwood $521 $481,558 38 $641,498 $304,000 $1,148,250
29 Gravesend $523 $384,306 23 $460,010
$199,000 $540,000
28 Kensington $542 $462,000 16 $660,000 $450,000 $889,500
27 Brighton Beach $550 $400,000 21 $555,000
$70,000 $1,375,000
26 Flatbush $553 $595,676 7 $595,676 $567,000 $1,150,000
25 Crown Heights $557 $702,500 16 $621,000
- $872,000
24 Fort Hamilton $563 $415,000 12 $745,000 $222,005 $979,500
23 Dyker Heights $580 $724,200 10 $570,000
$375,000 $2,000,000
22 Ditmas Park $581 $490,000 9 - $465,000 $2,075,000
21 Prospect Park South $591 $410,000 6 $466,000
- $1,337,000
20 Borough Park $609 $665,500 11 $625,000 $348,000 $995,000
19 Bedford-Stuyvesant $614 $684,500 27 $675,000
- $1,750,000
18 Bath Beach $644 $481,350 9 $743,323 $267,500 $790,000
17 Prospect - Lefferts Gardens $673 $1,750,000 3 -
$402,424 -
16 Windsor Terrace $694 $722,500 9 $850,000 $590,000 $1,400,000
15 Sunset Park $732 $450,000 8 $500,000
$500,000 -
14 Bushwick $855 $998,500 6 $786,750 - $2,000,000
13 Cobble Hill $884 $680,000 9 $1,150,623
- -
12 Clinton Hill $948 $735,000 18 $865,513 $647,500 -
11 Columbia Street Waterfront District $997 $961,681 4 $961,681
$399,000 $2,013,651
10 Greenpoint $1,010 $927,500 8 $828,750 - $1,526,000
9 Fort Greene $1,016 $489,967 34 $455,224
$500,000 $3,900,000
8 Carroll Gardens $1,058 $925,000 6 $925,000 $1,252,500 -
7 Downtown Brooklyn $1,078 $944,000 36 $1,029,500
$810,000 -
6 Gowanus $1,103 $1,065,000 6 $1,180,000 $725,000 -
5 Prospect Heights $1,106 $825,000 32 $870,713
$295,000 $1,152,500
4 Park Slope $1,118 $955,000 59 $1,035,000 $840,000 $2,237,500
3 Williamsburg $1,122 $781,500 70 $781,500
- -
2 Brooklyn Heights $1,346 $773,000 31 $2,395,000 $725,000 -
1 DUMBO $1,379 $1,412,500 8 $1,412,500
# NeighborhoodMedian
price/sq.ft.
Median sale
price
No. of
sales
Median sale price
Condo Coop Single family
Top Neighborhoods
Brooklyn, June 2016
This is a ranking of Brooklyn neighborhoods based on median sale price per sq.ft.
Only neighborhoods with a minimum of 3 property sales where square footage is available were considered.
4
Sales Maps

P: 718-715-1758 www.PropertyShark.com [email protected]
The map displays Price per sq.ft. for properties
sold in the last 5 years.
Price / Sq.ft.
The map displays the median sale price
changes in the last 10 years. The analysis is
based only on residential sales.
Home Price Changes by
Neighborhood
Sales Maps
Brooklyn, June 2016
5

P: 718-715-1758 www.PropertyShark.com [email protected]
Houses $790,000 9% $813 66% 1
Coops $267,500 7% - - 4
Condos $743,323 49% $613 14% 3
Bath BeachBrooklyn, June 2016
Property Type Median sale price Y-o-Y Median sale price/sqft Y-o-Y Transactions
Type of Properties Sold
-18% YoY
Number of Transactions
26% YoY
Median Sale Price per Sq.ft.
44% YoY
Median Sale Price
Served by five different subway stations on the D, Bath Beach is a
community with good transportation options. Mostly made up of small
apartment homes and semi-attached houses, the streets are lined with
both mom-and-pop storefronts and chain stores. Caesar’s Bay Shopping
Center is as popular as the locally owned fruit and vegetable stands.
$481K
$
$200K
$400K
$600K
$800KMedian Sale Price
$481K
$644
$
$200
$400
$600
$800
Jan-1
4
Feb
-14
Mar-
14
Ap
r-14
May-
14
Jun-1
4
Jul-
14
Aug
-14
Sep
-14
Oct
-14
No
v-14
Dec-
14
Jan-1
5
Feb
-15
Mar-
15
Ap
r-15
Jun-1
5
Jul-
15
Aug
-15
Sep
-15
Oct
-15
No
v-15
Dec-
15
Jan-1
6
Feb
-16
Mar-
16
Ap
r-16
May-
16
Jun-1
6
Median Sale Price per Sq.ft.
$644
9
0
5
10
15
Jan-1
4
Feb
-14
Mar-
14
Ap
r-14
May-
14
Jun-1
4
Jul-
14
Aug
-14
Sep
-14
Oct
-14
No
v-14
Dec-
14
Jan-1
5
Feb
-15
Mar-
15
Ap
r-15
May-
15
Jun-1
5
Jul-
15
Aug
-15
Sep
-15
Oct
-15
No
v-15
Dec-
15
Jan-1
6
Feb
-16
Mar-
16
Ap
r-16
May-
16
Jun-1
6Number of Transactions
9
6

P: 718-715-1758 www.PropertyShark.com [email protected]
Houses $775,000 -24% $613 -2% 6
Coops $250,000 6% $435 11% 8
Transactions
Condos $520,000 - $472 - 1
Bay RidgeBrooklyn, June 2016
Property Type Median sale price Y-o-Y Median sale price/sqft Y-o-Y
Type of Properties Sold
-32% YoY
Number of Transactions
6% YoY
Median Sale Price per Sq.ft.
83% YoY
Median Sale Price
Located at the southwest corner of Brooklyn, Bay Ridge is a middle-class
neighborhood with plenty of housing and retail and restaurant options.
The main commercial strips are along 3rd and 5th avenues and the
neighborhood was named the 12th most livable neighborhood in NYC
by New York Magazine. Landmarks include the 69th Street Pier and Owl’s
Head Park.
$458K
$
$200K
$400K
$600K
$800KMedian Sale Price
$458K
$512
$
$200
$400
$600
$800Median Sale Price per Sq.ft.
$512
15
0
10
20
30
40
Jan-1
4
Feb
-14
Mar-
14
Ap
r-14
May-
14
Jun-1
4
Jul-
14
Aug
-14
Sep
-14
Oct
-14
No
v-14
Dec-
14
Jan-1
5
Feb
-15
Mar-
15
Ap
r-15
May-
15
Jun-1
5
Jul-
15
Aug
-15
Sep
-15
Oct
-15
No
v-15
Dec-
15
Jan-1
6
Feb
-16
Mar-
16
Ap
r-16
May-
16
Jun-1
6Number of Transactions
15
7

P: 718-715-1758 www.PropertyShark.com [email protected]
Houses $1,337,000 160% $614 150% 6
Coops - - - - 0
Transactions
Condos $675,000 0% $640 -4% 21
Bedford-StuyvesantBrooklyn, June 2016
Property Type Median sale price Y-o-Y Median sale price/sqft Y-o-Y
Type of Properties Sold
-18% YoY
Number of Transactions
2% YoY
Median Sale Price per Sq.ft.
1% YoY
Median Sale Price
Also known as Bed-Stuy, this centrally located neighborhood is just next
door to hip Williamsburg but has plenty to set itself apart: impeccable
brownstones, unique storefronts, and a tight-knit community that
supports improvements to bring in more locally owned businesses.
Public transportation includes half a dozen subway and bus lines.
$685K
$
$200K
$400K
$600K
$800K
$1.0MMedian Sale Price
$685K
$614
$
$200
$400
$600
$800
$1,000Median Sale Price per Sq.ft.
$614
27
0
10
20
30
40
50
Jan-1
4
Feb
-14
Mar-
14
Ap
r-14
May-
14
Jun-1
4
Jul-
14
Aug
-14
Sep
-14
Oct
-14
No
v-14
Dec-
14
Jan-1
5
Feb
-15
Mar-
15
Ap
r-15
May-
15
Jun-1
5
Jul-
15
Aug
-15
Sep
-15
Oct
-15
No
v-15
Dec-
15
Jan-1
6
Feb
-16
Mar-
16
Ap
r-16
May-
16
Jun-1
6Number of Transactions
27
8

P: 718-715-1758 www.PropertyShark.com [email protected]
Houses $870,000 34% $420 -26% 4
Coops - - - - 0
Transactions
Condos $650,000 38% $609 -4% 3
BensonhurstBrooklyn, June 2016
Property Type Median sale price Y-o-Y Median sale price/sqft Y-o-Y
Type of Properties Sold
167% YoY
Number of Transactions
-21% YoY
Median Sale Price per Sq.ft.
41% YoY
Median Sale Price
Home to both Little Italy and Brooklyn’s second Chinatown, Bensonhurst
is rich in diversity. New Yorkers love this neighborhood’s friendly
atmosphere, numerous shopping options, and quick and easy access to
public transportation.
$670K
$
$200K
$400K
$600K
$800K
$1.0MMedian Sale Price
$670K
$471
$
$200
$400
$600
$800Median Sale Price per Sq.ft.
$471
8
0
5
10
15
20
Jan-1
4
Feb
-14
Mar-
14
Ap
r-14
May-
14
Jun-1
4
Jul-
14
Aug
-14
Sep
-14
Oct
-14
No
v-14
Dec-
14
Jan-1
5
Feb
-15
Mar-
15
Ap
r-15
May-
15
Jun-1
5
Jul-
15
Aug
-15
Sep
-15
Oct
-15
No
v-15
Dec-
15
Jan-1
6
Feb
-16
Mar-
16
Ap
r-16
May-
16
Jun-1
6Number of Transactions
8
9

P: 718-715-1758 www.PropertyShark.com [email protected]
Houses $995,000 29% $716 74% 3
Coops $348,000 - - - 1
Transactions
Condos $625,000 0% $577 51% 7
Borough ParkBrooklyn, June 2016
Property Type Median sale price Y-o-Y Median sale price/sqft Y-o-Y
Type of Properties Sold
-15% YoY
Number of Transactions
59% YoY
Median Sale Price per Sq.ft.
6% YoY
Median Sale Price
Borough Park covers just 200 blocks yet it’s one of the most densely
populated areas in Brooklyn. The population is just under 200,000 and
housing is primarily low-rise multifamily homes. Rarer options include
classic apartment complexes and high-end gated communities. Public
transportation options abound in this neighborhood.
$666K
$
$200K
$400K
$600K
$800K
$1.0MMedian Sale Price
$666K
$609
$
$200
$400
$600
$800Median Sale Price per Sq.ft.
$609
11
0
10
20
30
40
Jan-1
4
Feb
-14
Mar-
14
Ap
r-14
May-
14
Jun-1
4
Jul-
14
Aug
-14
Sep
-14
Oct
-14
No
v-14
Dec-
14
Jan-1
5
Feb
-15
Mar-
15
Ap
r-15
May-
15
Jun-1
5
Jul-
15
Aug
-15
Sep
-15
Oct
-15
No
v-15
Dec-
15
Jan-1
6
Feb
-16
Mar-
16
Ap
r-16
May-
16
Jun-1
6Number of Transactions
11
10

P: 718-715-1758 www.PropertyShark.com [email protected]
Houses $540,000 - $584 - 3
Coops $199,000 -3% - - 12
Transactions
Condos $555,000 -9% $516 -27% 6
Brighton BeachBrooklyn, June 2016
Property Type Median sale price Y-o-Y Median sale price/sqft Y-o-Y
Type of Properties Sold
-5% YoY
Number of Transactions
-22% YoY
Median Sale Price per Sq.ft.
-24% YoY
Median Sale Price
Located in Southern Brooklyn, Brighton Beach is an Oceanside
neighborhood next to Coney Island and Manhattan Beach. It’s served by
the B and Q trains along with several local buses. There’s plenty to do in
the neighborhood and both Coney Island and Manhattan Beach are
close by. Housing options include both single-family and multi-family
homes.
$400K
$
$200K
$400K
$600K
$800KMedian Sale Price
$400K
$550
$
$200
$400
$600
$800
$1,000Median Sale Price per Sq.ft.
$550
21
05
1015202530
Jan-1
4
Feb
-14
Mar-
14
Ap
r-14
May-
14
Jun-1
4
Jul-
14
Aug
-14
Sep
-14
Oct
-14
No
v-14
Dec-
14
Jan-1
5
Feb
-15
Mar-
15
Ap
r-15
May-
15
Jun-1
5
Jul-
15
Aug
-15
Sep
-15
Oct
-15
No
v-15
Dec-
15
Jan-1
6
Feb
-16
Mar-
16
Ap
r-16
May-
16
Jun-1
6Number of Transactions
21
11

P: 718-715-1758 www.PropertyShark.com [email protected]
Houses - - - - 0
Coops $725,000 -9% $1,171 20% 26
Transactions
Condos $2,395,000 197% $1,495 37% 6
Brooklyn HeightsBrooklyn, June 2016
Property Type Median sale price Y-o-Y Median sale price/sqft Y-o-Y
Type of Properties Sold
29% YoY
Number of Transactions
29% YoY
Median Sale Price per Sq.ft.
-3% YoY
Median Sale Price
Buyers searching for beautiful homes, tree-lined streets, panoramic views
of the Manhattan skyline, and housing options ranging from row houses
to 19th-century mansions flock to Brooklyn Heights. It’s widely
considered to be one of the most elegant neighborhoods in Brooklyn.
$773K
$
$500K
$1.0M
$1.5MMedian Sale Price
$773K
$1,346
$
$500
$1,000
$1,500Median Sale Price per Sq.ft.
$1,346
31
0
10
20
30
40
Jan-1
4
Feb
-14
Mar-
14
Ap
r-14
May-
14
Jun-1
4
Jul-
14
Aug
-14
Sep
-14
Oct
-14
No
v-14
Dec-
14
Jan-1
5
Feb
-15
Mar-
15
Ap
r-15
May-
15
Jun-1
5
Jul-
15
Aug
-15
Sep
-15
Oct
-15
No
v-15
Dec-
15
Jan-1
6
Feb
-16
Mar-
16
Ap
r-16
May-
16
Jun-1
6Number of Transactions
31
12

P: 718-715-1758 www.PropertyShark.com [email protected]
Houses $2,000,000 285% $601 56% 1
Coops - - - - 0
Transactions
Condos $786,750 43% $917 28% 4
BushwickBrooklyn, June 2016
Property Type Median sale price Y-o-Y Median sale price/sqft Y-o-Y
Type of Properties Sold
-33% YoY
Number of Transactions
23% YoY
Median Sale Price per Sq.ft.
82% YoY
Median Sale Price
Known as a haven for creative professionals, Bushwick is a trendy
neighborhood with a wealth of bodegas, gallery spaces, bars, and
eateries. Virtually every type of housing can be found here, including
recently converted loft spaces. More than 90% of homes are within a
quarter mile of a park and 97% are within a half mile of a subway station.
$999K
$ $200K $400K $600K $800K $1.0M $1.2M
Median Sale Price
$999K
$855
$
$200
$400
$600
$800
$1,000
Jan-1
4
Feb
-14
Mar-
14
Ap
r-14
May-
14
Jun-1
4
Jul-
14
Aug
-14
Sep
-14
Oct
-14
No
v-14
Dec-
14
Jan-1
5
Feb
-15
Mar-
15
Ap
r-15
May-
15
Jun-1
5
Jul-
15
Aug
-15
Sep
-15
Oct
-15
No
v-15
Dec-
15
Jan-1
6
Mar-
16
Ap
r-16
May-
16
Jun-1
6
Median Sale Price per Sq.ft.
$855
6
0
5
10
15
20
Jan-1
4
Feb
-14
Mar-
14
Ap
r-14
May-
14
Jun-1
4
Jul-
14
Aug
-14
Sep
-14
Oct
-14
No
v-14
Dec-
14
Jan-1
5
Feb
-15
Mar-
15
Ap
r-15
May-
15
Jun-1
5
Jul-
15
Aug
-15
Sep
-15
Oct
-15
No
v-15
Dec-
15
Jan-1
6
Feb
-16
Mar-
16
Ap
r-16
May-
16
Jun-1
6Number of Transactions
6
13
P: 718-715-1758 www.PropertyShark.com [email protected]
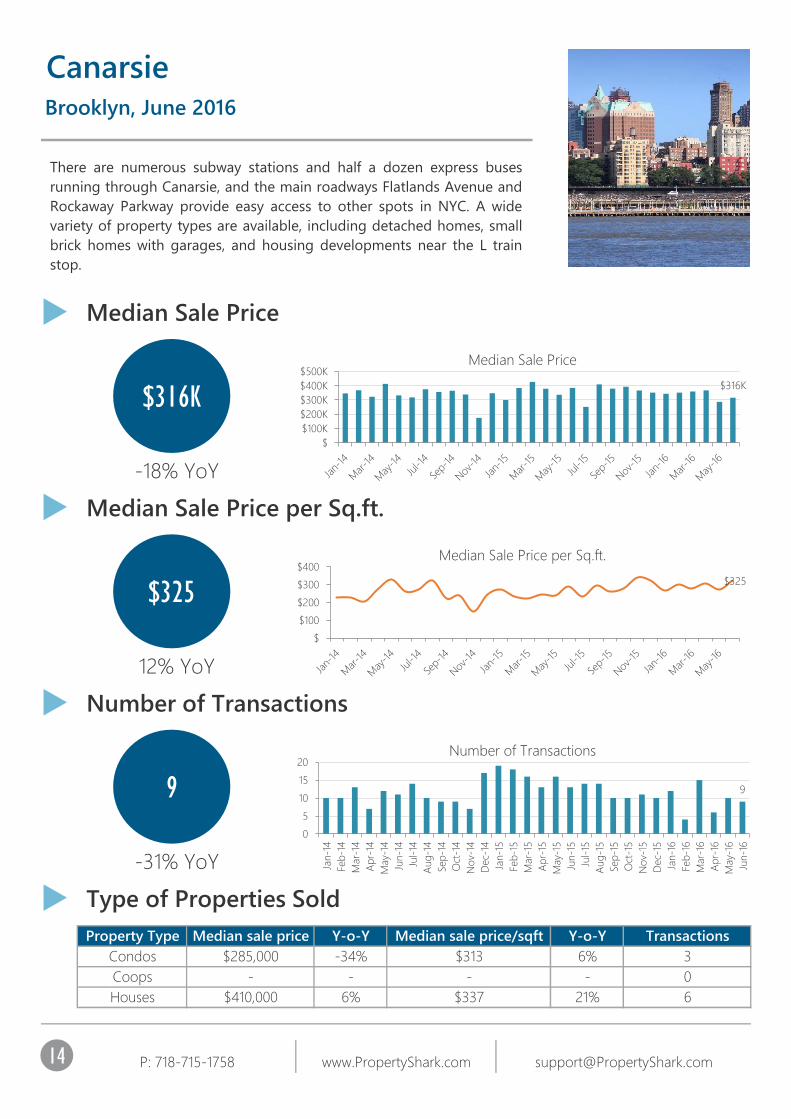
Houses $410,000 6% $337 21% 6
Coops - - - - 0
Transactions
Condos $285,000 -34% $313 6% 3
CanarsieBrooklyn, June 2016
Property Type Median sale price Y-o-Y Median sale price/sqft Y-o-Y
Type of Properties Sold
-31% YoY
Number of Transactions
12% YoY
Median Sale Price per Sq.ft.
-18% YoY
Median Sale Price
There are numerous subway stations and half a dozen express buses
running through Canarsie, and the main roadways Flatlands Avenue and
Rockaway Parkway provide easy access to other spots in NYC. A wide
variety of property types are available, including detached homes, small
brick homes with garages, and housing developments near the L train
stop.
$316K
$
$100K
$200K
$300K
$400K
$500KMedian Sale Price
$316K
$325
$
$100
$200
$300
$400Median Sale Price per Sq.ft.
$325
9
0
5
10
15
20
Jan-1
4
Feb
-14
Mar-
14
Ap
r-14
May-
14
Jun-1
4
Jul-
14
Aug
-14
Sep
-14
Oct
-14
No
v-14
Dec-
14
Jan-1
5
Feb
-15
Mar-
15
Ap
r-15
May-
15
Jun-1
5
Jul-
15
Aug
-15
Sep
-15
Oct
-15
No
v-15
Dec-
15
Jan-1
6
Feb
-16
Mar-
16
Ap
r-16
May-
16
Jun-1
6Number of Transactions
9
14

P: 718-715-1758 www.PropertyShark.com [email protected]
Houses - - - - 0
Coops $1,252,500 8% - - 2
Transactions
Condos $925,000 -33% $1,058 4% 3
Carroll GardensBrooklyn, June 2016
Property Type Median sale price Y-o-Y Median sale price/sqft Y-o-Y
Type of Properties Sold
20% YoY
Number of Transactions
0% YoY
Median Sale Price per Sq.ft.
-24% YoY
Median Sale Price
Carroll Gardens seems to have it all: tranquil but with plenty of nightlife.
Hip bars and boutiques line the streets yet it’s still hung on to its old-
NYC charm. Tree-lined sidewalks pave the way to local retailers, tasty
Italian restaurants and coffee shops galore. Transportation options
include F and G subway trains as well as several express buses.
$925K
$
$500K
$1.0M
$1.5M
$2.0M
$2.5MMedian Sale Price
$925K
$1,058
$
$500
$1,000
$1,500Median Sale Price per Sq.ft.
$1,058
6
02468
1012
Jan-1
4
Feb
-14
Mar-
14
Ap
r-14
May-
14
Jun-1
4
Jul-
14
Aug
-14
Sep
-14
Oct
-14
No
v-14
Dec-
14
Jan-1
5
Feb
-15
Mar-
15
Ap
r-15
May-
15
Jun-1
5
Jul-
15
Aug
-15
Sep
-15
Oct
-15
No
v-15
Dec-
15
Jan-1
6
Feb
-16
Mar-
16
Ap
r-16
May-
16
Jun-1
6Number of Transactions
6
15

P: 718-715-1758 www.PropertyShark.com [email protected]
Houses - - - - 0
Coops $647,500 13% $788 4% 9
Transactions
Condos $865,513 21% $1,008 8% 9
Clinton HillBrooklyn, June 2016
Property Type Median sale price Y-o-Y Median sale price/sqft Y-o-Y
Type of Properties Sold
38% YoY
Number of Transactions
9% YoY
Median Sale Price per Sq.ft.
6% YoY
Median Sale Price
Variety is the name of the game in residential Clinton Hill, which features
19th-century homes, converted lofts, Victorian row houses, and one and
two-bedroom homes. Many architectural styles are represented, several
bus lines run through the neighborhood, and both the C and G subways
have stations here. Walking and biking are a dream on the wide tree-
lined streets.
$735K
$
$200K
$400K
$600K
$800K
$1.0MMedian Sale Price
$735K
$948
$
$200
$400
$600
$800
$1,000Median Sale Price per Sq.ft.
$948
18
0
10
20
30
40
Jan-1
4
Feb
-14
Mar-
14
Ap
r-14
May-
14
Jun-1
4
Jul-
14
Aug
-14
Sep
-14
Oct
-14
No
v-14
Dec-
14
Jan-1
5
Feb
-15
Mar-
15
Ap
r-15
May-
15
Jun-1
5
Jul-
15
Aug
-15
Sep
-15
Oct
-15
No
v-15
Dec-
15
Jan-1
6
Feb
-16
Mar-
16
Ap
r-16
May-
16
Jun-1
6Number of Transactions
18
16

P: 718-715-1758 www.PropertyShark.com [email protected]
Houses - - - - 0
Coops $500,000 -47% $833 -27% 3
Transactions
Condos $1,150,623 -10% $934 2% 6
Cobble HillBrooklyn, June 2016
Property Type Median sale price Y-o-Y Median sale price/sqft Y-o-Y
Type of Properties Sold
-31% YoY
Number of Transactions
-15% YoY
Median Sale Price per Sq.ft.
-42% YoY
Median Sale Price
For buyers searching for the picturesque New York City setting Cobble
Hill is a top choice. There you’ll find plenty of corner cafes, unique
cinemas, and fire escapes and stoops perfect for people watching. The
streets are lined with classic mom and pop shops, meat markets, and
boutiques. Both trendy and hip this is a popular, growing neighborhood.
$680K
$
$1.0M
$2.0M
$3.0M
$4.0M
$5.0MMedian Sale Price
$680K
$884
$
$500
$1,000
$1,500Median Sale Price per Sq.ft.
$884
9
0
5
10
15
20
Jan-1
4
Feb
-14
Mar-
14
Ap
r-14
May-
14
Jun-1
4
Jul-
14
Aug
-14
Sep
-14
Oct
-14
No
v-14
Dec-
14
Jan-1
5
Feb
-15
Mar-
15
Ap
r-15
May-
15
Jun-1
5
Jul-
15
Aug
-15
Sep
-15
Oct
-15
No
v-15
Dec-
15
Jan-1
6
Feb
-16
Mar-
16
Ap
r-16
May-
16
Jun-1
6Number of Transactions
9
17

P: 718-715-1758 www.PropertyShark.com [email protected]
Houses - - - - 0
Coops - - - - 0
Transactions
Condos $961,681 89% $997 -70% 4
Columbia Street Waterfront DistrictBrooklyn, June 2016
Property Type Median sale price Y-o-Y Median sale price/sqft Y-o-Y
Type of Properties Sold
300% YoY
Number of Transactions
-70% YoY
Median Sale Price per Sq.ft.
89% YoY
Median Sale Price
The Columbia Street Waterfront District is one of the smallest
neighborhoods in Brooklyn. Residents are pushing for ferry service to
Manhattan from this up-and-coming area, which is home to trendy
eateries, independent stores, live poultry markets, and old manufacturing
buildings being converted to residential buildings.
$962K
$
$500K
$1.0M
$1.5M
$2.0M
Jan-1
4
Feb
-14
Mar-
14
Ap
r-14
May-
14
Jun-1
4
Jul-
14
Aug
-14
Sep
-14
Oct
-14
No
v-14
Dec-
14
Jan-1
5
Feb
-15
Mar-
15
Ap
r-15
May-
15
Jun-1
5
Jul-
15
Aug
-15
Sep
-15
Oct
-15
No
v-15
Dec-
15
Jan-1
6
Feb
-16
Ap
r-16
May-
16
Jun-1
6
Median Sale Price
$962K
$997
$
$1,000
$2,000
$3,000
$4,000
Jan-1
4
Feb
-14
Mar-
14
Ap
r-14
May-
14
Jun-1
4
Jul-
14
Aug
-14
Sep
-14
Oct
-14
No
v-14
Dec-
14
Jan-1
5
Feb
-15
Ap
r-15
May-
15
Jun-1
5
Jul-
15
Aug
-15
No
v-15
Dec-
15
Jan-1
6
Feb
-16
Ap
r-16
May-
16
Jun-1
6
Median Sale Price per Sq.ft.
$997
4
0
2
4
6
8
10
Jan-1
4
Feb
-14
Mar-
14
Ap
r-14
May-
14
Jun-1
4
Jul-
14
Aug
-14
Sep
-14
Oct
-14
No
v-14
Dec-
14
Jan-1
5
Feb
-15
Mar-
15
Ap
r-15
May-
15
Jun-1
5
Jul-
15
Aug
-15
Sep
-15
Oct
-15
No
v-15
Dec-
15
Jan-1
6
Feb
-16
Ap
r-16
May-
16
Jun-1
6Number of Transactions
4
18

P: 718-715-1758 www.PropertyShark.com [email protected]
Houses $313,375 -26% $241 -19% 2
Coops $340,000 20% $341 - 9
Transactions
Condos - - - - 0
Coney IslandBrooklyn, June 2016
Property Type Median sale price Y-o-Y Median sale price/sqft Y-o-Y
Type of Properties Sold
10% YoY
Number of Transactions
5% YoY
Median Sale Price per Sq.ft.
-17% YoY
Median Sale Price
Real estate in Coney Island is an almost even split between renters and
owners and includes everything from small studio apartments to four
bedroom townhomes. Most homes in the area were built between 1970
and 1990. Thousands of people visit Coney Island every day to see the
world-famous boardwalk.
$340K
$
$100K
$200K
$300K
$400K
$500KMedian Sale Price
$340K
$341
$$100$200$300$400$500$600
Feb
-14
Mar-
14
May-
14
Jun-1
4
Jul-
14
Aug
-14
Sep
-14
Oct
-14
No
v-14
Dec-
14
Jan-1
5
Feb
-15
Mar-
15
Ap
r-15
May-
15
Jun-1
5
Jul-
15
Aug
-15
Sep
-15
Oct
-15
No
v-15
Dec-
15
Jan-1
6
Feb
-16
Mar-
16
Ap
r-16
May-
16
Jun-1
6
Median Sale Price per Sq.ft.
$341
11
0
5
10
15
20
25
Jan-1
4
Feb
-14
Mar-
14
Ap
r-14
May-
14
Jun-1
4
Jul-
14
Aug
-14
Sep
-14
Oct
-14
No
v-14
Dec-
14
Jan-1
5
Feb
-15
Mar-
15
Ap
r-15
May-
15
Jun-1
5
Jul-
15
Aug
-15
Sep
-15
Oct
-15
No
v-15
Dec-
15
Jan-1
6
Feb
-16
Mar-
16
Ap
r-16
May-
16
Jun-1
6Number of Transactions
11
19

P: 718-715-1758 www.PropertyShark.com [email protected]
Houses $1,375,000 293% $496 90% 3
Coops $70,000 -79% $775 262% 3
Transactions
Condos $621,000 -16% $637 -8% 9
Crown HeightsBrooklyn, June 2016
Property Type Median sale price Y-o-Y Median sale price/sqft Y-o-Y
Type of Properties Sold
100% YoY
Number of Transactions
-14% YoY
Median Sale Price per Sq.ft.
50% YoY
Median Sale Price
Home to hugely popular street carnivals and several beloved museums,
Crown Heights has vastly different homes from street to street. The
neighborhood has four designated historic districts and easy access to
some of the trendier, more expensive Brooklyn neighborhoods.
$703K
$ $200K $400K $600K $800K $1.0M $1.2M
Median Sale Price
$703K
$557
$
$200
$400
$600
$800
$1,000Median Sale Price per Sq.ft.
$557
16
0
20
40
60
80
Jan-1
4
Feb
-14
Mar-
14
Ap
r-14
May-
14
Jun-1
4
Jul-
14
Aug
-14
Sep
-14
Oct
-14
No
v-14
Dec-
14
Jan-1
5
Feb
-15
Mar-
15
Ap
r-15
May-
15
Jun-1
5
Jul-
15
Aug
-15
Sep
-15
Oct
-15
No
v-15
Dec-
15
Jan-1
6
Feb
-16
Mar-
16
Ap
r-16
May-
16
Jun-1
6Number of Transactions
16
20

P: 718-715-1758 www.PropertyShark.com [email protected]
Houses $2,075,000 - $986 - 1
Coops $465,000 11% $578 9% 8
Transactions
Condos - - - - 0
Ditmas ParkBrooklyn, June 2016
Property Type Median sale price Y-o-Y Median sale price/sqft Y-o-Y
Type of Properties Sold
80% YoY
Number of Transactions
9% YoY
Median Sale Price per Sq.ft.
17% YoY
Median Sale Price
Ditmas Park is primarily residential, which leaves residents to head to
nearby Park Slop for their shopping. This neighborhood is perfect for
buyers who want a true community feeling in the middle of Brooklyn.
Cortelyou Road is one of the few commercial areas and has several delis,
coffee houses, bars, a food co-op, and restaurants.
$490K
$ $200K $400K $600K $800K $1.0M $1.2M
Median Sale Price
$490K
$581
$
$200
$400
$600
$800
$1,000
Jan-1
4
Feb
-14
Mar-
14
May-
14
Jun-1
4
Jul-
14
Aug
-14
Sep
-14
Oct
-14
No
v-14
Dec-
14
Jan-1
5
Feb
-15
Mar-
15
Ap
r-15
May-
15
Jun-1
5
Jul-
15
Aug
-15
Sep
-15
Oct
-15
No
v-15
Dec-
15
Jan-1
6
Feb
-16
Mar-
16
Ap
r-16
May-
16
Jun-1
6
Median Sale Price per Sq.ft.
$581
9
02468
1012
Jan-1
4
Feb
-14
Mar-
14
Ap
r-14
May-
14
Jun-1
4
Jul-
14
Aug
-14
Sep
-14
Oct
-14
No
v-14
Dec-
14
Jan-1
5
Feb
-15
Mar-
15
Ap
r-15
May-
15
Jun-1
5
Jul-
15
Aug
-15
Sep
-15
Oct
-15
No
v-15
Dec-
15
Jan-1
6
Feb
-16
Mar-
16
Ap
r-16
May-
16
Jun-1
6Number of Transactions
9
21

P: 718-715-1758 www.PropertyShark.com [email protected]
Houses $3,900,000 - $1,711 - 1
Coops $500,000 -6% $713 -2% 10
Transactions
Condos $1,029,500 2% $1,117 -12% 25
Downtown BrooklynBrooklyn, June 2016
Property Type Median sale price Y-o-Y Median sale price/sqft Y-o-Y
Type of Properties Sold
13% YoY
Number of Transactions
-9% YoY
Median Sale Price per Sq.ft.
23% YoY
Median Sale Price
As the third largest business district in NYC, Downtown Brooklyn may
buzz during the day but it’s relatively quiet at night. A wealth of condos,
apartments, brownstones and townhouses were built within the last
decade and today it’s an eclectic neighborhood and commuter’s dream
with parks, several schools, and many bus lines and subway stations.
$944K
$
$500K
$1.0M
$1.5M
$2.0MMedian Sale Price
$944K
$1,078
$
$500
$1,000
$1,500Median Sale Price per Sq.ft.
$1,078
36
0
10
20
30
40
50
Jan-1
4
Feb
-14
Mar-
14
Ap
r-14
May-
14
Jun-1
4
Jul-
14
Aug
-14
Sep
-14
Oct
-14
No
v-14
Dec-
14
Jan-1
5
Feb
-15
Mar-
15
Ap
r-15
May-
15
Jun-1
5
Jul-
15
Aug
-15
Sep
-15
Oct
-15
No
v-15
Dec-
15
Jan-1
6
Feb
-16
Mar-
16
Ap
r-16
May-
16
Jun-1
6Number of Transactions
36
22

P: 718-715-1758 www.PropertyShark.com [email protected]
Houses - - - - 0
Coops - - - - 0
Transactions
Condos $1,412,500 3% $1,379 11% 8
DUMBOBrooklyn, June 2016
Property Type Median sale price Y-o-Y Median sale price/sqft Y-o-Y
Type of Properties Sold
-27% YoY
Number of Transactions
11% YoY
Median Sale Price per Sq.ft.
-41% YoY
Median Sale Price
The trendy neighborhood of DUMBO is as classy as it is sassy. With a hip
vibe today built on a historic past there’s a mixture of converted
warehouses and vintage loft spaces – some with views of the Brooklyn
Bridge and the Manhattan skyline. Trendy shops, hip bars, and
manicured waterfront spaces can be found throughout this popular
neighborhood.
$1.4M
$ $500K $1.0M $1.5M $2.0M $2.5M $3.0M
Median Sale Price
$1.41M
$1,379
$
$500
$1,000
$1,500Median Sale Price per Sq.ft.
$1,379
8
0
5
10
15
Jan-1
4
Feb
-14
Mar-
14
Ap
r-14
May-
14
Jun-1
4
Jul-
14
Aug
-14
Sep
-14
Oct
-14
No
v-14
Dec-
14
Jan-1
5
Feb
-15
Mar-
15
Ap
r-15
May-
15
Jun-1
5
Jul-
15
Aug
-15
Sep
-15
Oct
-15
No
v-15
Dec-
15
Jan-1
6
Feb
-16
Mar-
16
Ap
r-16
May-
16
Jun-1
6Number of Transactions
8
23

P: 718-715-1758 www.PropertyShark.com [email protected]
Houses $872,000 6% $580 -8% 8
Coops - - - - 0
Transactions
Condos $570,000 10% $473 -23% 2
Dyker HeightsBrooklyn, June 2016
Property Type Median sale price Y-o-Y Median sale price/sqft Y-o-Y
Type of Properties Sold
25% YoY
Number of Transactions
-6% YoY
Median Sale Price per Sq.ft.
-11% YoY
Median Sale Price
Originally a luxury housing development way back in 1895, today Dyker
Heights is most well-known for the over-the-top Christmas lights
displays of its residents. Though it’s not served by the subway it is close
to several neighborhoods that are.
$724K
$
$200K
$400K
$600K
$800K
$1.0MMedian Sale Price
$724K
$580
$
$200
$400
$600
$800Median Sale Price per Sq.ft.
$580
10
0
5
10
15
20
Jan-1
4
Feb
-14
Mar-
14
Ap
r-14
May-
14
Jun-1
4
Jul-
14
Aug
-14
Sep
-14
Oct
-14
No
v-14
Dec-
14
Jan-1
5
Feb
-15
Mar-
15
Ap
r-15
May-
15
Jun-1
5
Jul-
15
Aug
-15
Sep
-15
Oct
-15
No
v-15
Dec-
15
Jan-1
6
Feb
-16
Mar-
16
Ap
r-16
May-
16
Jun-1
6Number of Transactions
10
24

P: 718-715-1758 www.PropertyShark.com [email protected]
Houses $397,520 -10% $278 15% 7
Coops - - - - 0
Transactions
Condos - - - - 0
East FlatbushBrooklyn, June 2016
Property Type Median sale price Y-o-Y Median sale price/sqft Y-o-Y
Type of Properties Sold
-30% YoY
Number of Transactions
15% YoY
Median Sale Price per Sq.ft.
-6% YoY
Median Sale Price
A top choice for renters and buyers who don’t want to pay top dollar for
Brooklyn real estate, this is a primarily residential area with little nightlife.
Three hospitals call East Flatbush home and notable landmarks include
Grand Army Plaza Greenmarket and the oldest house in New York City.
$398K
$
$100K
$200K
$300K
$400K
$500KMedian Sale Price
$398K
$278
$
$100
$200
$300
$400Median Sale Price per Sq.ft.
$278
7
0
5
10
15
20
Jan-1
4
Feb
-14
Mar-
14
Ap
r-14
May-
14
Jun-1
4
Jul-
14
Aug
-14
Sep
-14
Oct
-14
No
v-14
Dec-
14
Jan-1
5
Feb
-15
Mar-
15
Ap
r-15
May-
15
Jun-1
5
Jul-
15
Aug
-15
Sep
-15
Oct
-15
No
v-15
Dec-
15
Jan-1
6
Feb
-16
Mar-
16
Ap
r-16
May-
16
Jun-1
6Number of Transactions
7
25

P: 718-715-1758 www.PropertyShark.com [email protected]
Houses $510,000 176% $382 160% 3
Coops $152,500 -5% - - 2
Transactions
Condos - - - - 0
FarragutBrooklyn, June 2016
Property Type Median sale price Y-o-Y Median sale price/sqft Y-o-Y
Type of Properties Sold
0% YoY
Number of Transactions
160% YoY
Median Sale Price per Sq.ft.
178% YoY
Median Sale Price
A subsection of East Flatbush, Farragut is just 15 miles from Midtown
and directly south of the Holy Cross Cemetery. It offers the epitome of
urban life with a large variety of eateries along Flatbush Avenue. Many
residents own cars but Farragut is an easily walkable neighborhood with
subway stations for the 2 and 5 plus local and express buses.
$479K
$ $100K $200K $300K $400K $500K $600K
Median Sale Price
$479K
$382
$
$100
$200
$300
$400
$500Median Sale Price per Sq.ft.
$382
6
0
2
4
6
8
10
Jan-1
4
Feb
-14
Mar-
14
Ap
r-14
May-
14
Jun-1
4
Jul-
14
Aug
-14
Sep
-14
Oct
-14
No
v-14
Dec-
14
Jan-1
5
Feb
-15
Mar-
15
Ap
r-15
May-
15
Jun-1
5
Jul-
15
Aug
-15
Sep
-15
Oct
-15
No
v-15
Dec-
15
Jan-1
6
Feb
-16
Mar-
16
Ap
r-16
May-
16
Jun-1
6Number of Transactions
6
26
P: 718-715-1758 www.PropertyShark.com [email protected]
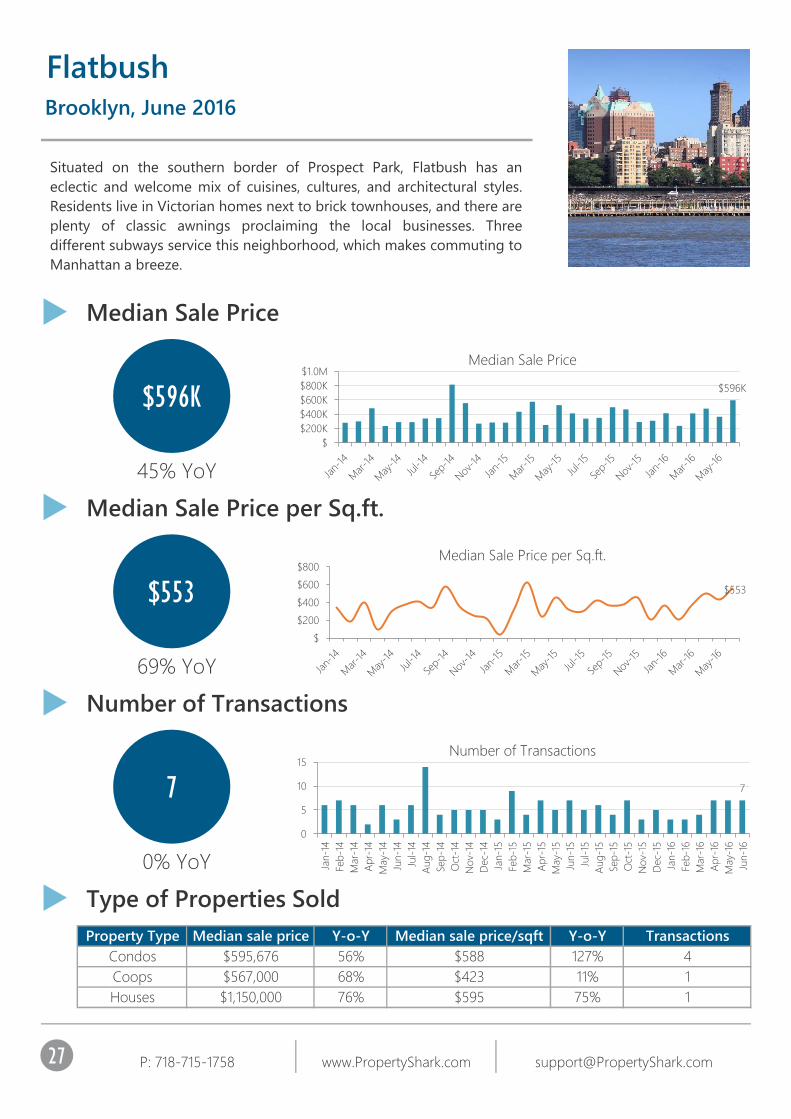
Houses $1,150,000 76% $595 75% 1
Coops $567,000 68% $423 11% 1
Transactions
Condos $595,676 56% $588 127% 4
FlatbushBrooklyn, June 2016
Property Type Median sale price Y-o-Y Median sale price/sqft Y-o-Y
Type of Properties Sold
0% YoY
Number of Transactions
69% YoY
Median Sale Price per Sq.ft.
45% YoY
Median Sale Price
Situated on the southern border of Prospect Park, Flatbush has an
eclectic and welcome mix of cuisines, cultures, and architectural styles.
Residents live in Victorian homes next to brick townhouses, and there are
plenty of classic awnings proclaiming the local businesses. Three
different subways service this neighborhood, which makes commuting to
Manhattan a breeze.
$596K
$
$200K
$400K
$600K
$800K
$1.0MMedian Sale Price
$596K
$553
$
$200
$400
$600
$800Median Sale Price per Sq.ft.
$553
7
0
5
10
15
Jan-1
4
Feb
-14
Mar-
14
Ap
r-14
May-
14
Jun-1
4
Jul-
14
Aug
-14
Sep
-14
Oct
-14
No
v-14
Dec-
14
Jan-1
5
Feb
-15
Mar-
15
Ap
r-15
May-
15
Jun-1
5
Jul-
15
Aug
-15
Sep
-15
Oct
-15
No
v-15
Dec-
15
Jan-1
6
Feb
-16
Mar-
16
Ap
r-16
May-
16
Jun-1
6Number of Transactions
7
27

P: 718-715-1758 www.PropertyShark.com [email protected]
Houses $376,000 -18% $387 17% 7
Coops $122,000 -6% $69 - 6
Transactions
Condos - - - - 0
FlatlandsBrooklyn, June 2016
Property Type Median sale price Y-o-Y Median sale price/sqft Y-o-Y
Type of Properties Sold
33% YoY
Number of Transactions
17% YoY
Median Sale Price per Sq.ft.
-10% YoY
Median Sale Price
With a population of almost 65,000, Flatlands is a mid-sized
neighborhood with no subway access but more than a dozen bus lines.
Owning a car is easier here than other Brooklyn areas because many
homes have driveways and garages. The Kings Plaza Shopping Center is
accessible by boat and car and features numerous retail stores and
restaurants.
$319K
$
$100K
$200K
$300K
$400K
$500KMedian Sale Price
$319K
$387
$
$100
$200
$300
$400
$500Median Sale Price per Sq.ft.
$387
12
0
5
10
15
20
25
Jan-1
4
Feb
-14
Mar-
14
Ap
r-14
May-
14
Jun-1
4
Jul-
14
Aug
-14
Sep
-14
Oct
-14
No
v-14
Dec-
14
Jan-1
5
Feb
-15
Mar-
15
Ap
r-15
May-
15
Jun-1
5
Jul-
15
Aug
-15
Sep
-15
Oct
-15
No
v-15
Dec-
15
Jan-1
6
Feb
-16
Mar-
16
Ap
r-16
May-
16
Jun-1
6Number of Transactions
12
28

P: 718-715-1758 www.PropertyShark.com [email protected]
Houses $2,013,651 -14% $877 8% 4
Coops $399,000 -36% - - 3
Transactions
Condos $455,224 -56% $1,089 7% 26
Fort GreeneBrooklyn, June 2016
Property Type Median sale price Y-o-Y Median sale price/sqft Y-o-Y
Type of Properties Sold
143% YoY
Number of Transactions
0% YoY
Median Sale Price per Sq.ft.
-49% YoY
Median Sale Price
Home to row houses in a variety of styles including Second Empire, Neo-
Grec, and Renaissance, Fort Greene is also home to many new
developments and redevelopments. Residents enjoy the local coffee
shops, wine bars, bookstores, organic markets, and the many outdoor
amenities at Fort Greene Park. Other attractions include the Paul
Robeson Theater.
$490K
$
$500K
$1.0M
$1.5MMedian Sale Price
$490K
$1,016
$
$500
$1,000
$1,500Median Sale Price per Sq.ft.
$1,016
34
0
10
20
30
40
Jan-1
4
Feb
-14
Mar-
14
Ap
r-14
May-
14
Jun-1
4
Jul-
14
Aug
-14
Sep
-14
Oct
-14
No
v-14
Dec-
14
Jan-1
5
Feb
-15
Mar-
15
Ap
r-15
May-
15
Jun-1
5
Jul-
15
Aug
-15
Sep
-15
Oct
-15
No
v-15
Dec-
15
Jan-1
6
Feb
-16
Mar-
16
Ap
r-16
May-
16
Jun-1
6Number of Transactions
34
29

P: 718-715-1758 www.PropertyShark.com [email protected]
Houses $979,500 29% $661 12% 2
Coops $222,005 -30% $396 -7% 9
Transactions
Condos $745,000 47% $621 27% 1
Fort HamiltonBrooklyn, June 2016
Property Type Median sale price Y-o-Y Median sale price/sqft Y-o-Y
Type of Properties Sold
-29% YoY
Number of Transactions
3% YoY
Median Sale Price per Sq.ft.
28% YoY
Median Sale Price
Fort Hamilton is only a square mile and it is located in the southwestern
corner of Brooklyn. Most buildings are pre-war and the real estate
market is known for its constancy. New developments have made their
way to the neighborhood in recent years.
$415K
$
$200K
$400K
$600K
$800KMedian Sale Price
$415K
$563
$
$200
$400
$600
$800Median Sale Price per Sq.ft.
$563
12
0
10
20
30
40
Jan-1
4
Feb
-14
Mar-
14
Ap
r-14
May-
14
Jun-1
4
Jul-
14
Aug
-14
Sep
-14
Oct
-14
No
v-14
Dec-
14
Jan-1
5
Feb
-15
Mar-
15
Ap
r-15
May-
15
Jun-1
5
Jul-
15
Aug
-15
Sep
-15
Oct
-15
No
v-15
Dec-
15
Jan-1
6
Feb
-16
Mar-
16
Ap
r-16
May-
16
Jun-1
6Number of Transactions
12
30

P: 718-715-1758 www.PropertyShark.com [email protected]
Houses - - - - 0
Coops - - - - 0
Transactions
Condos $346,430 -24% $305 7% 3
GeorgetownBrooklyn, June 2016
Property Type Median sale price Y-o-Y Median sale price/sqft Y-o-Y
Type of Properties Sold
-25% YoY
Number of Transactions
5% YoY
Median Sale Price per Sq.ft.
-36% YoY
Median Sale Price
An excellent choice for drivers, Georgetown is known as a quiet
neighborhood with fairly new buildings all with similar architecture and
few trees. There are four buses servicing the area but many homes have
not just one but two private parking spaces. With a major strip mall,
Georgetown Shopping Mall, the area has a distinctive suburban feel.
$346K
$
$200K
$400K
$600K
$800K
Jan-1
4
Feb
-14
Mar-
14
Ap
r-14
May-
14
Jun-1
4
Jul-
14
Aug
-14
Sep
-14
Oct
-14
No
v-14
Dec-
14
Jan-1
5
Feb
-15
Mar-
15
Ap
r-15
May-
15
Jun-1
5
Jul-
15
Aug
-15
Sep
-15
Oct
-15
No
v-15
Dec-
15
Jan-1
6
Mar-
16
Ap
r-16
May-
16
Jun-1
6
Median Sale Price
$346K
$305
$
$100
$200
$300
$400
$500
Jan-1
4
Feb
-14
Ap
r-14
May-
14
Jun-1
4
Jul-
14
Aug
-14
Sep
-14
Oct
-14
No
v-14
Dec-
14
Jan-1
5
Feb
-15
Mar-
15
Ap
r-15
May-
15
Jun-1
5
Jul-
15
Aug
-15
Sep
-15
Oct
-15
No
v-15
Dec-
15
Jan-1
6
Mar-
16
Ap
r-16
May-
16
Jun-1
6
Median Sale Price per Sq.ft.
$305
3
0
2
4
6
8
10
Jan-1
4
Feb
-14
Mar-
14
Ap
r-14
May-
14
Jun-1
4
Jul-
14
Aug
-14
Sep
-14
Oct
-14
No
v-14
Dec-
14
Jan-1
5
Feb
-15
Mar-
15
Ap
r-15
May-
15
Jun-1
5
Jul-
15
Aug
-15
Sep
-15
Oct
-15
No
v-15
Dec-
15
Jan-1
6
Mar-
16
Ap
r-16
May-
16
Jun-1
6Number of Transactions
3
31

P: 718-715-1758 www.PropertyShark.com [email protected]
Houses $395,000 20% $358 6% 12
Coops $175,500 35% $186 15% 2
Transactions
Condos - - - - 0
Gerritsen BeachBrooklyn, June 2016
Property Type Median sale price Y-o-Y Median sale price/sqft Y-o-Y
Type of Properties Sold
50% YoY
Number of Transactions
41% YoY
Median Sale Price per Sq.ft.
94% YoY
Median Sale Price
Home to the only volunteer fire department in NYC and The Gerritsen
Ballfields with two soccer fields, three athletic fields and a little league
field, Gerritsen Beach has a strong community-oriented vibe.
Recreational fishing is popular and model airplane enthusiasts love the
mini-airport. Block parties and street fairs take place all summer long.
$379K
$
$100K
$200K
$300K
$400K
$500KMedian Sale Price
$379K
$347
$
$100
$200
$300
$400
$500Median Sale Price per Sq.ft.
$347
15
0
5
10
15
20
Jan-1
4
Feb
-14
Mar-
14
Ap
r-14
May-
14
Jun-1
4
Jul-
14
Aug
-14
Sep
-14
Oct
-14
No
v-14
Dec-
14
Jan-1
5
Feb
-15
Mar-
15
Ap
r-15
May-
15
Jun-1
5
Jul-
15
Aug
-15
Sep
-15
Oct
-15
No
v-15
Dec-
15
Jan-1
6
Feb
-16
Mar-
16
Ap
r-16
May-
16
Jun-1
6Number of Transactions
15
32

P: 718-715-1758 www.PropertyShark.com [email protected]
Houses - - - - 0
Coops $725,000 18% - - 1
Transactions
Condos $1,180,000 38% $1,103 0% 4
GowanusBrooklyn, June 2016
Property Type Median sale price Y-o-Y Median sale price/sqft Y-o-Y
Type of Properties Sold
-33% YoY
Number of Transactions
0% YoY
Median Sale Price per Sq.ft.
31% YoY
Median Sale Price
Gowanus has a hip, industrial feel. Popular with artists, music venues, and
photographers due to its central location and easy public transportation
to Manhattan, it’s easy to see why it attracts buyers. Homes here include
frame houses and brick townhouses. Important attractions include the
Carroll Street Bridge and the site of the Gowanus Memorial Artyard.
$1.1M
$
$500K
$1.0M
$1.5M
$2.0M
Jan-1
4
Feb
-14
Mar-
14
Ap
r-14
May-
14
Jun-1
4
Jul-
14
Aug
-14
Sep
-14
Oct
-14
No
v-14
Dec-
14
Jan-1
5
Feb
-15
Mar-
15
Ap
r-15
May-
15
Jun-1
5
Jul-
15
Aug
-15
Sep
-15
No
v-15
Dec-
15
Jan-1
6
Feb
-16
Mar-
16
May-
16
Jun-1
6
Median Sale Price
$1.06M
$1,103
$
$500
$1,000
$1,500
Jan-1
4
Feb
-14
Mar-
14
Ap
r-14
May-
14
Jun-1
4
Jul-
14
Aug
-14
Sep
-14
Oct
-14
No
v-14
Dec-
14
Jan-1
5
Feb
-15
Mar-
15
Ap
r-15
May-
15
Jun-1
5
Jul-
15
Aug
-15
Sep
-15
No
v-15
Dec-
15
Jan-1
6
Feb
-16
Mar-
16
May-
16
Jun-1
6
Median Sale Price per Sq.ft.
$1,103
6
0
2
4
6
8
10
Jan-1
4
Feb
-14
Mar-
14
Ap
r-14
May-
14
Jun-1
4
Jul-
14
Aug
-14
Sep
-14
Oct
-14
No
v-14
Dec-
14
Jan-1
5
Feb
-15
Mar-
15
Ap
r-15
May-
15
Jun-1
5
Jul-
15
Aug
-15
Sep
-15
No
v-15
Dec-
15
Jan-1
6
Feb
-16
Mar-
16
May-
16
Jun-1
6Number of Transactions
6
33

P: 718-715-1758 www.PropertyShark.com [email protected]
Houses $750,500 -2% $541 -14% 3
Coops $257,000 14% - - 9
Transactions
Condos $460,010 -20% $510 2% 11
GravesendBrooklyn, June 2016
Property Type Median sale price Y-o-Y Median sale price/sqft Y-o-Y
Type of Properties Sold
10% YoY
Number of Transactions
4% YoY
Median Sale Price per Sq.ft.
-24% YoY
Median Sale Price
Known for large homes, elaborate hedges, and big porches, Gravesend is
a neighborhood with tree-lined streets and plenty of benches. Savvy
home buyers will also find plenty of single and multi-family homes,
seven-story co-ops, and condo buildings. This neighborhood is also
known for its historic Old Gravesend Cemetery, which was built in the
1600s.
$384K
$
$200K
$400K
$600K
$800KMedian Sale Price
$384K
$523
$
$200
$400
$600
$800Median Sale Price per Sq.ft.
$523
23
0
10
20
30
40
Jan-1
4
Feb
-14
Mar-
14
Ap
r-14
May-
14
Jun-1
4
Jul-
14
Aug
-14
Sep
-14
Oct
-14
No
v-14
Dec-
14
Jan-1
5
Feb
-15
Mar-
15
Ap
r-15
May-
15
Jun-1
5
Jul-
15
Aug
-15
Sep
-15
Oct
-15
No
v-15
Dec-
15
Jan-1
6
Feb
-16
Mar-
16
Ap
r-16
May-
16
Jun-1
6Number of Transactions
23
34

P: 718-715-1758 www.PropertyShark.com [email protected]
Houses $1,526,000 -24% $778 -36% 1
Coops - - - - 0
Transactions
Condos $828,750 -17% $1,032 -4% 7
GreenpointBrooklyn, June 2016
Property Type Median sale price Y-o-Y Median sale price/sqft Y-o-Y
Type of Properties Sold
-20% YoY
Number of Transactions
-6% YoY
Median Sale Price per Sq.ft.
-19% YoY
Median Sale Price
The charming townhouses found in Greenpoint are situated next to
cramped shops, and views of the Manhattan skyline can be seen from
the roofs of the loft apartments and converted warehouses. This is the
furthest north of all Brooklyn neighborhoods, and it takes longer to get
to Manhattan, but the easy public transportation options take the
pressure off.
$928K
$
$500K
$1.0M
$1.5MMedian Sale Price
$928K
$1,010
$
$500
$1,000
$1,500Median Sale Price per Sq.ft.
$1,010
8
0
5
10
15
20
25
Jan-1
4
Feb
-14
Mar-
14
Ap
r-14
May-
14
Jun-1
4
Jul-
14
Aug
-14
Sep
-14
Oct
-14
No
v-14
Dec-
14
Jan-1
5
Feb
-15
Mar-
15
Ap
r-15
May-
15
Jun-1
5
Jul-
15
Aug
-15
Sep
-15
Oct
-15
No
v-15
Dec-
15
Jan-1
6
Feb
-16
Mar-
16
Ap
r-16
May-
16
Jun-1
6Number of Transactions
8
35

P: 718-715-1758 www.PropertyShark.com [email protected]
Houses $889,500 -26% $620 -19% 2
Coops $450,000 50% $524 -1% 12
Transactions
Condos $660,000 -12% $695 2% 1
KensingtonBrooklyn, June 2016
Property Type Median sale price Y-o-Y Median sale price/sqft Y-o-Y
Type of Properties Sold
0% YoY
Number of Transactions
-3% YoY
Median Sale Price per Sq.ft.
-14% YoY
Median Sale Price
A charming, centrally located Brooklyn neighborhood full of Victorian
mansions and quiet side streets, along with commercial roads with
bodegas, restaurants, and hip coffee shops, transportation is easy via the
F train. Popular with first-time buyers looking for a great value for their
money, Kensington is quickly adding new cafes and bars.
$462K
$ $100K $200K $300K $400K $500K $600K
Median Sale Price
$462K
$542
$
$200
$400
$600
$800Median Sale Price per Sq.ft.
$542
16
05
1015202530
Jan-1
4
Feb
-14
Mar-
14
Ap
r-14
May-
14
Jun-1
4
Jul-
14
Aug
-14
Sep
-14
Oct
-14
No
v-14
Dec-
14
Jan-1
5
Feb
-15
Mar-
15
Ap
r-15
May-
15
Jun-1
5
Jul-
15
Aug
-15
Sep
-15
Oct
-15
No
v-15
Dec-
15
Jan-1
6
Feb
-16
Mar-
16
Ap
r-16
May-
16
Jun-1
6Number of Transactions
16
36

P: 718-715-1758 www.PropertyShark.com [email protected]
Houses $590,000 -26% $321 -39% 6
Coops $157,000 -7% $195 - 3
Transactions
Condos $532,113 - - - 4
MadisonBrooklyn, June 2016
Property Type Median sale price Y-o-Y Median sale price/sqft Y-o-Y
Type of Properties Sold
44% YoY
Number of Transactions
-42% YoY
Median Sale Price per Sq.ft.
-36% YoY
Median Sale Price
Only its own neighborhood for a decade (previously being part of
Marine Park), Madison is a small neighborhood with its own subway stop
and a large commercial thoroughfare. The area has a suburban feel,
thanks to its large years, sculpted hedges, and smartly placed topiary.
Oversized rooms and stucco exteriors are common in this neighborhood.
$510K
$
$200K
$400K
$600K
$800K
$1.0MMedian Sale Price
$510K
$305
$
$200
$400
$600
$800
Feb
-14
Mar-
14
Ap
r-14
May-
14
Jun-1
4
Jul-
14
Aug
-14
Sep
-14
Oct
-14
No
v-14
Dec-
14
Jan-1
5
Feb
-15
Mar-
15
Ap
r-15
May-
15
Jun-1
5
Jul-
15
Aug
-15
Sep
-15
Oct
-15
No
v-15
Dec-
15
Jan-1
6
Feb
-16
Mar-
16
Ap
r-16
May-
16
Jun-1
6
Median Sale Price per Sq.ft.
$305
13
0
5
10
15
Jan-1
4
Feb
-14
Mar-
14
Ap
r-14
May-
14
Jun-1
4
Jul-
14
Aug
-14
Sep
-14
Oct
-14
No
v-14
Dec-
14
Jan-1
5
Feb
-15
Mar-
15
Ap
r-15
May-
15
Jun-1
5
Jul-
15
Aug
-15
Sep
-15
Oct
-15
No
v-15
Dec-
15
Jan-1
6
Feb
-16
Mar-
16
Ap
r-16
May-
16
Jun-1
6Number of Transactions
13
37

P: 718-715-1758 www.PropertyShark.com [email protected]
Houses $622,500 18% $454 14% 18
Coops $145,000 - - - 1
Transactions
Condos - - - - 0
Marine ParkBrooklyn, June 2016
Property Type Median sale price Y-o-Y Median sale price/sqft Y-o-Y
Type of Properties Sold
73% YoY
Number of Transactions
14% YoY
Median Sale Price per Sq.ft.
17% YoY
Median Sale Price
Affordable but isolated, Marine Park is a throwback to the Brooklyn
neighborhoods of yesteryear. Without access to the subway, buyers are
hesitant to make the leap but the area is served by numerous shopping
strips with a diverse selection of stores, restaurants, and movie theaters.
The local landmark is the Hendrik I. Lott House built in 1800.
$620K
$
$200K
$400K
$600K
$800KMedian Sale Price
$620K
$454
$$100$200$300$400$500$600
Median Sale Price per Sq.ft.
$454
19
0
5
10
15
20
Jan-1
4
Feb
-14
Mar-
14
Ap
r-14
May-
14
Jun-1
4
Jul-
14
Aug
-14
Sep
-14
Oct
-14
No
v-14
Dec-
14
Jan-1
5
Feb
-15
Mar-
15
Ap
r-15
May-
15
Jun-1
5
Jul-
15
Aug
-15
Sep
-15
Oct
-15
No
v-15
Dec-
15
Jan-1
6
Feb
-16
Mar-
16
Ap
r-16
May-
16
Jun-1
6Number of Transactions
19
38

P: 718-715-1758 www.PropertyShark.com [email protected]
Houses $1,148,250 67% $567 15% 16
Coops $304,000 74% $419 15% 19
Transactions
Condos $641,498 12% $533 13% 3
MidwoodBrooklyn, June 2016
Property Type Median sale price Y-o-Y Median sale price/sqft Y-o-Y
Type of Properties Sold
27% YoY
Number of Transactions
6% YoY
Median Sale Price per Sq.ft.
60% YoY
Median Sale Price
Located in the middle of Brooklyn, Midwood is a true melting pot with a
small town feel. Though new construction isn’t prevalent in this
established neighborhood, it’s common to see homes expanded and
built into nothing short of palaces. This tree-lined, quiet, suburban-
feeling area is chock full of delicious bakeries and discounted shopping.
$482K
$
$200K
$400K
$600K
$800KMedian Sale Price
$482K
$521
$
$200
$400
$600
$800Median Sale Price per Sq.ft.
$521
38
0
10
20
30
40
50
Jan-1
4
Feb
-14
Mar-
14
Ap
r-14
May-
14
Jun-1
4
Jul-
14
Aug
-14
Sep
-14
Oct
-14
No
v-14
Dec-
14
Jan-1
5
Feb
-15
Mar-
15
Ap
r-15
May-
15
Jun-1
5
Jul-
15
Aug
-15
Sep
-15
Oct
-15
No
v-15
Dec-
15
Jan-1
6
Feb
-16
Mar-
16
Ap
r-16
May-
16
Jun-1
6Number of Transactions
38
39

P: 718-715-1758 www.PropertyShark.com [email protected]
Houses $905,000 39% $373 13% 8
Coops - - - - 0
Transactions
Condos - - - - 0
Mill BasinBrooklyn, June 2016
Property Type Median sale price Y-o-Y Median sale price/sqft Y-o-Y
Type of Properties Sold
167% YoY
Number of Transactions
13% YoY
Median Sale Price per Sq.ft.
39% YoY
Median Sale Price
Mill Basin is located in the south of Brooklyn, right along Jamaica Bay,
and is home to some of the most luxurious homes in New York City.
Most houses are relatively new and it’s not uncommon for waterfront
homes to include docks. Local retail stores line Strickland Avenue and
Avenue U and the Kings Plaza shopping mall is nearby.
$905K
$
$500K
$1.0M
$1.5MMedian Sale Price
$905K
$373
$$100$200$300$400$500$600
Median Sale Price per Sq.ft.
$373
8
0
2
4
6
8
10
Jan-1
4
Feb
-14
Mar-
14
Ap
r-14
May-
14
Jun-1
4
Jul-
14
Aug
-14
Sep
-14
Oct
-14
No
v-14
Dec-
14
Jan-1
5
Feb
-15
Mar-
15
Ap
r-15
May-
15
Jun-1
5
Jul-
15
Aug
-15
Sep
-15
Oct
-15
No
v-15
Dec-
15
Jan-1
6
Feb
-16
Mar-
16
Ap
r-16
May-
16
Jun-1
6Number of Transactions
8
40

P: 718-715-1758 www.PropertyShark.com [email protected]
Houses $500,000 18% $391 33% 7
Coops - - - - 0
Transactions
Condos - - - - 0
Old Mill BasinBrooklyn, June 2016
Property Type Median sale price Y-o-Y Median sale price/sqft Y-o-Y
Type of Properties Sold
-22% YoY
Number of Transactions
33% YoY
Median Sale Price per Sq.ft.
18% YoY
Median Sale Price
Old Mill Basin is subsection of Mill Basin and features many of the same
amenities as its parent neighborhood but with significantly less foot
traffic. Homes are tucked away and mostly consist of single-family
homes with the rare multi-family home available. Amenities are minimal
but the nearby neighborhoods offer plenty to do for residents.
$500K
$
$200K
$400K
$600K
$800KMedian Sale Price
$500K
$391
$$100$200$300$400$500$600
Median Sale Price per Sq.ft.
$391
7
0
2
4
6
8
10
Jan-1
4
Feb
-14
Mar-
14
Ap
r-14
May-
14
Jun-1
4
Jul-
14
Aug
-14
Sep
-14
Oct
-14
No
v-14
Dec-
14
Jan-1
5
Feb
-15
Mar-
15
Ap
r-15
May-
15
Jun-1
5
Jul-
15
Aug
-15
Sep
-15
Oct
-15
No
v-15
Dec-
15
Jan-1
6
Feb
-16
Mar-
16
Ap
r-16
May-
16
Jun-1
6Number of Transactions
7
41

P: 718-715-1758 www.PropertyShark.com [email protected]
Houses $2,237,500 -30% $1,004 -12% 2
Coops $840,000 8% $1,004 2% 30
Transactions
Condos $1,035,000 -16% $1,162 2% 27
Park SlopeBrooklyn, June 2016
Property Type Median sale price Y-o-Y Median sale price/sqft Y-o-Y
Type of Properties Sold
-2% YoY
Number of Transactions
6% YoY
Median Sale Price per Sq.ft.
-4% YoY
Median Sale Price
Both the largest and most highly sought after neighborhoods in NYC,
Park Slope was once the richest community in the U.S. Today it has
something for everyone with commercial streets next to a restaurant row
next to renovated brownstones and condos. From top-rated eateries to
low crime rates it’s easy to see why it’s a top rated neighborhood.
$955K
$
$500K
$1.0M
$1.5MMedian Sale Price
$955K
$1,118
$$200$400$600$800
$1,000$1,200
Median Sale Price per Sq.ft.
$1,118
59
0
20
40
60
80
Jan-1
4
Feb
-14
Mar-
14
Ap
r-14
May-
14
Jun-1
4
Jul-
14
Aug
-14
Sep
-14
Oct
-14
No
v-14
Dec-
14
Jan-1
5
Feb
-15
Mar-
15
Ap
r-15
May-
15
Jun-1
5
Jul-
15
Aug
-15
Sep
-15
Oct
-15
No
v-15
Dec-
15
Jan-1
6
Feb
-16
Mar-
16
Ap
r-16
May-
16
Jun-1
6Number of Transactions
59
42

P: 718-715-1758 www.PropertyShark.com [email protected]
Houses $1,750,000 59% $673 5% 3
Coops - - - - 0
Transactions
Condos - - - - 0
Prospect - Lefferts GardensBrooklyn, June 2016
Property Type Median sale price Y-o-Y Median sale price/sqft Y-o-Y
Type of Properties Sold
-63% YoY
Number of Transactions
5% YoY
Median Sale Price per Sq.ft.
90% YoY
Median Sale Price
Known as both Prospect Park and Lefferts Garden, this Brooklyn
neighborhood is easily accessible by train, bus, and car, and is known as
a down-to-earth, laid back area. Homes include brownstones,
townhomes, and modern condos and the streets tend to quiet down
fairly early in the evening. Popular landmarks include the Lefferts Historic
House.
$1.8M
$
$500K
$1.0M
$1.5M
$2.0MMedian Sale Price
$1.75M
$673
$
$500
$1,000
$1,500Median Sale Price per Sq.ft.
$673
3
0
5
10
15
20
25
Jan-1
4
Feb
-14
Mar-
14
Ap
r-14
May-
14
Jun-1
4
Jul-
14
Aug
-14
Sep
-14
Oct
-14
No
v-14
Dec-
14
Jan-1
5
Feb
-15
Mar-
15
Ap
r-15
May-
15
Jun-1
5
Jul-
15
Aug
-15
Sep
-15
Oct
-15
No
v-15
Dec-
15
Jan-1
6
Feb
-16
Mar-
16
Ap
r-16
May-
16
Jun-1
6Number of Transactions
3
43

P: 718-715-1758 www.PropertyShark.com [email protected]
Houses - - - - 0
Coops $810,000 16% $856 -4% 12
Transactions
Condos $870,713 -32% $1,149 33% 20
Prospect HeightsBrooklyn, June 2016
Property Type Median sale price Y-o-Y Median sale price/sqft Y-o-Y
Type of Properties Sold
100% YoY
Number of Transactions
26% YoY
Median Sale Price per Sq.ft.
16% YoY
Median Sale Price
Prospect Heights may be small but it’s big on cultural diversity and
quaint tree-lined streets. This neighborhood has one of the strongest
residential corridors in the city. Buyers can find everything from 1890s
brownstones to newly built modern apartment buildings to converted
lofts.
$825K
$
$500K
$1.0M
$1.5MMedian Sale Price
$825K
$1,106
$$200$400$600$800
$1,000$1,200
Median Sale Price per Sq.ft.
$1,106
32
0
10
20
30
40
Jan-1
4
Feb
-14
Mar-
14
Ap
r-14
May-
14
Jun-1
4
Jul-
14
Aug
-14
Sep
-14
Oct
-14
No
v-14
Dec-
14
Jan-1
5
Feb
-15
Mar-
15
Ap
r-15
May-
15
Jun-1
5
Jul-
15
Aug
-15
Sep
-15
Oct
-15
No
v-15
Dec-
15
Jan-1
6
Feb
-16
Mar-
16
Ap
r-16
May-
16
Jun-1
6Number of Transactions
32
44

P: 718-715-1758 www.PropertyShark.com [email protected]
Houses $2,000,000 - $698 - 1
Coops $375,000 - $420 - 3
Transactions
Condos $466,000 -15% $871 2% 1
Prospect Park SouthBrooklyn, June 2016
Property Type Median sale price Y-o-Y Median sale price/sqft Y-o-Y
Type of Properties Sold
500% YoY
Number of Transactions
-30% YoY
Median Sale Price per Sq.ft.
-25% YoY
Median Sale Price
Residents of Prospect Park South enjoy its small town atmosphere while
at the same time staying close to some of the more bustling and
dynamic Brooklyn neighborhoods. Most homes are freestanding and
most streets are lined with trees. Designated as a national historic
district, there is a diverse list of architectural styles including Queen Anne
and French Revival.
$410K
$
$500K
$1.0M
$1.5M
$2.0M
$2.5M
Jan-1
4
Feb
-14
Mar-
14
Ap
r-14
May-
14
Jun-1
4
Jul-
14
Aug
-14
Sep
-14
Oct
-14
No
v-14
Dec-
14
Jan-1
5
Feb
-15
Mar-
15
Ap
r-15
May-
15
Jun-1
5
Jul-
15
Aug
-15
Sep
-15
Oct
-15
No
v-15
Dec-
15
Feb
-16
Mar-
16
Ap
r-16
May-
16
Jun-1
6
Median Sale Price
$410K
$591
$
$500
$1,000
$1,500
$2,000
$2,500
Jan-1
4
Feb
-14
Mar-
14
Ap
r-14
May-
14
Jun-1
4
Jul-
14
Aug
-14
Sep
-14
Oct
-14
No
v-14
Dec-
14
Jan-1
5
Feb
-15
Mar-
15
Ap
r-15
May-
15
Jun-1
5
Jul-
15
Aug
-15
Oct
-15
No
v-15
Dec-
15
Feb
-16
Mar-
16
Ap
r-16
May-
16
Jun-1
6
Median Sale Price per Sq.ft.
$591
6
0
2
4
6
8
Jan-1
4
Feb
-14
Mar-
14
Ap
r-14
May-
14
Jun-1
4
Jul-
14
Aug
-14
Sep
-14
Oct
-14
No
v-14
Dec-
14
Jan-1
5
Feb
-15
Mar-
15
Ap
r-15
May-
15
Jun-1
5
Jul-
15
Aug
-15
Sep
-15
Oct
-15
No
v-15
Dec-
15
Feb
-16
Mar-
16
Ap
r-16
May-
16
Jun-1
6Number of Transactions
6
45

P: 718-715-1758 www.PropertyShark.com [email protected]
Houses $720,000 24% $444 42% 12
Coops $180,000 26% $206 23% 19
Transactions
Condos $535,475 32% $460 3% 7
Sheepshead BayBrooklyn, June 2016
Property Type Median sale price Y-o-Y Median sale price/sqft Y-o-Y
Type of Properties Sold
-22% YoY
Number of Transactions
22% YoY
Median Sale Price per Sq.ft.
92% YoY
Median Sale Price
Sheepshead Bay’s long past is full of twists and turns but in recent years,
new developments have been cropping up including a shopping center
with restaurants at Seaport Plaza, an assisted living facility, and upscale
Russian and French restaurants. Two subway lines serve the area and
new residential projects include row houses and condos.
$341K
$
$100K
$200K
$300K
$400K
$500KMedian Sale Price
$341K
$425
$$100$200$300$400$500$600
Median Sale Price per Sq.ft.
$425
38
0102030405060
Jan-1
4
Feb
-14
Mar-
14
Ap
r-14
May-
14
Jun-1
4
Jul-
14
Aug
-14
Sep
-14
Oct
-14
No
v-14
Dec-
14
Jan-1
5
Feb
-15
Mar-
15
Ap
r-15
May-
15
Jun-1
5
Jul-
15
Aug
-15
Sep
-15
Oct
-15
No
v-15
Dec-
15
Jan-1
6
Feb
-16
Mar-
16
Ap
r-16
May-
16
Jun-1
6Number of Transactions
38
46

P: 718-715-1758 www.PropertyShark.com [email protected]
Houses - - - - 0
Coops $402,424 22% $732 - 6
Transactions
Condos $500,000 56% $640 12% 2
Sunset ParkBrooklyn, June 2016
Property Type Median sale price Y-o-Y Median sale price/sqft Y-o-Y
Type of Properties Sold
-50% YoY
Number of Transactions
20% YoY
Median Sale Price per Sq.ft.
38% YoY
Median Sale Price
Considered by the New York Times to be one of next hot neighborhoods
in NYC, Sunset Park has no fancy condos, no Starbucks, and no trendy
restaurants but new developments like the 16-building Industry City,
with six million square feet of office and retail space, are in the process of
changing the landscape where prewar walkups are next to co-ops.
$450K
$ $100K $200K $300K $400K $500K $600K
Median Sale Price
$450K
$732
$
$200
$400
$600
$800Median Sale Price per Sq.ft.
$732
8
0
5
10
15
20
Jan-1
4
Feb
-14
Mar-
14
Ap
r-14
May-
14
Jun-1
4
Jul-
14
Aug
-14
Sep
-14
Oct
-14
No
v-14
Dec-
14
Jan-1
5
Feb
-15
Mar-
15
Ap
r-15
May-
15
Jun-1
5
Jul-
15
Aug
-15
Sep
-15
Oct
-15
No
v-15
Dec-
15
Jan-1
6
Feb
-16
Mar-
16
Ap
r-16
May-
16
Jun-1
6Number of Transactions
8
47

P: 718-715-1758 www.PropertyShark.com [email protected]
Houses $1,152,500 -21% $1,471 5% 2
Coops $295,000 -67% - - 2
Transactions
Condos $781,500 18% $1,082 11% 66
WilliamsburgBrooklyn, June 2016
Property Type Median sale price Y-o-Y Median sale price/sqft Y-o-Y
Type of Properties Sold
-7% YoY
Number of Transactions
15% YoY
Median Sale Price per Sq.ft.
18% YoY
Median Sale Price
A waterfront neighborhood with views of Manhattan and the East River,
Williamsburg is home to new residential buildings and unique converted
lofts. Known as an artist’s neighborhood, residents have access to local
restaurants, cafes, bars, clothing boutiques, tennis courts, greenmarkets,
kickball fields, and a wide range of historical landmarks.
$782K
$ $200K $400K $600K $800K $1.0M $1.2M
Median Sale Price
$782K
$1,122
$
$500
$1,000
$1,500Median Sale Price per Sq.ft.
$1,122
70
0
20
40
60
80
Jan-1
4
Feb
-14
Mar-
14
Ap
r-14
May-
14
Jun-1
4
Jul-
14
Aug
-14
Sep
-14
Oct
-14
No
v-14
Dec-
14
Jan-1
5
Feb
-15
Mar-
15
Ap
r-15
May-
15
Jun-1
5
Jul-
15
Aug
-15
Sep
-15
Oct
-15
No
v-15
Dec-
15
Jan-1
6
Feb
-16
Mar-
16
Ap
r-16
May-
16
Jun-1
6Number of Transactions
70
48
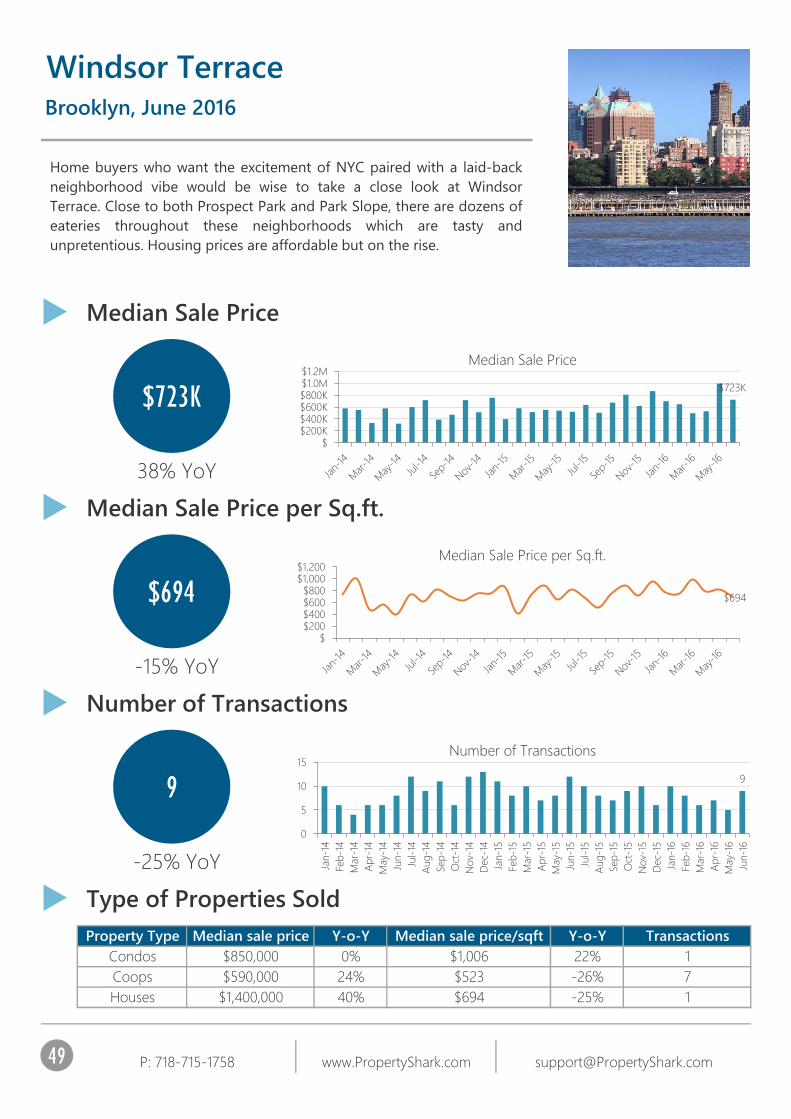
P: 718-715-1758 www.PropertyShark.com [email protected]
Houses $1,400,000 40% $694 -25% 1
Coops $590,000 24% $523 -26% 7
Transactions
Condos $850,000 0% $1,006 22% 1
Windsor TerraceBrooklyn, June 2016
Property Type Median sale price Y-o-Y Median sale price/sqft Y-o-Y
Type of Properties Sold
-25% YoY
Number of Transactions
-15% YoY
Median Sale Price per Sq.ft.
38% YoY
Median Sale Price
Home buyers who want the excitement of NYC paired with a laid-back
neighborhood vibe would be wise to take a close look at Windsor
Terrace. Close to both Prospect Park and Park Slope, there are dozens of
eateries throughout these neighborhoods which are tasty and
unpretentious. Housing prices are affordable but on the rise.
$723K
$ $200K $400K $600K $800K $1.0M $1.2M
Median Sale Price
$723K
$694
$$200$400$600$800
$1,000$1,200
Median Sale Price per Sq.ft.
$694
9
0
5
10
15
Jan-1
4
Feb
-14
Mar-
14
Ap
r-14
May-
14
Jun-1
4
Jul-
14
Aug
-14
Sep
-14
Oct
-14
No
v-14
Dec-
14
Jan-1
5
Feb
-15
Mar-
15
Ap
r-15
May-
15
Jun-1
5
Jul-
15
Aug
-15
Sep
-15
Oct
-15
No
v-15
Dec-
15
Jan-1
6
Feb
-16
Mar-
16
Ap
r-16
May-
16
Jun-1
6Number of Transactions
9
49

P: 718-715-1758 www.PropertyShark.com [email protected]
Houses $480,000 -10% $406 -37% 2
Coops $163,000 -4% - - 1
Transactions
Condos $520,000 - $349 - 1
WingateBrooklyn, June 2016
Property Type Median sale price Y-o-Y Median sale price/sqft Y-o-Y
Type of Properties Sold
0% YoY
Number of Transactions
-39% YoY
Median Sale Price per Sq.ft.
27% YoY
Median Sale Price
Sometimes considered to be part of East Flatbush or Crown Heights,
Wingate is a mostly residential neighborhood with a variety of housing
options available. It’s close to Brooklyn and reasonably close to
Manhattan, which makes it a top choice for commuters. Transportation is
quick and easy via subway lines and both local and express buses.
$460K
$
$200K
$400K
$600K
$800K
Feb
-14
Mar-
14
Jun-1
4
Jul-
14
Aug
-14
Sep
-14
Oct
-14
No
v-14
Dec-
14
Jan-1
5
Feb
-15
Mar-
15
Ap
r-15
May-
15
Jun-1
5
Jul-
15
Aug
-15
Sep
-15
Oct
-15
No
v-15
Dec-
15
Jan-1
6
Mar-
16
Ap
r-16
May-
16
Jun-1
6
Median Sale Price
$460K
$395
$
$200
$400
$600
$800
Feb
-14
Mar-
14
Jun-1
4
Jul-
14
Aug
-14
Sep
-14
Oct
-14
No
v-14
Dec-
14
Jan-1
5
Feb
-15
Mar-
15
Ap
r-15
May-
15
Jun-1
5
Jul-
15
Aug
-15
Sep
-15
Oct
-15
No
v-15
Dec-
15
Jan-1
6
Mar-
16
Ap
r-16
May-
16
Jun-1
6
Median Sale Price per Sq.ft.
$395
4
0
5
10
15
20
Feb
-14
Mar-
14
Jun-1
4
Jul-
14
Aug
-14
Sep
-14
Oct
-14
No
v-14
Dec-
14
Jan-1
5
Feb
-15
Mar-
15
Ap
r-15
May-
15
Jun-1
5
Jul-
15
Aug
-15
Sep
-15
Oct
-15
No
v-15
Dec-
15
Jan-1
6
Mar-
16
Ap
r-16
May-
16
Jun-1
6Number of Transactions
4
50
Attractions

P: 718-715-1758 www.PropertyShark.com [email protected]
Bridge Park
Attractions
Brooklyn, June 2016
Bridge
51
Attractions

P: 718-715-1758 www.PropertyShark.com [email protected]
Museum
Attractions
Brooklyn, June 2016
Grand Army Plaza
52
Attractions

P: 718-715-1758 www.PropertyShark.com [email protected]
Luna Park
Attractions
Brooklyn, June 2016
Botanic Garden
53