
Calcite Structures in Sea Urchin Tests using X-ray Ptychography.

HSE Health & Safety
Executive
Technical performance measures for North Sea jacket structures
Prepared by EQE International Limited for the Health and Safety Executive 2003
RESEARCH REPORT 094

HSE Health & Safety
Executive
Technical performance measures for North Sea jacket structures
A Nelson EQE International Limited
EQE House The Beacons
Warrington Road Birchwood Warrington
WA3 6WJ
This report presents the Technical Performance Measures (TPM) methodology that has been developed to enable a first point assessment of North Sea steel jacket structures to be made·
● The methodology de-emphasises the quantitative structural reliability predictions that are currently employed in the North Sea safety case regime and employs a more qualitative approach to assessing the structural reliability of individual installations. The approach takes into consideration the age of the structure, structural configuration and functionality to generate a relative risk index. This index is semi-quantitative and provides an indication of the structure’s performance in relation to other steel jacket fixed installations.·
● The measure of platform vulnerability is based upon the load capacity of the undamaged structure and that when the structure’s most critical bracing member is severed.·
● The measure of a platform’s consequence of failure is based upon a semi-quantitative approach that considers the nature of the field and the platform’s functionality. Benefit is taken from a bridge-linked complex.
The methodology presented in this report has used a number of arbitrary values in which to derive key components of both the likelihood and consequence measures. These values have been chosen for demonstration purposes only and may not be representative of values that would ultimately be used upon implementing this tool within a screening process.
The TPM methodology is based upon environmental loading and does not consider other potential causes of structural failure. Furthermore the likelihood of structural failure makes use of the Long Term Load Distributions developed as part of work conducted in Reference 6. Consideration is not given to airgap erosion, and as such, wave in deck forces are not considered.The TPM methodology has been applied to a number of North Sea jacket structures and a simple risk assessment has been performed. This has demonstrated the ease of applying the technique to a large number of structures. .
This report and the work it describes were funded by the Health and Safety Executive (HSE). Its contents, including any opinions and/or conclusions expressed, are those of the authors alone and do not necessarily reflect HSE policy.
HSE BOOKS

© Crown copyright 2003
First published 2003
ISBN 0 7176 2188 X
All rights reserved. No part of this publication may bereproduced, stored in a retrieval system, or transmitted inany form or by any means (electronic, mechanical,photocopying, recording or otherwise) without the priorwritten permission of the copyright owner.
Applications for reproduction should be made in writing to: Licensing Division, Her Majesty's Stationery Office, St Clements House, 2-16 Colegate, Norwich NR3 1BQ or by e-mail to [email protected]
ii

DOCUMENT SUMMARY
This report presents the Technical Performance Measures (TPM) methodology that has been developed to enable a first point assessment of North Sea steel jacket structures to be made
· The methodology de-emphasises the quantitative structural reliability predictions that are currently employed in the North Sea safety case regime and employs a more qualitative approach to assessing the structural reliability of individual installations. The approach takes into consideration the age of the structure, structural configuration and functionality to generate a relative risk index. This index is semi-quantitative and provides an indication of the structure‘s performance in relation to other steel jacket fixed installations.
· The measure of platform vulnerability is based upon the load capacity of the undamaged structure and that when the structure‘s most critical bracing member is severed.
· The measure of a platform‘s consequence of failure is based upon a semi-quantitative approach that considers the nature of the field and the platform‘s functionality. Benefit is taken from a bridge-linked complex.
The methodology presented in this report has used a number of arbitrary values in which to derive key components of both the likelihood and consequence measures. These values have been chosen for demonstration purposes only and may not be representative of values that would ultimately be used upon implementing this tool within a screening process.
The TPM methodology is based upon environmental loading and does not consider other potential causes of structural failure. Furthermore the likelihood of structural failure makes use of the Long Term Load Distributions developed as part of work conducted in Reference 6. Consideration is not given to airgap erosion, and as such, wave in deck forces are not considered.
The TPM methodology has been applied to a number of North Sea jacket structures and a simple risk assessment has been performed. This has demonstrated the ease of applying the technique to a large number of structures.
iii

LIST OF ACRONYMS
A Long term load distribution coefficient
B Number of bays
BR Business interrupt rating
BSdesign Design base shear
BSult_damaged Ultimate base shear in damaged state
BSult_undamaged Ultimate base shear in undamaged state
CDF Cumulative Distribution Function
CNS Central North Sea
CR Criticality Rating
DSR Damage Strength Ratio
E Long term load distribution storm loading
E0 Long term load distribution coefficient
E100 Long term load distribution storm load with a return period of 100 years
ER Environmental Rating
ERP Long term load distribution storm load with return period of RP years
FE Finite Element
FMD Flooded Member Detection
HSE UK Health and Safety Executive
JIP Joint Industry Project
LPF Load Proportionality Factor
LTLD Long Term Load Distribution
NESS Northern European Strom Study
NNS Northern North Sea
NS North Sea
OD Outer Diameter
Pdamaged Probability of limiting storm load
Pdead Dead load
PDF Probability Density Function
Pf Annualised probability of failure
iv

POB Personnel on board
Pref Reference load
Psever Probability of critical member being severed
Ptotal Total load
RLS Reference load set
RRF Residual Reserve Factor
RRFlimiting RRF attributed to failure of critical member
RSR Reserve Strength Ratio
SNS Southern North Sea
SR Safety Rating
TPM Technical Performance Measure
UKCS United Kingdom Continental Shelf
WT Wall Thickness
v

vi

CONTENTS
Page
Summary ..................................................................................................................... iii List of Acronyms .........................................................................................................iv Contents ......................................................................................................................viiList of Tables .............................................................................................................viiiList of Figures ............................................................................................................viiiList of Appendices ..................................................................................................... viii
1 Introduction........................................................................................................1 2 Methodology......................................................................................................3 2.1 Overview............................................................................................................3 2.2 Vulnerability Assessment ..................................................................................4 2.3 Consequence Assessment ................................................................................11 2.4 Risk Ranking ...................................................................................................14 2.5 Summary of TPM Methodology......................................................................15 3 Cumulative Distributions.................................................................................17 3.1 Overview..........................................................................................................17 3.2 Ultimate Strength Analysis..............................................................................17 3.3 Results..............................................................................................................19 3.4 Data Analysis...................................................................................................21 3.5 Comparison With Structure Specific Distributions .........................................23 4 Probability of Member Failure ........................................................................29 5 Risk Ranking of North Sea Installations .........................................................31 5.1 Overview..........................................................................................................31 5.2 Vulnerability Assessment ................................................................................32 5.3 Consequence Assessment ................................................................................33 5.4 Risk Assessment ..............................................................................................35 6 Limitations of Method .....................................................................................37 6.1 Assessment of Larger Structures .....................................................................37 6.2 Air Gap ............................................................................................................37 6.3 Failure Modes ..................................................................................................37 6.4 Stress Redistribution Effects............................................................................37 6.5 Probability of Member Failure ........................................................................38 6.6 Consequence Assessment ................................................................................38 7 Conclusions......................................................................................................39 8 Recommendations............................................................................................41 9 References........................................................................................................43
vii

ix
List of Tables Table 1 LTLD parameters
Table 2 Safety and environmental consequence indices
Table 3 Business interrupt indices and multipliers
Table 4 Generic structures‘ RSR
Table 5 X-braced damaged states pushover analyses
Table 6 Diamond braced damaged states pushover analyses
Table 7 Inverted K-braced damaged states pushover analysis
Table 9 Single diagonal braced damaged states pushover analyses
Table 10 Characteristics of specific structures
Table 11 Summaries of member failure rate data
Table 12 Summary of NS platforms considered
Table 13 Platform vulnerability assessment
Table 14 Consequence assessment parameters
Table 15 Consequence rating
Table 16 Summary of NS risk assessment
List of Figures Figure 1 Baseline structure
Figure 2 Bracing schemes
Figure 3 Relationship between water depth and number of bays
Figure 4 Single manned platform safety rating
Figure 5 Dual manned platform installation safety rating
Figure 6 Example 5 x 5 risk matrix
Figure 7 Summary of TPM methodology
Figure 8 CDF for each of the five generic bracing configurations
Figure 9 Comparison of RRF distributions œ Structure A and diamond braced structure
Figure 10 Comparison of RRF distributions œ Structure B, X and K-braced structure
Figure 11 Comparison of RRF distributions œ Structure C and K-braced structure
Figure 12 Comparison of RRF distributions œ Structure D and diamond braced structure
Figure 13 Risk assessment of North Sea structures
List of Appendices A Jacket Bracing Members
B Water Depth and Structural Bays Data
viii
1 INTRODUCTION
In recent years, much work has been performed to demonstrate the through-life structural integrity and reliability of fixed offshore jacket structures. A relatively sophisticated current method involves the use of non-linear ultimate strength (pushover) analyses of the jacket structures in both the undamaged and damaged states. The results of these pushover analyses are then combined with information pertaining to local environmental conditions and the fatigue lives of joints and members to establish the through life reliability profile based upon the proposed inspection schedule.
Often, analyses are performed on a single jacket and the results are then inferred to other structures that are deemed to be similar in configuration and location, to justify a proposed reliability-based maintenance strategy.
Clearly, performing pushover analyses on every installation in the North Sea may be prohibitively expensive, particularly for clusters of smaller structures, which are similar but not identical.
In light of the above, a need has been identified to produce a technical performance measure for fixed jacket structures to aid in the design and maintenance of reliable structures. The objective of this work is to produce a methodology that can be applied to North Sea structures to assess the structural performance.
The work builds upon previous studies, namely:
· The stress redistribution study that aimed to quantify the effect that a damaged member has on the stress distribution in jacket structures with typical bracing configurations (Reference 1).
· The platform robustness study that aimed to compile a worldwide database of pushover analyses (Reference 2).
· The Flooded Member Detection Joint Industry Project (FMD JIP) that developed a methodology for predicting the structural reliability of jacket structures subjected to FMD inspection using probabilistic fracture mechanics and pushover analyses (Reference 3).
The approach that has been adopted to develop a technical performance measure is based upon a semi-qualitative risk assessment. A methodology has been developed to enable a measure of the structure‘s performance in terms of reliability and consequence of failure. These two parameters are then plotted onto a risk matrix for each structure. From the matrix a first pass assessment can be made of a structure‘s perceived level of risk in comparison to other structures. In generating the measure consideration is given to the platform‘s vintage, location, functionality, and structural configuration (namely the number of legs and bracing scheme adopted).
This report presents the methodology that has been developed to derive both the likelihood of structural failure and the consequence of structural failure. The report also presents the application of this approach to a selection of North Sea Platforms and provides a commentary on the applicability of the methodology to various classes of jacket structures and water depths.
1

2

2 METHODOLOGY
2.1 OVERVIEW
The objective of this study is to develop a technical performance measure for the design and maintenance of reliable fixed jacket structures. However, since the UKCS is a mature area and instances of new build jackets being utilised to develop new fields are rare, the emphasis in this study is on the assessment of existing structures.
In order to produce the technical performance measure (TPM) a consistent methodology must be developed and applied to individual structures. This methodology should simply be capable of providing a first pass assessment of a structure‘s risk of collapse. Hence, the TPM should consider both the vulnerability to, and the consequence of, structural failure.
Since the dominant loading mechanism on the UKCS is due to the harsh environment, the methodology should use this as the basis for determining a structure‘s likelihood of collapse. The methodology developed as part of this study takes into consideration jacket location and
features; namely the;
· Number of legs
· Bracing configuration
· Vintage
· Platform functionality.
These ”features‘ are used to provide an estimate of jacket vulnerability to storm loading and the consequence of structural collapse, the latter taking into consideration safety, environmental and economic concerns.
To aid understanding of the methodology the following definitions are presented:
Reserve Strength Ratio, RSR This is the ratio between the base shear at structural collapse of the undamaged structure to the design base shear, i.e.
BSult _ undamagedRSR = BSdesign
Design practice on the UKCS has resulted in the use of the 100-year storm or the 50-year storm as the design load.
Damage Strength Ratio, DSR This is the ratio between the base shear at structural collapse for the damaged structure to the design base shear; i.e.
BSult _ damagedDSR = BSdesign
3

Residual Reserve Factor, RRF This is the ratio between the base shear at structural collapse for the structure in the damaged state to the base shear at structural collapse for the undamaged structure; i.e.
DSRRRF = RSR
Each of these parameters is used extensively in generating the vulnerability measure, which is one component of the TPM.
The methodology that has been developed here to assess a structure‘s consequence of failure is based upon a semi-qualitative —scorecard“ approach and takes into consideration the structure‘s functionality and manning levels. Each of these factors is considered in terms of the impact structural failure of an installation has on safety, the environment and interruption to the operator‘s business.
2.2 VULNERABILITY ASSESSMENT
The jacket vulnerability assessment takes into consideration structure-specific attributes and generic structural performance attributes that have been derived from work undertaken as part of this study and that reported in Reference 1. The structure-specific attributes are namely the RSR, location, and number of bracing members. The generic structural performance attributes are the levels of redundancy offered by various bracing schemes and how these impact structural reliability. These levels of redundancy are represented by RRF values derived from the generic structures.
Reference 1 presents details of five generic structures that were developed to help form an understanding of how various bracing configurations accommodate structural damage in terms of load redistribution, ultimate strength and structural reliability. The 5 generic structures were developed based upon a baseline structure (see Figure 1 for schematic representation).
The baseline structure is a four-legged jacket standing in approximately 45m of water, with the following key characteristics:
· N° of legs 4
· Batter; North 6.185°
South 1.606°
· Topsides weight 1200 tonnes
· Bays 3
· Piles 2 per leg
· Conductors 18 (OD = 0.685m, WT = 0.030m)
(Three rows of six running (North to South)
4

-43.5 m
-26 m
-8.5 m
+10 m
+21.5 m
z
East
North
-43.5 m
-26 m
-8.5 m
+10 m
+21.5 m
z
East
North
Figure 1 Baseline structure
Five common bracing schemes were applied to the baseline structure, as illustrated in Figure 2:
· X-bracing
· Diamond bracing
· Inverted K-bracing
· K-bracing
· Single diagonal bracing
These bracing schemes are commonly adopted on North Sea jackets as illustrated or as a hybrid of two or more.
Single Diagonal Inv. K KSingle Diagonal Inv. K K
X DiamondX Diamond
Figure 2 Bracing schemes
5

For each of the five generic structures, RRF distributions have been developed that represent the damage states involving vertical bracing members. These distributions provide representation of the levels of redundancy or robustness that a particular bracing configuration offers. The justification for the use of the generic RRF distributions is as follows:
· The RSR and DSR distribution for real structures are very much structure specific since they are functions of implicit and explicit conservatism in the structures‘ design process such as:
· Conservatism in the industry standard design codes.
· Variability in material yield properties and post yield behaviour.
· Structural detailing.
· Version of design code
Therefore one would not expect characterisation of generic behaviour of structures based upon distributions of the DSR and application to real structures to be realistic.
· The RRF is a measure of redundancy, which is a characteristic of the structural framing. Since the generic structures are ideal structures with pure bracing schemes, i.e. they do not contain combinations of different bracing schemes; the RRF distributions are simply measures of the redundancy that different bracing schemes offer when applied to 4-legged structures. Since the majority of 4-legged structures tend to exhibit relatively pure bracing schemes the application of these distributions to characterise the structural performance of real structures is deemed appropriate. The application to other jacket structures is discussed later.
The vulnerability assessment utilises the generic RRF distributions to define the DSR of a real structure in its most critical damage state, using the structure specific RSR to calculate the jacket reliability. The process comprises a number of steps that are outlined below:
· Categorise structure
· Input structure specific RSR
· Derive limiting RRF, RRFlimiting
· Calculate limiting DSR, DSRlimiting
· Calculate limiting storm return period
· Estimate probability of critical member being severed
· Calculate vulnerability in limiting damage state
The following sub-sections provide a more detailed description of each of these steps.
2.2.1 Categorise Structure
The starting point in the TPM vulnerability assessment methodology is to assign the ”real‘ structure under consideration to one of these generic structures, based upon bracing configuration. Where the structure under consideration exhibits more then one type of bracing scheme, judgement is required to assess which is the dominant bracing scheme in terms of structural failure.
6
2.2.2 Input Structure Specific RSR
The Reserve Strength Ratio, RSR, is obtained by performing non-linear ultimate strength analysis using appropriate FE software and following recognised practice such as that provided in Reference 5. The RSR is typically documented by North Sea operators and therefore should be accessible to the HSE. Furthermore, much work has been conducted in this area on behalf of the HSE by various consultants and thus provides an alternative data source.
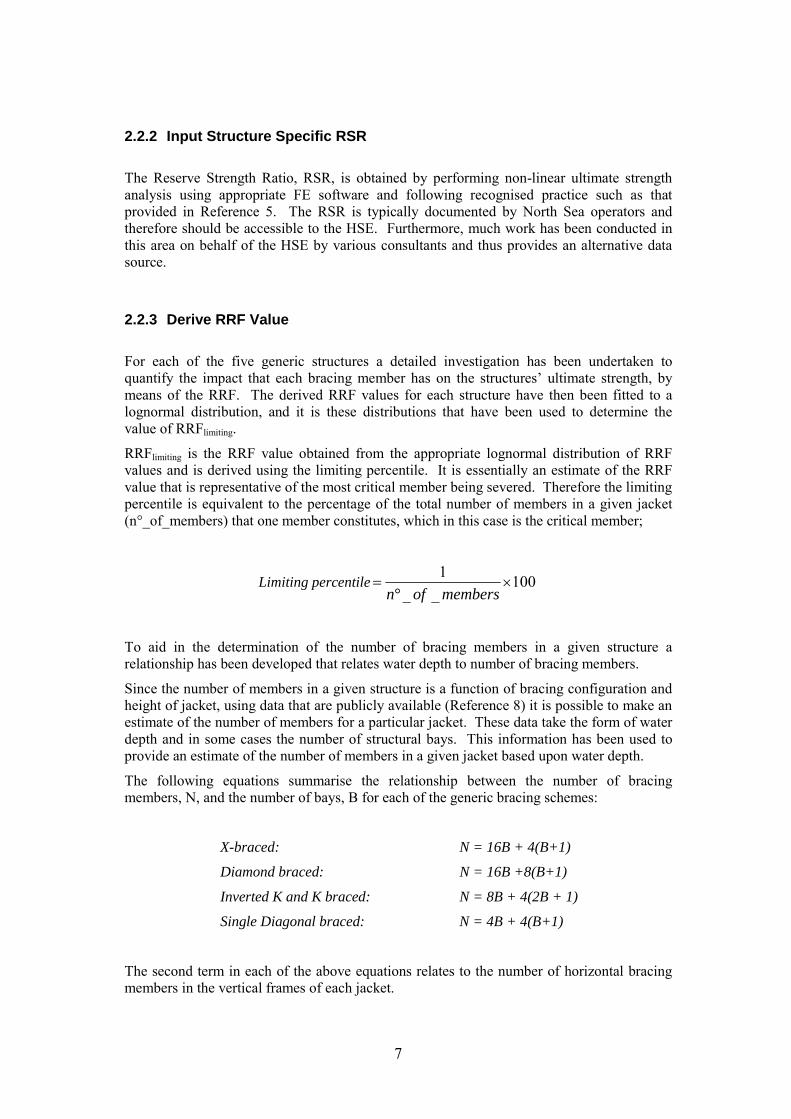
2.2.3 Derive RRF Value
For each of the five generic structures a detailed investigation has been undertaken to quantify the impact that each bracing member has on the structures‘ ultimate strength, by means of the RRF. The derived RRF values for each structure have then been fitted to a lognormal distribution, and it is these distributions that have been used to determine the value of RRFlimiting.
RRFlimiting is the RRF value obtained from the appropriate lognormal distribution of RRF values and is derived using the limiting percentile. It is essentially an estimate of the RRF value that is representative of the most critical member being severed. Therefore the limiting percentile is equivalent to the percentage of the total number of members in a given jacket (n°_of_members) that one member constitutes, which in this case is the critical member;
1Limiting percentile = ´100
n° _ of _ members
To aid in the determination of the number of bracing members in a given structure a relationship has been developed that relates water depth to number of bracing members.
Since the number of members in a given structure is a function of bracing configuration and height of jacket, using data that are publicly available (Reference 8) it is possible to make an estimate of the number of members for a particular jacket. These data take the form of water depth and in some cases the number of structural bays. This information has been used to provide an estimate of the number of members in a given jacket based upon water depth.
The following equations summarise the relationship between the number of bracing members, N, and the number of bays, B for each of the generic bracing schemes:
X-braced: N = 16B + 4(B+1)
Diamond braced: N = 16B +8(B+1)
Inverted K and K braced: N = 8B + 4(2B + 1)
Single Diagonal braced: N = 4B + 4(B+1)
The second term in each of the above equations relates to the number of horizontal bracing members in the vertical frames of each jacket.
7

The relationship between water depth and number of bays has been derived from the data in Appendix B, which was taken from Reference 8.
Wat
er D
epth
The following equation summarises the results from the linear regression performed on the data set used in generating the above plot.
B = (WD + 45.5)/36.2
Where B is the number of bays and is an integer, and WD is the water depth.
However, it should be emphasised that the reliance on this relationship is in practice likely to be limited since information on the number of structural bays for individual structures tends to be readily available.
180
160
140
120
100
80
60
40
20
0 1 2 3 4 5 6
y = 35.197x - 45.538
Number of Bays
Figure 3 Relationship between water depth and number of bays
2.2.4 Calculate DSR
The damage strength ratio, DSR, is determined from the product of the RRF and the RSR. For the purpose of the TPM the DSR is based upon the most critical damage state, i.e. that giving rise to RRFlimiting.
2.2.5 Calculate Limiting Storm Return Period
As is the case for the undamaged structure, the storm return period that is associated with the DSR is determined from the Long Term Load Distribution, LTLD. Since the DSR is a ratio
8
7

between the design load (normally the 100 year storm load) and the collapse storm load of the damaged structure, the DSR is equal to E, and hence Pdamaged can be determined for the damaged structure in the same way as Pintact.
The return period that is associated with the DSR is determined from the Long Term Load Distribution, LTLD, (Reference 5). The LTLD is a log-linear relationship between the ratio of the storm wave‘s return period and the return period of the design wave (typically 100 years). Typical relationships have been derived for the three North Sea sectors and it is these relationships that form an input into this methodology. These relationships are defined by the following equation:
Pdamaged =A exp -æçè E
E o
ö÷ø
where Pdamaged is the annual probability of the occurrence of a storm exceeding a load, E, and E=ERP/E100 where ERP is the load corresponding to a given return period, RP, and E100 is the most probable 100 year load. In the above equation, A and Eo are constants and the equation is only valid for values of E>0.8. In this assessment A and Eo are based upon the jacket‘s location in the NS, see Table 1.
Table 1 LTLD parameters Sector A E0
NNS 13.09 0.139
CNS 180 0.102
SNS 2543 0.080
Since the DSR is a multiple of the 100-year load, it is equal to E in the above expression, therefore it is possible to determine the probability of the storm that results in structural collapse.
2.2.6 Estimate Probability of Critical Member Being Severed
In order to calculate the probability of member failure, one of two possible approaches may be adopted:
1. Historical data of severed members
2. Probabilistic fracture mechanics
Each approach has its merits and has been investigated as part of previous studies undertaken by EQE (Reference 3). The first approach is an experience-based approach that takes the results of the in-service performance of North Sea platforms. These data have been analysed and member failure rates determined.
The second approach is to calculate a member failure rate using probabilistic fracture mechanics methods. This approach takes into account distributions of defect sizes for different types of welds, fatigue lives and dimensions of individual members. The approach was developed in conjunction with UMIST and attempts to model the ”physics of failure‘ of structural components. The application of such a detailed approach as part of the TPM is
9

considered to be too involved and would require considerable knowledge of individual jacket designs in order to calculate member probabilities of failure.
For the purpose of this study, the probability of member failure utilises the historical data method. This approach is discussed further in Section 4.
2.2.7 Calculate Vulnerability in Limiting Damage State
The approach adopted in determining the structural vulnerability of a given jacket is based upon the ability of the structure to resist storm induced loading whilst in the damage state. Using a probabilistic model it is possible to demonstrate the probability of failure of a structure in the limiting damage state (i.e. the most critical member severed). Given that analytical models, and particularly probabilistic models contain many uncertainties and assumptions there are dangers in quoting absolute values of probability of failure. However, the adoption of this technique is used here to illustrate the relative performance of jackets, and is therefore considered to be suitable.
The vulnerability of a structure that is damaged, Pf, is calculated from:
Pf = Pdamaged . Psever
Where:
Pdamaged = probability of limiting storm.
Psever = probability critical member being severed.
It is possible to adapt the above expression to take into consideration failure of each individual member and, combinations of members, as well as consideration of failure of the undamaged structure. However, the objective of this study is to develop a first point assessment tool for which a large number of jacket structures can be evaluated to provide an initial assessment of the structures‘ risk in the context of structural collapse resulting from storm damage. For this reason only the limiting member is considered, i.e. the member that have the most significant impact on structural capacity, (i.e. RRFlimiting) and which dominates the risk of collapse in a damaged condition.
10

2.3 CONSEQUENCE ASSESSMENT
The consequence assessment takes into consideration the implications of structural collapse, taking into account the impact on safety, the environment and the business. The model that has been developed utilises a ”scorecard‘ approach that considers platform functionality and manning levels.
The consequence rating is the sum of the safety, environmental and business interrupt ratings, weighted appropriately. Since the top priority is safety, the following weighting has been proposed and is used in this study for demonstration purposes:
CR = 0.6SR + 0.3ER + 0.1BR
Where:
CR = Consequence rating
SR = Safety Rating (Sum of Safety Indices)
ER = Environmental Rating (Sum of Environmental Indices)
BR = Business Interrupt Rating (Sum of Business Interrupt Indices)
2.3.1 Safety and Environmental Indices
The Safety Rating, SR, and the Environmental Rating, ER, are calculated using the appropriate safety and environmental indices from Table 2 below.
Table 2 Safety and environmental consequence indices Functionality Safety Environmental
Manned Unmanned
Wellhead 5 3 5
Drilling 3 1 2
Utilities 3 2 2
Quarters 2 - 1
Compression/Process 5 3 4
Export 5 3 5
The safety indices have been factored, taking into consideration the manning of an installation, and the model aims to capture the benefit, from a safety point of view, of bridge-linked installations (where this is considered permanent in respect of the installation‘s anticipated life).
As can be seen in Table 2, a scale of 1 to 5 has been allocated to each of the platform‘s functions; 5 being attributed to functions that pose the highest consequence, should structural collapse of the installation be realised.
Those functions that involve the potential for a significant release of hydrocarbons following structural failure have been apportioned an index of 5 for manned installations and an index of 3 for unmanned installations. Unmanned installations have been assigned a safety index,
11
where applicable, to take into consideration the need for manned intervention should structural failures occur. (It is considered that a platform containing a drilling function is always manned during drilling operations and therefore no index has been assigned to the unmanned drilling function; the omission of an index for the unmanned quarters is self-explanatory.) However, it should be recognised that the assignment of these safety indices, and for that matter the environmental and business interrupt indices, is arbitrary. They have been determined using a simple ranking approach. A more comprehensive study of platform type, location, economics, etc, would enable an improvement in the allocation of such indices.
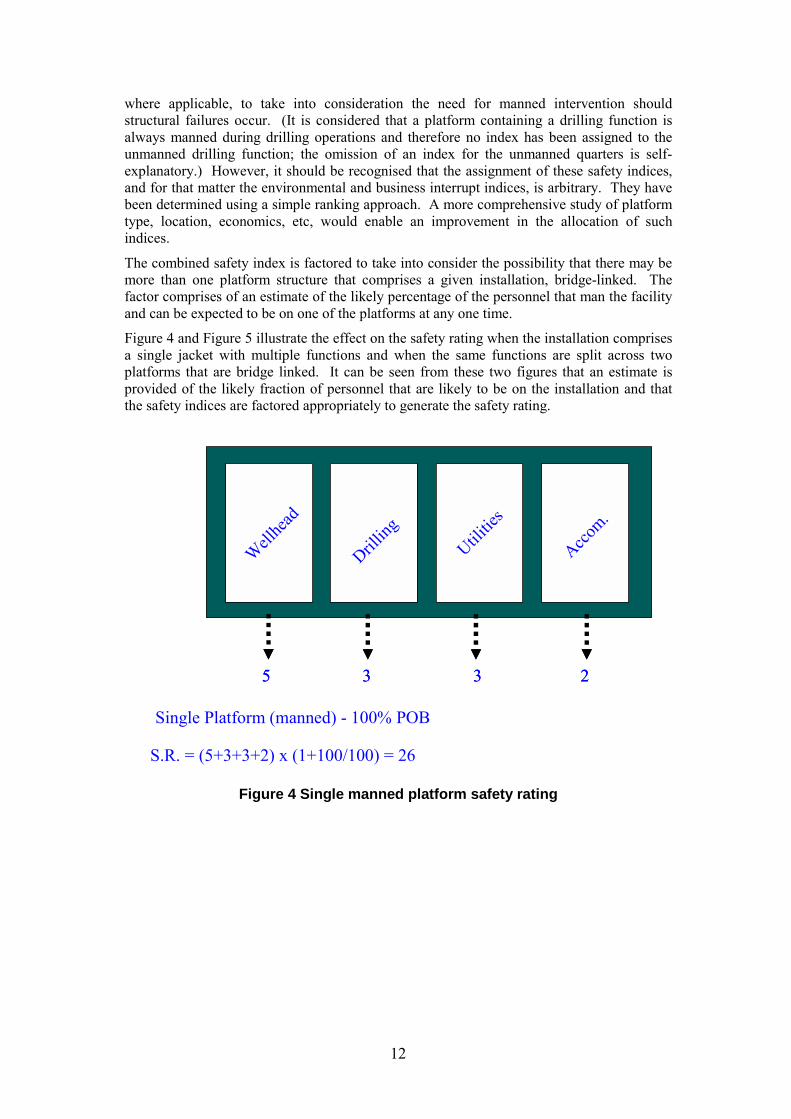
The combined safety index is factored to take into consider the possibility that there may be more than one platform structure that comprises a given installation, bridge-linked. The factor comprises of an estimate of the likely percentage of the personnel that man the facility and can be expected to be on one of the platforms at any one time.
Figure 4 and Figure 5 illustrate the effect on the safety rating when the installation comprises a single jacket with multiple functions and when the same functions are split across two platforms that are bridge linked. It can be seen from these two figures that an estimate is provided of the likely fraction of personnel that are likely to be on the installation and that the safety indices are factored appropriately to generate the safety rating.
Well
head
Drilling
Utilitie
s
Accom.
3 35 23 35 2
Single Platform (manned) - 100% POB
S.R. = (5+3+3+2) x (1+100/100) = 26
Figure 4 Single manned platform safety rating
12

Platform A Platform B
Well
head
Drilling
Utilitie
s
Accom.
20% POB 80% POB
55 33 3 23 2
Two Platforms, Bridge Linked (manned)
S.R.A = (5+3) x (1+20/100) = 9.6 S.R.B = (3+2) x (1+80/100) = 9
Figure 5 Dual manned platform installation safety rating
The environmental rating calculation again takes into consideration the platform‘s functionality and also considers the nature of the field that it is serving, i.e. oil or gas. For the purpose of this study it is considered that an oil field poses a greater environmental consequence than a gas field. However it is recognised that with the exception of the southern North Sea, fields tend to produce both gas and oil. Therefore platforms in such fields are assessed based upon the assumption that they are oil fields since the primary purpose of such installations is to produce oil.
Table 2 also provides details of the environmental indices apportioned to the different platform functions. Those functions that could result in a large release of hydrocarbons have the highest index, i.e. 5 for oil and 3 for gas.
2.3.2 Business Interrupt Indices
The Business Interrupt Rating, BR is calculated used the appropriate indices from Table 3 below.
The business interrupt rating calculation again takes into consideration the platform‘s functionality, but also considers whether the platform is a hub or a satellite/self contained platform. Indices are apportioned to each function based upon the impact that each function might have on field production.
Where a platform is purely a satellite no multiplier is applied to the business interrupt rating. However, where the platform provides centralised functions, in particular export and/or power to a number of other installations then a factor of 2 is applied to the business interrupt rating. As can be seen from Table 3, the factor of 2 has been applied to all but wellhead and drilling since these functions do not service other installations in the case of a fixed platform.
13

Table 3 Business interrupt indices and multipliers Functionality Indices Multiplier
Hub Satellite
Wellhead 4 1 1
Drilling 1 1 1
Utilities 3 2 1
Quarters 3 2 1
Compression/Process 5 2 1
Export 5 2 1
2.4 RISK RANKING
The risk ranking process requires each structure‘s measure of vulnerability and consequence of failure to be plotted on a 5x5 risk matrix, see Figure 6. The risk matrix is aimed at providing a relative risk assessment of jacket structures and should not be used to infer absolute risk.
Vul
nera
bilit
yV
ulne
rabi
lity
VV
IVIV
IIIIII
IIII
II
I II III IV VI II III IV V
ConsequenceConsequence
Figure 6 Example 5 x 5 risk matrix
14

2.4.1 Vulnerability Categories
The following categories have been used within this study for the platform vulnerability assessment:
I Pf ≤ 1x10⁻¹⁰
II Pf ≤1x10⁻⁸
III Pf ≤1x10⁻⁶
IV Pf ≤1x10⁻⁴
V Pf >1x10⁻⁴
These categories have been selected based upon the spread of the calculated annualised probability of failures for the NS jackets considered as part of this study (See Section 5). At this stage in the development of the methodology they are merely to serve for demonstration purposes.
2.4.2 Consequence Categories
The following categories have been used within this study for the platform consequence assessment:
I CR ≤ 10 II CR ≤ 20 III CR ≤ 30 IV CR ≤ 40 V CR > 40
As with the vulnerability categories, these categories have been selected based upon the spread of the calculated consequence rating for the NS jackets considered as part of this study (See Section 5). Again at this stage in the development of the methodology they are merely to serve for demonstration purposes.
2.5 SUMMARY OF TPM METHODOLOGY
Figure 7 presents a chart summarising the TPM methodology described in the previous sections.
15

16
Structural Characteristics
RRF Distributions,
RSR
Location,
LTLD
Vintage,
Historical data
Calculate Pf
Categorise structure
Determine SRDetermine RRFlimiting
Determine ERDetermine storm
probability,
Pdamaged
Determine BRDetermine
Psever
Calculate CR
Functionality,
Manning Levels,
Layout
INPUT INPUTVulnerability Assessment
Consequence Assessment
Risk Profiling
Categorise structure‘s
functionality
Figure 7 Summary of TPM methodology

3 CUMULATIVE DISTRIBUTIONS
3.1 OVERVIEW
The methodology described in the previous section relies upon the definition of cumulative distributions of RRF derived for each of the 5 generic structures. These distributions are based upon a lognormal distribution fitted to the RRF values.
To supplement the RRF values generated as part of the work presented in Reference 1 further pushover analyses have been undertaken, the purpose being to extend the data set already derived to ensure that all bracing members have been considered. However, data have only been generated for the ”East Storm‘ load case, thus the assumption is that this is the limiting storm direction for the structures considered.
3.2 ULTIMATE STRENGTH ANALYSIS
Additional ultimate strength analyses have been conducted as part of this study to supplement those that were conducted as part of the Stress Redistribution Study (Reference 1). These additional runs have extended the current dataset to provide an indication of the effect each bracing member (both parallel and perpendicular to the storm direction) has on the ultimate strength of the jacket. An in-depth description of the pushover methodology using ABAQUS (Reference 4) can be found in Reference 1, however, for completeness, a brief description is provided below.
3.2.1 100-Year RLS
Modern offshore fixed installations are designed to exhibit an elastic load response when exposed to a storm whose return period is predicted to be 100 years. This leads to the concept of a 100 year Reference Load Set, RLS, i.e. the load attributable to the combined wave and wind loading that occurs during a storm which is characterised by a return period of 100 years based upon the findings of Reference 7. Using the fluid-structure interaction model within ABAQUS, i.e. AQUA analysis, it is possible to derive the 100 year RLS for a given wave profile and wind load. A static analysis is performed whereby a single wave with the 100 year profile is passed through the structure and the 100 year wind load is applied to the topsides. The analysis extracts the load distribution from the model and generates a distribution of point loads that may be applied to the structure.
3.2.2 Buckling analysis
For each ultimate strength analysis undertaken a buckling analysis is performed to seed imperfections in the structure, since it is unrealistic to assume that each member in a jacket structure is perfectly straight. The buckling analysis is aimed at identifying those buckling modes that are likely to dominate the structural response of each jacket structure, and it is performed on the pre-stressed structure with the 100 year RLS applied in the bucking load step.
17

The imperfections that are applied in the Riks analysis consist of multiple superimposed buckling modes about the pre-stressed state, and are applied in the form of initial imperfections to the model in the unstressed condition. The structural response is considered to be sufficiently linear under gravity and buoyancy loads and therefore the principle of superimposition is valid.
3.2.3 Pushover analysis
The Riks method in ABAQUS allows for a static analysis to be performed on a model that exhibits instabilities due to buckling or collapse. During buckling or collapse the structure may exhibit a negative stiffness and therefore the structure needs to release strain energy to remain in equilibrium, and thus enable the static analysis to converge. The Riks method enables the static equilibrium state to be determined during the structures unstable response as a result of buckling or collapse.
Unlike conventional static analysis where displacements are determined for a given load, the Riks method uses the load as an additional variable and solves simultaneous equations to determine loads and displacements.
The Riks method requires the definition of ”dead loads‘, Pdead, and ”reference loads‘, Pref. In the pushover analyses dead loads are defined as the structure‘s pre-stressing loads, i.e. gravity and buoyancy loads. The reference load is defined as the RLS. It is this load that is ramped up from zero (initial pre-stressed state) to some pre-defined value as part of the Riks analysis.
The loading during the Riks analysis is always proportional and is related to the total load, Ptotal, applied to the structure by the following relationship:
Ptotal = Pdead + LPF (Pref - Pdead)
The LPF is the value that the ”Riks‘ solver uses to solve the simultaneous equations involving the load and displacement.
The analysis has been set up in this way so that the ultimate strength of a structure is defined by the LPF beyond which the Riks solver starts to unload the structure, or the structures‘ topsides have displaced by 0.75m
18

3.3 RESULTS
Table 4 provides a summary of the RSR values derived from the ultimate strength analysis performed on the five generic jacket structures, in the undamaged state.
Table 4 Generic structures’ RSR Bracing Configuration RSR
X 2.51
Diamond 2.23
Inverted K 2.07
K 2.27
Single diagonal 2.43
Table 5 to Table 9 provide a summary of the DSR and RRF values derived from all of the pushover analyses that have been conducted as part of this study and that reported in Reference 1, for the five generic structures in various damaged states. For damaged states involving severed members in Frame B on all but the single diagonal braced structure, the ultimate strength analysis results are inferred from the results for equivalent damage states involving members in Frame A. This is due to the structures‘ symmetry about their east to west axes.
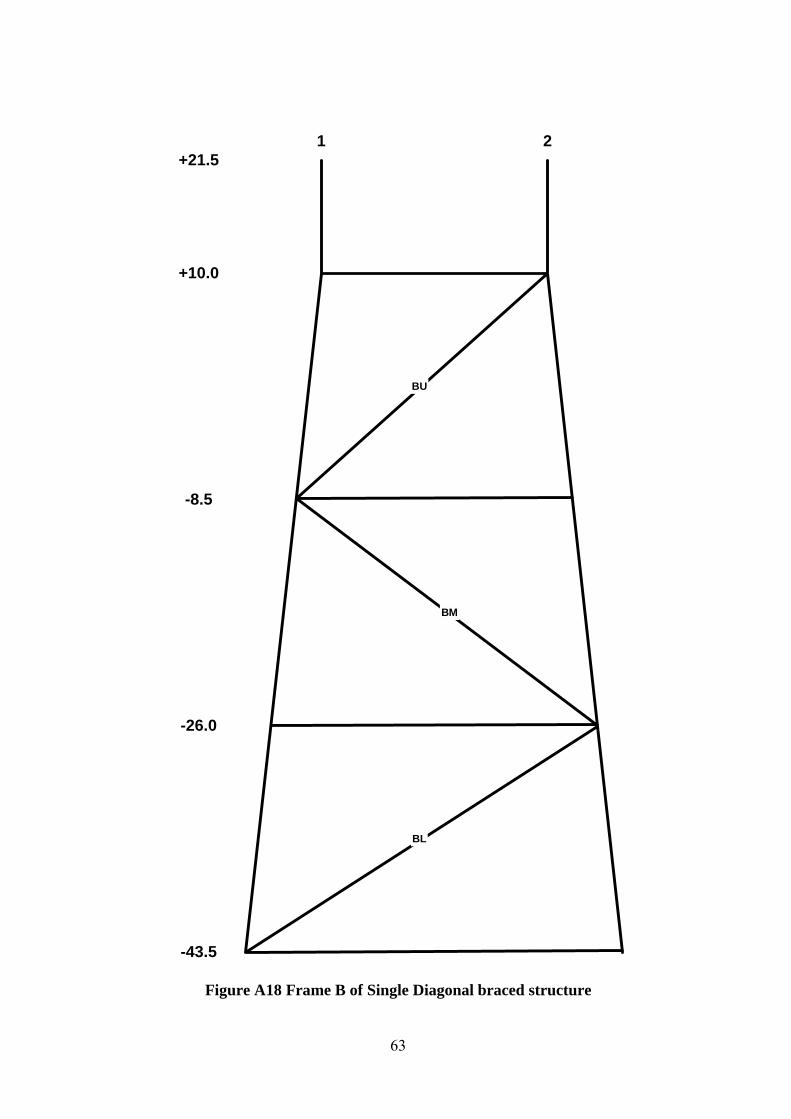
For the single diagonal braced structure, the structure is asymmetrical about the east to west axis and therefore Frame B damage states have been considered explicitly.
Table 5 X-braced damaged states pushover analyses Frame A Frame 1 Frame 2
Severed Member
DSR RRF Severed Member
DSR RRF Severed Member
DSR RRF
AL1L 2.32 0.921 1LAL 2.52 1 2LAL 2.52 1
AL1U 2.22 0.881 1LAU 2.52 1 2LAU 2.52 1
AL2L 2.21 0.877 1LBL 2.52 1 2LBL 2.52 1
AL2U 2.32 0.921 1LBU 2.52 1 2LBU 2.51 0.996
AM1L 2.49 0.988 1MAL 2.52 1 2MAL 2.52 1
AM1U 2.53 1.004 1MAU 2.52 1 2MAU 2.52 1
AM2L 2.53 1.004 1MBL 2.52 1 2MBL 2.52 1
AM2U 2.49 0.988 1MBU 2.52 1 2MBU 2.52 1
AU1L 2.52 1 1UAL 2.52 1 2UAL 2.52 1
AU1U 2.52 1 1UAU 2.51 0.996 2UAU 2.51 0.996
AU2L 2.52 1 1UBL 2.52 1 2UBL 2.52 1
AU2U 2.52 1 1UBU 2.52 1 2UBU 2.51 0.996
19
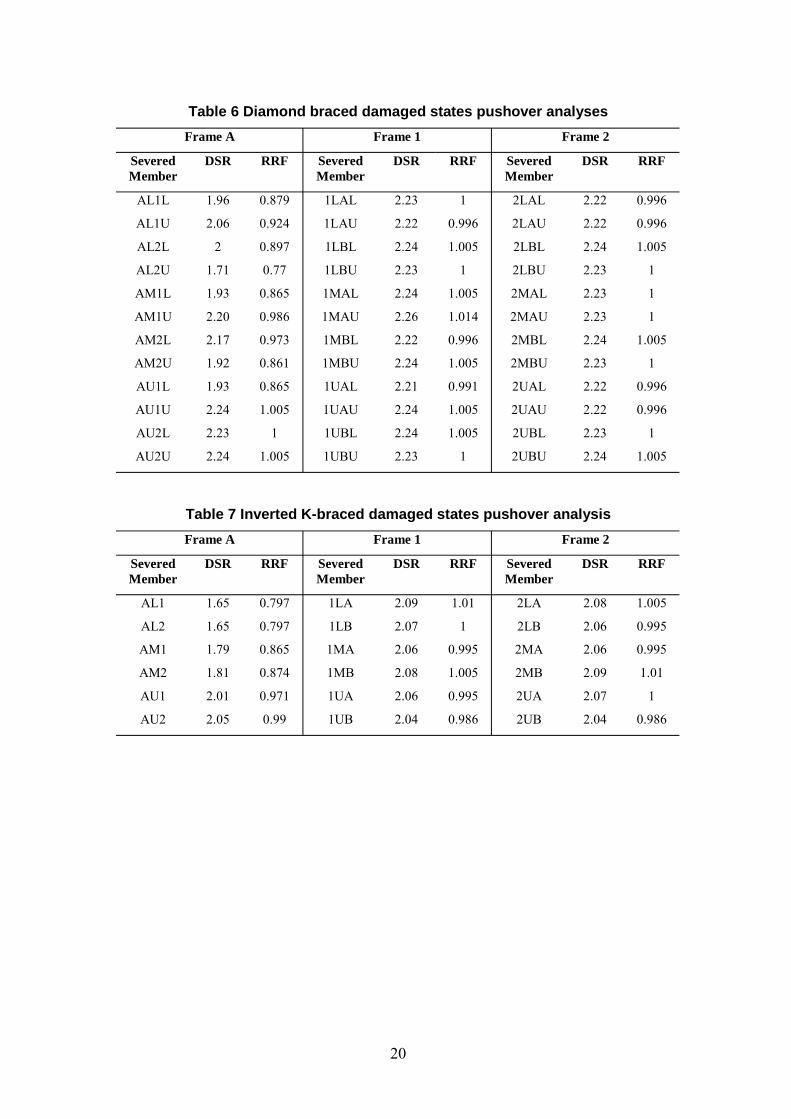
Table 6 Diamond braced damaged states pushover analyses Frame A Frame 1 Frame 2
Severed Member
DSR RRF Severed Member
DSR RRF Severed Member
DSR RRF
AL1L 1.96 0.879 1LAL 2.23 1 2LAL 2.22 0.996
AL1U 2.06 0.924 1LAU 2.22 0.996 2LAU 2.22 0.996
AL2L 2 0.897 1LBL 2.24 1.005 2LBL 2.24 1.005
AL2U 1.71 0.77 1LBU 2.23 1 2LBU 2.23 1
AM1L 1.93 0.865 1MAL 2.24 1.005 2MAL 2.23 1
AM1U 2.20 0.986 1MAU 2.26 1.014 2MAU 2.23 1
AM2L 2.17 0.973 1MBL 2.22 0.996 2MBL 2.24 1.005
AM2U 1.92 0.861 1MBU 2.24 1.005 2MBU 2.23 1
AU1L 1.93 0.865 1UAL 2.21 0.991 2UAL 2.22 0.996
AU1U 2.24 1.005 1UAU 2.24 1.005 2UAU 2.22 0.996
AU2L 2.23 1 1UBL 2.24 1.005 2UBL 2.23 1
AU2U 2.24 1.005 1UBU 2.23 1 2UBU 2.24 1.005
Table 7 Inverted K-braced damaged states pushover analysis Frame A Frame 1 Frame 2
Severed Member
DSR RRF Severed Member
DSR RRF Severed Member
DSR RRF
AL1 1.65 0.797 1LA 2.09 1.01 2LA 2.08 1.005
AL2 1.65 0.797 1LB 2.07 1 2LB 2.06 0.995
AM1 1.79 0.865 1MA 2.06 0.995 2MA 2.06 0.995
AM2 1.81 0.874 1MB 2.08 1.005 2MB 2.09 1.01
AU1 2.01 0.971 1UA 2.06 0.995 2UA 2.07 1
AU2 2.05 0.99 1UB 2.04 0.986 2UB 2.04 0.986
20

Table 8 K-braced damaged states pushover analyses
Frame A Frame 1 Frame 2
Severed Member
DSR RRF Severed Member
DSR RRF Severed Member
DSR RRF
AL1 1.86 0.819 1LA 2.26 0.996 2LA 2.28 1.004
AL2 1.85 0.815 1LB 2.28 1.004 2LB 2.39 1.053
AM1 1.85 0.815 1MA 2.27 1 2MA 2.28 1.004
AM2 1.88 0.828 1MB 2.26 0.996 2MB 2.27 1
AU1 2.33 1.026 1UA 2.27 1 2UA 2.27 1
AU2 2.33 1.026 1UB 2.26 0.996 2UB 2.24 0.987
Table 9 Single diagonal braced damaged states pushover analyses Frame A Frame B Frame 1 Frame 2
Severed Member
DSR RRF Severed Member
DSR RRF Severed Member
DSR RRF Severed Member
DSR RRF
AL 1.94 0.798 BL 2.16 0.889 1L 2.42 0.996 2L 2.42 0.99 6
AM 2.08 0.856 BM 2.27 0.934 1M 2.42 0.996 2M 2.43 1
AU 2.45 1.008 BU 2.44 1.004 1U 2.43 1 2U 2.43 1
3.4 DATA ANALYSIS
A lognormal distribution has been assumed to represent the distribution of RRF values for each structure. It is assumed that the RRF value for damage states involving a particular class of structure is a random variable whose natural logarithm is normally distributed. This distribution is characterised by the following probability density function, PDF:
2é ù ( )
( ) êê ë
çç è
æ -=
ln 2 1 exp
2 1
V
l
pV
x x
xf X ö- 0 £ x < ¥ú úû
÷÷ø
where ζ and λ are the distribution parameters that define the distribution‘s shape and location.
The expected value and the variance of the distribution are given by:
2 ö 2
)(e 1)æ V (X Var = E 2 X) ( V
( )X E = ÷÷+ççè
exp l -
2 ø
21

The cumulative distribution function, CDF, is given by the following function:
x
x ( V dFX ( ) = X P £ x ) = ò f ( ) VX 0
Figure 8 illustrates the curves that have been generated as part of this study.
CD
F
1
0.9
0.8
0.7
0.6
0.5
0.4
0.3
0.2
0.1
0
0.5 0.6 0.7 0.8 0.9 1 1.1 1.2 RRF
Figure 8 CDF for each of the five generic bracing configurations
The curves presented in Figure 8 illustrate the robustness of each of the bracing configurations to failure of a single bracing member. The results confirm the lower robustness of the two K bracing configurations and highlight the greater robustness of the X bracing configuration.
K
X
Single Diagonal
Inv K Diamond
22
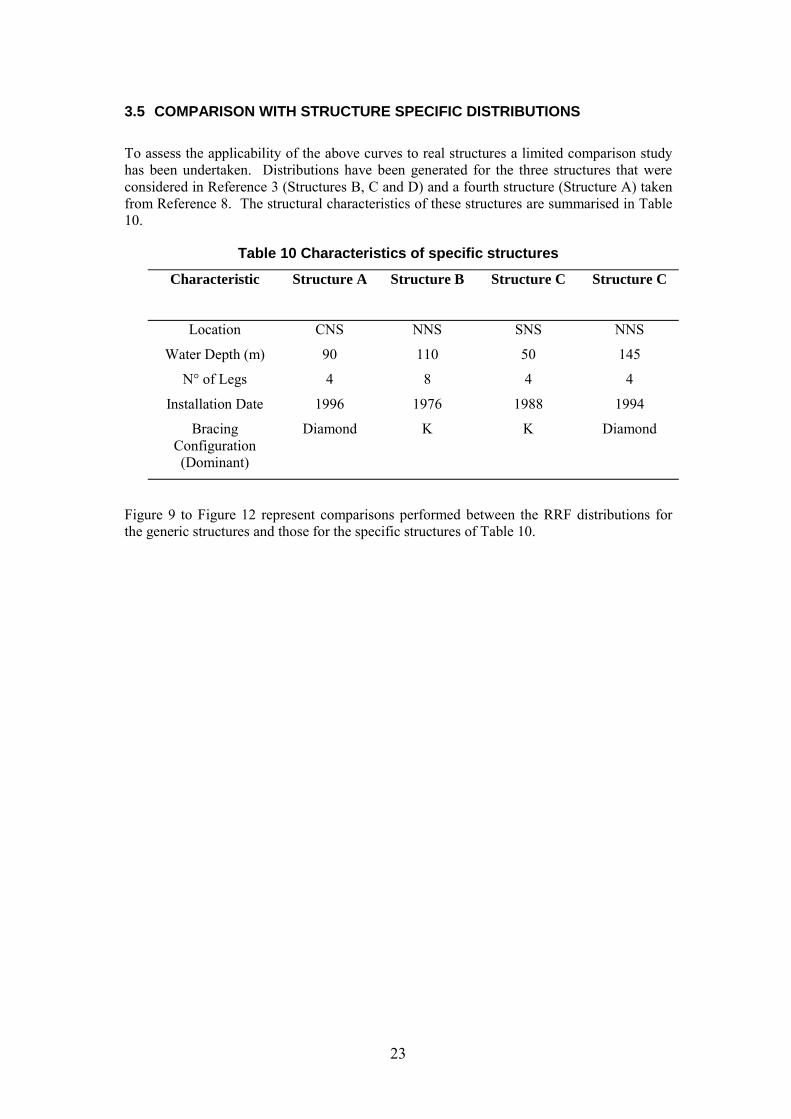
3.5 COMPARISON WITH STRUCTURE SPECIFIC DISTRIBUTIONS
To assess the applicability of the above curves to real structures a limited comparison study has been undertaken. Distributions have been generated for the three structures that were considered in Reference 3 (Structures B, C and D) and a fourth structure (Structure A) taken from Reference 8. The structural characteristics of these structures are summarised in Table 10.
Table 10 Characteristics of specific structures Characteristic Structure A Structure B Structure C Structure C
Location CNS NNS SNS NNS
Water Depth (m) 90 110 50 145
N° of Legs 4 8 4 4
Installation Date 1996 1976 1988 1994
Bracing Diamond K K Diamond Configuration (Dominant)
Figure 9 to Figure 12 represent comparisons performed between the RRF distributions for the generic structures and those for the specific structures of Table 10.
23

0
1
CD
F
Di
0.2
0.4
0.6
0.8
amond Braced Structure A
0.7 0.8 0.9 1
RRF
Figure 9 Comparison of RRF distributions – Structure A and diamond braced structure
From Figure 9 it can be seen that there is a good correlation between the RRF distributions for the damage states involving vertical members in Structure A and the diamond braced structure. Although Structure A is in deeper water than the diamond braced structure, the bracing scheme is principally the same (Structure A has additionally skirt framing local to the mud line), being diamond braced, and therefore its level of structural redundancy is considered to be similar.
It is worth noting however, that for the most critical damage states (lower half of distribution) the generic curve will overpredict the RRFlimiting and thus result in a slightly non-conservative reliability prediction in comparison to a prediction utilising the structure specific distribution.
24
1.1

0
1
CD
F
0.2
0.4
0.6
0.8
Structure B X-braced K-braced
0.7 0.8 0.9 1 RRF
Figure 10 Comparison of RRF distributions – Structure B, X and Kbraced structure
From Figure 10 it can be seen that the correlation between Structure B and the K-braced structure RRF distributions is poor. Although Structure B is predominantly K-braced, which may be regarded as a lower redundancy bracing scheme (Reference 1), it has 8 legs which provide additional redundancy to the structural framing. Therefore, comparison with the 4 leg, K-braced generic structure is inappropriate, and hence the RRF distribution for the X-braced generic structure is also plotted in Figure 10. The X-braced structure possesses the highest levels of structural redundancy of the five generic structures (Reference 1). Comparison of the RRF distribution for Structure B with that of the X-braced structure demonstrates some level of correlation, mainly with the general profile of the distribution. However, it is worth noting that the RRF distribution for Structure B is based upon a small sample of damage states and therefore this may account for the lack of correlation with the generic structures‘ RRF distributions.
It is likely that the application of the 4 leg generic structures‘ RRF distributions to larger real structures (i.e. those with 6 or more legs) is not appropriate due to the limited ability of the generic bracing configurations within a 4 leg structure to be representative of bracing configurations in larger structures. This demonstrates the limitation of the current study, i.e. it is not possible to assess larger structures (which make up approximately 50% of jackets on the UKCS) based upon the existing findings.
25
1.1

0
1
CD
F
K Braced
0.2
0.4
0.6
0.8
Structure C
0.6 0.7 0.8 0.9 1 1.1 RRF
Figure 11 Comparison of RRF distributions – Structure C and K-braced structure
From Figure 11 it can be seen that there is good correlation between the RRF distributions for the damage states involving the vertical braces of Structure C and the K-braced structure. However, it should be noted that these structures are similar in terms of size, water depth and overall structural configuration.
26

0
1
CD
F
0.2
0.4
0.6
0.8
Diamond Braced Structure D
0.8 0.9 1 1.1 RRF
Figure 12 Comparison of RRF distributions – Structure D and diamond braced structure
From Figure 12 it can again be seen that the generic diamond braced structure RRF distribution represents a deeper water real diamond braced structure reasonably well. Unlike the case for Structure A where the use of the generic distribution would lead to a slightly non-conservative reliability prediction, in this case the generic distribution leads to a slightly conservative reliability prediction.
27

28

4 PROBABILITY OF MEMBER FAILURE
As stated in Section 2 the probability of member failure is derived from historical data that were complied as part of Reference 3. The data takes the form of the number of platforms damaged against the number of platform operating hours for different platform vintages. For the purpose of this study the data is presented in terms of a damage rate for platforms that were installed in each of the following date ranges:
· Pre 1970
· 1971 to 1980
· 1981 to 1990
· Post 1990
For the purpose of this study it is assumed that platform damage equates to damage to the most critical member in the structure. This is undoubtedly a conservative assumption but is considered to be reasonable in the context of the current study. Table 11 summarises the raw data and the critical member failure rates used in this study.
Table 11 Summaries of member failure rate data Vintage No. of Total No. of Critical Member Damage
Platforms Platform Platforms Rate / Platform Years Installed Years Damaged
Pre 1970 18 541 5 0.009 1971-1980 52 1157 19 0.016 1981-1990 72 878 6 0.007 Post 1991 56 279 1 0.004
The critical member failure rates are defined as an annual failure rate and therefore they can be used to determine the probability of member failure in a given inspection
Psever = R.FRmember
Where:
FRmember = annual probability of member failure per platform year (Price Coefficient)
R = the inspection period in years
For the purpose of this study a three-year inspection interval has been assumed.
29

30

5 RISK RANKING OF NORTH SEA INSTALLATIONS
5.1 OVERVIEW
A risk ranking exercise has been conducted on a selection of North Sea installations. The extent of this exercise has been somewhat limited by the lack of public domain data on RSR values but nonetheless sufficient data are available to demonstrate the concept such that confidence can be gained in the application of the method.
Table 12 summarises the structures that have been considered in this study. Information is presented on functionality, age, sector and structural configuration.
Table 12 Summary of NS platforms considered Platform Location Water Inst. N° of No of Bays Bracing Scheme No of
ID Depth Year Bays Calculated Longitudinal Transverse
members (m)
Frames Frames P01 P02 P03 P04 P05 P06 P07 P08 P09 P10 P11 P12 P13 P14
NNS NNS NNS NNS NNS SNS SNS SNS SNS NNS NNS CNS NNS NNS
87 116 90 90 90 50 50 50 27 89
141 85 90
145
92 95 97 97 97 88 88 88 66 97 77 90 96 94
-4 ---3 3 3 3 -5 3 3 -
4 4 4 4 4 3 3 3 2 4 5 4 4 5
X X X X X K K K K D IK X D D
X X X X X K K K K D IK X D D
84 84 84 84 84 52 52 52 36
104 84 84
104 128
The number of structures is limited by the amount of RSR data available in the public domain. However, it should be emphasised that this does not highlight a deficiency in the methodology. RSR data are generated by operators for fixed jacket installations since the RSR is one parameter that is taken into consideration when developing the justification for a chosen inspection scheme.
31

5.2 VULNERABILITY ASSESSMENT
Table 13 below summarises the vulnerability calculations that have been performed on the selection of NS structures that have been considered in this study.
Table 13 Platform vulnerability assessment Platform RSR RRFlimiting DSR Pdamaged Pmember Pf Vulnerability
ID Category
P01 3.54 0.8988 3.18 1.4988E-09 0.012 1.305E-10 II P02 2.57 0.8988 2.31 7.9388E-07 0.012 1.303E-07 III P03 1.91 0.8988 1.72 5.6649E-05 0.012 1.461E-05 IV P04 2.98 0.8988 2.68 5.6024E-08 0.012 6.995E-09 II P05 3.61 0.8988 3.24 9.5319E-10 0.012 7.944E-11 I P06 1.7 0.7634 1.31 2.2915E-04 0.021 6.282E-06 IV P07 1.7 0.7634 1.31 2.2915E-04 0.021 6.282E-06 IV P08 1.7 0.7634 1.31 2.2915E-04 0.021 6.282E-06 IV P09 1.987 0.7755 1.56 1.0970E-05 0.027 3.366E-07 III P10 2.18 0.8071 1.77 4.1623E-05 0.012 2.497E-06 IV P11 2.831 0.7651 2.19 2.2346E-06 0.048 1.251E-07 III P12 1.89 0.8988 1.70 1.0529E-05 0.021 1.802E-06 IV P13 3.202 0.8071 2.60 1.1016E-07 0.012 2.602E-09 II P14 2.04 0.8026 1.65 1.0023E-04 0.012 6.671E-06 IV
32

5.3 CONSEQUENCE ASSESSMENT
Table 14 below summarises the parameters that are used by the consequence assessment to determine the consequence rating of each of the NS structures considered in this study.
Table 14 Consequence assessment parameters Platform
ID W D U Q C/P E F M POB H S
P01 Y Y Y Y Y Y Gas Y 100 Y P02 Y Y Y Y Y Y Oil Y 100 Y P03 Y Y Y Oil N - Y P04 Y Y Y Y Oil Y 50 Y P05 Y Y Oil Y 50 Y P06 Y Y Gas N - Y P07 Y Y Gas N - Y P08 Y Y Gas N - Y P09 Y Gas Y 10 Y
P10 Y Y Y Y Y Y Gas / Con Y 100 Y
P11 Y Y Y Y Y Oil Y 100 Y P12 Y Y Y Y Y Oil Y 100 Y P13 Y Y Oil N - Y P14 Y Y Y Y Y Oil Y 100 Y W = Wellhead, D = Drilling, U=Utilities, Q = Quarters, C/P = Compression or Process, E = Export,
F = Field Type, M = Manned, H = Hub, S = Satellite
33

Table 15 summarises the results obtained for the NS structures considered using the methodology described in Section 2.
Table 15 Consequence rating
Platform ID Consequence Rating
Consequence Category
P01 38 IV P02 40 V P03 11 II P04 27 III P05 7 I P06 6 I P07 6 I P08 6 I P09 5 I P10 35 IV P11 33 IV P12 33 IV P13 8 I P14 33 IV
34

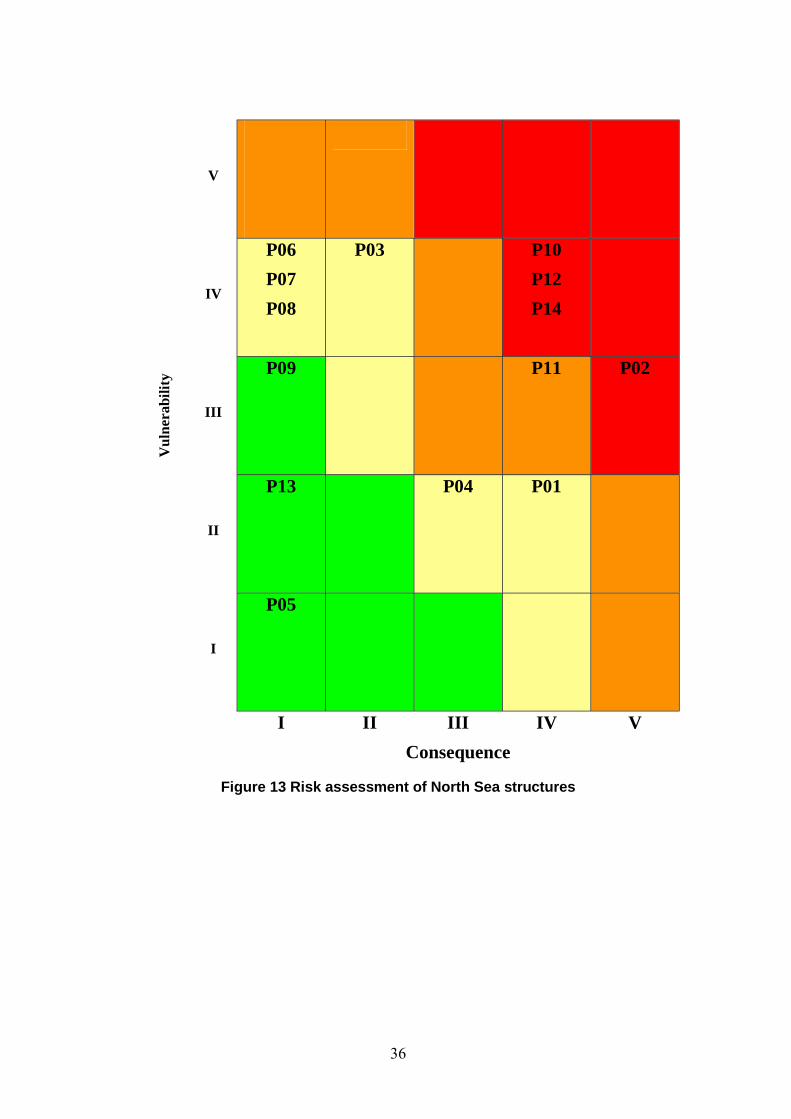
5.4 RISK ASSESSMENT
The results from the consequence assessment and the vulnerability study have been mapped onto a 5x5 risk matrix, see Figure 13, and are summarised in Table 16 below for completeness.
Table 16 Summary of NS risk assessment
Platform ID Vulnerability Category
Consequence Category
P01 II IV P02 III V P03 IV II P04 II III P05 I I P06 IV I P07 IV I P08 IV I P09 III I P10 IV IV P11 III IV P12 IV IV P13 II I P14 IV IV
Those structures that are considered to pose a higher risk by the TPM are those structures that are located in the deeper waters of the CNS and the NNS. They are fully manned and self-contained installations.
Those structures that are considered to pose the lower risk by the TPM are those structures that are unmanned satellite wellhead platforms and exhibit high RSR values.
35
Vul
nera
bilit
y V
IV
III
II
I
P06 P07 P08
P03 P10 P12 P14
P09 P11 P02
P13 P04 P01
P05
I II III IV Consequence
Figure 13 Risk assessment of North Sea structures
36
V

6 LIMITATIONS OF METHOD
6.1 ASSESSMENT OF LARGER STRUCTURES
The methodology that has been developed is based upon four-legged structures in shallow water (i.e. 40 to 50 metres of water). The methodology has been developed and extended to take into consideration 4-legged jackets in much deeper waters such as the CNS and the NNS. Comparison of RRF distributions for several real structures with the appropriate generic structure‘s distribution has demonstrated this to be reasonable. However, it should be recognised that the extent of the comparisons has been limit to several generic bracing schemes and therefore consideration should be given to extending the generic structures to consider deeper water structures.
Preliminary comparison of the generic RRF distributions to those obtained for larger structures (i.e. 6 or more legs) has highlighted a current limitation of the TPM methodology. The RRF distributions show significant differences, which are attributed to the additional redundancy provided by the legs of such larger structures when compared with equivalent bracing configurations in 4-legged structures.
6.2 AIR GAP
The study has not considered the impact of a structure‘s airgap on structural reliability. Airgap is defined as the minimum deck clearance above the maximum 100-year (or 50 year) surface elevation of the sea. The vulnerability assessment described in this report does not take into consideration the additional loading imparted on the jacket structure as a result of the air gap being fully eroded and the wave entering the deck structure of a platform.
6.3 FAILURE MODES
The jackets that comprise the database were designed to promote failure in the bracing. During the design phase of these jackets, failures were observed in the piles, i.e. yielding of the section. Furthermore the piles were modelled as simple beams with their end points fixed. There was no soil to structure interaction modelled.
6.4 STRESS REDISTRIBUTION EFFECTS
When determining the limiting damage state no consideration has been given to stress redistribution effects and the impact that these have on other members in a structure. Since the vulnerability assessment is based upon a three-year inspection schedule it is possible for redistribution effects to result in accelerated fatigue damage accumulation in members and thus the limiting damage state may actually comprise of two or more members. Explicit consideration of such effects in the RRF distributions would require a significant effort in modelling multi-member failure cases and, therefore, consideration should be given to the possibility of a more practical approach to considering these effects.
37
6.5 PROBABILITY OF MEMBER FAILURE
The probability of a member failing is derived from the raw data that were compiled in support of Reference 3. The vulnerability assessment makes use of these historical data to derive member failure rates. The limitations of this approach are as follows:
· A constant failure rate model is assumed for critical members, hence consideration of time dependent degradation mechanisms such as fatigue are not considered explicitly. Such mechanisms have contributed to the failures observed and recorded in the historical data and are therefore considered implicitly in the vulnerability assessment.
· This data are now several years out of data and therefore may not be truly reflective of operating experience to date.
· The data used in this study do not discriminate between damage to primary structure and to secondary structure in jackets.
· The approach assumes that damage to a structure equates to the most critical member being severed. This is undoubtedly a conservative assumption but is considered sufficient for the purposes of this study.
6.6 CONSEQUENCE ASSESSMENT
The consequence assessment is based upon a scorecard approach that considers platform functionality whether it is manned or unmanned and whether it produces oil. At present, it has only been developed to a high level, which is considered adequate for screening purposes since the emphasis in this study is on the risk to human life. The assessment approach has deliberately steered cleared from comparing manning levels between installations such that, if two identical installations were to have different manning levels, they would still be considered to pose the same level of risk.
The consequence assessment could take the form of a financial rating with safety, age, functionality, field size and other economic factors all being taken into consideration. Such an approach would be able to distinguish between the case outlined in the previous paragraph and would serve as a useful tool for an operator to perform a risk ranking on all of his assets.
38

7 CONCLUSIONS
· A ”Technical Performance Measures‘ (TPM) methodology has been developed that is capable of providing a first point assessment of North Sea Jackets
· The methodology employs a semi-quantitative approach to assessing the structural reliability of individual installations as opposed to the fully quantitative structural reliability predictions that are currently employed in performance assessment in the North Sea. The approach takes into consideration the age of the structure, structural configuration and functionality to generate a relative risk index. This index is semi-qualitative and provides an indication of the structure‘s performance in relation to other steel jacket fixed installations.
· The measure of platform vulnerability is based upon the undamaged structure and when the structure‘s most critical bracing member is severed.
· The measure of a platform‘s consequence of failure is based upon a scorecard approach that considers the nature of the field and the platform‘s functionality. Benefit is taken from a bridge-linked complex.
· The methodology presented in this report has used a number of arbitrary values in which to derive key components of both the likelihood and consequence measures. These values have been chosen for demonstration purposes only and may not be representative of values that would ultimately be used upon implementing this tool within a screening process.
· The TPM is based upon environmental loading and does not consider other potential causes of structural failure. Furthermore, the likelihood of structural failure makes use of the Long Term Load Distribution (LTLD) developed as part of work conducted in Reference 5. Consideration is not given to airgap erosion, and as such, wave in-deck forces are not considered.
39

40

8 RECOMMENDATIONS
The TPM model developed as part of this work has been developed to provide a reasonable first point assessment of structural performance and hence risk profile of a selection North Sea Jackets. However the following recommendations are made for future development of the TPM methodology:
· Consider implication of air gap erosion on vulnerability assessment.
· Extend generic structures RRF distributions to encompass deeper water 4-leg structures and structures with 6 or more legs.
· Take into consideration stress redistribution and the impact that this has on structural reliability.
· Refine Consequence Assessment such that a financial loss potential is determined.
· Benchmark methodology against a larger data set of real structures.
41

42

9 REFERENCES
1 Stress Redistribution in Platform Substructures Due to Primary Member Damage and its Effect on Structural Reliability, EQE Report N° 45-20-R-01, Issue 1, 28th September 2001
2 Effect of Platform Robustness on Inspection Planning, EQE Report N° 301306.01, June 2000
3 Guidance on the Use of Flooded Member Detection for Assuring the Integrity of Offshore Platform Structures, EQE Report N°179-03-R-07, Issue 1, 6th June 2000.
4 ABAQUS v5.8, Hibbitt, Karlsson & Sorensen Inc.
5 ULTIGUIDE Best Practice Guidelines for the Use of Non-Linear Analysis Methods in Documentation of Ultimate Limit States for Jacket Type Offshore Structures, DNV œ SINTEF œ Bomel, April 1999
6 M Efthymiou, J W van de Graaf, P S Tromans and I M Hines, —Reliability Based Criteria for Fixed Offshore Steel Platforms“, OMAE Conference, June 1996, Florence.
7 Peters D J, Shaw C J, Grant C K, Heideman J C and Szabo D, —Modelling the North Sea Through The North European Storm Study“, OTC 7130, 1993.
8 A JIP to Assess Online Monitoring as a Means For The Assurance of Structural Integrity, 179-05-R-01.
9 OPL North Sea Field Development Guide, 6th Edition
43

44

APPENDIX A
Jacket Bracing Members
45

1 2 +21.5
+10.0
-8.5
-26.0
-43.5
Figure A1 Frame A of X-braced structure
AU1U AU2U
AU1L AU2L
AM1U AM2U
AM1L AM2L
AL1U AL2U
AL1L AL2L
46

1 2 +21.5
+10.0
-8.5
-26.0
-43.5
Figure A2 Frame B of X-braced structure
BU1U BU2U
BU1L BU2L
BM1U BM2U
BM1L BM2L
BL1U BL2U
BL1L BL2L
47
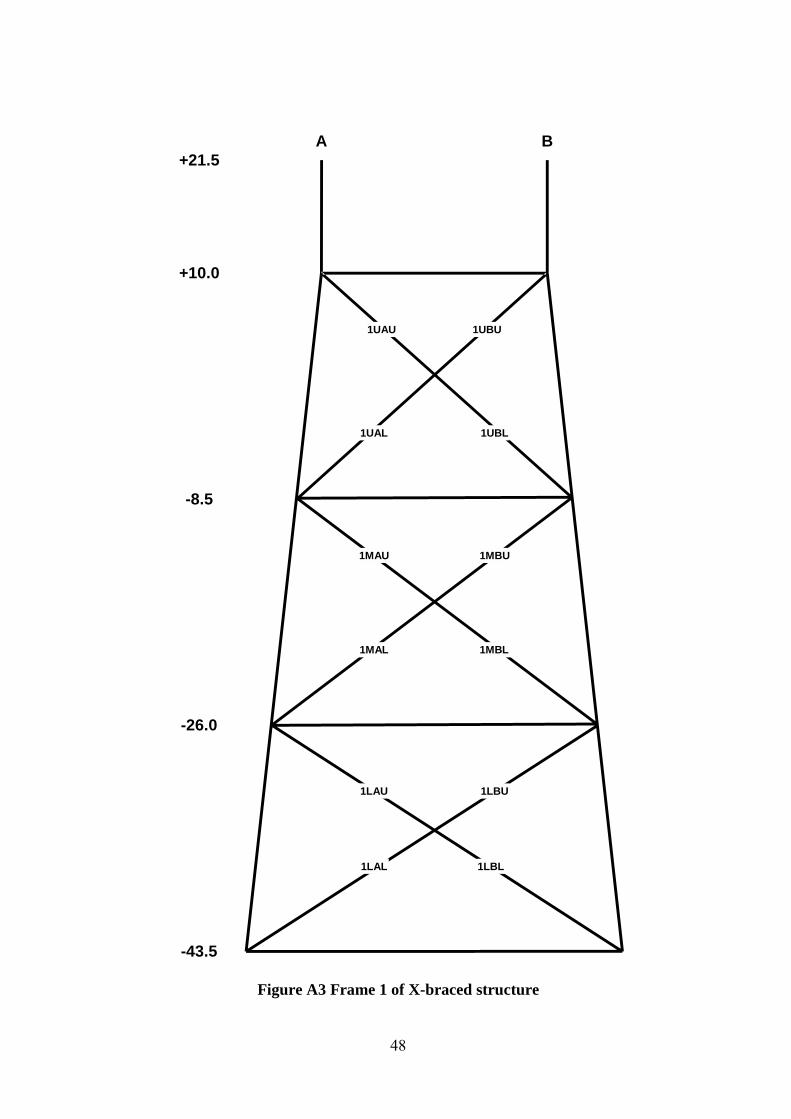
A B +21.5
+10.0
-8.5
-26.0
-43.5
Figure A3 Frame 1 of X-braced structure
1UBU
1UBL
1LBU
1LBL
1UAU
1UAL
1MAU 1MBU
1MAL 1MBL
1LAU
1LAL
48

A B +21.5
+10.0
-8.5
-26.0
-43.5
Figure A4 Frame 2 of X-braced structure
2UBU
2UBL
2LBU
2LBL
2UAU
2UAL
2MAU 2MBU
2MAL 2MBL
2LAU
2LAL
49

1 2 +21.5
+10.0
AU1U AU2U
AU1L AU2L
-8.5
AM1U AM2U
AM1L AM2L
-26.0
AL1U AL2U
AL1L AL2L
-43.5
Figure A5 Frame A of Diamond braced structure
50

1 2 +21.5
+10.0
BU1U BU2U
BU1L BU2L
-8.5
BM1U BM2U
BM1L BM2L
-26.0
BL1U BL2U
BL1L BL2L
-43.5
Figure A6 Frame B of Diamond braced structure
51

A B +21.5
+10.0
1UAU 1UBU
1UAL 1UBL
-8.5
1MAU 1MBU
1MAL 1MBL
-26.0
1LAU 1LBU
1LAL 1LBL
-43.5
Figure A7 Frame 1 of Diamond braced structure
52

A B +21.5
+10.0
2UAU 2UBU
2UAL 2UBL
-8.5
2MAU 2MBU
2MAL 2MBL
-26.0
2LAU 2LBU
2LAL 2LBL
-43.5
Figure A8 Frame 2 of Diamond braced structure
53

1 2 +21.5
+10.0
-8.5
-26.0
-43.5
AU1 AU2
AM1 AM2
AL1 AL2
Figure A9 Frame A of Inverted K-braced structure
54

1 2 +21.5
+10.0
-8.5
-26.0
-43.5
BU1 BU2
BM1 BM2
BL1 BL2
Figure A10 Frame B of Inverted K-braced structure
55

A B +21.5
+10.0
-8.5
-26.0
-43.5
1UA 1UB
1MB
1LA 1LB
1MA
Figure A11 Frame 1 of Inverted K-braced structure
56

A B +21.5
+10.0
-8.5
-26.0
-43.5
2UA 2UB
2MB
2LA 2LB
2MA
Figure A12 Frame 2 of Inverted K-braced structure
57

1 2 +21.5
+10.0
-8.5
-26.0
-43.5
AU1 AU2
AM1 AM2
AL1 AL2
Figure A13 Frame A of K-braced structure
58

1 2 +21.5
+10.0
-8.5
-26.0
-43.5
BU1 BU2
BM1 BM2
BL1 BL2
Figure A14 Frame B of K-braced structure
59

A B +21.5
+10.0
-8.5
-26.0
-43.5
1UA 1UB
1MB
1LA 1LB
1MA
Figure A15 Frame 1 of K-braced structure
60

A B +21.5
+10.0
-8.5
-26.0
-43.5
2UA 2UB
2MB
2LA 2LB
2MA
Figure A16 Frame 2 of K-braced structure
61

1 2 +21.5
+10.0
-8.5
-26.0
-43.5
AU
AM
AL
Figure A17 Frame A of Single Diagonal braced structure
62
1 2 +21.5
+10.0
-8.5
-26.0
-43.5
BU
BM
BL
Figure A18 Frame B of Single Diagonal braced structure
63

A B +21.5
+10.0
-8.5
-26.0
-43.5
1U
1M
1L
Figure A19 Frame 1 of Single Diagonal braced structure
64

A B +21.5
+10.0
-8.5
-26.0
-43.5
2U
2M
2L
Figure A20 Frame 2 of Single Diagonal braced structure
65

66
APPENDIX B
Water Depth and Structural Bays Data
67

Platform Location Water Depth (m)
N° of Bays
Scott JU CNS 142 5 Inde AQ SNS 30 2
Leman AQ SNS 36 3 Leman EP SNS 37 3 Leman H SNS 38 3 Leman J SNS 42 3
Pickerill A SNS 21 2 Pickerill B SNS 21 2
Amethyst A1D SNS 29 2 Amethyst A2D SNS 24 2 Amethyst B1D SNS 25 2 Amethyst C1D SNS 25 2
Andrew NNS 116 4 Cleeton Wellhead Tower SNS 50 3
Hyde SNS 35 2 Ravenspurn South A SNS 50 3 Ravenspurn South B SNS 50 3 Ravenspurn South C SNS 50 3
Thistle A NNS 161 6 West Sole WAP SNS 27 3
Ganymede SNS 33 2 LOGGS GGS Accommodation SNS 21 2
LOGGS GGS Riser SNS 21 2 Murdoch SNS 30 2
Valiant North 1 SNS 21 2 Valiant North 2 SNS 29 2 Valiant South SNS 34 2
Vanguard SNS 30 2 Viking BA SNS 25 2 Vulcan 1 SNS 30 2 Vulcan 2 SNS 36 2
Saltire NNS 143 5 Brae East CNS 116 4
Guinevere A SNS 17 2 Lancelot A SNS 21 2
Ninian Southern NNS 141 5 Audrey 48/15-B SNS 25 2 Audrey 49/11-A SNS 26 2
Barque PB SNS 22 2 Clipper PC SNS 22 2 Gannet A NNS 95 4 Kittiwake CNS 85 3 Schooner SNS 71 3
Captain WHP NNS 106 5 Erskine NNS 90 3 Caister SNS 41 2
Printed and published by the Health and Safety Executive C1.25 05/03

ISBN 0-7176-2188-X
RR 094
78071 7 621 880£20.00 9

Tech
nica
l perfo
rmance
measu
res fo
r North
Sea ja
cket stru
cture
s H
SE
BO
OK
S