RESEARCH Open Access Boolean modeling and fault diagnosis … · (SMP) which then binds to the...
16
RESEARCH Open Access Boolean modeling and fault diagnosis in oxidative stress response Sriram Sridharan 1 , Ritwik Layek 1 , Aniruddha Datta 1* , Jijayanagaram Venkatraj 2 From IEEE International Workshop on Genomic Signal Processing and Statistics (GENSIPS) 2011 San Antonio, TX, USA. 4-6 December 2011 Abstract Background: Oxidative stress is a consequence of normal and abnormal cellular metabolism and is linked to the development of human diseases. The effective functioning of the pathway responding to oxidative stress protects the cellular DNA against oxidative damage; conversely the failure of the oxidative stress response mechanism can induce aberrant cellular behavior leading to diseases such as neurodegenerative disorders and cancer. Thus, understanding the normal signaling present in oxidative stress response pathways and determining possible signaling alterations leading to disease could provide us with useful pointers for therapeutic purposes. Using knowledge of oxidative stress response pathways from the literature, we developed a Boolean network model whose simulated behavior is consistent with earlier experimental observations from the literature. Concatenating the oxidative stress response pathways with the PI3-Kinase-Akt pathway, the oxidative stress is linked to the phenotype of apoptosis, once again through a Boolean network model. Furthermore, we present an approach for pinpointing possible fault locations by using temporal variations in the oxidative stress input and observing the resulting deviations in the apoptotic signature from the normally predicted pathway. Such an approach could potentially form the basis for designing more effective combination therapies against complex diseases such as cancer. Results: In this paper, we have developed a Boolean network model for the oxidative stress response. This model was developed based on pathway information from the current literature pertaining to oxidative stress. Where applicable, the behaviour predicted by the model is in agreement with experimental observations from the published literature. We have also linked the oxidative stress response to the phenomenon of apoptosis via the PI3k/Akt pathway. Conclusions: It is our hope that some of the additional predictions here, such as those pertaining to the oscillatory behaviour of certain genes in the presence of oxidative stress, will be experimentally validated in the near future. Of course, it should be pointed out that the theoretical procedure presented here for pinpointing fault locations in a biological network with feedback will need to be further simplified before it can be even considered for practical biological validation. Introduction The control of gene expression in eukaryotic organisms is achieved via multivariate interactions between different biological molecules such as proteins and DNA [1]. Consequently, in recent years, various genetic regulatory network modeling approaches such as differential equa- tions and their discrete-time counterparts, Bayesian networks, Boolean networks (BNs) and their probabilistic generalizations, the so-called probabilistic Boolean networks (PBNs) [2] have been proposed for capturing the holistic behavior of the relevant genes. Some of these approaches such as differential equations involve finer models and require a lot of data for inference while others such as Boolean networks yield coarse models with lower data requirements for model inference. On the other hand, historically biologists have focused on experimen- tally establishing marginal cause-effect relationships between different pairs of genes, which when concatenated * Correspondence: [email protected] 1 Texas A & M University, Electrical and Computer Engineering, College Station, TX, 77843-3128, USA Full list of author information is available at the end of the article Sridharan et al. BMC Genomics 2012, 13(Suppl 6):S4 http://www.biomedcentral.com/1471-2164/13/S6/S4 © 2012 Sridharan et al.; licensee BioMed Central Ltd. This is an open access article distributed under the terms of the Creative Commons Attribution License (http://creativecommons.org/licenses/by/2.0), which permits unrestricted use, distribution, and reproduction in any medium, provided the original work is properly cited.
-
Upload
duongthien -
Category
Documents
-
view
214 -
download
0
Transcript of RESEARCH Open Access Boolean modeling and fault diagnosis … · (SMP) which then binds to the...

RESEARCH Open Access
Boolean modeling and fault diagnosis inoxidative stress responseSriram Sridharan1, Ritwik Layek1, Aniruddha Datta1*, Jijayanagaram Venkatraj2
From IEEE International Workshop on Genomic Signal Processing and Statistics (GENSIPS) 2011San Antonio, TX, USA. 4-6 December 2011
Abstract
Background: Oxidative stress is a consequence of normal and abnormal cellular metabolism and is linked to thedevelopment of human diseases. The effective functioning of the pathway responding to oxidative stress protectsthe cellular DNA against oxidative damage; conversely the failure of the oxidative stress response mechanism caninduce aberrant cellular behavior leading to diseases such as neurodegenerative disorders and cancer. Thus,understanding the normal signaling present in oxidative stress response pathways and determining possiblesignaling alterations leading to disease could provide us with useful pointers for therapeutic purposes. Usingknowledge of oxidative stress response pathways from the literature, we developed a Boolean network model whosesimulated behavior is consistent with earlier experimental observations from the literature. Concatenating theoxidative stress response pathways with the PI3-Kinase-Akt pathway, the oxidative stress is linked to the phenotype ofapoptosis, once again through a Boolean network model. Furthermore, we present an approach for pinpointingpossible fault locations by using temporal variations in the oxidative stress input and observing the resultingdeviations in the apoptotic signature from the normally predicted pathway. Such an approach could potentially formthe basis for designing more effective combination therapies against complex diseases such as cancer.
Results: In this paper, we have developed a Boolean network model for the oxidative stress response. This model wasdeveloped based on pathway information from the current literature pertaining to oxidative stress. Where applicable,the behaviour predicted by the model is in agreement with experimental observations from the published literature.We have also linked the oxidative stress response to the phenomenon of apoptosis via the PI3k/Akt pathway.
Conclusions: It is our hope that some of the additional predictions here, such as those pertaining to theoscillatory behaviour of certain genes in the presence of oxidative stress, will be experimentally validated in thenear future. Of course, it should be pointed out that the theoretical procedure presented here for pinpointing faultlocations in a biological network with feedback will need to be further simplified before it can be even consideredfor practical biological validation.
IntroductionThe control of gene expression in eukaryotic organisms isachieved via multivariate interactions between differentbiological molecules such as proteins and DNA [1].Consequently, in recent years, various genetic regulatorynetwork modeling approaches such as differential equa-tions and their discrete-time counterparts, Bayesian
networks, Boolean networks (BNs) and their probabilisticgeneralizations, the so-called probabilistic Booleannetworks (PBNs) [2] have been proposed for capturing theholistic behavior of the relevant genes. Some of theseapproaches such as differential equations involve finermodels and require a lot of data for inference while otherssuch as Boolean networks yield coarse models with lowerdata requirements for model inference. On the otherhand, historically biologists have focused on experimen-tally establishing marginal cause-effect relationshipsbetween different pairs of genes, which when concatenated
* Correspondence: [email protected] A & M University, Electrical and Computer Engineering, CollegeStation, TX, 77843-3128, USAFull list of author information is available at the end of the article
Sridharan et al. BMC Genomics 2012, 13(Suppl 6):S4http://www.biomedcentral.com/1471-2164/13/S6/S4
© 2012 Sridharan et al.; licensee BioMed Central Ltd. This is an open access article distributed under the terms of the CreativeCommons Attribution License (http://creativecommons.org/licenses/by/2.0), which permits unrestricted use, distribution, andreproduction in any medium, provided the original work is properly cited.

together leads to what is known as pathway information.Biological pathways are used by biologists to representcomplex interactions occurring at the molecular levelinside living cells [3]. Pathway diagrams describe how thebiological molecules interact to achieve their biologicalfunction in the presence of appropriate stimuli [4]. At avery simple level, biological pathways represent the graphi-cal interactions between different molecules. However, asalready noted, the pathways give only a marginal pictureof the regulations (up-regulation or down-regulation) ofthe different genes/RNAs/proteins by other genes/RNAs/proteins.The complexity of biological signaling and the preve-
lance of prior information in the form of pathway knowl-edge demand that genetic regulatory network modelsconsistent with pathway information be developed.Motivated by this, we developed an approach to generateBoolean network models consistent with given pathwayinformation and applied it to studying the p53-mediatedDNA damage stress response [5]. In addition, we used asignaling diagram of the MAP-Kinase pathways to predictpossible location(s) of the single signaling breakdowns,based on the cancer-causing breakdown signature [6].Moreover, we also made theoretical predictions of the effi-cacy of different combination therapies involving six anti-cancer drugs, which we plan to validate in the near future.In this paper, we first develop a Boolean network model
consistent with oxidative stress response pathway informa-tion from the biological literature. Thereafter this model islinked with the PI3k/Akt pathway and the compositemodel is used to pinpoint the possible fault locationsbased on the observed deviations in the apoptotic signa-ture over different time windows. The paper is organizedas follows. Section contains a brief general description ofStress Response Pathways while Section presents a discus-sion specific to the case of oxidative stress. The Booleannetwork model for oxidative stress response is developedin Section. The role of mitochondria as the site in a cellwhere the oxidative stress is generated is discussed in Sec-tion. In Section, we develop an integrated network linkingoxidative stress response to the phenomenon of apoptosisvia the PI3k/Akt pathways. Section presents an approachfor pinpointing fault locations in the integrated networkby observing the apoptotic signature in response to certaintest stress input sequences. Finally, Section contains someconcluding remarks.
Stress response pathwaysAdaptive stress response pathways are the first respondersto chemical toxicity, radiation, and physical insults. Thedifferent stress response pathways share a very similararchitecture. This architecture has three main compo-nents: a transducer, a sensor and a transcription factor(TF) [7]. The transcription factor (TF) is a DNA-binding
protein that interacts with the promoter regions of itstarget genes via its canonical DNA-binding sites, known as‘response elements’ (REs), to activate the expression of thetarget genes. The sensor is a protein that physically inter-acts with the transcription factor in the cytosol, sequester-ing the transcription factor from the nucleus undernormal cellular conditions. In addition to its role in cyto-plasmic sequestration of the TF, the sensor may direct TFdegradation, providing an additional layer of regulatorycontrol. The result of the sensor-TF complexation is tomaintain inactivity of the TF under normal cellular condi-tions, while providing a mechanism that permits activationin response to an appropriate insult to the cell. The trans-ducer is an enzymatic protein, such as a kinase, that con-veys a biochemical change from a signaling pathwayupstream of the sensor/TF complex in the event of cellularstress. The transducer may directly modify the transcrip-tion factor, providing the activating signal or modify thesensor which in turn, destabilizes the sensor/TF complex.Liberated, stabilized, and activated, the transcription factorrelocates to the nucleus where it activates its target genes.Generally the sensor and TF are unique for a given stressresponse pathway unlike transducers which can be sharedbetween different stress response pathways, leading towhat is commonly referred to as ‘crosstalk’ between thepathways. A schematic diagram showing the general archi-tecture of a stress response pathway is shown in Figure 1.
Oxidative stress response pathwaysOxidative stress is caused by exposure to reactive oxygenintermediaries/species (ROS). The stress induced on thecells by electrophiles and oxidants gives rise to a variety ofchronic diseases. The outcome of interactions between thecell and oxidants is determined largely by the balancebetween the enzymes that activate the reactive intermedi-aries and the enzymes that detoxify these reactive interme-diaries [8]. For example, oxidative stress contributes toaging and age-related diseases such as cancer, cardiovascu-lar disease, chronic inflammation, and neurodegenerativedisorders. The body has developed a variety of counterac-tive measures for combating oxidative stress. At elevatedconcentrations of electrophiles the complex Keap1-Nrf2(made up of the transcription factor Nrf 2 and sensorKeap1) is broken and Nrf2 is liberated and transportedinto the nucleus. Keap1 has been known to sequester Nrf2in the cytoplasm and also leads to the proteasomal degra-dation of Nrf2. Once the complex is broken, Nrf2 is phos-phorylated and transported to the nucleus. Inside thenucleus, Nrf2 forms heterodimers with small Maf proteins(SMP) which then binds to the anti-oxidant responseelement (ARE) and leads to the translation of antioxidantgenes, which produces Phase II detoxifying enzymes.The purpose of this is to detoxify the electrophiles towater soluble components. Thus in response to elevated
Sridharan et al. BMC Genomics 2012, 13(Suppl 6):S4http://www.biomedcentral.com/1471-2164/13/S6/S4
Page 2 of 16
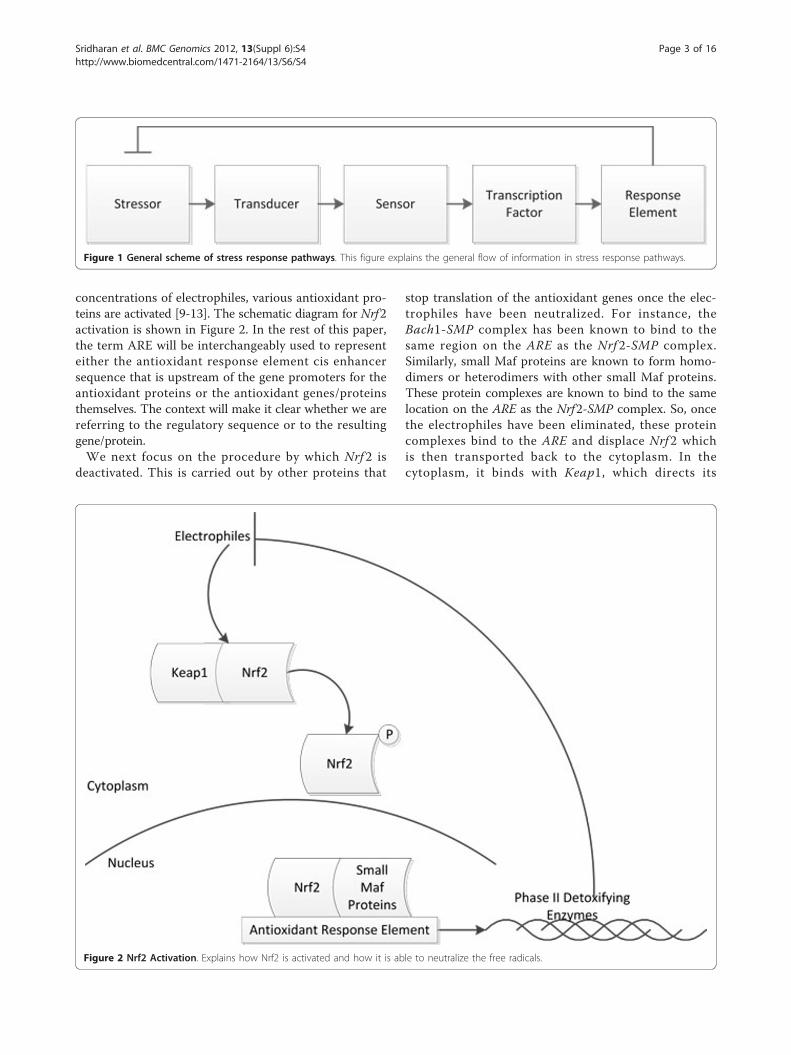
concentrations of electrophiles, various antioxidant pro-teins are activated [9-13]. The schematic diagram for Nrf2activation is shown in Figure 2. In the rest of this paper,the term ARE will be interchangeably used to representeither the antioxidant response element cis enhancersequence that is upstream of the gene promoters for theantioxidant proteins or the antioxidant genes/proteinsthemselves. The context will make it clear whether we arereferring to the regulatory sequence or to the resultinggene/protein.We next focus on the procedure by which Nrf 2 is
deactivated. This is carried out by other proteins that
stop translation of the antioxidant genes once the elec-trophiles have been neutralized. For instance, theBach1-SMP complex has been known to bind to thesame region on the ARE as the Nrf 2-SMP complex.Similarly, small Maf proteins are known to form homo-dimers or heterodimers with other small Maf proteins.These protein complexes are known to bind to the samelocation on the ARE as the Nrf2-SMP complex. So, oncethe electrophiles have been eliminated, these proteincomplexes bind to the ARE and displace Nrf 2 whichis then transported back to the cytoplasm. In thecytoplasm, it binds with Keap1, which directs its
Figure 1 General scheme of stress response pathways. This figure explains the general flow of information in stress response pathways.
Figure 2 Nrf2 Activation. Explains how Nrf2 is activated and how it is able to neutralize the free radicals.
Sridharan et al. BMC Genomics 2012, 13(Suppl 6):S4http://www.biomedcentral.com/1471-2164/13/S6/S4
Page 3 of 16

proteosomal degradation [14-17]. The schematic dia-gram for Nrf2 deactivation is shown in Figure 3.One of the byproducts of normal metabolism is the
production of a large number of free radicals. Oxidativestress is caused by the production of free radicals in quanti-ties beyond those that can be handled by the cellularantioxidant system. Indeed, oxidative stress has been impli-cated in the development of many age-related diseases,including neurodegenerative ones, such as Alzheimer’s andParkinson’s, and in aging itself. In addition, excess freeradicals react with the nucleotides in the DNA resultingin mutations in the long run. Although there are cellularmechanisms to sense and repair the oxidative DNAdamage, mutations can accumulate over a period of timeand result in a major disease like cancer. In the nextsection, we develop a Boolean network model for oxidativestress response pathways. This network will be later utilizedto analyze different failure modes that can supress apopto-sis and possibly lead to cancer.
Boolean network modeling of oxidative stress responsepathwaysBefore proceeding to the actual modeling of the specificoxidative stress response pathways, we first formallydefine the general terms ‘pathway’ and ‘Boolean Network’following the detailed development in [5]. Given twogenes/proteins A and B and binary values a, b Î {0, 1},we define the term pathway segment A
t:a,b→ B to mean thatif gene/protein A assumes the value a then gene/proteinB transitions to b in no more than t subsequent timesteps. A pathway is defined to be a sequence of pathwaysegments of the form A
t1:a,b→ Bt2:b,c→ C.
A Boolean Network (BN), ϒ = (V, F ), on n genes isdefined by a set of nodes/genes V = {x1, ..., xn}, xi Î {0, 1},i = 1, ..., n, and a list F = (f1, ..., fn), of Boolean functions,fi: {0, 1}
n ® {0, 1}, i = 1, ..., n [18]. The expression of eachgene is quantized to two levels, and each node xi repre-sents the state/expression of the gene i, where xi = 0means that gene i is OFF and xi = 1 means that gene i is
Figure 3 Nrf2 Deactivation. Explains how after neutralizing free radicals Nrf2 is transported back to cytoplasm from mitochondria.
Sridharan et al. BMC Genomics 2012, 13(Suppl 6):S4http://www.biomedcentral.com/1471-2164/13/S6/S4
Page 4 of 16

ON. The function fi is called the predictor function forgene i. Updating the states of all genes in ϒ is done syn-chronously at every time step according to their predictorfunctions. At time t, the network state is given by x(t) =(x1(t), x2 (t), ..., xn(t)), which is also called the gene activityprofile (GAP) of the network.The modeling approach that we will follow here
involves using the biological pathway knowledge fromthe literature and applying Karnaugh map reductiontechniques to it to obtain an update equation for eachnode of the Boolean network [5]. The details specific tothe oxidative stress response pathway are discussednext. The pathway segments relevant to the oxidativestress response are given below [9,10,12,15,19,20]:
ROS1:1,0→ K eap1 (1)
ROS1:1,1→ PKC (2)
ROS1:a,a→ Bach 1 (3)
Keap 11:b,b→ Nrf2 (4)
Nrf2,ROS1:(1,0),1→ Keap1 (5)
PKC1:1,1→ Nrf2 (6)
Bach1, SMP1:(1,1),0→ ARE (7)
Nrf2, SMP1:(1,1),1→ ARE (8)
SMP, SMP1:(1,1),0→ ARE (9)
ARE1:1,1→ SMP (10)
ARE1:1,0→ ROS (11)
ARE1:1,0→ PKC (12)
In these pathways ARE represents the family of antioxi-dant genes in the sense that if the correct complexes bindto ARE it leads to the up-regulation/down-regulation ofthe appropriate antioxidant gene. These pathway interac-tions are pictorially represented in Figure 4. In this figurewe have used square boxes without making any distinctionbetween whether they represent proteins/genes or a bio-chemical entity. ROS stands for reactive oxidative specieswhich is a biochemical entity. The other entities like PKC,Keap1, Nrf2, Bach1 are all proteins and ARE (Antioxidant
Response Element) is a cis enhancer sequence that isupstream of the gene promoters for the antioxidant pro-teins or the antioxidant genes/proteins themselves. Alsothe merged activation (Nrf2/SMP) or inhibition (Bach1/SMP) corresponds to dimers formed between these com-ponents. The Karnaugh-maps for the genes/proteins areshown in Figure 5.From the pathways described above and using the
Karnaugh-map reduction techniques, the Boolean updateequations for each node of the network are deduced.Some logical reasoning has been used for determining theequations: 1) the maximum number of predictors forupdating a variable is fixed to be 3; 2) Small Maf Protein isassumed to be ubiquitously expressed and the pathwaygiven by Eqn.(10) only increases the concentration ofSMP, which in conjunction with Eqn.(9), binds to AREand down-regulates the antioxidant gene; 3) a gene beingturned on implies that the corresponding protein is beingproduced although, in reality, this is not necessarily true;and 4) in the case of a conflict in the Karnaugh map, bio-logical knowledge has been used to assign either a 0 or a1. This last point is demonstrated by a specific example.For instance, in the case of ARE, the entry shown with agrey circle around it says that when both Bach1 and Nrf2are upregulated and antioxidant gene is downregulated,then at the next time step antioxidant gene will be upregu-lated. The biological explanation for such an update is thatit corresponds to the situation where, in the presence ofStress, Nrf2 has been activated and is relocating to thenucleus while the inhibitor Bach1 is simultaneously relo-cating to the cytoplasm prior to the activation of antioxi-dant gene at the next time step. Such intuitive reasoninghas been used to model the system here. One might use adifferent reasoning which could lead to a different set ofupdate equations. However, since we are concerned onlyabout the final steady-state behavior, such reasoning canbe justified as long as the overall system behavior, definedby the update equations, matches the steady-state. As anexample, the final update equation for ARE is derived asfollows. In the K-maps, the ones are grouped up in pairsof 2,4,8 and so on and each group should have at least onevariable staying constant. So for this case there are twogroups whose equations correspond to Nrf2 · (ARE) andNrf2 · (Bach1). The final update equation for ARE is thesum of these two equations. Please refer to Additional file1 for some additional details. Indeed, by working with dif-ferent sets of update equations, we determined that all bio-logically plausible ones led to the same/similar attractorbehavior. From the set of possible Boolean networks wechose the ones that appealed most to our biological under-standing and the resulting update equations are givenbelow:
ROSnext = Stress · ARE (13)
Sridharan et al. BMC Genomics 2012, 13(Suppl 6):S4http://www.biomedcentral.com/1471-2164/13/S6/S4
Page 5 of 16

Keap1next = ROS · (Nrf2 + Keap1) (14)
PKCnext = ROS · ARE (15)
Nrf2next = PKC + Keap1 (16)
Bach1next = ROS (17)
Figure 4 Oxidative Stress Response Pathways. The major pathways involved in oxidative stress response.
Sridharan et al. BMC Genomics 2012, 13(Suppl 6):S4http://www.biomedcentral.com/1471-2164/13/S6/S4
Page 6 of 16

SMPnext = 1 (18)
AREnext = Nrf2 · (ARE + Bach1). (19)
An equivalent digital circuit with logic gates is shownin Figure 6. Here the lines in bold represent feedbackpaths. The state transition diagrams resulting from Eqns.(13)-(19) for the two cases Stress = 0 and Stress = 1 areshown in Figures 7 and 8 respectively. In these transitiondiagrams, the genes in the binary state representation areordered as [ROS Keap1 PKC Nrf2 Bach1 ARE] and thebinary states are compactly represented by their decimalequivalents. For instance, the binary state (111100) wouldbe represented by the decimal number 60. The states ofparticular interest are the attractors as they give rise tothe steady-state properties of the network. In Figure 7,the state of interest is the singleton attractor 18(010010).On the other hand, in Figure 8, the states of interest arethe seven states forming the attractor cycle. These states
are: 18(010010), 50(110010), 40(101000), 44(101100),45(001101), 5(000101) and 23(010111) traversed in thatorder. They would lead to cyclical/oscillatory behavior inthe time domain response.It is clear from the preceding discussion that some kind
of oscillatory behavior of the genes will be observed whenthe external Stress input equals 1. On the other hand,when the Stress input equals 0, the system will rest in onlyone state meaning that there will be no oscillation.
Time domain simulation resultsThe network obtained was simulated using MATLAB bygiving an external stress input signal for a duration of 50timesteps, and both the input signal and the responses areshown in Figure 9. The signal ROS is a biological manifes-tation of the external input signal, Stress being applied tothe network. The biological purpose of this network is tocounteract the effect of ROS produced in response to theStress input. As we can see from Figure 9, in the absence
Figure 5 Karnaugh Maps for Deriving the Oxidative Stress Response Boolean Network. K-map simplification for all the elements involvedin the system.
Sridharan et al. BMC Genomics 2012, 13(Suppl 6):S4http://www.biomedcentral.com/1471-2164/13/S6/S4
Page 7 of 16

Figure 6 Equivalent Boolean Network for Oxidative Stress Response. Boolean network model for oxidative stress response based on theequations derived using K-maps.
Figure 7 The Boolean State Transition Diagram when the Stress input is 0. The state transition diagram for the Boolean network with nostress on the system. This gives us an idea of the attractor states of the system.
Sridharan et al. BMC Genomics 2012, 13(Suppl 6):S4http://www.biomedcentral.com/1471-2164/13/S6/S4
Page 8 of 16
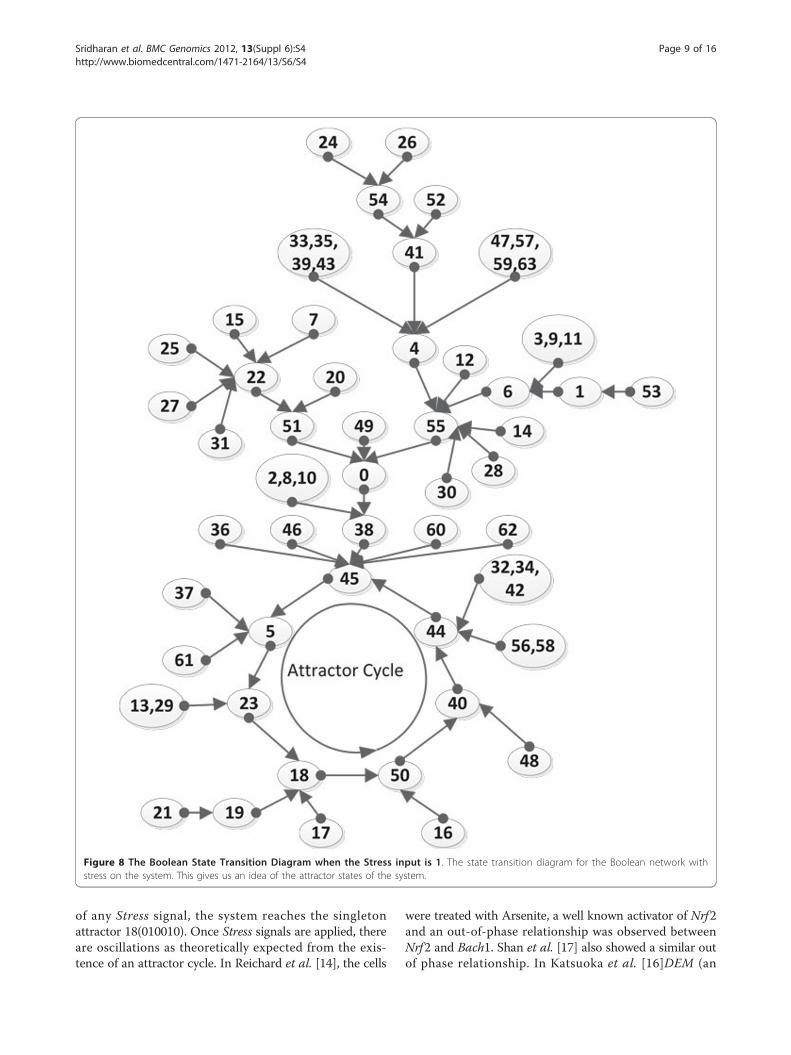
of any Stress signal, the system reaches the singletonattractor 18(010010). Once Stress signals are applied, thereare oscillations as theoretically expected from the exis-tence of an attractor cycle. In Reichard et al. [14], the cells
were treated with Arsenite, a well known activator of Nrf2and an out-of-phase relationship was observed betweenNrf2 and Bach1. Shan et al. [17] also showed a similar outof phase relationship. In Katsuoka et al. [16]DEM (an
Figure 8 The Boolean State Transition Diagram when the Stress input is 1. The state transition diagram for the Boolean network withstress on the system. This gives us an idea of the attractor states of the system.
Sridharan et al. BMC Genomics 2012, 13(Suppl 6):S4http://www.biomedcentral.com/1471-2164/13/S6/S4
Page 9 of 16

activator of Nrf2) also leads to increased expression ofNQO1 which is a known anti-oxidant response element.Such an in-phase relationship between Nrf2 and the anti-oxidant gene is also seen in Figure 9. Thus the theoreticalpredictions made by our Boolean network model for oxi-dative stress response appear to be consistent with experi-mental observations from the published literature. Note,however, that these experiments consider only two genes/proteins at a time and therefore, there is a need for experi-mentally studying the simultaneous activities of ROS,Keap1, Nrf2, PKC, Bach1 and ARE in the time domain.
Mitochondria and free radical generationMitochondria play an important role in cellular energymetabolism, free radical generation and apoptosis. It haslong been suspected that mitochondrial functions con-tribute to the development and progression of cancer[21-23]. Over 70 years ago, Otto Warburg proposed thata key event in carcinogenesis is a defect in the respira-tory mechanism, leading to increased glycolysis even inthe presence of oxygen;this is known as the Warburgeffect [24]. The well known function of mitochondria isto generate Adenosine Triphosphate (ATP) moleculesproviding energy for the survival of the cell through oxi-dative phosphorylation (OXPHOS), which is collectivelyaccomplished by proteins encoded both by nuclear andmitochondrial DNA. Oxidative phosphorylation is a
metabolic process, which takes place in mitochondria inwhich ATP is formed as a result of the transfer of elec-trons from NADH or FADH2 to O2 by a series of elec-tron carriers. OXPHOS is the major source of ATP aswell as free radical generation in aerobic organisms. Forexample, oxidative phosphorylation generates 26 of the30 molecules of ATP that are formed when a moleculeof glucose is completely oxidized to CO2 and H2O,although 1 to 2% of the electrons are lost during trans-fer through the chains leading to free radical generation[25]. Figure 10 [26] shows a schematic representation ofthe whole process along with free radical generation.The points shown with red stars correspond to the loca-tions where free radicals are generated.Even though it has been long recognized that increased
ROS production in mitochondria leads to genetic instabil-ity and progression of cancer, there remain several unan-swered questions regarding the complex signallingcapacity of this organelle [27]. The DNA is highly suscep-tible to free radical attacks. Free radicals can break DNAstrands or delete bases. These mutations can prove to becarcinogenic. It has been estimated that more than 10,000hits of oxidative stress occur each day. So it is importantto tackle these free radicals at the source of their genera-tion, which is why the mitochondria is also a very richsource of anti-oxidants. Although cellular mechanisms cantackle this stress, damage accumulates with age. At present
Figure 9 Time response behaviour of the system in Fig.4. Time response simulation of the Boolean network to observe oscillations of theproteins in the system.
Sridharan et al. BMC Genomics 2012, 13(Suppl 6):S4http://www.biomedcentral.com/1471-2164/13/S6/S4
Page 10 of 16

altered energy metabolism is considered to be an addi-tional hall mark of cancer progression [28] and thesemetabolic pathways have been investigated as targets forcancer therapy. In this paper, we will specifically focus onthe PI3k/Akt pathway which is one such pathway and isdescribed in the following section.
An integrated network for oxidative stress responseand apoptosisCancer is an umbrella term for diseases that are associatedwith loss of cell-cycle control, leading to uncontrolled cellproliferation and/or reduced apoptosis. It is often causedby genetic alterations leading to malfunctioning in the bio-logical pathways [1,29,30]. One of the possible cellularresponses resulting from oxidative stress is the inductionof apoptosis. Thus it is important to develop a networkmodel linking the oxidative stress input to the fate of thecell. In this section, we will do precisely that by consider-ing the oxidative stress response pathways alongside otherdownstream pathways capable of inducing apoptosis. Spe-cifically, we will focus on the PI3k/Akt pathway. The PI3k/Akt pathway is downstream of the Ras gene which isknown to play an important role in many cancers. In addi-tion, other genes in the PI3k/Akt pathways are foundmutated in many cases of cancer. Oxidative stress oftenupregulates many of the genes in the PI3k/Akt pathway.The detailed interactions between the oxidative stressresponse pathway and the PI3k/Akt pathway are shown inFigure 11 [1,31-33]. Starting with this pathway diagramand utilizing the procedure developed earlier in Section,an equivalent digital circuit in terms of logic gates can beimplemented as shown in Figure 12. The above circuit is
modeled with two output genes which effectively controlthe final fate of the cell. Bad and Bcl2 are known to havepro-apoptotic and anti-apoptotic functions respectivelyand thus can serve as biomarkers of apoptosis induction.Indeed, it is the delicate balance between the activity ofthese two genes that dictates the ultimate fate of the cell[34-36]. The purpose of the Nrf 2-ARE pathway in thisintegrated network is to reduce the average value of ROSpresent in the system, in response to the oxidative stress.This is clear from the plot in Figure 9: between the timeinstants from the 25th timestep to the 75th timestep whenthere is a continuous Stress present in the system, the ROSpresent in the system is oscillating between 0 and 1 whichimplies that its average value is less than ‘1’, which is thevalue that we would have otherwise had in the absence ofthe Nrf 2-ARE pathway.
Classification of faults in the integrated networkIn the integrated pathway diagram of Figure 11, the twogenes namely Bad and Bcl2 are instrumental in decidingthe fate of the cell. The preferred status of the twogenes, when oxidative stress is not being neutralized, are1 and 0 respectively since it corresponds to the situationwhere the pro-apoptotic factor is turned ON and theanti-apoptotic factor is turned OFF. Although a devia-tion from this state may not signal that the cell is turn-ing cancerous, there is a higher possiblity of the cellexhibiting aberrant behaviour.Depending on the final resting status of these two genes,
one may be able to characterize the degree of invasivenessof the disease especially if it is being caused by apoptosissupression. Once it has been determined that a cell is
Figure 10 Stages of Oxidative Phosphorylation producing free radicals. Explains Krebs cycle and how and where free radicals are producedin the mitochondria.
Sridharan et al. BMC Genomics 2012, 13(Suppl 6):S4http://www.biomedcentral.com/1471-2164/13/S6/S4
Page 11 of 16

exhibiting abberant behavior, one would like to pinpointthe location of the fault/error so that the necessary thera-peutic intervention(s) can be applied. Since the digital cir-cuit model of Figure 12 uses logic gates, it should bepossible to use the fault detection techniques from theDigital Logic literature [37,38] to pinpoint the fault loca-tions. This will be carried out in this section. An importantdifference between the results obtained in Layek et al. [6]for pinpointing the fault locations in the MAPKinase path-ways and the results to be presented here is that the digitalcircuit in Figure 12 involves feedback and its behaviour is,therefore, much more complicated to analyze. However, itshould be pointed out that the simpler fault pinpointingmethodology presented in Layek et al. [6] is much moreamenable to biological validation via appropriatelydesigned experiments while the same cannot be said aboutthe results to be presented here. Indeed, the results to bepresented here show that the pinpointing of the fault loca-tions is theoretically possible even in this case, althoughthe biological feasibility of the methods required is opento question.
We note that the faults in a digital circuit are mainlyof two types [37]:
• Stuck-at Faults: As the name implies, this is a faultwhere a particular line l is stuck at a particular valuea Î {0, 1}, denoted by line l,s-a-a (s-a-a meansstuck-at-a). This means that the value at that line isalways going to be a regardless of the inputs comingin. This can be thought of as something similar to amutation in a gene, where a particular gene is eitherpermanently turned ON or OFF.• Bridging Faults: This is the type of fault where newinterconnections are introduced among elements ofthe network. This can be thought of as new pathwaysbeing created in the cell. This type of fault is not con-sidered in the current paper due to the lack of biologi-cal knowledge about new pathways being introduced.
Here, it is appropriate to mention that the biologicalrelevance of each of these two types of faults has beendiscussed in Layek et al. [6].
Figure 11 Pathway Diagram of Oxidative Stress along with PI3k/Akt. Inclusion of PI3k/Akt pathways along with oxidative stress pathwaysand study how they can lead to aberrant be-haviour in cells.
Sridharan et al. BMC Genomics 2012, 13(Suppl 6):S4http://www.biomedcentral.com/1471-2164/13/S6/S4
Page 12 of 16

The digital circuit in Figure 12 has feedback (shown inbold lines) and is, therefore, a sequential circuit. Todetect a fault in a sequential circuit we need a testsequence. Let T be a test sequence and let R(q,T) be theresponse of the fault-free sequential system N starting inthe intial state q. Now let the faulty sequential circuit bedenoted by Nf where f is the fault. Let us denote by Rf
(qf,T) the response of Nf to T starting in the initial stateqf. A test sequence T detects a fault f iff (if and only ifor equivalently this condition is both necessary and suf-ficient) for every possible pair of initial states q and qf,the output sequences R(q,T) and Rf (qf ,T) are differentfor some specified vector ti Î T. The output beingobserved is the status of [Bad, Bcl2].Once this output shows a deviation from a desired value,
it becomes imperative to pinpoint the possible fault loca-tions which can give rise to the aberrant behaviour. To doso, one can represent the digital circuit of Figure 12 as inFigure 13. The Primary Input(PI) is Stress which is theonly external signal which the experimenter has controlover. The Primary Output’s (PO’s) are the status of Badand Bcl2, which are the only outputs available to theexperimenter. The Secondary Output’s and SecondaryInput’s are [ARE, Keap1, Mdm2], which are being fed backinto the system. The states of these 3 genes ARE, Keap1and Mdm2 determine the internal state of the system.These 3 elements can be considered as memory elementsof the system as their previous state is retained by the
system and fed back. The input sequence consists of twoparts namely a Homing sequence and a Test sequence,denoted by H and T respectively.The purpose of this procedure is to pinpoint the possi-
ble locations for the fault f in Nf, given the outputsequence of Bad and Bcl2 for the normal and faulty cir-cuits. It is assumed that we have no knowledge about theinitial status of any of the genes. Knowledge of the initialstatus of the internal states is important as all futurecomputations are based on these values. The Homingsequence is an initial input sequence that brings the net-work to a known internal state. So, once the HomingSequence is given to N and Nf, N will come to a knowninternal state. Note that a similar claim cannot be madeabout Nf as the fault f is not known apriori. For the cir-cuit in Figure 13, a possible Homing sequence is [0 0 0 00 0 0 0], which brings the internal state of the system to[0 1 0]. This means that if the Stress input is zero foreight time steps, then at the end of that period, the inter-nal state of the system becomes [0 1 0], regardless of theinitial status of any of the genes in the network. A reasonfor choosing this Homing sequence is that it implies thatno input needs to be given to the system and it evolves tothe indicated internal state. In future when we are tryingto validate these results experimentally this will be ofimmense help. If we refer back to Figure 7, we see thatregardless of the initial state, within four time steps thetrajectory reaches the state (’010010’) where ARE = 0 and
Figure 12 Boolean Network modeling of Fig. 11. A Boolean network model of the network along with PI3k/Akt pathways.
Sridharan et al. BMC Genomics 2012, 13(Suppl 6):S4http://www.biomedcentral.com/1471-2164/13/S6/S4
Page 13 of 16

Keap1 = 1. This is consistent with the conclusion that weare getting from the Homing sequence here with the onlydifference that a slightly longer sequence is required hereas the state transition diagram has a higher cardinalitythan that in Figure 7.Once the Homing sequence has done its job, the Test
sequence(T) is fed into N and Nf, and by comparing theoutput states of the normal and faulty networks, we canpinpoint the location of the fault in the network, assumingthat a single stuck-at-fault has occurred. This can be car-ried out using the time-frame expansion method which isbriefly discussed next. The block in Figure 13 is replicatedn times with the feedback loops cut-off. The SecondaryOutput of the kth stage is fed as the Secondary Input forthe (k + 1)th stage. The Primary Outputs of the first (n - 1)stages are neglected. The Primary Outputs of the nth stageof the normal and faulty circuits will be different as thenetwork configurations are different for both. The PrimaryInput sequence has to be derived so that the error in a lineis propagated to the primary output in n time steps, sothat a difference is observed at the primary outputs of thenormal and faulty circuits [37,38]. The situation is picto-rially represented in Figure 14. Please refer to Additionalfile 1 for to y example.From the preceding discussion in this section, we know
that there are 15 possible genes (this is the total numberof genes in Figure 11, excluding the output genes Badand Bcl2) where there could be a mutation. This meansthat there are 30 cases of faults as a single gene can bemutated as a s-a-0 or as a s-a-1. We consider all possiblecases of single mutation, because in the presence of
mutation, the normal and faulty system cannot producethe same output unless, of course, the mutated gene isnot a critical one. Based on the methods described earlierin this section, we came up with a list of test sequencesfor the detection of each gene fault. It is to be noted thatthe Test Sequences generated here are only for the Hom-ing Sequence considered earlier. For a different HomingSequence the Test Sequence will also be different. Thedifferent test sequences and their ability to detect differ-ent single stuck-at faults are tabulated in Figure 15. Here,truncated versions of the same test sequence can be usedto detect different faults appearing in the same row. Fordetecting any particular fault, one would apply the testsequence from the same row truncated at the bit whosecolor matches that of the particular fault. The mismatchbetween the outputs of the normal and faulty systems,characterized by the vector [Bad, Bcl2] would then resultin the detection of that fault. Thus we have developed amethod to pinpoint the possible fault locations in a Boo-lean network with feedback. The algorithm will workwith multiple fault cases too with minor modifications.
Concluding remarksIn this paper, we have developed a Boolean networkmodel for the oxidative stress response. This model wasdeveloped based on pathway information from the cur-rent literature pertaining to oxidative stress. Whereapplicable, the behaviour predicted by the model is inagreement with experimental observations from thepublished literature. It is our hope that some of theadditional predictions here, such as those pertaining to
Figure 13 Block Diagram Representation of Fig.12. A simple description of the system showing clearly the feedback lines in the system.
Sridharan et al. BMC Genomics 2012, 13(Suppl 6):S4http://www.biomedcentral.com/1471-2164/13/S6/S4
Page 14 of 16

the oscillatory behaviour of certain genes in the pre-sence of oxidative stress, will be experimentally validatedin the near future.We have also linked the oxidative stress response to
the phenomenon of apoptosis via the PI3k/Akt pathway.An integrated model based on collectively consideringthe PI3k/Akt pathways and the oxidative stress responsepathways was developed and then used to pinpoint pos-sible fault locations based on the Bad-Bcl2 apoptoticsignatures in response to ‘test’ oxidative stress inputs.The approach used to achieve this differs significantlyfrom the earlier results in Layek et al. [6] since the Boo-lean network of this paper has feedback. The approachesused here and in Layek et al. [6] could potentially havea significant effect on cancer therapy in the future aspinpointing the possible fault location(s) in cancer couldpermit the choice of the appropriate combination ofdrugs (such as kinase inhibitors) for maximum thera-peutic effectiveness. Of course, it should be pointed out
that the theoretical procedure presented here for pin-pointing fault locations in a biological network withfeedback will need to be further simplified before it canbe even considered for practical biological validation.
Additional material
Additional file 1: Explains the algorithms discussed in themanuscript with toy examples.
AcknowledgementsBased on “Modelling oxidative stress response pathways”, by SriramSridharan, Ritwik Layek, Aniruddha Datta and Jijayanagaram Venkatraj whichappeared in Genomic Signal Processing and Statistics (GENSIPS), 2011 IEEEInternational Workshop on. © 2011 IEEE [39].This work was supported in part by the National Science Foundation underGrants ECCS-0701531 and and ECCS-1068628 and in part by the J. W.Runyon, Jr. ‘35 Professorship II Endowment Funds at Texas A & M University.This article has been published as part of BMC Genomics Volume 13Supplement 6, 2012: Selected articles from the IEEE International Workshop
Figure 14 Fault Detection using Time-Frame Expansion. Fault detection in the boolean(digital) network using time-frame expansion method.
Figure 15 Test Sequences for detecting single stuck-at-faults. The test sequence which can be given to system to find out single stuck-at-faults based on output signature.
Sridharan et al. BMC Genomics 2012, 13(Suppl 6):S4http://www.biomedcentral.com/1471-2164/13/S6/S4
Page 15 of 16

on Genomic Signal Processing and Statistics (GENSIPS) 2011. The fullcontents of the supplement are available online at http://www.biomedcentral.com/bmcgenomics/supplements/13/S6.
Author details1Texas A & M University, Electrical and Computer Engineering, CollegeStation, TX, 77843-3128, USA. 2Texas A & M University, Vet IntegrativeBiosciences, College Station, TX, 77843-4458, USA.
Authors’ contributionsSriram Sridharan did most of the theoretical work on this paper with someassistance from Ritwik Layek. Aniruddha Datta provided overall direction andsupervision while Jijayanagaram Venkatraj provided the relevant supportingbiological domain knowledge.
Competing interestsThe authors declare that they have no competing interests.
Published: 26 October 2012
References1. Weinberg RA: The Biology of Cancer. Garland Science, Princeton;, 1 2006.2. Datta A, Dougherty E: Introduction to Genomic Signal Processing with Control
Boca Raton: CRC Press; 2007.3. Viswanathan GA, Seto J, Patil S, Nudelman G, Sealfon SC: Getting Started in
Biological Pathway Construction and Analysis. PLoS Comput Biol 2008, 4:e16.
4. Saraiya P, North C, Duca K: Visualizing biological pathways: requirementsanalysis, systems evaluation and research agenda. InformationVisualization 2005, 1-15.
5. Layek R, Datta A, Dougherty ER: From Biological Pathways to RegulatoryNetworks. Mol BioSyst 2011, 7:843-851.
6. Layek R, Datta A, Bittner M, Dougherty ER: Cancer therapy design basedon pathway logic. Bioinformatics 2011, 27:548-555.
7. Simmons SO, Fan CY, Ramabhadran R: Cellular Stress Response PathwaySystem as a Sentinel Ensemble in Toxicological Screening. Toxicol Sci2009, 111:202-225.
8. Storz G, Imlay JA: Oxidative Stress. Current Opinion in Microbiology 1999,2:188-194.
9. Kensler TW, Wakabayashi N, Biswa S: Cell Survival Responses toEnvironmental Stresses Via the Keap1-Nrf2-ARE Pathway. Annu RevPharmacol Toxicol 2007, 47:89-110.
10. Lee JM, Johnson JA: An Important Role of Nrf2-ARE Pathway in theCellular Defense Mechanism. J Biochem Mol Biol 2004, 37:139-143.
11. Hong F, Freeman KRSML, Liebler DC: Specific patterns of electrophileadduction trigger Keap1 ubiquitination and Nrf2 activation. J Biol Chem2005, 280:31768-75.
12. Itoh K, Wakabayashi N, Katoh Y, Ishii T, O’Connor T, Yamamoto M: Keap1regulates both cytoplasmic-nuclear shuttling and degradation of Nrf2 inresponse to electrophiles. Genes to Cells 2003, 8:379-391.
13. Niture SK, Jaiswal AK: Prothymosin Mediates Nuclear Import of the INrf2/Cul3_Rbx1 Complex to Degrade Nuclear Nrf2. The Journal of BiologicalChemistry 2009, 284:13856-68.
14. Reichard JF, Motz GT, Puga A: Heme oxygenase-1 induction by NRF2requires inactivation of the transcriptional repres-sor BACH1. Nucl AcidsRes 2007, 35:7074-86.
15. Dhakshinamoorthy S, Jain AK, Bloom DA, Jaiswal AK: Bach1 competes withNrf2 leading to negative regulation of the antioxidant response element(ARE)-mediated NAD(P)H:quinone oxidoreductase 1 gene expression andinduction in response to antioxidants. J Biol Chem 2005, 280:16891-900.
16. Katsuoka F, Motohashi H, Engel JD, Yamamoto M: Nrf2 TranscriptionallyActivates the mafG Gene through an Antioxidant Response Element.J Biol Chem 2005, 280:4483-90.
17. Shan Y, Lambrecht RW, Donohue SE, Bonkovsky HL: Role of Bach1 andNrf2 in up-regulation of the heme oxygenase-1 gene by cobaltprotoporphyrin. FASEB J 2006, 20:2651-3.
18. Kauffman S: The Origins of Order: Self-Organization and Selection in EvolutionNew York: Oxford Univ. Press; 1993.
19. Lee OH, Jain AK, Papusha V, Jaiswal AK: An Auto-regulatory Loop betweenStress Sensors INrf2 and Nrf2 Controls Their Cellular Abundance. TheJournal of Biological Chemistry 2007, 282:36412-36420.
20. Huang HC, Nguyen T, Pickett CB: Phosphorylation of Nrf2 at Ser-40 byProtein Kinase C Regulates Antioxidant Response Element-mediatedTranscription. The Journal of Biological Chemistry 2002, 277:42769-42774.
21. Goh J, Enns L, Fatemie S, Hopkins H, Morton J, Pettan-Brewer C, Ladiges W:Mitochondrial targeted catalase suppresses invasive breast cancer inmice. BMC Cancer 2011, 11:191.
22. Sotgia F, Martinez-Outschoorn UE, Lisanti MP: Mitochondrial oxidativestress drives tumor progression and metastasis: should we useantioxidants as a key component of cancer treatment and prevention.BMC Medicine 2011, 9:62.
23. Bai RK, Leal SM, Covarrubias D, Liu A, Wong LJC: Mitochondrial GeneticBackground Modifies Breast Cancer Risk. Cancer Res 2007, 67:4687-4694.
24. Ferreira LM: Cancer metabolism: The Warburg effect today. Experimentaland Molecular Pathology 2010, 89:372-380.
25. Inoue M, Sato EF, Nishikawa M, Park Ah-Mee, Kira Y, Imada I, Utsumi K:Mitochondrial Generation of Reactive Oxygen Species and its Role inAerobic Life. Current Medicinal Chemistry 2003, 10:2495-2505.
26. Beal MF: Less stress, longer life. Nature Medicine 2005, 11:598-599.27. Sitaramayya A: Signal Transduction: Pathways, Mechanisms and Diseases
Berlin: Springer Verilag; 2010.28. Hanahan D, Weinberg RA: Hallmarks of Cancer: The Next Generation. Cell
2011, 144:646-674.29. Hanahan D, Weinberg RA: The Hallmarks of Cancer. Cell 2000, 100:57-70.30. Hahn WC, Weinberg RA: Rules for Making Human Tumor Cells. N Engl J
Med 2002, 1593-1603.31. Sakamoto K, Iwasaki K, Sugiyama H, Tsuji Y: Role of the Tumor Suppressor
PTEN in Antioxidant Responsive Element-mediated Transcription andAssociated Histone Modifications. Mol Biol Cell 2009, 20:1606-17.
32. Hennessy BT, Smith DL, Ram PT, Lu Y, Mills GB: Exploiting the PI3K/AKTPathway For Cancer Drug Discovery. Nature Reviews, Drug Discovery, 2005,4:988-1004.
33. Wang L, Chen Y, Sternberg P, Cai J: Essential Roles of the PI3 Kinase/AktPathway in Regulating Nrf2-Dependent Antioxidant Functions in theRPE. Invest Ophthalmol Vis Sci 2008, 49:1671-1678.
34. Martindale JL, Holbrook NJ: Cellular Response to Oxidative Stress:Signaling for Suicide and Survival. Journal of Cellular Physiology 2002,192:1-15.
35. Gross A, McDonnell JM, Korsmeyer SJ: BCL-2 family members and themitochondria in apoptosis. Genes and Development 1999, 13:1899-1911.
36. Coultas L, Strasser A: The role of the Bcl-2 protein family in cancer.Seminars in Cancer Biology 2003, 13:115-123.
37. Abramovici M, Breuer MA, Friedman AD: Digital Systems Testing andTestable Design. IEEE Press, The IEEE, Inc, New York;, 1 1990.
38. Breuer MA, Friedman AD: Diagnosis and Reliable Design of DigitalSystems. Computer Science Press, Inc., Maryland; 1989.
39. Sridharan S, Layek R, Datta A, Venkatraj J: Modelling oxidative stressresponse pathways. Genomic Signal Processing and Statistics (GENSIPS), 2011IEEE International Workshop on: 4-6 December 2011 2011, 166-169.
doi:10.1186/1471-2164-13-S6-S4Cite this article as: Sridharan et al.: Boolean modeling and faultdiagnosis in oxidative stress response. BMC Genomics 2012 13(Suppl 6):S4.
Submit your next manuscript to BioMed Centraland take full advantage of:
• Convenient online submission
• Thorough peer review
• No space constraints or color figure charges
• Immediate publication on acceptance
• Inclusion in PubMed, CAS, Scopus and Google Scholar
• Research which is freely available for redistribution
Submit your manuscript at www.biomedcentral.com/submit
Sridharan et al. BMC Genomics 2012, 13(Suppl 6):S4http://www.biomedcentral.com/1471-2164/13/S6/S4
Page 16 of 16