RESEARCH Open Access A goal-oriented, business ... · RESEARCH Open Access A goal-oriented,...
36
RESEARCH Open Access A goal-oriented, business intelligence-supported decision-making methodology Alireza Pourshahid 1* , Iman Johari 2 , Gregory Richards 3 , Daniel Amyot 4* and Okhaide S Akhigbe 4 * Correspondence: [email protected]; [email protected] 1 IBM Canada, Ottawa, Canada 4 School of Computer Science and Electrical Engineering, University of Ottawa, 800 King Edward Avenue, Ottawa, ON K1N 6N5, Canada Full list of author information is available at the end of the article Abstract In many enterprises and other types of organizations, decision making is both a crucial and a challenging task. Despite their importance, many decisions are still made based on experience and intuition rather than on evidence supported by rigorous approaches. Decisions are often made this way because of lack of data, unknown relationships between data and goals, conflicting goals, and poorly understood risks. This research presents a goal-oriented, business intelligence-supported methodology for decision making. The methodology, which is iterative, allows enterprises to begin with limited data, discover required data to build their models, capture stakeholders goals, and model threats, opportunities, and their impact. It also enables the aggregation of Key Performance Indicators and their integration into goal models. The tool-supported methodology and its models aim to enhance the user’s experience with common business intelligence applications. Managers can monitor the impact of decisions on the organization's goals and improve both decision models and business processes. The approach is illustrated and evaluated through a retail business scenario, from which several lessons were learned. One key lesson is that once an organization has a goal model, data can be added iteratively. The example, tool support, and lessons suggest the feasibility of the methodology. Keywords: Business Process Management; Business intelligence; Decision support systems; Goal-oriented modelling; Performance indicators; Tools; User requirements notation Background The motivation for this research stems from the observation that, despite the vast amount of time and effort spent on Business Intelligence (BI) technologies in orga- nizations, these systems often fail to influence managerial decision making (Ko and Abdullaev 2007; Korhonen et al. 2008). One of the issues is that BI can be viewed primarily as tool for data consolidation, not necessarily one that represents the managerial decision making environment. As a result, the decision making environment, which includes for example, organizational goals, key performance indicators related to these goals and linkages to the business processes involved, is not represented within the BI system. Yet, a stream of literature, beginning in the 1960s, has addressed the notion of decision-centric information delivery (Ackoff 1967; King and Cleland 1975). The recent development of goal modelling languages provides an opportunity to explore this notion in more detail. More specifically, we believe that the use of such © 2014 Pourshahid et al.; licensee Springer. This is an Open Access article distributed under the terms of the Creative Commons Attribution License (http://creativecommons.org/licenses/by/4.0), which permits unrestricted use, distribution, and reproduction in any medium, provided the original work is properly credited. Pourshahid et al. Decision Analytics 2014, 1:9 http://www.decisionanalyticsjournal.com/1/1/9
Transcript of RESEARCH Open Access A goal-oriented, business ... · RESEARCH Open Access A goal-oriented,...
Pourshahid et al. Decision Analytics 2014, 1:9http://www.decisionanalyticsjournal.com/1/1/9
RESEARCH Open Access
A goal-oriented, business intelligence-supporteddecision-making methodologyAlireza Pourshahid1*, Iman Johari2, Gregory Richards3, Daniel Amyot4* and Okhaide S Akhigbe4
* Correspondence:[email protected];[email protected] Canada, Ottawa, Canada4School of Computer Science andElectrical Engineering, University ofOttawa, 800 King Edward Avenue,Ottawa, ON K1N 6N5, CanadaFull list of author information isavailable at the end of the article
©Am
Abstract
In many enterprises and other types of organizations, decision making is both a crucialand a challenging task. Despite their importance, many decisions are still made basedon experience and intuition rather than on evidence supported by rigorous approaches.Decisions are often made this way because of lack of data, unknown relationshipsbetween data and goals, conflicting goals, and poorly understood risks. This researchpresents a goal-oriented, business intelligence-supported methodology for decisionmaking. The methodology, which is iterative, allows enterprises to begin with limiteddata, discover required data to build their models, capture stakeholders goals, andmodel threats, opportunities, and their impact. It also enables the aggregation of KeyPerformance Indicators and their integration into goal models. The tool-supportedmethodology and its models aim to enhance the user’s experience with commonbusiness intelligence applications. Managers can monitor the impact of decisions onthe organization's goals and improve both decision models and business processes.The approach is illustrated and evaluated through a retail business scenario, from whichseveral lessons were learned. One key lesson is that once an organization has a goalmodel, data can be added iteratively. The example, tool support, and lessons suggestthe feasibility of the methodology.
Keywords: Business Process Management; Business intelligence; Decision supportsystems; Goal-oriented modelling; Performance indicators; Tools; User requirementsnotation
BackgroundThe motivation for this research stems from the observation that, despite the vast
amount of time and effort spent on Business Intelligence (BI) technologies in orga-
nizations, these systems often fail to influence managerial decision making (Ko and
Abdullaev 2007; Korhonen et al. 2008). One of the issues is that BI can be viewed
primarily as tool for data consolidation, not necessarily one that represents the
managerial decision making environment. As a result, the decision making environment,
which includes for example, organizational goals, key performance indicators related to
these goals and linkages to the business processes involved, is not represented within the
BI system.
Yet, a stream of literature, beginning in the 1960s, has addressed the notion of
decision-centric information delivery (Ackoff 1967; King and Cleland 1975). The
recent development of goal modelling languages provides an opportunity to explore
this notion in more detail. More specifically, we believe that the use of such
2014 Pourshahid et al.; licensee Springer. This is an Open Access article distributed under the terms of the Creative Commonsttribution License (http://creativecommons.org/licenses/by/4.0), which permits unrestricted use, distribution, and reproduction in anyedium, provided the original work is properly credited.
Pourshahid et al. Decision Analytics 2014, 1:9 Page 2 of 36http://www.decisionanalyticsjournal.com/1/1/9
languages can enable integration of organizational goals, managerial decision models, Key
Performance Indicators (KPIs), and the relationship between KPIs and business processes
into a single methodology with proper tool support to better deliver information to man-
agers within a decision-centric context.
The main research question therefore, is whether the integration of goal, KPI, and
business process models together with BI systems is feasible and potentially benefi-
cial for decision making, especially for middle-level managers and in the presence of
sparse data. Accordingly, the main objectives of the research were:
� To develop a framework to model goals, key performance indicators and processes,
using one modelling notation, in an iterative and incremental manner;
� To define a method for modelling and analysis of cause-effect relationships between
indicators used to measure goal satisfaction; and
� To specific a technical architecture for integration of an existing open source
modelling tool with the BI system as a means of implementing the aforementioned
framework.
MethodWe use a research method inspired from design science (Hevner et al. 2004; Hevner
and Chatterjee 2010), where we construct and evaluate relevant artefacts to enable
managerial decision making. This method relies on iterative improvements to the
research based on three cycles: relevance, rigor, and design.
� Relevance cycle: The research was conducted through collaboration with a
medium-sized organization in the retail sector. Through interviews with
managers and observations of their data management and decision making
processes, we developed familiarity with the current processes and methods
allowing us to better define and scoped the problem areas.
� Rigor cycle: Literature was reviewed to find existing research results on decision
making with an emphasis on approaches based on BI and goal and process
modelling. This step helped us to better understand the state of the art and
related research and to validate our research topic.
� Design cycle: We built model artefacts of a real-life example to motivate, illustrate
and evaluate the main aspects of our decision-making methodology. Feedback
from real users was incorporated in our methodology during its refinement. Tool
support was developed to demonstrate the feasibility of the methodology. Lessons
learned from the design cycle were also documented to augment the knowledge
base related to goal-oriented and BI-driven decision making.
The main contributions of this paper include:
� A novel goal-oriented decision methodology that integrates goal models, decision
models, threats and opportunities (collectively called situations in this paper), and
processes together with analytic capabilities in order to improve decision-making
capabilities within BI systems.
Pourshahid et al. Decision Analytics 2014, 1:9 Page 3 of 36http://www.decisionanalyticsjournal.com/1/1/9
� Extensions of a standard goal-oriented language (from the User Requirements
Notation) to better model and analyze relationships between KPIs, goals, and
situations. In particular, these extensions enhance what-if strategy analysis in
support of decision making.
� Tool support for the above extensions and for integration of goal/decision models
with BI systems (particularly with a commercially available system, namely IBM
Cognos BI).
The rest of the paper presents our literature review (resulting from the relevance and
rigor cycles), the methodology that exploits goal and process modelling together with
BI for decision making (from the design cycle), and the application of the methodology
to a real-life example from the retail organization (also from the design cycle).
Literature reviewThis section reviews important concepts and relevant research in the areas of decision
making based on BI, goal and process modelling with the User Requirements Notation
(URN), and the use of the Goal-oriented Requirement Language (GRL) combined with
Key Performance Indicators for business modelling.
Current challenges related to BI-based decision making
BI is typically thought of as a category of applications specifically related to the
provision of information for management decision-making (Negash 2004; Shariat and
Hightower 2007). In some cases, Data Warehouses (DW) are seen as components of BI
(Negash 2004; Wixom et al. 2008), but many standalone BI tools exist for the delivery
of on-line analytic processing, dashboards, and reporting. These tools capture data
from a variety of different sources including the DW.
Currently, BI information is consumed in a variety of ways. Managers either interact
directly with the system viewing data presented in graphical or tabular reports, or they
rely on analysts to prepare such reports (Negash 2004). In some cases, dashboards are
used to provide a quick review of performance against targets. Alternatively or in con-
junction, on-line analytic processing (OLAP) might be employed to explore perform-
ance across a range of different dimensions within the data set such as customer,
location, or product.
The use of BI to actually make a decision, however, still requires a fair bit of data
manipulation even after the data has been delivered in the formats mentioned above
because another series of steps are needed to arrive at a decision after the data has been
viewed (Cooper et al. 2000; Vinekar et al. 2009). Although the fundamental goal of BI is
to enable informed decision-making that results in improved organizational performance
(Vinekar et al. 2009), it has been argued that, perhaps due to the lack of integration of BI
into the decision making process, more than 50% of BI implementations fail to influence
the decision-making process in any meaningful way (Ko and Abdullaev 2007).
The dichotomy between data delivery and the use of data in decision making is
evidenced by the categorization of BI tools into data-driven support and decision
support (Isik et al. 2011). Data support is related to the delivery of accurate, up-to-date
data while decision support refers to the assistance provided to the user in actually

Pourshahid et al. Decision Analytics 2014, 1:9 Page 4 of 36http://www.decisionanalyticsjournal.com/1/1/9
making decisions based on the available data (Power and Sharda 2007). As March and
Hevner (2007) point out, simply loading transactional data into a Data Warehouse is
not necessarily the answer if the objective is to enable managerial decision-making.
Korhonen et al. (2008) argue that one of the key challenges faced in institutionalizing
decision aids is validating decision models used by the decision maker. The implication is
that such a model would help to provide information more closely linked to the decision
to be made. One problem associated with the integration of data in this way is the fact
that the need for analytic information differs from the need for transactional information,
and Information System professionals lack adequate models to clearly define analytic
information needs (March and Hevner 2007; Stroh et al. 2011).
This notion of delivering information based on “decision analysis”, however, has a long
history in management information systems (MIS). For example, over 30 years ago, Ackoff
(1967) called for the use of decision analysis as the key to designing a useful MIS. King
and Cleland (1975), as well as Henderson and West (1979), explored the use of “decision
inventories”, and King and Cleland (1975) proposed the concept of “decision models” as a
means of specifying the decision environment in more detail.
More recent decision-centric approaches to information delivery include Watson and
Frolick’s (1993) “strategic business objective” technique. In this approach, the strategic
business objectives and the processes that influence their accomplishment are defined
and serve as the basis for information delivery. Similarly, goal-oriented techniques are
based on mapping organizational goals and attendant sub-goals as a means of defining
information needs of managers (Siena et al. 2008). In addition, Prakash and Gosain
(2008) describe the goal-decision-information (GDI) approach for DW development,
which defines goals and associated decisions leading to a better understanding of the data
required in a DW. Finally, Liew and Sundaram (2009) define a complex “flexible object-
oriented decision system” that leverages information about organizational objectives as a
starting point for defining information requirements.
Although decision or goal analysis is the foundation for many of the above approaches,
most are applied at the enterprise level and thus are not necessarily in line with current
BI technologies. Furthermore, while they do focus on delivery of information linked
to goals and outcomes, many are static in that they seek to design the goal system as
a “business architecture” that informs the information architecture.
In addition, while many of these models do explore linkages between goals and informa-
tion required for the decisions, the actual KPIs and the interrelationships between KPIs
and goals are not defined. According to Popova and Sharpanskykh (2010), even when
relationships can be defined, such as in the ARIS model (Davis and Brabänder 2007)
where users articulate cause-effect relationships using Balanced Scorecards and connect
KPIs to strategic goals, the analysis options are inadequate due to a lack of formal modelling
foundations and proper representations.
In order to shorten the gap between the delivery of information and decision making,
we propose an approach that borrows from the decision analysis tradition. Specifically, we
seek to create a BI-supported decision methodology by providing a means of defining
decision models that illustrate cause-effect relationships among variables relevant to the
decision for specific roles in the organization. As in the GDI and strategic business objective
approaches, the model includes definition of goals and the presumed drivers of these goals.
To this approach we add Key Performance Indicators, which are organized according to the
Pourshahid et al. Decision Analytics 2014, 1:9 Page 5 of 36http://www.decisionanalyticsjournal.com/1/1/9
decision model and are “dimensionally aware”, allowing users to compare KPIs from
different store locations for example. Finally, to allow for adaptability in the process, we
take a prototyping, iterative approach to model development, which allows for adaptation
as business needs change or as managers become clearer on what types of information
they need for various decisions.
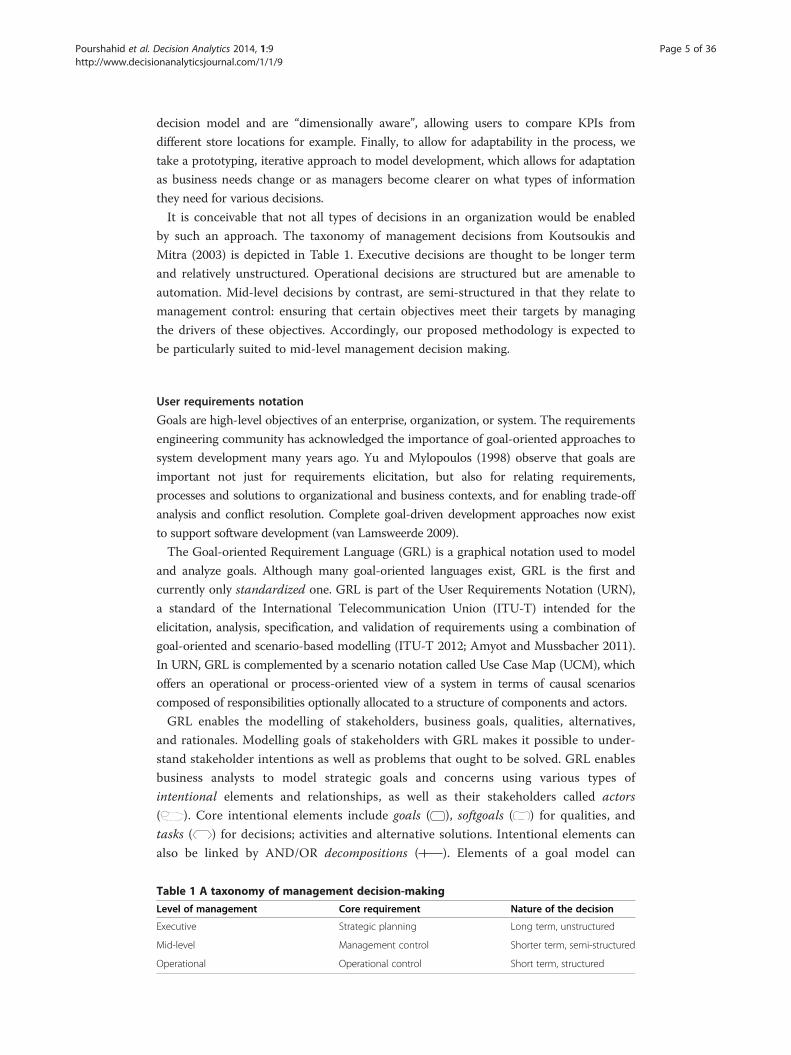
It is conceivable that not all types of decisions in an organization would be enabled
by such an approach. The taxonomy of management decisions from Koutsoukis and
Mitra (2003) is depicted in Table 1. Executive decisions are thought to be longer term
and relatively unstructured. Operational decisions are structured but are amenable to
automation. Mid-level decisions by contrast, are semi-structured in that they relate to
management control: ensuring that certain objectives meet their targets by managing
the drivers of these objectives. Accordingly, our proposed methodology is expected to
be particularly suited to mid-level management decision making.
User requirements notation
Goals are high-level objectives of an enterprise, organization, or system. The requirements
engineering community has acknowledged the importance of goal-oriented approaches to
system development many years ago. Yu and Mylopoulos (1998) observe that goals are
important not just for requirements elicitation, but also for relating requirements,
processes and solutions to organizational and business contexts, and for enabling trade-off
analysis and conflict resolution. Complete goal-driven development approaches now exist
to support software development (van Lamsweerde 2009).
The Goal-oriented Requirement Language (GRL) is a graphical notation used to model
and analyze goals. Although many goal-oriented languages exist, GRL is the first and
currently only standardized one. GRL is part of the User Requirements Notation (URN),
a standard of the International Telecommunication Union (ITU-T) intended for the
elicitation, analysis, specification, and validation of requirements using a combination of
goal-oriented and scenario-based modelling (ITU-T 2012; Amyot and Mussbacher 2011).
In URN, GRL is complemented by a scenario notation called Use Case Map (UCM), which
offers an operational or process-oriented view of a system in terms of causal scenarios
composed of responsibilities optionally allocated to a structure of components and actors.
GRL enables the modelling of stakeholders, business goals, qualities, alternatives,
and rationales. Modelling goals of stakeholders with GRL makes it possible to under-
stand stakeholder intentions as well as problems that ought to be solved. GRL enables
business analysts to model strategic goals and concerns using various types of
intentional elements and relationships, as well as their stakeholders called actors
( ). Core intentional elements include goals ( ), softgoals ( ) for qualities, and
tasks ( ) for decisions; activities and alternative solutions. Intentional elements can
also be linked by AND/OR decompositions ( ). Elements of a goal model can
Table 1 A taxonomy of management decision-making
Level of management Core requirement Nature of the decision
Executive Strategic planning Long term, unstructured
Mid-level Management control Shorter term, semi-structured
Operational Operational control Short term, structured
Pourshahid et al. Decision Analytics 2014, 1:9 Page 6 of 36http://www.decisionanalyticsjournal.com/1/1/9
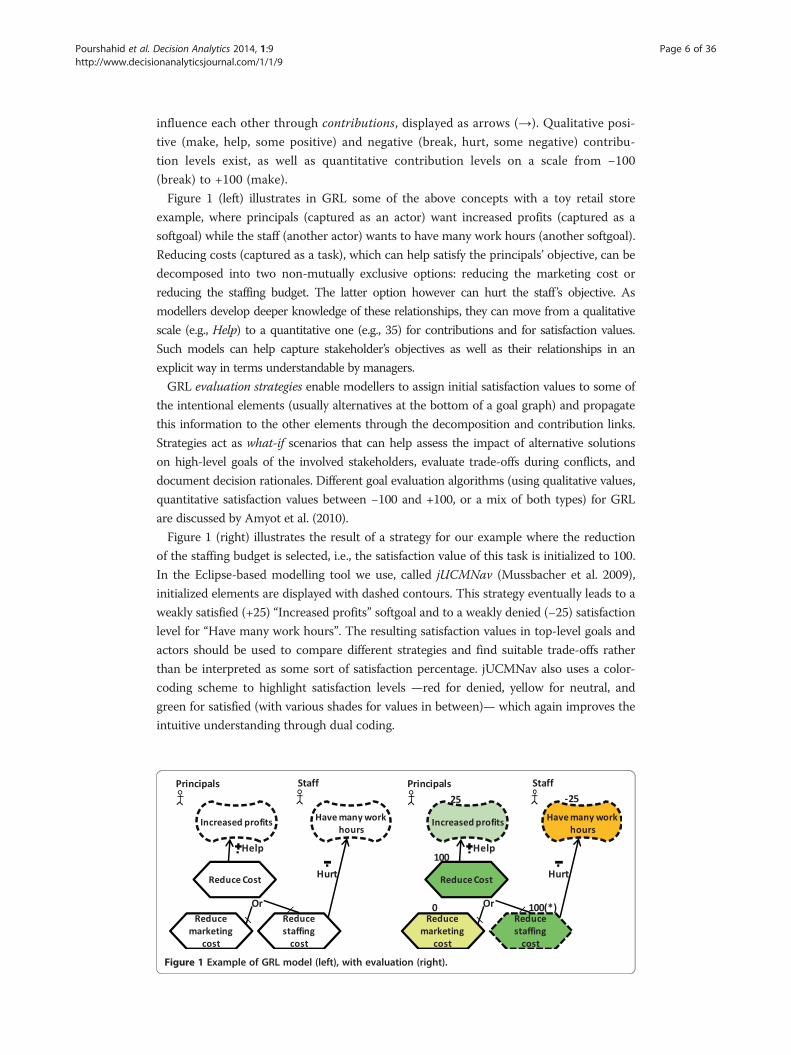
influence each other through contributions, displayed as arrows (→). Qualitative posi-
tive (make, help, some positive) and negative (break, hurt, some negative) contribu-
tion levels exist, as well as quantitative contribution levels on a scale from −100(break) to +100 (make).
Figure 1 (left) illustrates in GRL some of the above concepts with a toy retail store
example, where principals (captured as an actor) want increased profits (captured as a
softgoal) while the staff (another actor) wants to have many work hours (another softgoal).
Reducing costs (captured as a task), which can help satisfy the principals’ objective, can be
decomposed into two non-mutually exclusive options: reducing the marketing cost or
reducing the staffing budget. The latter option however can hurt the staff ’s objective. As
modellers develop deeper knowledge of these relationships, they can move from a qualitative
scale (e.g., Help) to a quantitative one (e.g., 35) for contributions and for satisfaction values.
Such models can help capture stakeholder’s objectives as well as their relationships in an
explicit way in terms understandable by managers.
GRL evaluation strategies enable modellers to assign initial satisfaction values to some of
the intentional elements (usually alternatives at the bottom of a goal graph) and propagate
this information to the other elements through the decomposition and contribution links.
Strategies act as what-if scenarios that can help assess the impact of alternative solutions
on high-level goals of the involved stakeholders, evaluate trade-offs during conflicts, and
document decision rationales. Different goal evaluation algorithms (using qualitative values,
quantitative satisfaction values between −100 and +100, or a mix of both types) for GRL
are discussed by Amyot et al. (2010).
Figure 1 (right) illustrates the result of a strategy for our example where the reduction
of the staffing budget is selected, i.e., the satisfaction value of this task is initialized to 100.
In the Eclipse-based modelling tool we use, called jUCMNav (Mussbacher et al. 2009),
initialized elements are displayed with dashed contours. This strategy eventually leads to a
weakly satisfied (+25) “Increased profits” softgoal and to a weakly denied (−25) satisfactionlevel for “Have many work hours”. The resulting satisfaction values in top-level goals and
actors should be used to compare different strategies and find suitable trade-offs rather
than be interpreted as some sort of satisfaction percentage. jUCMNav also uses a color-
coding scheme to highlight satisfaction levels —red for denied, yellow for neutral, and
green for satisfied (with various shades for values in between)— which again improves the
intuitive understanding through dual coding.
Figure 1 Example of GRL model (left), with evaluation (right).
Pourshahid et al. Decision Analytics 2014, 1:9 Page 7 of 36http://www.decisionanalyticsjournal.com/1/1/9
The Use Case Map notation is a visual process modelling language for specifying causal
scenarios and optionally allocating their activities to an underlying structure of components
and actors. UCMs model scenarios and processes with causal relationships, where
responsibilities ( ) are sequenced and may be assigned to components ( ). Responsi-
bilities represent activities performed in a process whereas components represent ac-
tors, systems, and system parts. UCMs support most of the concepts used in common
workflow modelling notations including start points ( ), end points (|) as well as
guarded alternatives and concurrent flows. Stubs ( ) are containers for sub-maps and
can be used to organize a complex model in a hierarchical structure. Furthermore,
URN allows typed links to be established between modelling elements (e.g., between a
GRL goal and a UCM responsibility). UCMs can be used to model as-is and to-be
business processes, as will be seen in our illustrative case study.
GRL and KPIs for business modelling
Although the primary application domains for URN target reactive systems and
telecommunications systems, this language has also been applied successfully to the
modelling and analysis of business goals and processes (Weiss and Amyot 2005). Goal
models combined with process models have been used elsewhere to assess the risk
and viability of business solutions (Ansar et al. 2008) and model different concerns of
interest to different stakeholders (Colombo and Mylopoulos 2006). However, in order
to better support business process monitoring and performance management, Pourshahid
et al. (2007, 2009) have extended GRL with the concept of Key Performance Indicators
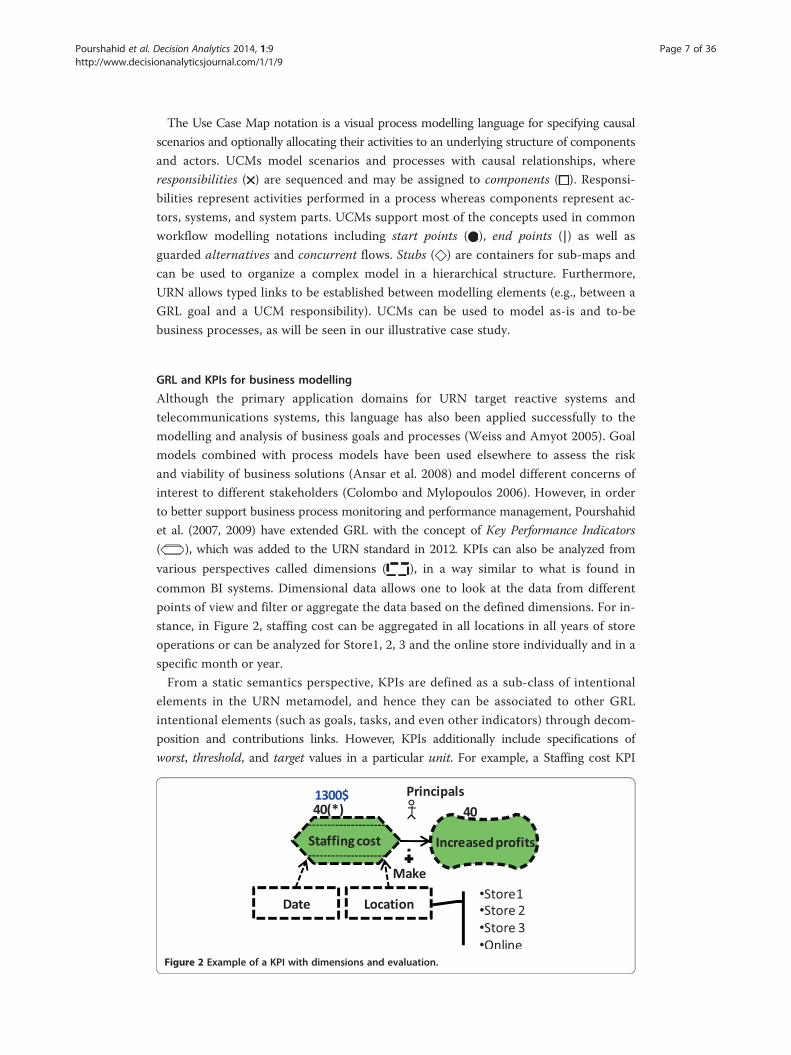
( ), which was added to the URN standard in 2012. KPIs can also be analyzed from
various perspectives called dimensions ( ), in a way similar to what is found in
common BI systems. Dimensional data allows one to look at the data from different
points of view and filter or aggregate the data based on the defined dimensions. For in-
stance, in Figure 2, staffing cost can be aggregated in all locations in all years of store
operations or can be analyzed for Store1, 2, 3 and the online store individually and in a
specific month or year.
From a static semantics perspective, KPIs are defined as a sub-class of intentional
elements in the URN metamodel, and hence they can be associated to other GRL
intentional elements (such as goals, tasks, and even other indicators) through decom-
position and contributions links. However, KPIs additionally include specifications of
worst, threshold, and target values in a particular unit. For example, a Staffing cost KPI
Figure 2 Example of a KPI with dimensions and evaluation.

Pourshahid et al. Decision Analytics 2014, 1:9 Page 8 of 36http://www.decisionanalyticsjournal.com/1/1/9
(see Figure 2) could have a target value of $1000, a threshold value of $1,500, and
a worst value of $2,500. KPIs also contain a current value, which is either defined
in a GRL evaluation strategy or provided by an external source of information such
as a database, an Excel sheet, a BI tool, external sensors, or web services. The KPI
is a metric of the system that normalizes the current value to a scale of −100 to
100, which enables it to be used like any other intentional element in a GRL
model. For instance, if the current Staffing Cost is $1,300, then the normalization
function, which takes here |threshold-current|/|threshold-target|*100, will result in
a satisfaction level of 40. Furthermore, when the current value is between the
threshold value and the worst value (e.g., $2,500), then the normalization function
becomes |threshold-current|/|worst-threshold| * (−100), which results in a negative
value (e.g., −100 here). If the result is higher than 100, then it becomes 100 (symmetrically,
if it is lower than −100, then it becomes −100). Such an evaluation strategy was used in
Figure 2. After the satisfaction level (i.e., 40) is calculated, the usual GRL quantitative algo-
rithm is used to evaluate the satisfaction level of the goals connected to the KPI (i.e., Increase
profits). Note also in this model that Staffing cost could be drilled down (e.g., explored)
according to the Date and Location dimensions.
Although goal modelling and scorecards have been used in combination in the past
(Babar et al. 2010; Siena et al. 2008), we believe KPIs are also necessary because they
act as an interface between conventional goal models and quantitative, external sources
of information. Our work, together with the work on qualitative indicators of Tawhid
et al. (2012), has actually led to the standardization of KPIs by ITU-T as part of URN
(ITU-T 2012). This standard goes beyond other goal-indicator approaches, such the
one proposed by Popova and Sharpanskykh (2011), in that quantitative and qualitative
indicators are both supported and are compatible with strategy-based propagation
algorithms.
Furthermore, Chen (2007) and Pourshahid et al. (2009) have introduced and implemented
a service-oriented architecture enabling the use of underlying data and BI reports by the
jUCMNav tool. jUCMNav is connected to BI systems via a web service. All the information
generated by the BI system, from raw data to very complex data warehouses, can hence be
used as qualitative data to initialize the KPIs used in the GRL model, and against which goal
satisfaction is evaluated.
Although several other goal modelling languages exist (e.g., i*, Tropos, KAOS, and
the Extended Enterprise Modeling Language), the combination of support for KPIs and
performance modelling, the ability to combine process and goal models and perform
analysis on both, the possibility of defining strategies, existing tool support for using BI
systems as sources of data, and the fact that URN is a standard modelling language, all
together have convinced us that URN is the best language to be used in the context of
our research. A more formal and detailed evaluation of 14 popular goal and process
modelling languages is provided in Pourshahid (2014), with a similar conclusion.
Decision-making methodology
The methodology we have developed defines the organizational goals and links these
explicitly to a decision model and relevant Key Performance Indicators. The methodology
can be used by organizations at any level of maturity and readiness in terms of gathering
and monitoring data for BI-based decision making. In particular, unlike many simulation
Pourshahid et al. Decision Analytics 2014, 1:9 Page 9 of 36http://www.decisionanalyticsjournal.com/1/1/9
approaches, it does not necessitate up front large quantities of data to be useful. We
believe different organizations however have different needs and may be in different states
when they decide to incorporate such a methodology. Consequently, we are suggesting an
iterative approach for this section.
Furthermore, we extend the existing modelling notation (URN) and its associated
evaluation algorithms to allow organizations to better define the relationship between
the KPIs and also to aggregate the KPI values using custom formulas.
Finally, we propose an enhancement to the supporting tool (jUCMNav) to enable
better integration with Business Intelligence tools. This helps organizations to use their
existing BI systems to initialize the KPI values of the defined models. Although this
additional tool support can be helpful for organizations that would like to automate this
part of the process, it is not a required component of the methodology and a small
organization without a sophisticated Business Intelligence infrastructure can still benefit
from the approach.
In the next three subsections, we elaborate on the three main contributions of this
paper in more detail.
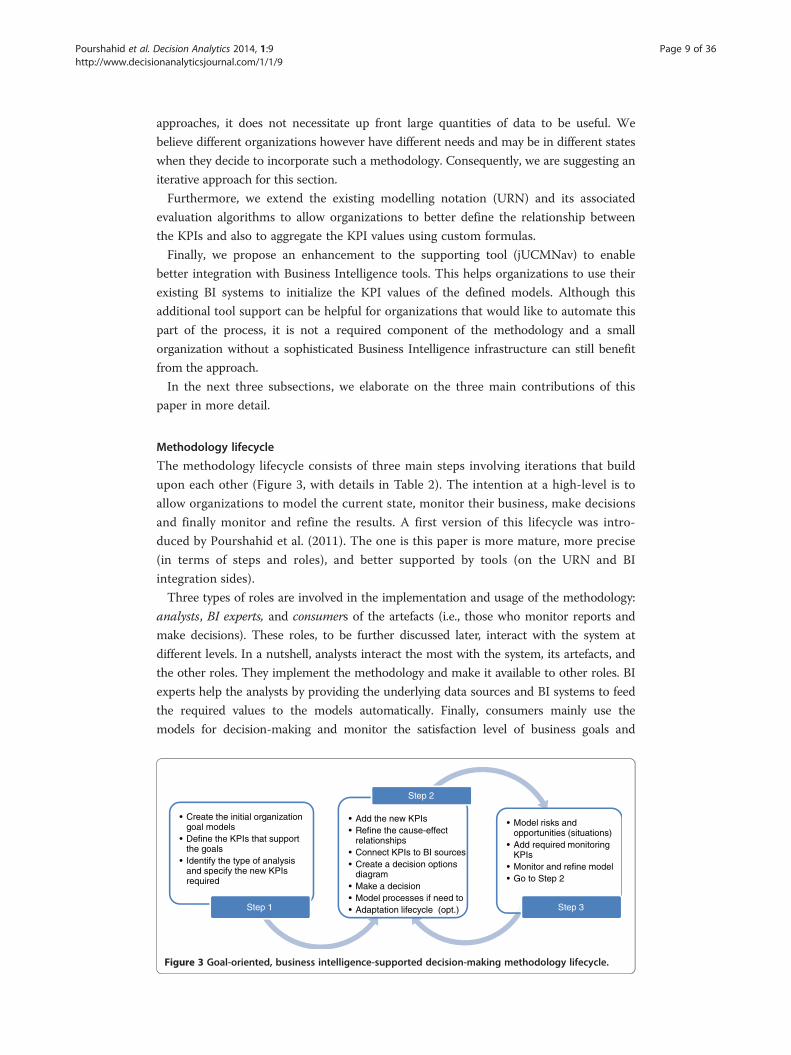
Methodology lifecycle
The methodology lifecycle consists of three main steps involving iterations that build
upon each other (Figure 3, with details in Table 2). The intention at a high-level is to
allow organizations to model the current state, monitor their business, make decisions
and finally monitor and refine the results. A first version of this lifecycle was intro-
duced by Pourshahid et al. (2011). The one is this paper is more mature, more precise
(in terms of steps and roles), and better supported by tools (on the URN and BI
integration sides).
Three types of roles are involved in the implementation and usage of the methodology:
analysts, BI experts, and consumers of the artefacts (i.e., those who monitor reports and
make decisions). These roles, to be further discussed later, interact with the system at
different levels. In a nutshell, analysts interact the most with the system, its artefacts, and
the other roles. They implement the methodology and make it available to other roles. BI
experts help the analysts by providing the underlying data sources and BI systems to feed
the required values to the models automatically. Finally, consumers mainly use the
models for decision-making and monitor the satisfaction level of business goals and
• Create the initial organization goal models
• Define the KPIs that support the goals
• Identify the type of analysis and specify the new KPIs required
Step 1
• Add the new KPIs• Refine the cause-effect
relationships• Connect KPIs to BI sources• Create a decision options
diagram• Make a decision• Model processes if need to• Adaptation lifecycle (opt.)
Step 2
• Model risks and opportunities (situations)
• Add required monitoring KPIs
• Monitor and refine model• Go to Step 2
Step 3
Figure 3 Goal-oriented, business intelligence-supported decision-making methodology lifecycle.
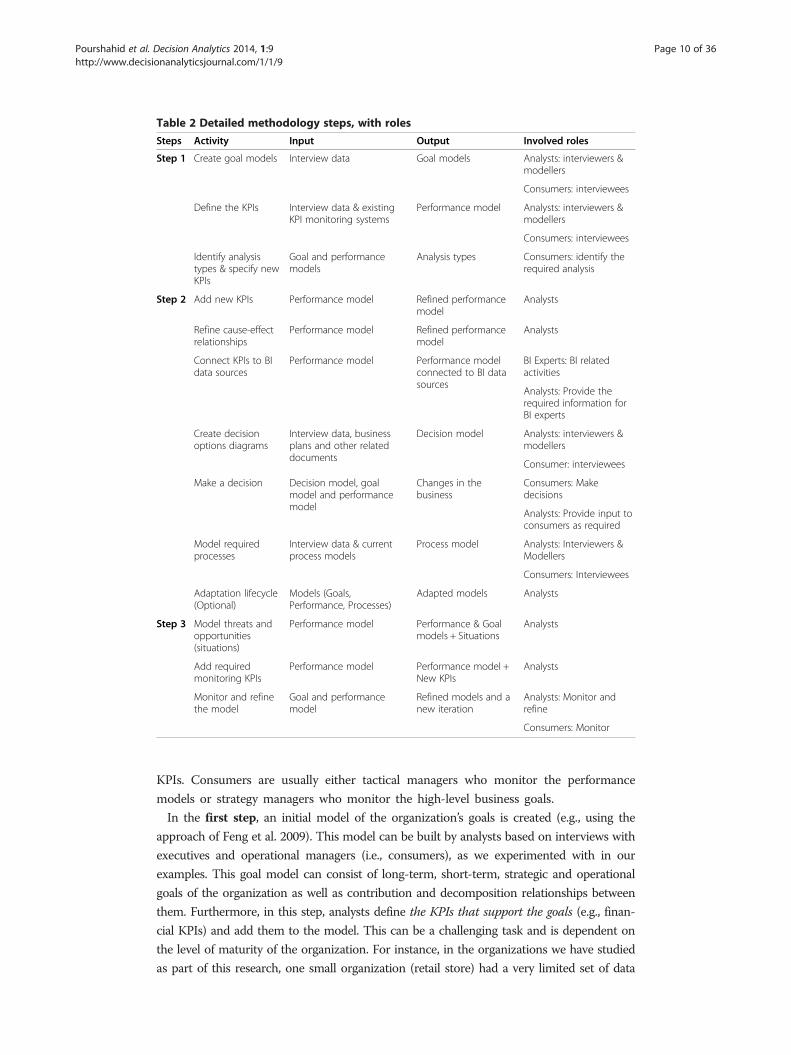
Table 2 Detailed methodology steps, with roles
Steps Activity Input Output Involved roles
Step 1 Create goal models Interview data Goal models Analysts: interviewers &modellers
Consumers: interviewees
Define the KPIs Interview data & existingKPI monitoring systems
Performance model Analysts: interviewers &modellers
Consumers: interviewees
Identify analysistypes & specify newKPIs
Goal and performancemodels
Analysis types Consumers: identify therequired analysis
Step 2 Add new KPIs Performance model Refined performancemodel
Analysts
Refine cause-effectrelationships
Performance model Refined performancemodel
Analysts
Connect KPIs to BIdata sources
Performance model Performance modelconnected to BI datasources
BI Experts: BI relatedactivities
Analysts: Provide therequired information forBI experts
Create decisionoptions diagrams
Interview data, businessplans and other relateddocuments
Decision model Analysts: interviewers &modellers
Consumer: interviewees
Make a decision Decision model, goalmodel and performancemodel
Changes in thebusiness
Consumers: Makedecisions
Analysts: Provide input toconsumers as required
Model requiredprocesses
Interview data & currentprocess models
Process model Analysts: Interviewers &Modellers
Consumers: Interviewees
Adaptation lifecycle(Optional)
Models (Goals,Performance, Processes)
Adapted models Analysts
Step 3 Model threats andopportunities(situations)
Performance model Performance & Goalmodels + Situations
Analysts
Add requiredmonitoring KPIs
Performance model Performance model +New KPIs
Analysts
Monitor and refinethe model
Goal and performancemodel
Refined models and anew iteration
Analysts: Monitor andrefine
Consumers: Monitor
Pourshahid et al. Decision Analytics 2014, 1:9 Page 10 of 36http://www.decisionanalyticsjournal.com/1/1/9
KPIs. Consumers are usually either tactical managers who monitor the performance
models or strategy managers who monitor the high-level business goals.
In the first step, an initial model of the organization’s goals is created (e.g., using the
approach of Feng et al. 2009). This model can be built by analysts based on interviews with
executives and operational managers (i.e., consumers), as we experimented with in our
examples. This goal model can consist of long-term, short-term, strategic and operational
goals of the organization as well as contribution and decomposition relationships between
them. Furthermore, in this step, analysts define the KPIs that support the goals (e.g., finan-
cial KPIs) and add them to the model. This can be a challenging task and is dependent on
the level of maturity of the organization. For instance, in the organizations we have studied
as part of this research, one small organization (retail store) had a very limited set of data

Pourshahid et al. Decision Analytics 2014, 1:9 Page 11 of 36http://www.decisionanalyticsjournal.com/1/1/9
and was using a spreadsheet to monitor the business while the other (a large teaching
hospital) had many indicators available and was using a sophisticated Business
Intelligence system. Our discussions with both organizations however demonstrate that
organizations at any point within this wide range of information management capabil-
ities can benefit from applying such a goal-based model. After defining the performance
and goal models, consumers will have a better picture of their business, will identify the
type of analysis they want to perform on the model and specify the new KPIs required
to do so if any are missing.
In the second step, analysts explore the existing models, discover and add the
new KPIs and the new dimensions to the model required to perform a better job
in monitoring various aspects of the business. Note that not all the KPIs need to
be dimensional and if the available data is not as granular as is required for a
dimensional model, or if all the data is not available, a step-by-step approach can
be used leading to a number of model iterations as additional data becomes
available.
In addition, during this process analysts refine the relationships between KPIs in the goal
model. These relationships create a graphical model, which can be used to analyze what-if
scenarios. The relationships are defined using mathematical formulas that are discussed
comprehensively in the next sub-section. For example, a relationship between the “New
customer count” KPI and the “Online marketing campaign budget” and “Flyer budget”
KPIs could look like the following:
New customer count ¼ Online marketing campaign budget in $=ð 0:5 $=customerÞ
þFlyer budget in $= 0:8 $=customerð Þ
Such formulae capturing relationships between KPIs can be refined based on historical
data, for example through data mining. In cases where organizations do not have histor-
ical data and are in early stages of creating their performance model, the initial formula
used to define the KPI relationships can be based on industry standards (e.g., Gartner
2014; World Intellectual Capital 2014); analysts have to start somewhere, even if the
relationships are not right the first time. As the organization gathers more information,
this historical data can be integrated into the model. As will be seen later in the retail
example, the models can be used to illustrate the expected impact of actions taken by
involved consumers and analysts.
Once a performance model is ready, as an optional step, BI experts can get involved
and use that model as a reference to understand the monitoring needs of the
organization and create (or reuse) the underlying BI infrastructure, including data
warehouses and BI reports, to feed the performance model. This is a collaborative effort
between analysts and BI experts and may result in refining the performance model by
adding raw data elements to read the data directly from BI systems.
Analysts can also add a decision model and connect the model’s options to the goals
and KPIs of the organization. A decision model outlines the different options available to
organizations to achieve their goals. This diagram helps managers to visualize the options
and define GRL strategies that reflect the result of selecting one of the options. Note that
this is not a new type of graphical diagram and it is only a terminology choice in our
methodology to isolate the decision options from goal and performance models.

Pourshahid et al. Decision Analytics 2014, 1:9 Page 12 of 36http://www.decisionanalyticsjournal.com/1/1/9
Moreover, organizations can continually adapt the models by saving the initial iteration
as a “snapshot” and comparing it to actual results achieved by decisions. Gathering these
snapshots will eventually create a “decision trail” that displays decisions taken and results
thus allowing managers to continually improve their decisions. In addition, decision trails
allow organizations to refer back to the rationale they used for making successful or
unsuccessful decisions. At this time, the snapshots are not currently supported by tools at
the model level, and analysts have to save various model versions and rely on BI tools and
databases for snapshot capabilities. This functionality needs to be further developed in the
supporting tool in the future but is out of the scope of this paper.
Furthermore, the notation used for the methodology and the modelling tool allow
the organization to model business processes (with UCM) in an integrated environment
with the KPI models. This often can be used when the analysts believe some of the
processes in the organization need closer attention to enhance the KPIs of interest.
Analysts can model the as-is and proposed to-be processes and use the KPI model to
monitor the expected results. When process adaptation is considered to be an option
for improving certain aspect of a business, analysts can use the process adaptation
lifecycle. The latter exploits redesign patterns and aspect-oriented extensions to URN
(Pourshahid et al. 2012, 2013) to detect improvement opportunities and dynamically
adapt business processes in consequence. This lifecycle, detailed by Pourshahid (2014),
is outside the scope of this paper.
In the third step, analysts add the expected impact, if any, of the decision made in the
second step to the model that illustrates either threats or opportunities involved. Such
expected impact is modelled with situations, a new concept in our methodology, which is
akin to situations in the Business Intelligence Model (BIM), which is focused on SWOT
(Strengths, Weaknesses, Opportunities, and Threats) analysis (Jiang et al. 2011; Horkoff
et al. 2014; Yu et al. 2013). Situations, in this paper, capture the opportunities or threats that
affect the way a business operates. For instance, investment in an online store brings the risk
of reducing the profits of the business for a period of time. Using stereotyped GRL softgoals
to capture situations, we are able to the show the qualitative impact of situations on the rest
of the model. The most challenging aspect of this step is modelling a qualitative situation
factor that influences a quantitative KPI. In this case, we model the impact by increasing the
range of acceptable values for a KPI. In other words, once we have estimated the impact of
the situation, we allow the acceptable range of the measured KPI to deviate accordingly
from its target value.
In this third step, analysts also add the required KPIs and dimensions to the model
that allows analysts and consumers to better observe the impact of decisions. If analysts
expect a decision to change anything in the organization, they will examine that
hypothesis using the appropriate KPIs and GRL strategies.
Finally, analysts monitor the impact of the changes made to the business or
processes and compare expected results against actual results. Based on this com-
parison, analysts refine the models as required and record the data. Monitoring of
the business could be done in several ways. Analysts and consumers can observe the
results of business goals and KPIs one by one and look for signs of unsatisfied
business goals and performance indicators in the models. They can also take advantage
of more sophisticated reports based on BI tools, or of detection mechanisms from the
adaptation lifecycle (Pourshahid 2014).
Pourshahid et al. Decision Analytics 2014, 1:9 Page 13 of 36http://www.decisionanalyticsjournal.com/1/1/9
In summary, the methodology is based on creating an initial model, which is then
refined by expanding data sources, capturing decisions made and the results of those
decisions, and building historical decision trails that inform future models.
New goal evaluation with KPI aggregation and situation analysis
Although several “standard” GRL evaluation algorithms (qualitative, quantitative and
hybrid) already exist, as described by Amyot et al. (2010), none of them provides
the formula-based KPI aggregation required for the type of cause-effect analysis
performed in our decision making context. The current algorithms allow modellers
to specify the contribution level of a KPI on another GRL intentional element and
to calculate the satisfaction level of that target element (Pourshahid et al. 2009).
However, these algorithms prevent one KPI from driving the computation of the
current value of another KPI. Although the current evaluation methods allow com-
puting the impact of one KPI on another KPI in terms of satisfaction levels, when it
comes to showing the impact of several KPIs on one KPI (e.g., their aggregate
effect), the current evaluation methods quickly become a bottleneck and thus ob-
struct the cause-effect analysis. Furthermore the current algorithms have no means
to consider the impact of situations (threats and opportunities) in the calculation of
the evaluation values. There is also a need to connect KPIs to raw data values in
goal models. These three features (KPI aggregation, KPI calculation using raw data
values, and situation impact) are essential as they allow modellers and managers to
explore and modify the way KPIs impact each other inside the goal model. This
may happen frequently, especially when little data or knowledge about the enterprise
is available or when the organization is small and does not want to have a large
infrastructure in place. The alternative is to rely on heavy computing at the BI tool
level and hence involves complex modifications outside the modelling environment
that often require implementation by IT staff.
Other modelling languages and enterprise modelling methodologies exist that can
be used to model KPIs, however many have a limited computational power and do
not allow one to define proper relationships between KPIs for advanced analysis
(Popova and Sharpanskykh 2010). In addition, there have been recent efforts in
industry to use strategy maps and measurable objectives to help with decision
making and process improvement (Silver 2010). However, the mutual influence of
KPIs on each other has not been discussed. More recently, and inspired by work on
GRL and KPIs, the Business Intelligence Model (BIM) proposed by Jiang et al.
(2011) also suggests KPI aggregation in goal models. However, BIM’s formal seman-
tics is mainly based on Description Logic (Horkoff et al. 2014), and hence semantics
and tools are currently unable to consider the impact of situations in models in a
quantitative way.
In order to address these issues, we introduce further extensions to GRL and a
novel evaluation algorithm that allow analysts and decision makers to define precise
mathematical formulae describing relationships between the model elements. This
method extends the bottom-up propagation algorithm defined in (Amyot et al. 2010).
Modellers and analysts gain full control of the model and can change the impact of
one element on another as desired.
Pourshahid et al. Decision Analytics 2014, 1:9 Page 14 of 36http://www.decisionanalyticsjournal.com/1/1/9
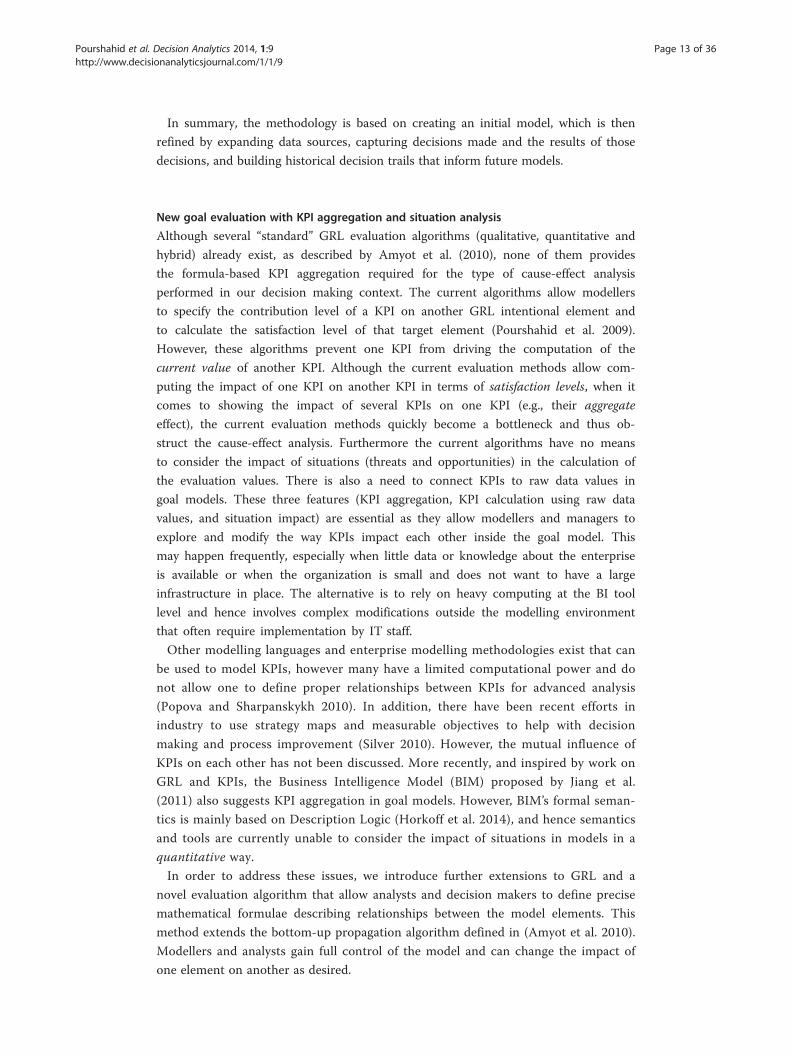
The algorithm uses current/evaluation values of the source KPIs as inputs for the
formula (described as metadata, see Figure 4) and calculates the target KPI evaluation
value using these inputs. Then, the satisfaction level of the KPI is calculated using the
KPI’s target/threshold/worst values as discussed previously. The impact of KPIs on
other types of intentional elements (e.g., goals, softgoals and tasks) is computed using
conventional GRL quantitative and qualitative algorithms. This unique combination
allows one to have both quantifiable KPIs and strategic-level softgoals that are hard to
quantify together in the same model and to show and monitor the impact of KPIs on
the goals of the organization.
Figure 4 shows a simple example where the current KPI values are displayed, with their
units, above the usual satisfaction values. Note that the inputs can be of different units;
the formula in the target KPI must take this into consideration. In this example, the
current value of Profit is computed as Revenue – Costs – Stolen*50 (the first two are in
dollars and the third is a number of items). Note also that the contributions have no
weight; the satisfaction of the Profit KPI is based on the normalization of its computed
current value ($39,000) against its specified target, threshold and worse values. We have
implemented this new formula-based algorithm in the jUCMNav tool.
Another benefit of this formula-based approach is the ability to account for
situations. In organizations, cause-effect analysis and decision making usually in-
volve an element of threat or opportunity that we capture as situations influencing
the business. Even though we can easily show situations as model elements in GRL
diagrams (e.g., using softgoals stereotyped with «Situation»), it is rather hard to
quantify the impact of situations on the value of a KPI and consider it in evalu-
ation algorithms.
It has been argued that integrating risks, threats, and opportunities into KPI frame-
works can contribute to effective management (Beasley et al. 2006; McWhorter et al.
2006; Wu and Olson 2009). We therefore propose such integration in GRL with a
new model element called situation (a stereotyped softgoal) with an evaluation value
between 0 and 100. This element allows us to easily model and evaluate threats and
opportunities in the models. The situation element can be connected to KPI nodes
using either positive or negative contributions. Table 3 discusses one potential
example of the expected impact on a target KPI. The method is not limited to this
example (where linear interpolation is used) and one can define any formula that is
suitable for their situation.
Profit
45(*)39,000$
Revenue
50(*)250,000$
Costs
-6(*)210,000$
Stolen items
-25(*)20 items
METADATA:Formula = Revenue – Costs – Stolen * 50
Figure 4 Formula-based KPI evaluation.
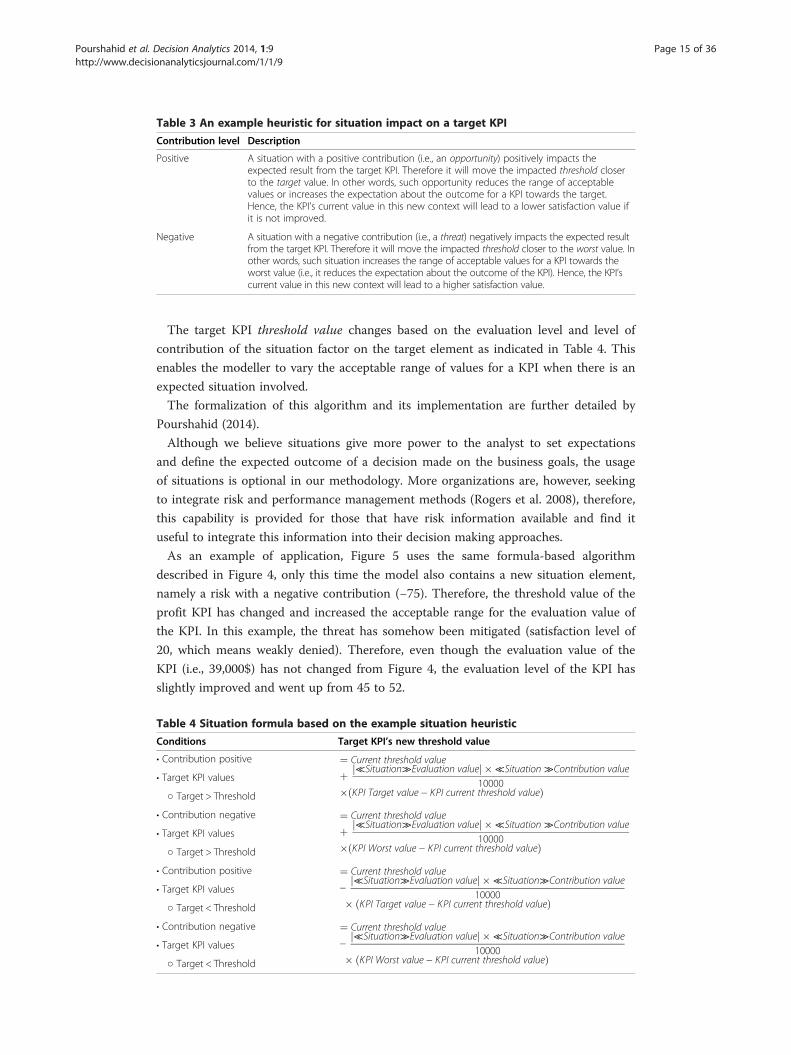
Table 3 An example heuristic for situation impact on a target KPI
Contribution level Description
Positive A situation with a positive contribution (i.e., an opportunity) positively impacts theexpected result from the target KPI. Therefore it will move the impacted threshold closerto the target value. In other words, such opportunity reduces the range of acceptablevalues or increases the expectation about the outcome for a KPI towards the target.Hence, the KPI’s current value in this new context will lead to a lower satisfaction value ifit is not improved.
Negative A situation with a negative contribution (i.e., a threat) negatively impacts the expected resultfrom the target KPI. Therefore it will move the impacted threshold closer to the worst value. Inother words, such situation increases the range of acceptable values for a KPI towards theworst value (i.e., it reduces the expectation about the outcome of the KPI). Hence, the KPI’scurrent value in this new context will lead to a higher satisfaction value.
Pourshahid et al. Decision Analytics 2014, 1:9 Page 15 of 36http://www.decisionanalyticsjournal.com/1/1/9
The target KPI threshold value changes based on the evaluation level and level of
contribution of the situation factor on the target element as indicated in Table 4. This
enables the modeller to vary the acceptable range of values for a KPI when there is an
expected situation involved.
The formalization of this algorithm and its implementation are further detailed by
Pourshahid (2014).
Although we believe situations give more power to the analyst to set expectations
and define the expected outcome of a decision made on the business goals, the usage
of situations is optional in our methodology. More organizations are, however, seeking
to integrate risk and performance management methods (Rogers et al. 2008), therefore,
this capability is provided for those that have risk information available and find it
useful to integrate this information into their decision making approaches.
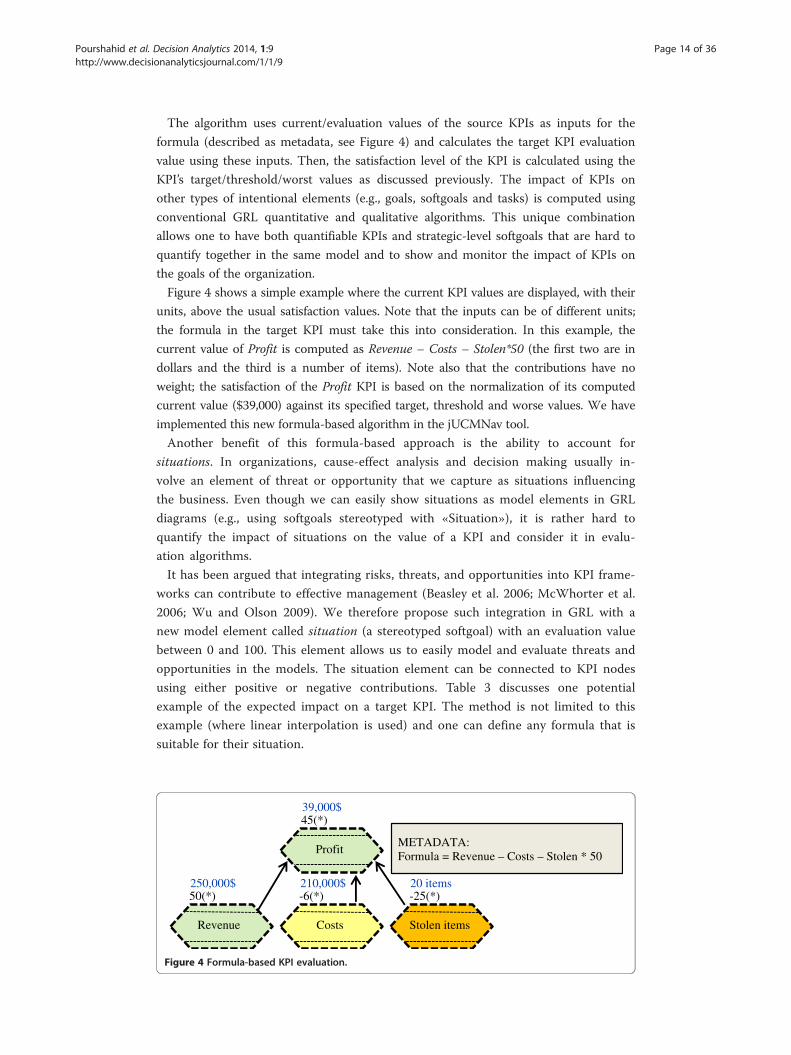
As an example of application, Figure 5 uses the same formula-based algorithm
described in Figure 4, only this time the model also contains a new situation element,
namely a risk with a negative contribution (−75). Therefore, the threshold value of the
profit KPI has changed and increased the acceptable range for the evaluation value of
the KPI. In this example, the threat has somehow been mitigated (satisfaction level of
20, which means weakly denied). Therefore, even though the evaluation value of the
KPI (i.e., 39,000$) has not changed from Figure 4, the evaluation level of the KPI has
slightly improved and went up from 45 to 52.
Table 4 Situation formula based on the example situation heuristic
Conditions Target KPI’s new threshold value
• Contribution positive ¼ Current threshold value
þ ≪Situation≫Evaluation valuej j �≪Situation≫Contribution value10000� KPI Target value − KPI current threshold valueð Þ
• Target KPI values
○ Target > Threshold
• Contribution negative ¼ Current threshold value
þ ≪Situation≫Evaluation valuej j �≪Situation≫Contribution value10000� KPI Worst value − KPI current threshold valueð Þ
• Target KPI values
○ Target > Threshold
• Contribution positive ¼ Current threshold value
−≪Situation≫Evaluation valuej j �≪Situation≫Contribution value
10000� KPI Target value − KPI current threshold valueð Þ
• Target KPI values
○ Target < Threshold
• Contribution negative ¼ Current threshold value
−≪Situation≫Evaluation valuej j �≪Situation≫Contribution value
10000� KPI Worst value − KPI current threshold valueð Þ• Target KPI values
○ Target < Threshold
Figure 5 Situation impact on KPI evaluation (with jUCMNav).
Pourshahid et al. Decision Analytics 2014, 1:9 Page 16 of 36http://www.decisionanalyticsjournal.com/1/1/9
Formalized algorithm
In this section, we discuss the formal definition of the formula-base algorithm. This
algorithm is based on the evaluation algorithm described in Appendix II of the URN
standard (ITU-T 2012). To set the context, the core part of the standard algorithm is
repeated here (Figures 6 and 7) before the extension points and modifications are
illustrated in later figures. The data types used correspond to elements of URN’s
metamodel.
The algorithm is a bottom-up forward propagation algorithm that uses the initial values
set in a GRL strategy to calculate the satisfaction level of the rest of the GRL elements in
the graph shows the forward propagation algorithm from the standard. In this algorithm,
totalSourceLink is total number of incoming source links to a node and linkReady is used
to track the number of links that have been used in the propagation so far.
ØØ
Ø
Figure 6 Forward propagation algorithm, standard version (ITU-T 2012).
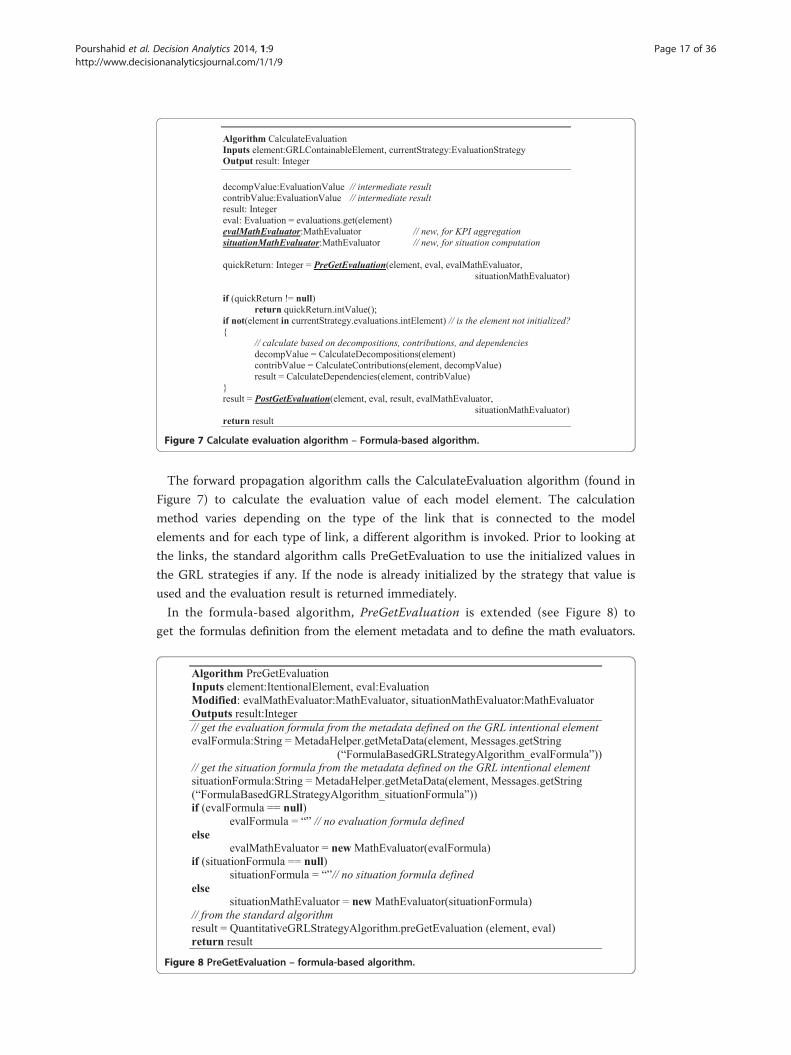
Figure 7 Calculate evaluation algorithm – Formula-based algorithm.
Pourshahid et al. Decision Analytics 2014, 1:9 Page 17 of 36http://www.decisionanalyticsjournal.com/1/1/9
The forward propagation algorithm calls the CalculateEvaluation algorithm (found in
Figure 7) to calculate the evaluation value of each model element. The calculation
method varies depending on the type of the link that is connected to the model
elements and for each type of link, a different algorithm is invoked. Prior to looking at
the links, the standard algorithm calls PreGetEvaluation to use the initialized values in
the GRL strategies if any. If the node is already initialized by the strategy that value is
used and the evaluation result is returned immediately.
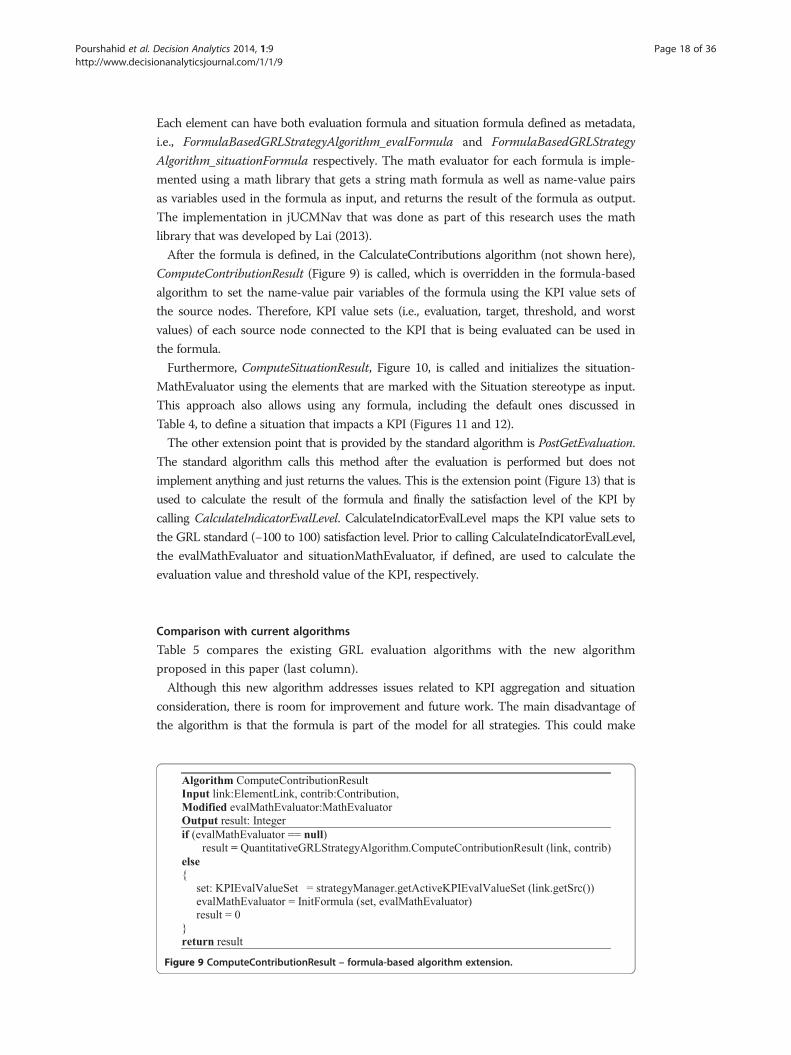
In the formula-based algorithm, PreGetEvaluation is extended (see Figure 8) to
get the formulas definition from the element metadata and to define the math evaluators.
Figure 8 PreGetEvaluation – formula-based algorithm.
Pourshahid et al. Decision Analytics 2014, 1:9 Page 18 of 36http://www.decisionanalyticsjournal.com/1/1/9
Each element can have both evaluation formula and situation formula defined as metadata,
i.e., FormulaBasedGRLStrategyAlgorithm_evalFormula and FormulaBasedGRLStrategy
Algorithm_situationFormula respectively. The math evaluator for each formula is imple-
mented using a math library that gets a string math formula as well as name-value pairs
as variables used in the formula as input, and returns the result of the formula as output.
The implementation in jUCMNav that was done as part of this research uses the math
library that was developed by Lai (2013).
After the formula is defined, in the CalculateContributions algorithm (not shown here),
ComputeContributionResult (Figure 9) is called, which is overridden in the formula-based
algorithm to set the name-value pair variables of the formula using the KPI value sets of
the source nodes. Therefore, KPI value sets (i.e., evaluation, target, threshold, and worst
values) of each source node connected to the KPI that is being evaluated can be used in
the formula.
Furthermore, ComputeSituationResult, Figure 10, is called and initializes the situation-
MathEvaluator using the elements that are marked with the Situation stereotype as input.
This approach also allows using any formula, including the default ones discussed in
Table 4, to define a situation that impacts a KPI (Figures 11 and 12).
The other extension point that is provided by the standard algorithm is PostGetEvaluation.
The standard algorithm calls this method after the evaluation is performed but does not
implement anything and just returns the values. This is the extension point (Figure 13) that is
used to calculate the result of the formula and finally the satisfaction level of the KPI by
calling CalculateIndicatorEvalLevel. CalculateIndicatorEvalLevel maps the KPI value sets to
the GRL standard (−100 to 100) satisfaction level. Prior to calling CalculateIndicatorEvalLevel,
the evalMathEvaluator and situationMathEvaluator, if defined, are used to calculate the
evaluation value and threshold value of the KPI, respectively.
Comparison with current algorithms
Table 5 compares the existing GRL evaluation algorithms with the new algorithm
proposed in this paper (last column).
Although this new algorithm addresses issues related to KPI aggregation and situation
consideration, there is room for improvement and future work. The main disadvantage of
the algorithm is that the formula is part of the model for all strategies. This could make
Figure 9 ComputeContributionResult – formula-based algorithm extension.
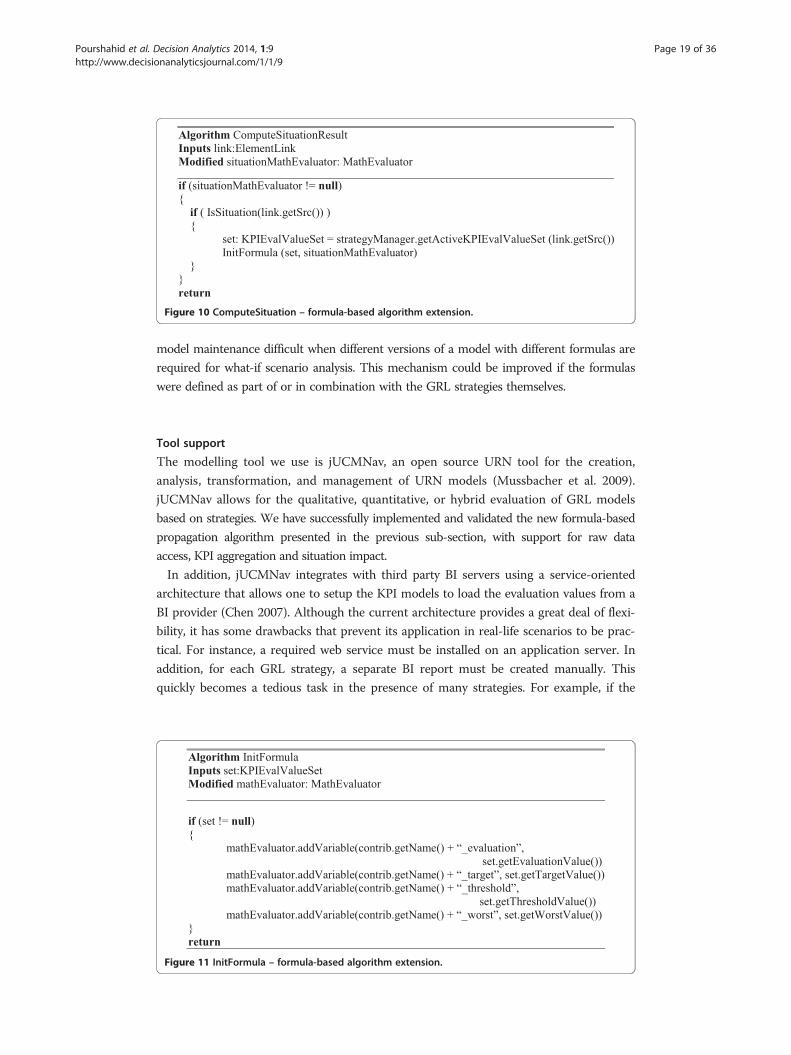
Figure 10 ComputeSituation – formula-based algorithm extension.
Pourshahid et al. Decision Analytics 2014, 1:9 Page 19 of 36http://www.decisionanalyticsjournal.com/1/1/9
model maintenance difficult when different versions of a model with different formulas are
required for what-if scenario analysis. This mechanism could be improved if the formulas
were defined as part of or in combination with the GRL strategies themselves.
Tool support
The modelling tool we use is jUCMNav, an open source URN tool for the creation,
analysis, transformation, and management of URN models (Mussbacher et al. 2009).
jUCMNav allows for the qualitative, quantitative, or hybrid evaluation of GRL models
based on strategies. We have successfully implemented and validated the new formula-based
propagation algorithm presented in the previous sub-section, with support for raw data
access, KPI aggregation and situation impact.
In addition, jUCMNav integrates with third party BI servers using a service-oriented
architecture that allows one to setup the KPI models to load the evaluation values from a
BI provider (Chen 2007). Although the current architecture provides a great deal of flexi-
bility, it has some drawbacks that prevent its application in real-life scenarios to be prac-
tical. For instance, a required web service must be installed on an application server. In
addition, for each GRL strategy, a separate BI report must be created manually. This
quickly becomes a tedious task in the presence of many strategies. For example, if the
Figure 11 InitFormula – formula-based algorithm extension.
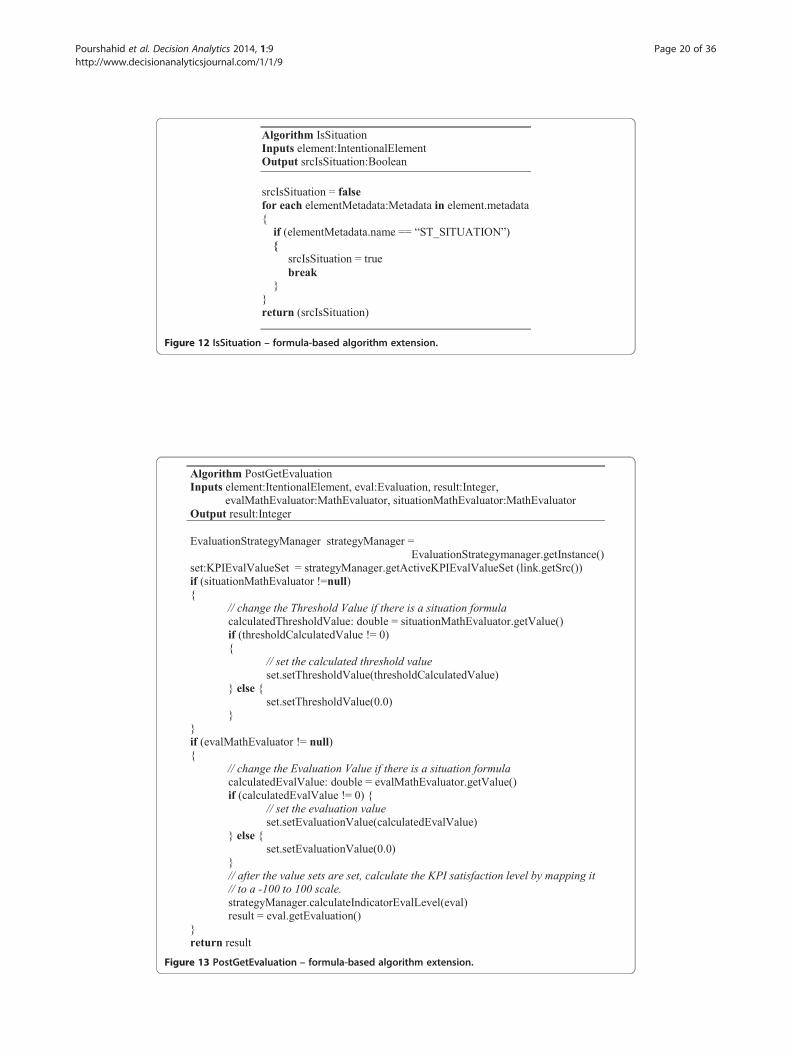
Figure 12 IsSituation – formula-based algorithm extension.
Figure 13 PostGetEvaluation – formula-based algorithm extension.
Pourshahid et al. Decision Analytics 2014, 1:9 Page 20 of 36http://www.decisionanalyticsjournal.com/1/1/9
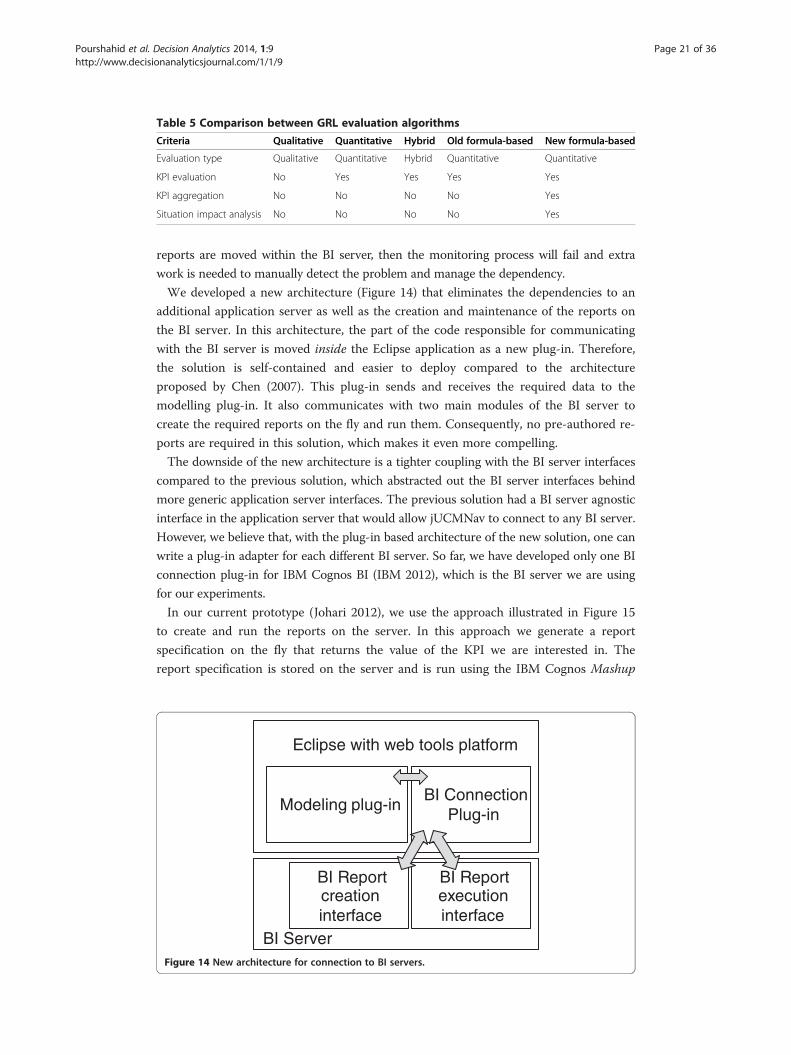
Table 5 Comparison between GRL evaluation algorithms
Criteria Qualitative Quantitative Hybrid Old formula-based New formula-based
Evaluation type Qualitative Quantitative Hybrid Quantitative Quantitative
KPI evaluation No Yes Yes Yes Yes
KPI aggregation No No No No Yes
Situation impact analysis No No No No Yes
Pourshahid et al. Decision Analytics 2014, 1:9 Page 21 of 36http://www.decisionanalyticsjournal.com/1/1/9
reports are moved within the BI server, then the monitoring process will fail and extra
work is needed to manually detect the problem and manage the dependency.
We developed a new architecture (Figure 14) that eliminates the dependencies to an
additional application server as well as the creation and maintenance of the reports on
the BI server. In this architecture, the part of the code responsible for communicating
with the BI server is moved inside the Eclipse application as a new plug-in. Therefore,
the solution is self-contained and easier to deploy compared to the architecture
proposed by Chen (2007). This plug-in sends and receives the required data to the
modelling plug-in. It also communicates with two main modules of the BI server to
create the required reports on the fly and run them. Consequently, no pre-authored re-
ports are required in this solution, which makes it even more compelling.
The downside of the new architecture is a tighter coupling with the BI server interfaces
compared to the previous solution, which abstracted out the BI server interfaces behind
more generic application server interfaces. The previous solution had a BI server agnostic
interface in the application server that would allow jUCMNav to connect to any BI server.
However, we believe that, with the plug-in based architecture of the new solution, one can
write a plug-in adapter for each different BI server. So far, we have developed only one BI
connection plug-in for IBM Cognos BI (IBM 2012), which is the BI server we are using
for our experiments.
In our current prototype (Johari 2012), we use the approach illustrated in Figure 15
to create and run the reports on the server. In this approach we generate a report
specification on the fly that returns the value of the KPI we are interested in. The
report specification is stored on the server and is run using the IBM Cognos Mashup
Modeling plug-inBI Connection
Plug-in
Eclipse with web tools platform
BI Server
BI Report executioninterface
BI Report creation interface
Figure 14 New architecture for connection to BI servers.
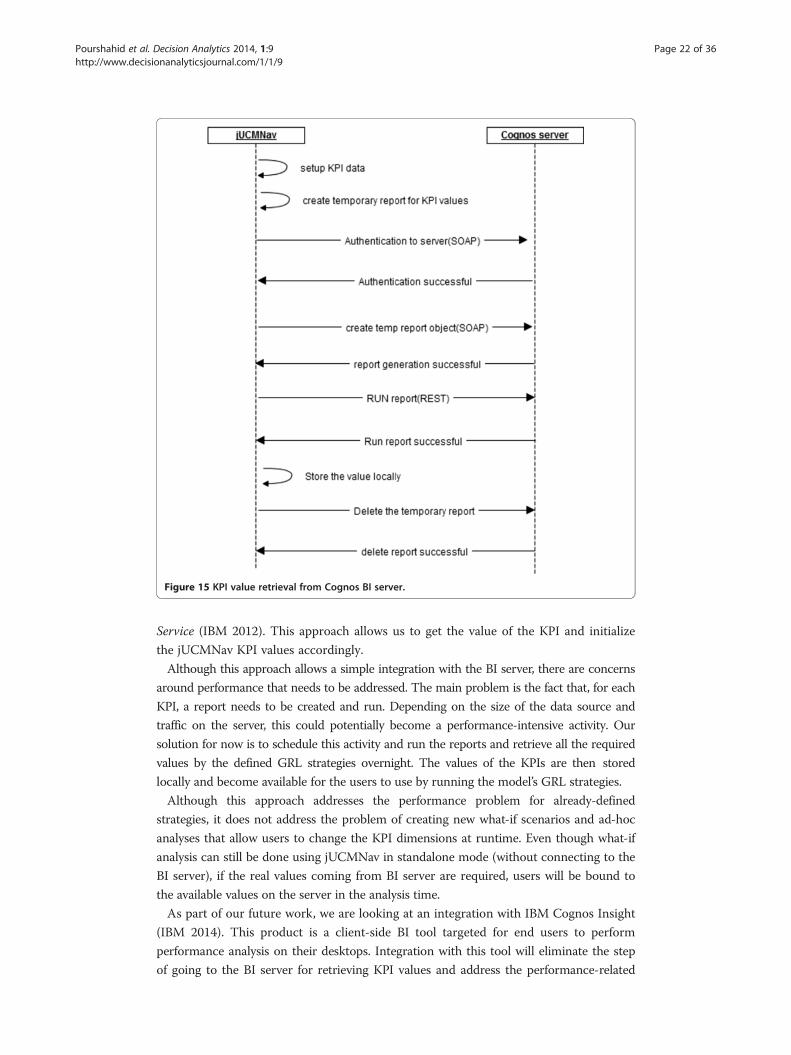
Figure 15 KPI value retrieval from Cognos BI server.
Pourshahid et al. Decision Analytics 2014, 1:9 Page 22 of 36http://www.decisionanalyticsjournal.com/1/1/9
Service (IBM 2012). This approach allows us to get the value of the KPI and initialize
the jUCMNav KPI values accordingly.
Although this approach allows a simple integration with the BI server, there are concerns
around performance that needs to be addressed. The main problem is the fact that, for each
KPI, a report needs to be created and run. Depending on the size of the data source and
traffic on the server, this could potentially become a performance-intensive activity. Our
solution for now is to schedule this activity and run the reports and retrieve all the required
values by the defined GRL strategies overnight. The values of the KPIs are then stored
locally and become available for the users to use by running the model’s GRL strategies.
Although this approach addresses the performance problem for already-defined
strategies, it does not address the problem of creating new what-if scenarios and ad-hoc
analyses that allow users to change the KPI dimensions at runtime. Even though what-if
analysis can still be done using jUCMNav in standalone mode (without connecting to the
BI server), if the real values coming from BI server are required, users will be bound to
the available values on the server in the analysis time.
As part of our future work, we are looking at an integration with IBM Cognos Insight
(IBM 2014). This product is a client-side BI tool targeted for end users to perform
performance analysis on their desktops. Integration with this tool will eliminate the step
of going to the BI server for retrieving KPI values and address the performance-related
Pourshahid et al. Decision Analytics 2014, 1:9 Page 23 of 36http://www.decisionanalyticsjournal.com/1/1/9
issues. Furthermore, since IBM Cognos Insight has write-back capabilities and allows end
users to enter their own data to perform what-if analysis by creating a local data source, it
represents a good match for our methodology and integration with our KPI and goal
models. This will enable users to change the values of the KPIs at runtime efficiently and
see the results in the goal models without being dependent on a database administrator to
update the data sources.
Roles and responsibilities in an organization
Although the iterative and incremental nature of the framework allows organizations at any
size/maturity to start using it, depending on the size of the organization and level of invest-
ment, not all aspects of the framework may be readily achievable. The complexity of some as-
pects of the framework requires specialized skills that not all users in an organization have,
and the intention of the framework is also not to expose everyone to the same level of detail
and complexity.
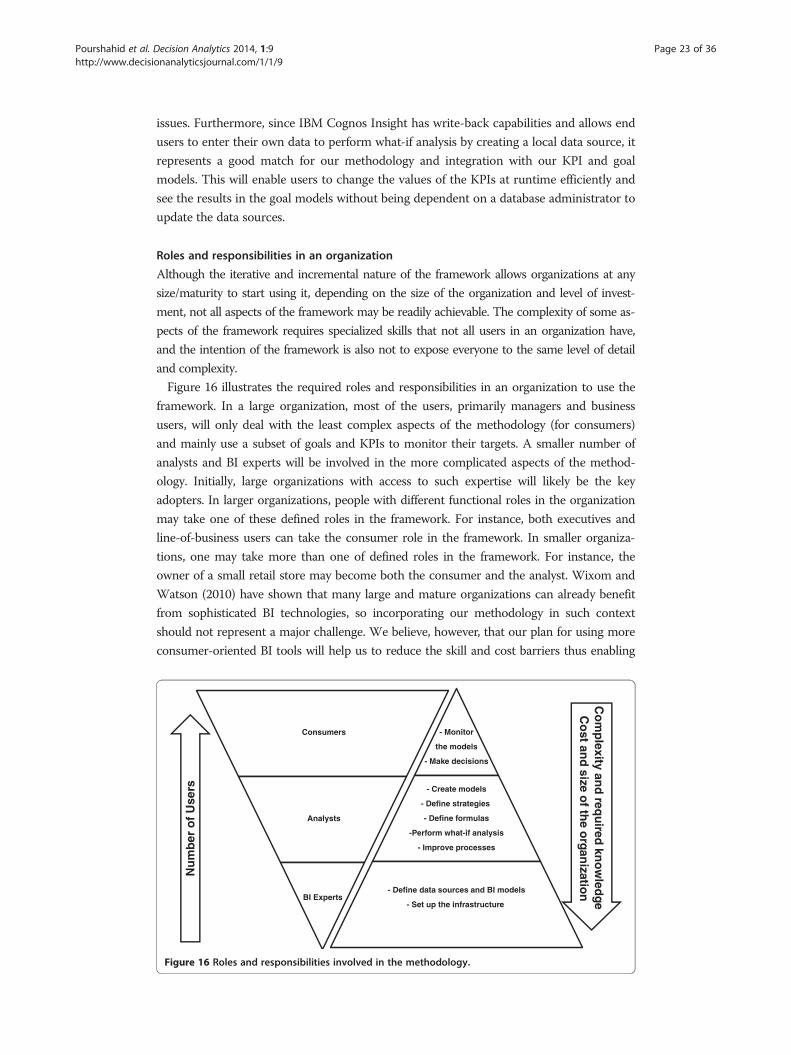
Figure 16 illustrates the required roles and responsibilities in an organization to use the
framework. In a large organization, most of the users, primarily managers and business
users, will only deal with the least complex aspects of the methodology (for consumers)
and mainly use a subset of goals and KPIs to monitor their targets. A smaller number of
analysts and BI experts will be involved in the more complicated aspects of the method-
ology. Initially, large organizations with access to such expertise will likely be the key
adopters. In larger organizations, people with different functional roles in the organization
may take one of these defined roles in the framework. For instance, both executives and
line-of-business users can take the consumer role in the framework. In smaller organiza-
tions, one may take more than one of defined roles in the framework. For instance, the
owner of a small retail store may become both the consumer and the analyst. Wixom and
Watson (2010) have shown that many large and mature organizations can already benefit
from sophisticated BI technologies, so incorporating our methodology in such context
should not represent a major challenge. We believe, however, that our plan for using more
consumer-oriented BI tools will help us to reduce the skill and cost barriers thus enabling
Consumers
Analysts
BI Experts
- Monitor
the models
- Make decisions
- Create models
- Define strategies
- Define formulas
-Perform what-if analysis
- Improve processes
- Define data sources and BI models
- Set up the infrastructure
Nu
mb
er o
f U
sers
Co
mp
lexity and
requ
ired kn
ow
ledge
Co
st and
size of th
e organ
ization
Figure 16 Roles and responsibilities involved in the methodology.
Pourshahid et al. Decision Analytics 2014, 1:9 Page 24 of 36http://www.decisionanalyticsjournal.com/1/1/9
smaller organizations, and especially middle-level managers, to fully utilize all aspects of
the methodology.
Results and discussionExample of methodology application
In this example, we describe an application of the methodology in a Canada-based retail
business. The particular retail business studied here is a small enterprise (with revenues less
than $50 million) with four local stores. The business has existed for over 15 years,
establishing a strong foothold in one neighborhood, and is now planning to expand
nationally. Three years prior to the study, the business was purchased by new owners who
set national growth as a key strategic objective. As part of the expansion plans, market and
competitive studies were conducted. In addition, the owners had created a scorecard that
tracked key operational indicators and provided the ability to conduct an assessment of
business results. Some data however, for example, the flow of customers through each of the
locations, was not yet available in the scorecard.
At the time of the study, most revenues were earned through consignment sales. The busi-
ness had started selling new items as well and was planning to invest in an online business.
Revenue was driven by ensuring that stock was properly displayed, which in turn depended
on assuring that enough staff were available to sort, tag, and lay out the products. The supply
side of the business depended on the number of consigners available, the amount of product
they brought to each store, and the speed at which these products could be displayed. The
demand side depended on local advertising and word of mouth that stimulated traffic
flow. All stores were situated in prominent locations with good visibility that stimulated
walk-in traffic.
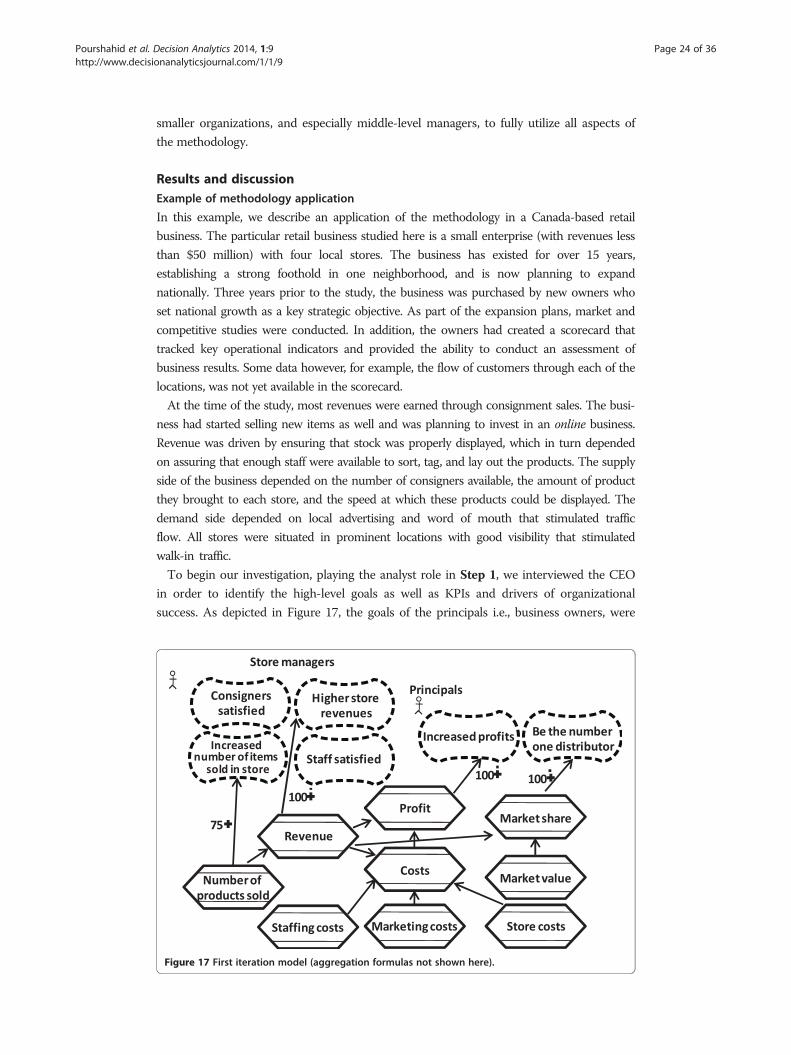
To begin our investigation, playing the analyst role in Step 1, we interviewed the CEO
in order to identify the high-level goals as well as KPIs and drivers of organizational
success. As depicted in Figure 17, the goals of the principals i.e., business owners, were
Figure 17 First iteration model (aggregation formulas not shown here).
Product category
Product type
Profit Revenue Staffing costs Number of
products sold
DateLocation
Figure 18 First iteration dimensions.
Pourshahid et al. Decision Analytics 2014, 1:9 Page 25 of 36http://www.decisionanalyticsjournal.com/1/1/9
related to market growth: they wanted to be the number one distributor within their
geographical market. Store managers were aware of the growth objective, but on the short
term, they focused on increasing revenues and the number of items sold in their stores.
As discussed above, the first iteration of the model provides an initial alignment of
higher-level goals and KPIs. We started with a minimal decision model and limited set of
data just to illustrate the business goals and financial targets and to identify the indicators
and driver KPIs required to monitor the business and to make informed business deci-
sions. Figure 17 illustrates the first iteration of the model. At this stage, we also developed
a rough dimensional model (Figure 18) in order to ensure that the data needed for the
decision model would be available. The dimensional model helps the store to analyze the
impact of the KPIs on goals based on their different store locations, in each period of
time, by product type (e.g., clothing, electronics, etc.), and by product category (i.e., retail
and consignment).
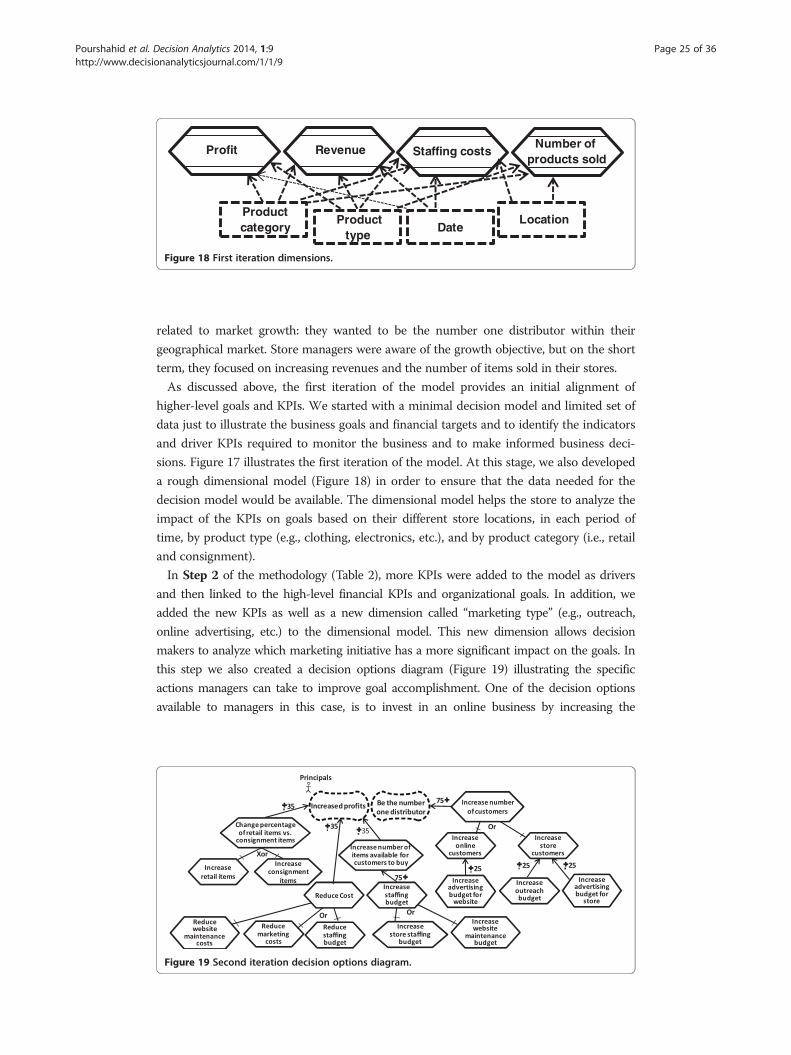
In Step 2 of the methodology (Table 2), more KPIs were added to the model as drivers
and then linked to the high-level financial KPIs and organizational goals. In addition, we
added the new KPIs as well as a new dimension called “marketing type” (e.g., outreach,
online advertising, etc.) to the dimensional model. This new dimension allows decision
makers to analyze which marketing initiative has a more significant impact on the goals. In
this step we also created a decision options diagram (Figure 19) illustrating the specific
actions managers can take to improve goal accomplishment. One of the decision options
available to managers in this case, is to invest in an online business by increasing the
Figure 19 Second iteration decision options diagram.
Pourshahid et al. Decision Analytics 2014, 1:9 Page 26 of 36http://www.decisionanalyticsjournal.com/1/1/9
advertising budget for the website and increasing the website maintenance budget. We
consider this option as the decision made by managers and update the models while
transitioning to Step 3.
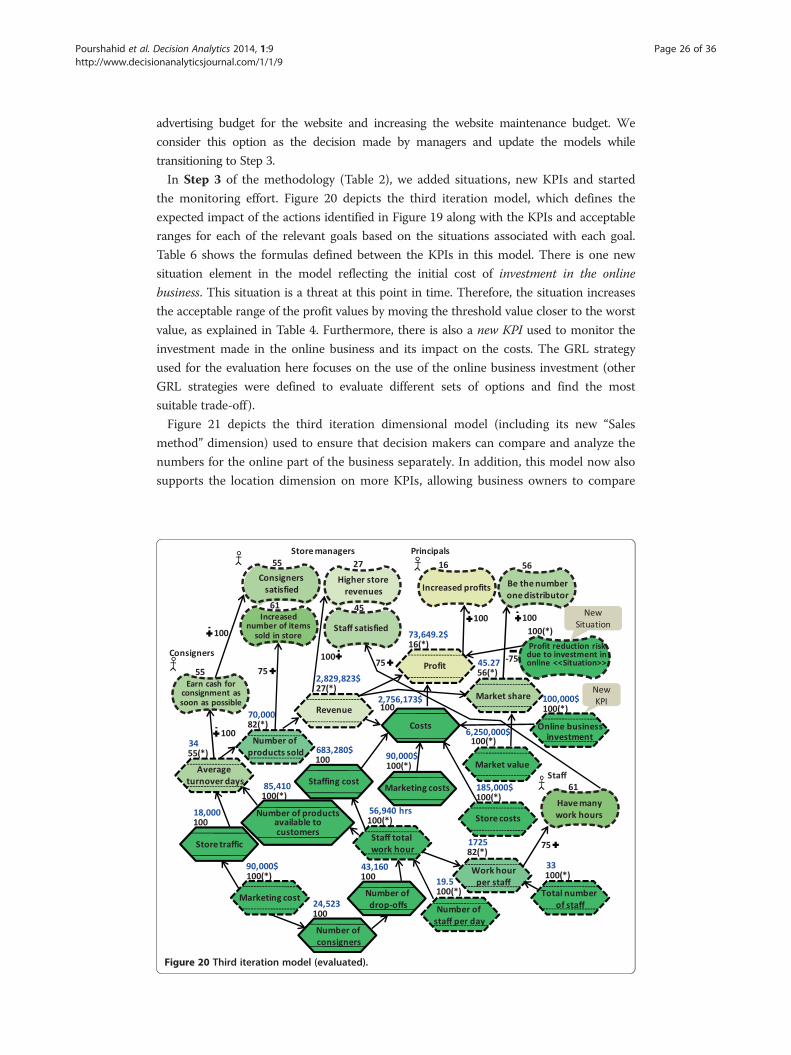
In Step 3 of the methodology (Table 2), we added situations, new KPIs and started
the monitoring effort. Figure 20 depicts the third iteration model, which defines the
expected impact of the actions identified in Figure 19 along with the KPIs and acceptable
ranges for each of the relevant goals based on the situations associated with each goal.
Table 6 shows the formulas defined between the KPIs in this model. There is one new
situation element in the model reflecting the initial cost of investment in the online
business. This situation is a threat at this point in time. Therefore, the situation increases
the acceptable range of the profit values by moving the threshold value closer to the worst
value, as explained in Table 4. Furthermore, there is also a new KPI used to monitor the
investment made in the online business and its impact on the costs. The GRL strategy
used for the evaluation here focuses on the use of the online business investment (other
GRL strategies were defined to evaluate different sets of options and find the most
suitable trade-off).
Figure 21 depicts the third iteration dimensional model (including its new “Sales
method” dimension) used to ensure that decision makers can compare and analyze the
numbers for the online part of the business separately. In addition, this model now also
supports the location dimension on more KPIs, allowing business owners to compare
Figure 20 Third iteration model (evaluated).
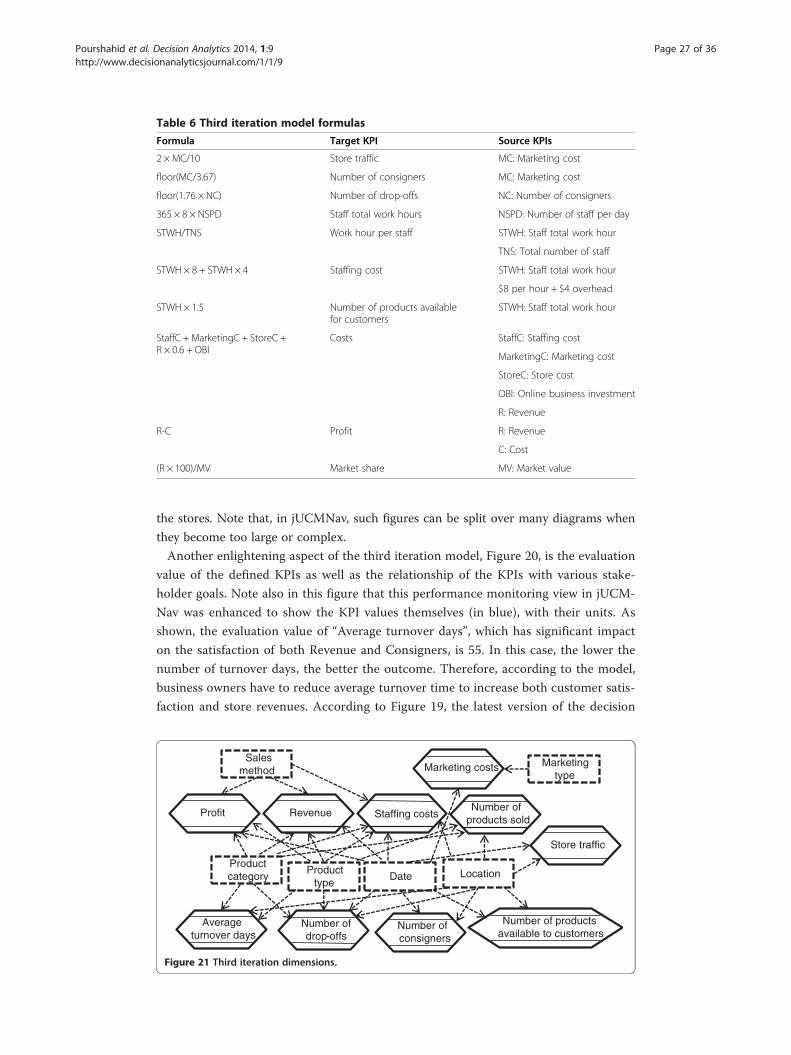
Table 6 Third iteration model formulas
Formula Target KPI Source KPIs
2 × MC/10 Store traffic MC: Marketing cost
floor(MC/3.67) Number of consigners MC: Marketing cost
floor(1.76 × NC) Number of drop-offs NC: Number of consigners
365 × 8 × NSPD Staff total work hours NSPD: Number of staff per day
STWH/TNS Work hour per staff STWH: Staff total work hour
TNS: Total number of staff
STWH × 8 + STWH × 4 Staffing cost STWH: Staff total work hour
$8 per hour + $4 overhead
STWH × 1.5 Number of products availablefor customers
STWH: Staff total work hour
StaffC + MarketingC + StoreC +R × 0.6 + OBI
Costs StaffC: Staffing cost
MarketingC: Marketing cost
StoreC: Store cost
OBI: Online business investment
R: Revenue
R-C Profit R: Revenue
C: Cost
(R × 100)/MV Market share MV: Market value
Pourshahid et al. Decision Analytics 2014, 1:9 Page 27 of 36http://www.decisionanalyticsjournal.com/1/1/9
the stores. Note that, in jUCMNav, such figures can be split over many diagrams when
they become too large or complex.
Another enlightening aspect of the third iteration model, Figure 20, is the evaluation
value of the defined KPIs as well as the relationship of the KPIs with various stake-
holder goals. Note also in this figure that this performance monitoring view in jUCM-
Nav was enhanced to show the KPI values themselves (in blue), with their units. As
shown, the evaluation value of “Average turnover days”, which has significant impact
on the satisfaction of both Revenue and Consigners, is 55. In this case, the lower the
number of turnover days, the better the outcome. Therefore, according to the model,
business owners have to reduce average turnover time to increase both customer satis-
faction and store revenues. According to Figure 19, the latest version of the decision
Product category
Product type
Profit Revenue Staffing costsNumber of
products sold
Date Location
Marketing costs
Number of productsavailable to customers
Number of consigners
Number of drop-offs
Average turnover days
Store traffic
Marketing type
Sales method
Figure 21 Third iteration dimensions.
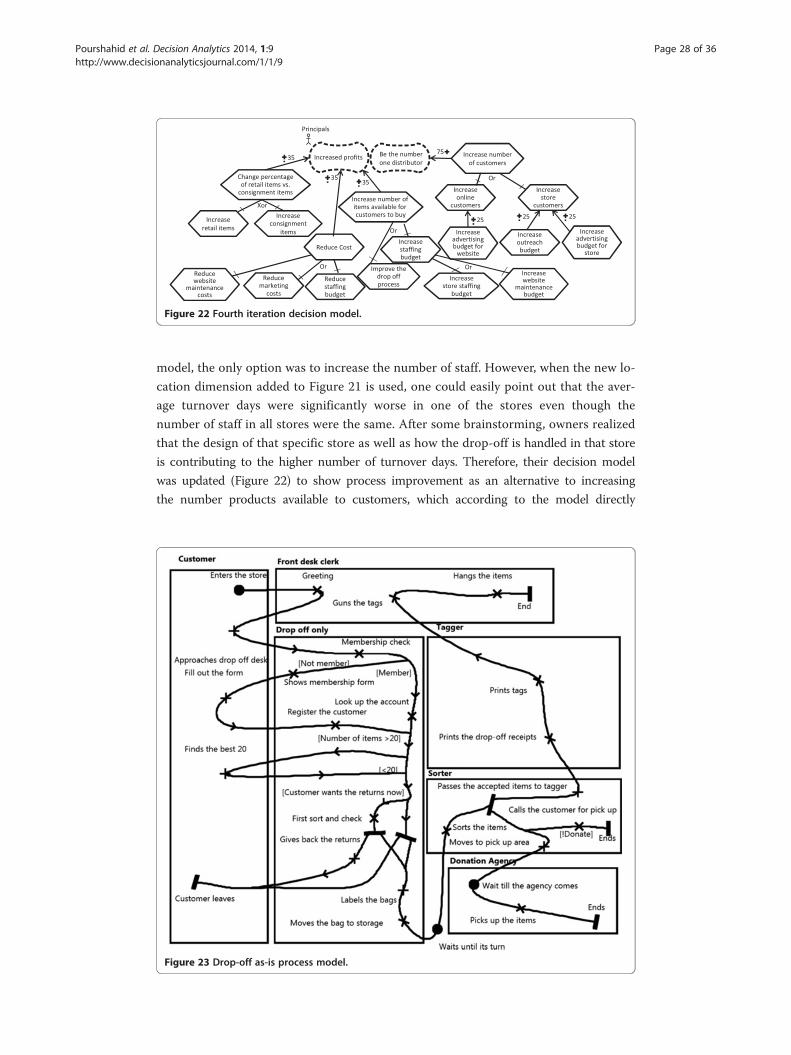
Figure 22 Fourth iteration decision model.
Pourshahid et al. Decision Analytics 2014, 1:9 Page 28 of 36http://www.decisionanalyticsjournal.com/1/1/9
model, the only option was to increase the number of staff. However, when the new lo-
cation dimension added to Figure 21 is used, one could easily point out that the aver-
age turnover days were significantly worse in one of the stores even though the
number of staff in all stores were the same. After some brainstorming, owners realized
that the design of that specific store as well as how the drop-off is handled in that store
is contributing to the higher number of turnover days. Therefore, their decision model
was updated (Figure 22) to show process improvement as an alternative to increasing
the number products available to customers, which according to the model directly
Figure 23 Drop-off as-is process model.
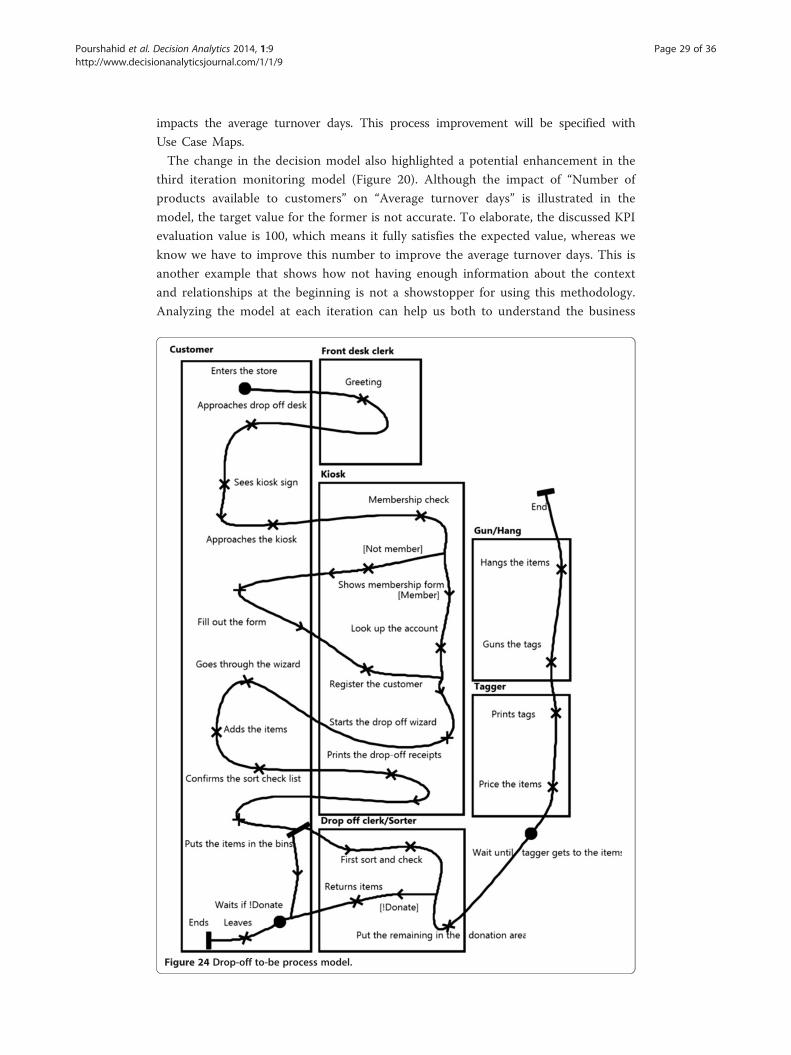
Pourshahid et al. Decision Analytics 2014, 1:9 Page 29 of 36http://www.decisionanalyticsjournal.com/1/1/9
impacts the average turnover days. This process improvement will be specified with
Use Case Maps.
The change in the decision model also highlighted a potential enhancement in the
third iteration monitoring model (Figure 20). Although the impact of “Number of
products available to customers” on “Average turnover days” is illustrated in the
model, the target value for the former is not accurate. To elaborate, the discussed KPI
evaluation value is 100, which means it fully satisfies the expected value, whereas we
know we have to improve this number to improve the average turnover days. This is
another example that shows how not having enough information about the context
and relationships at the beginning is not a showstopper for using this methodology.
Analyzing the model at each iteration can help us both to understand the business
Figure 24 Drop-off to-be process model.
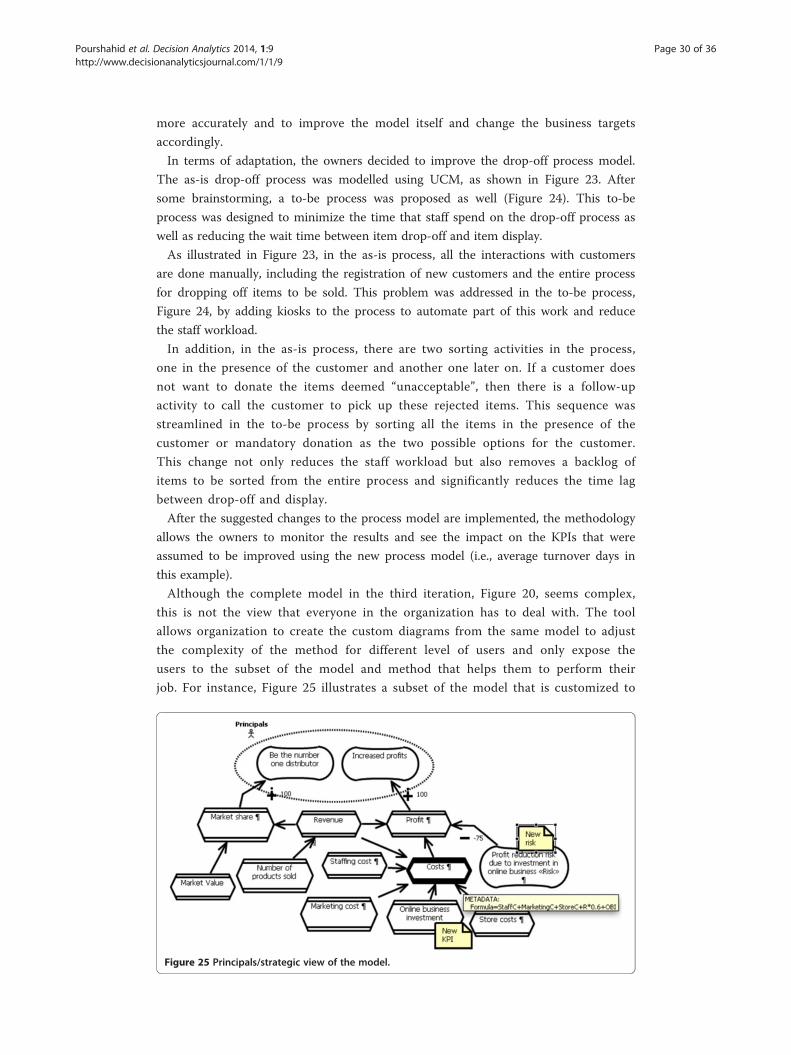
Pourshahid et al. Decision Analytics 2014, 1:9 Page 30 of 36http://www.decisionanalyticsjournal.com/1/1/9
more accurately and to improve the model itself and change the business targets
accordingly.
In terms of adaptation, the owners decided to improve the drop-off process model.
The as-is drop-off process was modelled using UCM, as shown in Figure 23. After
some brainstorming, a to-be process was proposed as well (Figure 24). This to-be
process was designed to minimize the time that staff spend on the drop-off process as
well as reducing the wait time between item drop-off and item display.
As illustrated in Figure 23, in the as-is process, all the interactions with customers
are done manually, including the registration of new customers and the entire process
for dropping off items to be sold. This problem was addressed in the to-be process,
Figure 24, by adding kiosks to the process to automate part of this work and reduce
the staff workload.
In addition, in the as-is process, there are two sorting activities in the process,
one in the presence of the customer and another one later on. If a customer does
not want to donate the items deemed “unacceptable”, then there is a follow-up
activity to call the customer to pick up these rejected items. This sequence was
streamlined in the to-be process by sorting all the items in the presence of the
customer or mandatory donation as the two possible options for the customer.
This change not only reduces the staff workload but also removes a backlog of
items to be sorted from the entire process and significantly reduces the time lag
between drop-off and display.
After the suggested changes to the process model are implemented, the methodology
allows the owners to monitor the results and see the impact on the KPIs that were
assumed to be improved using the new process model (i.e., average turnover days in
this example).
Although the complete model in the third iteration, Figure 20, seems complex,
this is not the view that everyone in the organization has to deal with. The tool
allows organization to create the custom diagrams from the same model to adjust
the complexity of the method for different level of users and only expose the
users to the subset of the model and method that helps them to perform their
job. For instance, Figure 25 illustrates a subset of the model that is customized to
Figure 25 Principals/strategic view of the model.

Pourshahid et al. Decision Analytics 2014, 1:9 Page 31 of 36http://www.decisionanalyticsjournal.com/1/1/9
show only the elements that business principals would be interested in. This
strategic view only has the very high level goals of the organization and the related
high-level KPIs and does not include any operational goals that normally store
managers would be interested in.
Lessons learned
The development of our methodology and its application to the real world retail business
led to several lessons learned. From a business management perspective, we observe the
following:
� Modelling goals and defining drivers and KPIs (i.e., creating the cause-effect decision
model) not only helps to document the known aspects of the business but also helps
to clarify unknown factors that might be driving goal accomplishment. Validation of
the model through interviews with decision makers ensures that data and KPIs included
are indeed relevant to the business. This can have a great impact especially for small
businesses where initial goals might not have been clear.
� Even though modelling the indicators helps define the required information
and the relationships between variables, we are still unsure about where to
draw the line regarding the data we need to show in the model versus the
data maintained in source systems (e.g., databases or BI reports). We still
need to explore how to find the appropriate balance so we do not omit
important information in the model for decision making while preventing
the inclusion of too much data which can complicate the decision-making
environment.
We believe however that getting feedback on the right balance is facilitated by
the use of graphical goal models with rapid evaluation feedback as provided by
GRL strategies, which provide more insight into cause-effect relationships than
do conventional BI reports. Note however that the goal-oriented view introduced
here is complementary to what is currently found in BI tools, not a substitute.
� Defining relationships between the model elements without historical data is
difficult. In some cases, managers themselves are not aware of the linkages
because they have not had the historical data available to create cause-effect
models. In this case, we first create the models using industry standards or
“educated guesses”
and then use the different iterations of the methodology steps to improve the
cause-effect decision model.
� The ability to adjust the range of acceptable values for a KPI is useful for
registering risk. For example, one might establish a wide range of acceptable
values for an objective that carries a high level of risk, such as expected sales
for a new product. On the other hand, objectives with lower profiles, such as
sales of well-established products, might have a narrower range of acceptable
values.
� The ability to have a cohesive notation and modelling environment that allow
one to model the organization goals, KPIs, decision, situations, and processes,
together with simple integration of the models with BI tools, can help with
the introduction and adaptation of the suggested approach.

Pourshahid et al. Decision Analytics 2014, 1:9 Page 32 of 36http://www.decisionanalyticsjournal.com/1/1/9
From a technical point of view, we have learned that:
� Our new extensions to GRL and the new formula-based algorithm provide a
great deal of flexibility for model evaluation, especially as they are combined
with standard goal satisfaction evaluation, hence offering the best of both worlds.
However our new algorithm still has room for improvement, especially when it
comes to using other intentional elements (e.g., goals) as contributors to KPIs.
We have had limited experience with this idea by considering situations as an
input to KPIs, but this type of modelling may be useful in other circumstances
that require further investigation. In addition, recent results on the use of
constraint-based programming for solving the satisfaction problem in GRL
models (Luo and Amyot 2011) has the potential to allow optimizations to be
computer and answers to be provided to questions such as “if I want to reach
this KPI satisfaction level or current value, tell me what should be done in
sub-KPIs given all the constraints present in the goal model”.
� Creating different versions of a model in different iterations and keeping them
consistent for comparison purposes can be painful with current tool support.
Saving separate files for each version of the model quickly becomes a maintenance
issue that requires a better technical solution. Very recent additions to jUCMNav
(Amyot et al. 2013) however provide potentially useful features in this context,
including: URN model comparisons, strategy evaluation differences, contribution
overrides, as well as export of strategy results (e.g., for historical data) and import
of strategy definitions as Comma-Separated Value (CSV) files.
ConclusionsThere are critical issues related to the use of conventional Business Intelligence
technology for decision making. Data support is an important contribution of BI, but
data presented without a proper context can require more effort from decision makers
and does not necessarily enable decision support. This represents a challenge that will
become even more important in the future given that organizations are nowadays
gathering terabytes of information.
In this research, we have provided several contributions toward a goal-oriented business
intelligence-supported decision methodology, where we integrate in a novel way goal
models, decision models, situations, and processes together with analytic capabilities. By
integrating the decision model into the BI system, we attempt to integrate model-based
decision support into a BI system thus improving the decision-making process. To do so,
we extended a standard goal-oriented language, GRL, to better display relationships be-
tween Key Performance Indicators and objectives and processes, to enable formula-based
evaluations of goal models involving KPI aggregation, and to integrate situations through
the notion of acceptable ranges for KPIs. These extensions enable the combination of
quantifiable KPIs with strategic-level softgoals in the same model, which in turn allows
analysts to assess and monitor the impact of KPIs based on existing values and to
explore what-if scenarios through GRL strategies.
We also proposed an enhancement to the integration architecture of the existing open
source URN tool, jUCMNav. This new architecture addresses two major issues of the
Pourshahid et al. Decision Analytics 2014, 1:9 Page 33 of 36http://www.decisionanalyticsjournal.com/1/1/9
existing integration approach, which were considered main impediments for adaptation of
the integration between jUCMNav and BI tools: dependency on an external web service
and application server, as well as BI reports created, hosted, and manually maintained on
the BI server.
From an implementation perspective, we also introduced a methodology lifecycle
with iterative steps that support the construction of goal models (including KPIs and
dimensions) even in situations where little information is available. Such models can be
refined as more knowledge is gained about the organization and its context. Models
can also be compared (as historical data) to validate newer models. This feature allows
for assessment of the impact of past business decisions creating an ongoing system of
record that permits continual adaptation. Our retail business example helped illustrate
the methodology in a real context, and the results of our study suggest the feasibility of
the approach, especially for middle-level managers. Other applications of parts of the
methodology to information access in a large hospital (Pourshahid 2014) and to adaptive
enterprise architectures in a government’s department (Akhigbe 2014; Akhigbe et al.
2014) also support this conclusion. We also believe that such a graphical, goal-oriented
approach, which delivers data values used to make decisions in context, supports the
comprehension of important cause-effect relationships in a way that could complement
existing current BI technologies, which often lack an appropriate goal view.
The methodology is still evolving, and limitations and potential work items have been
identified in our lessons learned. In particular, major future work items include:
� Study of the usability of the methodology from several viewpoints, including the
effort required by the iterative modelling before analysis can be done, the
continuous evolution of the models, what to put in the URN model and what to
leave in conventional BI systems, the usefulness of the analysis results in helping
decision making, and appropriate tool support (including integration with BI
systems other than IBM Cognos).
� Further validation of the methodology by applying it to other real organizations
and measuring its usefulness in organizations of different domains, sizes, and levels
of maturity.
� Improvements to the maintainability of models with formulas, and of evolving
models.
� Improvements to the performance of the current integration with IBM Cognos BI
by exploiting the facilities provided by IBM Cognos Insight.
Still, as it stands today, this methodology brings new contributions and good value to
the BI table, and we believe it has a promising future.
AbbreviationsBI: Business intelligence; BIM: Business intelligence model; DW: Data warehouse; GDI: Goal-decision-information;GRL: Goal-oriented requirement language; ITU-T: International Telecommunication Union - Telecommunicationstandardization sector; KPI: Key performance indicator; MIS: Management information systems; SWOT: Strengths,weaknesses, opportunities, and threats; UCM: Use case map; URN: User requirements notation.
Competing interestsOkhaide Akhigbe was funded by the Business Intelligence Network (BIN), a strategic network of the National Scienceand Engineering Research Council of Canada. Greg Richards and Daniel Amyot were co-investigators in this project.BIN received funding from several companies, including IBM Canada. Greg Richards is the director of the IBM Centerfor Business Analytics and Performance at the University of Ottawa, also funded by IBM Canada. Alireza Pourshahid

Pourshahid et al. Decision Analytics 2014, 1:9 Page 34 of 36http://www.decisionanalyticsjournal.com/1/1/9
and Iman Johari are both employees of the Business Analytics division of IBM Canada. As the IBM Cognos BI tool(provided to the researchers by IBM Canada through its educational program) was used in our methodology, it couldbe perceived that IBM Canada may benefit from the publication of this manuscript. However, the research results areindependent from specific BI tools.Other than the above, the authors declare that they have no competing interests.
Authors’ contributionsAP defined the overall methodology and the algorithms supporting indicator relationships, with assistance from DAand GR. AP led development and modeling of the illustrative case study, with assistance from GR and DA. IJ providedthe integration with IBM Cognos BI, with the assistance of GR and DA. All authors contributed to the literature review,helped to draft the manuscript, and approved the final version. OA led its finalization.
Authors’ informationAlireza Pourshahid received his M.Sc. degree in E-Business Technologies and his Ph.D. in Computer Science from theUniversity of Ottawa in 2008 and 2014 respectively. He is Software Development Manager and Product Owner at IBM.His main research interests are business process and performance management, business analytics, data visualization,process modeling, trust modeling, and software development methodologies. During his masters, Alireza developedthe foundation of a Process Monitoring Framework and Methodology based on the User Requirement Notation (URN)and business intelligence. He extended this framework during his Ph.D. studies to support business processimprovement, through the use of aspect-oriented modeling and redesign patterns.Gregory Richards is Professor of Performance Management at the Telfer School of Management and Director of theIBM Centre for Business Analytics and Performance. He is also the Director of the MBA program at the same school.He has a Ph.D. from Carleton University and an MBA and a MA from the University of Ottawa. Prior to his academicappointment, Gregory worked at Transport Canada and at Consulting and Audit Canada as well as with CognosIncorporated. He also has over 20 years of consulting experience and is a Certified Management Consultant. Hisresearch interests include the use of analytics in decision making, business intelligence, organizational learning, andmanagement process innovation.Daniel Amyot is Professor at the University of Ottawa, which he joined in 2002 after working for Mitel Networks as asenior researcher. His research interests include scenario-based software engineering, requirements engineering,business process modeling, aspect-oriented modeling, and healthcare informatics. Daniel led the standardization ofthe User Requirements Notation at the International Telecommunication Union between 2002 and 2013, and still leadsthe development of the jUCMNav modeling environment. He has published over 130 journal and conferencepublications. He has a Ph.D. and an M.Sc. from the University of Ottawa (2001 and 1994), as well as a B.Sc. from LavalUniversity (1992). Daniel is also a Professional Engineer in the province of Québec, Canada.Iman Johari holds a Master’s degree in Systems Science (2012) and a Bachelor’s degree in Software Engineering (2009)from the University of Ottawa. His research area relates to goals in business intelligence and performancemanagement. Iman is also a software developer at IBM for the Business Analytics segment, where he contributed tothe development of the IBM Cognos SDK and Cognos Mashup Service.Okhaide Akhigbe holds a Master’s degree in Systems Science from the University of Ottawa (2014) and a Bachelor ofEngineering degree from Ambrose Alli University (2003). His research area relates to adaptive enterprise architectures,goal modeling, and performance management. Okhaide is now a Ph.D. student in E-Business at the University of Ottawa.
AcknowledgementsThis research was supported by the Business Intelligence Network of the National Science and Engineering ResearchCouncil of Canada and by the IBM Centre for Business Analytics and Performance of the University of Ottawa.
Author details1IBM Canada, Ottawa, Canada. 2IBM Canada, Vancouver, Canada. 3Telfer School of Management, University of Ottawa,55 Laurier Avenue East, Ottawa ON K1N 6N5, Canada. 4School of Computer Science and Electrical Engineering,University of Ottawa, 800 King Edward Avenue, Ottawa, ON K1N 6N5, Canada.
Received: 5 May 2014 Accepted: 20 October 2014
References
Ackoff, RL. (1967). Management Misinformation Systems. Management Science, 14(4), B147–B156.Akhigbe, OS. (2014). Business Intelligence - Enabled Adaptive Enterprise Architecture. M.Sc. thesis, Systems Science,University of Ottawa, April. http://hdl.handle.net/10393/31012.Akhigbe, OS, Amyot, D, & Richards, G. (2014). A Framework for a Business Intelligence-Enabled Adaptive Enterprise Architecture.
In 33rd Int. Conf. on Conceptual Modeling (ER 2014) (LNCS 8824, pp. 393–406). Switzerland: Springer International Publishing.Amyot, D, Ghanavati, S, Horkoff, J, Mussbacher, G, Peyton, L, & Yu, E. (2010). Evaluating Goal Models within the
Goal-oriented Requirement Language. International Journal of Intelligent Systems, 25(8), 841–877.Amyot, D, & Mussbacher, G. (2011). User Requirements Notation: The First Ten Years, The Next Ten Years, Invited paper
(Journal of Software (JSW), Vol. 6, No. 5, pp. 747–768). Academy Publisher. doi:10.4304/jsw.6.5.747-768.Amyot, D, Rashidi-Tabrizi, R, Mussbacher, G, Kealey, J, Tremblay, E, & Horkoff, J. (2013). Improved GRL Modeling and
Analysis with jUCMNav 5. In 6th International i* Workshop (iStar 2013) (CEUR-WS, Vol. 978, pp. 137–139).Ansar, Y, Giorgini, P, Ciancarini, P, Moretti, R, Sebastianis, M, & Zannone, N. (2008). Evaluation of Business Solutions in
Manufacturing Enterprises. International Journal of Business Intelligence and Data Mining, 3(3), 305–329.Babar, A, Zowghi, D, & Chew, E. (2010). Using Goals to Model Strategy Map for Business IT Alignment (Workshop on
BUSITAL10, in conjunction with CAiSE’10, June. CEUR-WS, Vol-599, pp. 16–30).

Pourshahid et al. Decision Analytics 2014, 1:9 Page 35 of 36http://www.decisionanalyticsjournal.com/1/1/9
Beasley, M, Chen, A, Nunez, K, & Wright, L. (2006). Balanced Scorecards and Enterprise Risk Management. StrategicFinance, 87(9), 49–55.
Chen, P. (2007). Goal-oriented business process monitoring: An approach based on user requirement notation combined withbusiness intelligence and web services. Master’s thesis, Computer Science, Carleton University, Canada, December.
Colombo, E, & Mylopoulos, J. (2006). A Multi-perspective Framework for Organizational Patterns (Conceptual Modeling,LNCS, Vol. 4215, pp. 451–467). Berlin Heidelberg: Springer.
Cooper, BL, Watson, HJ, Wixom, BH, & Goodhue, DL. (2000). Data Warehousing supports Corporate Strategy at FirstAmerican Corporation. MIS Quarterly, 24(4), 547–567.
Davis, R, & Brabänder, E. (2007). ARIS Design Platform: Getting Started with BPM. London: Springer.Feng, X, Richards, G, & Raheemi, B. (2009). The Road to Decision-Centric Business Intelligence. In 2nd Int. Conf. on Business
Intelligence and Financial Engineering (pp. 514–518). Beijing, China: IEEE CS.Gartner (2014). Gartner/EBRC KPI Initiative, http://www.aicpa.org/InterestAreas/FRC/AccountingFinancialReporting/
EnhancedBusinessReporting/Pages/GartnerEBRCKPIInitiative.aspx, accessed May 2014.Henderson, JC, & West, JM, Jr. (1979). Planning for MIS: A Decision-Oriented Approach. MIS Quarterly, 3(2), 45–58.Hevner, A, & Chatterjee, S. (2010). Design Research in Information Systems - Theory and Practice (Integrated Series in
Information Systems, Vol. 22). USA: Springer.Hevner, AR, March, ST, Park, J, & Ram, S. (2004). Design science in information systems research. MIS Quarterly, 28, 75–105.Horkoff, J, Barone, D, Jiang, L, Yu, E, Amyot, D, Borgida, A, & Mylopoulos, J. (2014). Strategic Business Modeling - Representation
and Reasoning. Software and Systems Modeling, 13(3), 1015–1041.IBM (2012). Cognos Mashup Service. http://www-03.ibm.com/software/products/en/cognos-mashup-service, accessed November 2014.IBM (2014). Cognos Insight. http://www-03.ibm.com/software/products/en/cogninsi, accessed May 2014.Isik, O, Jones, MC, & Sidorova, A. (2011). Business Intelligence (BI) and the Role of BI Capabilities. Intelligent Systems in
Accounting, Finance and Management, 18(4), 161–176.International Telecommunication Union – ITU-T (2012). Recommendation Z.151 (10/12), User Requirements Notation
(URN) – Language definition. Geneva, Switerland. http://www.itu.int/rec/T-REC-Z.151/en.Jiang, L, Barone, D, Amyot, D, & Mylopoulos, J. (2011). Composite Indicators for Business Intelligence. In 30th Int. Conf.
on Conceptual Modeling (ER 2011) (LNCS 6998, pp. 448–458). Brussels, Belgium: Springer.Johari, I (2012). Combining Business Intelligence, Indicators, and the User Requirements Notation for Performance Monitoring.
Master’s thesis, Systems Science, University of Ottawa, Canada, November. http://hdl.handle.net/10393/23540King, WR, & Cleland, DI. (1975). The Design of Management Information Systems: An Information Analysis Approach.
Management Science, 22(3), 286–297.Ko, IS, & Abdullaev, SR. (2007). A Study on the Aspects of Successful Business Intelligence System Development
(Int. Conf. on Computational Science (ICCS 2007). LNCS, Vol. 4490, pp. 729–732). Berlin Heidelberg: Springer.Korhonen, P, Mano, H, Stenfors, S, & Wallenius, J. (2008). Inherent Biases in Decision Support Systems: The Influence of
Optimistic and Pessimistic DSS on Choice, Affect, and Attitudes. Journal of Behavioral Decision Making, 21, 45–58.Koutsoukis, N, & Mitra, G. (2003). Decision Modelling and Information Systems: The information Value Chain.
Boston: Kluwer Academic Publishers.Lai, T, (2013). com.primalworld.math.MathEvaluator (Math Evaluator), http://goo.gl/z3KIEA, accessed September 2014.Liew, A, & Sundaram, D. (2009). Flexible Modelling and Support of Interrelated Decisions. Decision Support Systems, 46, 786–802.Luo, H, & Amyot, D. (2011). Towards a Declarative, Constraint-Oriented Semantics with a Generic Evaluation Algorithm
for GRL. In 5th International i* Workshop (CEUR-WS, Vol. 766, pp. 26–31).March, ST, & Hevner, AR. (2007). Integrated Decision Support Systems: A data warehousing perspective. Decision
Support Systems, 43, 1031–1043.McWhorter, LB, Matherly, M, & Frizzel, DM. (2006). The Connection between Performance Measurement and Risk
Management. Strategic Finance, 87(8), 50–55.Mussbacher, G, Ghanavati, S, & Amyot, D. (2009). Modeling and Analysis of URN Goals and Scenarios with jUCMNav
(17th IEEE Int. Requirements Engineering Conf, pp. 383–384). USA: IEEE CS. http://softwareengineering.ca/jucmnav/.Negash, S. (2004). Business Intelligence. Communications of the Association for Information Systems, 13, 177–195.Popova, V, & Sharpanskykh, A. (2010). Modeling organizational performance indicators. Information Systems, 35(4), 505–527.
Special issue on Vocabularies, Ontologies and Rules for Enterprise and Business Process Modeling and Management, June.Popova, V, & Sharpanskykh, A. (2011). Formal modelling of organisational goals based on performance indicators. Data
& Knowledge Engineering, 70(4), 335–364.Pourshahid, A. (2014). A Framework for Monitoring and Adapting Business Processes Using Aspect-Oriented URN. Ph.D.
thesis, Computer Science, University of Ottawa, Canada, April. http://hdl.handle.net/10393/30958.Pourshahid, A, Amyot, D, Shamsaei, A, Mussbacher, G, & Weiss, M. (2012). A Systematic Review and Assessment of
Aspect-oriented Methods Applied to Business Process Adaptation (Journal of Software (JSW), Vol. 7, No. 8, pp.1816–1826). Academy Publisher. http://ojs.academypublisher.com/index.php/jsw/article/viewFile/jsw070818161826/5368.
Pourshahid, A, Chen, P, Amyot, D, Forster, AJ, Ghanavati, S, Peyton, L, & Weiss, M. (2009). Business Process Managementwith the User Requirements Notation (Electronic Commerce Research, Vol. 9, No. 4, pp. 269–316). USA: Springer.
Pourshahid, A, Chen, P, Amyot, D, Forster, AJ, & Weiss, M. (2007). Business Process Monitoring and Alignment: AnApproach Based on the User Requirements Notation and Business Intelligence Tool. In Proc. of the 10th Workshopon Requirements Engineering (WER'07) (pp. 80–91). Canada: York University Printing Services. ISBN 978-1-55014-483-3.
Pourshahid, A, Mussbacher, G, Amyot, D, & Weiss, M. (2013). Requirements for a Modeling Language to Specify and Match BusinessProcess Improvement Patterns. In 3rd Workshop on Model-Driven Requirements Engineering (MoDRE 2012) (pp. 10–19). USA: IEEE CS.
Pourshahid, A, Richards, G, & Amyot, D. (2011). Toward a Goal-Oriented, Business Intelligence Decision-Making Framework.In 5th International MCETECH Conference on eTechnologies (LNBIP 78, pp. 100–115). Berlin Heidelberg: Springer.
Power, DJ, & Sharda, R. (2007). Model-driven Decision Support Systems: Concepts and Research Directions. DecisionSupport Systems, 43, 1044–1061.
Prakash, N, & Gosain, A. (2008). An Approach to Engineering the Requirements of Data Warehouses. RequirementsEngineering, 13, 49–72.

Pourshahid et al. Decision Analytics 2014, 1:9 Page 36 of 36http://www.decisionanalyticsjournal.com/1/1/9
Rogers, S, Lin, S, & Torok, R. (2008). Orchestrating Risk-Adjusted Performance Management (IBM Institute for BusinessValue). https://www-935.ibm.com/services/no/cfo/pdf/gbe03048usen.pdf. accessed May 2014.
Shariat, M, & Hightower, R, Jr. (2007). Conceptualizing Business Intelligence Architecture. Marketing ManagementJournal, 17(2), 40–46.
Siena, A, Bonetti, A, & Giorgini, P. (2008). Balanced Goalcards: Combining Balanced Scorecards and Goal Analysis. InThird Int. Conf. on Evaluation of Novel Approaches to Software Engineering (ENASE 2008) (pp. 107–114). Funchal,Portugal: INSTICC Press.
Silver, B. (2010). Collaborative Business Process Discovery and Improvement (Industry Trend Reports). USA: Bruce SilverAssociates.
Stroh, F, Winter, R, & Wortmann, F. (2011). Method Support of Information Requirements Analysis for AnalyticalInformation Systems. Business & Information Systems Engineering, 3(1), 33–43.
Tawhid, R, Alhaj, M, Mussbacher, G, Braun, E, Cartwright, N, Shamsaei, A, Amyot, D, Behnam, SA, & Richards, G. (2012).Towards Outcome-Based Regulatory Compliance in Aviation Security. In 20th IEEE Int. Requirements EngineeringConf. (RE'12) (pp. 267–272). USA: IEEE CS.
van Lamsweerde, A. (2009). Requirements Engineering: From System Goals to UML Models to Software Specifications.England: John Wiley & Sons.
Vinekar, V, Teng, JTC, & Chennamaneni, A. (2009). The Interaction of Business Intelligence and Knowledge Managementin Organizational Decision-Making. Journal of International Technology and Information Management, 18(2), 143–159.
Watson, HJ, & Frolick, MN. (1993). Determining Information Requirements for an EIS. MIS Quarterly, 17(3), 255–269.Weiss, M, & Amyot, D. (2005). Business Process Modeling with URN. International Journal of E-Business Research, 1(3), 63–90.Wixom, BH, & Watson, HJ. (2010). The BI-Based Organization. International Journal of Business Intelligence Research, 1, 13–28.Wixom, BH, Watson, HJ, Reynolds, AM, & Hoffer, JA. (2008). Continental Airlines Continues to Soar with Business
Intelligence. Information Systems Management, 25, 102–112.World Intellectual Capital Initiative (2014). WICI KPI, http://www.wici-global.com/kpis, accessed May 2014.Wu, DD, & Olson, DL. (2009). Entreprise Risk Management: Small Business Scorecard Analysis. Production Planning and
Control, 20(4), 362–369.Yu, E, Horkoff, J, Mylopoulos, J, Richards, G, & Amyot, D. (2013). Business Modeling for Business Intelligence. In RT Ng
et al. (Eds.), Perspectives on Business Intelligence (Synthesis Lectures on Data Management, Vol. 5(1), pp. 19–33). USA:Morgan & Claypool Publishers.
Yu, E, & Mylopoulos, J. (1998). Why Goal-Oriented Requirements Engineering. In Fourth Intl. Workshop on Req. Eng.:Foundation for Software Quality (REFSQ’98), Pisa, Italy.
doi:10.1186/s40165-014-0009-8Cite this article as: Pourshahid et al.: A goal-oriented, business intelligence-supported decision-makingmethodology. Decision Analytics 2014 1:9.
Submit your manuscript to a journal and benefi t from:
7 Convenient online submission
7 Rigorous peer review
7 Immediate publication on acceptance
7 Open access: articles freely available online
7 High visibility within the fi eld
7 Retaining the copyright to your article
Submit your next manuscript at 7 springeropen.com