Research at Nova 2012
19
RESEARCH AT NOVA 2012 EVOLUTION 2009-2012 ANA RAMOS DIVISION OF RESEARCH SUPPORT AND INSTITUTIONAL DEVELOPMENT 11 DECEMBER 2013
-
Upload
universidade-nova -
Category
Documents
-
view
213 -
download
0
description
Â
Transcript of Research at Nova 2012
RESEARCH AT NOVA 2012 EVOLUTION 2009-2012
ANA RAMOS
DIVISION OF RESEARCH SUPPORT AND INSTITUTIONAL DEVELOPMENT
11 DECEMBER 2013
2
CONTENTS
1. PHD STUDENTS .............................................................. 3
2. PHD DEGREES AWARDED ....................................................... 5
3. POST DOCTORAL RESEARCHERS ................................................. 6
4. “INVESTIGADOR FUNDAÇÃO PARA A CIÊNCIA E A TECNOLOGIA” 2012 ................ 8
5. REVENUE ................................................................... 9
6. PROJECTS FUNDAÇÃO PARA A CIÊNCIA E A TECNOLOGIA (FCT) .................... 12
7. 7TH FRAMEWORK-PROGRAMME .................................................. 13
8. OTHER FUNDING SOURCES (PROJECTS RUNNING IN 2012) ......................... 14
9. PUBLICATIONS NOVA ........................................................ 15
10. PUBLICATIONS ACADEMIC UNITS (SOURCE: CONVERIS) .......................... 17
11. NORMALIZED IMPACT WOS PUBLICATIONS 2000-2010 (SOURCE CWTS, LEIDEN) ...... 18
12. RESEARCH UNITS .......................................................... 19
3
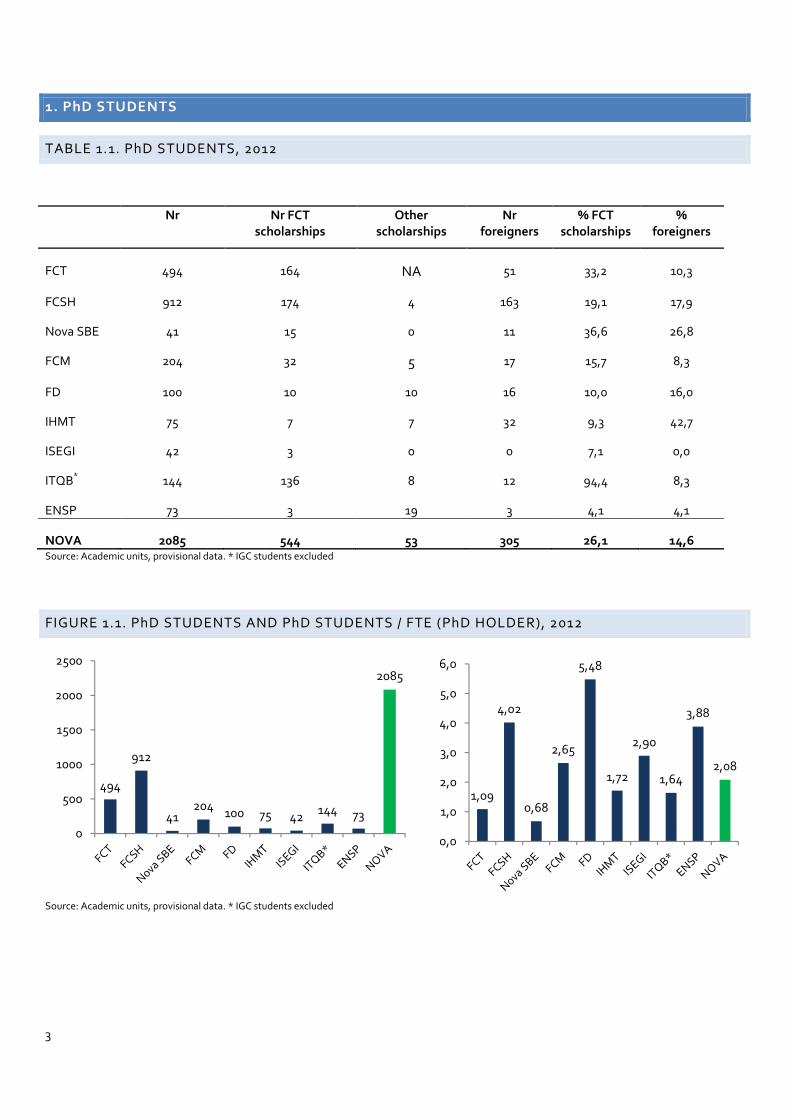
1. PhD STUDENTS
TABLE 1.1. PhD STUDENTS, 2012
Nr Nr FCT scholarships
Other scholarships
Nr foreigners
% FCT scholarships
% foreigners
FCT 494 164 NA 51 33,2 10,3
FCSH 912 174 4 163 19,1 17,9
Nova SBE 41 15 0 11 36,6 26,8
FCM 204 32 5 17 15,7 8,3
FD 100 10 10 16 10,0 16,0
IHMT 75 7 7 32 9,3 42,7
ISEGI 42 3 0 0 7,1 0,0
ITQB* 144 136 8 12 94,4 8,3
ENSP 73 3 19 3 4,1 4,1
NOVA 2085 544 53 305 26,1 14,6 Source: Academic units, provisional data. * IGC students excluded
FIGURE 1.1. PhD STUDENTS AND PhD STUDENTS / FTE (PhD HOLDER), 2012
Source: Academic units, provisional data. * IGC students excluded
494
912
41204
100 75 42144 73
2085
0
500
1000
1500
2000
2500
1,09
4,02
0,68
2,65
5,48
1,72
2,90
1,64
3,88
2,08
0,0
1,0
2,0
3,0
4,0
5,0
6,0
4
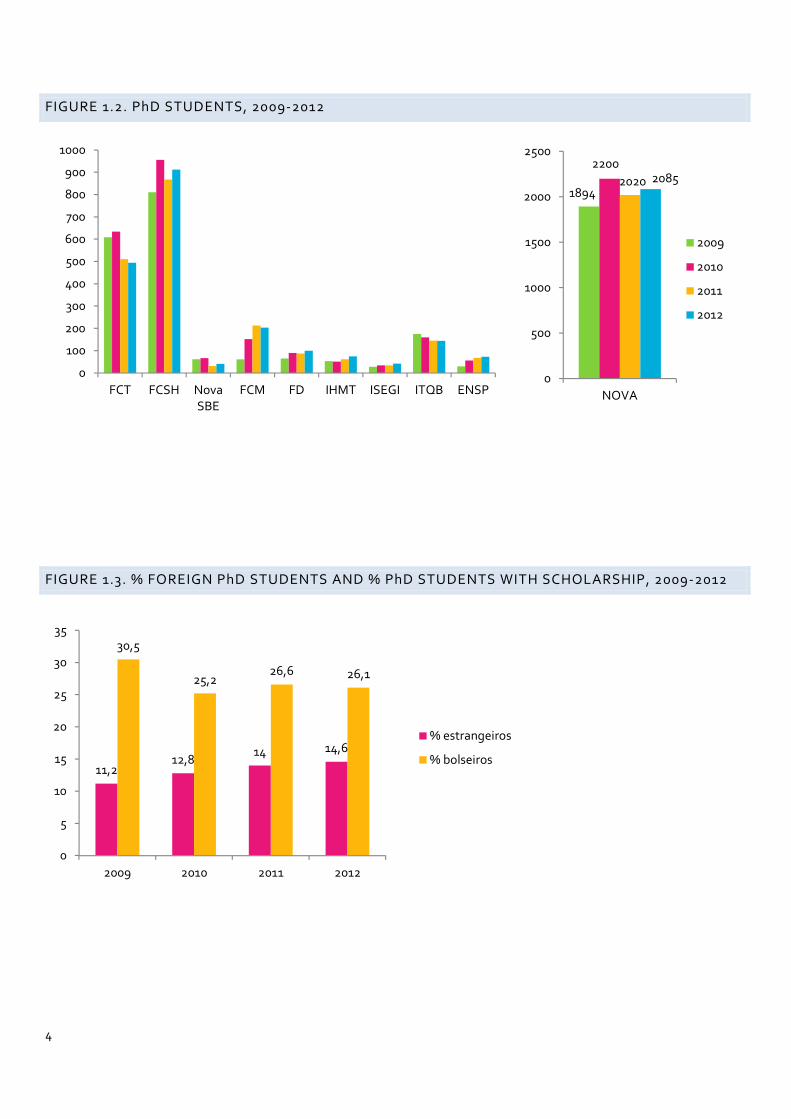
FIGURE 1.2. PhD STUDENTS, 2009-2012
FIGURE 1.3. % FOREIGN PhD STUDENTS AND % PhD STUDENTS WITH SCHOLARSHIP, 2009-2012
0
100
200
300
400
500
600
700
800
900
1000
FCT FCSH NovaSBE
FCM FD IHMT ISEGI ITQB ENSP
1894
2200
2020 2085
0
500
1000
1500
2000
2500
NOVA
2009
2010
2011
2012
11,212,8
14 14,6
30,5
25,226,6 26,1
0
5
10
15
20
25
30
35
2009 2010 2011 2012
% estrangeiros
% bolseiros

5
2. PhD DEGREES AWARDED
TABLE 2.1. PhD DEGREES AWARDED, 2009-2012
2009 2010 2011 2012
FCT 49 40 62 61
FCSH 39 59 65 64
Nova SBE 4 6 4 5
FCM 7 7 3 8
FD 3 1 0 2
IHMT 8 11 14 1
ISEGI 0 2 2 2
ITQB** 20 (2) 34 (6) 45 (12) 44 (14)
ENSP 1 8 5 4
NOVA 135 168 200 191
Source: Academic Division, Rectorate. Includes ISPA and IGC (between parenthesis)
FIGURE 2.1. PhD DEGREES AWARDED, 2009-2012
Source: Academic Division, Rectorate. Includes ISPA and IGC
0
10
20
30
40
50
60
70
2009 2010 2011 2012
FCT
FCSH
Nova SBE
FCM
FD
IHMT
ISEGI
ITQB
ENSP0
50
100
150
200
250
2009 2010 2011 2012
NOVA

6
FIGURE 2.2. PhD DEGREES AWARDED / FTE (PhD HOLDER), 2009-2012
Source: Academic Division, Rectorate. Includes ISPA and IGC
3. POST DOCTORAL RESEARCHERS
TABLE 3.1. POST DOCTORAL RESEARCHERS, 2012
Nr Nr FCT scholarships
Other scholarships
Nr foreigners % FCT scholarships
% foreigners
FCT 114 88 26 37 100,0 32,5
FCSH 175 163 6 68 96,6 38,9
Nova SBE 4 4 0 1 100,0 25,0
FCM 69 17 13 9 43,5 13,0
FD NA NA NA NA NA NA
IHMT 12 9 3 2 100,0 16,7
ISEGI 0 0 0 0 - -
ITQB/IBET 104 86 18 22 100,0 21,2
ENSP 1 0 1 1 100,0 100,0
NOVA 479 367 67 140 90,6 29,2
Source: Academic Units
0
0,1
0,2
0,3
0,4
0,5
0,6
FCT FCSH NovaSBE
FCM FD IHMT ISEGI ITQB ENSP
0,132
0,162
0,192 0,191
0,00
0,05
0,10
0,15
0,20
0,25
NOVA
2009
2010
2011
2012

7
FIGURE 3.1. POST DOCS AND POST-DOCS / FTE (PhD HOLDER), 2012
FIGURE 3.2. % FOREIGN POST DOCS AND % OF POST DOCS WITH SCHOLARSHIPS, 2009-2012
114175
4
6912 0
104
1
479
0
100
200
300
400
500
600
0,25
0,77
0,07
0,90
0,27
1,19
0,05
0,48
0,0
0,2
0,4
0,6
0,8
1,0
1,2
1,4
24,9
38 36,8
29,2
77,3
85,6
93,390,6
0
10
20
30
40
50
60
70
80
90
100
2009 2010 2011 2012
% estrangeiros
% bolseiros

8
FIGURE 3.3. POST DOCS, 2009-2012
4. “INVESTIGADOR FUNDAÇÃO PARA A CIÊNCIA E A TECNOLOGIA” 2012
TABLE 4.1. NR OF “FCT RESEARCHERS” POR UNIT AND TYPE OF GRANT
Type of grant Unit Advanced Development Starting
FCT 0 2 2 FCSH 0 2 1 FCM 0 1 3 ITQB 1 3 2
NOVA (% of total) 1 (7,7%) 8 (10,4%) 8 (12,3%) Total national 13 77 65
Source: FCT
0
20
40
60
80
100
120
140
160
180
200
FCT FCSH NovaSBE
FCM FD IHMT ISEGI ITQB ENSP
233271
363
479
0
100
200
300
400
500
600
NOVA
2009
2010
2011
2012
9
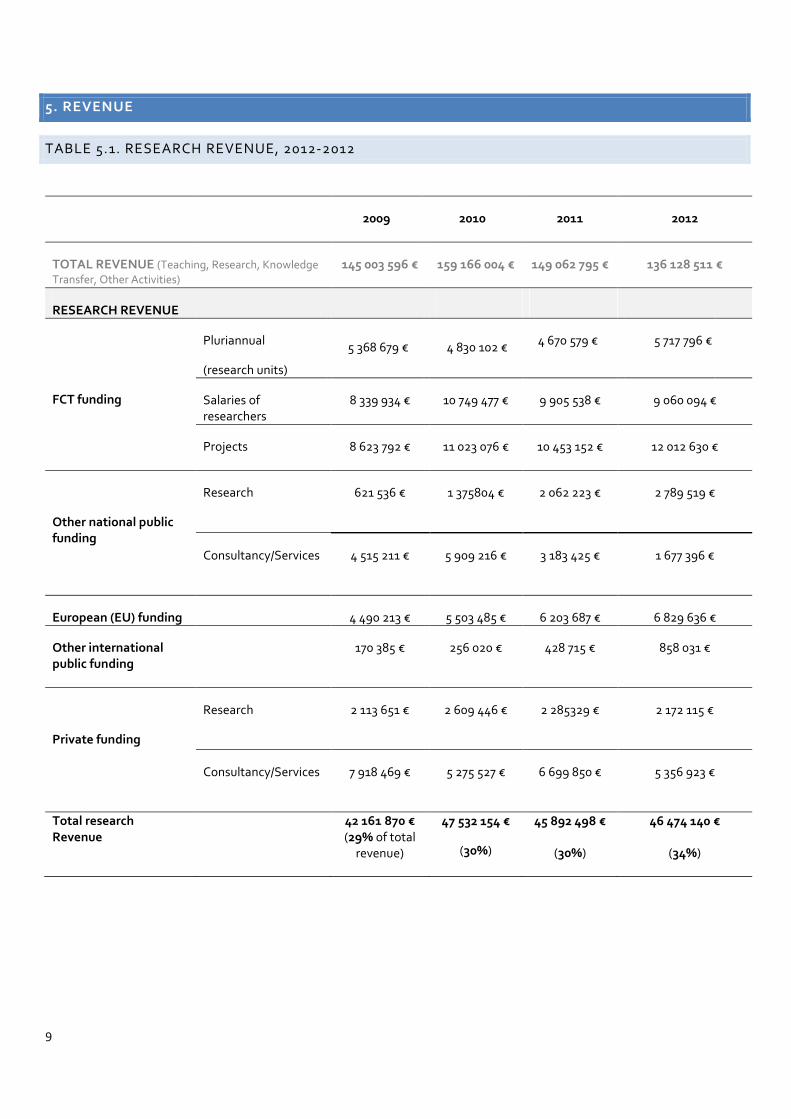
5. REVENUE
TABLE 5.1. RESEARCH REVENUE, 2012-2012
2009 2010 2011 2012
TOTAL REVENUE (Teaching, Research, Knowledge Transfer, Other Activities)
145 003 596 € 159 166 004 € 149 062 795 € 136 128 511 €
RESEARCH REVENUE
FCT funding
Pluriannual
(research units)
5 368 679 € 4 830 102 € 4 670 579 € 5 717 796 €
Salaries of researchers
8 339 934 € 10 749 477 € 9 905 538 € 9 060 094 €
Projects 8 623 792 € 11 023 076 € 10 453 152 € 12 012 630 €
Other national public funding
Research 621 536 € 1 375804 € 2 062 223 €
2 789 519 €
Consultancy/Services 4 515 211 € 5 909 216 €
3 183 425 € 1 677 396 €
European (EU) funding 4 490 213 € 5 503 485 € 6 203 687 € 6 829 636 €
Other international public funding
170 385 € 256 020 € 428 715 €
858 031 €
Private funding
Research 2 113 651 € 2 609 446 € 2 285329 €
2 172 115 €
Consultancy/Services 7 918 469 €
5 275 527 €
6 699 850 € 5 356 923 €
Total research Revenue
42 161 870 € (29% of total
revenue)
47 532 154 €
(30%)
45 892 498 €
(30%)
46 474 140 €
(34%)

10
FIGURE 5.1. RESEARCH REVENUE PER SOURCE, 2012
FIGURE 5.2. RESEARCH REVENUE PER UNIT AND SOURCE, 2012
26.790.520 €58%
4.466.915 €9%
6.829.636 €15%
858.031 €2%
7.529.038 €16%
Fundação para a Ciência e aTecnologia
Outro financiamento público nacional
Financiamento Europeu
Outro financiamento públicointernacional
Financiamento privado
0,00
2.000.000,00
4.000.000,00
6.000.000,00
8.000.000,00
10.000.000,00
12.000.000,00
14.000.000,00
16.000.000,00
18.000.000,00
FCT FCSH NovaSBE
FCM FD IHMT ISEGI ITQB ENSP 0,00
5.000.000,00
10.000.000,00
15.000.000,00
20.000.000,00
25.000.000,00
30.000.000,00
35.000.000,00
40.000.000,00
45.000.000,00
50.000.000,00
NOVA
TOTAL
PÚBLICO
INTERNACIONAL
PRIVADO

11
FIGURE 5.3. WEIGHT OF FUNDING SOURCE IN THE RESEARCH REVENUE, 2012
FIGURE 5.4. RESEARCH REVENUE / FTE (PhD HOLDER), 2012
FIGURE 5.5. RESEARCH REVENUE 2009-2012, PER SOURCE
0% 20% 40% 60% 80% 100%
FCT
FCSH
Nova SBE
FCM
FD
IHMT
ISEGI
ITQB
ENSP
NOVA
PÚBLICO
INTERNACIONAL
PRIVADO
0,00
20.000,00
40.000,00
60.000,00
80.000,00
100.000,00
120.000,00
140.000,00
160.000,00
180.000,00
FCT FCSH NovaSBE
FCM FD IHMT ISEGI ITQB ENSP 0,00
5.000,00
10.000,00
15.000,00
20.000,00
25.000,00
30.000,00
35.000,00
40.000,00
45.000,00
50.000,00
NOVA
Total F/ETId
F público/ETId
F internacional/ETId
F privado/ETId
0
5.000.000
10.000.000
15.000.000
20.000.000
25.000.000
30.000.000
35.000.000
40.000.000
2009 2010 2011 2012
Financiamento público nacional
Financiamento internacional
Financiamento privado
12
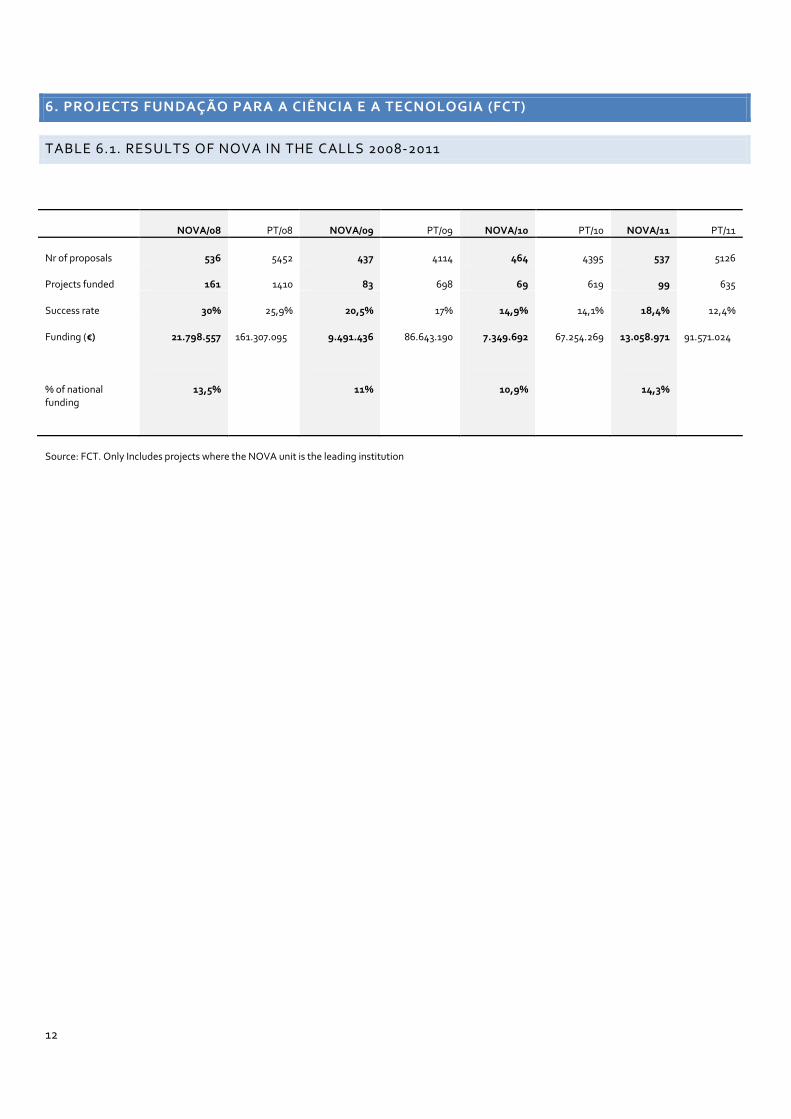
6. PROJECTS FUNDAÇÃO PARA A CIÊNCIA E A TECNOLOGIA (FCT)
TABLE 6.1. RESULTS OF NOVA IN THE CALLS 2008-2011
NOVA/08 PT/08 NOVA/09 PT/09 NOVA/10 PT/10 NOVA/11 PT/11
Nr of proposals 536 5452 437 4114 464 4395 537 5126
Projects funded 161 1410 83 698 69 619 99 635
Success rate 30% 25,9% 20,5% 17% 14,9% 14,1% 18,4% 12,4%
Funding (€)
% of national funding
21.798.557
13,5%
161.307.095 9.491.436
11%
86.643.190
7.349.692
10,9%
67.254.269 13.058.971
14,3%
91.571.024
Source: FCT. Only Includes projects where the NOVA unit is the leading institution

13
7. 7TH FRAMEWORK-PROGRAMME
FIGURE 7.1. 7TH FRAMEWORK-PROGRAMME, 2007 - 2012
Source: GPPQ
TABLE 7.1. 7TH FRAMEWORK-PROGRAMME 2007 – 2012, PER UNIT
Cooperation People Research for SME´s Infrastructures Science in
Society
Ideas
(ERC)
IMI INCO
FCT 43 5 2 2 2
FCSH 1 3 1
Nova SBE 1
FCM 1 2 1
IHMT 5 1
ITQB 20 12 5 1 1 1 1
ENSP 2
NOVA 72 22 7 3 3 4 1 1
Source: GPPQ
72
22
73
3 4 11 Cooperation
People
Research for SME´s
Infrastructures
Science in Society
Ideas (European Research Council)
Innovative Medicines Initiative
INCO

14
FIGURE 7.2. PROJECTS COOPERATION PROGRAMME 2007 - 2012, PER AREA
Source: GPPQ
8. OTHER FUNDING SOURCES (PROJECTS RUNNING IN 2012)
Source: CONVERIS (16/09/2013)
17
15
19
10
52 2 1 1
Food, Agriculture & Fisheries, and Biotechnol
Health
ICT
NMP
Environment
Energy
Space
Transport
Social Sci & Humanities
2
2521
6 6
1619
11
5
20
45
0
5
10
15
20
25
30
35
40
45
50
Nú
me
ro d
e p
roje
cto
s

15
9. PUBLICATIONS NOVA
2009 2010 2011 2012
Article or Proceeding international1 - indexed to WoS or other international databases 1118 1268 1344 1481
- Indexed to WoS 1009 1047 1089 1117
Other international publications2 194 197 432 537
TOTAL INTERNATIONAL 1312 1465 1776 2018
National publications
TOTAL
761
2073
973
2438
1741
3517
1814
3832
Source: CONVERIS
1 Includes “Article, letter or review in peer-reviewed journal” and “Article in conference proceedings with peer-reviewing”. 2 Includes “Book as author; Book as
editor/coordinator; Book chapter; Issue of journal as editor/coordinator; Article (book review or editorial)” classified in CONVERIS as international
FIGURE 9.1. EVOLUTION, 2009-2012
Source: CONVERIS
0
500
1000
1500
2000
2500
3000
3500
4000
4500
2009 2010 2011 2012
Nú
me
ro d
e p
ub
lica
çõe
s
Publicações indexadas à WoS
Total publicações internacionais
Total publicações nacionais
TOTAL (internacional+nacional)

16
FIGURE 9.2. PRODUCTIVITY (NR OF PUBLICATIONS/FTE PhD HOLDER), 2009-2012
Source: CONVERIS
0,00
0,50
1,00
1,50
2,00
2,50
3,00
3,50
4,00
4,50
2009 2010 2011 2012
Nú
me
ro d
e p
ub
lica
çõe
s/E
TI
do
uto
rad
o
Publicações indexadas à WoS/ETId
Total publicações internacionais/ETId
Total publicações nacionais/ETId
TOTAL (internacional+nacional)/ETId

17
10. PUBLICATIONS ACADEMIC UNITS (SOURCE: CONVERIS)
FIGURE 10.1. INTERNATIONAL PUBLICATIONS/FTE PhD HOLDER, 2012
FIGURE 10.2. WOS PUBLICATIONS / FTE PhD HOLDER, 2012
FIGURE 10.3. NATIONAL PUBLICATIONS/FTE PhD HOLDER, 2012
1,88
2,46
0,85
1,64
3,27
2,833,09
0,96
0,00
0,50
1,00
1,50
2,00
2,50
3,00
3,50
FCT FCSH NovaSBE
FCM IHMT ISEGI ITQB ENSP
Pub
licaç
ões
inte
rnac
ion
ais/
ET
I d
out
ora
do
1,20
0,340,48
1,561,90
2,692,92
0,48
0,00
0,50
1,00
1,50
2,00
2,50
3,00
3,50
FCT FCSH NovaSBE
FCM IHMT ISEGI ITQB ENSP
Pub
licaç
ões
Wo
S/E
TI
do
uto
rad
o
0,76
5,95
0,13 0,03
1,08
2,48
0,02
1,54
0,00
1,00
2,00
3,00
4,00
5,00
6,00
7,00
FCT FCSH NovaSBE
FCM IHMT ISEGI ITQB ENSP
Pub
licaç
ões
nac
ion
ais
/ET
I d
out
ora
do

18
FIGURE 10.4. TOTAL PUBLICATIONS/FTE PhD HOLDER, 2012
FIGURE 10.5. INTERNATIONAL PUBLICATIONS/FTE PhD HOLDER, 2009-2012
11. NORMALIZED IMPACT WOS PUBLICATIONS 2000-2010 (SOURCE CWTS, LEIDEN)
2,63
8,40
0,981,66
4,35
5,31
3,122,50
0,00
1,00
2,00
3,00
4,00
5,00
6,00
7,00
8,00
9,00
FCT FCSH NovaSBE
FCM FD IHMT ISEGI ITQB ENSP
To
tal p
ublic
açõ
es/E
TI d
out
ora
do
0,00
0,50
1,00
1,50
2,00
2,50
3,00
3,50
FCT FCSH Nova SBE FCM IHMT ISEGI ITQB ENSP
2009
2010
2011
2012
0.82 0.80.88 0.87 0.89
1 1.03 1.05
0
0,2
0,4
0,6
0,8
1
1,2

19
12. RESEARCH UNITS
FIGURE 11.1. EVALUATION OF RESEARCH UNITS
Source: FCT evaluations in 2007 (Research units) and 2008 (Associated Laboratories)
FIGURE 11.2. AREAS OF RESEARCH UNITS
Source: FCT . Associated Laboratories excluded
7
17%
19
45%
12
29%
4
10%
Excellent 17%
Very Good 45%
Good 29%
Fair 10%
15
9
3
3
6
3Arts & Humanities
Social Sci
Natural Sci
Exact Sci
Engineering Sci & Technol
Health Sci