Research Article Stress-Strain Relationship of Ca OH -Activated...
10
Research Article Stress-Strain Relationship of Ca(OH) 2 -Activated Hwangtoh Concrete Keun-Hyeok Yang, 1 Ju-Hyun Mun, 2 and Hey-Zoo Hwang 3 1 Department of Plant, Architectural Engineering, Kyonggi University, Suwon, Kyonggi-do 443-760, Republic of Korea 2 Department of Architectural Engineering, Graduate School, Kyonggi University, Suwon, Kyonggi-do 443-760, Republic of Korea 3 Department of Architecture, Mokpo National University, Jeonnam 534-729, Republic of Korea Correspondence should be addressed to Keun-Hyeok Yang; [email protected] Received 2 January 2014; Accepted 29 January 2014; Published 4 March 2014 Academic Editors: ˙ I. B. Topc ¸u and J. Zheng Copyright © 2014 Keun-Hyeok Yang et al. is is an open access article distributed under the Creative Commons Attribution License, which permits unrestricted use, distribution, and reproduction in any medium, provided the original work is properly cited. is study examined the stress-strain behavior of 10 calcium hydroxide (Ca(OH) 2 )-activated Hwangtoh concrete mixes. e volumetric ratio of the coarse aggregate ( agg ) and the water-to-binder (W/B) ratio were selected as the main test variables. Two W/B ratios (25% and 40%) were used and the value of agg varied between 0% and 40.0%, and 0% and 46.5% for W/B ratios of 25% and 40%, respectively. e test results demonstrated that the slope of the ascending branch of the stress-strain curve of Ca(OH) 2 -activated Hwangtoh concrete was smaller, and it displayed a steeper drop in stress in the descending branch, compared with those of ordinary Portland cement (OPC) concrete with the same compressive strength. is trend was more pronounced with the increase in the W/B ratio and decrease in agg . Based on the experimental observations, a simple and rational stress-strain model was established mathematically. Furthermore, the modulus of elasticity and strain at peak stress of the Ca(OH) 2 -activated Hwangtoh concrete were formulated as a function of its compressive strength and agg . e proposed stress-strain model predicted the actual behavior accurately, whereas the previous models formulated using OPC concrete data were limited in their applicability to Ca(OH) 2 -activated Hwangtoh concrete. 1. Introduction With the increasing importance of leadership in energy and environmental design (LEED) certifications for buildings and reducing greenhouse gas (GHG) emissions, many concrete industry players are strongly focusing on minimizing the use of ordinary Portland cement (OPC). Although OPC has played a prominent role in building and infrastructure development as the basic component of concrete and mortar, the production of a ton of OPC is commonly associated with the following environmental issues [1–4]: (1) CO 2 emissions of 0.8–0.9 ton, which is approximately 7% of the total GHG emissions into the earth’s atmosphere; (2) very high energy consumption including 90–100 kWh of electric power and 3- 4 GJ of thermal energy owing to the plasticity temperature exceeding 1300 ∘ C; (3) natural resource depletion including 180–190 kg of bituminous coal and 20–30 kg of crude oil. For these reasons, the development of concrete with nil or minimal cement has attracted significant attention since the late 1980s. Hwangtoh has gained more interest recently as a source material for low-cement concrete, especially in Korea and China, because it is known to be eco-friendly, with high absorption capacity and self-purifying characteristics, as well as offering health benefits by virtue of emitting far infrared radiation [5–7]. Hwangtoh is primarily clay formed by the weathering of rocks and composed of more than 70% inorganic substances, some organic material, water, and air. Yang et al. [6, 7] established that the workability and compressive strength development in calcium hydroxie (Ca(OH) 2 )-activated Hwangtoh mortars are comparable to those of OPC mortars with the same mixing proportions. However, more extensive use of Hwangtoh concrete in structural engineering applications warrants precise evalu- ations of its inherent characteristics including mechanical properties, inelastic deformation behavior, and durability. In Hindawi Publishing Corporation e Scientific World Journal Volume 2014, Article ID 846805, 9 pages http://dx.doi.org/10.1155/2014/846805
Transcript of Research Article Stress-Strain Relationship of Ca OH -Activated...
Research ArticleStress-Strain Relationship of Ca(OH)2-Activated HwangtohConcrete
Keun-Hyeok Yang1 Ju-Hyun Mun2 and Hey-Zoo Hwang3
1 Department of Plant Architectural Engineering Kyonggi University Suwon Kyonggi-do 443-760 Republic of Korea2Department of Architectural Engineering Graduate School Kyonggi University Suwon Kyonggi-do 443-760 Republic of Korea3 Department of Architecture Mokpo National University Jeonnam 534-729 Republic of Korea
Correspondence should be addressed to Keun-Hyeok Yang yangkhkyonggiackr
Received 2 January 2014 Accepted 29 January 2014 Published 4 March 2014
Academic Editors I B Topcu and J Zheng
Copyright copy 2014 Keun-Hyeok Yang et al This is an open access article distributed under the Creative Commons AttributionLicense which permits unrestricted use distribution and reproduction in any medium provided the original work is properlycited
This study examined the stress-strain behavior of 10 calcium hydroxide (Ca(OH)2)-activated Hwangtoh concrete mixes The
volumetric ratio of the coarse aggregate (119881agg) and the water-to-binder (WB) ratio were selected as the main test variables TwoWB ratios (25 and 40) were used and the value of 119881agg varied between 0 and 400 and 0 and 465 for WB ratiosof 25 and 40 respectively The test results demonstrated that the slope of the ascending branch of the stress-strain curve ofCa(OH)
2-activated Hwangtoh concrete was smaller and it displayed a steeper drop in stress in the descending branch compared
with those of ordinary Portland cement (OPC) concrete with the same compressive strength This trend was more pronouncedwith the increase in theWB ratio and decrease in119881agg Based on the experimental observations a simple and rational stress-strainmodel was established mathematically Furthermore the modulus of elasticity and strain at peak stress of the Ca(OH)
2-activated
Hwangtoh concrete were formulated as a function of its compressive strength and119881aggThe proposed stress-strain model predictedthe actual behavior accurately whereas the previous models formulated using OPC concrete data were limited in their applicabilityto Ca(OH)
2-activated Hwangtoh concrete
1 Introduction
With the increasing importance of leadership in energy andenvironmental design (LEED) certifications for buildings andreducing greenhouse gas (GHG) emissions many concreteindustry players are strongly focusing on minimizing theuse of ordinary Portland cement (OPC) Although OPChas played a prominent role in building and infrastructuredevelopment as the basic component of concrete and mortarthe production of a ton of OPC is commonly associated withthe following environmental issues [1ndash4] (1) CO
2emissions
of 08ndash09 ton which is approximately 7 of the total GHGemissions into the earthrsquos atmosphere (2) very high energyconsumption including 90ndash100 kWh of electric power and 3-4GJ of thermal energy owing to the plasticity temperatureexceeding 1300∘C (3) natural resource depletion including180ndash190 kg of bituminous coal and 20ndash30 kg of crude oilFor these reasons the development of concrete with nil or
minimal cement has attracted significant attention since thelate 1980s
Hwangtoh has gained more interest recently as a sourcematerial for low-cement concrete especially in Korea andChina because it is known to be eco-friendly with highabsorption capacity and self-purifying characteristics aswell as offering health benefits by virtue of emitting farinfrared radiation [5ndash7] Hwangtoh is primarily clay formedby the weathering of rocks and composed of more than70 inorganic substances some organic material waterand air Yang et al [6 7] established that the workabilityand compressive strength development in calcium hydroxie(Ca(OH)
2)-activated Hwangtoh mortars are comparable to
those of OPC mortars with the same mixing proportionsHowever more extensive use of Hwangtoh concrete instructural engineering applications warrants precise evalu-ations of its inherent characteristics including mechanicalproperties inelastic deformation behavior and durability In
Hindawi Publishing Corporatione Scientific World JournalVolume 2014 Article ID 846805 9 pageshttpdxdoiorg1011552014846805
2 The Scientific World Journal
Table 1 Chemical composition of Hwangtoh ( by mass)
SiO2 Al2O3 Fe2O3 CaO MgO K2O Na2O TiO2 MnO LOIlowast
5250 3290 431 040 437 150 200 069 024 109lowastLoss on ignition
Table 2 Details of Ca(OH)2-activated Hwangtoh concrete mix proportions and summary of test results
Group Specimenlowast 119882119861 () 119878119886 () 119881agg () Unit weight (kgm3)119908119888(kgm3) 1198911015840
119888(MPa) 119864
119888(MPa) 120576
012057605
119882 119861 119878 119866 119878119901
I
25ndash100
25
100 00
180 720
1469 0
108
2419 308 17468 00033 0003825ndash75 75 143 1102 372 2424 331 18563 00031 0004225ndash60 60 229 882 595 2426 350 19873 00032 0004825ndash45 45 314 661 818 2429 350 22040 00028 0005425ndash30 30 400 441 1041 2431 369 23607 00028 00062
II
40ndash100
40
100 00
180 450
1709 0
54
2321 122 10241 00026 0005240ndash75 75 166 1281 432 2326 157 13822 00025 0005040ndash60 60 266 1025 691 2329 166 15737 00023 0005640ndash45 45 366 769 951 2332 175 16382 00023 0006140ndash30 30 465 513 1210 2335 195 17043 00024 00066
119882119861 water-to-binder ratio by weight 119878119886 fine aggregate-to-total aggregate ratio by volume 119881agg volumetric ratio of coarse aggregate119882 water 119861 binder119878 fine aggregate 119866 coarse aggregate 119878119901 polycarboxylate-based high-range water-reducing admixture 119908119888 dry density of concrete 119891
1015840
119888 compressive strength
119864119888 modulus of elasticity 1205760 strain at peak stress and 12057605 strain corresponding to 051198911015840119888after the peak stress
lowastIn specimen names the first and second parts refer to the119882119861 ratio and 119878119886 ratio respectively for example 25ndash75 refers to Ca(OH)2-activated Hwangtohconcrete mix with119882119861 and 119878119886 ratios of 25 and 75 respectively
particular the compressive stress-strain relations of concreteincorporating a new binder should definitely be evaluatedfor use in the rational analysis and design of structuralelements because the cohesion between pastes and aggregateparticles significantly influences the extent of increase instrain due to the applied load [8] The stress-strain rela-tions are typically understood through various experimentsand formulated using simple equations However no suchexperimental observations on the stress-strain relations ofCa(OH)
2-activated Hwangtoh concrete are available in exist-
ing literatureThe objective of the present study is to propose a simple
and rational model for obtaining the nonlinear stress-straincurves for Ca(OH)
2-activated Hwangtoh concrete under
compression To formulate the key factor determining theslopes of the ascending and descending branches of thecurves 10 concrete mixes were prepared with a range ofwater-to-binder (119882119861) ratios by weight and fine aggregate-to-total aggregate ratios (119878119886) by volume The developedmodel was then compared with existing models [9ndash11] thatwere empirically derived from the test data on OPC concreteFurthermore the modulus of elasticity and strain at peakstress of Ca(OH)
2-activated Hwangtoh concrete were com-
pared with those of OPC concrete collected from a variety ofspecimens [12] with compressive strength in similar ranges
2 Experimental Program
21Materials Hwangtoh acquired high pozzolanic reactivityas a result of its calcination at a temperature of 850∘Cusing theHoffmanmethodThe calcinated Hwangtoh which was used
as a source material was activated by 75 Ca(OH)2 This
Hwangtoh contained less calcium oxide (CaO) but was richin both silicon oxide (SiO
2) and aluminium oxide (Al
2O3)
as inferred from Table 1 This indicates that the chemicalcomposition of Hwangtoh is very similar to that of fly ashandor metakaolin [13] All dry powdered alkali activatorswere preblended with the source materials in dry form
The measurement of the physical properties of materialsrevealed the specific gravity and specific surface area ofHwangtoh to be 28 and 3200 cm2g respectivelyThe specificgravity fineness modulus and water absorption of the sand(used as the fine aggregate) were 242 251 and 17respectively and those of the crushed granite (used as thecoarse aggregate with a maximum size of 19mm) were26 675 and 11 respectively The specific gravity andmaximum particle sizes of Ca(OH)
2were 224 and 212 120583m
respectively
22 Specimen Mix Characteristics In general with increasein the compressive strength of concrete the initial slope of itsstress-strain curve increases whereas the descending branchof the curves after peak stress has a more rapidly decreasingslope [14] Moreover concrete displays higher modulus ofelasticity (119864
119888) and smaller strain (120576
0) values at peak stress
than do mortars and pastes indicating that the volumetricratio of the coarse aggregates (119881agg) directly affects the stress-strain curve of concrete[15 16] Considering these criticalfactors the 10 cementless concrete mixes using Ca(OH)
2-
activated Hwangtoh binder were prepared with a range of119882119861 and 119878119886 ratios as listed in Table 2 The selected 119882119861ratios were 25 and 40 and within each of these ratios the
The Scientific World Journal 3
P (Load)
Concrete specimen(Φ100 times 200mm)
Electrical resistancestrain gauge
Compressometer
Steel plates
LVDT(for longitudinaldisplacement)
100
200
100
UTM bed
Spherical hinge
(for transverseLVDT
displacement)
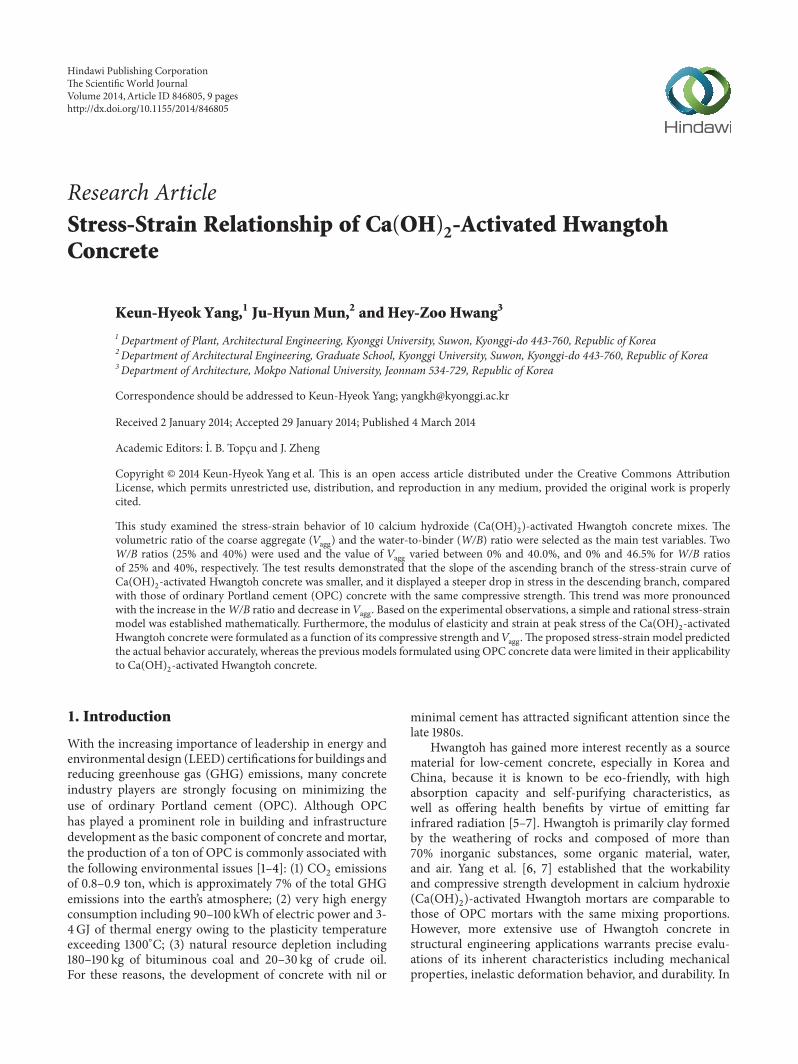
Figure 1 Test setup and instrumentation for test region (all dimensions are in mm)
119878119886 ratio of the mixes for each119882119861 ratio varied from 30 to100 in intervals of 15 The concrete specimen with an 119878119886ratio of 100 indicates a mortar without coarse aggregatesAs a result 119881agg ranged between 0 and 400 and 0and 465 for119882119861 ratios of 25 and 40 respectively Theunit water content was fixed at 180 kgm3 for all concretemixes To achieve workability of the mixes for casting apolycarboxylate-based high-range water-reducing agent wasadded with binder ratio by weight of 15 and 12 forconcretemixes with119882119861 ratios of 25 and 40 respectively
23 Testing All concrete specimens were mixed using a panmixer of 035m3 capacity and equipped with rubber wiperblades The initial slump of fresh concrete was measured inaccordance with the ASTMC143 provision [17] Immediatelyafter casting all specimens used for plotting the stress-straincurve were cured at a constant temperature and relativehumidity of 23 plusmn 2∘C and 70 plusmn 5 respectively until testingat an age of 28 days All steel moulds were removed after1 day The stress-strain curve was recorded using 100 times200mm cylindrical concrete specimens equipped with acompressor meter comprising linear variable differentialtransducers (LVDTs) of 50mm capacity on both sides asshown in Figure 1 The compressometer was combined witha convenient unbounded device for measuring transversestrain Electrical resistance strain gages with gage length of75mm were also attached to the specimens Prior to testingboth ends of each cylinder were leveled using a grindingmachine Concentric load was applied using a universaltesting machine of 500 kN capacity equipped with a closed-loop servocontrol system Each specimen was preloaded to20 of its compressive strength after which its position wasadjusted based on strain gage and LVDT readings to achievea concentric axial load A spherical hinge was also positionedbetween the testing machine head and the specimens to
minimize eccentricity in case of a large deformation Toobtain a complete stress-strain curve a low strain rate of20times10
minus4 permin was employed Testing was continued untilthe final crushing of the concrete All test data were capturedby a data logger and stored automatically Using themeasuredstress-strain curve the 119864
119888was calculated at 40 peak stress
in accordance with the ASTM C469 provision [17]
3 Test Results and Discussion
31 General Behavior and Crack Propagation Longitudinalcracking started at 50ndash60 of the peak stress within themid-height section of the specimen The stress at whichcracks developed was independent of 119881agg As the appliedload increased the initial crack propagated toward the topand bottom surfaces of the specimens As a result the failureof specimens after peak stress was governed by the timewhen the longitudinal crack joined the top and bottomsurfaces of the specimenThewidth of the longitudinal cracksincreased sharply at 80ndash85 of the peak stress whichwas accompanied by a rapid increase in the longitudinaland transverse strains as shown in Figure 2 The rates ofincrease in those strains increased as 119881agg decreased Withrapid increase in transverse strain the volumetric change ofthe specimens started to shift from compression to tensionThis threshold point was found to occur at approximately80 and 95 of the peak stress for concrete mixes with119881agg of 0 and 40 respectively This implies that therate of increase in transverse strain due to the opening oflongitudinal cracks decreases as119881agg increases After the peakstress failure tended to occur along the longitudinal crackswhich commonly formed in the pastes between the aggregateparticles The drop in stress subsequent to peak stress wasmore rapid in concrete mixes with 119881agg = 0 than those
4 The Scientific World Journal
0
02
04
06
08
1
12
minus0002 0002 0004 0006 0008
Strain
Longitudinal strainLateral strainVolumetric change
0
Nor
mal
ized
stre
ss (fcfc
)998400
Tension Compression
(a) Specimen of 25ndash100 (119881agg = 0)
minus0002 0002 0004 0006 00080
Strain
0
02
04
06
08
1
12
Longitudinal strainLateral strainVolumetric change
Nor
mal
ized
stre
ss (fcfc
)998400
Tension Compression
(b) Specimen of 25ndash30 (119881agg = 400)
Figure 2 Typical strain behavior of Ca(OH)2-activated Hwangtoh
concrete under axial compressive load
with119881agg = 40 Figure 2 also shows that aggregate interlockaction is expected along the longitudinal cracks
32 Compressive Strength Table 2 summarizes the test resultsincluding the compressive strength (1198911015840
119888)119864119888 and strains of the
Ca(OH)2-activatedHwangtoh concrete specimensThe value
of1198911015840119888increased by 189ndash252 times as the119882119861 ratio decreased
from 40 to 25 The rate of this increase also increasedgradually as 119881agg decreased At both 119882119861 ratios the con-crete specimens developed lower 1198911015840
119888than did OPC concrete
with no supplementary cementitious materials as shown inFigure 3 However the overall pattern of the decrease in 1198911015840
119888
corresponding to an increase in the 119882119861 ratio was similarin both concrete types The best-fit curve for 1198911015840
119888confirmed
that a119882119861 ratio not exceeding approximately 30 is requiredfor structural applications of Ca(OH)
2-activated Hwangtoh
concrete The 1198911015840119888of the test concrete also decreased as 119881agg
decreased (Table 2) at rates of 17 and 38 for119882119861 ratios
0
20
40
60
80
100
20 30 40 50 60 70 80
WB ratio ()
fc
(MPa
) Best fit curve forOPC concrete
Best fit line forCa(OH)2-activated Hwangtoh concrete
Ca(OH)2-activated Hwangtoh concrete
998400
OPC concrete (Yang et al 2010)
Figure 3 Effect of the water-to-binder ratio (119882119861) on compressivestrength (1198911015840
119888)
of 25 and 40 respectively as the 119878119886 ratio increased from30 to 100 The effect of 119881agg on 119891
1015840
119888was more prominent
for a higher 119882119861 ratio Higher coarse aggregate contentleads to lower shrinkage and lower bleeding resulting inless damage to the bond between the aggregate particles andpastes [8] Hence the coarse aggregate content is regarded asthe secondary factor influencing the strength development inconcrete especially for one with a higher119882119861 ratio
33 Stress-Strain Behavior The stress-strain curves obtainedfor the concrete mixes are plotted in Figure 4 The shape ofall curves was a second-degree parabola with its vertex at thepeak stress point However the slopes of the ascending anddescending branches of the curves heavily depended on the1198911015840
119888and 119881agg values Similar to observations on OPC concrete
[9ndash11] the curves were almost linear up to approximatelyone-half of the peak stress point showing that their initialslope increased as 1198911015840
119888andor 119881agg increased Normal-weight
aggregates possess elastic modulus values that are 15ndash50times higher than those of pastes [14] causing the initial slopeof the curves to rise with increase in 119881agg Additionally theslope of the descending branch was steeper and less steepwith increasing 1198911015840
119888and 119881agg respectively though a slightly
higher value of 1198911015840119888was obtained for the concrete mix with
a higher 119881agg value but the same 119882119861 ratio Overall thedescending branch of the curve for concrete mixes with119881agg = 0 (ie specimens 25ndash100 and 40ndash100) was veryshort compared to those for mixes with coarse aggregatesThese trends were more pronounced for a119882119861 ratio of 25than for 40 leading to the inference that the mechanicalinterlocking of the coarse aggregate along the cracks relivesthe brittle fracture (as indicated by the descending branch)and improves the compressive strength of the concrete
34 Modulus of Elasticity (119864119888) The relationship of 1198911015840
119888and
119864119888of the Ca(OH)
2-activated Hwangtoh concrete is shown
in Figure 5 The figure also shows the test data for normal-weight OPC concrete with 1198911015840
119888not exceeding 50MPa as well
as predictions made by Carreira and Chursquos model [9] In
The Scientific World Journal 5
0
5
10
15
20
25
30
35
40
0 0002 0004 0006 0008
Strain
Stre
ss (M
Pa)
25ndash10025ndash7525ndash60
25ndash4525ndash30
(a) 119882119861 = 25
0
5
10
15
20
25
30
35
40
0 0002 0004 0006 0008
Strain
Stre
ss (M
Pa)
40ndash10040ndash7540ndash60
40ndash4540ndash30
(b) 119882119861 = 40
Figure 4 Stress-strain curves measured for Ca(OH)2-activated
Hwangtoh concrete
0
10000
20000
30000
40000
50000
60000
0 10 20 30 40 50
f 998400c (MPa)
Ec
(MPa
)
OPC concrete
Predictions by Carreira and Chursquos model
Best fit curve forOPC concrete
Best fit curve forCa(OH)2-activated Hwangtoh concrete
Ca(OH)2-activated Hwangtoh concrete
Figure 5 Modulus of elasticity (119864119888) as a function of compressive
strength (1198911015840119888)
y = 3010x
R2 = 097
y = 3610x
R2 = 052
0
10000
20000
30000
40000
50000
3 4 5 6 7 8 9 10
(f998400c )05 times (1 + Vagg 100)
075 (MPa)
Ca(OH)2-activated Hwangtoh concrete
Ec
(MPa
)
OPC concrete (f 998400c = 15 50MPa)ndash
Figure 6 Regression analysis for modulus of elasticity (119864119888)
their model the unit weight (119908119888) of normal-weight concrete
was assumed to be 2300 kgm3 The 119864119888of the concrete was
commonly lower than the best-fit curves determined forOPCconcrete and predictions of Carreira andChursquosmodel [9]Thedevelopment of bond microcracks at the interfaces betweenpastes and aggregate particles accelerates the nonlinearity ofthe stress-strain curves [14] possibly causing the cohesionbetween them to be lower in Ca(OH)
2-activated Hwangtoh
binder than OPCIn general the 119864
119888of concrete can be expressed as a func-
tion of 1198911015840119888and 119908
119888[14] However it was difficult to determine
the effect of 119908119888on the 119864
119888of the tested Ca(OH)
2-activated
Hwangtoh concrete because the variation in the119908119888values (in
the test) was very minimal at the same119882119861 ratios rangingbetween 2419 and 2431 kgm3 2321 and 2335 kgm3 for119882119861ratios of 25 and 40 respectivelyMoreover119864
119888was affected
by 119881agg (showing a slightly lower value in specimens with an119878119886 ratio of 60 than those with an 119878119886 ratio of 45 at similar1198911015840
119888) owing to the considerably higher modulus of elasticity in
aggregates than in pastes when individually subjected to loadIn addition an increase in the continuous cracks joining thebondmicrocracks that developed at the interface between thepastes and aggregate particles leads to a faster rate of increasein strain [8] To formulate a simple equation for119864
119888 influential
parameters such as1198911015840119888and119881agg were repeatedly combined and
adjusted through a trial-and-error approach until a relativelyhigh correlation coefficient (1198772) was obtained Based on aregression analysis of the test results the 119864
119888of Ca(OH)
2-
activated Hwangtoh concrete with 1198911015840119888lt 40MPa can be
empirically expressed as follows (see Figure 6)
119864119888= 3010(119891
1015840
119888)05
(1 +
119881agg
100)
075
(MPa) (1)
35 Strain at Peak Stress (1205760) MacGregor and Wight [14]
established that 1205760of concrete increases with increase in 1198911015840
119888
This trend was also verified for the test case from the datalisted in Table 2 As a result the existent equations for 120576
0
have mostly been empirically developed only as a function of
6 The Scientific World Journal
Ca(OH)2-activated Hwangtoh concreteOPC concrete (f998400c = 15 50MPa)
y = 00344x + 00011
R2 = 0511
y = 008x
R2 = 093
0
00005
0001
00015
0002
00025
0003
00035
0004
00045
002 0025 003 0035 004 0045 005
(f998400cEc)05(1 + Vagg 100)
minus05
120576 0
ndash
Figure 7 Regression analysis for strain (1205760) at peak stress
1198911015840
119888 However Ca(OH)
2-activatedHwangtoh concrete demon-
strated higher values of 1205760than did OPC concrete with the
same 1198911015840119888 as shown in Figure 7 These 120576
0values also increased
slightly as119881agg decreased because the increase in paste volumereduced the 119864
119888and accelerated the nonlinearity of the stress-
strain curves especially after the development of longitudinalcracks However none of the predicted equations [9ndash11]consider the effect of 119881agg on the strain although the formeris evidently the secondary factor causing the increasing strainrate Based on a regression analysis of the test results the 120576
0
of Ca(OH)2-activated Hwangtoh concrete can be written as
follows (see Figure 7)
1205760= 008(
1198911015840
119888
119864119888
)
05
(1 +
119881agg
100)
minus05
(2)
4 Mathematical Equations for Stress-StrainRelations
Figure 4 confirms that the compressive stress-strain curveof Ca(OH)
2-activated Hwangtoh concrete is parabolic and
hump-shaped with its vertex at the peak stress point Thisphysically means that the tangential modulus of elasticityhas the maximum value at the origin gradually decreases tozero at the peak stress point and becomes negative throughthe descending branch of the curve In this study the sameassumption and the following nonlinear equation [9 11 12]were applied for generating a complete curve
119884 =(1205731+ 1)119883
1198831205731+1 + 1205731
(3)
where 119884(= 1198911198881198911015840
119888) is the normalized stress 119883(= 120576
1198881205760) is the
normalized strain and119891119888is the concrete stress corresponding
to strain 120576119888 Equation (3) gives the following physical mean-
ings (1) 119884 = 0 when 119883 = 0 representing the origin point(2) 119884 = 1 when 119883 = 1 representing the peak stress point
y = minus017x + 0166
R2 = 086
00000
00010
00020
00030
00040
00050
00060
00070
092 0925 093 0935 094
(f998400cEc)001(1 + Vagg 100)
minus003
120576 05
Figure 8 Regression analysis for 12057605
of Ca(OH)2-activated Hwang-
toh concrete
(3) 119889119891119888119889120576119888= 0 when119883 = 1 or at the peak stress point
Hence the factor 1205731in (3) is a key parameter for determining
the slopes of the ascending and descending branches of thecurve with its values commonly differing in each branchTo determine the slope of the ascending branch 119864
119888was
selected as the reference parameter Because 119864119888is defined as
a secant modulus joining the origin and 40 of the peakstress substituting it in (3) results in the following equationfor determining 120573
1for the ascending branch
04(119883119886)1205731+1
+ (04 minus 119883119886) 1205731minus 119883119886= 0 for 120576
119888le 1205760 (4)
where119883119886= 04119891
1015840
1198881198641198881205760
In contrast some reviews [12 18] concluded that thesecant modulus joining the origin and 50 of the peakstress can be regarded as an adequate reference point toderive the slope of the descending branch Hence the presentstudy formulated an equation for determining 120573
1for the
descending branch using the secant modulus at 051198911015840119888as the
reference point as follows
(119883119889)1205731+1
+ (1 minus 2119883119889) 1205731minus 2119883119889= 0 for 120576
119888gt 1205760 (5)
where 119883119889= 120576051205760and 12057605
is the strain corresponding to051198911015840119888after peak stress The values of 120573
1in the nonlinear
equations (4) and (5) can be calculated through numericalanalysis for the given material properties of 119864
119888 1205760 and 120576
05
41 Strain at 50 of Peak Stress in Descending Branch (12057605)
The slope of the descending branch of the curve depends on1198911015840
119888and 119881agg as inferred from Table 1 A regression analysis
was conducted using these parameters (as shown in Figure 8)similar to the procedure employed for 120576
0to propose a simple
equation for 12057605 yielding the following equation
12057605= minus017 [(
1198911015840
119888
119864119888
)
001
(1 +
119881agg
100)
minus003
] + 0166 (6)
42 Key Parameter (1205731) An analytical parametric study was
conducted to formulate 1205731 which determines the slopes
The Scientific World Journal 7
Table 3 Statistical values of NRMSEs calculated by comparing stress-strain curves of various models to experimental data
Error coefficientslowast Prediction modelsCarreira and Chu [9] Wee et al [11] Lu and Zhao [10] This study
120574119890119898
0238 0254 0259 0091120574119890119904
0075 0072 0050 0039lowast120574119890119898 and 120574119890119904 refer to the mean and standard deviation respectively of the NRMSE calculated for each specimen using the following equation
NRMSE = (1(119891119888)119898)sum [((119891119888)Exp minus (119891119888)Pre)2119899]12
where (119891119888)119898 is themean of themeasured stress (119891119888)Exp and (119891119888)Pre are experimental and predicted stressesrespectively and 119899 is the number of measured points
of the ascending and descending branches For given 1198911015840119888
and 119881agg the material properties of 119864119888 1205760 and 120576
05were
calculated using (1) (2) and (6) respectively Subsequentlythe two non-linear equations ((4) and (5)) were solvedusing the Newton-Raphson method Considering the prac-tical strength development in Ca(OH)
2-activated Hwangtoh
concrete the variables1198911015840119888and119881agg in the analytical parametric
study were selected to range between 10 and 50MPa and0 and 60 respectively Finally the analytically obtainedresults were statistically optimized to drive the following 120573
1
equations for the ascending branch (Figure 9(a)) and thedescending branch (Figure 9(b))
1205731= 033 explfloor065(
1198911015840
119888
1198910
)
05
(1 +
119881agg
100)
02
rfloor for 120576119888le 1205760
(7)
1205731= 043 explfloor21(
1198911015840
119888
1198910
)
05
(1 +
119881agg
100)
minus25
rfloor for 120576119888gt 1205760
(8)
where1198910(= 10MPa) is the reference value for the compressive
strength of concrete A higher value of 1205731in (3) produces
larger slopes of the ascending and descending branchesHence an increase in the value of 119881agg in (7) and (8) resultsin a higher value of 119864
119888and less steep slope of the descending
branch as observed in Figure 4In summary the compressive stress-strain relations for
unconfined Ca(OH)2-activated Hwangtoh concrete can be
generalized as follows
119891119888= [(1205731+ 1) (120576
1198881205760)
(1205761198881205760)1205731+1
+ 1205731
]1198911015840
119888 (9)
where 1205760and 120573
1are obtained using (2) and (7) or (8)
respectively The stress-strain relations proposed for theconcrete need to be reexamined for strengths of more than40MPa because these equations have been derived using thelimited test data pertaining to the present study
5 Comparisons of Model and Test Results
Figure 10 shows the typical comparisons of the predictedand measured curves for different 119882119861 ratios and 119881aggvalues The figure also displays the curves pertaining toprevious models [9ndash11] that were empirically formulatedusingOPC test data Table 3 lists themean (120574
119890119898) and standard
0 05 1 15 2 25 3 35 40
05
1
15
2
25
3
35
4
Best fit curvey = 033exp(065x)
R2 = 099
f998400c = 10 50MPaVagg = 0 60
1205731
(f998400cf0)05(1 + Vagg 100)
02
ndashndash
(a) For ascending branch
0
1
2
3
4
5
6
7
8
9
10
0 02 04 06 08 1 12
1205731
(f998400cf0)05(1 + Vagg 100)
25minus
Best fit curvey = 043exp(21x)
R2 = 098
f998400c = 10 50MPaVagg = 0 60
ndashndash
(b) For descending branch
Figure 9 Formulation of 1205731through numerical analysis
deviation (120574119890119904) of the normalized root-mean-square errors
(NRMSE) calculated for each stress-strain curve In generalthe previous models commonly overestimate the slope ofthe ascending branch and underestimate the value of 120576
0
This trend is more pronounced with the increase in 1198911015840119888and
decrease in119881agg Furthermore the equations proposed by [9]and Wee et al [11] overestimate the stress in the descendingbranch particularly for concrete with low119881agg Consequentlythe previous models yield high values for 120574
119890119898(gt0238) and
120574119890119904(gt0050) and are limited in their applicability toCa(OH)
2-
activated Hwangtoh concrete and the error associated withthem gradually increases as 119881agg decreases
In contrast to the previous models for OPC concrete thepredictions obtained from the proposedmodel for Ca(OH)
2-
activated Hwangtoh concrete are in better agreement with
8 The Scientific World Journal
0
5
10
15
20
25
30
35
0 0001 0002 0003
Strain
Stre
ss (M
Pa)
(a) Specimen 25ndash100 (119882119861 = 25 119881agg = 0)
Strain
Stre
ss (M
Pa)
0
5
10
15
20
25
30
35
40
0 0002 0004 0006 0008
(b) Specimen 25ndash30 (119882119861 = 25 119881agg = 40)
Strain
Stre
ss (M
Pa)
ExpCarreira and ChuWee et al
Lu and ZhaoThis study
0
2
4
6
8
10
12
14
0 0002 0004
(c) Specimen 40ndash100 (119882119861 = 40 119881agg = 0)
Strain
Stre
ss (M
Pa)
ExpCarreira and ChuWee et al
Lu and ZhaoThis study
0
5
10
15
20
25
0 0002 0004 0006
(d) Specimen 40ndash30 (119882119861 = 40 119881agg = 465)
Figure 10 Typical comparisons of predicted and measured stress-strain curves for various119882119861 ratio and 119881agg values
test results showing relatively higher accuracy for bothascending and descending branches judging from the con-siderably lower NRMSE values (0091 and 0039 for 120574
119890119898
and 120574119890119904 resp) These results are consistent with the actual
responses in particular they accurately reflect the effect of119881agg on 120576
0and the slopes of the ascending and descending
branches Hence the proposed model is useful for accuratelyevaluating the compressive stress-strain behavior of low- andmedium-strength Ca(OH)
2-activated Hwangtoh concrete
6 Conclusions
The present study examined the stress-strain behavior ofCa(OH)
2-activated Hwangtoh concrete with different 119882119861
and 119881agg values The 119864119888and 1205760values of the specimens were
compared to those of OPC concrete compiled by Yang et alBased on the experimental data a simple equation wasestablished to reasonably predict the stress-strain relations ofCa(OH)
2-activated Hwangtoh concrete under compression
The Scientific World Journal 9
though further verification is required for strengths of morethan 40MPa because of the limited data used for empiricalfitting From the experimental and comparative observationsthe following conclusions may be drawn
(1) For the same 119882119861 the 1198911015840119888of Ca(OH)
2-activated
Hwangtoh concrete was commonly lower than thatof OPC concrete however the test concrete gainedstrength development comparable to that of struc-tural concrete at a119882119861 less than 30
(2) With decrease in 119881agg the slope of the ascendingbranch of the stress-strain curve and 1198911015840
119888decreased
whereas 1205760and the declining slope of the descending
branch of the curve increased This observation wasmore pronounced as the119882119861 ratio increased
(3) Compared to OPC concrete with the same 1198911015840119888
Ca(OH)2-activated Hwangtoh concrete had lower 119864
119888
and larger 1205760 showing greater discrepancy as 119881agg
decreased Hence the119864119888and 1205760of Ca(OH)
2-activated
Hwangtoh concrete could be formulated as a functionof 1198911015840119888and 119881agg
(4) Previousmodels formulated usingOPC concrete datarevealed limitations in their applicability to Ca(OH)
2-
activated Hwangtoh concrete whereas the proposedstress-strain model predicted the actual behaviorquite accurately as evidenced by the much lowerNRMSE values
Conflict of Interests
The authors declare that they have no conflict of interestsregarding the publication of this paper
Acknowledgment
This research was supported by the Public Welfare and SafetyResearch Program through the National Research Founda-tion of Korea (NRF) funded by the Ministry of Science ICTand Future Planning (No 2013067519)
References
[1] B L Damineli F M Kemeid P S Aguiar and V M JohnldquoMeasuring the eco-efficiency of cement userdquo Cement andConcrete Composites vol 32 no 8 pp 555ndash562 2010
[2] E Gartner ldquoIndustrially interesting approaches to ldquolow-CO2rdquo
cementsrdquo Cement and Concrete Research vol 34 no 9 pp1489ndash1498 2004
[3] S O Ogbeide ldquoDeveloping an optimization model for CO2
reduction in cement production processrdquo Journal of EngineeringScience and Technology Review vol 3 no 1 pp 85ndash88 2010
[4] K H Yang J K Song and K I Song ldquoAssessment ofCO2reduction of alkali-activated concreterdquo Journal of Cleaner
Production vol 39 no 1 pp 265ndash272 2013[5] H Z Hwang A study on the method activating kaolin and
mortar amp concrete mixed with active kaolin [PhD thesis] SeoulNational University Seoul Republic of Korea 1997
[6] K-H Yang H-Z Hwang and S Lee ldquoEffects of water-binderratio and fine aggregate-total aggregate ratio on the propertiesof hwangtoh-based alkali-activated concreterdquo Journal of Mate-rials in Civil Engineering vol 22 no 9 pp 887ndash896 2010
[7] K-H Yang H-Z Hwang S-Y Kim and J-K Song ldquoDevelop-ment of a cementless mortar using hwangtoh binderrdquo Buildingand Environment vol 42 no 10 pp 3717ndash3725 2007
[8] AMNevilleProperties of Concrete AddisonWesley LongmanNew York NY USA 1995
[9] D J Carreira and K-H Chu ldquoStress-strain relationship forplain concrete in compressionrdquo Journal of the American Con-crete Institute vol 82 no 6 pp 797ndash804 1985
[10] Z-H Lu and Y-G Zhao ldquoEmpirical stress-strain model forunconfined high-strength concrete under uniaxial compres-sionrdquo Journal of Materials in Civil Engineering vol 22 no 11pp 1181ndash1186 2010
[11] T H Wee M S Chin and M A Mansur ldquoStress-strainrelationship of high-strength concrete in compressionrdquo Journalof Materials in Civil Engineering vol 8 no 2 pp 70ndash76 1996
[12] KH Yang and J I Sim ldquoModeling of themechanical propertiesof structural lightweight concrete based on size effectsrdquo TechRep Department of Plant Architectural Engineering KyonggiUniversity 2011
[13] P Dinakar P K Sahoo and G Sriram ldquoEffect of metakaolincontent on the properties of high strength concreterdquo Interna-tional Journal of Concrete Structures and Materials vol 7 no 3pp 215ndash223 2013
[14] J GMacGregor and J KWightReinforcedConcreteMechanicsand Design Prentice-Hall New York NY USA 2006
[15] T T Ghebrab and P Soroushian ldquoMechanical properties ofcement mortar development of structure-property relation-shipsrdquo International Journal of Concrete Structures and Materi-als vol 5 no 1 pp 3ndash10 2011
[16] K H Yang J H Mun and J K Song ldquoTests on cementlessalkali-activated slag concrete using lightweight aggregatesrdquoInternational Journal of Concrete Structures and Materials vol5 no 2 pp 125ndash131 2011
[17] ASTM C 143 C 469 Annual Book of ASTM Standards V 402ASTM International West Conshohocken Pa USA 2012
[18] A vanGysel and L Taerwe ldquoAnalytical formulation of the com-plete stress-strain curve for high strength concreterdquo Materialsand Structures vol 29 no 193 pp 529ndash533 1996
International Journal of
AerospaceEngineeringHindawi Publishing Corporationhttpwwwhindawicom Volume 2014
RoboticsJournal of
Hindawi Publishing Corporationhttpwwwhindawicom Volume 2014
Hindawi Publishing Corporationhttpwwwhindawicom Volume 2014
Active and Passive Electronic Components
Control Scienceand Engineering
Journal of
Hindawi Publishing Corporationhttpwwwhindawicom Volume 2014
International Journal of
RotatingMachinery
Hindawi Publishing Corporationhttpwwwhindawicom Volume 2014
Hindawi Publishing Corporation httpwwwhindawicom
Journal ofEngineeringVolume 2014
Submit your manuscripts athttpwwwhindawicom
VLSI Design
Hindawi Publishing Corporationhttpwwwhindawicom Volume 2014
Hindawi Publishing Corporationhttpwwwhindawicom Volume 2014
Shock and Vibration
Hindawi Publishing Corporationhttpwwwhindawicom Volume 2014
Civil EngineeringAdvances in
Acoustics and VibrationAdvances in
Hindawi Publishing Corporationhttpwwwhindawicom Volume 2014
Hindawi Publishing Corporationhttpwwwhindawicom Volume 2014
Electrical and Computer Engineering
Journal of
Advances inOptoElectronics
Hindawi Publishing Corporation httpwwwhindawicom
Volume 2014
The Scientific World JournalHindawi Publishing Corporation httpwwwhindawicom Volume 2014
SensorsJournal of
Hindawi Publishing Corporationhttpwwwhindawicom Volume 2014
Modelling amp Simulation in EngineeringHindawi Publishing Corporation httpwwwhindawicom Volume 2014
Hindawi Publishing Corporationhttpwwwhindawicom Volume 2014
Chemical EngineeringInternational Journal of Antennas and
Propagation
International Journal of
Hindawi Publishing Corporationhttpwwwhindawicom Volume 2014
Hindawi Publishing Corporationhttpwwwhindawicom Volume 2014
Navigation and Observation
International Journal of
Hindawi Publishing Corporationhttpwwwhindawicom Volume 2014
DistributedSensor Networks
International Journal of

2 The Scientific World Journal
Table 1 Chemical composition of Hwangtoh ( by mass)
SiO2 Al2O3 Fe2O3 CaO MgO K2O Na2O TiO2 MnO LOIlowast
5250 3290 431 040 437 150 200 069 024 109lowastLoss on ignition
Table 2 Details of Ca(OH)2-activated Hwangtoh concrete mix proportions and summary of test results
Group Specimenlowast 119882119861 () 119878119886 () 119881agg () Unit weight (kgm3)119908119888(kgm3) 1198911015840
119888(MPa) 119864
119888(MPa) 120576
012057605
119882 119861 119878 119866 119878119901
I
25ndash100
25
100 00
180 720
1469 0
108
2419 308 17468 00033 0003825ndash75 75 143 1102 372 2424 331 18563 00031 0004225ndash60 60 229 882 595 2426 350 19873 00032 0004825ndash45 45 314 661 818 2429 350 22040 00028 0005425ndash30 30 400 441 1041 2431 369 23607 00028 00062
II
40ndash100
40
100 00
180 450
1709 0
54
2321 122 10241 00026 0005240ndash75 75 166 1281 432 2326 157 13822 00025 0005040ndash60 60 266 1025 691 2329 166 15737 00023 0005640ndash45 45 366 769 951 2332 175 16382 00023 0006140ndash30 30 465 513 1210 2335 195 17043 00024 00066
119882119861 water-to-binder ratio by weight 119878119886 fine aggregate-to-total aggregate ratio by volume 119881agg volumetric ratio of coarse aggregate119882 water 119861 binder119878 fine aggregate 119866 coarse aggregate 119878119901 polycarboxylate-based high-range water-reducing admixture 119908119888 dry density of concrete 119891
1015840
119888 compressive strength
119864119888 modulus of elasticity 1205760 strain at peak stress and 12057605 strain corresponding to 051198911015840119888after the peak stress
lowastIn specimen names the first and second parts refer to the119882119861 ratio and 119878119886 ratio respectively for example 25ndash75 refers to Ca(OH)2-activated Hwangtohconcrete mix with119882119861 and 119878119886 ratios of 25 and 75 respectively
particular the compressive stress-strain relations of concreteincorporating a new binder should definitely be evaluatedfor use in the rational analysis and design of structuralelements because the cohesion between pastes and aggregateparticles significantly influences the extent of increase instrain due to the applied load [8] The stress-strain rela-tions are typically understood through various experimentsand formulated using simple equations However no suchexperimental observations on the stress-strain relations ofCa(OH)
2-activated Hwangtoh concrete are available in exist-
ing literatureThe objective of the present study is to propose a simple
and rational model for obtaining the nonlinear stress-straincurves for Ca(OH)
2-activated Hwangtoh concrete under
compression To formulate the key factor determining theslopes of the ascending and descending branches of thecurves 10 concrete mixes were prepared with a range ofwater-to-binder (119882119861) ratios by weight and fine aggregate-to-total aggregate ratios (119878119886) by volume The developedmodel was then compared with existing models [9ndash11] thatwere empirically derived from the test data on OPC concreteFurthermore the modulus of elasticity and strain at peakstress of Ca(OH)
2-activated Hwangtoh concrete were com-
pared with those of OPC concrete collected from a variety ofspecimens [12] with compressive strength in similar ranges
2 Experimental Program
21Materials Hwangtoh acquired high pozzolanic reactivityas a result of its calcination at a temperature of 850∘Cusing theHoffmanmethodThe calcinated Hwangtoh which was used
as a source material was activated by 75 Ca(OH)2 This
Hwangtoh contained less calcium oxide (CaO) but was richin both silicon oxide (SiO
2) and aluminium oxide (Al
2O3)
as inferred from Table 1 This indicates that the chemicalcomposition of Hwangtoh is very similar to that of fly ashandor metakaolin [13] All dry powdered alkali activatorswere preblended with the source materials in dry form
The measurement of the physical properties of materialsrevealed the specific gravity and specific surface area ofHwangtoh to be 28 and 3200 cm2g respectivelyThe specificgravity fineness modulus and water absorption of the sand(used as the fine aggregate) were 242 251 and 17respectively and those of the crushed granite (used as thecoarse aggregate with a maximum size of 19mm) were26 675 and 11 respectively The specific gravity andmaximum particle sizes of Ca(OH)
2were 224 and 212 120583m
respectively
22 Specimen Mix Characteristics In general with increasein the compressive strength of concrete the initial slope of itsstress-strain curve increases whereas the descending branchof the curves after peak stress has a more rapidly decreasingslope [14] Moreover concrete displays higher modulus ofelasticity (119864
119888) and smaller strain (120576
0) values at peak stress
than do mortars and pastes indicating that the volumetricratio of the coarse aggregates (119881agg) directly affects the stress-strain curve of concrete[15 16] Considering these criticalfactors the 10 cementless concrete mixes using Ca(OH)
2-
activated Hwangtoh binder were prepared with a range of119882119861 and 119878119886 ratios as listed in Table 2 The selected 119882119861ratios were 25 and 40 and within each of these ratios the
The Scientific World Journal 3
P (Load)
Concrete specimen(Φ100 times 200mm)
Electrical resistancestrain gauge
Compressometer
Steel plates
LVDT(for longitudinaldisplacement)
100
200
100
UTM bed
Spherical hinge
(for transverseLVDT
displacement)
Figure 1 Test setup and instrumentation for test region (all dimensions are in mm)
119878119886 ratio of the mixes for each119882119861 ratio varied from 30 to100 in intervals of 15 The concrete specimen with an 119878119886ratio of 100 indicates a mortar without coarse aggregatesAs a result 119881agg ranged between 0 and 400 and 0and 465 for119882119861 ratios of 25 and 40 respectively Theunit water content was fixed at 180 kgm3 for all concretemixes To achieve workability of the mixes for casting apolycarboxylate-based high-range water-reducing agent wasadded with binder ratio by weight of 15 and 12 forconcretemixes with119882119861 ratios of 25 and 40 respectively
23 Testing All concrete specimens were mixed using a panmixer of 035m3 capacity and equipped with rubber wiperblades The initial slump of fresh concrete was measured inaccordance with the ASTMC143 provision [17] Immediatelyafter casting all specimens used for plotting the stress-straincurve were cured at a constant temperature and relativehumidity of 23 plusmn 2∘C and 70 plusmn 5 respectively until testingat an age of 28 days All steel moulds were removed after1 day The stress-strain curve was recorded using 100 times200mm cylindrical concrete specimens equipped with acompressor meter comprising linear variable differentialtransducers (LVDTs) of 50mm capacity on both sides asshown in Figure 1 The compressometer was combined witha convenient unbounded device for measuring transversestrain Electrical resistance strain gages with gage length of75mm were also attached to the specimens Prior to testingboth ends of each cylinder were leveled using a grindingmachine Concentric load was applied using a universaltesting machine of 500 kN capacity equipped with a closed-loop servocontrol system Each specimen was preloaded to20 of its compressive strength after which its position wasadjusted based on strain gage and LVDT readings to achievea concentric axial load A spherical hinge was also positionedbetween the testing machine head and the specimens to
minimize eccentricity in case of a large deformation Toobtain a complete stress-strain curve a low strain rate of20times10
minus4 permin was employed Testing was continued untilthe final crushing of the concrete All test data were capturedby a data logger and stored automatically Using themeasuredstress-strain curve the 119864
119888was calculated at 40 peak stress
in accordance with the ASTM C469 provision [17]
3 Test Results and Discussion
31 General Behavior and Crack Propagation Longitudinalcracking started at 50ndash60 of the peak stress within themid-height section of the specimen The stress at whichcracks developed was independent of 119881agg As the appliedload increased the initial crack propagated toward the topand bottom surfaces of the specimens As a result the failureof specimens after peak stress was governed by the timewhen the longitudinal crack joined the top and bottomsurfaces of the specimenThewidth of the longitudinal cracksincreased sharply at 80ndash85 of the peak stress whichwas accompanied by a rapid increase in the longitudinaland transverse strains as shown in Figure 2 The rates ofincrease in those strains increased as 119881agg decreased Withrapid increase in transverse strain the volumetric change ofthe specimens started to shift from compression to tensionThis threshold point was found to occur at approximately80 and 95 of the peak stress for concrete mixes with119881agg of 0 and 40 respectively This implies that therate of increase in transverse strain due to the opening oflongitudinal cracks decreases as119881agg increases After the peakstress failure tended to occur along the longitudinal crackswhich commonly formed in the pastes between the aggregateparticles The drop in stress subsequent to peak stress wasmore rapid in concrete mixes with 119881agg = 0 than those
4 The Scientific World Journal
0
02
04
06
08
1
12
minus0002 0002 0004 0006 0008
Strain
Longitudinal strainLateral strainVolumetric change
0
Nor
mal
ized
stre
ss (fcfc
)998400
Tension Compression
(a) Specimen of 25ndash100 (119881agg = 0)
minus0002 0002 0004 0006 00080
Strain
0
02
04
06
08
1
12
Longitudinal strainLateral strainVolumetric change
Nor
mal
ized
stre
ss (fcfc
)998400
Tension Compression
(b) Specimen of 25ndash30 (119881agg = 400)
Figure 2 Typical strain behavior of Ca(OH)2-activated Hwangtoh
concrete under axial compressive load
with119881agg = 40 Figure 2 also shows that aggregate interlockaction is expected along the longitudinal cracks
32 Compressive Strength Table 2 summarizes the test resultsincluding the compressive strength (1198911015840
119888)119864119888 and strains of the
Ca(OH)2-activatedHwangtoh concrete specimensThe value
of1198911015840119888increased by 189ndash252 times as the119882119861 ratio decreased
from 40 to 25 The rate of this increase also increasedgradually as 119881agg decreased At both 119882119861 ratios the con-crete specimens developed lower 1198911015840
119888than did OPC concrete
with no supplementary cementitious materials as shown inFigure 3 However the overall pattern of the decrease in 1198911015840
119888
corresponding to an increase in the 119882119861 ratio was similarin both concrete types The best-fit curve for 1198911015840
119888confirmed
that a119882119861 ratio not exceeding approximately 30 is requiredfor structural applications of Ca(OH)
2-activated Hwangtoh
concrete The 1198911015840119888of the test concrete also decreased as 119881agg
decreased (Table 2) at rates of 17 and 38 for119882119861 ratios
0
20
40
60
80
100
20 30 40 50 60 70 80
WB ratio ()
fc
(MPa
) Best fit curve forOPC concrete
Best fit line forCa(OH)2-activated Hwangtoh concrete
Ca(OH)2-activated Hwangtoh concrete
998400
OPC concrete (Yang et al 2010)
Figure 3 Effect of the water-to-binder ratio (119882119861) on compressivestrength (1198911015840
119888)
of 25 and 40 respectively as the 119878119886 ratio increased from30 to 100 The effect of 119881agg on 119891
1015840
119888was more prominent
for a higher 119882119861 ratio Higher coarse aggregate contentleads to lower shrinkage and lower bleeding resulting inless damage to the bond between the aggregate particles andpastes [8] Hence the coarse aggregate content is regarded asthe secondary factor influencing the strength development inconcrete especially for one with a higher119882119861 ratio
33 Stress-Strain Behavior The stress-strain curves obtainedfor the concrete mixes are plotted in Figure 4 The shape ofall curves was a second-degree parabola with its vertex at thepeak stress point However the slopes of the ascending anddescending branches of the curves heavily depended on the1198911015840
119888and 119881agg values Similar to observations on OPC concrete
[9ndash11] the curves were almost linear up to approximatelyone-half of the peak stress point showing that their initialslope increased as 1198911015840
119888andor 119881agg increased Normal-weight
aggregates possess elastic modulus values that are 15ndash50times higher than those of pastes [14] causing the initial slopeof the curves to rise with increase in 119881agg Additionally theslope of the descending branch was steeper and less steepwith increasing 1198911015840
119888and 119881agg respectively though a slightly
higher value of 1198911015840119888was obtained for the concrete mix with
a higher 119881agg value but the same 119882119861 ratio Overall thedescending branch of the curve for concrete mixes with119881agg = 0 (ie specimens 25ndash100 and 40ndash100) was veryshort compared to those for mixes with coarse aggregatesThese trends were more pronounced for a119882119861 ratio of 25than for 40 leading to the inference that the mechanicalinterlocking of the coarse aggregate along the cracks relivesthe brittle fracture (as indicated by the descending branch)and improves the compressive strength of the concrete
34 Modulus of Elasticity (119864119888) The relationship of 1198911015840
119888and
119864119888of the Ca(OH)
2-activated Hwangtoh concrete is shown
in Figure 5 The figure also shows the test data for normal-weight OPC concrete with 1198911015840
119888not exceeding 50MPa as well
as predictions made by Carreira and Chursquos model [9] In
The Scientific World Journal 5
0
5
10
15
20
25
30
35
40
0 0002 0004 0006 0008
Strain
Stre
ss (M
Pa)
25ndash10025ndash7525ndash60
25ndash4525ndash30
(a) 119882119861 = 25
0
5
10
15
20
25
30
35
40
0 0002 0004 0006 0008
Strain
Stre
ss (M
Pa)
40ndash10040ndash7540ndash60
40ndash4540ndash30
(b) 119882119861 = 40
Figure 4 Stress-strain curves measured for Ca(OH)2-activated
Hwangtoh concrete
0
10000
20000
30000
40000
50000
60000
0 10 20 30 40 50
f 998400c (MPa)
Ec
(MPa
)
OPC concrete
Predictions by Carreira and Chursquos model
Best fit curve forOPC concrete
Best fit curve forCa(OH)2-activated Hwangtoh concrete
Ca(OH)2-activated Hwangtoh concrete
Figure 5 Modulus of elasticity (119864119888) as a function of compressive
strength (1198911015840119888)
y = 3010x
R2 = 097
y = 3610x
R2 = 052
0
10000
20000
30000
40000
50000
3 4 5 6 7 8 9 10
(f998400c )05 times (1 + Vagg 100)
075 (MPa)
Ca(OH)2-activated Hwangtoh concrete
Ec
(MPa
)
OPC concrete (f 998400c = 15 50MPa)ndash
Figure 6 Regression analysis for modulus of elasticity (119864119888)
their model the unit weight (119908119888) of normal-weight concrete
was assumed to be 2300 kgm3 The 119864119888of the concrete was
commonly lower than the best-fit curves determined forOPCconcrete and predictions of Carreira andChursquosmodel [9]Thedevelopment of bond microcracks at the interfaces betweenpastes and aggregate particles accelerates the nonlinearity ofthe stress-strain curves [14] possibly causing the cohesionbetween them to be lower in Ca(OH)
2-activated Hwangtoh
binder than OPCIn general the 119864
119888of concrete can be expressed as a func-
tion of 1198911015840119888and 119908
119888[14] However it was difficult to determine
the effect of 119908119888on the 119864
119888of the tested Ca(OH)
2-activated
Hwangtoh concrete because the variation in the119908119888values (in
the test) was very minimal at the same119882119861 ratios rangingbetween 2419 and 2431 kgm3 2321 and 2335 kgm3 for119882119861ratios of 25 and 40 respectivelyMoreover119864
119888was affected
by 119881agg (showing a slightly lower value in specimens with an119878119886 ratio of 60 than those with an 119878119886 ratio of 45 at similar1198911015840
119888) owing to the considerably higher modulus of elasticity in
aggregates than in pastes when individually subjected to loadIn addition an increase in the continuous cracks joining thebondmicrocracks that developed at the interface between thepastes and aggregate particles leads to a faster rate of increasein strain [8] To formulate a simple equation for119864
119888 influential
parameters such as1198911015840119888and119881agg were repeatedly combined and
adjusted through a trial-and-error approach until a relativelyhigh correlation coefficient (1198772) was obtained Based on aregression analysis of the test results the 119864
119888of Ca(OH)
2-
activated Hwangtoh concrete with 1198911015840119888lt 40MPa can be
empirically expressed as follows (see Figure 6)
119864119888= 3010(119891
1015840
119888)05
(1 +
119881agg
100)
075
(MPa) (1)
35 Strain at Peak Stress (1205760) MacGregor and Wight [14]
established that 1205760of concrete increases with increase in 1198911015840
119888
This trend was also verified for the test case from the datalisted in Table 2 As a result the existent equations for 120576
0
have mostly been empirically developed only as a function of
6 The Scientific World Journal
Ca(OH)2-activated Hwangtoh concreteOPC concrete (f998400c = 15 50MPa)
y = 00344x + 00011
R2 = 0511
y = 008x
R2 = 093
0
00005
0001
00015
0002
00025
0003
00035
0004
00045
002 0025 003 0035 004 0045 005
(f998400cEc)05(1 + Vagg 100)
minus05
120576 0
ndash
Figure 7 Regression analysis for strain (1205760) at peak stress
1198911015840
119888 However Ca(OH)
2-activatedHwangtoh concrete demon-
strated higher values of 1205760than did OPC concrete with the
same 1198911015840119888 as shown in Figure 7 These 120576
0values also increased
slightly as119881agg decreased because the increase in paste volumereduced the 119864
119888and accelerated the nonlinearity of the stress-
strain curves especially after the development of longitudinalcracks However none of the predicted equations [9ndash11]consider the effect of 119881agg on the strain although the formeris evidently the secondary factor causing the increasing strainrate Based on a regression analysis of the test results the 120576
0
of Ca(OH)2-activated Hwangtoh concrete can be written as
follows (see Figure 7)
1205760= 008(
1198911015840
119888
119864119888
)
05
(1 +
119881agg
100)
minus05
(2)
4 Mathematical Equations for Stress-StrainRelations
Figure 4 confirms that the compressive stress-strain curveof Ca(OH)
2-activated Hwangtoh concrete is parabolic and
hump-shaped with its vertex at the peak stress point Thisphysically means that the tangential modulus of elasticityhas the maximum value at the origin gradually decreases tozero at the peak stress point and becomes negative throughthe descending branch of the curve In this study the sameassumption and the following nonlinear equation [9 11 12]were applied for generating a complete curve
119884 =(1205731+ 1)119883
1198831205731+1 + 1205731
(3)
where 119884(= 1198911198881198911015840
119888) is the normalized stress 119883(= 120576
1198881205760) is the
normalized strain and119891119888is the concrete stress corresponding
to strain 120576119888 Equation (3) gives the following physical mean-
ings (1) 119884 = 0 when 119883 = 0 representing the origin point(2) 119884 = 1 when 119883 = 1 representing the peak stress point
y = minus017x + 0166
R2 = 086
00000
00010
00020
00030
00040
00050
00060
00070
092 0925 093 0935 094
(f998400cEc)001(1 + Vagg 100)
minus003
120576 05
Figure 8 Regression analysis for 12057605
of Ca(OH)2-activated Hwang-
toh concrete
(3) 119889119891119888119889120576119888= 0 when119883 = 1 or at the peak stress point
Hence the factor 1205731in (3) is a key parameter for determining
the slopes of the ascending and descending branches of thecurve with its values commonly differing in each branchTo determine the slope of the ascending branch 119864
119888was
selected as the reference parameter Because 119864119888is defined as
a secant modulus joining the origin and 40 of the peakstress substituting it in (3) results in the following equationfor determining 120573
1for the ascending branch
04(119883119886)1205731+1
+ (04 minus 119883119886) 1205731minus 119883119886= 0 for 120576
119888le 1205760 (4)
where119883119886= 04119891
1015840
1198881198641198881205760
In contrast some reviews [12 18] concluded that thesecant modulus joining the origin and 50 of the peakstress can be regarded as an adequate reference point toderive the slope of the descending branch Hence the presentstudy formulated an equation for determining 120573
1for the
descending branch using the secant modulus at 051198911015840119888as the
reference point as follows
(119883119889)1205731+1
+ (1 minus 2119883119889) 1205731minus 2119883119889= 0 for 120576
119888gt 1205760 (5)
where 119883119889= 120576051205760and 12057605
is the strain corresponding to051198911015840119888after peak stress The values of 120573
1in the nonlinear
equations (4) and (5) can be calculated through numericalanalysis for the given material properties of 119864
119888 1205760 and 120576
05
41 Strain at 50 of Peak Stress in Descending Branch (12057605)
The slope of the descending branch of the curve depends on1198911015840
119888and 119881agg as inferred from Table 1 A regression analysis
was conducted using these parameters (as shown in Figure 8)similar to the procedure employed for 120576
0to propose a simple
equation for 12057605 yielding the following equation
12057605= minus017 [(
1198911015840
119888
119864119888
)
001
(1 +
119881agg
100)
minus003
] + 0166 (6)
42 Key Parameter (1205731) An analytical parametric study was
conducted to formulate 1205731 which determines the slopes
The Scientific World Journal 7
Table 3 Statistical values of NRMSEs calculated by comparing stress-strain curves of various models to experimental data
Error coefficientslowast Prediction modelsCarreira and Chu [9] Wee et al [11] Lu and Zhao [10] This study
120574119890119898
0238 0254 0259 0091120574119890119904
0075 0072 0050 0039lowast120574119890119898 and 120574119890119904 refer to the mean and standard deviation respectively of the NRMSE calculated for each specimen using the following equation
NRMSE = (1(119891119888)119898)sum [((119891119888)Exp minus (119891119888)Pre)2119899]12
where (119891119888)119898 is themean of themeasured stress (119891119888)Exp and (119891119888)Pre are experimental and predicted stressesrespectively and 119899 is the number of measured points
of the ascending and descending branches For given 1198911015840119888
and 119881agg the material properties of 119864119888 1205760 and 120576
05were
calculated using (1) (2) and (6) respectively Subsequentlythe two non-linear equations ((4) and (5)) were solvedusing the Newton-Raphson method Considering the prac-tical strength development in Ca(OH)
2-activated Hwangtoh
concrete the variables1198911015840119888and119881agg in the analytical parametric
study were selected to range between 10 and 50MPa and0 and 60 respectively Finally the analytically obtainedresults were statistically optimized to drive the following 120573
1
equations for the ascending branch (Figure 9(a)) and thedescending branch (Figure 9(b))
1205731= 033 explfloor065(
1198911015840
119888
1198910
)
05
(1 +
119881agg
100)
02
rfloor for 120576119888le 1205760
(7)
1205731= 043 explfloor21(
1198911015840
119888
1198910
)
05
(1 +
119881agg
100)
minus25
rfloor for 120576119888gt 1205760
(8)
where1198910(= 10MPa) is the reference value for the compressive
strength of concrete A higher value of 1205731in (3) produces
larger slopes of the ascending and descending branchesHence an increase in the value of 119881agg in (7) and (8) resultsin a higher value of 119864
119888and less steep slope of the descending
branch as observed in Figure 4In summary the compressive stress-strain relations for
unconfined Ca(OH)2-activated Hwangtoh concrete can be
generalized as follows
119891119888= [(1205731+ 1) (120576
1198881205760)
(1205761198881205760)1205731+1
+ 1205731
]1198911015840
119888 (9)
where 1205760and 120573
1are obtained using (2) and (7) or (8)
respectively The stress-strain relations proposed for theconcrete need to be reexamined for strengths of more than40MPa because these equations have been derived using thelimited test data pertaining to the present study
5 Comparisons of Model and Test Results
Figure 10 shows the typical comparisons of the predictedand measured curves for different 119882119861 ratios and 119881aggvalues The figure also displays the curves pertaining toprevious models [9ndash11] that were empirically formulatedusingOPC test data Table 3 lists themean (120574
119890119898) and standard
0 05 1 15 2 25 3 35 40
05
1
15
2
25
3
35
4
Best fit curvey = 033exp(065x)
R2 = 099
f998400c = 10 50MPaVagg = 0 60
1205731
(f998400cf0)05(1 + Vagg 100)
02
ndashndash
(a) For ascending branch
0
1
2
3
4
5
6
7
8
9
10
0 02 04 06 08 1 12
1205731
(f998400cf0)05(1 + Vagg 100)
25minus
Best fit curvey = 043exp(21x)
R2 = 098
f998400c = 10 50MPaVagg = 0 60
ndashndash
(b) For descending branch
Figure 9 Formulation of 1205731through numerical analysis
deviation (120574119890119904) of the normalized root-mean-square errors
(NRMSE) calculated for each stress-strain curve In generalthe previous models commonly overestimate the slope ofthe ascending branch and underestimate the value of 120576
0
This trend is more pronounced with the increase in 1198911015840119888and
decrease in119881agg Furthermore the equations proposed by [9]and Wee et al [11] overestimate the stress in the descendingbranch particularly for concrete with low119881agg Consequentlythe previous models yield high values for 120574
119890119898(gt0238) and
120574119890119904(gt0050) and are limited in their applicability toCa(OH)
2-
activated Hwangtoh concrete and the error associated withthem gradually increases as 119881agg decreases
In contrast to the previous models for OPC concrete thepredictions obtained from the proposedmodel for Ca(OH)
2-
activated Hwangtoh concrete are in better agreement with
8 The Scientific World Journal
0
5
10
15
20
25
30
35
0 0001 0002 0003
Strain
Stre
ss (M
Pa)
(a) Specimen 25ndash100 (119882119861 = 25 119881agg = 0)
Strain
Stre
ss (M
Pa)
0
5
10
15
20
25
30
35
40
0 0002 0004 0006 0008
(b) Specimen 25ndash30 (119882119861 = 25 119881agg = 40)
Strain
Stre
ss (M
Pa)
ExpCarreira and ChuWee et al
Lu and ZhaoThis study
0
2
4
6
8
10
12
14
0 0002 0004
(c) Specimen 40ndash100 (119882119861 = 40 119881agg = 0)
Strain
Stre
ss (M
Pa)
ExpCarreira and ChuWee et al
Lu and ZhaoThis study
0
5
10
15
20
25
0 0002 0004 0006
(d) Specimen 40ndash30 (119882119861 = 40 119881agg = 465)
Figure 10 Typical comparisons of predicted and measured stress-strain curves for various119882119861 ratio and 119881agg values
test results showing relatively higher accuracy for bothascending and descending branches judging from the con-siderably lower NRMSE values (0091 and 0039 for 120574
119890119898
and 120574119890119904 resp) These results are consistent with the actual
responses in particular they accurately reflect the effect of119881agg on 120576
0and the slopes of the ascending and descending
branches Hence the proposed model is useful for accuratelyevaluating the compressive stress-strain behavior of low- andmedium-strength Ca(OH)
2-activated Hwangtoh concrete
6 Conclusions
The present study examined the stress-strain behavior ofCa(OH)
2-activated Hwangtoh concrete with different 119882119861
and 119881agg values The 119864119888and 1205760values of the specimens were
compared to those of OPC concrete compiled by Yang et alBased on the experimental data a simple equation wasestablished to reasonably predict the stress-strain relations ofCa(OH)
2-activated Hwangtoh concrete under compression
The Scientific World Journal 9
though further verification is required for strengths of morethan 40MPa because of the limited data used for empiricalfitting From the experimental and comparative observationsthe following conclusions may be drawn
(1) For the same 119882119861 the 1198911015840119888of Ca(OH)
2-activated
Hwangtoh concrete was commonly lower than thatof OPC concrete however the test concrete gainedstrength development comparable to that of struc-tural concrete at a119882119861 less than 30
(2) With decrease in 119881agg the slope of the ascendingbranch of the stress-strain curve and 1198911015840
119888decreased
whereas 1205760and the declining slope of the descending
branch of the curve increased This observation wasmore pronounced as the119882119861 ratio increased
(3) Compared to OPC concrete with the same 1198911015840119888
Ca(OH)2-activated Hwangtoh concrete had lower 119864
119888
and larger 1205760 showing greater discrepancy as 119881agg
decreased Hence the119864119888and 1205760of Ca(OH)
2-activated
Hwangtoh concrete could be formulated as a functionof 1198911015840119888and 119881agg
(4) Previousmodels formulated usingOPC concrete datarevealed limitations in their applicability to Ca(OH)
2-
activated Hwangtoh concrete whereas the proposedstress-strain model predicted the actual behaviorquite accurately as evidenced by the much lowerNRMSE values
Conflict of Interests
The authors declare that they have no conflict of interestsregarding the publication of this paper
Acknowledgment
This research was supported by the Public Welfare and SafetyResearch Program through the National Research Founda-tion of Korea (NRF) funded by the Ministry of Science ICTand Future Planning (No 2013067519)
References
[1] B L Damineli F M Kemeid P S Aguiar and V M JohnldquoMeasuring the eco-efficiency of cement userdquo Cement andConcrete Composites vol 32 no 8 pp 555ndash562 2010
[2] E Gartner ldquoIndustrially interesting approaches to ldquolow-CO2rdquo
cementsrdquo Cement and Concrete Research vol 34 no 9 pp1489ndash1498 2004
[3] S O Ogbeide ldquoDeveloping an optimization model for CO2
reduction in cement production processrdquo Journal of EngineeringScience and Technology Review vol 3 no 1 pp 85ndash88 2010
[4] K H Yang J K Song and K I Song ldquoAssessment ofCO2reduction of alkali-activated concreterdquo Journal of Cleaner
Production vol 39 no 1 pp 265ndash272 2013[5] H Z Hwang A study on the method activating kaolin and
mortar amp concrete mixed with active kaolin [PhD thesis] SeoulNational University Seoul Republic of Korea 1997
[6] K-H Yang H-Z Hwang and S Lee ldquoEffects of water-binderratio and fine aggregate-total aggregate ratio on the propertiesof hwangtoh-based alkali-activated concreterdquo Journal of Mate-rials in Civil Engineering vol 22 no 9 pp 887ndash896 2010
[7] K-H Yang H-Z Hwang S-Y Kim and J-K Song ldquoDevelop-ment of a cementless mortar using hwangtoh binderrdquo Buildingand Environment vol 42 no 10 pp 3717ndash3725 2007
[8] AMNevilleProperties of Concrete AddisonWesley LongmanNew York NY USA 1995
[9] D J Carreira and K-H Chu ldquoStress-strain relationship forplain concrete in compressionrdquo Journal of the American Con-crete Institute vol 82 no 6 pp 797ndash804 1985
[10] Z-H Lu and Y-G Zhao ldquoEmpirical stress-strain model forunconfined high-strength concrete under uniaxial compres-sionrdquo Journal of Materials in Civil Engineering vol 22 no 11pp 1181ndash1186 2010
[11] T H Wee M S Chin and M A Mansur ldquoStress-strainrelationship of high-strength concrete in compressionrdquo Journalof Materials in Civil Engineering vol 8 no 2 pp 70ndash76 1996
[12] KH Yang and J I Sim ldquoModeling of themechanical propertiesof structural lightweight concrete based on size effectsrdquo TechRep Department of Plant Architectural Engineering KyonggiUniversity 2011
[13] P Dinakar P K Sahoo and G Sriram ldquoEffect of metakaolincontent on the properties of high strength concreterdquo Interna-tional Journal of Concrete Structures and Materials vol 7 no 3pp 215ndash223 2013
[14] J GMacGregor and J KWightReinforcedConcreteMechanicsand Design Prentice-Hall New York NY USA 2006
[15] T T Ghebrab and P Soroushian ldquoMechanical properties ofcement mortar development of structure-property relation-shipsrdquo International Journal of Concrete Structures and Materi-als vol 5 no 1 pp 3ndash10 2011
[16] K H Yang J H Mun and J K Song ldquoTests on cementlessalkali-activated slag concrete using lightweight aggregatesrdquoInternational Journal of Concrete Structures and Materials vol5 no 2 pp 125ndash131 2011
[17] ASTM C 143 C 469 Annual Book of ASTM Standards V 402ASTM International West Conshohocken Pa USA 2012
[18] A vanGysel and L Taerwe ldquoAnalytical formulation of the com-plete stress-strain curve for high strength concreterdquo Materialsand Structures vol 29 no 193 pp 529ndash533 1996
International Journal of
AerospaceEngineeringHindawi Publishing Corporationhttpwwwhindawicom Volume 2014
RoboticsJournal of
Hindawi Publishing Corporationhttpwwwhindawicom Volume 2014
Hindawi Publishing Corporationhttpwwwhindawicom Volume 2014
Active and Passive Electronic Components
Control Scienceand Engineering
Journal of
Hindawi Publishing Corporationhttpwwwhindawicom Volume 2014
International Journal of
RotatingMachinery
Hindawi Publishing Corporationhttpwwwhindawicom Volume 2014
Hindawi Publishing Corporation httpwwwhindawicom
Journal ofEngineeringVolume 2014
Submit your manuscripts athttpwwwhindawicom
VLSI Design
Hindawi Publishing Corporationhttpwwwhindawicom Volume 2014
Hindawi Publishing Corporationhttpwwwhindawicom Volume 2014
Shock and Vibration
Hindawi Publishing Corporationhttpwwwhindawicom Volume 2014
Civil EngineeringAdvances in
Acoustics and VibrationAdvances in
Hindawi Publishing Corporationhttpwwwhindawicom Volume 2014
Hindawi Publishing Corporationhttpwwwhindawicom Volume 2014
Electrical and Computer Engineering
Journal of
Advances inOptoElectronics
Hindawi Publishing Corporation httpwwwhindawicom
Volume 2014
The Scientific World JournalHindawi Publishing Corporation httpwwwhindawicom Volume 2014
SensorsJournal of
Hindawi Publishing Corporationhttpwwwhindawicom Volume 2014
Modelling amp Simulation in EngineeringHindawi Publishing Corporation httpwwwhindawicom Volume 2014
Hindawi Publishing Corporationhttpwwwhindawicom Volume 2014
Chemical EngineeringInternational Journal of Antennas and
Propagation
International Journal of
Hindawi Publishing Corporationhttpwwwhindawicom Volume 2014
Hindawi Publishing Corporationhttpwwwhindawicom Volume 2014
Navigation and Observation
International Journal of
Hindawi Publishing Corporationhttpwwwhindawicom Volume 2014
DistributedSensor Networks
International Journal of
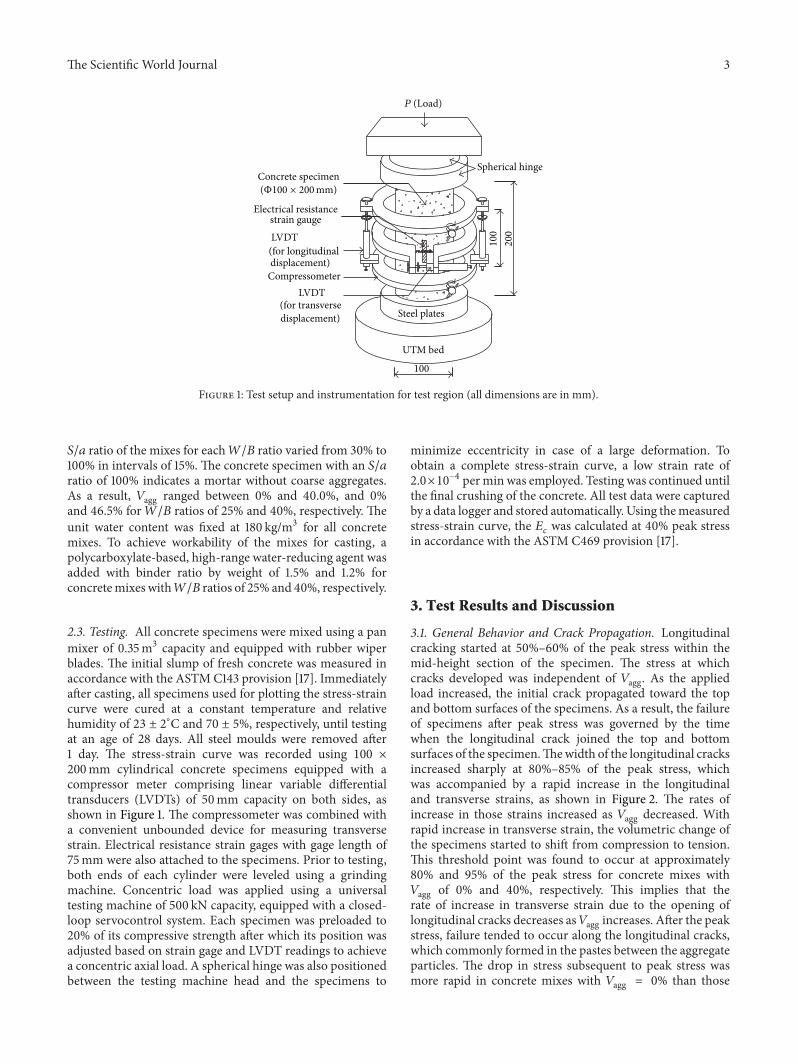
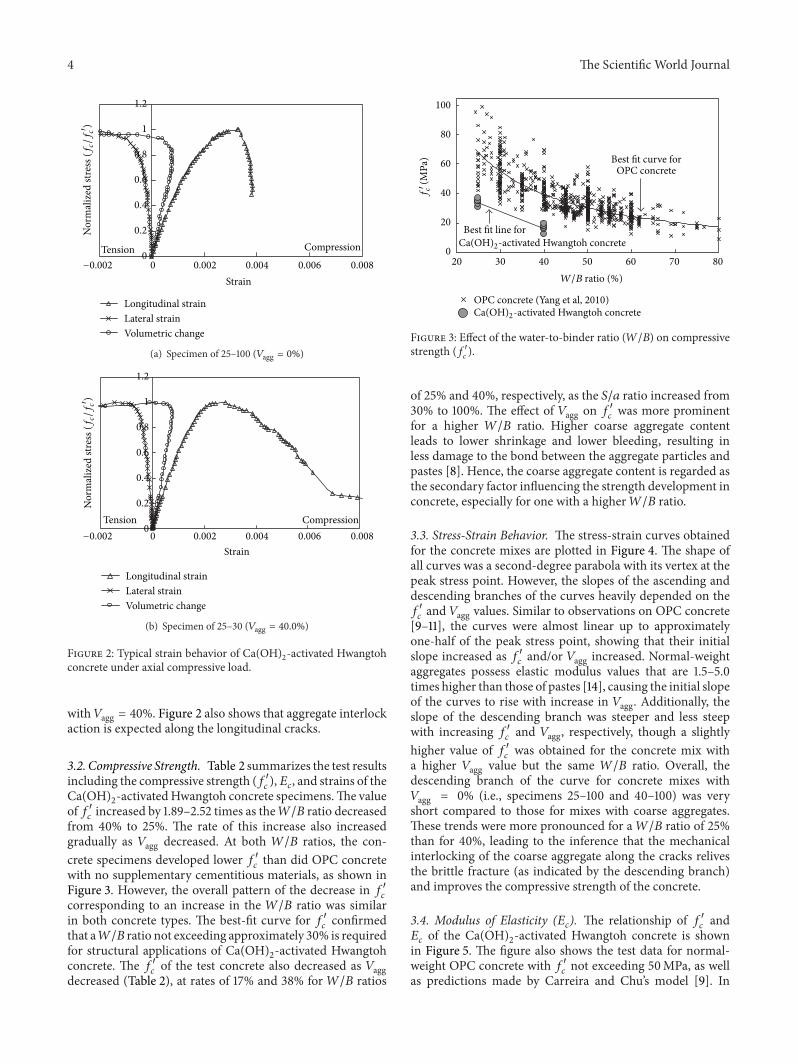
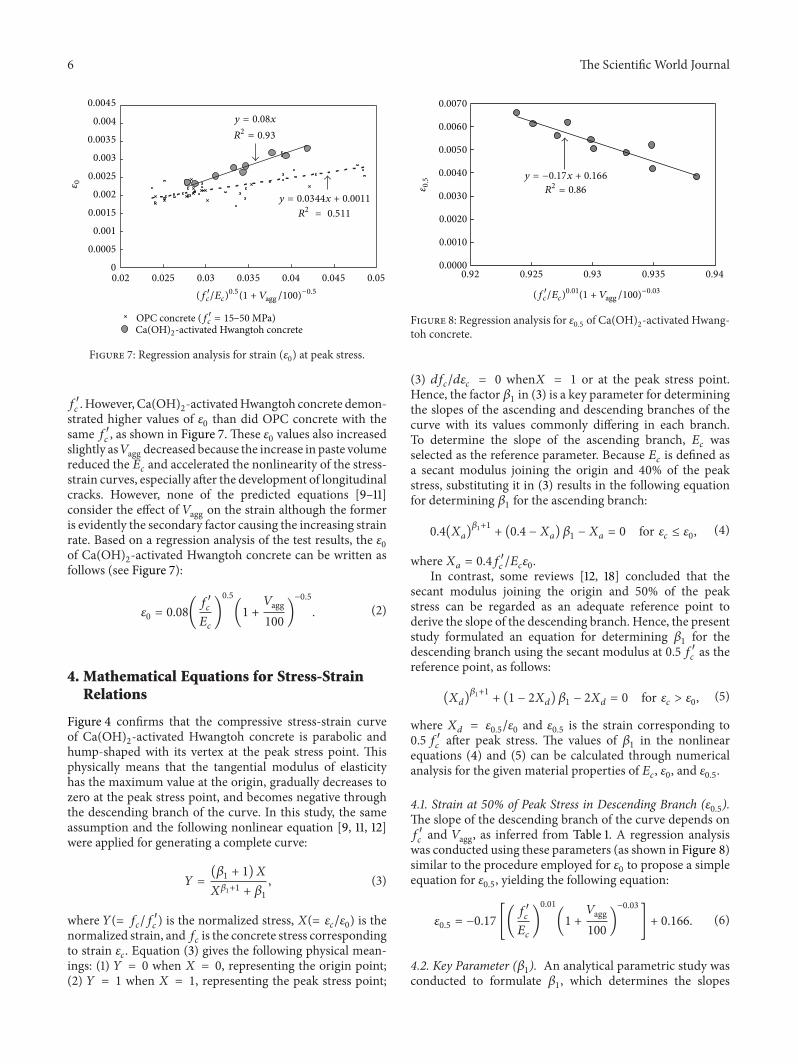

International Journal of
AerospaceEngineeringHindawi Publishing Corporationhttpwwwhindawicom Volume 2014
RoboticsJournal of
Hindawi Publishing Corporationhttpwwwhindawicom Volume 2014
Hindawi Publishing Corporationhttpwwwhindawicom Volume 2014
Active and Passive Electronic Components
Control Scienceand Engineering
Journal of
Hindawi Publishing Corporationhttpwwwhindawicom Volume 2014
International Journal of
RotatingMachinery
Hindawi Publishing Corporationhttpwwwhindawicom Volume 2014
Hindawi Publishing Corporation httpwwwhindawicom
Journal ofEngineeringVolume 2014
Submit your manuscripts athttpwwwhindawicom
VLSI Design
Hindawi Publishing Corporationhttpwwwhindawicom Volume 2014
Hindawi Publishing Corporationhttpwwwhindawicom Volume 2014
Shock and Vibration
Hindawi Publishing Corporationhttpwwwhindawicom Volume 2014
Civil EngineeringAdvances in
Acoustics and VibrationAdvances in
Hindawi Publishing Corporationhttpwwwhindawicom Volume 2014
Hindawi Publishing Corporationhttpwwwhindawicom Volume 2014
Electrical and Computer Engineering
Journal of
Advances inOptoElectronics
Hindawi Publishing Corporation httpwwwhindawicom
Volume 2014
The Scientific World JournalHindawi Publishing Corporation httpwwwhindawicom Volume 2014
SensorsJournal of
Hindawi Publishing Corporationhttpwwwhindawicom Volume 2014
Modelling amp Simulation in EngineeringHindawi Publishing Corporation httpwwwhindawicom Volume 2014
Hindawi Publishing Corporationhttpwwwhindawicom Volume 2014
Chemical EngineeringInternational Journal of Antennas and
Propagation
International Journal of
Hindawi Publishing Corporationhttpwwwhindawicom Volume 2014
Hindawi Publishing Corporationhttpwwwhindawicom Volume 2014
Navigation and Observation
International Journal of
Hindawi Publishing Corporationhttpwwwhindawicom Volume 2014
DistributedSensor Networks
International Journal of