Research Article Open Access Structural and ...
21
149 Journal of Basic and Environmental Sciences 4 (2017) 149-169 ISSN Online: 2356-6388 Print: 2536-9202 Research Article Open Access Structural and Lithostratigraphic evolution of Al Baraka Oil field, Komombo Basin, Upper Egypt as deduce from 2D seismic lines and well logging data Mo’men A. 1 , Darwish M. 2 , Abdelhady A. 3 , Mahmoud A. Essa 1 1 Geology Department, Faculty of Science, Assiut University, Assiut 71516, Egypt 2 Geology Department, Faculty of Science, Cairo University, Cairo, Egypt 3 DEA Egypt, Cairo, Egypt Email: [email protected] Abstract Twenty 2D seismic lines were interpreted with three well velocities and time-depth trace conversion to characterize the different stratigraphic tops of Komombo basin and to highlight the major structural elements. Five depth structure contour maps were constructed on the tops of Pre-Cambrian Basement, Neocomian, Aptian and Albian/Cenomanian sequences. The interpretations of depth structure contour maps show two main fault trends: NW-SE and NE to ENE directions. The NW-SE trend is the dominant one, creating a half-graben system with two major bounding faults. The northeast one is downthrown to the southwest, while the southwestern bounding fault is downthrown to the northeast. The restoration of the structure patterns and sediment fill evolution in Komombo basin is attempted using the 2D seismic lines in background, integrated with the well data (Al Baraka-1 and Komombo-3). A series of flattened profiles on top of Pre-Cambrian Basement, Neocomian, Barremian, Aptian, Albian/Cenomanian, Turonian, Coniacian/Santonian, and Campanian/Maastrichtian successions supported the identification of basin dimensions during its development through the main tectonic phases. Keywords: Komombo basin, Al Baraka Oil Field, Seismic Interpretation, Structure, Lithostratigraphic, Upper Egypt. Received; 5 Jan. 2017, In Revised form; 1 Feb. 2017, Accepted; 1 Feb. 2017, Available online 1 April, 2017 1. Introduction Komombo concession area is located in Upper Egypt about 570 km south of Cairo and 65 km NNW of Aswan Town and covers an area around 11, 446 km². The area is well served by a paved road to Cairo, Aswan and the Red Sea Coast and by air connections through Aswan airport to Cairo. Al Baraka Oil Filed occupies the eastern part of the Komombo basin. It lies between latitudes 24 ◦ 38` and 24 ◦ 40` 30`` N, and longitudes 32 ◦ 46` and 32 ◦ 50` 30`` E (Fig.1), It is one of a series of intracontinental rift basins straddling the river Nile such as the Beni Suef and Asyut basins (Bosworth et al. 2008). The study area is located on the eastern part of the Komombo basin (Fig. 1). It was part of a larger former Repsol concession which was relinquished in 2001 after the drilling of three wells in this area. These wells are located in a NW–SE trending half graben. After Centurion obtained exploration rights on Komombo block in 2004, additional 2D seismic and 3D seismic acquisition and processing were done. Despite this, the geologic evolution, geometry, and petroleum system of the basin remain poorly understood [1] and the basin still represents a unique petroleum activity in South Egypt. The aim of the present study is to integrated 2D seismic data and wire-line logs of selected wells to construct the structure-tectonic maps. This is to characterize the different stratigraphic tops in the Komombo basin fill sequence. The detailed structural elements and the reconstruction of the evolution history and basin fill will be highlighted in order to understand the petroleum system in this new basin.
Transcript of Research Article Open Access Structural and ...
149
Journal of Basic and Environmental Sciences 4 (2017) 149-169
ISSN
Online: 2356-6388
Print: 2536-9202
Research Article Open Access
Structural and Lithostratigraphic evolution of Al Baraka Oil field, KomomboBasin, Upper Egypt as deduce from 2D seismic lines and well logging data
Mo’men A.1, Darwish M.2, Abdelhady A.3, Mahmoud A. Essa1
1 Geology Department, Faculty of Science, Assiut University, Assiut 71516, Egypt2 Geology Department, Faculty of Science, Cairo University, Cairo, Egypt3 DEA Egypt, Cairo, EgyptEmail: [email protected]
Abstract
Twenty 2D seismic lines were interpreted with three well velocities and time-depth trace conversion to characterize thedifferent stratigraphic tops of Komombo basin and to highlight the major structural elements. Five depth structurecontour maps were constructed on the tops of Pre-Cambrian Basement, Neocomian, Aptian and Albian/Cenomaniansequences. The interpretations of depth structure contour maps show two main fault trends: NW-SE and NE to ENEdirections. The NW-SE trend is the dominant one, creating a half-graben system with two major bounding faults. Thenortheast one is downthrown to the southwest, while the southwestern bounding fault is downthrown to the northeast.
The restoration of the structure patterns and sediment fill evolution in Komombo basin is attempted using the 2Dseismic lines in background, integrated with the well data (Al Baraka-1 and Komombo-3). A series of flattened profileson top of Pre-Cambrian Basement, Neocomian, Barremian, Aptian, Albian/Cenomanian, Turonian, Coniacian/Santonian,and Campanian/Maastrichtian successions supported the identification of basin dimensions during its developmentthrough the main tectonic phases.
Keywords: Komombo basin, Al Baraka Oil Field, Seismic Interpretation, Structure, Lithostratigraphic, Upper Egypt.
Received; 5 Jan. 2017, In Revised form; 1 Feb. 2017, Accepted; 1 Feb. 2017, Available online 1 April, 20171. Introduction
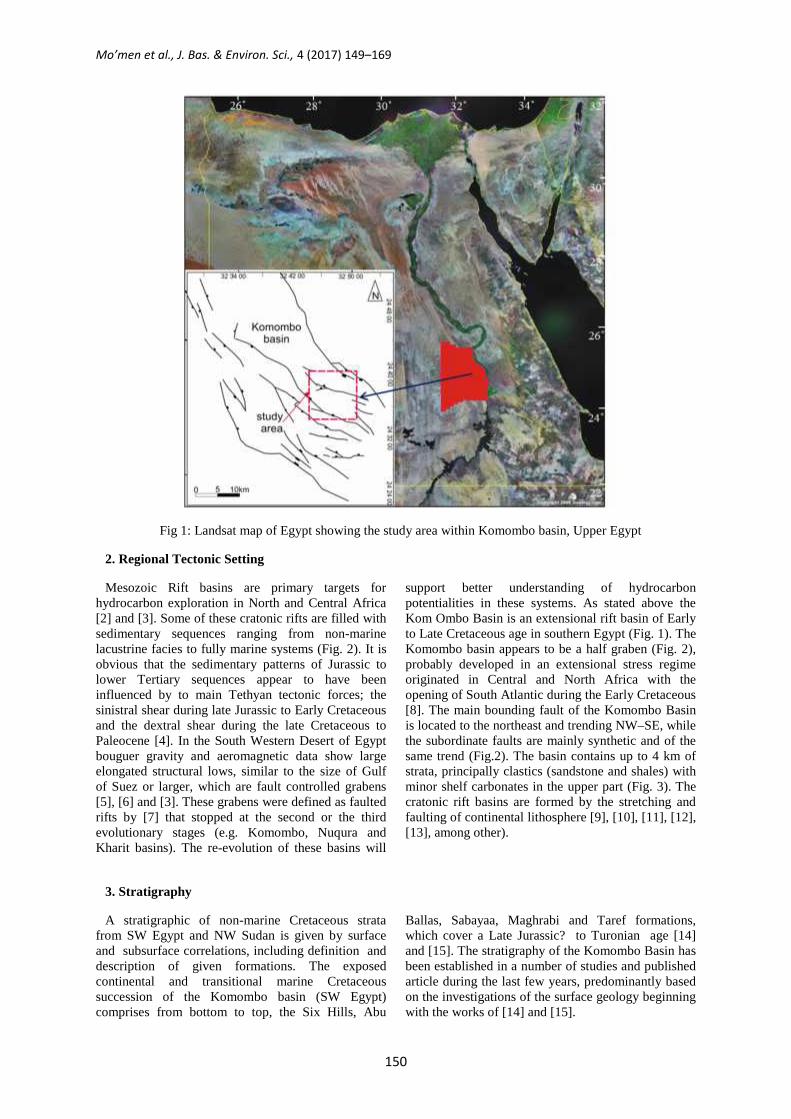
Komombo concession area is located in UpperEgypt about 570 km south of Cairo and 65 km NNWof Aswan Town and covers an area around 11, 446km². The area is well served by a paved road to Cairo,Aswan and the Red Sea Coast and by air connectionsthrough Aswan airport to Cairo. Al Baraka Oil Filedoccupies the eastern part of the Komombo basin. Itlies between latitudes 24◦ 38` and 24◦ 40` 30`` N, andlongitudes 32◦ 46` and 32◦ 50` 30`` E (Fig.1), It is oneof a series of intracontinental rift basins straddling theriver Nile such as the Beni Suef and Asyut basins(Bosworth et al. 2008).
The study area is located on the eastern part of theKomombo basin (Fig. 1). It was part of a largerformer Repsol concession which was relinquished in2001 after the drilling of three wells in this area.
These wells are located in a NW–SE trending halfgraben. After Centurion obtained exploration rightson Komombo block in 2004, additional 2D seismicand 3D seismic acquisition and processing were done.Despite this, the geologic evolution, geometry, andpetroleum system of the basin remain poorlyunderstood [1] and the basin still represents a uniquepetroleum activity in South Egypt.
The aim of the present study is to integrated 2Dseismic data and wire-line logs of selected wells toconstruct the structure-tectonic maps. This is tocharacterize the different stratigraphic tops in theKomombo basin fill sequence. The detailed structuralelements and the reconstruction of the evolutionhistory and basin fill will be highlighted in order tounderstand the petroleum system in this new basin.
Mo’men et al., J. Bas. & Environ. Sci., 4 (2017) 149–169
150
Fig 1: Landsat map of Egypt showing the study area within Komombo basin, Upper Egypt
2. Regional Tectonic Setting
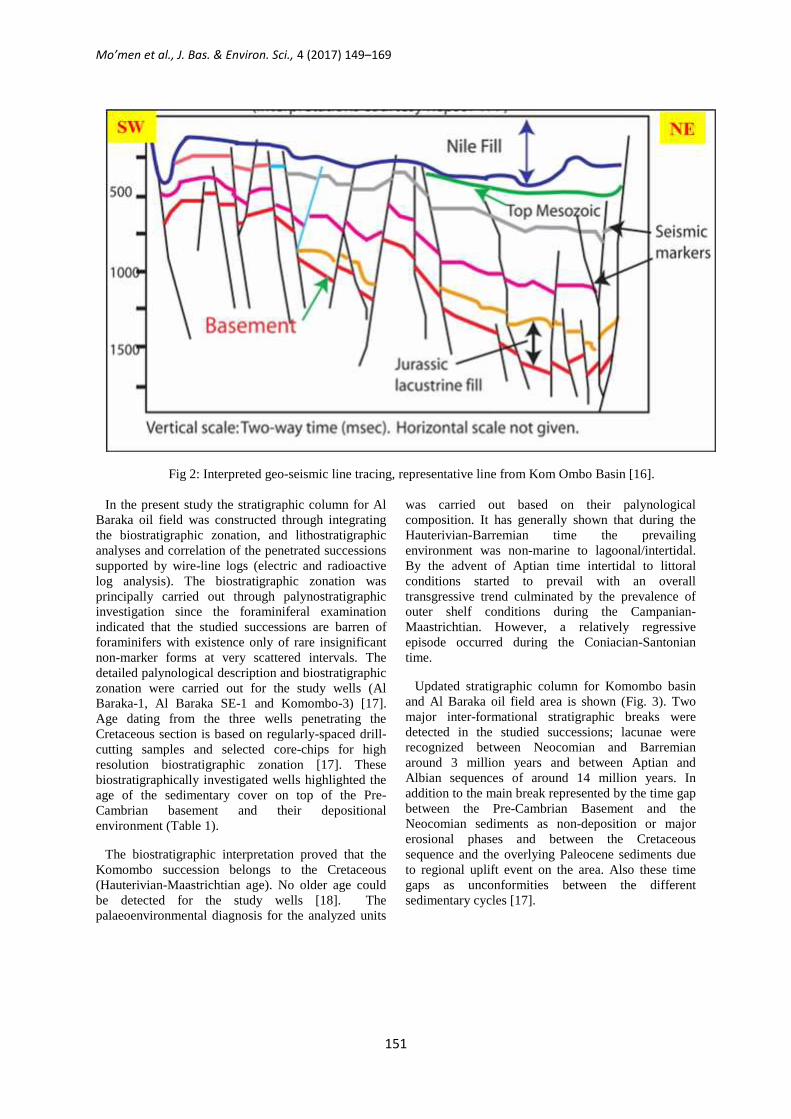
Mesozoic Rift basins are primary targets forhydrocarbon exploration in North and Central Africa[2] and [3]. Some of these cratonic rifts are filled withsedimentary sequences ranging from non-marinelacustrine facies to fully marine systems (Fig. 2). It isobvious that the sedimentary patterns of Jurassic tolower Tertiary sequences appear to have beeninfluenced by to main Tethyan tectonic forces; thesinistral shear during late Jurassic to Early Cretaceousand the dextral shear during the late Cretaceous toPaleocene [4]. In the South Western Desert of Egyptbouguer gravity and aeromagnetic data show largeelongated structural lows, similar to the size of Gulfof Suez or larger, which are fault controlled grabens[5], [6] and [3]. These grabens were defined as faultedrifts by [7] that stopped at the second or the thirdevolutionary stages (e.g. Komombo, Nuqura andKharit basins). The re-evolution of these basins will
support better understanding of hydrocarbonpotentialities in these systems. As stated above theKom Ombo Basin is an extensional rift basin of Earlyto Late Cretaceous age in southern Egypt (Fig. 1). TheKomombo basin appears to be a half graben (Fig. 2),probably developed in an extensional stress regimeoriginated in Central and North Africa with theopening of South Atlantic during the Early Cretaceous[8]. The main bounding fault of the Komombo Basinis located to the northeast and trending NW–SE, whilethe subordinate faults are mainly synthetic and of thesame trend (Fig.2). The basin contains up to 4 km ofstrata, principally clastics (sandstone and shales) withminor shelf carbonates in the upper part (Fig. 3). Thecratonic rift basins are formed by the stretching andfaulting of continental lithosphere [9], [10], [11], [12],[13], among other).
3. Stratigraphy
A stratigraphic of non-marine Cretaceous stratafrom SW Egypt and NW Sudan is given by surfaceand subsurface correlations, including definition anddescription of given formations. The exposedcontinental and transitional marine Cretaceoussuccession of the Komombo basin (SW Egypt)comprises from bottom to top, the Six Hills, Abu
Ballas, Sabayaa, Maghrabi and Taref formations,which cover a Late Jurassic? to Turonian age [14]and [15]. The stratigraphy of the Komombo Basin hasbeen established in a number of studies and publishedarticle during the last few years, predominantly basedon the investigations of the surface geology beginningwith the works of [14] and [15].
Mo’men et al., J. Bas. & Environ. Sci., 4 (2017) 149–169
151
Fig 2: Interpreted geo-seismic line tracing, representative line from Kom Ombo Basin [16].
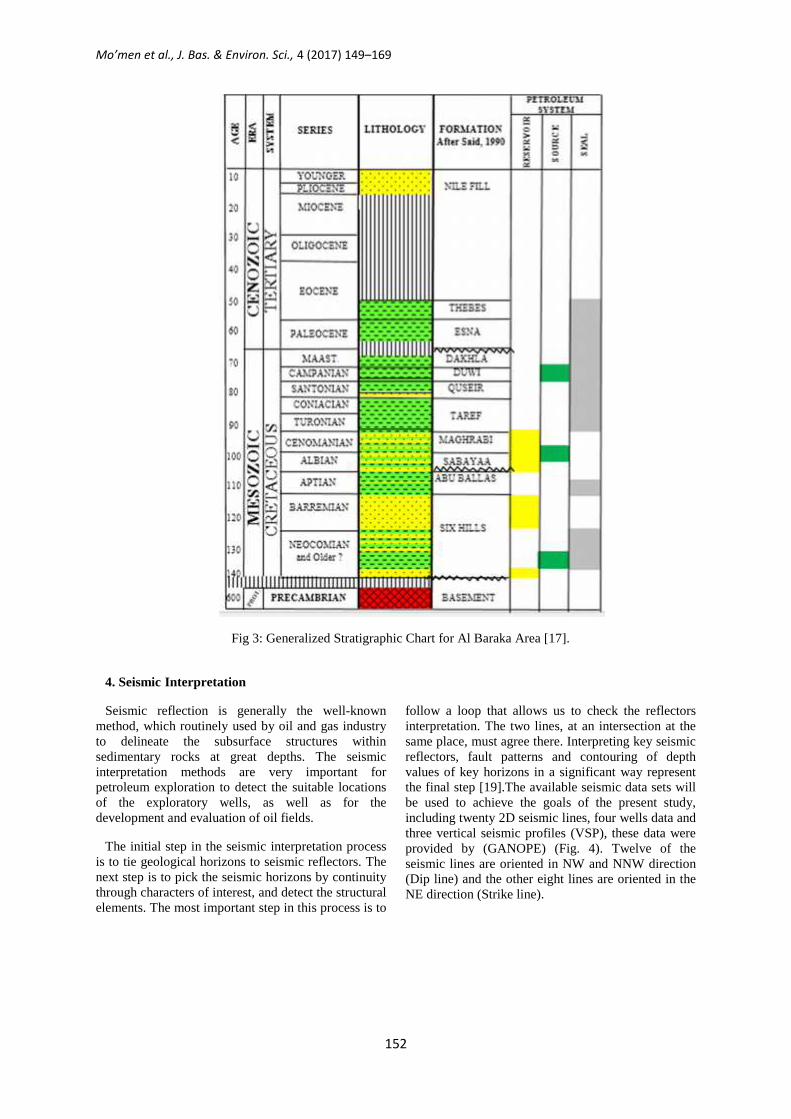
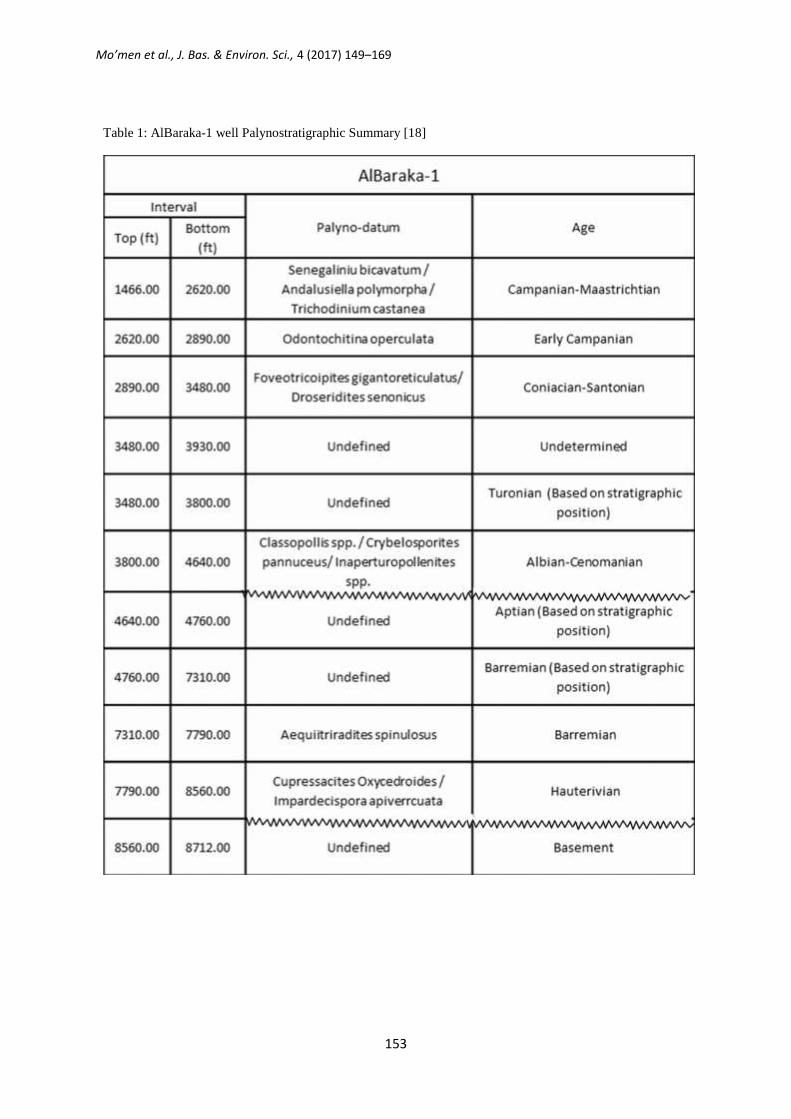
In the present study the stratigraphic column for AlBaraka oil field was constructed through integratingthe biostratigraphic zonation, and lithostratigraphicanalyses and correlation of the penetrated successionssupported by wire-line logs (electric and radioactivelog analysis). The biostratigraphic zonation wasprincipally carried out through palynostratigraphicinvestigation since the foraminiferal examinationindicated that the studied successions are barren offoraminifers with existence only of rare insignificantnon-marker forms at very scattered intervals. Thedetailed palynological description and biostratigraphiczonation were carried out for the study wells (AlBaraka-1, Al Baraka SE-1 and Komombo-3) [17].Age dating from the three wells penetrating theCretaceous section is based on regularly-spaced drill-cutting samples and selected core-chips for highresolution biostratigraphic zonation [17]. Thesebiostratigraphically investigated wells highlighted theage of the sedimentary cover on top of the Pre-Cambrian basement and their depositionalenvironment (Table 1).
The biostratigraphic interpretation proved that theKomombo succession belongs to the Cretaceous(Hauterivian-Maastrichtian age). No older age couldbe detected for the study wells [18]. Thepalaeoenvironmental diagnosis for the analyzed units
was carried out based on their palynologicalcomposition. It has generally shown that during theHauterivian-Barremian time the prevailingenvironment was non-marine to lagoonal/intertidal.By the advent of Aptian time intertidal to littoralconditions started to prevail with an overalltransgressive trend culminated by the prevalence ofouter shelf conditions during the Campanian-Maastrichtian. However, a relatively regressiveepisode occurred during the Coniacian-Santoniantime.
Updated stratigraphic column for Komombo basinand Al Baraka oil field area is shown (Fig. 3). Twomajor inter-formational stratigraphic breaks weredetected in the studied successions; lacunae wererecognized between Neocomian and Barremianaround 3 million years and between Aptian andAlbian sequences of around 14 million years. Inaddition to the main break represented by the time gapbetween the Pre-Cambrian Basement and theNeocomian sediments as non-deposition or majorerosional phases and between the Cretaceoussequence and the overlying Paleocene sediments dueto regional uplift event on the area. Also these timegaps as unconformities between the differentsedimentary cycles [17].
Mo’men et al., J. Bas. & Environ. Sci., 4 (2017) 149–169
152
Fig 3: Generalized Stratigraphic Chart for Al Baraka Area [17].
4. Seismic Interpretation
Seismic reflection is generally the well-knownmethod, which routinely used by oil and gas industryto delineate the subsurface structures withinsedimentary rocks at great depths. The seismicinterpretation methods are very important forpetroleum exploration to detect the suitable locationsof the exploratory wells, as well as for thedevelopment and evaluation of oil fields.
The initial step in the seismic interpretation processis to tie geological horizons to seismic reflectors. Thenext step is to pick the seismic horizons by continuitythrough characters of interest, and detect the structuralelements. The most important step in this process is to
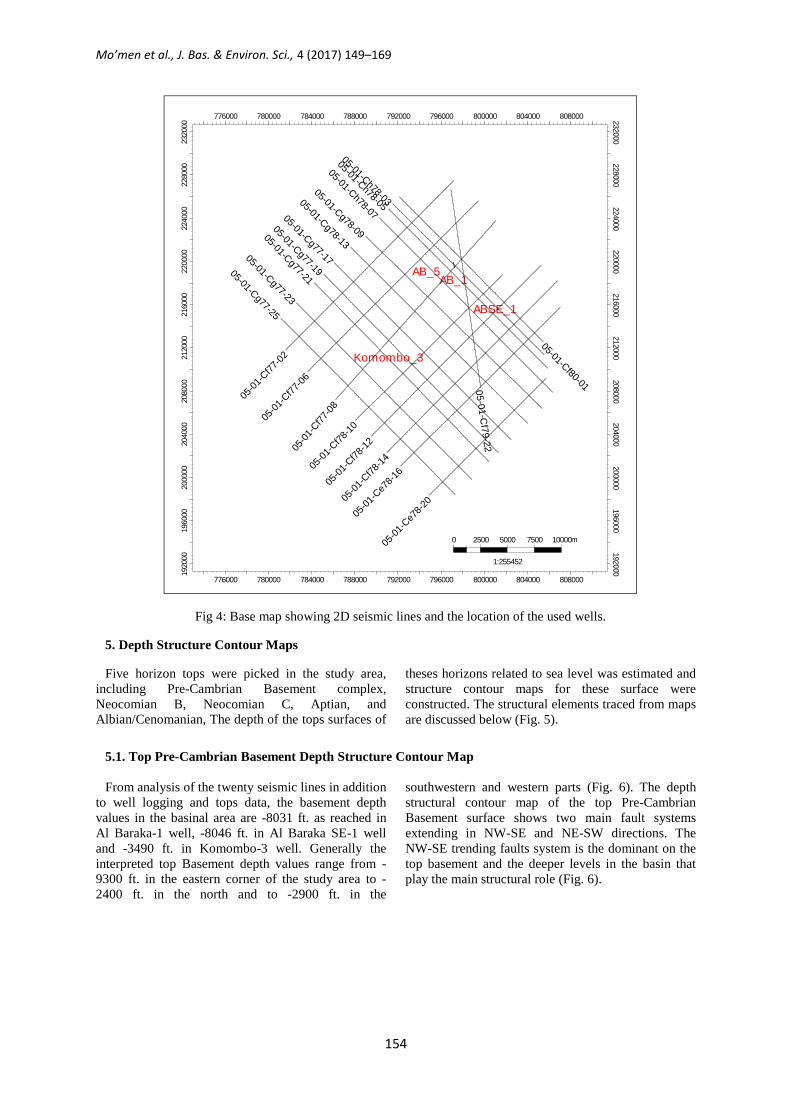
follow a loop that allows us to check the reflectorsinterpretation. The two lines, at an intersection at thesame place, must agree there. Interpreting key seismicreflectors, fault patterns and contouring of depthvalues of key horizons in a significant way representthe final step [19].The available seismic data sets willbe used to achieve the goals of the present study,including twenty 2D seismic lines, four wells data andthree vertical seismic profiles (VSP), these data wereprovided by (GANOPE) (Fig. 4). Twelve of theseismic lines are oriented in NW and NNW direction(Dip line) and the other eight lines are oriented in theNE direction (Strike line).
Mo’men et al., J. Bas. & Environ. Sci., 4 (2017) 149–169
153
Table 1: AlBaraka-1 well Palynostratigraphic Summary [18]
Mo’men et al., J. Bas. & Environ. Sci., 4 (2017) 149–169
154
Fig 4: Base map showing 2D seismic lines and the location of the used wells.
5. Depth Structure Contour Maps
Five horizon tops were picked in the study area,including Pre-Cambrian Basement complex,Neocomian B, Neocomian C, Aptian, andAlbian/Cenomanian, The depth of the tops surfaces of
theses horizons related to sea level was estimated andstructure contour maps for these surface wereconstructed. The structural elements traced from mapsare discussed below (Fig. 5).
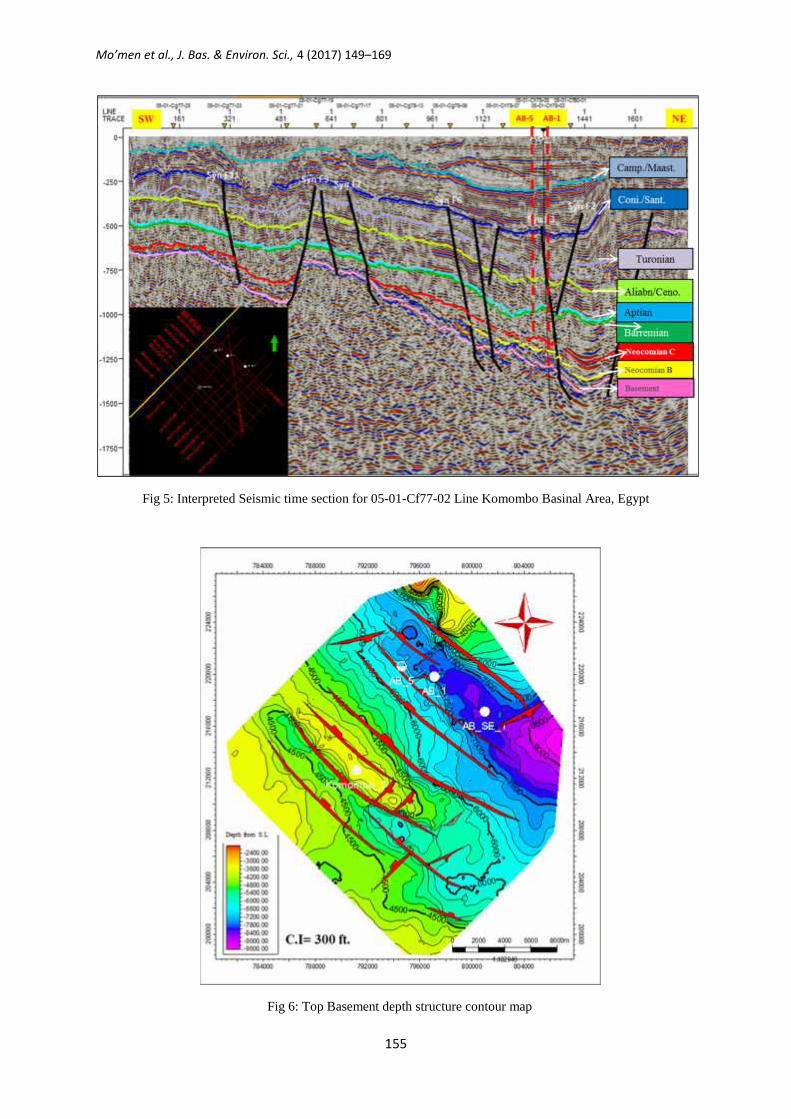
5.1. Top Pre-Cambrian Basement Depth Structure Contour Map
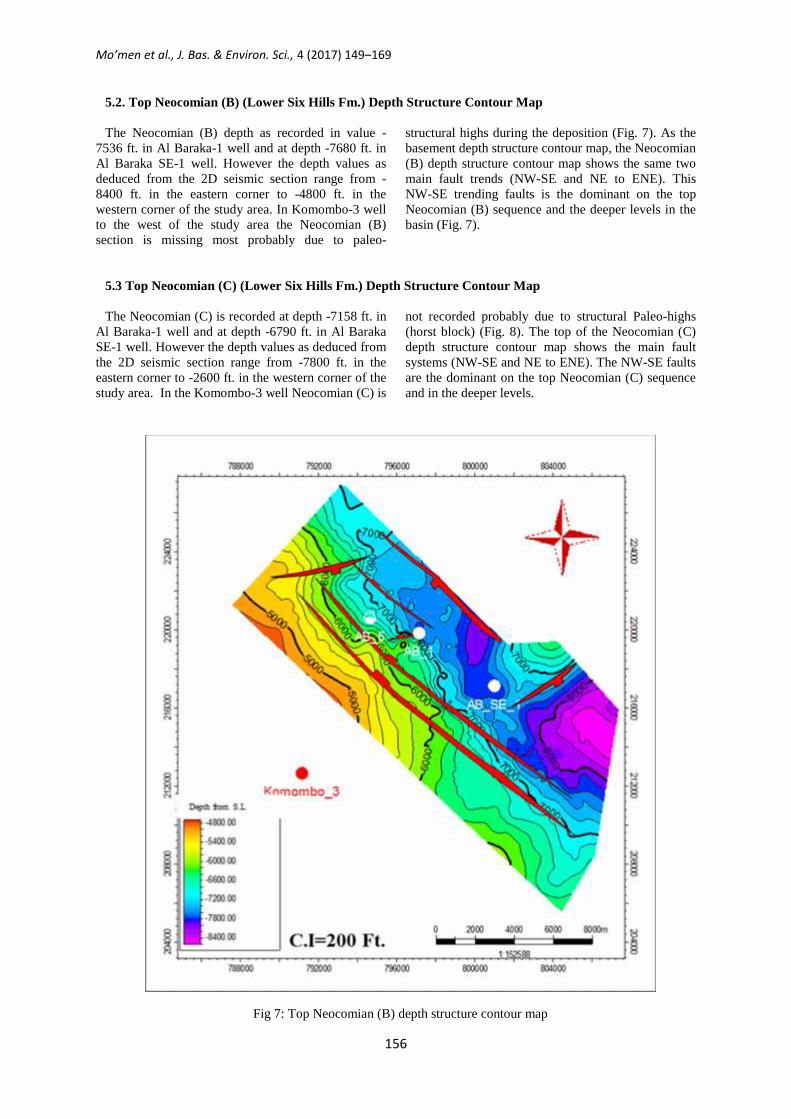
From analysis of the twenty seismic lines in additionto well logging and tops data, the basement depthvalues in the basinal area are -8031 ft. as reached inAl Baraka-1 well, -8046 ft. in Al Baraka SE-1 welland -3490 ft. in Komombo-3 well. Generally theinterpreted top Basement depth values range from -9300 ft. in the eastern corner of the study area to -2400 ft. in the north and to -2900 ft. in the
southwestern and western parts (Fig. 6). The depthstructural contour map of the top Pre-CambrianBasement surface shows two main fault systemsextending in NW-SE and NE-SW directions. TheNW-SE trending faults system is the dominant on thetop basement and the deeper levels in the basin thatplay the main structural role (Fig. 6).
AB_5
Komombo_3
ABSE_1
AB_1
05-01
-Cf77
-02
05-01
-Cf77
-06
05-01
-Cf77
-08
05-01
-Cf78
-10
05-01
-Cf78
-12
05-01
-Cf78
-14
05-01
-Ce7
8-16
05-01
-Ce7
8-20
05-01-Cf79-22
05-01-Cf80-01
05-01-Ch78-03
05-01-Ch78-05
05-01-Ch78-07
05-01-Cg78-09
05-01-Cg78-13
05-01-Cg77-17
05-01-Cg77-19
05-01-Cg77-21
05-01-Cg77-23
05-01-Cg77-25
776000 780000 784000 788000 792000 796000 800000 804000 808000
776000 780000 784000 788000 792000 796000 800000 804000 808000
1920
0019
6000
2000
0020
4000
2080
0021
2000
2160
0022
0000
2240
0022
8000
2320
00192000
196000200000
204000208000
212000216000
220000224000
228000232000
0 2500 5000 7500 10000m
1:255452
Mo’men et al., J. Bas. & Environ. Sci., 4 (2017) 149–169
155
Fig 5: Interpreted Seismic time section for 05-01-Cf77-02 Line Komombo Basinal Area, Egypt
Fig 6: Top Basement depth structure contour map
Mo’men et al., J. Bas. & Environ. Sci., 4 (2017) 149–169
156
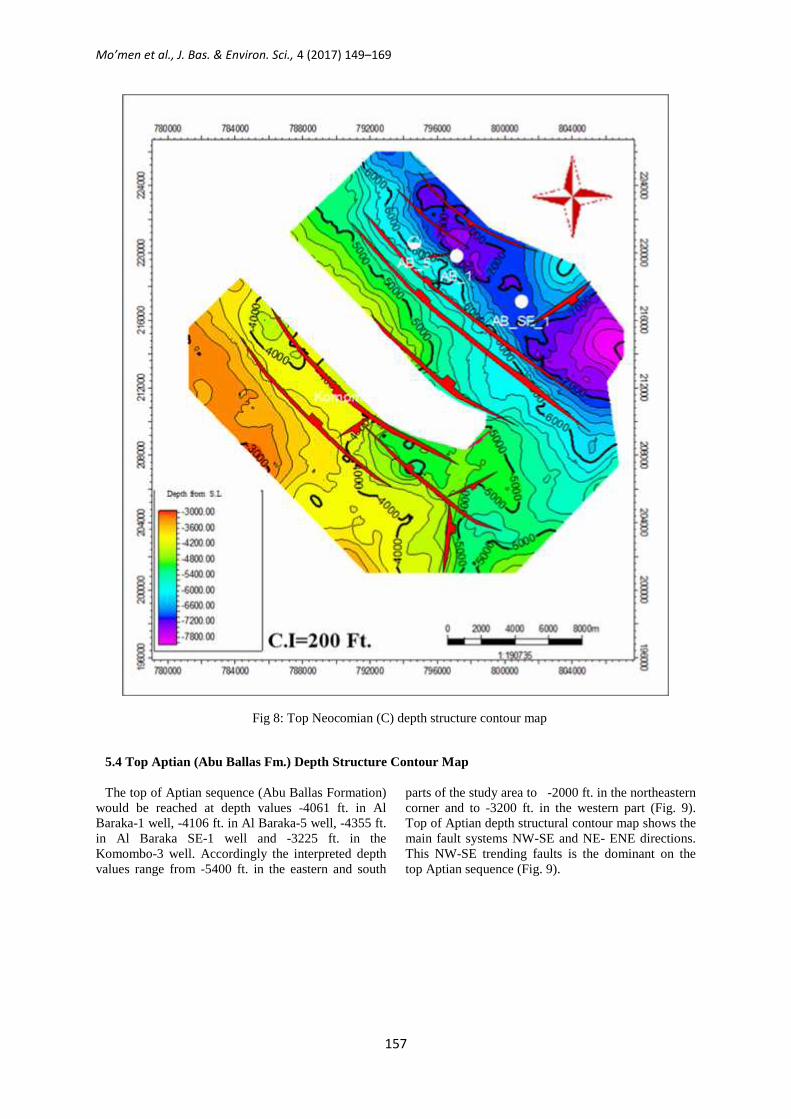
5.2. Top Neocomian (B) (Lower Six Hills Fm.) Depth Structure Contour Map
The Neocomian (B) depth as recorded in value -7536 ft. in Al Baraka-1 well and at depth -7680 ft. inAl Baraka SE-1 well. However the depth values asdeduced from the 2D seismic section range from -8400 ft. in the eastern corner to -4800 ft. in thewestern corner of the study area. In Komombo-3 wellto the west of the study area the Neocomian (B)section is missing most probably due to paleo-
structural highs during the deposition (Fig. 7). As thebasement depth structure contour map, the Neocomian(B) depth structure contour map shows the same twomain fault trends (NW-SE and NE to ENE). ThisNW-SE trending faults is the dominant on the topNeocomian (B) sequence and the deeper levels in thebasin (Fig. 7).
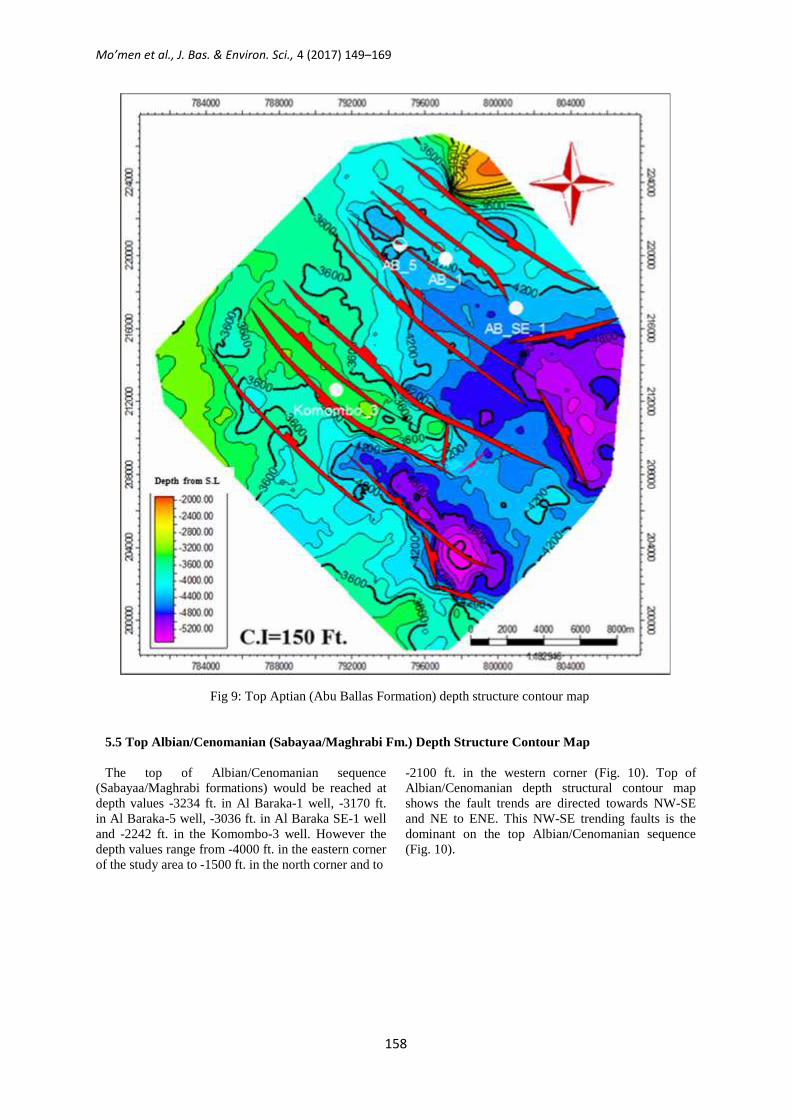
5.3 Top Neocomian (C) (Lower Six Hills Fm.) Depth Structure Contour Map
The Neocomian (C) is recorded at depth -7158 ft. inAl Baraka-1 well and at depth -6790 ft. in Al BarakaSE-1 well. However the depth values as deduced fromthe 2D seismic section range from -7800 ft. in theeastern corner to -2600 ft. in the western corner of thestudy area. In the Komombo-3 well Neocomian (C) is
not recorded probably due to structural Paleo-highs(horst block) (Fig. 8). The top of the Neocomian (C)depth structure contour map shows the main faultsystems (NW-SE and NE to ENE). The NW-SE faultsare the dominant on the top Neocomian (C) sequenceand in the deeper levels.
Fig 7: Top Neocomian (B) depth structure contour map
Mo’men et al., J. Bas. & Environ. Sci., 4 (2017) 149–169
157
Fig 8: Top Neocomian (C) depth structure contour map
5.4 Top Aptian (Abu Ballas Fm.) Depth Structure Contour Map
The top of Aptian sequence (Abu Ballas Formation)would be reached at depth values -4061 ft. in AlBaraka-1 well, -4106 ft. in Al Baraka-5 well, -4355 ft.in Al Baraka SE-1 well and -3225 ft. in theKomombo-3 well. Accordingly the interpreted depthvalues range from -5400 ft. in the eastern and south
parts of the study area to -2000 ft. in the northeasterncorner and to -3200 ft. in the western part (Fig. 9).Top of Aptian depth structural contour map shows themain fault systems NW-SE and NE- ENE directions.This NW-SE trending faults is the dominant on thetop Aptian sequence (Fig. 9).
Mo’men et al., J. Bas. & Environ. Sci., 4 (2017) 149–169
158
Fig 9: Top Aptian (Abu Ballas Formation) depth structure contour map
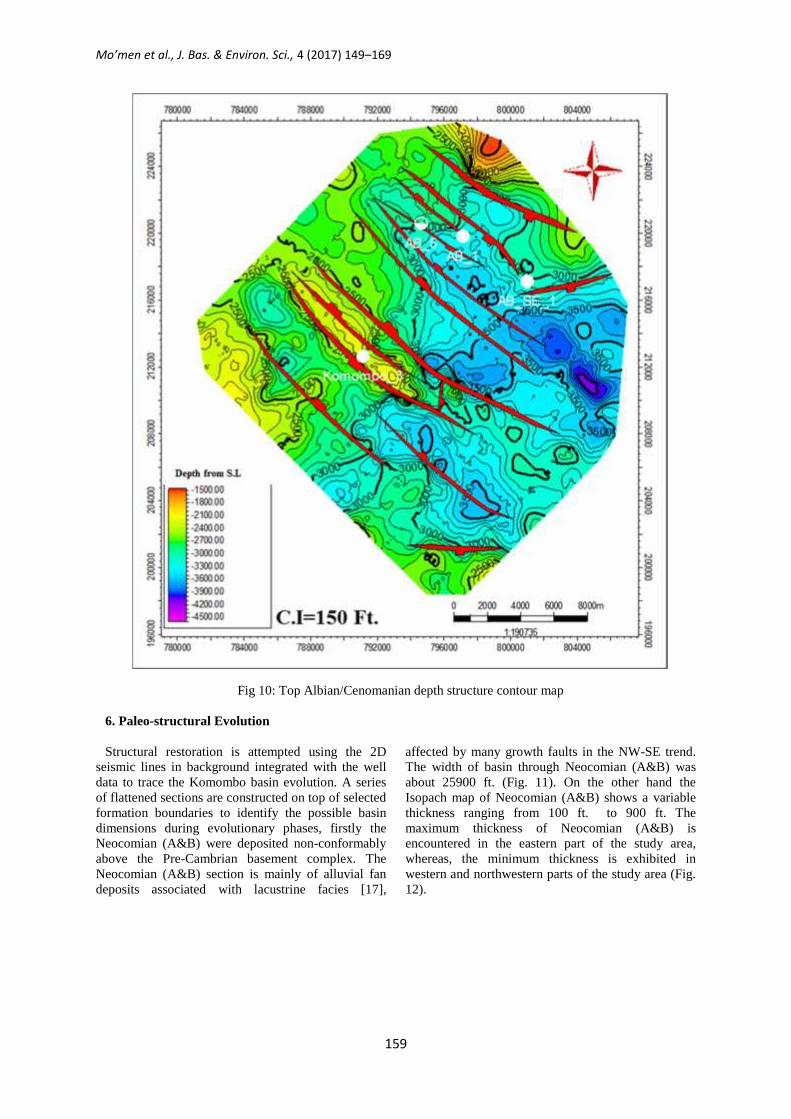
5.5 Top Albian/Cenomanian (Sabayaa/Maghrabi Fm.) Depth Structure Contour Map
The top of Albian/Cenomanian sequence(Sabayaa/Maghrabi formations) would be reached atdepth values -3234 ft. in Al Baraka-1 well, -3170 ft.in Al Baraka-5 well, -3036 ft. in Al Baraka SE-1 welland -2242 ft. in the Komombo-3 well. However thedepth values range from -4000 ft. in the eastern cornerof the study area to -1500 ft. in the north corner and to
-2100 ft. in the western corner (Fig. 10). Top ofAlbian/Cenomanian depth structural contour mapshows the fault trends are directed towards NW-SEand NE to ENE. This NW-SE trending faults is thedominant on the top Albian/Cenomanian sequence(Fig. 10).
Mo’men et al., J. Bas. & Environ. Sci., 4 (2017) 149–169
159
Fig 10: Top Albian/Cenomanian depth structure contour map
6. Paleo-structural Evolution
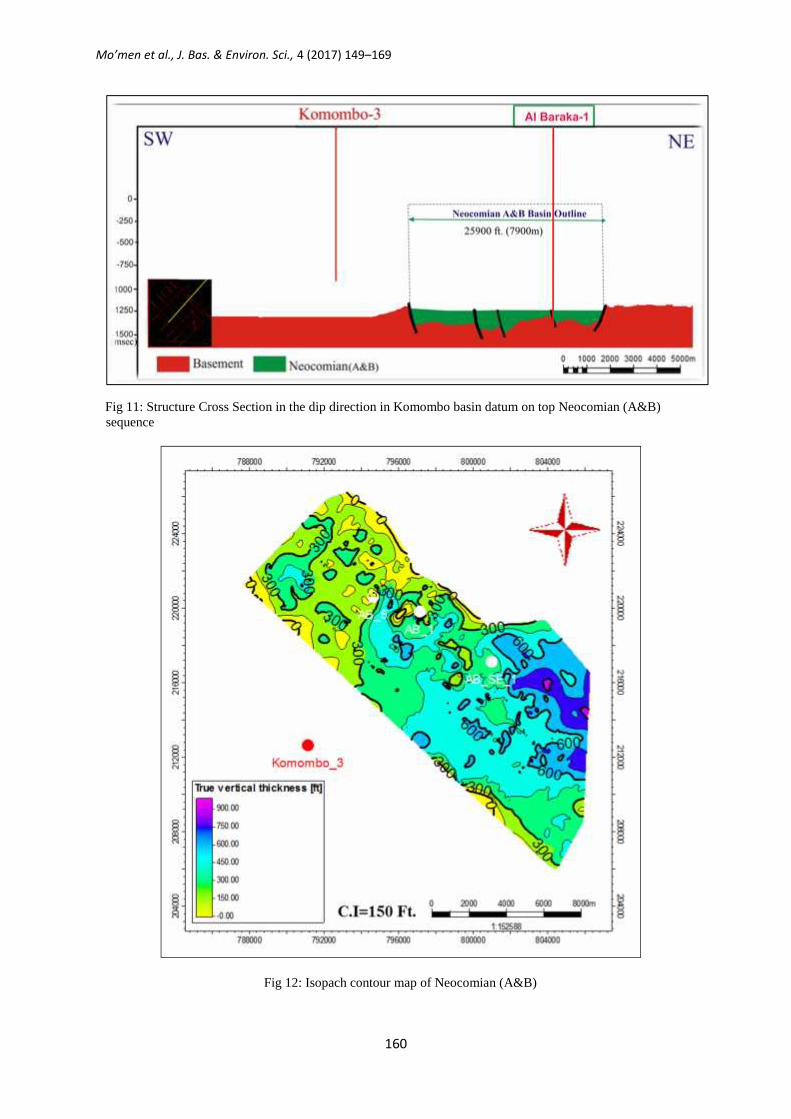
Structural restoration is attempted using the 2Dseismic lines in background integrated with the welldata to trace the Komombo basin evolution. A seriesof flattened sections are constructed on top of selectedformation boundaries to identify the possible basindimensions during evolutionary phases, firstly theNeocomian (A&B) were deposited non-conformablyabove the Pre-Cambrian basement complex. TheNeocomian (A&B) section is mainly of alluvial fandeposits associated with lacustrine facies [17],
affected by many growth faults in the NW-SE trend.The width of basin through Neocomian (A&B) wasabout 25900 ft. (Fig. 11). On the other hand theIsopach map of Neocomian (A&B) shows a variablethickness ranging from 100 ft. to 900 ft. Themaximum thickness of Neocomian (A&B) isencountered in the eastern part of the study area,whereas, the minimum thickness is exhibited inwestern and northwestern parts of the study area (Fig.12).
Mo’men et al., J. Bas. & Environ. Sci., 4 (2017) 149–169
160
Fig 11: Structure Cross Section in the dip direction in Komombo basin datum on top Neocomian (A&B)sequence
Fig 12: Isopach contour map of Neocomian (A&B)
Mo’men et al., J. Bas. & Environ. Sci., 4 (2017) 149–169
161
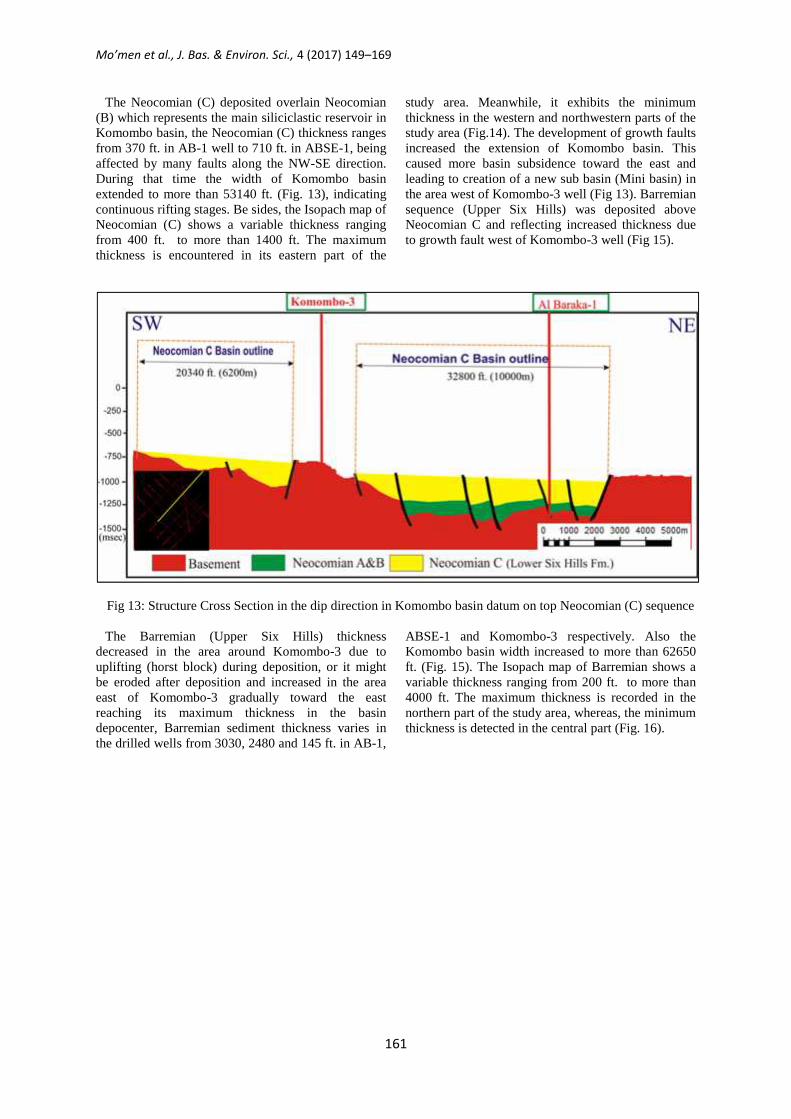
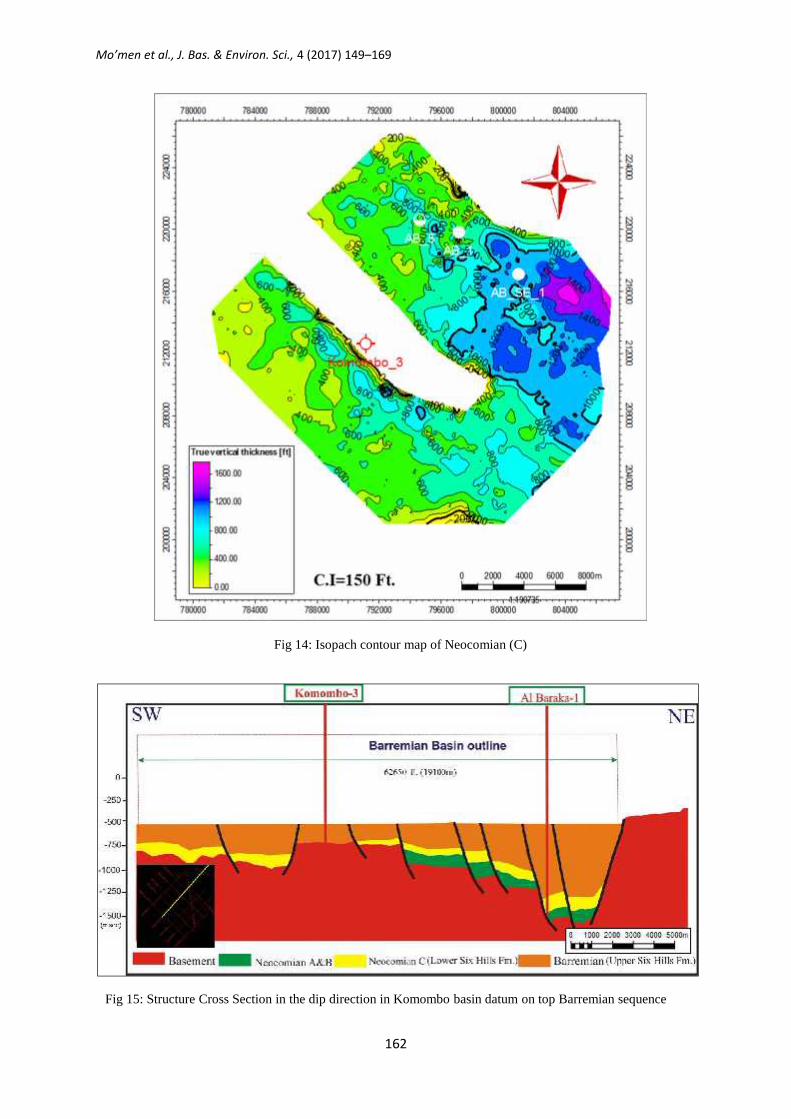
The Neocomian (C) deposited overlain Neocomian(B) which represents the main siliciclastic reservoir inKomombo basin, the Neocomian (C) thickness rangesfrom 370 ft. in AB-1 well to 710 ft. in ABSE-1, beingaffected by many faults along the NW-SE direction.During that time the width of Komombo basinextended to more than 53140 ft. (Fig. 13), indicatingcontinuous rifting stages. Be sides, the Isopach map ofNeocomian (C) shows a variable thickness rangingfrom 400 ft. to more than 1400 ft. The maximumthickness is encountered in its eastern part of the
study area. Meanwhile, it exhibits the minimumthickness in the western and northwestern parts of thestudy area (Fig.14). The development of growth faultsincreased the extension of Komombo basin. Thiscaused more basin subsidence toward the east andleading to creation of a new sub basin (Mini basin) inthe area west of Komombo-3 well (Fig 13). Barremiansequence (Upper Six Hills) was deposited aboveNeocomian C and reflecting increased thickness dueto growth fault west of Komombo-3 well (Fig 15).
Fig 13: Structure Cross Section in the dip direction in Komombo basin datum on top Neocomian (C) sequence
The Barremian (Upper Six Hills) thicknessdecreased in the area around Komombo-3 due touplifting (horst block) during deposition, or it mightbe eroded after deposition and increased in the areaeast of Komombo-3 gradually toward the eastreaching its maximum thickness in the basindepocenter, Barremian sediment thickness varies inthe drilled wells from 3030, 2480 and 145 ft. in AB-1,
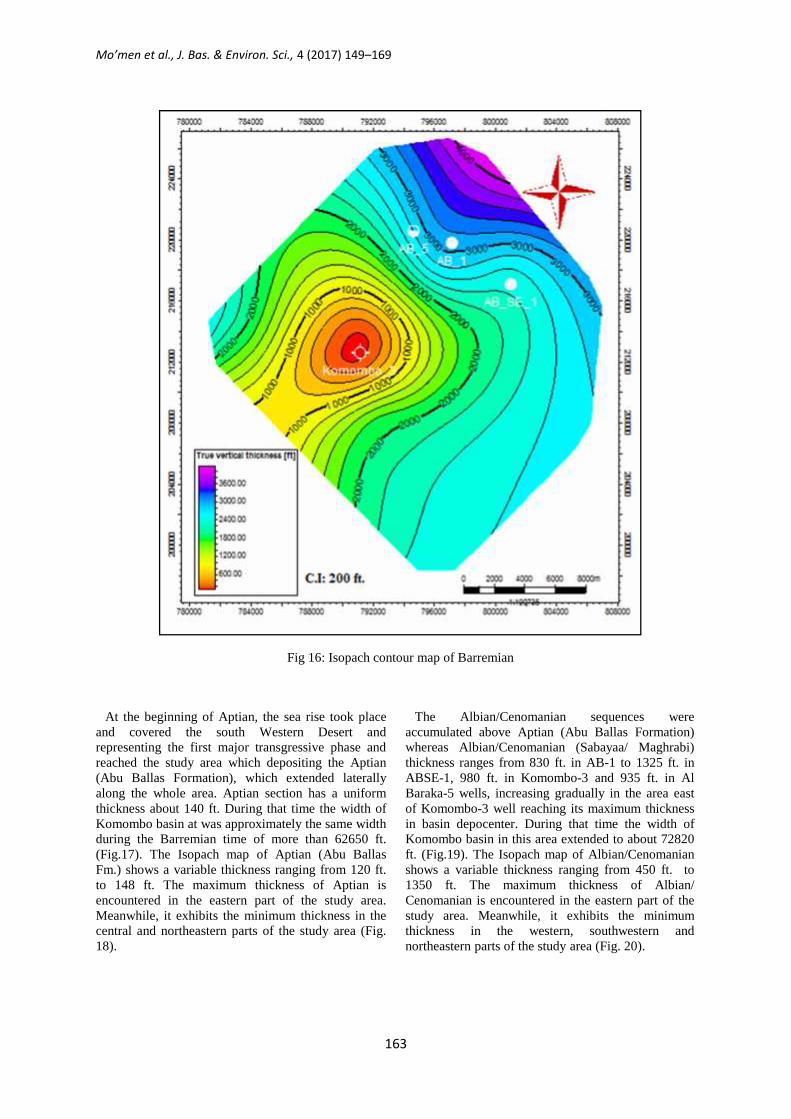
ABSE-1 and Komombo-3 respectively. Also theKomombo basin width increased to more than 62650ft. (Fig. 15). The Isopach map of Barremian shows avariable thickness ranging from 200 ft. to more than4000 ft. The maximum thickness is recorded in thenorthern part of the study area, whereas, the minimumthickness is detected in the central part (Fig. 16).
Mo’men et al., J. Bas. & Environ. Sci., 4 (2017) 149–169
162
Fig 14: Isopach contour map of Neocomian (C)
Fig 15: Structure Cross Section in the dip direction in Komombo basin datum on top Barremian sequence
Mo’men et al., J. Bas. & Environ. Sci., 4 (2017) 149–169
163
Fig 16: Isopach contour map of Barremian
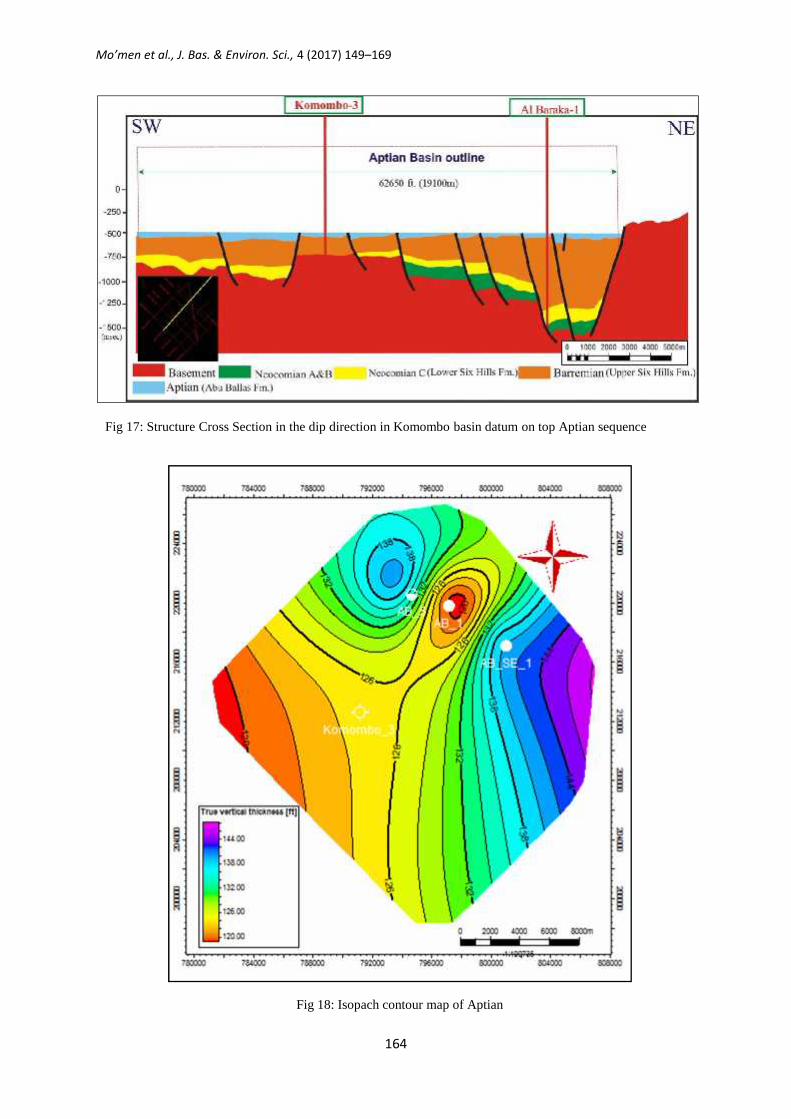
At the beginning of Aptian, the sea rise took placeand covered the south Western Desert andrepresenting the first major transgressive phase andreached the study area which depositing the Aptian(Abu Ballas Formation), which extended laterallyalong the whole area. Aptian section has a uniformthickness about 140 ft. During that time the width ofKomombo basin at was approximately the same widthduring the Barremian time of more than 62650 ft.(Fig.17). The Isopach map of Aptian (Abu BallasFm.) shows a variable thickness ranging from 120 ft.to 148 ft. The maximum thickness of Aptian isencountered in the eastern part of the study area.Meanwhile, it exhibits the minimum thickness in thecentral and northeastern parts of the study area (Fig.18).
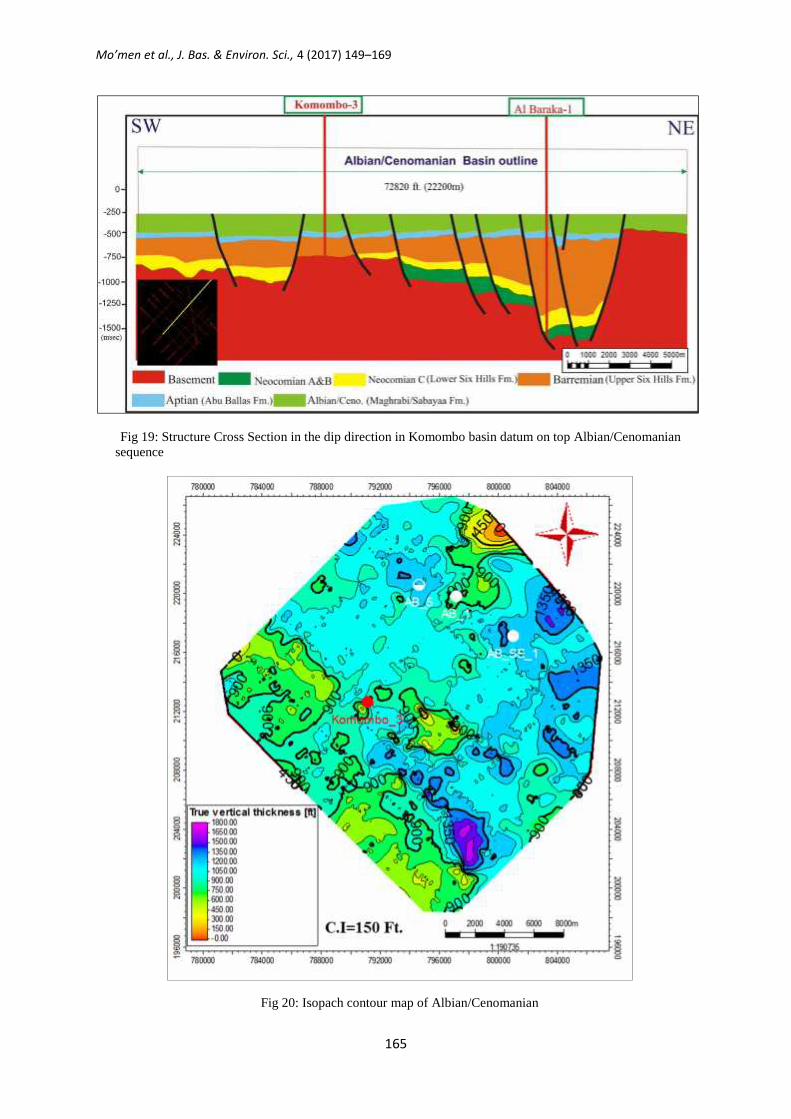
The Albian/Cenomanian sequences wereaccumulated above Aptian (Abu Ballas Formation)whereas Albian/Cenomanian (Sabayaa/ Maghrabi)thickness ranges from 830 ft. in AB-1 to 1325 ft. inABSE-1, 980 ft. in Komombo-3 and 935 ft. in AlBaraka-5 wells, increasing gradually in the area eastof Komombo-3 well reaching its maximum thicknessin basin depocenter. During that time the width ofKomombo basin in this area extended to about 72820ft. (Fig.19). The Isopach map of Albian/Cenomanianshows a variable thickness ranging from 450 ft. to1350 ft. The maximum thickness of Albian/Cenomanian is encountered in the eastern part of thestudy area. Meanwhile, it exhibits the minimumthickness in the western, southwestern andnortheastern parts of the study area (Fig. 20).
Mo’men et al., J. Bas. & Environ. Sci., 4 (2017) 149–169
164
Fig 17: Structure Cross Section in the dip direction in Komombo basin datum on top Aptian sequence
Fig 18: Isopach contour map of Aptian
Mo’men et al., J. Bas. & Environ. Sci., 4 (2017) 149–169
165
Fig 19: Structure Cross Section in the dip direction in Komombo basin datum on top Albian/Cenomaniansequence
Fig 20: Isopach contour map of Albian/Cenomanian
Mo’men et al., J. Bas. & Environ. Sci., 4 (2017) 149–169
166
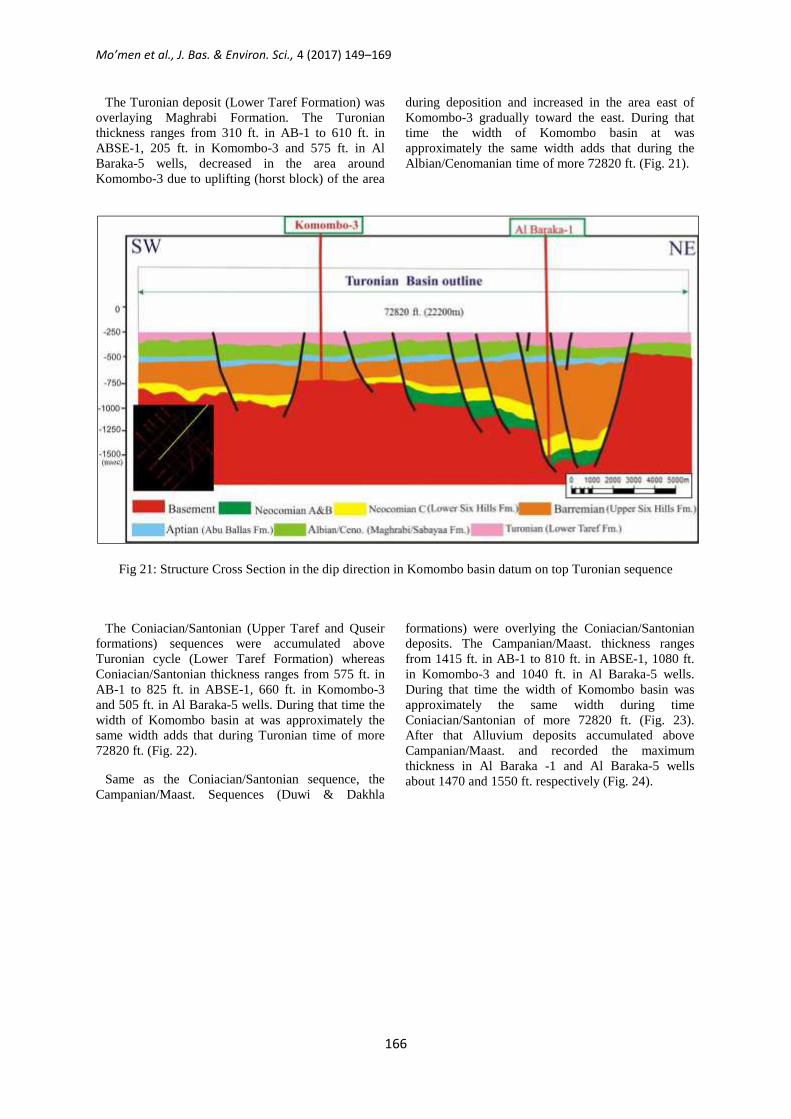
The Turonian deposit (Lower Taref Formation) wasoverlaying Maghrabi Formation. The Turonianthickness ranges from 310 ft. in AB-1 to 610 ft. inABSE-1, 205 ft. in Komombo-3 and 575 ft. in AlBaraka-5 wells, decreased in the area aroundKomombo-3 due to uplifting (horst block) of the area
during deposition and increased in the area east ofKomombo-3 gradually toward the east. During thattime the width of Komombo basin at wasapproximately the same width adds that during theAlbian/Cenomanian time of more 72820 ft. (Fig. 21).
Fig 21: Structure Cross Section in the dip direction in Komombo basin datum on top Turonian sequence
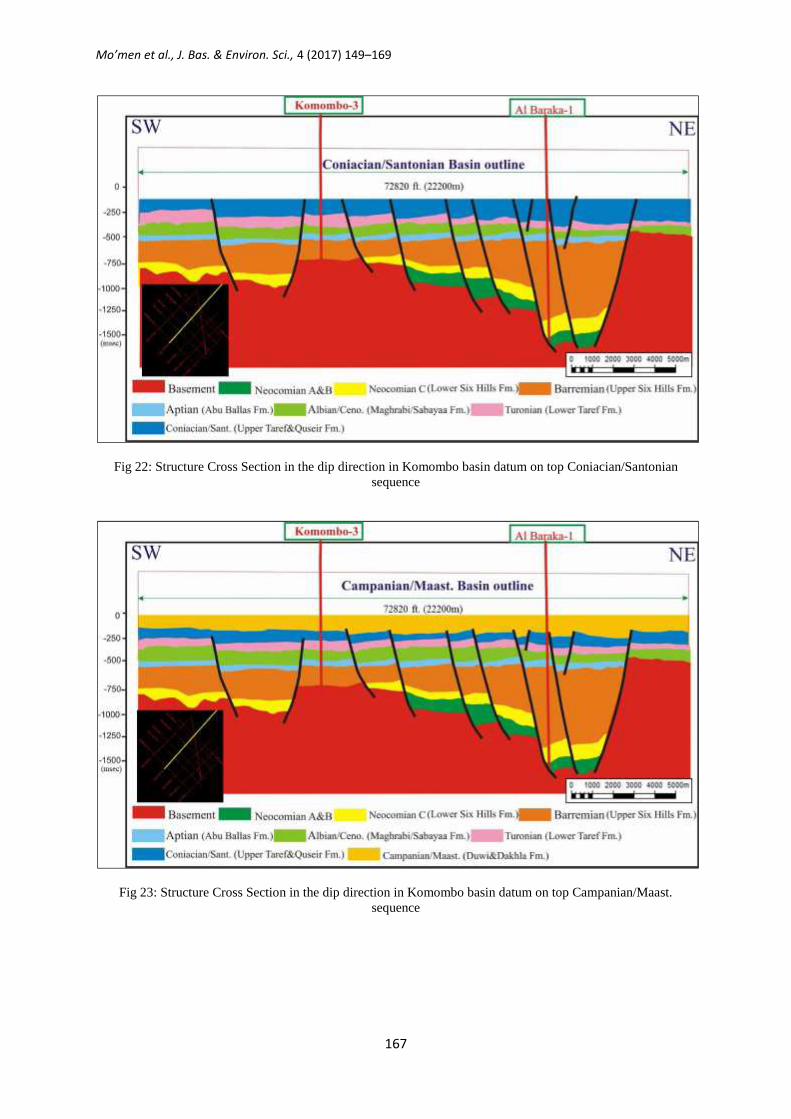
The Coniacian/Santonian (Upper Taref and Quseirformations) sequences were accumulated aboveTuronian cycle (Lower Taref Formation) whereasConiacian/Santonian thickness ranges from 575 ft. inAB-1 to 825 ft. in ABSE-1, 660 ft. in Komombo-3and 505 ft. in Al Baraka-5 wells. During that time thewidth of Komombo basin at was approximately thesame width adds that during Turonian time of more72820 ft. (Fig. 22).
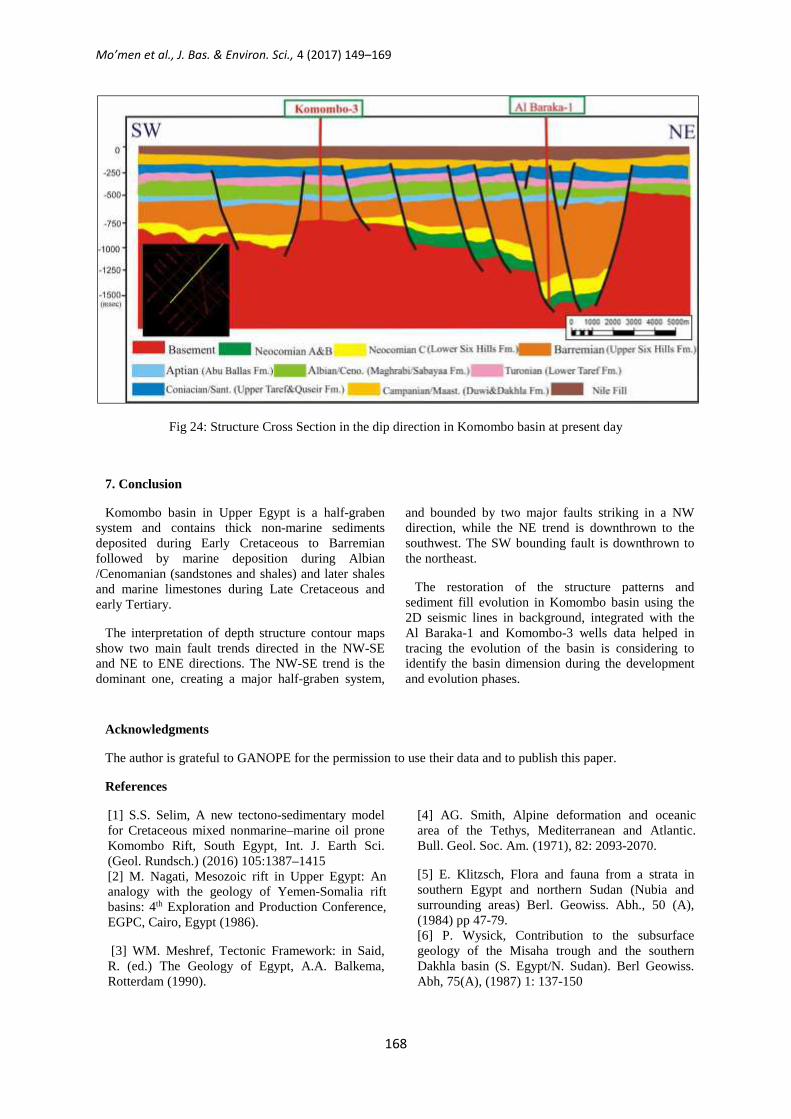
Same as the Coniacian/Santonian sequence, theCampanian/Maast. Sequences (Duwi & Dakhla
formations) were overlying the Coniacian/Santoniandeposits. The Campanian/Maast. thickness rangesfrom 1415 ft. in AB-1 to 810 ft. in ABSE-1, 1080 ft.in Komombo-3 and 1040 ft. in Al Baraka-5 wells.During that time the width of Komombo basin wasapproximately the same width during timeConiacian/Santonian of more 72820 ft. (Fig. 23).After that Alluvium deposits accumulated aboveCampanian/Maast. and recorded the maximumthickness in Al Baraka -1 and Al Baraka-5 wellsabout 1470 and 1550 ft. respectively (Fig. 24).
Mo’men et al., J. Bas. & Environ. Sci., 4 (2017) 149–169
167
Fig 22: Structure Cross Section in the dip direction in Komombo basin datum on top Coniacian/Santoniansequence
Fig 23: Structure Cross Section in the dip direction in Komombo basin datum on top Campanian/Maast.sequence
Mo’men et al., J. Bas. & Environ. Sci., 4 (2017) 149–169
168
Fig 24: Structure Cross Section in the dip direction in Komombo basin at present day
7. Conclusion
Komombo basin in Upper Egypt is a half-grabensystem and contains thick non-marine sedimentsdeposited during Early Cretaceous to Barremianfollowed by marine deposition during Albian/Cenomanian (sandstones and shales) and later shalesand marine limestones during Late Cretaceous andearly Tertiary.
The interpretation of depth structure contour mapsshow two main fault trends directed in the NW-SEand NE to ENE directions. The NW-SE trend is thedominant one, creating a major half-graben system,
and bounded by two major faults striking in a NWdirection, while the NE trend is downthrown to thesouthwest. The SW bounding fault is downthrown tothe northeast.
The restoration of the structure patterns andsediment fill evolution in Komombo basin using the2D seismic lines in background, integrated with theAl Baraka-1 and Komombo-3 wells data helped intracing the evolution of the basin is considering toidentify the basin dimension during the developmentand evolution phases.
Acknowledgments
The author is grateful to GANOPE for the permission to use their data and to publish this paper.
References
[1] S.S. Selim, A new tectono-sedimentary modelfor Cretaceous mixed nonmarine–marine oil proneKomombo Rift, South Egypt, Int. J. Earth Sci.(Geol. Rundsch.) (2016) 105:1387–1415[2] M. Nagati, Mesozoic rift in Upper Egypt: Ananalogy with the geology of Yemen-Somalia riftbasins: 4th Exploration and Production Conference,EGPC, Cairo, Egypt (1986).
[3] WM. Meshref, Tectonic Framework: in Said,R. (ed.) The Geology of Egypt, A.A. Balkema,Rotterdam (1990).
[4] AG. Smith, Alpine deformation and oceanicarea of the Tethys, Mediterranean and Atlantic.Bull. Geol. Soc. Am. (1971), 82: 2093-2070.
[5] E. Klitzsch, Flora and fauna from a strata insouthern Egypt and northern Sudan (Nubia andsurrounding areas) Berl. Geowiss. Abh., 50 (A),(1984) pp 47-79.[6] P. Wysick, Contribution to the subsurfacegeology of the Misaha trough and the southernDakhla basin (S. Egypt/N. Sudan). Berl Geowiss.Abh, 75(A), (1987) 1: 137-150
Mo’men et al., J. Bas. & Environ. Sci., 4 (2017) 149–169
169
[7] MA. Taha and H. Aziz, Mesozoic rifting inUpper Egypt Concession (abs.): 14th InternationalPetroleum Conference, p. 5 (abstract) (1998).[8] W. Bosworth, AS. El-Hawat, DA. Helgeson, K.Burke, Cyrenaican “shock absorber” and associatedinversion strain shadow in the collision zone ofnortheast Africa. Geology (2008) 36:695–698[9] D. McKenzie, Some remarks on thedevelopment of sedimentary basins. Earth PlanetSci Lett (1978) 40:25–32[10] B. Wernicke, Uniform sense normal simpleshear of the continental lithosphere. Can J Earth Sci(1985) 22:108–125[11] BR. Rosendahl, Architecture of continental
rifts with special reference to east Africa. AnnuRev Earth Planet Sci Lett (1987) 15:445–503[12] NJ. Kusznir, G. Marsden and SS. Egan, Alexural cantilever simple shear/pure shear model ofcontinental lithosphere extension: applications tothe Jeanne d’Arc basin, Grand Banks, and VikingGraben, North Sea. In: Roberts AM, Yielding G,Freeman B (eds) The geometry of normal faults.Geological Society Special Publication 56, (1991)41–60
[13] PA. Ziegler, Geodynamics of rifting andimplications for hydrocarbon habitat.Tectonophysics 215, (1992) 221–253[14] E. Klitzsch, FK. List (Eds.), Southwest Egypt
1:500 000-Geological interpretation map,preliminary edition: Sheet 2521 Gebel Uweinat,Sheet 2527 Farafra, Sheer 2827 El Minya Berlin(1979).[15] KW. Barthel, & Boettcher, Abu BallasFormation: a significant lithostratigraphic unit ofthe former Nubian Series. Mitt. Bayer. Staats.Paleontol. Hist. Geol. 18, (1978), pp. 155-166[16] JC. Dolson, C. Harwood, MV. Sham, R.
Rashed, S. Matbouly and H. Hammouda, Thepetroleum potential of Egypt: AAPG memoir 74,(2001) pp.453-482.[17] A. Abdelhady, Hydrocarbon Potential andPetroleum occurrence in Komombo SedimentaryBasin, South West Nile Valley, Upper Egypt(2016) (PHD thesis 1-219)[18]Dana Gas Internal Report 2, StratoChemServices geochemical evaluation report on the wellAl Baraka-1(2008).[19] RE. Sheriff and LP. Geldart, ExplorationSeismology, Cambridge Univ. (1995).