Research Article Description of Guava Osmotic Dehydration Using...
8
Research Article Description of Guava Osmotic Dehydration Using a Three-Dimensional Analytical Diffusion Model Wilton Pereira da Silva, Cleide M. D. P. S. e Silva, and Kalina Lígia Cavalcante de Almeida Farias Aires Federal University of Campina Grande, 58492-900 Campina Grande, PB, Brazil Correspondence should be addressed to Wilton Pereira da Silva; [email protected] Received 15 June 2014; Accepted 15 October 2014; Published 6 November 2014 Academic Editor: Jayashree Arcot Copyright © 2014 Wilton Pereira da Silva et al. is is an open access article distributed under the Creative Commons Attribution License, which permits unrestricted use, distribution, and reproduction in any medium, provided the original work is properly cited. e mass migrations during osmotic dehydration of guava were studied. Parallelepiped shaped slices were dipping in syrup of distilled water and sucrose with two concentrations and two temperatures. It was supposed that a three-dimensional diffusion model with boundary condition of the first kind satisfactorily describes the mass migrations and that the volume and effective mass diffusivities can be assumed constant during the process. e effective mass diffusivities were determined by coupling the three- dimensional analytical solution of the diffusion equation with an optimizer based on the inverse method. e proposed model well described the kinetics of water and sucrose migrations and enabled determining the mass distributions (water and sucrose) within the product at any instant. 1. Introduction In order to prolong the shelf life of fruits, an alternative is the water removal from these agricultural products. In this sense, one of the methods of partial water removal is the osmotic dehydration. For fruits, generally dipping of pieces of the product in a solution of distilled water and sucrose is used, at given concentration and temperature. As examples, the following processes involving osmotic dehydration of fruits through dipping of the product in syrup can be cited: apples [1], mango [2], acerola [3], melon [4], papaya [5], banana [6], pumpkin, kiwi and pear [7], coconut [8], and pineapple [9]. According to Yadav and Singh [10], many advantages of water removal by the use of osmotic dehydration can be cited. Among them is (1) a low temperature water removal process and hence the minimum loss of color and flavor take place. (2) Flavor retention is more when sugar syrup is used as osmotic agent. (3) Energy consumption is less when no phase change is involved. (4) It increases solid density due to solid uptake and helps in getting better quality product in freeze drying. (5) e textural quality of product is better aſter reconstitution. (6) e storage life of product is greatly enhanced. (7) Simple equipment is required for the process. In order to extract the major quantity of information on the osmotic dehydration process of a fruit, generally a mathematical model is used to describe the water removal and sucrose uptake. Although empirical models are used to describe osmotic dehydration [4, 6, 7], the most frequent in the literature is diffusion model [1–3, 8, 9, 11]. According to Da Silva et al. [9], the main advantage of diffusion models is the possibility to predict the distributions of mass content (water and sucrose) within the product at any instant, and this allows the analysis of stresses that can damage the product. In order to describe osmotic dehydration through a diffusion model, normally the geometry of the fruit pieces is simplified reducing the problem to the one-dimensional case [3, 11–16]. However, if the exact distribution of water and sucrose along the time is required, the real geometry must be used in the description of the process [8, 9]. In the case of water removal from guava pieces, some works are found in the literature [17–19], but none of them consider the three- dimensional nature of the pieces of pulp. In this sense, the objective of this paper is defined below. In this paper, osmotic dehydration of guava pieces was described through three-dimensional diffusion model. e Hindawi Publishing Corporation Journal of Food Processing Volume 2014, Article ID 157427, 7 pages http://dx.doi.org/10.1155/2014/157427
Transcript of Research Article Description of Guava Osmotic Dehydration Using...

Research ArticleDescription of Guava Osmotic Dehydration Usinga Three-Dimensional Analytical Diffusion Model
Wilton Pereira da Silva, Cleide M. D. P. S. e Silva,and Kalina Lígia Cavalcante de Almeida Farias Aires
Federal University of Campina Grande, 58492-900 Campina Grande, PB, Brazil
Correspondence should be addressed to Wilton Pereira da Silva; [email protected]
Received 15 June 2014; Accepted 15 October 2014; Published 6 November 2014
Academic Editor: Jayashree Arcot
Copyright © 2014 Wilton Pereira da Silva et al. This is an open access article distributed under the Creative Commons AttributionLicense, which permits unrestricted use, distribution, and reproduction in any medium, provided the original work is properlycited.
The mass migrations during osmotic dehydration of guava were studied. Parallelepiped shaped slices were dipping in syrup ofdistilled water and sucrose with two concentrations and two temperatures. It was supposed that a three-dimensional diffusionmodel with boundary condition of the first kind satisfactorily describes the mass migrations and that the volume and effective massdiffusivities can be assumed constant during the process. The effective mass diffusivities were determined by coupling the three-dimensional analytical solution of the diffusion equation with an optimizer based on the inverse method.The proposed model welldescribed the kinetics of water and sucrose migrations and enabled determining the mass distributions (water and sucrose) withinthe product at any instant.
1. Introduction
In order to prolong the shelf life of fruits, an alternative isthe water removal from these agricultural products. In thissense, one of the methods of partial water removal is theosmotic dehydration. For fruits, generally dipping of pieces ofthe product in a solution of distilledwater and sucrose is used,at given concentration and temperature. As examples, thefollowing processes involving osmotic dehydration of fruitsthrough dipping of the product in syrup can be cited: apples[1], mango [2], acerola [3], melon [4], papaya [5], banana[6], pumpkin, kiwi and pear [7], coconut [8], and pineapple[9]. According to Yadav and Singh [10], many advantagesof water removal by the use of osmotic dehydration can becited. Among them is (1) a low temperature water removalprocess and hence the minimum loss of color and flavor takeplace. (2) Flavor retention is more when sugar syrup is usedas osmotic agent. (3) Energy consumption is less when nophase change is involved. (4) It increases solid density dueto solid uptake and helps in getting better quality productin freeze drying. (5) The textural quality of product is betterafter reconstitution. (6) The storage life of product is greatlyenhanced. (7) Simple equipment is required for the process.
In order to extract the major quantity of informationon the osmotic dehydration process of a fruit, generally amathematical model is used to describe the water removaland sucrose uptake. Although empirical models are used todescribe osmotic dehydration [4, 6, 7], the most frequent inthe literature is diffusionmodel [1–3, 8, 9, 11]. According toDaSilva et al. [9], the main advantage of diffusion models is thepossibility to predict the distributions of mass content (waterand sucrose) within the product at any instant, and this allowsthe analysis of stresses that can damage the product.
In order to describe osmotic dehydration through adiffusion model, normally the geometry of the fruit piecesis simplified reducing the problem to the one-dimensionalcase [3, 11–16]. However, if the exact distribution of water andsucrose along the time is required, the real geometry must beused in the description of the process [8, 9]. In the case ofwater removal from guava pieces, some works are found inthe literature [17–19], but none of them consider the three-dimensional nature of the pieces of pulp. In this sense, theobjective of this paper is defined below.
In this paper, osmotic dehydration of guava pieces wasdescribed through three-dimensional diffusion model. The
Hindawi Publishing CorporationJournal of Food ProcessingVolume 2014, Article ID 157427, 7 pageshttp://dx.doi.org/10.1155/2014/157427

2 Journal of Food Processing
analytical solution of the diffusion equation was coupled withan optimizer, which enabled calculating the effective massdiffusivities for a given experimental data set. Consequently,the simulation of the water quantity and sucrose gain kineticscan be performed, and information related to the processcan be obtained. In particular, the adequacy of the proposedmodel in the description of the process can be analyzed, andthe distributions of water and sucrose within the sample atany given instant previously stipulated can be also known.
2. Material and Methods
In this paper, a diffusion model with boundary condition ofthe first kind was used in order to describe the water andsucrose migrations during osmotic dehydration of guava. Inthis sense, the three-dimensional analytical solution of thediffusion equation will be presented below.
2.1. Diffusion Equation. The diffusion equation, used todescribe mass transport in porous media many times, can bewritten as [20]
𝜕Φ
𝜕𝑡= ∇ ⋅ (𝐷∇Φ) , (1)
where Φ is a generic variable that represents the relativewater quantity, 𝑊, or relative sucrose gain, 𝑆, 𝑡 is the time,and 𝐷 is the effective mass diffusivity (𝐷
𝑤for water and
𝐷𝑠for sucrose). In Cartesian coordinates, (1) for the three-
dimensional case is written in the following way:
𝜕Φ
𝜕𝑡=
𝜕
𝜕𝑥(𝐷
𝜕Φ
𝜕𝑥) +
𝜕
𝜕𝑦(𝐷
𝜕Φ
𝜕𝑦) +
𝜕
𝜕𝑧(𝐷
𝜕Φ
𝜕𝑧) . (2)
In order to solve (2), some assumptions should beestablished: (1) diffusion is the only transport mechanism ofmass within the guava slices; (2) the initial mass distributionsshould be uniform; (3) the dimensions of the slices donot vary significantly during the mass diffusion; (4) theeffective mass diffusivities do not vary during the diffusion;(5) the boundary condition of the diffusion equation is of thefirst kind (i.e., at the edges of the slices, the relative watercontent and relative sucrose gain are known and have fixedvalues); (6) each guava slice is considered homogeneous andisotropic.
The solution to be presented below takes into account theparallelepiped shown in Figure 1.
The analytical solution at instant 𝑡 in a position (𝑥, 𝑦, 𝑧)within the parallelepiped is given by [20, 21]
Φ(𝑥, 𝑦, 𝑧, 𝑡)
= Φeq + (Φ0 − Φeq)∞
∑
𝑛=1
∞
∑
𝑚=1
∞
∑
𝑘=1
𝐴𝑛𝐴𝑚𝐴𝑘
× cos(𝜇𝑛
𝑥
𝐿1/2) cos(𝜇
𝑚
𝑦
𝐿2/2) × cos(𝜇
𝑘
𝑧
𝐿3/2)
× exp[−(𝜇2
𝑛
(𝐿1/2)2+
𝜇2
𝑚
(𝐿2/2)2+
𝜇2
𝑘
(𝐿3/2)2)𝐷𝑡] ,
(3)
x
yz
L3/2
L1/2
L2/2
Figure 1: Parallelepiped, highlighting a vertical plane 𝑥𝑧, at position𝑦 = 0, where the distributions of water quantity and sucrose gainwere examined.
in which 𝐴𝑗and 𝜇
𝑗are given by
𝐴𝑗=2(−1)𝑗+1
𝜇𝑗
, (4a)
𝜇𝑗=(2𝑗 − 1) 𝜋
2, (4b)
with 𝑗 equal to indexes 𝑛,𝑚, and 𝑘.In (3),Φ
0andΦeq are the initial and equilibrium value of
Φ. The average value of Φ(𝑥, 𝑦, 𝑧, 𝑡), at any instant 𝑡, is givenin the following way:
Φ (𝑡) = Φeq + (Φ0 − Φeq)∞
∑
𝑛=1
∞
∑
𝑚=1
∞
∑
𝑘=1
𝐵𝑛𝐵𝑚𝐵𝑘
× exp[−(𝜇2
𝑛
(𝐿1/2)2+
𝜇2
𝑚
(𝐿2/2)2+
𝜇2
𝑘
(𝐿3/2)2)𝐷𝑡] ,
(5)
with 𝐵𝑗(𝑗 equal to 𝑛,𝑚, and 𝑘) given by
𝐵𝑗=
2
𝜇𝑗
2. (6)
2.2. Optimization. For the boundary condition of the firstkind, the average value of Φ at instant 𝑡 only depends on thevalue of the effective mass diffusivity 𝐷, since the convectivemass transfer coefficient is known (and it tends to infinity).Then, for a given experimental data set, the chi-square isdefined in the following way [22, 23]:
𝜒2
=
𝑁𝑝
∑
𝑖=1
[Φexp𝑖
− Φana𝑖
(𝐷)]2 1
𝜎2𝑖
, (7)
where Φexp𝑖
represents the average water quantity 𝑊 orsucrose gain 𝑆 of the 𝑖th experimental point; Φana
𝑖(𝐷) is
the average value of Φ as a function of 𝐷 at the samepoint, calculated through (5); 𝜎
𝑖is the standard deviation

Journal of Food Processing 3
of the experimental value of Φ at the point 𝑖; and 𝑁𝑝is
the number of experimental points. An optimum value of𝐷 can be determined for each set of experimental data byminimizing (7). If 𝜎
𝑖was not obtained from the experiment
and is therefore unknown, a common value, for example, 𝜎𝑖
= 1, should be attributed to all experimental points. da Silvaet al. [23] proposed an algorithm to determine 𝐷 in spheres,and this algorithm can be adapted for parallelepipeds. Suchalgorithm consists essentially of the following steps.
(i) An initial value close to zero (1 × 10⁻²⁰) is attributedto𝐷 and replaced into (5), approximated by a certainnumber of terms, for instance, 25 terms for eachsummation. Thus, Φana
𝑖(𝐷) can be calculated for
a given time by (5) and, consequently, 𝜒2 can bedetermined for a set of experimental data through(7). Then, the value of 𝐷 is doubled, and a new 𝜒
2 iscalculated. The new 𝜒
2 is compared with the formervalue. If the new value is lower than the foregoing,𝐷 is again doubled and the corresponding value of𝜒2 is calculated and compared with the former one.
This procedure is repeated until the last calculated𝜒2 is greater than the anterior value. Thereby, the
antepenultimate and ultimate values of 𝐷, denotedas 𝐷𝑎and 𝐷
𝑏, respectively, define a region which
contains the minimal value of 𝜒2. The penultimatevalue of the effective mass diffusivity corresponds tothe smallest value of 𝜒2 obtained in this interval.
(ii) The latter procedure can be refined between 𝐷𝑎
and 𝐷𝑏, subdividing this interval in 𝑛V values of 𝐷
uniformly distributed. Then, a more refined intervalcan be obtained, and this procedure can be repeateduntil a convergence criterion is satisfied.
According to da Silva et al. [23], the described algorithmneeds neither the input of an initial value, nor the definitionof a search interval for the determination of an optimum “𝐷.”This is a very comfortable characteristic of the optimizationprocedure since the user of the algorithm only needs toinform the set of experimental data, once the guesses of valuesdefining the interval which contains the optimal value arenot necessary. Due to the advantages presented above, thisalgorithm was adapted to the three-dimensional geometry tobe analyzed in this paper. On the other hand, the criterion ofconvergence was stipulated in this paper as 1 × 10⁻¹⁶.
Since the diffusivities are determined by optimization, (3)can be used to calculate the water quantity and sucrose gaindistributions as a function of the position at given time 𝑡.
2.3. Experimental Data. Mature guavas (Psidium guajava L.)were peeled and the seeds were removed. Its pulp was cutinto parallelepiped shaped pieces with the following averagedimensions, measured with a caliper rule: 𝐿
1= 9.56; 𝐿
2=
20.03; and 𝐿3= 30.29mm (Figure 1).
Guava slices with initial moisture content of5.34 kgwater kg
−1
drymatter were submitted to osmotic dehydra-tion, and two experiments were carried out: one of them at40∘Brix and 30∘C and other at 50∘Brix and 40∘C. The ratio
of the volume of the guava pieces to that of the medium wasmaintained at 1 : 15.
The quantities analyzed in the experiments were therelative water quantity within the sample during the process,𝑊, and relative sucrose gain, 𝑆. In each osmotic dehydrationexperiment, ten samples with about 15 g were weighted andimmersed in syrup, and one sample was weighted and placedin a kiln at 105∘C during 24 h to determine its initial watermass and dry matter. This procedure permits to determinethe mass of water and dry matter of all samples at initialinstant. After that, in each instant 𝑡 previously stipulated,one sample was removed from the syrup and its weight wasmeasured. Then, the mass of water and its dry matter wasalso determined as described above. This procedure enablesto determine the mass of water and dry matter at instant 𝑡 ofeach sample that continues to be immersed in the solution.In each removal, the sample was washed in tap water andthe external moisture was removed with paper towel. Theequations used to determine 𝑊 and 𝑆 in each instant 𝑡 aregiven, respectively, by
𝑊(𝑡) =𝑚𝑊(𝑡)
𝑚𝑊(0)
× 100,
𝑆 (𝑡) =𝑚𝑆(𝑡)
𝑚𝑑0
× 100,
(8)
where 𝑚𝑊(𝑡) and 𝑚
𝑊(0) represent the mass of water within
the sample at instants 𝑡 and zero, respectively; 𝑚𝑆(𝑡) is the
mass of sucrose transferred to the sample up to the instant 𝑡;and𝑚
𝑑0is its initial dry matter.
The initial and equilibrium sucrose gain were, respec-tively, 𝑆
0= 0 and 𝑆eq = 72.0% (40∘Brix, 30∘C) and 𝑆
0= 0 and
𝑆eq = 74.2% (50∘Brix, 40∘C).The initial and equilibriumwaterquantitywithin the sampleswere, respectively,𝑊
0= 100%and
𝑊eq = 33.8% (40∘Brix, 30∘C) and𝑊0= 100% and𝑊eq = 25.0%
(50∘Brix, 40∘C).
3. Results and Discussion
The experimental data were processed as described above,and the results will be presented in the following.
3.1. Results. Equation (5) was coupled with the optimizerdescribed herein and the values presented in Table 1 wereobtained for the effective mass diffusivities. This table alsopresents the statistical indicators for each optimization pro-cess.
Performing the simulations using the effective waterdiffusivities determined by optimization, the water migrationkinetics is given through Figure 2 for two experiments carriedout.
As additional information, the graphs of Figure 2 weredrawn by the own software developed to obtain the effectivemass diffusivities by optimization. On the other hand, thesimulations related to the sucrose uptake kinetics are shownin Figure 3. As is realized, an advantage of the diffusionmodelused to represent the experiments (Figures 2 and 3) is thepossibility to describe the whole process by simulation, once

4 Journal of Food Processing
100.0
33.8
W(%
)
t (min)0 1440
ExperimentalAnalytical
(a)
100.0
25.0
W(%
)
t (min)0 1440
ExperimentalAnalytical
(b)
Figure 2: Water quantity at (a) 40∘Brix and 30∘C; (b) 50∘Brix and 40∘C.
Table 1: Effective mass diffusivities and statistical indicators forthree-dimensional model.
Experiment at 𝐷 (m2 min−1) 𝑅2
𝜒2
40∘Brix, 30∘C Water 1.52 × 10⁻⁸ 0.9857 55.0450∘Brix, 40∘C Water 1.74 × 10⁻⁸ 0.9973 16.4840∘Brix, 30∘C Sucrose 3.55 × 10⁻⁸ 0.9869 67.6150∘Brix, 40∘C Sucrose 4.11 × 10⁻⁸ 0.9926 38.20
the experimental points are known at beginning the process(first 4 or 5 h) and also the equilibrium point (for the guavaslices used in the experiments, about 24 h). Such informationis enough to determine 𝐷, enabling the simulation of thewhole process.
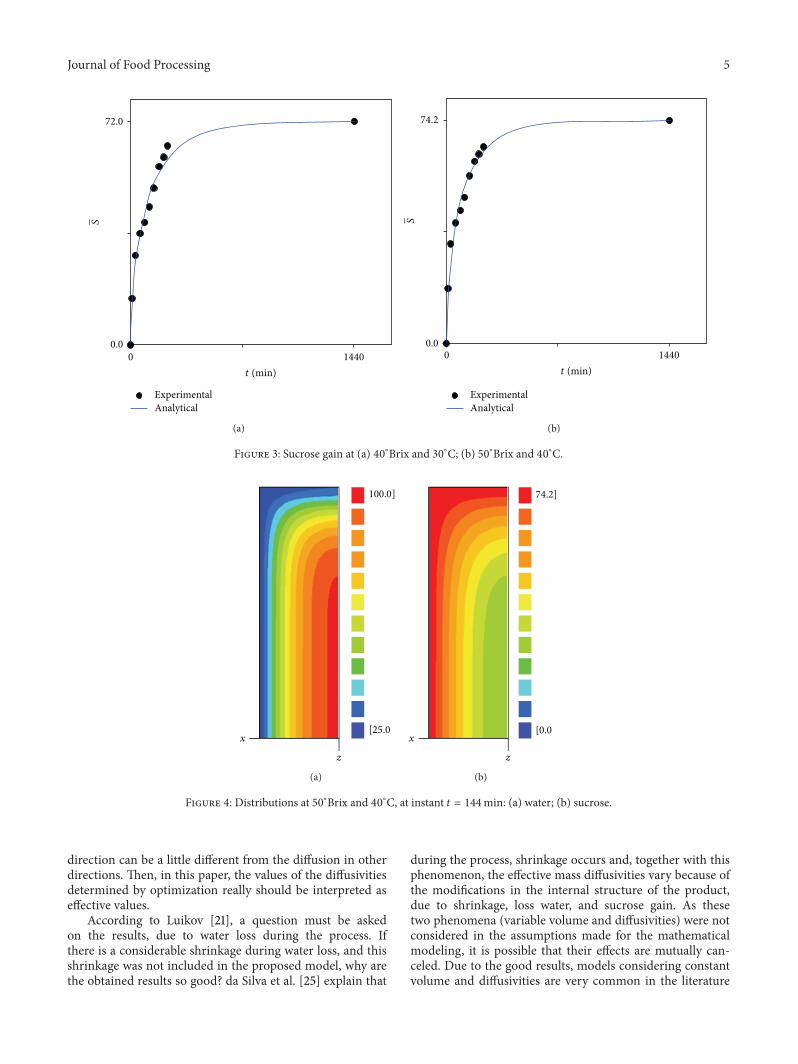
The contour plots showing the distributions of waterquantity and sucrose gain within the guava slices at anyinstant can be obtained using (3). These distributions in thevertical plane 𝑥𝑧 in y = 0 (Figure 1) were determined for50∘Brix and 40∘C, at instant of 144min, and the obtainedresults are shown in Figure 4.
3.2. Discussion. An inspection of Table 1 (and also an obser-vation of Figures 2 and 3) enables affirming that three-dimensional diffusion model with boundary condition ofthe first kind well describes the osmotic dehydration ofthe parallelepiped shaped slices of guava. For example, thedetermination coefficient was greater than 0.9850 for allanalyzed migrations. From Figure 3 it is realized that thedifference between the experimental results is very little whensucrose uptake is analyzed (72% and 74.2%). On the otherhand, comparing the experiments at 40∘Brix and 30∘C and
50∘Brix and 40∘C, shown in Figure 2, the water removal inthe second experiment is almost 9% greater than in the firstone. Thus, in order to remove a major quantity of water, it isrecommendable to perform osmotic dehydration at 50∘Brixand 40∘C.
Boundary condition of the first kind is used with successby several researchers in the description of osmotic dehy-dration of many fruits [3, 11]. However, in order to describeosmotic dehydration of some agricultural products in a rig-orous way, in many occasions the boundary condition of thethird kind must be used [8, 9]. As was observed by Da Silvaet al. [9], the appropriate boundary condition to describe anosmotic dehydration process depends on the type of studiedproduct, shape, dimensions, and experimental conditions. Inthe guava case, it was observed that the boundary conditionof the first kind well describes the process.
An observation of Figure 4 enables to realize that thewater quantity, for instance, at 𝑡 = 144min, is greater in thecentral region than in the extremities. On the other hand, thesucrose concentration is greater in the extremities than in thecentral region. Obviously, these results are foreseeable, but allof them were obtained by proposed model.
As was observed in this study, the obtained resultsindicated that the boundary condition of the first kind isappropriate to describe the mass migrations. For that, eachsummation of (3) and (5) varied from 1 to 25 (insteadof “infinite terms”). According to Da Silva et al. [24], forthe boundary condition of the first kind, 25 terms in eachsummation are enough to maintain the maximum cut-offerror in 1.3%, at 𝑡 = 0. On the other hand, as was commentedby Da Silva et al. [20], it should be observed that, due to someheterogeneity and anisotropy, the diffusion process in a given
Journal of Food Processing 5
72.0
0.0
S
t (min)0 1440
ExperimentalAnalytical
(a)
74.2
t (min)0 1440
0.0
S
ExperimentalAnalytical
(b)
Figure 3: Sucrose gain at (a) 40∘Brix and 30∘C; (b) 50∘Brix and 40∘C.
100.0]
[25.0x
z
(a)
x
z
74.2]
[0.0
(b)
Figure 4: Distributions at 50∘Brix and 40∘C, at instant 𝑡 = 144min: (a) water; (b) sucrose.
direction can be a little different from the diffusion in otherdirections. Then, in this paper, the values of the diffusivitiesdetermined by optimization really should be interpreted aseffective values.
According to Luikov [21], a question must be askedon the results, due to water loss during the process. Ifthere is a considerable shrinkage during water loss, and thisshrinkage was not included in the proposed model, why arethe obtained results so good? da Silva et al. [25] explain that
during the process, shrinkage occurs and, together with thisphenomenon, the effective mass diffusivities vary because ofthe modifications in the internal structure of the product,due to shrinkage, loss water, and sucrose gain. As thesetwo phenomena (variable volume and diffusivities) were notconsidered in the assumptions made for the mathematicalmodeling, it is possible that their effects are mutually can-celed. Due to the good results, models considering constantvolume and diffusivities are very common in the literature

6 Journal of Food Processing
[1–3, 8, 9, 11–16]. On the other hand, in order to considerthe effects above-mentioned, an analytical solution is notappropriate to describe the process, which may best bedescribed by numerical solutions. However, even in thesecases, the study presented in this paper is useful because,through the proposed model, the obtained results serve asinitial values for other optimization processes involving, forinstance, a numerical solution of the diffusion equation.
4. Conclusion
The statistical indicators related with the kinetics of massmigrations can be considered good. Particularly, the determi-nation coefficients were greater than 0.9850. In addition, theuse of proposed three-dimensional model enables obtaininginformation as, for instance, the local value of thewater quan-tity and sucrose gain, at any point within the parallelepipedthat represents the slices of guava.
The final sucrose gain was practically the same for twoexperiments carried out in this study. However, the finalwater quantity was significantly lesser for 50∘Brix and 40∘C(about 25%) than for 40∘Brix and 30∘C (about 34%).Thus, inorder to remove a major quantity of water, the experiment at50∘Brix and 40∘C should be preferred when compared withthe experiment at 40∘Brix and 30∘C.
The model analyzed in this paper presupposes restric-tive assumptions such as constant volume and diffusivities.However, even if the obtained results were not consideredcompletely satisfactory, these results could be used as initialvalues in other optimization processes that use numericalsolutions. Such solutions would take into account the men-tioned restrictions.
Practical Applications
In order to prolong the shelf life of fruits and vegetables,an alternative is the water removal. In this sense, this paperpresents a study on the guava osmotic dehydration usingsucrose solutions at two concentrations and two tempera-tures. Therefore, the results of this research can be used infood processing industry in order to partially remove waterof guava.
Conflict of Interests
The authors declare that there is no conflict of interestsregarding the publication of this paper.
Acknowledgment
The first author would like to thank CNPq (ConselhoNacional de Desenvolvimento Cientıfico e Tecnologico) forthe support given to this work and for the research grant(Process no. 301697/2012-4).
References
[1] A. Derossi, T. de Pilli, C. Severini, and M. J. McCarthy, “Masstransfer during osmotic dehydration of apples,” Journal of FoodEngineering, vol. 86, no. 4, pp. 519–528, 2008.
[2] M. A. M. Khan, L. Ahrne, J. C. Oliveira, and F. A. R. Oliveira,“Prediction of water and soluble solids concentration duringosmotic dehydration of mango,” Food and Bioproducts Process-ing, vol. 86, no. 1, pp. 7–13, 2008.
[3] M. A. C. Silva, J. L. G. Correa, and Z. E. Da Silva, “Applicationof inverse methods in the osmotic dehydration of acerola,”International Journal of Food Science and Technology, vol. 45, no.12, pp. 2477–2484, 2010.
[4] C. C. Ferrari, J. R. Arballo, R. H. Mascheroni, and M. D. Hub-inger, “Modelling ofmass transfer and texture evaluation duringosmotic dehydration of melon under vacuum,” InternationalJournal of Food Science & Technology, vol. 46, no. 2, pp. 436–443, 2011.
[5] S. K. Jain, R. C. Verma, L. K. Murdia, H. K. Jain, and G.P. Sharma, “Optimization of process parameters for osmoticdehydration of papaya cubes,” Journal of Food Science andTechnology, vol. 48, no. 2, pp. 211–217, 2011.
[6] G. D. Mercali, L. D. F. Marczak, I. C. Tessaro, and C. P.Z. Norena, “Evaluation of water, sucrose and NaCl effectivediffusivities during osmotic dehydration of banana (Musasapientum, shum.),” LWT—Food Science andTechnology, vol. 44,no. 1, pp. 82–91, 2011.
[7] J. R. Arballo, R. R. Bambicha, L. A. Campanone, M. E. Agnelli,and R. H.Mascheroni, “Mass transfer kinetics and regressional-desirability optimisation during osmotic dehydration of pump-kin, kiwi and pear,” International Journal of Food Science andTechnology, vol. 47, no. 2, pp. 306–314, 2012.
[8] W. P. da Silva, D. S. do Amaral, M. E. M. Duarte et al.,“Description of the osmotic dehydration and convective dryingof coconut (Cocos nucifera L.) pieces: a three-dimensionalapproach,” Journal of Food Engineering, vol. 115, no. 1, pp. 121–131, 2013.
[9] W. P. Da Silva, C. M. D. P. S. e Silva, M. A. A. Lins, and J. P.Gomes, “Osmotic dehydration of pineapple (Ananas comosus)pieces in cubical shape described by diffusion models,” FoodScience and Technology, vol. 55, no. 1, pp. 1–8, 2014.
[10] A. K. Yadav and S. V. Singh, “Osmotic dehydration of fruits andvegetables: a review,” Journal of Food Science and Technology,vol. 51, no. 9, pp. 1654–1673, 2012.
[11] E. Herman-Lara, C. E. Martınez-Sanchez, H. Pacheco-Angulo,R. Carmona-Garcıa, H. Ruiz-Espinosa, and I. I. Ruiz-Lopez,“Mass transfer modeling of equilibrium and dynamic periodsduring osmotic dehydration of radish in NaCl solutions,” Foodand Bioproducts Processing, vol. 91, no. 3, pp. 216–224, 2013.
[12] E. Amami, E. Vorobiev, and N. Kechaou, “Modelling of masstransfer during osmotic dehydration of apple tissue pre-treatedby pulsed electric field,” LWT—Food Science and Technology,vol. 39, no. 9, pp. 1014–1021, 2006.
[13] C. C. Garcia,M. A.Mauro, andM.Kimura, “Kinetics of osmoticdehydration and air-drying of pumpkins (Cucurbitamoschata),”Journal of Food Engineering, vol. 82, no. 3, pp. 284–291, 2007.
[14] K. O. Falade, J. C. Igbeka, and F. A. Ayanwuyi, “Kinetics ofmass transfer, and colour changes during osmotic dehydrationof watermelon,” Journal of Food Engineering, vol. 80, no. 3, pp.979–985, 2007.

Journal of Food Processing 7
[15] B. Singh, P. S. Panesar, and V. Nanda, “Osmotic dehydrationkinetics of carrot cubes in sodium chloride solution,” Interna-tional Journal of Food Science and Technology, vol. 43, no. 8, pp.1361–1370, 2008.
[16] W. P. Silva, C. M. D. P. S. Silva, J. E. F. Aires, and A. F. SilvaJunior, “Osmotic dehydration and convective drying of coconutslices: experimental determination and description using one-dimensional diffusion model,” Journal of the Saudi Society ofAgricultural Sciences, vol. 13, no. 2, pp. 162–168, 2013.
[17] L. M. Pereira, S. M. Carmello-Guerreiro, and M. D. Hubinger,“Microscopic features, mechanical and thermal properties ofosmotically dehydrated guavas,” LWT—Food Science and Tech-nology, vol. 42, no. 1, pp. 378–384, 2009.
[18] J. L. G. Correa, L. M. Pereira, G. S. Vieira, and M. D. Hubinger,“Mass transfer kinetics of pulsed vacuum osmotic dehydrationof guavas,” Journal of Food Engineering, vol. 96, no. 4, pp. 498–504, 2010.
[19] S. P. Kek, N. L. Chin, and Y. A. Yusof, “Direct and indirectpower ultrasound assisted pre-osmotic treatments in convectivedrying of guava slices,” Food and Bioproducts Processing, vol. 91,no. 4, pp. 495–506, 2013.
[20] W. P. Da Silva, C. M. D. P. S. E Silva, V. S. O. Farias, andA. G. B. Lima, “Effect of the geometry on the description ofthe water absorption by composite materials using diffusionmodels,”Materialwissenschaft undWerkstofftechnik, vol. 42, no.8, pp. 747–752, 2011.
[21] A. V. Luikov, Analytical Heat DiffusionTheory, Academic Press,London, UK, 1968.
[22] P. R. Bevington and D. K. Robinson, Data Reduction and ErrorAnalysis for the Physical Sciences, McGraw-Hill, Boston, Mass,USA, 2nd edition, 1992.
[23] W. P. da Silva, J. W. Precker, C. M. D. P. S. e Silva, and D.D. P. S. e Silva, “Determination of the effective diffusivity viaminimization of the objective function by scanning: applicationto drying of cowpea,” Journal of Food Engineering, vol. 95, no. 2,pp. 298–304, 2009.
[24] W. P. Da Silva, V. S. DeOliveira Farias, G. DeArau JoNeves, andA. G. B. De Lima, “Modeling of water transport in roof tiles byremoval of moisture at isothermal conditions,” Heat and MassTransfer, vol. 48, no. 5, pp. 809–821, 2012.
[25] W. P. da Silva, C. M. D. P. S. e Silva, and J. P. Gomes, “Dryingdescription of cylindrical pieces of bananas in different temper-atures using diffusion models,” Journal of Food Engineering, vol.117, no. 3, pp. 417–424, 2013.

Submit your manuscripts athttp://www.hindawi.com
Hindawi Publishing Corporationhttp://www.hindawi.com Volume 2014
Anatomy Research International
PeptidesInternational Journal of
Hindawi Publishing Corporationhttp://www.hindawi.com Volume 2014
Hindawi Publishing Corporation http://www.hindawi.com
International Journal of
Volume 2014
Zoology
Hindawi Publishing Corporationhttp://www.hindawi.com Volume 2014
Molecular Biology International
GenomicsInternational Journal of
Hindawi Publishing Corporationhttp://www.hindawi.com Volume 2014
The Scientific World JournalHindawi Publishing Corporation http://www.hindawi.com Volume 2014
Hindawi Publishing Corporationhttp://www.hindawi.com Volume 2014
BioinformaticsAdvances in
Marine BiologyJournal of
Hindawi Publishing Corporationhttp://www.hindawi.com Volume 2014
Hindawi Publishing Corporationhttp://www.hindawi.com Volume 2014
Signal TransductionJournal of
Hindawi Publishing Corporationhttp://www.hindawi.com Volume 2014
BioMed Research International
Evolutionary BiologyInternational Journal of
Hindawi Publishing Corporationhttp://www.hindawi.com Volume 2014
Hindawi Publishing Corporationhttp://www.hindawi.com Volume 2014
Biochemistry Research International
ArchaeaHindawi Publishing Corporationhttp://www.hindawi.com Volume 2014
Hindawi Publishing Corporationhttp://www.hindawi.com Volume 2014
Genetics Research International
Hindawi Publishing Corporationhttp://www.hindawi.com Volume 2014
Advances in
Virolog y
Hindawi Publishing Corporationhttp://www.hindawi.com
Nucleic AcidsJournal of
Volume 2014
Stem CellsInternational
Hindawi Publishing Corporationhttp://www.hindawi.com Volume 2014
Hindawi Publishing Corporationhttp://www.hindawi.com Volume 2014
Enzyme Research
Hindawi Publishing Corporationhttp://www.hindawi.com Volume 2014
International Journal of
Microbiology