Research & Occasional Paper Series: CSHE.4.16 UNIVERSITY ...
14
Research & Occasional Paper Series: CSHE.4.16 UNIVERSITY OF CALIFORNIA, BERKELEY http://cshe.berkeley.edu/ A PROPOSAL TO ELIMINATE THE SAT IN BERKELEY ADMISSIONS May 2016 Saul Geiser * UC Berkeley Copyright 2016 SAUL GEISER, all rights reserved. ABSTRACT The SAT is used for two purposes at the University of California. First is eligibility: Determining whether applicants meet the minimum requirements for admission to the UC system. Second is admissions selection: At high-demand campuses such as Berkeley, with many more eligible applicants than places available, test scores are used to select from among them. UC policy delegates authority to the faculty at each campus to establish local admissions procedures that reflect “campus values and academic priorities.” Under the proposal outlined here, while retaining the test for eligibility, Berkeley would eliminate the SAT (and ACT) as a factor in local admissions decisions. There are strong reasons for doing so. With the advent of “holistic” review in Berkeley admissions, the SAT has become almost entirely redundant and adds little to the much richer body of information now available in applicants’ files. After taking that information into account, the SAT predicts less than 2 percent of the variance in students’ first-year grades at Berkeley. This introduces a considerable element of error in admissions decisions, as many students predicted to perform well actually perform worse than those with lower scores, and vice versa. Most troubling, the SAT has a severe adverse effect on admission of students of color beyond what is warranted by test validity. There is clear evidence, much of it produced by Berkeley researchers, that the SAT exhibits differential prediction, differential item functioning, and related psychometric issues when used with black and Latino examinees. National testing standards oblige colleges and universities to be sensitive to such issues, but in California, Proposition 209 bars sensitivity to race in admissions decisions. If Berkeley cannot consider race as a contextual factor in admissions, neither should it consider SAT scores. The cost of the SAT, in terms of its adverse impact on students of color, is far out of proportion with its marginal benefit as an indicator of student success at Berkeley. Keywords: Higher education, college admissions, standardized tests, race and ethnicity The SAT is employed at two main decision points in undergraduate admissions at the University of California. First is eligibility: Test scores are among the principal criteria used to determine whether applicants qualify within the top eighth of California high school graduates and are thereby eligible for admission to the UC system (if not necessarily at their campus of choice). Campuses have little say over the use of test scores for this purpose. Minimum test-score requirements are set by a university- wide faculty committee, the Board of Admissions and Relations with Schools (BOARS), subject to approval by the UC regents. Along with high school GPA and class rank, SAT scores are used to identify the broader “eligibility pool” – California residents who rank within the top 12.5% of the state’s high school graduates -- from which UC campuses admit their students. 1 The second main decision point where the SAT is employed is admissions selection. At campuses, such as Berkeley, that have more eligible applicants than places available, test scores are among the criteria used to compare applicants and select from among them. Unlike eligibility, however, use of test scores in selection is largely under campus control; UC policy delegates authority to the faculty at each campus to design local admissions procedures. UC has a longstanding tradition of local control * Saul Geiser is a Research Associate at the Center for Studies in Higher Education (CSHE) at Berkeley and former director of admissions research for the UC system. 1 In addition to the SAT, UC applicants may also submit ACT scores to establish eligibility. California is predominantly an “SAT state,” and a much smaller percentage of students take the ACT than the SAT, although that percentage has grown in recent years. From a psychometric standpoint, there is little difference between the tests; most American colleges and universities accept both tests and treat SAT and ACT scores interchangeably. Unless otherwise specifically noted in the following pages, all statements about the SAT apply also to the ACT.
Transcript of Research & Occasional Paper Series: CSHE.4.16 UNIVERSITY ...

Research & Occasional Paper Series: CSHE.4.16
UNIVERSITY OF CALIFORNIA, BERKELEY http://cshe.berkeley.edu/
A PROPOSAL TO ELIMINATE THE SAT IN BERKELEY ADMISSIONS
May 2016
Saul Geiser* UC Berkeley
Copyright 2016 SAUL GEISER, all rights reserved.
ABSTRACT The SAT is used for two purposes at the University of California. First is eligibility: Determining whether applicants meet the minimum requirements for admission to the UC system. Second is admissions selection: At high-demand campuses such as Berkeley, with many more eligible applicants than places available, test scores are used to select from among them. UC policy delegates authority to the faculty at each campus to establish local admissions procedures that reflect “campus values and academic priorities.” Under the proposal outlined here, while retaining the test for eligibility, Berkeley would eliminate the SAT (and ACT) as a factor in local admissions decisions. There are strong reasons for doing so. With the advent of “holistic” review in Berkeley admissions, the SAT has become almost entirely redundant and adds little to the much richer body of information now available in applicants’ files. After taking that information into account, the SAT predicts less than 2 percent of the variance in students’ first-year grades at Berkeley. This introduces a considerable element of error in admissions decisions, as many students predicted to perform well actually perform worse than those with lower scores, and vice versa. Most troubling, the SAT has a severe adverse effect on admission of students of color beyond what is warranted by test validity. There is clear evidence, much of it produced by Berkeley researchers, that the SAT exhibits differential prediction, differential item functioning, and related psychometric issues when used with black and Latino examinees. National testing standards oblige colleges and universities to be sensitive to such issues, but in California, Proposition 209 bars sensitivity to race in admissions decisions. If Berkeley cannot consider race as a contextual factor in admissions, neither should it consider SAT scores. The cost of the SAT, in terms of its adverse impact on students of color, is far out of proportion with its marginal benefit as an indicator of student success at Berkeley. Keywords: Higher education, college admissions, standardized tests, race and ethnicity The SAT is employed at two main decision points in undergraduate admissions at the University of California. First is eligibility: Test scores are among the principal criteria used to determine whether applicants qualify within the top eighth of California high school graduates and are thereby eligible for admission to the UC system (if not necessarily at their campus of choice). Campuses have little say over the use of test scores for this purpose. Minimum test-score requirements are set by a university-wide faculty committee, the Board of Admissions and Relations with Schools (BOARS), subject to approval by the UC regents. Along with high school GPA and class rank, SAT scores are used to identify the broader “eligibility pool” – California residents who rank within the top 12.5% of the state’s high school graduates -- from which UC campuses admit their students.1 The second main decision point where the SAT is employed is admissions selection. At campuses, such as Berkeley, that have more eligible applicants than places available, test scores are among the criteria used to compare applicants and select from among them. Unlike eligibility, however, use of test scores in selection is largely under campus control; UC policy delegates authority to the faculty at each campus to design local admissions procedures. UC has a longstanding tradition of local control
* Saul Geiser is a Research Associate at the Center for Studies in Higher Education (CSHE) at Berkeley and former director of admissions research for the UC system. 1 In addition to the SAT, UC applicants may also submit ACT scores to establish eligibility. California is predominantly an “SAT state,” and a much smaller percentage of students take the ACT than the SAT, although that percentage has grown in recent years. From a psychometric standpoint, there is little difference between the tests; most American colleges and universities accept both tests and treat SAT and ACT scores interchangeably. Unless otherwise specifically noted in the following pages, all statements about the SAT apply also to the ACT.

GEISER: Eliminating the SAT in Berkeley Admissions 2
CSHE Research & Occasional Paper Series
over admissions, allowing campuses discretion to tailor their selection procedures to reflect “campus values and academic priorities” (University of California, 2014:3). UC policy on admissions selection also differs from that on eligibility in another important way. While SAT (or ACT) scores are specifically required for eligibility, there is no similar requirement for selection. UC policy establishes only a general expectation that campus selection “… honors academic achievement and accords priority to students of high academic accomplishment” (University of California, 2014:3). The policy encourages the use of multiple measures, rather than any single measure, for this purpose. Campuses thus consider a broad array of academic indicators, in addition to SAT scores, when reviewing applicants’ files: High school GPA in UC-approved courses; class rank; completion of a-g coursework beyond the minimum required; number of Advanced Placement, honors, or International Baccalaureate courses taken; scores on AP exams and SAT II Subject Tests; quality of senior-year program; and recent marked improvement in academic performance, among others. Nothing in UC policy, however, dictates the specific weight that campuses must give to SAT scores in admissions selection. Indeed, UC admissions policy and guidelines state only that campuses “may” consider test scores in selection and leaves decisions about the relative importance of different factors to local faculty admissions committees (UC, 2014:3). Thus, were Berkeley to reduce the weight given to the SAT to zero, effectively eliminating test scores as a selection criterion, such a change could be made within the parameters of existing UC admissions policy and would not require approval from BOARS or the UC regents. Eliminating use of the SAT in selection differs, in this respect, from “test optional” reforms adopted at some other colleges and universities; going test-optional at Berkeley would require regental approval. Eliminating the SAT in selection would not, as long test scores continued to be employed in determining whether applicants met UC’s minimum eligibility requirements. Though it would prudent to consult with others in the UC system before taking such a decision, the decision itself is the campus’s prerogative. Granted that such a proposal is possible under UC policy, why should Berkeley eliminate the SAT in admissions selection? Would it not diminish the academic quality of the admitted class and thereby reduce student persistence and completion? The case for eliminating the SAT at Berkeley is threefold: First, as an admissions criterion, the SAT is almost entirely redundant and adds little information not already available from other academic indicators. The raison d’etre for college admissions tests is their predictive validity, that is, their ability to predict student success in college. But at campuses like Berkeley and UCLA, where applicants’ files now contain a broad array of other academic indicators, SAT or ACT scores add little incremental validity in predicting student performance. Though use of test scores may have made sense at one time as a stand-alone, short-hand measure of student readiness for college, it makes much less sense today with the advent of “holistic” review in Berkeley admissions. Eliminating the SAT in admissions selection would have virtually no impact on the academic quality of the admitted class. Second, while SAT scores may be useful in predicting average performance for large groups of students, they are much less useful in individual cases. Test scores account for only a tiny fraction of the variance of first-year college grades (the outcome measure conventionally employed in predictive-validity studies), and the confidence intervals or error bands around test-based predictions of student performance are very broad. Ranking individual applicants on the basis of test scores thus introduces a considerable element of error, as applicants predicted to do well often perform more poorly than lower-scoring students, and vice versa. Comparing applicants on the basis of test scores is especially problematic when score differences are small – as is often the case at selective institutions like Berkeley, where most applicants have relatively high scores. Using SAT or ACT scores to make fine distinctions among applicants assumes a false precision that is unwarranted by their limited predictive power. Third, compared to other admissions criteria such as high school grades, SAT scores have much more adverse impact on low-income applicants and students of color. SAT and ACT scores correlate strongly with family income, parental education, and race/ethnicity, while high school grades do not. As a result, test scores accentuate socioeconomic and racial disparities among applicants to a much greater extent than other selection criteria. The cost of the SAT, in terms of its adverse effect on admission of low-income and minority applicants, is far out of proportion with any marginal benefit it provides as an indicator of how students will perform at Berkeley. The following analysis explains and documents each of these assertions.

GEISER: Eliminating the SAT in Berkeley Admissions 3
CSHE Research & Occasional Paper Series
A. What Does the SAT Add to the Prediction of Student Performance at Berkeley? After other information in an applicant’s file is considered, SAT or ACT scores yield only a small incremental improvement in predicting student success at UC. The relatively weak “predictive validity” of the SAT is a longstanding issue that prevented its adoption at UC until much later than many other selective institutions. Berkeley scholar John Aubrey Douglass has documented UC’s early history with the SAT and the faculty’s initial reservations about the test. UC had experimented with the SAT as early as 1960, when it required the test on a trial basis in order to evaluate its effectiveness. “Extensive analysis of the data,” BOARS chair Charles Jones concluded in 1962, “leave the Board wholly convinced that the Scholastic Aptitude Test scores add little or nothing to the precision with which the existing admissions requirements are predictive of success in the University.” BOARS voted unanimously to reject the test (Douglass, 2007:90). Lobbied by the Educational Testing Service, UC conducted another major study in 1964 of the predictive value of achievement exams such as the SAT II Subject Tests, which assess student knowledge of specific subjects. The study again showed that tests were of limited value in predicting academic success at UC, although achievement exams were slightly superior to the SAT. High school GPA remained the best indicator, explaining 22% of the variance in university grades, while subject tests explained 8%. Combining high school GPA and test scores did yield a marginal improvement, but the study concluded that the gain was too small to warrant adoption of the tests in UC admissions (Douglass, 2007:91-92). Again, BOARS’ decision was to reject the tests. Yet the “tidal wave” of California high school graduates that Clark Kerr and the Master Plan architects had anticipated would soon tip the scales in favor of the SAT, if for reasons other than its predictive accuracy. With the growing volume of applicants to UC, test scores were useful as an administrative tool to cull UC’s eligibility pool and limit it to the prescribed 12.5% mandated by the Master Plan. And at high-demand campuses like Berkeley and UCLA, SAT scores had the “added practical advantage,” in the words of UC director of admissions Edward W. Bowes, of providing a numerical, seemingly objective basis for sorting large numbers of applicants and reducing complaints from the growing number of those denied admission (Douglass, 2007:92). Still, compared to other public and private universities, UC was much slower to embrace the national tests. In 1968, UC for the first time required all applicants to take the SAT or ACT but limited the use of test scores to specific purposes such as evaluating of out-of-state applicants and assessing the eligibility of in-state students with very low GPAS (between 3.00 and 3.09), who represented less than 2% of all admits. By and large, tests were still not widely employed in UC admissions (UCOP, 1977). This changed in 1979, following a 1976 study by the California Postsecondary Education Commission that showed that UC eligibility criteria then in place were drawing almost 15% of the state’s high school graduates, well in excess of the university’s 12.5% Master Plan target. Rather than tightening UC’s GPA requirements, BOARS chair Allan Parducci proposed an “eligibility index,” combining grades and test scores, to address the problem. The index was an offsetting scale that required students with lower GPAs to earn higher test scores, and conversely. The effect was to extend a minimum test-score requirement to the majority of UC applicants. The proposal was controversial because of its anticipated adverse effect on low-income and underrepresented minority applicants, and it was narrowly approved by the regents in a close vote (Douglass, 2007:116-117). The SAT would soon feature more prominently in admissions selection as well, and for the same reason – its administrative convenience as a tool to sort the ballooning volume of applications at Berkeley and UCLA after the UC system introduced multiple filing in 1986.2 The change was codified in new policy guidelines, issued by UC’s office of the president in 1988, establishing a “two tier” structure for campus admissions. The guidelines required that the top 40% to 60% of entering freshmen be admitted on the basis of academic criteria alone – primarily grades and test scores – with the remainder admitted on the basis of a combination of academic and “supplemental” criteria. Race and ethnicity were explicitly included among the supplemental criteria. The guidelines were, in effect, a compromise between the competing goals of selectivity and diversity -- a compromise that would hold for only a few years, however, before being shattered in 1995 by Regents’ resolution SP-1, eliminating race as a supplemental admissions criterion. It might be presumed that UC’s increasing reliance on the SAT during this period was accompanied by concurrent improvements in the accuracy and validity of the test itself, but that presumption would be mistaken. In the aftermath of SP-1 (and, a year later, passage of Proposition 209, which amended the state constitution to bar consideration of race in all public education), UC
2 Multiple filing enabled students to submit one application to any and all UC campuses by means of a central application processing system. In the first year of multiple filing, the total number of applications increased dramatically, and Berkeley and UCLA for the first time received vastly more applications from eligible students than they were able to accommodate.

GEISER: Eliminating the SAT in Berkeley Admissions 4
CSHE Research & Occasional Paper Series
undertook a sweeping review of all of its admissions criteria – the SAT, in particular -- in an effort to reverse plummeting minority enrollments. The findings of that review were strikingly similar to what BOARS had found 40 years earlier. In a large-scale study commissioned by BOARS in 2001, the results showed once again that SAT scores yielded only a small incremental improvement over high school GPA in predicting first-year grades at UC (see Figure 1). High school GPA accounted for 15.4% of the variance in freshman grades; adding students’ scores from the SAT I “reasoning test” into the prediction model improved the explained variance to 20.4%. The SAT provided an incremental gain, in other words, of about five percentage points, similar to what BOARS had found in 1962.
Predictorvariables/equations: Explainedvarariance:
(1) HSGPA 15.4%(2) HSGPA+SATIreasoningtest 20.8%(3) HSGPA+SATIIsubjecttests 22.2%(4) HSGPA+SATI+SATII 22.3%(5) SATIincrement(5-4) 0.1%
Figure1
PercentofVarianceinUCFirst-YearGradesExplainedbyHighSchoolGPAandTestScores
Source:Geiser&Studley,2002,Table2.Basedona sampleof77,893fi rs t-timefreshmenenteringUCfrom1996through1999.
The 2001 UC study also replicated another result from BOARS’ 1964 study: Achievement exams such as the SAT II Subject Tests were slightly superior to the SAT I in predicting first-year performance at UC, providing an incremental gain of about seven percentage points over high school GPA alone. Moreover, after taking account of high school GPA and SAT II Subject Test scores, the SAT I yielded little further incremental improvement and became almost entirely redundant. Based in part on this finding, then-UC president Richard C. Atkinson proposed eliminating the SAT reasoning test at UC in favor of curriculum-based achievement exams like the SAT II Subject tests (Atkinson, 2001).3 As well as replicating BOARS’ earlier findings, the 2001 UC study went beyond that work to examine the extent to which the predictive power of the SAT is conditioned by socioeconomic factors such as family income and parental education. Up to that time, the vast majority of predictive-validity studies ignored socioeconomic factors and relied on simple correlations. Researchers calculated the correlation between SAT or ACT scores and college grades, and the size of the correlation was taken as an indicator of the predictive power of the tests. Even today, studies conducted by the national testing agencies report multiple correlations involving only two variables, as when they examine the joint effect of SAT scores and high school GPA in predicting college grades (see, e.g., Patterson, Mattern, & Kobrin, 2009). But correlations of this kind can be misleading because they mask the effects of socioeconomic factors on prediction estimates. Family income and parental education are strongly correlated not only with SAT scores but also with college outcomes, so that much of the apparent predictive power of the SAT or ACT actually reflects the “proxy” effects of socioeconomic status (SES). The 2001 UC study found that when family income and education were included in the prediction model along with high school GPA and test scores, the predictive weight for SAT scores was reduced. (The weight for high school GPA, on the other hand, was undiminished; see Geiser & Studley, 2002:10-14). This finding was subsequently confirmed in an independent study by Berkeley economist Jesse Rothstein in 2004:
The results here indicate that the exclusion of student background characteristics from prediction models inflates the SAT’s apparent validity, as the SAT score appears to be a more effective measure of the demographic characteristics that predict UC FGPA [freshman grade-point average] than it is of preparedness conditional on student background . . . [A] conservative estimate is that traditional methods and sparse models [i.e., those that do
3 The College Board responded by revising the SAT in 2005. The new test eliminated two of its more controversial item-types, verbal analogies and quantitative comparisons, and added a writing test, thus addressing some of Atkinson’s and BOARS’ criticisms and moving the exam more in the direction of a curriculum-based assessment. But the changes did not fundamentally alter the test’s basic design and, like the ACT, it has remained a norm-referenced, as opposed to a criterion-referenced, assessment. Nor have the changes improved the test’s predictive accuracy. According to the College Board: “The results show that the changes made to the SAT did not substantially change how well the test predicts first-year college performance” (Kobrin, et al, 2008:1).

GEISER: Eliminating the SAT in Berkeley Admissions 5
CSHE Research & Occasional Paper Series
not take socioeconomic factors into account] overstate the SAT’s importance to predictive accuracy by 150 percent (Rothstein, 2004:297).
Later studies have extended the UC findings from California to the nation as a whole and from outcomes such as first-year college grades to other performance measures such as college graduation. The largest and most definitive study of college graduation undertaken to date is Bowen, Chingos, and McPherson’s Crossing the Finish Line. Based on a massive sample of freshmen at 21 state flagship universities and four state higher education systems, William G. Bowen and his colleagues found:
High school grades are a far better predictor of both four-year and six-year graduation rates than are SAT/ACT test scores – a central finding that holds within each of the six sets of public universities that we study . . . Test scores, on the other hand, routinely fail to pass standard tests of statistical significance when included with high school GPA in regressions predicting graduation rates . . . (Bowen, Chingos, and McPherson, 2009:113-115).
Returning to the question posed at the beginning of this section: How much does the SAT contribute to the prediction of student performance at Berkeley? As we have seen, the answer depends to a considerable extent on what other academic or socioeconomic factors are included in the prediction model. The advent of “holistic” review in Berkeley admissions has expanded the availability of both kinds of applicant data far beyond the crude index of high school grades and test scores used to determine minimum eligibility for the UC system. After taking those other factors into account, what does the SAT uniquely add as an indicator of student success at Berkeley? An answer is provided in a 2008 study conducted by Sam Agronow, former director of policy, planning, and analysis at Berkeley. In a regression model predicting first-year grades at Berkeley, Agronow entered all available measures from the UC application. In addition to high school GPA and SAT or ACT-equivalent scores, these included: students’ course totals in the UC-required “a-g” sequence, whether the student ranked in the top 4% of their class, scores on two SAT II Subject Tests, family income, parental education, language spoken in the home, participation in academic preparation programs, and the rank of the applicants’ high school on the state’s Academic Performance Index. Entering all of these factors into the prediction model, Agronow found that they explained 21.7% of the variance in students’ first-year grades at Berkeley. When he eliminated SAT scores from the model, thus isolating the unique contribution of the SAT, the explained variance dropped to 19.8%. SAT scores, in other words, accounted for less than 2 percent of the total variance in students’ first-year performance at Berkeley.4 To be clear: SAT and ACT-equivalent scores do add a statistically significant, if marginal, increment to the prediction of student performance at Berkeley. But in the context of all of the other information now available on Berkeley applicants, the SAT is largely redundant, and its unique contribution is small. B. Prediction Error in Selection Decisions Nevertheless, even if the SAT’s contribution is small, it might be argued that any improvement in prediction, however marginal, is useful if it adds information. More information is always better than less, on this view, and using SAT scores in tandem with other applicant data may improve the quality of admissions decisions. A key problem with this argument is that it ignores prediction error. In applicant pools like Berkeley’s, where most applicants have relatively high scores to begin with, relying on small test-score differences to compare and rank students produces almost as many wrong decisions as correct ones. The following example (see Figure 2 below), based on findings from a sample of over 200,000 UC freshmen, will illustrate. Consider two applicants who are matched in all other respects -- same high school grades, socioeconomic background, and so forth -- except that the first student scored 1300 on the SAT and the second 1400. The choice would seem obvious. Test scores are sometimes used as a tie-breaker to choose between applicants who are otherwise equally qualified, and in this case the tie would go to the second student. 4 Compare prediction models 21 and 22 in Agronow, 2008:107. Agronow’s primary focus was the incremental contribution of the SAT II Subject Tests that UC then required for eligibility, but his results provide the same estimate for the SAT I “reasoning test.” Although the Subject Tests were subsequently removed from UC eligibility requirements by policy changes in 2012, they continue to be employed in admissions selection at Berkeley along with Advanced Placement and International Baccalaureate exams. In addition to those exams, Berkeley’s holistic-review process also considers a variety of other quantitative and qualitative indicators that are not on the UC application but are known to correlate with student outcomes. Inclusion of those additional factors in the prediction model would likely reduce still further the incremental contribution uniquely attributable to the SAT below the 2 percent estimate given here.

GEISER: Eliminating the SAT in Berkeley Admissions 6
CSHE Research & Occasional Paper Series
What this ignores, however, are two measurement issues. First, because SAT scores account for such a small fraction of the variance in college grades, their effect size is miniscule. Controlling for other academic and nonacademic factors in students’ files, a 100-point increment in SAT scores translates into an effect size of just 0.13 of a grade point, or the difference between a GPA of 3.00 and 3.13, for the overall UC sample.5 Second, the error bands or confidence intervals around predicted performance are large and, indeed, substantially larger than the effect size itself. The error band around predicted GPA for the UC sample was plus or minus 0.81 grade points at the 95 percent confidence level, the standard normally employed in social-science research. The error band, in other words, was over six times larger than the difference in outcomes predicted by the two applicants’ SAT scores. For both students, the most that can be said is that actual performance at UC is likely to fall somewhere in a broad range between an A- and a C+ average. Because the confidence interval is so much larger than the actual effect size, reliance on SAT scores to compare or rank individual applicants introduces a substantial amount of noise in admissions decision-making. Two types of error are involved. First are “false positives,” that is, instances where an applicant admitted on the basis of higher test scores performs worse than an applicant denied admission would have performed. Second are “false negatives,” that is, students denied admission who would have performed better than some of those admitted. Both kinds of error are inevitable when the predictive power of tests is low and score differences are small. Still, it may be argued that, notwithstanding the large error component that they introduce, SAT scores provide a cost-saving and administratively convenient metric for managing admissions at campuses like Berkeley, that receive tens of thousands of applications. After all, test scores do have incremental predictive value “on average,” that is, over large groups of students. Whatever errors they produce in individual cases may be justified by their usefulness as an administrative tool. The main counter to that argument is that the effect of SAT scores, whether for individuals or groups, is non-random. Test scores accentuate socioeconomic and racial differences to a much greater degree than other admissions criteria. C. Adverse impact of SAT Scores on Admission of Students of Color Proponents of the SAT often point out that other measures of student achievement also exhibit gaps between students of color and other applicants:
Results indicate that the score gaps that are observed in admission tests among members of different racial and ethnic groups and different socioeconomic groups are also found in other standardized tests and in other measures
5 This estimate is based on regression analysis of a sample of 201,853 California residents entering UC between 1994 and 2005 (Geiser, 2015:19-20). The dependent variable studied was students’ cumulative GPA after four years at UC, although the results are very similar when first-year GPA at UC is employed as the outcome criterion (Geiser & Studley, 2002:10-14). The full prediction model included the following factors, in addition to SAT scores: high school GPA, total number of UC-required courses taken, parents’ education, family income, race/ethnicity, language spoken in the home, academic major/discipline, UC campus, and year of UC matriculation. A 100-point difference in SAT scores represented slightly over half (.54) of one standard deviation for the study sample.
Source: UC Corporate Student data. See footnote 5.

GEISER: Eliminating the SAT in Berkeley Admissions 7
CSHE Research & Occasional Paper Series
of educational attainment. It is hypothesized that these differences are a powerful illustration of an important social problem: inequitable access to high quality education (Camara & Schmidt, 1999:1). The indisputable fact is that both high school grades and scores on admissions tests are reflections of the same education system, with all its flaws and inequities (Zwick, 1999:323).
These statements are true but misleading, since they obscure a fundamental point: The magnitude of the gap between students of color and others is much greater for SAT scores than for other admissions criteria such as high school GPA. Compared to that measure, SAT (and ACT-equivalent) scores are much more closely correlated with socioeconomic background factors such as parents’ education, family income, and race/ethnicity.
Parents' Family UnderrepresentedEducation Income MinorityStatus
SATScores 0.45 0.36 -0.38
HighSchoolGPA 0.14 0.11 -0.17
completedatawereavailableonall covariates.N=868,484.
Figure3
CorrelationofSATScoresandHighSchoolGPAwithSocioeconomicBackgroundofUCApplicants
Source:UCCorporateStudentdataonall Californiaresidentswhoappliedforfreshmanadmissionbetween1994and2011andforwhom
For this reason, when SAT scores are used to compare and rank applicants, they magnify socioeconomic and demographic differences to a much greater extent than other criteria, thereby reducing the chances of admission for low-income applicants generally and for students of color, in particular. Figure 4 will illustrate. The figure is based on a sample of over 1.1 million California residents who applied for freshman admission at UC from 1994 to 2011. Applicants were divided into ten equal groups, or deciles, based on their test scores. The red bars in the figure represent the percentage of applicants within each decile who were Latino or black. The blue bars show the percentage of Latino and black applicants when the same students were ranked by high school grade-point average.
The difference is stark. Although SAT scores and high school GPA both have an adverse impact on students of color, the demographic footprint of the SAT is far more pronounced. At the bottom of the applicant pool, Latino and black applicants make up 60 percent of the lowest SAT decile but only 39 percent of the lowest HSGPA decile. Conversely, within the top decile – those

GEISER: Eliminating the SAT in Berkeley Admissions 8
CSHE Research & Occasional Paper Series
most likely to be admitted – Latinos and blacks account for 12 percent of applicants when ranked by high school grades but just 5 percent when ranked by SAT scores. The relative emphasis that institutions place on the two criteria can thus make a substantial difference in the demographic composition of the admitted class. The demographic footprint of the SAT shown here raises a fundamental question about costs and benefits: Is the adverse racial impact of the SAT justified in view of the relatively limited benefit it provides in predicting student performance at Berkeley? D. Predictive Validity of the SAT for Students of Color The adverse effect of the SAT on students of color might be easier to justify were the test a better predictor of college success for those students. In fact, the opposite is true: SAT scores are significantly poorer predictors of how Latino and black students perform at UC. Figure 5 shows the relative weights of high school GPA and SAT scores in predicting 5-year graduation rates at UC. The coefficients are standardized, meaning that they show the effect of a one standard-deviation change in each measure on the probability of graduating from UC when the other measure is held constant.6 Weights are given both before and after controlling for family income and parents’ education in order to take into account the “proxy” effects of SES noted earlier.
The first two pairs of bars show the relative weight of high school GPA and SAT scores in predicting graduation rates for all UC freshmen. Much of the SAT’s apparent predictive power reflects the proxy effect of socioeconomic status, so that when family income and parents’ education are added to the regression model, the predictive weight for SAT scores drops by about a third. The weight for high school GPA, on the other hand, remains about the same. The last two pairs of bars show the same results for underrepresented minority students. In the prediction model that does not include SES, the coefficient on SAT scores for students of color is significantly smaller than that for all students. And when controls for SES are introduced, the predictive weight of SAT scores for black and Latino students is reduced even further. Not only do SAT scores have a strong adverse effect on admission of students of color, but also they are very poor indicators of how those students actually perform at UC.7
6 The modal time-to-degree for students who graduate from UC is about four years and a quarter, so that a 5-year graduation rate captures modal time-to-degree. The standardized logistic regression weights show the effect of a one-standard deviation change in each measure on the log odds of graduation, ceteris paribus. 7 For the technical reader: It might be thought that the relatively poor predictive power of SAT scores compared with HSGPA may reflect range restriction of test scores among the pool of students admitted to UC, but that is not the case. In fact, comparing the pool of admitted students with the larger UC applicant pool, HSGPA is far more range-restricted than SAT scores, as UC has long weighed high school grades more heavily in both eligibility and admissions selection.

GEISER: Eliminating the SAT in Berkeley Admissions 9
CSHE Research & Occasional Paper Series
E. National Standards for Fairness in Testing In 2014, the American Educational Research Association, American Psychological Association, and National Council on Measurement in Education jointly issued the latest revision of their National Standards for Educational and Psychological Testing. First issued in 1955, and previously revised in 1974, 1985, and 1999, the Standards address all aspects of test design, development, and use. While they do not carry the force of law, the Standards provide specific guidance on the responsibilities of both test developers and users to ensure “fairness in testing.” Standard 3.16 states:
When credible research indicates that test scores for some relevant subgroups are differentially affected by construct-irrelevant characteristics of the test or of the examinees, when legally permissible, test users should use the test only for those subgroups for which there is sufficient evidence of validity to support score interpretations for the intended uses” (AERA/APA/NCME, 2014:70).
Looking past the technical language, Standard 3.16 is making a simple point: Colleges and universities have a responsibility to be sensitive to the differential impact of their tests on particular subgroups, beyond what can be reasonably justified by measurement validity. When this does occur, colleges and universities have an obligation to mitigate the adverse effects of the tests they employ. Note that evidence of adverse impact, by itself, does not suffice to trigger application of Standard 3.16. The standard comes into play only when that impact cannot reasonably be justified by a test’s measurement validity. How does this standard apply, if at all, to the factual circumstances of Berkeley admissions? On the one hand, it is clear that the cost of the SAT, in terms of its adverse impact on admission of students of color, is far out of proportion to the limited incremental benefit it provides in predicting student performance at Berkeley as measured by grades and graduation rates. This is especially apparent when one compares the SAT with high school GPA. Yet the weighing of costs and benefits is partly in the eye of the beholder, and reasonable persons may strike the balance differently. Beyond the general balancing of costs and benefits, the Standards list a number specific psychometric issues, or “threats to fairness,” that may indicate that a test has unwarranted effects on specific subgroups. Those include differential prediction, item functioning, and test context. There is substantial evidence, much of it produced by researchers at Berkeley, that the SAT exhibits all of these issues when employed with students of color. Differential prediction occurs “… when differences exist in the pattern of associations between test scores and other variables for different groups, bringing with it concerns about bias in the inferences drawn from the use of test scores” (AERA/APA/NCME, 2014:51). At UC, SAT scores are a significantly weaker predictor of graduation rates for black and Latino than other students, as noted immediately above. Differential item functioning, or DIF, occurs “… when equally able test takers differ in their probabilities of answering a test item correctly as a function of group membership” (AERA/APA/NCME, 2014:51). There is clear evidence of DIF on the SAT. The most recent and authoritative work in this area is that by psychometricians Veronica Santelices and Mark Wilson of Berkeley’s graduate school of education. Based on analysis of several forms of the SAT offered in different years, they found that about 10% of all items exhibited large DIF for black examinees and 3% to 10% for Latino examinees, depending on the year and form; moderate-to-low levels of DIF were found for a substantially larger percentage of items for both subgroups (Santelices & Wilson, 2012:23).8 It should be emphasized that both the College Board and ACT take strenuous measures to eliminate DIF, so that any such effects are unintentional. Gone are the days when items such as “runner is to marathon as oarsman is to regatta” would survive the rigorous, multi-step review process that test developers now follow. Despite this, however, there are grounds for believing that norm-referenced exams like the SAT or ACT may unintentionally create DIF because of the way those tests are developed. Before any item is included in the SAT, it is reviewed for reliability, which is measured by the internal correlation between performance on that item and overall performance on the test among a reference population. If the correlation drops below 0.30, the item is typically flagged and excluded from the test.
8 Santelices and Wilson’s main finding was that differential item functioning for black and Latino examinees was inversely related to item difficulty. Surprisingly, DIF was greater on easier rather than on more difficult SAT items.

GEISER: Eliminating the SAT in Berkeley Admissions 10
CSHE Research & Occasional Paper Series
UC Riverside scholar William C. Kidder, with Jay Rosner of the Princeton Review, argues that when the reference population is comprised disproportionately of non-minority examinees, the norming process will systematically tend to exclude items on which minority students perform well, and vice versa, even though the items seem unbiased on their face:
Such a bias tends to be obscured because Whites have historically scored higher on the SAT than African Americans and Chicanos. The entire score gap is usually attributed to differences in academic preparation, although a significant and unrecognized portion of the gap is an inevitable result of … the development process (Kidder and Rosner, 2002:159).
Differential test context refers to:
. . . multiple aspects of the test and testing environment that may affect the performance of an examinee and consequently give rise to construct-irrelevant variance in the test scores. As research on contextual factors (e.g., stereotype threat) is ongoing, test developers and test users should pay attention to the emerging empirical literature on these topics so that they can use this information if and when the preponderance of evidence dictates that it is appropriate to do so (AERA/APA/NCME, 2014:54).
The Standards’ acknowledgement of “stereotype threat” as an important contextual factor in testing owes to the seminal work of social psychologist Claude Steele, formerly at Stanford and now at Berkeley. Steele and Aronson’s (1995) study was the first in a now extensive body of research to demonstrate that awareness of racial stereotypes has a measureable effect on SAT performance among students of color. F. Competing Obligations: Fairness in Testing and Proposition 209 The “threats to fairness” against which Standard 3.16 warns are readily apparent in the case of the SAT. Under that standard, test users such as Berkeley assume a responsibility to mitigate the unwarranted effects of the test on students of color. Yet Standard 3.16 also includes the qualification, “when legally permissible.” In California, of course, Proposition 209 forbids consideration of race and ethnicity in university admissions, thereby foreclosing many of the options available in other states to address concerns about fairness in testing for students of color. How can these competing obligations be reconciled? To anticipate the conclusion of this analysis, the argument here is that Berkeley cannot fully meet its obligation to follow best practices for fairness in testing without taking account of race. Given that Proposition 209 forbids consideration of race, the only principled alternative is to eliminate the SAT as an admission criterion. If Berkeley cannot consider race as a contextual factor in admissions, then neither should it consider SAT scores. The Standards suggest a variety of practices by which test users can minimize or otherwise accommodate the “threats to fairness” that their tests may pose for particular subgroups. The best practice is simply not to use tests with subgroups for which there is not “… sufficient evidence of validity to support score interpretations for the intended uses,” in the language of Standard 3.16. Applying this practice in the context of Berkeley admissions, however, would mean exempting black and Latino applicants from the SAT requirement, clearly a violation of Proposition 209. Proposition 209 also forecloses a number of other options for mitigating the differential validity of SAT scores for students of color. One type of accommodation that has sometimes been employed in other testing contexts is ranking examinees by subgroup and selecting the top scorers from each – obviously also a non-starter under Proposition 209. Another type of accommodation is the Educational Testing Service’s “strivers” proposal (Carnevale & Haghighat, 1998). In 1999 ETS proposed a new measure derived by comparing a student’s actual SAT score with their predicted score based on socioeconomic and other factors, including race. Students whose actual score significantly exceeded their predicted score were deemed “strivers.” As an ETS official explained, “A combined score of 1000 on the SATs is not always a 1000. When you look at a Striver who gets a 1000, you’re looking at someone who really performs at a 1200” (Marcus, 1999). The proposal sparked controversy and was quickly withdrawn, though it continues to resurface from time to time. But if the Strivers proposal itself was rejected, its underlying premise – that SAT scores should be evaluated in light of an applicant’s social and economic circumstances – has been widely accepted at colleges and universities both inside and outside California. Comprehensive or “holistic” review of applicants’ files, including evaluation of students’ “opportunity to learn,” is increasingly the norm not only at private institutions but selective public universities as well, in no small part because of
GEISER: Eliminating the SAT in Berkeley Admissions 11
CSHE Research & Occasional Paper Series
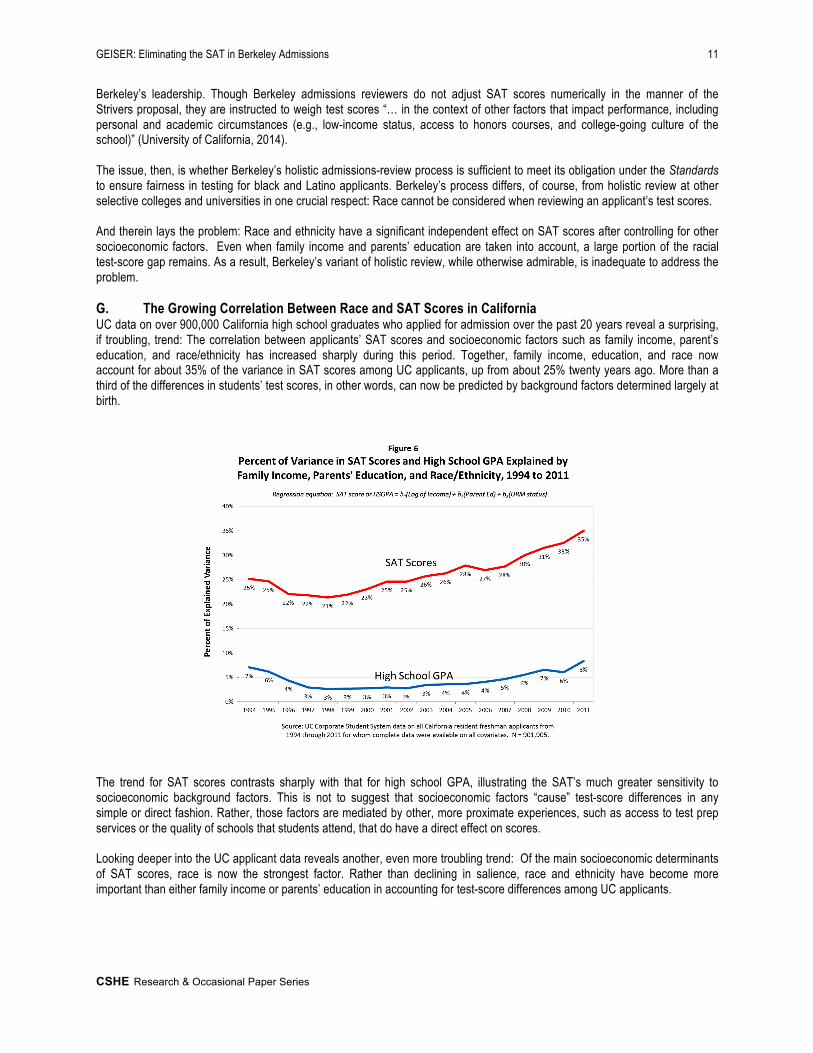
Berkeley’s leadership. Though Berkeley admissions reviewers do not adjust SAT scores numerically in the manner of the Strivers proposal, they are instructed to weigh test scores “… in the context of other factors that impact performance, including personal and academic circumstances (e.g., low-income status, access to honors courses, and college-going culture of the school)” (University of California, 2014). The issue, then, is whether Berkeley’s holistic admissions-review process is sufficient to meet its obligation under the Standards to ensure fairness in testing for black and Latino applicants. Berkeley’s process differs, of course, from holistic review at other selective colleges and universities in one crucial respect: Race cannot be considered when reviewing an applicant’s test scores. And therein lays the problem: Race and ethnicity have a significant independent effect on SAT scores after controlling for other socioeconomic factors. Even when family income and parents’ education are taken into account, a large portion of the racial test-score gap remains. As a result, Berkeley’s variant of holistic review, while otherwise admirable, is inadequate to address the problem. G. The Growing Correlation Between Race and SAT Scores in California UC data on over 900,000 California high school graduates who applied for admission over the past 20 years reveal a surprising, if troubling, trend: The correlation between applicants’ SAT scores and socioeconomic factors such as family income, parent’s education, and race/ethnicity has increased sharply during this period. Together, family income, education, and race now account for about 35% of the variance in SAT scores among UC applicants, up from about 25% twenty years ago. More than a third of the differences in students’ test scores, in other words, can now be predicted by background factors determined largely at birth.
The trend for SAT scores contrasts sharply with that for high school GPA, illustrating the SAT’s much greater sensitivity to socioeconomic background factors. This is not to suggest that socioeconomic factors “cause” test-score differences in any simple or direct fashion. Rather, those factors are mediated by other, more proximate experiences, such as access to test prep services or the quality of schools that students attend, that do have a direct effect on scores. Looking deeper into the UC applicant data reveals another, even more troubling trend: Of the main socioeconomic determinants of SAT scores, race is now the strongest factor. Rather than declining in salience, race and ethnicity have become more important than either family income or parents’ education in accounting for test-score differences among UC applicants.

GEISER: Eliminating the SAT in Berkeley Admissions 12
CSHE Research & Occasional Paper Series
Twenty years ago, parents’ education was the strongest predictor of SAT scores among UC applicants, and its weight has remained fairly steady since then.9 The weight for family income has shown a small but steady increase. But the most important change has been the growing salience of race. Since 1999, the predictive weight associated with under-represented minority status has increased almost every year until it surpassed that for parents’ education for the first time in 2009. A key implication of these findings is that racial and ethnic group differences in SAT scores are not simply reducible to differences in family income and education. There remains a large and growing residual correlation between race and SAT scores after those factors are taken into account. As a result, even where admissions reviewers are highly sensitive to applicants’ social and economic circumstances, as at Berkeley, they cannot fully evaluate the effect of those circumstances on test performance without also taking account of race.10 G. Conclusion: Eliminating the SAT in Berkeley Admissions The proposal outlined here differs in several ways from “test-optional” admissions adopted at other US colleges and universities. There, applicants may choose whether to submit test scores and have them considered in the admissions decision. At many institutions, this has boosted SAT averages among applicants who do submit scores, a fact that has not gone unnoticed at colleges with concerns about their institutional ranking. Under the proposal here, SAT or ACT-equivalent scores would be considered neither positively or negatively in Berkeley admissions. Scores on those tests would simply be eliminated from the applicant files provided to admissions readers. There is precedent, of course, for such a change: Race was removed from applicant files following SP-1. The proposal also differs from test-optional admissions insofar as all UC applicants would still be required to take the SAT or ACT. Test scores would continue to be used to determine whether applicants meet minimum eligibility requirements for the UC system. While it is true that the SAT raises many of the same issues with respect to eligibility as it does for admissions selection,
9 For the non-technical reader: Standardized regression coefficients, or “beta weights,” show the predictive weight of any one factor in a regression model after controlling for the effects of all other factors, thus permitting comparison of the relative weight of each factor. For example, the standardized coefficient of 0.27 on parents’ education in 1994 means that, when parents’ education increased by one standard deviation, SAT scores rose by 0.27 of a standard deviation after controlling for family income and race/ethnicity. 10 For a more extended discussion of the growing correlation between race and SAT scores at UC, and what might explain it, see Geiser (2015). One explanation that could account for this trend is the dramatic increase in racial segregation in California over the past two decades, as documented by Gary Orfield and his colleagues at the UCLA Civil Rights Project. On some measures, California schools have become more segregated than any other state’s, driven largely by trends among the Chicano and Latino population (Orfield & Ee, 2015). Some of the leading research on the connection between racial segregation and SAT scores has been conducted at Berkeley. Economists David Card and Jesse Rothstein’s (2007) influential study of racial segregation in metropolitan areas across the US found “… robust evidence that the black-white score gap [on the SAT] is higher in more segregated cities” (p. 1).

GEISER: Eliminating the SAT in Berkeley Admissions 13
CSHE Research & Occasional Paper Series
the two contexts differ in important ways. In eligibility, test scores affect a relatively limited number of students at the margin of the eligibility pool, that is, those with relatively low high school GPAs. In admissions, test scores are used to compare and rank applicants throughout the entire pool, so that more students are affected. In addition, determination of UC eligibility is based on only two other indicators – high school GPA and class rank, the latter of which is itself based on GPA – so that including test scores in the UC eligibility index arguably adds more information there than in admissions selection.11 As admissions selection is now practiced at Berkeley, however, SAT scores have become largely redundant and add little unique information to that already available in applicants’ files. Their weak predictive power inevitably introduces an element of error in selection decisions when employed within an applicant pool such as Berkeley’s, where most students have high scores and score differences are relatively small. Most troubling, compared to other admissions criteria such as high school grades, SAT scores have an adverse impact on admission of students of color that is far out of proportion with their limited measurement validity. There is clear evidence of differential prediction, differential item functioning, and differential test context among black and Latino examinees. National standards for fairness in testing oblige test users be sensitive to the differential validity of their exams for racial and ethnic minorities. Until 1998, Berkeley met this obligation by means of a two-tiered admissions process. The top half of the pool was admitted solely on the basis of grades and test scores, while the bottom half was selected using a combination of academic and “supplemental” criteria, including race. Though far from ideal, two-tiered admissions did allow sensitivity to the differential validity of SAT scores for students of color.12 All of this changed with SP-1 and Proposition 209, barring consideration of race as an admission criterion. But that change has also barred consideration of how other admissions criteria, such as SAT scores, are themselves affected by race. Berkeley is thus faced with a choice of some consequence. One option is to continue to employ an admissions criterion with known collateral effects on students of color, even while admissions officials are barred by law from acting on that knowledge. Continuing to use the SAT under the constraints of Proposition 209 means accepting some level of residual bias against black and Latino applicants beyond what can be justified by test validity. The alternative is to discontinue use of the SAT in admissions altogether. If Berkeley cannot consider race as a contextual factor in admissions, neither should it consider the SAT. REFERENCES Agronow, S. (2008 ). Examining the predictive value of the SAT II subject exams in the prediction of first-year UC GPA – A report to BOARS.
Appendix IV (pp. 88-132) in BOARS’ revised “Proposal to reform UC’s freshman eligibility policy.” Oakland, CA: University of California Academic Senate. Accessed on March 22, 2016 from http://senate.universityofcalifornia.edu/underreview/sw.rev.eligibility.02.08.pdf.
Atkinson, R.C. (2001). Standardized tests and access to American universities. The 2001 Robert H. Atwell Distinguished Lecture, delivered at the 83rd Annual Meeting of the American Council on Education, Washington, DC. Accessed on March 22, 2016 from http://rca.ucsd.edu/speeches/satspch.pdf.
Atkinson, R., & Geiser, S. (2009). Reflections on a century of college admissions tests. Educational Researcher, 38(9), 665-676. Bowen, W., Chingos, M., & McPherson, M. (2009). Crossing the Finish Line: Completing College at America’s Public Universities. Princeton,
NJ: Princeton University Press. Camara, W. & Schmidt, A. (1999). Group differences in standardized testing and social stratification. College Board Report No. 99-5. Accessed
on August 19, 2005 from http://research.collegeboard.org/sites/default/files/publications/2012/7/researchreport-1999-5-group-differences-standardized-testing-social-stratification.pdf.
Card, D., & Rothstein, J. (2006). Racial segregation and the black-white score gap. NBER Working Paper 12078. Cambridge, MA: National Bureau of Economic Research.
11 This leaves aside, however, the question of what kinds of tests are best suited for that purpose. Some argue that criterion-referenced tests that measure an applicant’s knowledge of specific college-preparatory subjects, like biology or chemistry, are better suited for college admissions than generic, norm-referenced exams such as the SAT or ACT, which compare an applicant’s performance to that of a reference group. For an extended discussion of this issue, see Atkinson & Geiser (2009). 12 The two-tiered admissions selection process ended in 2001, when the UC regents, on the recommendation of the faculty and the president, mandated comprehensive review of all UC applicants.

GEISER: Eliminating the SAT in Berkeley Admissions 14
CSHE Research & Occasional Paper Series
Carnevale, A., & Haghighat, E. (1998). Selecting the strivers: A report on the preliminary results of the ETS ‘Educational Strivers’ study. Pp. 122-128 Hopwood, Bakke, and Beyond: Diversity on Our Nation’s Campuses, edited by D. Bakst. Washington, DC: American Association of Collegiate Registrars and Admissions Officers.
Douglass, J. A. (2007). The Conditions of Admission: Access, Equity, and the Social Contract of Public Universities. Stanford, CA: Stanford University Press.
Geiser, S., & Studley, R. (2002). UC and the SAT: Predictive validity and differential impact of the SAT I and SAT II at the University of California. Educational Assessment, 8, 1-16.
Geiser, S. (2015). The growing correlation between race and SAT scores: New findings from California. Research and Occasional Paper Series No. 10-54 (October, 2015). Berkeley, CA: Center for Studies in Higher Education. Accessed April 1, 2016 from http://www.cshe.berkeley.edu/sites/default/files/shared/publications/docs/ROPS.CSHE_.10.15.Geiser.RaceSAT.10.26.2015.pdf.
Kidder, W., & Rosner, J. (2002). How the SAT creates built-in-headwinds: An educational and legal analysis of disparate impact, 43, Santa Clara L. Rev. 131. Accessed on January 6, 2015 from http://digitalcommons.law.scu.edu/lawreview/vol43/iss1/3.
Kobrin, J., Patterson, B., Shaw, E., Mattern, K., & Barbuti, S. (2008). Validity of the SAT for predicting first-year college gradepoint average. (College Board Research Rep. No. 2008-5). New York: College Board.
Marcus, A. (1999). New weights can alter SAT scores: Family is factor in determining who’s a ‘striver’. Wall Street Journal, August 31, 1999, pp. B1, B8. Accessed on June 27, 2015 from http://info.wsj.com/classroom/archive/wsjce.99nov.casestudy.html.
Orfield, G., & Ee, J. (2014). Segregating California’s Future: Inequality and its Alternative 60 Years after Brown v. Board of Education. Los Angeles, CA: UCLA Civil Rights Project. Accessed on August 19, 2015 from http://civilrightsproject.ucla.edu/research/k-12-education/integration-and-diversity/segregating-california2019s-future-inequality-and-its-alternative-60-years-after-brown-v.-board-of-education.
Patterson, B.F., Mattern, K.D., & Kobrin, J. (2009). Validity of the SAT for predicting FYGPA: 2007 SAT validity sample (College Board Statistical Report No. 2009-1). New York: The College Board.
Rothstein, J. (2004). College performance predictions and the SAT. Journal of Econometrics, 121, 297-317. Santelices, M.V., & Wilson, M. On the relationship between differential item functioning and item difficulty: An issue of methods? Item response
theory approach to differential item functioning. Educational and Psychological Measurement, 72(1), 5–36. Steele, C., & Aronson, J. (1995). Stereotype threat and the intellectual test performance of African Americans. Journal of Personality and Social
Psychology 69(5):797-811. University of California. (2014). Guidelines for Implementation of University Policy on Undergraduate Admissions. UC Academic Senate:
Oakland, CA. Accessed on March 9, 2016 from http://senate.universityofcalifornia.edu/committees/boars/GUIDELINES_FOR_IMPLEMENTATION_OF_UNIVERSITY_POLICY_on_UG_ADM_Revised_January2014.pdf.
University of California Office of the President. (1977). Final Report on the Task Force for Undergraduate Admissions. Oakland, CA: Author. Zwick, R. (1999). Eliminating standardized tests in college admissions: The new affirmative action? Phi Delta Kappan 81.


![[en] [de] - Gradient Gliders€¦ · Projected aspect ratio 4.16 4.16 4.16 4.16 4.16 Max. chord m 2.58 2.69 2.81 2.93 3.05 Min. chord m 0.62 0.64 0.67 0.70 0.73 Number of cells 51](https://static.fdocuments.net/doc/165x107/5f935f96abeb684e7251d926/en-de-gradient-gliders-projected-aspect-ratio-416-416-416-416-416-max.jpg)