Republic of Nicaragua Policy and Investment Priorities to...
100
Report No. 67497 - NI Republic of Nicaragua Policy and Investment Priorities to Reduce Environmental Degradation of the Lake Nicaragua Watershed (Cocibolca) Addressing Key Environmental Challenges – Study 2 June 29, 2010 Sustainable Development Department Latin America and the Caribbean Region Document of the World Bank Public Disclosure Authorized Public Disclosure Authorized Public Disclosure Authorized Public Disclosure Authorized Public Disclosure Authorized Public Disclosure Authorized Public Disclosure Authorized Public Disclosure Authorized
Transcript of Republic of Nicaragua Policy and Investment Priorities to...
Report No. 67497 - NI
Republic of Nicaragua
Policy and Investment Priorities to Reduce
Environmental Degradation of the Lake
Nicaragua Watershed (Cocibolca)
Addressing Key Environmental Challenges – Study 2
June 29, 2010
Sustainable Development Department
Latin America and the Caribbean Region
Document of the World Bank
Pub
lic D
iscl
osur
e A
utho
rized
Pub
lic D
iscl
osur
e A
utho
rized
Pub
lic D
iscl
osur
e A
utho
rized
Pub
lic D
iscl
osur
e A
utho
rized
Pub
lic D
iscl
osur
e A
utho
rized
Pub
lic D
iscl
osur
e A
utho
rized
Pub
lic D
iscl
osur
e A
utho
rized
Pub
lic D
iscl
osur
e A
utho
rized

CURRENCY EQUIVALENTS
Currency Unit = Nicaraguan Córdoba (NIO)
US $1 = NIO 20.96
FISCAL YEAR
January 1 – December 31
Vice President: Pamela Cox
Country Director: Laura Frigenti
Sector Director: Laura Tuck
Sector Manager: Karin Kemper
Sector Leader: Gregor Wolf
Task Manager: Irina Klytchnikova
i
Contents
Acronyms and Abbreviations ........................................................................................................ iii
Acknowledgements ..........................................................................................................................v
Foreword ........................................................................................................................................ vi
Executive Summary .........................................................................................................................1
I. Introduction ................................................................................................................................13
II. Deterioration of the watershed and sources of contamination ..................................................18
III. Modeling pressures on Lake Cocibolca: Results of the study .................................................34
IV. Setting research priorities ........................................................................................................46
V. Setting policy and investment priorities....................................................................................50
VI. Conclusions and policy implications .......................................................................................63
References ......................................................................................................................................68
Annex A. Technical Description of the SWAT Modeling of the Lake Cocibolca Watershed .....71
Annex B. Estimation of nutrient load from tilapia farming in Lake Cocibolca ............................87
Annex C. Additional Figures and Tables .......................................................................................89
Tables
Table II.1. Proportion of farms without land title by region and type of farm ..............................27
Table III.1. Estimated nutrient flows into the lake from domestic wastewater discharge in
coastal towns ..................................................................................................................................38
Table III.2. Estimated mean annual nutrient flows to Lake Cocibolca, by source ........................40
Table III.3. Estimated mean annual nutrient flows into Lake Cocibolca by country ....................42
Table V.1. Principal water users in selected sub-watersheds of the Lake Cocibolca watershed ..55
Figures
Figure I.1. The San Juan River Basin and Lake Cocibolca ...........................................................14
Figure II.1. Average annual precipitation in the Lake Cocibolca watershed (1975–1994) ...........18
Figure II.2. Topography of the Lake Cocibolca watershed ...........................................................19
Figure II.4. Sources of environmental degradation in the watershed and its impacts ...................24
Figure II.5. Land use in the Lake Cocibolca watershed ................................................................25
ii
Figure II.7. Wetlands in the Lake Cocibolca watershed ................................................................32
Figure III.1. Estimating the magnitude of problems affecting Lake Cocibolca ............................34
Figures III.2a. and III.2b. Mean annual soil erosion in the Lake Cocibolca watershed and
forest cover.....................................................................................................................................37
Figure III.3. Pollution from sediment and nutrients, coastal towns and tilapia farming ...............41
Figure V.3. Possible patterns of returns to farmers from adopting land uses that protect Lake
Cocibolca .......................................................................................................................................53
Supporting off-farm employment: realizing the watershed’s potential for sustainable tourism ...57
Figure A.10. Mean annual sediment loads carried by streams in the Lake Cocibolca
watershed .......................................................................................................................................85
Boxes
Box II.1. Tilapia farming can pose risks to the lake’s biodiversity ...............................................30
Box III.1. The Soil and Water Assessment Tool (SWAT) ............................................................35
Box V.1. Protecting Santa Lucía’s water source ...........................................................................55
iii
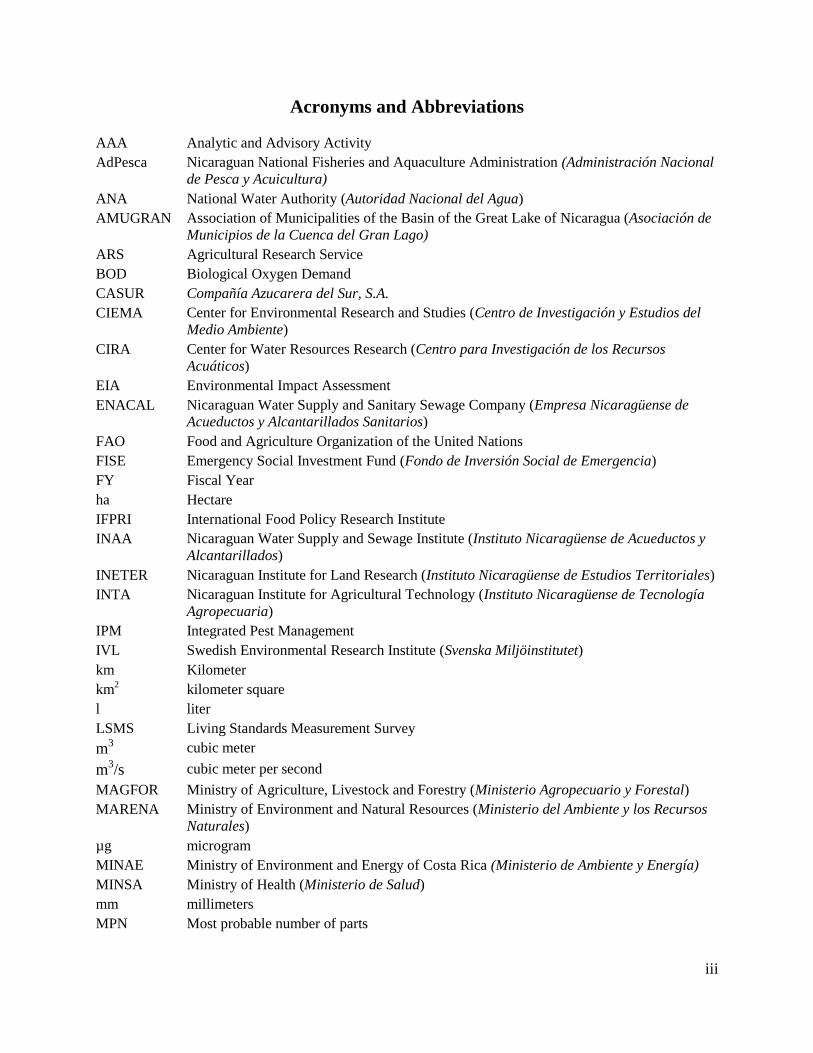
Acronyms and Abbreviations
AAA Analytic and Advisory Activity
AdPesca Nicaraguan National Fisheries and Aquaculture Administration (Administración Nacional
de Pesca y Acuicultura)
ANA National Water Authority (Autoridad Nacional del Agua)
AMUGRAN Association of Municipalities of the Basin of the Great Lake of Nicaragua (Asociación de
Municipios de la Cuenca del Gran Lago)
ARS Agricultural Research Service
BOD Biological Oxygen Demand
CASUR Compañía Azucarera del Sur, S.A.
CIEMA Center for Environmental Research and Studies (Centro de Investigación y Estudios del
Medio Ambiente)
CIRA Center for Water Resources Research (Centro para Investigación de los Recursos
Acuáticos)
EIA Environmental Impact Assessment
ENACAL Nicaraguan Water Supply and Sanitary Sewage Company (Empresa Nicaragüense de
Acueductos y Alcantarillados Sanitarios)
FAO Food and Agriculture Organization of the United Nations
FISE Emergency Social Investment Fund (Fondo de Inversión Social de Emergencia)
FY Fiscal Year
ha Hectare
IFPRI International Food Policy Research Institute
INAA Nicaraguan Water Supply and Sewage Institute (Instituto Nicaragüense de Acueductos y
Alcantarillados)
INETER Nicaraguan Institute for Land Research (Instituto Nicaragüense de Estudios Territoriales)
INTA Nicaraguan Institute for Agricultural Technology (Instituto Nicaragüense de Tecnología
Agropecuaria)
IPM Integrated Pest Management
IVL Swedish Environmental Research Institute (Svenska Miljöinstitutet)
km Kilometer
km2 kilometer square
l liter
LSMS Living Standards Measurement Survey
m3 cubic meter
m3/s cubic meter per second
MAGFOR Ministry of Agriculture, Livestock and Forestry (Ministerio Agropecuario y Forestal)
MARENA Ministry of Environment and Natural Resources (Ministerio del Ambiente y los Recursos
Naturales)
µg microgram
MINAE Ministry of Environment and Energy of Costa Rica (Ministerio de Ambiente y Energía)
MINSA Ministry of Health (Ministerio de Salud)
mm millimeters
MPN Most probable number of parts
iv
N Nitrogen
NGO Nongovernmental organization
No. Number
NRCS Natural Resources Conservation Service
OAS Organization of American States
P Phosphorus
PASOLAC Program for Sustainable Hillside Agriculture in Central America (Programa para la
Agricultura Sostenible en Laderas de América Central)
PES Payments for Environmental Services
SAP Strategic Action Plan
SWAT Soil and Water Assessment Tool
TA Technical Assistance
TEDS Transboundary Environmental Diagnostic Study
UNAN National Autonomous University of Nicaragua (Universidad Nacional Autónoma de
Nicaragua)
UNEP United Nations Environment Programme
USDA United States Department of Agriculture
US EPA United States Environmental Protection Agency
v
Acknowledgements
This study was prepared by the team led by Irina Klytchnikova (Economist, LCSEN) and
composed of Rita Cestti (Sr. Rural Development Specialist), Stefano Pagiola (Sr. Environmental
Economist); Allan Jones, Raghavan Srinivasan, Patrick Debels, Jorge Escurra (Consultants);
Augusto García (Operations Officer, LCSAR), Francisco Carranza (Consultant, ETWAN),
Nelson Medina (Water and Sanitation Specialist, ETWAN); with inputs from Ruth Tiffer
Sotomayor, Juan Carlos Valle, Carolina Ruiz Bojorge, and Juan Carlos Martínez Sánchez
(Consultants); Irene Leino (Junior Professional Officer) and Sarah Martiny (Junior Professional
Associate); and with inputs from the Technical Working Group composed of Nicaraguan
Government agencies. Valuable comments by Juan Carlos Belausteguigoitia (Lead
Environmental Economist, LCSEN), Ernesto Sánchez Triana (Lead Environmental Specialist,
SASDI), Susanne Scheierling (Sr. Irrigation Water Economist, ETWWA), Julia Bucknall (Sector
Manger, ETWWA), Grant Milne (Sr. Water Resources Specialist), Paula Novo (Visiting
Researcher, IFPRI), Willem Janssen (Lead Agriculturalist, LCSAR), Coleen Littlejohn (Sr.
Operations Officer, LCCNI), David Michaud (Water and Sanitation Specialist, LCSUW), and
outstanding assistance by Santiago Sandoval (LCSEN) and Linda Castillo (LCCNI) are
gratefully acknowledged. The study was carried out under the overall guidance of Laura Frigenti
(Country Director), Karin Kemper (Sector Manager since December 2009), Laura Tlaiye (Sector
Manager until November 2009), Gregor Wolf (Sector Leader), Joseph Owen (Country Manager),
and the guidance of the Steering Committee for the study, composed of high-level decision
makers in Nicaragua. The authors of the study are especially grateful for the guidance and
support of the Minister of MARENA Juanita Argeñal Sandoval, Vice Minister of MARENA
Roberto Araquistáin, the Director of Planning of MARENA Denis Fuentes, the focal point for
the study in MARENA Engracia Merlo, the Minister of MAGFOR Ariel Bucardo, the Vice
Minister of MAGFOR Amanda Lorío Arana, the former President of ENACAL Ruth Selma
Herrera, the former Director of INTA María Isabel Martínez, the President of INETER
Alejandro Rodríguez, the Director of CIRA/UNAN Salvador Montenegro, the Deputy Director
of CIRA/UNAN Katherine Vammen, the Director of CIEMA Sergio Gámez, as well as support
by experts from MARENA and other institutions and by the members of the Technical Working
Group for this study. Financial support by the Governments of the Netherlands through the Bank
Netherlands Partnership Program (BNPP) is gratefully acknowledged.
vi
Foreword
In November 2008, consultations with the Government of Nicaragua, academia and
nongovernmental stakeholders resulted in the selection of three studies on key environmental
issues for the programmatic analytic and advisory activity (AAA) “Republic of Nicaragua.
Addressing Key Environmental Challenges: (i) Environmental Health in Nicaragua, (ii) Setting
Policy Priorities to Reduce Environmental Degradation in the Lake Cocibolca Watershed, and
(iii) Analysis of the Process of Environmental Impact Assessment in Nicaragua.” This report
presents the findings of the second study. In the course of the dialogue during the study’s
implementation, the government requested an additional Diagnostic Study of Environmental
Degradation in Corn Island, the results of which have informed the design of a pilot project in
Corn Island, included in the FY09 Nicaragua Rural Water and Sanitation Project (PRASNICA).
The main counterpart for this study is the Ministry of Environment and Natural
Resources of Nicaragua (MARENA) but many organizations in Nicaragua have contributed to
and helped shape the results of the study and the training activities that have accompanied it. At
the government’s request, this study was designed to provide Nicaraguan institutions with a tool
to help set priorities in the management of this critical watershed for the country. The study was
launched in Managua in November 2008 with the creation of the Technical Working Group,
composed of key government institutions and research institutes, and the Steering Committee,
composed of high-level decision makers heading those institutions (MARENA, MAGFOR,
INTA, INETER, ENACAL, CIRA/UNAN, CIEMA and MINSA). As an outcome of the initial
technical consultations, the Soil and Water Assessment Tool (SWAT), used extensively around
the world to help set priorities in watershed management, was chosen as one of the best available
tools for modeling the environmental problems associated with unsustainable land use in the
context of the Lake Cocibolca watershed. This study has built on earlier efforts by other national
and international organizations—particularly the Procuenca San Juan and TWINLATIN
projects—and its results will inform the Master Plan for the lake’s watershed, currently under
preparation by MARENA.
At different stages in the research, a combination of workshops and technical trainings (in
Managua and at Texas A&M University in College Station, Texas) was carried out with sessions
tailored to decision makers and technical experts. This process has been successful at generating
a high level of interest in this AAA, addressing concerns that this study must have a real impact
in decision making and be relevant for the formulation of the watershed protection plan, and to
some extent helping overcome institutional silos. As the importance of the contribution of the
sediment load from the Costa Rican part of the watershed became apparent in the course of the
study, technical experts were invited to participate in the workshops in Nicaragua, provide
guidance on possible binational cooperation and seek solutions at the scientific level. This
version of the study incorporates comments from the Government of Nicaragua received during
consultations on the draft report in March 2010.
The study was completed and disseminated in Nicaragua in June 2010, and published in
electronic form. The report was welcomed by MARENA, which also provided additional
comments that future studies would need to address. This is the paper version of the electronic
publication dated June 2010.

vii
1
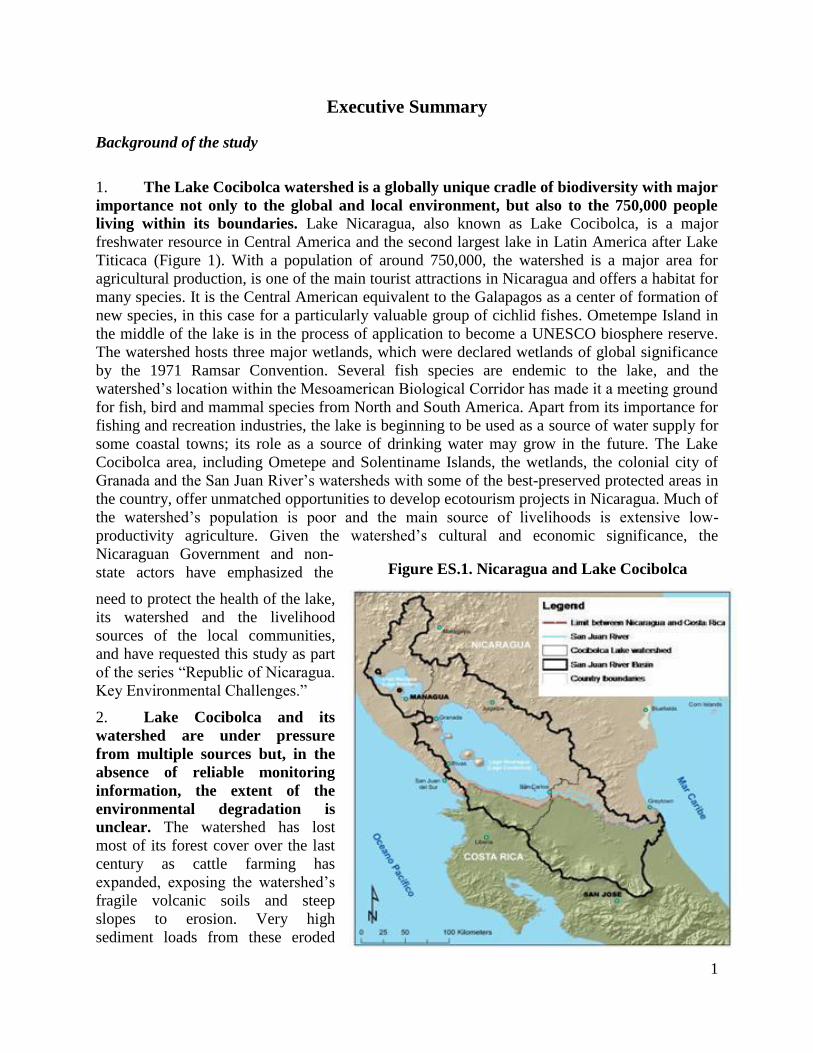
Figure ES.1. Nicaragua and Lake Cocibolca
Executive Summary
Background of the study
1. The Lake Cocibolca watershed is a globally unique cradle of biodiversity with major
importance not only to the global and local environment, but also to the 750,000 people
living within its boundaries. Lake Nicaragua, also known as Lake Cocibolca, is a major
freshwater resource in Central America and the second largest lake in Latin America after Lake
Titicaca (Figure 1). With a population of around 750,000, the watershed is a major area for
agricultural production, is one of the main tourist attractions in Nicaragua and offers a habitat for
many species. It is the Central American equivalent to the Galapagos as a center of formation of
new species, in this case for a particularly valuable group of cichlid fishes. Ometempe Island in
the middle of the lake is in the process of application to become a UNESCO biosphere reserve.
The watershed hosts three major wetlands, which were declared wetlands of global significance
by the 1971 Ramsar Convention. Several fish species are endemic to the lake, and the
watershed’s location within the Mesoamerican Biological Corridor has made it a meeting ground
for fish, bird and mammal species from North and South America. Apart from its importance for
fishing and recreation industries, the lake is beginning to be used as a source of water supply for
some coastal towns; its role as a source of drinking water may grow in the future. The Lake
Cocibolca area, including Ometepe and Solentiname Islands, the wetlands, the colonial city of
Granada and the San Juan River’s watersheds with some of the best-preserved protected areas in
the country, offer unmatched opportunities to develop ecotourism projects in Nicaragua. Much of
the watershed’s population is poor and the main source of livelihoods is extensive low-
productivity agriculture. Given the watershed’s cultural and economic significance, the
Nicaraguan Government and non-
state actors have emphasized the
need to protect the health of the lake,
its watershed and the livelihood
sources of the local communities,
and have requested this study as part
of the series “Republic of Nicaragua.
Key Environmental Challenges.”
2. Lake Cocibolca and its
watershed are under pressure
from multiple sources but, in the
absence of reliable monitoring
information, the extent of the
environmental degradation is
unclear. The watershed has lost
most of its forest cover over the last
century as cattle farming has
expanded, exposing the watershed’s
fragile volcanic soils and steep
slopes to erosion. Very high
sediment loads from these eroded
2
Box ES.1. Preparation of the Strategic Action Program (SAP)
Preparation of the SAP was supported by the Procuenca Río San Juan Project, with GEF financing of $3.9
million, over the course of 2001–2005. The project was jointly implemented by the Ministry of Environment
and Natural Resources of Nicaragua (MARENA) and the Ministry of Environment and Energy (MINAE) of
Costa Rica, and was supported by the Global Environmental Facility’s (GEF) implementing agencies: United
Nations Environment Programme (UNEP) and the Organization of American States (OAS). The main
objectives of the SAP are (i) the creation of a well-coordinated bilateral planning process for the watershed,
(ii) the strengthening of a basin-wide information system and the capacity of public institutions, and (iii)
promoting strategic actions such as sustainable agricultural production and the restoration of deforested areas.
The results of the technical studies and projects implemented to date, and the resulting strategic focus areas,
were summarized in the 2004 TEDS.
soils settle in the confluence of the San Juan River and the lake, decreasing its navigability and
reducing the future potential of tourism development in that area. Other environmental problems
stem from the use of agrochemicals, tilapia farming, and the flows of untreated or poorly treated
wastewater from coastal towns. The result is a reduction in water quality: nutrient levels are
rising and there is evidence of agrochemical and bacteriological contamination. However, the
extent of these problems is uncertain.
3. Environmental deterioration in the watershed is high on the government’s agenda. There is a widespread perception that this important resource is deteriorating and urgent action is
needed to save it. The main concern is eutrophication—a progressive deterioration of water
quality that is generally accompanied by the occurrence of algae blooms, increased water
turbidity and possibly an unpleasant taste and odor. If these problems were to manifest
themselves in the lake, future costs of water treatment to make it potable would at least double.
More systematic monitoring data are needed to confirm the suspected eutrophication trend in the
lake, and information on the absolute and relative importance of different sources of nutrient
loading—unavailable until now—is needed to design the government’s future environmental
protection policies, as well as management strategies to minimize nutrient loading to the lake. It
is also unclear from the available data whether the lake has already reached a eutrophic state and
if it has not, how far it is from a threshold level that would threaten wildlife and result in a
serious and irreversible deterioration of water quality. Nevertheless, the economic and social
impacts of the watershed’s degradation are already being felt with the declining navigability of
the San Juan River and efforts to dredge the confluence of the river with the lake, alleged
declines in fish stocks, occasional fish kills in the lake and localized water contamination.
4. A strategic vision has underpinned the efforts to set broad priority actions and
specific policy and investment priorities. The strategic vision for integrated watershed
management at the regional level for the greater San Juan River watershed, which includes the
Lake Cocibolca watershed, dates back to the 1992 Summit of the Presidents of Central American
Countries. This was followed by the Transboundary Environmental Diagnostic Study (TEDS)
prepared in 1994 and 1996, and the preparation of the 2004 Strategic Action Program (SAP) for
the greater San Juan River watershed (Box ES.1). The Government of Nicaragua is currently
identifying financing sources to proceed with the implementation of priority actions identified by
the program. The government has developed a solid legal and policy framework for the
implementation of actions envisaged in the SAP through such benchmark achievements as the
adoption of the 2001 National Water Policy, the recent passage of the 2007 Water Law, the
creation of the Commission for the Sustainable Development of the Lake Cocibolca and San
Juan River Watersheds in 2007, and the priority given to integrated water resources management
3
Box ES.2. Consultations in Nicaragua and training for technical experts
Over the course of the study’s implementation from December, 2008 until March, 2010, the preliminary
findings were discussed in a series of five workshops with the Steering Committee for the study, composed of
high-level decision makers, and the Technical Working Group, involving technical experts from ten
government agencies, the national water utility and research institutes, and other non-state actors. Four
training events, including a one-week training at Texas A&M University in College Station, Texas, were
conducted to demonstrate the use of the SWAT model in this study for an inter-institutional team of local
experts on Geographic Information Systems and hydrological modeling.
by the 2009–2011 Updated National Human Development Plan. Ensuring successful
implementation of the key elements of this comprehensive regulatory and policy framework is an
important challenge and an urgent current priority.
5. Objectives of the study. The main objective of this study is to fill an important gap in
the understanding of the problem as identified by the Transboundary Environmental Diagnostic
Study (TEDS), and build a more comprehensive picture of the sources of contamination. The
study achieves this by examining the entire watershed and all pollution sources, unlike earlier
studies that focused only on parts of the watershed or on a few pollution sources. Another goal of
this study is to provide an overarching framework for the investment priorities defined in the
watershed’s SAP. The study has also aimed to facilitate the dialogue across institutions and with
academic and civil society organizations by creating a common platform for a technical
discussion centered on a modeling exercise. The technical training and the sharing of regional
experiences with Colombia and Costa Rica, conducted in the course of this study, have
demonstrated how using hydrological modeling tools such as the Soil and Water Assessment
Tool (SWAT) can be used as a guide for identifying critical areas and can help set priorities in
watershed action plans.
6. Audience. This study is intended primarily for Nicaraguan experts and government
agencies, as well as their counterparts in Costa Rica and the region. The study is also intended to
inform the lending program of the World Bank and other donors. The improved understanding of
drivers of degradation in the watershed will facilitate the setting of policy and investment
priorities in the watershed area while considering the relevant environmental, social and
economic perspectives.
The study’s methodology and the main results
7. The study has assessed the sources and the magnitude of the pressures that threaten
Lake Cocibolca. It was accomplished by applying a hydrological and land use model (SWAT)
to the lake’s watershed and by conducting additional estimates of nutrients generated from
wastewater sources and tilapia farming. SWAT was applied by a team of international and local
experts, drawing on data collected by local institutions throughout this study and the
georeferenced database of the lake’s watershed assembled through the EU-supported
TWINLATIN project in 2005–2009 (Box ES.2). Building on that database, the use of SWAT has
facilitated an assessment of the rates of sedimentation in the basin’s sub-watersheds and the
flows of nutrients from the watershed to the lake. The conclusions of the study are limited by
important gaps in the scientific understanding of the ecological processes affecting the lake’s
water quality, and by the limited availability of monitoring data and agrochemical application
data.

4
8. The study has confirmed that sediment loads are very high, and has estimated their
magnitude in each sub-watershed. The key results of the study are the estimation of
sedimentation levels in the watershed and the identification of erosion hotspots. At about 13.3
tons/ha per year on average for the watershed, sediment yields are high and comparable to
watersheds with well-documented sedimentation problems such as Lake Victoria, which is more
than ten times the size of the Lake Cocibolca watershed but has similar elevations, rainfall
patterns and deforestation problems. The load of sediments and nutrients can be greatly reduced
through programs that combine such measures as reforestation in areas with the steepest slopes,
the adoption of conservation tillage, and improved pasture management. As estimated by this
study, it is technically feasible to reduce sediment flows by over 80 percent, and to reduce the
associated flows of nitrogen and phosphorus by over 18 and 46 percent, respectively. Future
socioeconomic assessments, building on the priorities already defined by the SAP, are needed to
identify what share of that reduction is actually also economically feasible. The high sediment
loads in the Lake Cocibolca watershed and the nutrients they carry have been a major concern
for local experts, and this study’s findings corroborate these concerns.
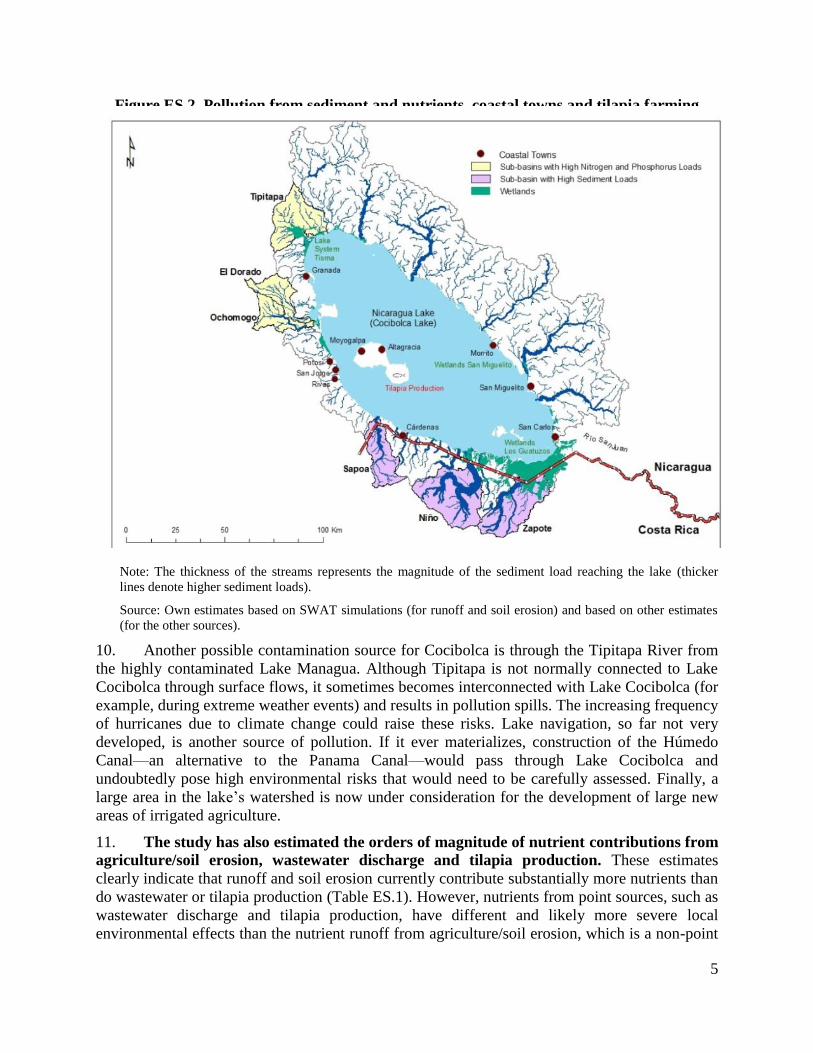
9. Most of the sediment (but not the nutrients) reaching the lake originates in the
Costa Rican part of the watershed. The Costa Rican part of the watershed occupies only one-
fifth of the entire watershed (excluding the area of the lake), and much of the area is protected
through formal protected areas and payment for environmental services (PES) schemes.
Nevertheless, this study estimates that due to very high slopes and precipitation, around 74 to 84
percent of the total sediment load originates there. To help inform the prioritization of watershed
protection actions, this study has produced a ranking of the sub-watersheds in terms of the
contribution of sediment, nitrogen and phosphorus from non-point sources into the lake. The
Niño, Zapote and Sapoá sub-watersheds in Costa Rica, followed by the Tule in Nicaragua, are
the highest ranking in terms of sediment loads; the Ochomogo, Zapote, Tipitapa, Niño and El
Dorado in terms of phosphorus; and the El Dorado, Tipitapa and Ochomogo in Nicaragua,
followed by the Niño in Costa Rica, in terms of nitrogen (Figure ES.2). Wastewater flows from
coastal towns, tilapia cultivation in floating cages off the shores of Ometepe Island, and livestock
are additional sources of nutrients.
5
Figure ES.2. Pollution from sediment and nutrients, coastal towns and tilapia farming
Note: The thickness of the streams represents the magnitude of the sediment load reaching the lake (thicker
lines denote higher sediment loads).
Source: Own estimates based on SWAT simulations (for runoff and soil erosion) and based on other estimates
(for the other sources).
10. Another possible contamination source for Cocibolca is through the Tipitapa River from
the highly contaminated Lake Managua. Although Tipitapa is not normally connected to Lake
Cocibolca through surface flows, it sometimes becomes interconnected with Lake Cocibolca (for
example, during extreme weather events) and results in pollution spills. The increasing frequency
of hurricanes due to climate change could raise these risks. Lake navigation, so far not very
developed, is another source of pollution. If it ever materializes, construction of the Húmedo
Canal—an alternative to the Panama Canal—would pass through Lake Cocibolca and
undoubtedly pose high environmental risks that would need to be carefully assessed. Finally, a
large area in the lake’s watershed is now under consideration for the development of large new
areas of irrigated agriculture.
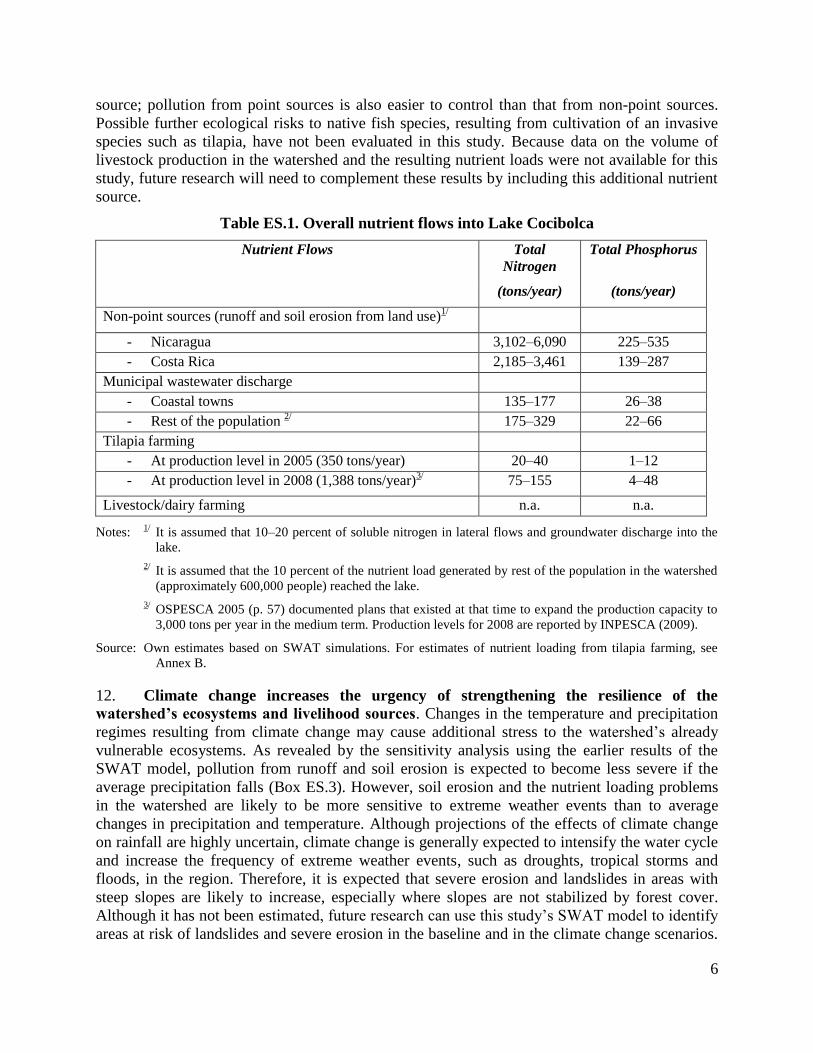
11. The study has also estimated the orders of magnitude of nutrient contributions from
agriculture/soil erosion, wastewater discharge and tilapia production. These estimates
clearly indicate that runoff and soil erosion currently contribute substantially more nutrients than
do wastewater or tilapia production (Table ES.1). However, nutrients from point sources, such as
wastewater discharge and tilapia production, have different and likely more severe local
environmental effects than the nutrient runoff from agriculture/soil erosion, which is a non-point
6
source; pollution from point sources is also easier to control than that from non-point sources.
Possible further ecological risks to native fish species, resulting from cultivation of an invasive
species such as tilapia, have not been evaluated in this study. Because data on the volume of
livestock production in the watershed and the resulting nutrient loads were not available for this
study, future research will need to complement these results by including this additional nutrient
source.
Table ES.1. Overall nutrient flows into Lake Cocibolca
Nutrient Flows Total
Nitrogen
Total Phosphorus
(tons/year) (tons/year)
Non-point sources (runoff and soil erosion from land use)1/
- Nicaragua 3,102–6,090 225–535
- Costa Rica 2,185–3,461 139–287
Municipal wastewater discharge
- Coastal towns 135–177 26–38
- Rest of the population 2/ 175–329 22–66
Tilapia farming
- At production level in 2005 (350 tons/year) 20–40 1–12
- At production level in 2008 (1,388 tons/year)3/ 75–155 4–48
Livestock/dairy farming n.a. n.a.
Notes: 1/
It is assumed that 10–20 percent of soluble nitrogen in lateral flows and groundwater discharge into the
lake.
2/
It is assumed that the 10 percent of the nutrient load generated by rest of the population in the watershed
(approximately 600,000 people) reached the lake.
3/ OSPESCA 2005 (p. 57) documented plans that existed at that time to expand the production capacity to
3,000 tons per year in the medium term. Production levels for 2008 are reported by INPESCA (2009).
Source:
Own estimates based on SWAT simulations. For estimates of nutrient loading from tilapia farming, see
Annex B.
12. Climate change increases the urgency of strengthening the resilience of the
watershed’s ecosystems and livelihood sources. Changes in the temperature and precipitation
regimes resulting from climate change may cause additional stress to the watershed’s already
vulnerable ecosystems. As revealed by the sensitivity analysis using the earlier results of the
SWAT model, pollution from runoff and soil erosion is expected to become less severe if the
average precipitation falls (Box ES.3). However, soil erosion and the nutrient loading problems
in the watershed are likely to be more sensitive to extreme weather events than to average
changes in precipitation and temperature. Although projections of the effects of climate change
on rainfall are highly uncertain, climate change is generally expected to intensify the water cycle
and increase the frequency of extreme weather events, such as droughts, tropical storms and
floods, in the region. Therefore, it is expected that severe erosion and landslides in areas with
steep slopes are likely to increase, especially where slopes are not stabilized by forest cover.
Although it has not been estimated, future research can use this study’s SWAT model to identify
areas at risk of landslides and severe erosion in the baseline and in the climate change scenarios.
7
Box ES.3. Re-running the SWAT model in the climate change scenario
A comparison of 16 global circulation models (GCMs) shows that models agree on temperature projections,
with nearly all models predicting an increase of average temperature in the range of 1°C and 3°C. However,
the models disagree on the changes in average precipitation. An arithmetic average of the models’
projections, assuming that the projections of all of the GCMs are equally likely, indicates that precipitation
would decline. Re-running the SWAT model for the watershed, with the assumptions of expected higher
average temperatures and lower precipitation in the climate change scenario, has shown that the severity of
pollution problems is much more sensitive to average precipitation than to temperature changes. Thus, an 18
percent reduction in average annual precipitation leads to decreases of more than 42 percent and 38 percent
in mean annual runoff and sediment yield, respectively. However, regional climate models do not provide
guidance on the expected changes in the monthly distribution of rainfall. If dry months become drier and wet
months wetter, this change would have a greater impact on pollution than would average temperature and
rainfall changes. Heavy rainfall during hurricanes and droughts, which are expected to become more frequent
with climate change, would result in even heavier sediment and nutrient runoff. Taking all the effects into
account, the vulnerability of the watershed’s soils is likely to increase and peak pollution events are likely to
become more frequent.
The rising uncertainty about the long-term vulnerability of the population and ecosystems
increases the urgency of shifting to a development path that combines sustainable management
of natural resources with strategies to increase the well-being of the watershed’s population.
13. Impacts on biodiversity. This study has not conducted an assessment of the effects of
water pollution on biodiversity. Nevertheless, it is clear that water and soil pollution from
sediment and nutrient runoff, hotspots of contamination due to the application of agrochemicals,
runoff of wastewater from municipal sources, livestock and tilapia farming, and the degradation
of the watershed’s wetlands translate into a loss of the watershed’s remarkable biodiversity. The
watershed is home to bird habitats, including Nicaragua’s only endemic bird species, the
Nicaraguan grackle (Quiscalus nicaraguensis), and to breeding grounds for locally and globally
important endemic and native fish and reptiles.
14. Caveats about the results and their interpretation. The results of the modeling effort
have helped to assess the relative magnitude of sediment and nutrient loads associated with
runoff and soil erosion and to establish several policy priorities. The model’s outputs have been
compared to the available monitoring data whenever possible, and the local and international
experts involved in the study concur with the results of this study. Since the limited availability
of monitoring and field data has prevented calibration of the model, the estimates of pollution
loads in this study are indicative measures of magnitude rather than precise estimates, and this is
reflected in the wide ranges surrounding those estimates.
15. Only with a sustainable, integrated program of monitoring, watershed and lake modeling,
and data management, shared among the relevant institutions, will it be possible to achieve a
better understanding of the actual status of the lake’s water quality and to confidently predict the
impacts, both positive and negative, of future socioeconomic, technological and climate changes.
However, few institutions have the responsibilities and capabilities to implement such an
integrated program. With strengthened coordination mechanisms to facilitate inter-agency
collaboration, the institutions that participated in this study could take on this role.
8
Box ES.4. Project profiles defined in the 2004 Strategic Action Program
The SAP developed project profiles in the greater San Juan River watershed that would support the
Procuenca Project’s broad “Eco-management vision, Tourism and Rural Development,” including:
Agroecological zoning to support integrated watershed and farm management
Implementation of zoning plans in the watershed’s urban areas
Financing of investments in wastewater treatment systems in selected municipalities
Strengthening of the participation of civil society organizations in the integrated watershed management
process
Environmental education to improve the sustainable use of natural resources in the watershed
Water quality monitoring and strengthening of meteorological data provision
Integrated management of the Malacatoya and other prioritized sub-watersheds
Conservation of the biological corridor’s ecosystems, the coastal zone and other biodiversity hotspots
Management plans for the prioritized Nicaraguan and transboundary wildlife refuges
Payment for environmental services in several prioritized areas of the watershed
Support for sustainable fishing activities and agro- and ecotourism.
Policy Recommendations
16. It is possible to achieve the long-term vision of better livelihoods and sustainable use of
natural resources in the Lake Cocibolca watershed. The Government of Nicaragua has made
important efforts and achieved significant progress in raising public awareness of the
watershed’s environmental problems, seeking solutions and implementing programs to improve
sanitation systems and wastewater treatment, promote sustainable agricultural practices and
support the development of sustainable tourism. Prior to this study, a broad group of
stakeholders, including national and local-level government institutions and civil society
organizations of the watershed, identified the strategic vision and a long series of investments to
implement that vision in the watershed (Box ES.4). This study has built upon these efforts,
identified the most critical gaps in scientific understanding and investment, and helped place the
series of investments identified by the SAP within a broader watershed-wide perspective. Future
efforts to reduce the environmental and health risks in the watershed need to include a range of
measures to tackle health and environmental risks from municipal wastewater discharge,
industrial water sources, agrochemicals, tilapia farming, and a series of investments and policies
to promote sustainable land use practices and reduce wetland degradation.
17. The need to identify win-win solutions with benefits for the lake but also for people
who live in the watershed and/or whose livelihoods depend on the watershed’s natural
resources. Public resources are scarce; without greater certainty about the severity of the
economic, ecological and health impacts of environmental degradation in the watershed, it is
unclear what level of investments in mitigation measures is justified. The scientific uncertainty
about the impact of contamination on water quality, ecosystems and public health and on the
resulting economic costs preclude even a rough estimation of the needed investment in
mitigation solely on the basis of the benefits to the lake. Given the current state of knowledge,
the policy agenda for the watershed needs to advance on two fronts: ascertaining the severity of
environmental degradation and its impacts, and identifying win-win options or policy changes
and investments with significant local benefits apart from the benefits for the lake. Many such
options exist: treating wastewater in areas where localized bacteriological contamination is so
high that it poses risks to health and limits recreation and tourism; supporting sustainable land
uses that raise agricultural productivity and protect local water sources, while also reducing the
9
sedimentation of the wetlands and the San Juan River; reducing health and ecosystem risks from
pesticide application in intensive agriculture; and other options. The GoN is supporting the
identification of these win-win options by providing discussion forums and mechanisms to
facilitate the active engagement of local communities in the formulation of the watershed action
and of municipal environmental and zoning plans.
18. Based on this study’s findings and the series of consultations held with state and non-
state actors in Nicaragua in the course of this study’s implementation, the required actions fall
into four broad areas: (i) supporting sustainable agriculture and alternative livelihood sources,
such as sustainable tourism; (ii) strengthening the protection of wetlands and integrating their
management in broader-scale river basin management; (iii) investing in wastewater treatment,
water supply and hygiene; and (iv) strengthening the regulatory framework for environmental
management and the enforcement of key regulations (Figure 2). The strengthening of
information provision, education, environmental information and monitoring data, as well as the
strengthening of the institutional framework for integrated water resources management in the
watershed, form the “enabling environment” to ensure successful implementation of the strategic
agenda.
19. Within this broad range of policy measures and investments to help shift to a more
sustainable path, some measures are more urgent than others and some are very costly, but low-
cost solutions and win-win measures that are good for the environment, for people’s livelihoods
and for the lake’s ecology can also be found. The following general and more specific technical
conclusions have emerged from this study and can inform the setting of investment and policy
priorities:
Making extensive and intensive agriculture more sustainable. Farming in extensive
cattle and crop systems has led to the degradation of the watershed’s forests and soils. The
common practice of burning pastures to control weeds is especially damaging in the extensive
pasture systems, particularly in steeply sloped areas with soils vulnerable to erosion. Switching
to more sustainable land uses, such as silvopastoral systems that combine animal farming and
tree cultivation, requires an integrated approach to help overcome barriers to their adoption:
providing incentives to farmers to adopt such land uses, strengthening agricultural extension
services and environmental education, supporting improvements in infrastructure, strengthening
access to markets, and improving access to credit to allow farmers to make the up-front
investments that may be required for switching to more sustainable farming systems. Other
options for reducing the pressures on forests and soils from extensive systems are a transition to
more intensive agriculture and the expansion of opportunities for off-farm employment.
Intensive agriculture—rice, sugarcane and cotton cultivation in the watershed—has its own set of
problems: pollution of water and soils with agrochemicals and the impacts on farm workers’
health. Better education by scaling up the successful experiences with the provision of
agricultural extension services, support for the adoption of integrated pest management practices,
controlling stocks of outdated pesticides, and monitoring the actual application rates of the most
polluting agrochemicals are important priorities in the watershed. This study has identified
erosion hotspots in areas of extensive agriculture, and hotspots of contamination with
agrochemicals are known (although not monitored) in the watershed, thus facilitating the setting
of priority areas that most urgently need to be addressed. An expansion of off-farm employment
opportunities is another way to promote a shift to a more sustainable pattern of land use in the
watershed, although in the short term the scope for this may be limited.
10
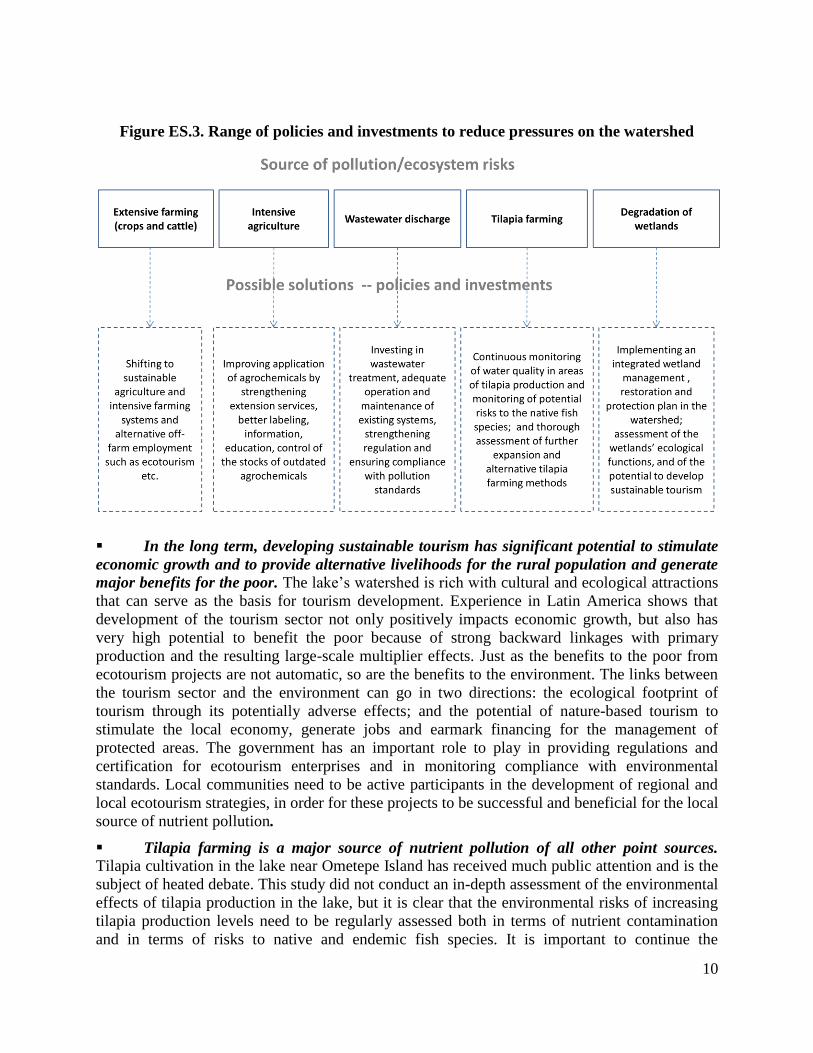
Figure ES.3. Range of policies and investments to reduce pressures on the watershed
In the long term, developing sustainable tourism has significant potential to stimulate
economic growth and to provide alternative livelihoods for the rural population and generate
major benefits for the poor. The lake’s watershed is rich with cultural and ecological attractions
that can serve as the basis for tourism development. Experience in Latin America shows that
development of the tourism sector not only positively impacts economic growth, but also has
very high potential to benefit the poor because of strong backward linkages with primary
production and the resulting large-scale multiplier effects. Just as the benefits to the poor from
ecotourism projects are not automatic, so are the benefits to the environment. The links between
the tourism sector and the environment can go in two directions: the ecological footprint of
tourism through its potentially adverse effects; and the potential of nature-based tourism to
stimulate the local economy, generate jobs and earmark financing for the management of
protected areas. The government has an important role to play in providing regulations and
certification for ecotourism enterprises and in monitoring compliance with environmental
standards. Local communities need to be active participants in the development of regional and
local ecotourism strategies, in order for these projects to be successful and beneficial for the local
source of nutrient pollution.
Tilapia farming is a major source of nutrient pollution of all other point sources. Tilapia cultivation in the lake near Ometepe Island has received much public attention and is the
subject of heated debate. This study did not conduct an in-depth assessment of the environmental
effects of tilapia production in the lake, but it is clear that the environmental risks of increasing
tilapia production levels need to be regularly assessed both in terms of nutrient contamination
and in terms of risks to native and endemic fish species. It is important to continue the
11
independent monitoring of possible impacts of tilapia production on water quality through the
affluence of nutrients from tilapia as well as its impacts on the native fish population, since
tilapia can be an invasive species.
Weltand protection and the implementation of management plans will have multiple
benefits. Another source of pollution is the degradation of wetlands, which may be affected by
the encroachment of agriculture. According to the calculations in this study, Los Guatuzos and
other wetlands could be playing a very important role in the filtration of sediment and nutrient
loads from agricultural fields and point sources of pollution, but technical studies are needed to
ascertain how much pollution they filter. The watershed’s wetlands undoubtedly provide other
globally and locally important ecological and socioeconomic benefits such as fish hatcheries and
habitats for endemic and native species of fish, reptiles and birds. Devising strategies that place
the local communities in the driver’s seat as the stewards of conservation will help ensure that
the management plans are effective. Sustainable sources of financing for the implementation of a
watershed-wide wetland management plan, well integrated in the overall plan for the
management of the lake’s watershed, may include innovative approaches such as sustainable
tourism, creation of environmental conservation funds for wetland protection, and payment for
environmental services (PES) mechanisms with local and international funding.
Much progress needs to occur in enhancing the adaptive water governance in
Nicaragua and the Lake Cocibolca watershed, including the strengthening of the institutional
and regulatory framework for water resources management. Important steps in this regard have
taken place. At national level, an institutional and regulatory framework has been worked out
under the new Water Law, but implementation still needs to be carried out. At municipal level,
local actors are actively engaged in the process of planning watershed protection actions. Making
the National Water Authority (ANA) and the Secretariat of the Cocibolca Watershed
Commission operational, and establishing clear coordination mechanisms among municipalities
in the watershed, are the crucially needed institutional basis for watershed protection.
Strengthening the required technical capacity at local level, together with the use of innovative
approaches, may to some extent help reduce the high costs of implementation and regulatory
enforcement and enhance adaptive capacity. Such approaches may include the use of remote
sensing and satellite technologies to monitor land use and water quantity, and the promotion of
public access to environmental information and of community-based environmental monitoring
initiatives.
Putting in place a monitoring strategy is urgent. The limited available evidence suggests
that contamination from nutrients carried into the lake with sediment flows is not yet severe in
the watershed as a whole, but action now may help to avoid potentially irreversible consequences
in the future. Although it is unclear how far the lake is from reaching a critical threshold at which
the ecosystems would be severely or irreversibly affected, the case is strong for urgent policy
actions in order to begin shifting to a more sustainable future development path for this
important watershed. As a first step, putting in place a strategy of systematic
hydrometeorological and water quality monitoring with clear institutional arrangements and
sources of financing is an urgent priority. Since the study has found that most of the runoff,
sediments and some nutrients originate from the Costa Rican part of the watershed, cooperation
with Costa Rica at scientific and policy levels is essential. Nicaraguan experts cite successful
experiences of cooperation with scientific laboratories in Costa Rica and Colombia that could be
scaled up within the framework of the SAP implementation and joint monitoring efforts. This
12
study has also identified the critical parameters that need to be monitored: precipitation, water
flows, agrochemical runoff from agriculture, and the nutrient content of the watershed’s soils.
Some of the monitoring, such as for precipitation and stream flow, needs to occur continuously
while other parameters, such as soil quality, can be established through discrete monitoring
efforts. Ensuring the financial sustainability and clear assignment of institutional responsibilities
for a monitoring program of this nature is an essential element for its successful implementation.
20. In the short term, financing of targeted interventions and the selected priorities
identified by the SAP and by this study will help the transition toward more sustainable use of
the watershed’s natural resources. In the long term, the broader economic policy and
institutional change will ultimately determine the watershed’s development pattern. The
broader economic policies and institutional factors—such as access to markets, agricultural
extension services, land tenure security and adequate regulation of access to water—will play a
key role in determining the longer-term economic development pattern, the agricultural
production structure, agrochemical use and land use in the watershed, as well as the prospects for
developing the region as the country’s prime tourist destination. Thus, many solutions lie within
the broader policy realm and require inter-agency coordination and bringing the environmental
problems of the watershed into the core development agenda, with a focus on sustainable growth,
protection of the watershed’s globally important ecosystems, and improvement of livelihoods.
13
I. Introduction
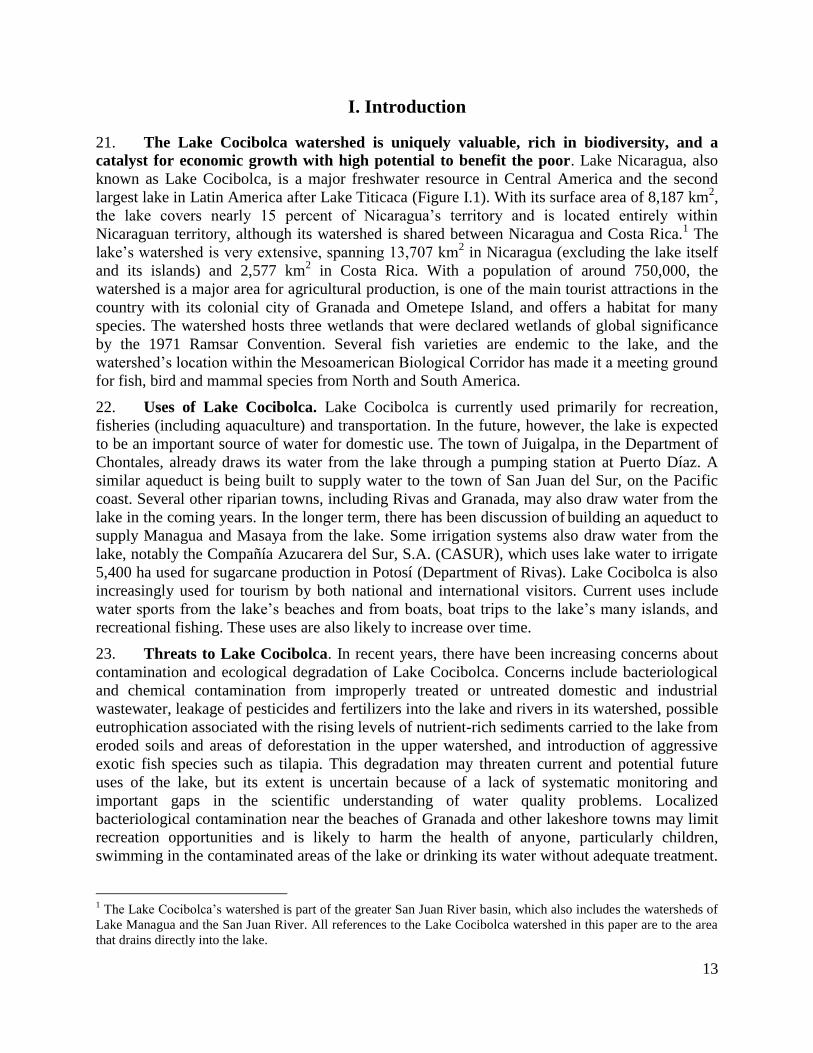
21. The Lake Cocibolca watershed is uniquely valuable, rich in biodiversity, and a
catalyst for economic growth with high potential to benefit the poor. Lake Nicaragua, also
known as Lake Cocibolca, is a major freshwater resource in Central America and the second
largest lake in Latin America after Lake Titicaca (Figure I.1). With its surface area of 8,187 km2,
the lake covers nearly 15 percent of Nicaragua’s territory and is located entirely within
Nicaraguan territory, although its watershed is shared between Nicaragua and Costa Rica.1 The
lake’s watershed is very extensive, spanning 13,707 km2 in Nicaragua (excluding the lake itself
and its islands) and 2,577 km2 in Costa Rica. With a population of around 750,000, the
watershed is a major area for agricultural production, is one of the main tourist attractions in the
country with its colonial city of Granada and Ometepe Island, and offers a habitat for many
species. The watershed hosts three wetlands that were declared wetlands of global significance
by the 1971 Ramsar Convention. Several fish varieties are endemic to the lake, and the
watershed’s location within the Mesoamerican Biological Corridor has made it a meeting ground
for fish, bird and mammal species from North and South America.
22. Uses of Lake Cocibolca. Lake Cocibolca is currently used primarily for recreation,
fisheries (including aquaculture) and transportation. In the future, however, the lake is expected
to be an important source of water for domestic use. The town of Juigalpa, in the Department of
Chontales, already draws its water from the lake through a pumping station at Puerto Díaz. A
similar aqueduct is being built to supply water to the town of San Juan del Sur, on the Pacific
coast. Several other riparian towns, including Rivas and Granada, may also draw water from the
lake in the coming years. In the longer term, there has been discussion of building an aqueduct to
supply Managua and Masaya from the lake. Some irrigation systems also draw water from the
lake, notably the Compañía Azucarera del Sur, S.A. (CASUR), which uses lake water to irrigate
5,400 ha used for sugarcane production in Potosí (Department of Rivas). Lake Cocibolca is also
increasingly used for tourism by both national and international visitors. Current uses include
water sports from the lake’s beaches and from boats, boat trips to the lake’s many islands, and
recreational fishing. These uses are also likely to increase over time.
23. Threats to Lake Cocibolca. In recent years, there have been increasing concerns about
contamination and ecological degradation of Lake Cocibolca. Concerns include bacteriological
and chemical contamination from improperly treated or untreated domestic and industrial
wastewater, leakage of pesticides and fertilizers into the lake and rivers in its watershed, possible
eutrophication associated with the rising levels of nutrient-rich sediments carried to the lake from
eroded soils and areas of deforestation in the upper watershed, and introduction of aggressive
exotic fish species such as tilapia. This degradation may threaten current and potential future
uses of the lake, but its extent is uncertain because of a lack of systematic monitoring and
important gaps in the scientific understanding of water quality problems. Localized
bacteriological contamination near the beaches of Granada and other lakeshore towns may limit
recreation opportunities and is likely to harm the health of anyone, particularly children,
swimming in the contaminated areas of the lake or drinking its water without adequate treatment.
1 The Lake Cocibolca’s watershed is part of the greater San Juan River basin, which also includes the watersheds of
Lake Managua and the San Juan River. All references to the Lake Cocibolca watershed in this paper are to the area
that drains directly into the lake.
14
The growth of blue-green algae, detected in some studies by Nicaraguan research institutes and
associated with increasing nutrient flows to the lake, may undermine the ecosystem’s health and
could double water treatment costs. Finally, deforestation and soil degradation in the upper parts
of the lake’s watershed are reducing agricultural productivity and negatively affecting farmers’
livelihoods; and sedimentation reduces navigability of the San Juan River and diminishes the
prospects for tourism growth in the area. Although it is unclear how far the lake is from reaching
a critical threshold at which the ecosystems would be severely or irreversibly affected, the case is
strong for urgent policy actions to begin shifting to a more sustainable future development path
for this important watershed.
Figure I.1. The San Juan River Basin and Lake Cocibolca
Source: TWINLATIN project database based on data provided by INETER.
24. The legal and institutional framework for water resources management. Nicaragua
has recently taken significant steps to strengthen the legal framework for the management of its
water resources at national level and in the priority watershed of Lake Cocibolca. The 2007
National Water Law (Law No. 620) stipulates the need for integrated water resources
management at watershed and sub-watershed levels, with the overall objective of protecting
drinking water sources and facilitating access to safe drinking water. The law specifically refers
to the need to protect the Lake Cocibolca watershed as a strategically important source of potable
water. Subsequently, Law No. 626 stipulated the creation of the Commission for the Sustainable
Development of the Lake Cocibolca and San Juan River Watershed. Progress with the
implementation of corresponding institutional reforms in the water sector has been slower. The
creation of the National Water Authority as the executing agency, as stipulated by the National
Water Law, has already been delayed by over a year; and the Commission is not yet operational.
15
Box I.1. Preparation of the Strategic Action Program (SAP)
Preparation of the SAP was supported by the Procuenca Río San Juan Project, with GEF financing of $3.9
million, over the course of 2001–2005. The project was jointly implemented by the Ministry of Environment and
Natural Resources of Nicaragua (MARENA) and the Ministry of Environment and Energy (MINAE) of Costa
Rica, and was supported by the Global Environmental Facility’s (GEF) implementing agencies: United Nations
Environment Programme (UNEP) and the Organization of American States (OAS). The main objectives of the
SAP are (i) the creation of a well-coordinated bilateral planning process for the watershed, (ii) the strengthening
a basin-wide information system and the capacity of public institutions, and (iii) the promotion of strategic
actions such as sustainable agricultural production and the restoration of deforested areas. The results of the
technical studies and projects implemented to date, and the resulting strategic focus areas, have been summarized
in the 2004 TEDS.
25. A strategic vision has underpinned the efforts to set broad priority actions and
specific policy and investment priorities. The strategic vision for integrated watershed
management at regional level for the greater San Juan River watershed, which includes the Lake
Cocibolca watershed, dates back to the 1992 Summit of the Presidents of Central American
Countries. This was followed by the Transboundary Diagnostic Study (Diagnóstico Ambiental
Transfronterizo, DAT) prepared in 1994 and 1996, and the preparation of the 2004 Strategic
Action Program (SAP) for the greater San Juan River watershed (Box I.1). The Government of
Nicaragua is currently identifying financing sources to proceed with the implementation of
priority actions identified by the program. The government has developed a solid legal and
policy framework for the implementation of actions envisaged in the SAP through such
benchmark achievements as the adoption of the 2001 National Water Policy, the recent passage
of the 2007 Water Law, the creation of the Commission for the Sustainable Development of the
Lake Cocibolca and San Juan River Watersheds in 2007, and the priority given to integrated
water resources management by the 2009–2011 Updated National Human Development Plan.
Ensuring successful implementation of the key elements of this comprehensive regulatory and
policy framework is an important challenge and an urgent current priority.
26. Municipal-level efforts to protect the Lake Cocibolca watershed. Promising
watershed management efforts at municipal and regional levels have underpinned the important
legal and institutional changes needed at national level in order to prepare the bilateral SAP for
Nicaragua and Costa Rica. The association of 32 Nicaraguan municipalities in the area of the
Lake Cocibolca watershed (Association of Municipalities of the Great Lake, AMUGRAN) has
been coordinating watershed protection actions at municipal level and holding annual Cocibolca
Forums.
27. Objective of the study. The main objective of this study is to fill an important gap in the
understanding of the environmental problems as identified by TEDS, and to build a more
comprehensive picture of the sources of contamination. The study achieves this by examining the
entire watershed and all pollution sources, unlike earlier studies that focused only on parts of the
watershed or on a few pollution sources.
28. Audience. This study is intended primarily for Nicaraguan experts and government
agencies, as well as their counterparts in Costa Rica and the region; the study is also intended to
inform the lending program of the World Bank and other donors. The improved understanding of
drivers of degradation in the watershed will facilitate the setting of policy and investment

16
priorities in the watershed area while considering relevant environmental, social and economic
perspectives.
29. Approach. Assessing the magnitude of the impact of contamination from point sources
(wastewater and tilapia farming) is relatively straightforward. Assessing non-point source
pollution (sediment and nutrients) from agricultural land and land use change is far more
complicated. Modeling tools are needed to carry out this analysis. This study assesses pollution
from agricultural land and land use change by applying a hydrological and land use model, the
Soil and Water Assessment Tool (SWAT), to the lake’s watershed. The model was applied by a
team of international and local experts, drawing on data collected by local institutions (Annex
A). Use of SWAT allows nutrient flows from the watershed to the lake to be assessed and the
origins of the nutrient flows to be identified. By combining SWAT estimates with estimates of
other nutrient flows into the lake, their relative importance can be evaluated. The SWAT model
also allows the likely impact of changes in land use and other factors (including the potential
impact of climate change) to be simulated. Based on this improved understanding, possible
policy options to reduce threats to the lake can be examined.
30. Process of the study. The study was launched in Managua in November 2008 with the
creation of a Technical Working Group, composed of the key government institutions and
research institutes, and a Steering Committee composed of high-level decision makers heading
those institutions (MARENA, MAGFOR, INTA, INETER, ENACAL, CIRA/UNAN, CIEMA
and MINSA). This study builds on earlier efforts by other national and international
organizations, particularly the European Union-supported TWINLATIN project that had just
come to completion at the start of this study.2 The dataset of environmental data and
georeferenced information, provided for the TWINLATIN project by INETER, MAGFOR,
MARENA, CIRA and other government and research institutions in Nicaragua, were augmented
by the additional data and incorporated into a decision-making tool. The information on the
lake’s hydrology, soil types, land use and climate that has been incorporated in the SWAT
database is more easily available to decision makers as an outcome of this study. This study’s
results will inform the Master Plan for the lake’s watershed, under preparation by MARENA.
The methodology and intermediate results were discussed with Nicaraguan scientists and
relevant government institutions in a series of workshops over the course of the study and
corroborate many of the earlier findings by Nicaraguan scientists (i.e., CIRA and CIEMA).
2 The TWINLATIN Project (“Twinning European and Latin American River Basins for Research Enabling
Sustainable Water Resources Management,” 2005–2009, www.twinlatin.org) was an international research project
funded under the priority area “Global Change and Ecosystems” of the European Commission’s 6th
Framework
Programme for Research and Technical Development. The project was executed by a consortium of research
institutions and government stakeholder organizations from the water resources sector from three European and
seven Latin American countries, and covered five Latin American case-study basins. The project’s main objectives
were to fill in gaps in local and regional knowledge in order to enhance possibilities for the implementation of
integrated basin-level water resources management plans. Activities in the Lake Cocibolca Basin were conducted by
CIEMA (Center for Environmental Research and Studies of Nicaragua’s National Engineering University) and the
EULA-Chile Center for Environmental Research (University of Concepción, Chile), in close collaboration with
national stakeholders (INETER, in particular the Water Resources Bureau, MARENA and others) and with
important support from international consortium members, especially the Swedish Environmental Research Institute
(IVL), which also acted as the project’s general coordinator. A particularly important achievement in the case of the
Lake Cocibolca Basin was the construction of a Georeferenced Environmental Database, which provided the basis
for the work conducted under the present study.

17
31. Outline of the study. The following section discusses in more detail the existing
knowledge of the lake’s condition, the pressures it faces, and the consequences of Lake
Cocibolca’s degradation on the economy, livelihoods, public health, and ecosystems. Section 3
then describes the modeling work undertaken to quantify and assess these pressures, and presents
the results of the analysis. Section 4 summarizes the research priorities that have emerged from
the modeling efforts in this study. Section 5 sets investment and policy priorities emerging from
this study, in order to address the pressures and protect the lake’s ecosystems and natural
resources. Although this study represents a significant step forward in our understanding of the
problems facing Lake Cocibolca, significant gaps remain in the scientific understanding and
socioeconomic assessment of the effects of environmental degradation and of their solutions.
18
II. Deterioration of the watershed and sources of contamination
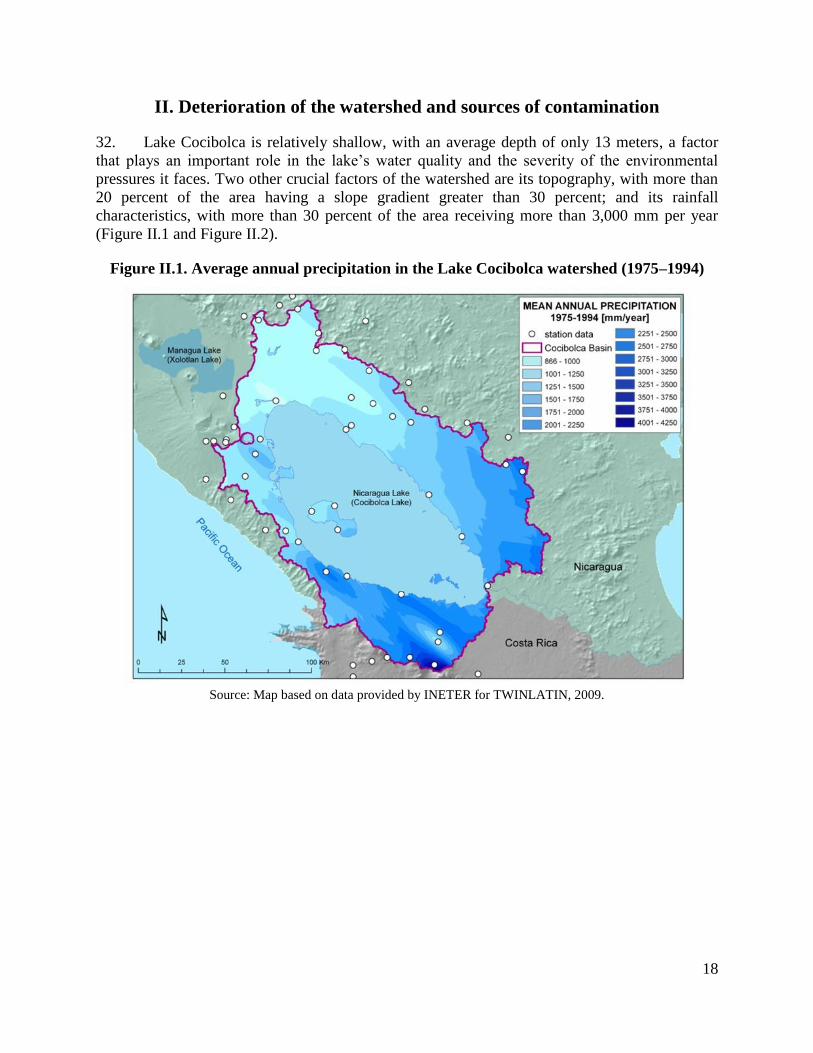
32. Lake Cocibolca is relatively shallow, with an average depth of only 13 meters, a factor
that plays an important role in the lake’s water quality and the severity of the environmental
pressures it faces. Two other crucial factors of the watershed are its topography, with more than
20 percent of the area having a slope gradient greater than 30 percent; and its rainfall
characteristics, with more than 30 percent of the area receiving more than 3,000 mm per year
(Figure II.1 and Figure II.2).
Figure II.1. Average annual precipitation in the Lake Cocibolca watershed (1975–1994)
Source: Map based on data provided by INETER for TWINLATIN, 2009.

19
Figure II.2. Topography of the Lake Cocibolca watershed
Source: Map based on TWINLATIN database, 2009.
2.1 Evidence of contamination problems but major knowledge and data gaps
33. Little is known about the trends in water quality because monitoring of water and
sediment quality in the lake and in its watershed has not been systematic. However, the available
anecdotal evidence, such as the occurrence of fish kills in the lake, and occasional monitoring
data suggest that water quality is increasingly becoming a problem. Water sampling campaigns
by the Center for Water Resources Research (CIRA/UNAN) have generated evidence of
bacteriological contamination and of high levels of agrochemicals and their residues in some
samples and have pointed to an ongoing eutrophication process in Lake Cocibolca. Based on
these limited sampling data, water quality appears to have deteriorated in the last fifteen years.
34. Concerns about eutrophication. One of the most serious longer-term water quality
concerns in the lake is the ongoing process of eutrophication, marked by the presence of
sufficiently high levels of nutrients in the water to cause algal growth, particularly of
cyanophytes commonly known as blue-green algae.3 Problems associated with eutrophication
include increasing cyanobacteria populations and the associated potential for the production of
microbial toxins that can affect fish, wildlife and humans. In addition, these cyanobacteria
produce organic compounds that can cause undesirable taste and odor in the water, resulting in
3 Other symptoms include an increase in phytoplankton and chlorophyll a, and structural simplification of biological
communities.

20
consumer complaints and very high water treatment costs. Although occasional water quality
monitoring campaigns have pointed to a eutrophic status in sampled sections of the lake, existing
water quality studies do not provide unambiguous evidence of the severity of eutrophication
problems. Monitoring data also indicate a worrisome tripling of nitrogen (N) levels and near-
doubling of phosphorus (P) levels in sampled areas between 1994 and 2003; nitrogen levels had
reached 382 μg/l and phosphorus levels 47 μg/l (García et al. 2003).4 The lake’s turbidity and
typically windy conditions help slow the development of blue-green algae and raise oxygen
levels in the water, but the lake’s shallowness makes it more susceptible to eutrophication.
35. Gaps in monitoring data and toxicology studies. The available occasional monitoring
studies leave no doubt that water quality is a serious concern in the watershed, but it is unclear
how the concentration of pollutants fluctuates throughout the year, how pollutants travel in the
lake, and whether toxic algae varieties are already present or are becoming a threat to the lake’s
water quality. Toxicology studies focusing on algae species present in Lake Cocibolca are
needed for a more definitive assessment of the severity of the eutrophication problems in the lake
and what the presence of those algae means for public health, ecosystems and water treatment.
Furthermore, in the absence of systematic monitoring data, calibration of hydrological models
such as the one developed under this study is not possible. One of this study’s contributions is
the identification of key areas and parameters for monitoring that are needed to enable the
development and calibration of land-water models in the future.
36. Fecal and pesticide contamination. The limited monitoring data point to localized high
levels of bacteria indicative of human fecal contamination near Granada, San Jorge, San Carlos
and Rivas. Water quality near the beaches may pose public health risks in the hotspots of
contamination because bacteriological levels exceed the levels recommended for swimming and
recreation, according to the results of the occasional monitoring campaigns. According to recent
samples of water quality mostly near beaches, beachfront restaurants and piers in those towns,
the total fecal coliform count exceeded 200 most probable number of parts (MPN) per 100
milliliters in 13 out of 20 sampled areas, and exceeded 1,000 MPN in four samples, likely
making it unsuitable for bathing in the areas with the worst water quality (MINSA 2009).5 In
some areas the bacteriological count even exceeded the standards set by the Nicaraguan Water
Supply and Sanitary Sewage Company (ENACAL) for drinking water quality prior to treatment
with conventional potabilization methods. However, monitoring data suggest that, in general, the
lake’s water quality is high enough to be used as a source of drinking water with conventional
water treatment processes.6 Measurable levels of polycyclic aromatic hydrocarbons, as well as
4 Studies in Florida and Brazil indicate that eutrophication of tropical shallow lakes can occur when total nitrogen
reaches 2,000 µg/l and total phosphorus reaches 50–200 µg/l (Koster et al. 2009). 5 Total fecal coliform ranged between 2,800 and 5,000 MPN per 100 milliliters in three out of ten areas in the water
quality monitoring sample, and the thermo-tolerant coliform count ranged from 230 to 1,100 MPN in the three
samples with the worst water quality (Salvatierra Suárez and Caballero Arbizú 2006: 31). According to Canada’s
2003 water quality norms, water with total fecal coliform exceeding 1,000 MPN per 100 milliliters is not suitable for
swimming and irrigation, while according to the US Environmental Protection Agency’s (US EPA) 1991 water
quality guidelines, the thermo-tolerant coliform count should not exceed 200 MPN in water suitable for swimming. 6 In 2007, ENACAL initiated a Special Water Quality Monitoring Program for Lake Cocibolca, which involves
systematic monitoring of a range of parameters at 64 sites. The results to date were recently presented by ENACAL.
They indicate that the lake’s water is suitable for conventional treatment to make water potable even though
parameters are exceeded in some critical areas. Nicaraguan water quality standards defined by INAA specify that the
total coliform count needs to fall below a monthly average of 2,000 MPN per 100 ml for water for domestic use
21
organochlorine and organophosphorus pesticides and their degradation products, have been
detected in river and lake sediments, although the levels of these contaminants in river waters
were below the levels of concern for aquatic life and drinking water.7 Since these pesticides and
their residues persist (do not degrade) for many years in soils and water, they will continue to be
carried to the lake in runoff, despite the fact that they are no longer widely used in agriculture.
37. Sedimentation of the San Juan River. Another important concern, identified as one of
the main environmental problems in the watershed, as documented in the studies of the
Procuenca project, is the high rate of sedimentation. The San Juan River is the lake’s only outlet
(Figure II.3). As noted by the Procuenca study, the increased sedimentation in the area where the
lake enters the San Juan River appears to have increased difficulties for navigation since parts of
the river have now become impassable even for small boats during the dry season, and thereby
require dredging in this area (Procuenca 2004).8 Bathymetric studies, measuring the lake’s depth,
have revealed that substantial sedimentation is occurring in the eastern-southeastern parts of the
watershed, near San Carlos and the mouths of the Mayales, Tepenaguasapa and Tule Rivers
(Procuenca 2004). Systematic monitoring data are required to evaluate the extent of the problem
and estimate the rates of accumulation of sediment flows in the river’s confluence with the lake.
Figure II.3. The San Juan River is the lake’s only outlet to the sea
prior to standard treatment (only disinfection) and below 10,000 MPN per 100 ml for water for more elaborate and
slightly more expensive conventional treatment (ENACAL 2009). 7 The concentration of the highly persistent herbicides dieldrin, linden and the products of DDT degradation (pp-
DDT) exceed Canadian- and US-recommended ambient quality norms. A highly persistent herbicide, linden,
possibly used in the past or at present by agriculture and in vector control, was found in all sediment samples of the
lake, with the concentration varying from 0.45 to 1.51 µg/Kg (the permissible level according to Canadian
guidelines is 0.94) (CIRA/UNAN, Ciudad del Saber). 8 This historic river was the route of famous pirates and later the stage for great colonial-period battles between the
Spanish and British Crowns. It later became the route of Cornelius Vanderbilt’s interoceanic steam ship service
during the California gold rush; and it was described by Mark Twain in his notebooks as “an earthly paradise.”

22
Source: Data provided by INETER for TWINLATIN, 2009.
38. Lake Cocibolca’s role in domestic water supply. Lake Cocibolca is considered a major
future source of water supply in the region. Currently exploited water sources will be unable to
meet growing demand as Nicaragua’s population grows9 and as the rates of service coverage rise
from the current national average of 80 percent. Several hydrological studies have concluded
that, given the current efficiency of water supply, in the medium term Managua’s already
overexploited aquifer will be unable to meet the city’s growing water demand (JICA 1993;
ENACAL 2003, 2007).10
Lake Cocibolca and the Las Canoas reservoir appear to be most viable
sources for additional water supplies.11
Lake Cocibolca already provides drinking water to about
75,000 people in the city of Juigalpa, and an aqueduct is under construction to supply water from
the lake to the coastal tourism town of San Juan del Sur. Other towns near the lake that face
overexploited aquifers and aquifer contamination with nitrates and iron, including Rivas, San
Jorge, Cárdenas, Boaco and San Carlos, could draw water from the lake in the future. Granada,
9 Nicaragua’s population growth rate of 1.8 percent is one of the highest in the Western Hemisphere.
10 In principle, current sources are sufficient to cover Managua’s needs through at least 2015, assuming that
distribution losses can be reduced from 55 percent to 25 percent of total water produced and distributed by
Managua’s water system (JICA 2005; World Bank 2008). However, this ambitious target is unlikely to be achieved.
Even if it were, additional sources would be needed to meet increasing demand after 2015. 11
Las Canoas is located in the Malacatoya River watershed, which is within the Lake Cocibolca watershed.
ENACAL estimates that Las Canoas could provide about 1.05 m3/sec, of which 90 percent would be used by
Managua (increasing total supply from current levels of 2.78 m3/sec) and the rest by Titipapa (ENACAL 2008).
Although this is only a small fraction of what Lake Cocibolca could provide, it could be available sooner and could
be delivered to Managua largely by gravity flow. However, the Malacatoya River watershed also has its problems,
as discussed below.
23
Nicaragua’s fourth most populous city with about 111,000 people and one of the country’s main
tourism attractions, may also resort to using the lake in the longer term.12
Although in-depth
economic assessments will still be needed to determine whether the lake is a more reliable and
less expensive water supply source than other alternatives such as rivers and streams in the lake’s
upper watershed, and to assess the scope for the efficiency gains from improving water use from
current sources, it is clear that the lake is a likely water supply source in the long term for at least
some of the towns in the lake’s watershed and possibly even for Managua.13
Using lake water is
likely to be particularly important for towns near the shore in small catchments, such as Rivas,
San Jorge, Cárdenas or San Carlos, and for towns along the Pacific coast, such as San Juan del
Sur.
39. Impact of eutrophication on water treatment costs. Despite the apparent deterioration
in the lake’s water quality over the last decade and evidence of ongoing eutrophication,
conventional water treatment processes at present are generally sufficient to ensure that drinking
water standards are met. With the continuing flow of nutrients and the associated growth of blue-
green algae in the lake, more expensive water treatment processes would be required to remove
organic matter, turbidity and odor in treated water; and to remove other chemical compounds and
metals that adversely affect water quality. According to ENACAL, if water quality were to
deteriorate to such an extent that more complex water treatment processes are required, water
treatment costs could double compared to conventional treatment, from about US$0.30 per cubic
meter to US$0.67 per cubic meter. In a hypothetical case that all of Granada’s water demand
were to be met by the lake, annual treatment costs would rise from US$3.6 million to US$8.0
million at current water consumption rates of 0.38 m3/s.
40. Reduction of health risks and adverse impacts on biodiversity. Other benefits from
protecting water quality could not be assessed in this study because of the uncertainty about
impacts (eutrophication, bacteriological contamination and the effects on ecosystem health, and
future water treatment costs) and data limitations (agrochemicals). In-depth assessment of the
costs of investments in watershed and water quality protection and the associated benefits are
needed in the contamination hotspots where humans and the ecosystems are exposed to and may
be affected by agrochemicals and bacteriological contamination.
2.2 Sources of environmental degradation
41. Sources of contamination. Some pollution originates from point sources, such as the
discharge of domestic wastewater and sewage without appropriate treatment, discharge of
industrial wastewater, and intensive cultivation of tilapia in some coastal areas. But many
important sources of contamination in the lake—nitrogen, phosphorus and highly persistent
herbicides, as well as hydrocarbons—are from non-point sources, particularly agricultural runoff.
12
Hydrological assessments indicate that Granada’s aquifer has enough capacity to meet the city’s water needs until
2040, but contamination from nearby solid waste disposal sites may limit its use after 2022. 13
As an example of the cost of obtaining water from Lake Cocibolca, the cost of the newly constructed aqueduct to
Juigalpa was US$20.6 million. This covered the building of two pumping stations, 28 km of aqueducts to bring the
water to Juigalpa, and a 1,200 m3 holding tank cost (ENACAL 2008). The Government of South Korea contributed
US$17.2 million of this cost. A second phase of the project, to expand the treatment plant and improve the local
distribution network, is expected to cost US$19.9 million, of which 80 percent will also be financed by South Korea.
Beyond the capital costs, drawing water from the lake imposes high operating costs. The monthly energy costs
arising from the Juigalpa’s system are estimated at US$60,000.
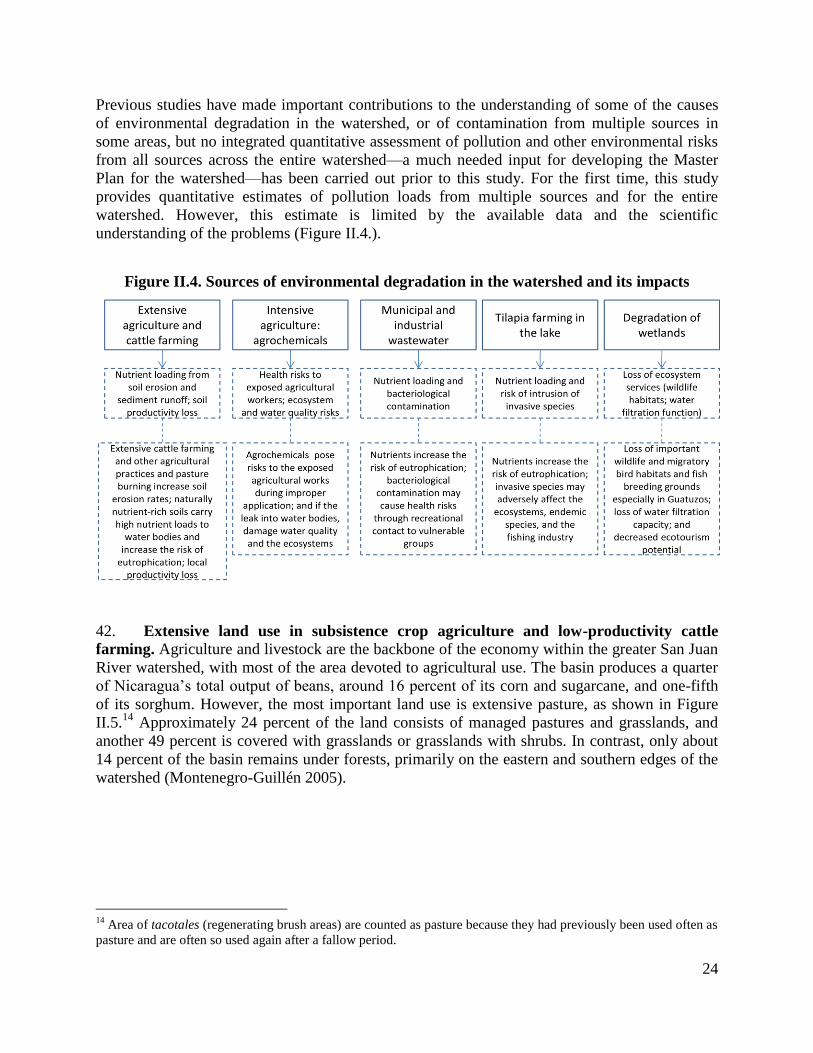
24
Previous studies have made important contributions to the understanding of some of the causes
of environmental degradation in the watershed, or of contamination from multiple sources in
some areas, but no integrated quantitative assessment of pollution and other environmental risks
from all sources across the entire watershed—a much needed input for developing the Master
Plan for the watershed—has been carried out prior to this study. For the first time, this study
provides quantitative estimates of pollution loads from multiple sources and for the entire
watershed. However, this estimate is limited by the available data and the scientific
understanding of the problems (Figure II.4.).
Figure II.4. Sources of environmental degradation in the watershed and its impacts
42. Extensive land use in subsistence crop agriculture and low-productivity cattle
farming. Agriculture and livestock are the backbone of the economy within the greater San Juan
River watershed, with most of the area devoted to agricultural use. The basin produces a quarter
of Nicaragua’s total output of beans, around 16 percent of its corn and sugarcane, and one-fifth
of its sorghum. However, the most important land use is extensive pasture, as shown in Figure
II.5.14
Approximately 24 percent of the land consists of managed pastures and grasslands, and
another 49 percent is covered with grasslands or grasslands with shrubs. In contrast, only about
14 percent of the basin remains under forests, primarily on the eastern and southern edges of the
watershed (Montenegro-Guillén 2005).
14
Area of tacotales (regenerating brush areas) are counted as pasture because they had previously been used often as
pasture and are often so used again after a fallow period.

25
Figure II.5. Land use in the Lake Cocibolca watershed
Source: Based on data from MAGFOR and INETER collected under the TWINLATIN project and this study.
43. The environmental impacts of this agricultural expansion have been great and include
reductions in biodiversity, increased runoff and severe soil erosion. Extensive cattle farming, the
most common agricultural activity in the Nicaraguan part of the watershed, is a major source of
nutrients. The practice of seasonal pasture burning makes the soils in areas with high slopes and
no forest cover particularly prone to erosion. Eroded soil is a significant source of nitrogen and
phosphorus that reach Lake Cocibolca, because the volcanic soils in the lake’s watershed are rich
in these nutrients. Another source of nutrients is the application of fertilizers.
44. The Procuenca San Juan Project emphasized the importance of deforestation and
poor agricultural practices in increasing soil erosion in the basin. Agricultural practices
identified by the project as causes of excessive soil erosion included deforestation, burning crop
lands and pastures in the dry season to facilitate land preparation and pasture regrowth at the
26
beginning of the wet season, and extensive livestock production without pasture rotation, leading
to localized soil compaction by cattle and poor protection of the soil surface by vegetation. The
impacts of this excessive soil erosion, as highlighted by the Procuenca San Juan Project, included
reduced soil fertility, gully erosion, increased the turbidity in the rivers, erosion and
sedimentation of stream channels, diminished recharge of aquifers and subsurface return flows to
streams, increased flows in the wet season, decreased flows in the dry season, and excessive
sedimentation and algae growth in the lake (Procuenca San Juan 2004). The project identified
problems with soil erosion in the Ochomogo, Malacatoya, Tecolostote, Mayales and Acoyapa
sub-basins in Nicaragua. In addition, substantial areas with “severe” and “strong” levels of soil
erosion were identified in the Costa Rican portions of the watershed, where there are large areas
of cattle and crop production below the protected areas near the top of the watershed.
Bathymetric studies, measuring the lake’s depth, have revealed that substantial sedimentation is
occurring in the eastern-southeastern parts of the watershed, near San Carlos and the mouths of
the Mayales, Tepenaguasapa and Tule Rivers.
45. Studies in Nicaragua and Costa Rica have found large amounts of localized soil erosion,
large sediment loads in rivers during the wet season, and sediment accumulation near the mouths
of rivers that drain the high-rainfall areas of the Lake Cocibolca watershed. The Procuenca San
Juan Project and studies by CIRA-UNAN have emphasized the role of soil erosion in the
deterioration of water quality in Lake Cocibolca, and several maps representing the local
magnitude of different factors that influence soil erosion were produced during the TWINLATIN
project; however, no comprehensive studies have addressed the scale of nutrient loads associated
with runoff and erosion from the watershed (Procuenca San Juan 2004 and TWINLATIN 2009).
In addition, no quantitative estimates are available for an evaluation of the possible impacts of
agriculture and rural development programs focused on promoting sustainable agricultural
practices that could increase agricultural production while reducing soil erosion and nutrient
losses from the watershed.
46. These unsustainable land uses and production patterns are part of a broader rural
development challenge: to improve productivity of subsistence farmers through stronger tenure
security and access to productive assets, and to diversify rural livelihoods. Nationally, 72 percent
of all rural households in Nicaragua own only 16 percent of total agricultural land and 80 percent
of cultivated area is under staple grains. In the greater Lake Cocibolca-San Juan River watershed,
small and subsistence producers represent around 88 percent of producers, but they occupy only
half of the total area under crops and pastures (Montenegro-Guillén 2005). Livestock production
in the Nicaraguan part of the Lake Cocibolca watershed is dominated by extensive dual-purpose
cattle farming by small farmers; in the Costa Rican part of the watershed, livestock production
generally specializes in higher-productivity dairy or meat breeds. It is difficult to draw a
conclusive picture because few statistics and little socioeconomic information about the
population and agricultural production structure in the Lake Cocibolca watershed are available
(Procuenca San Juan 2004).
47. Although approximately 70 percent of land has registered titles in Nicaragua, small and
poor producers until recently tended to lack formal title to land, which is often but not always
associated with insecure tenure (Table II.1) (World Bank 2003, pp. 16–17). As in the rest of
Nicaragua, high levels of inequality in land distribution, high levels of tenure insecurity or a lack
of formal titles to land, as well as limited access to markets, credit, and investment resources
contribute to unsustainable land use and extensive production patterns by small subsistence
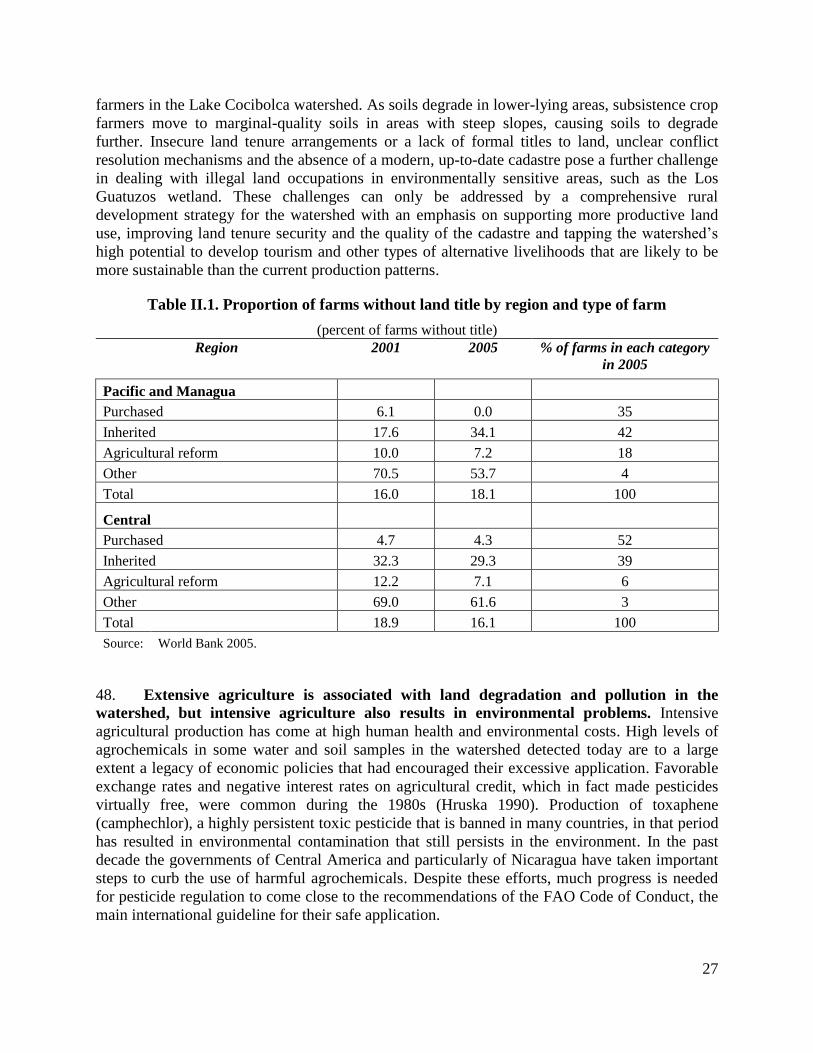
27
farmers in the Lake Cocibolca watershed. As soils degrade in lower-lying areas, subsistence crop
farmers move to marginal-quality soils in areas with steep slopes, causing soils to degrade
further. Insecure land tenure arrangements or a lack of formal titles to land, unclear conflict
resolution mechanisms and the absence of a modern, up-to-date cadastre pose a further challenge
in dealing with illegal land occupations in environmentally sensitive areas, such as the Los
Guatuzos wetland. These challenges can only be addressed by a comprehensive rural
development strategy for the watershed with an emphasis on supporting more productive land
use, improving land tenure security and the quality of the cadastre and tapping the watershed’s
high potential to develop tourism and other types of alternative livelihoods that are likely to be
more sustainable than the current production patterns.
Table II.1. Proportion of farms without land title by region and type of farm
(percent of farms without title)
Region 2001 2005 % of farms in each category
in 2005
Pacific and Managua
Purchased 6.1 0.0 35
Inherited 17.6 34.1 42
Agricultural reform 10.0 7.2 18
Other 70.5 53.7 4
Total 16.0 18.1 100
Central
Purchased 4.7 4.3 52
Inherited 32.3 29.3 39
Agricultural reform 12.2 7.1 6
Other 69.0 61.6 3
Total 18.9 16.1 100
Source: World Bank 2005.
48. Extensive agriculture is associated with land degradation and pollution in the
watershed, but intensive agriculture also results in environmental problems. Intensive
agricultural production has come at high human health and environmental costs. High levels of
agrochemicals in some water and soil samples in the watershed detected today are to a large
extent a legacy of economic policies that had encouraged their excessive application. Favorable
exchange rates and negative interest rates on agricultural credit, which in fact made pesticides
virtually free, were common during the 1980s (Hruska 1990). Production of toxaphene
(camphechlor), a highly persistent toxic pesticide that is banned in many countries, in that period
has resulted in environmental contamination that still persists in the environment. In the past
decade the governments of Central America and particularly of Nicaragua have taken important
steps to curb the use of harmful agrochemicals. Despite these efforts, much progress is needed
for pesticide regulation to come close to the recommendations of the FAO Code of Conduct, the
main international guideline for their safe application.
28
49. Pesticide use in Central America has been an acute social and political issue over the past
few decades, causing large numbers of reported pesticide poisonings among agricultural
workers, heated debate about the need to restrict the use of the most toxic substances, and street
protests and civil unrest. Reports of pesticide-caused illness in Central America go back to the
1970s, when pesticides were extensively used in cotton cultivation in El Salvador, Nicaragua and
Guatemala. After the collapse of cotton cultivation, pesticide use shifted to other crops. It has
been estimated that around 400,000 poisonings may have occurred in Central America each year
in the late 1990s, affecting nearly two percent of the population over age 15 (Murray et al. 2002).
Of particular concern are the cases of mass poisonings from methamidophos due to
environmental or residential exposure such as drifts from nearby agricultural fields, aerial
applications or school gardens, as reported in the mass media. Most of the poisonings have been
associated with the use of highly toxic organophosphates, carbamates and paraquat. Many
pesticides currently used in Central America are highly toxic, acknowledged animal carcinogens,
neurotoxins, reproductive toxins or endocrine disruptors that have been banned or severely
restricted in industrialized countries (Wesseling et al. 2005).
50. The governments of Nicaragua and Costa Rica have taken important steps to address the
problem by implementing the PLAGSALUD surveillance system ahead of other Central
American countries, strengthening the capacity of the ministries of health, banning some most
harmful substances, and improving the permitting and registration requirements. However, cases
of pesticide poisoning are thought to be severely underreported in the surveillance system. In
Nicaragua, one census-based study found that only 6 percent of the poisonings attended in health
centers appeared in official statistics. Other studies have also found very high rates of
underreporting (Wesseling et al. 2002). Furthermore, regulations are based on the exposures
estimated based on international practices for which the risks have been evaluated, but the use of
application techniques that are not approved and evaluated in other countries, such as using
plastic bags impregnated with chlorpyrifos by banana workers in Honduras, is common in
Central America.
51. Training personnel to carry out exposure assessments and monitoring of the permitting
and registration procedures, establishing effective coordination mechanisms between the
Ministries of Agriculture and Health, and provision of agricultural extension services for farmers
on safe application practices of pesticides and the use of Integrated Pest Management (IPM)
instead of chemical control methods are the main strategies for reducing the health and
environmental risks. Curbing the leakage to markets of banned pesticides from the existing
stockpiles that have not been destroyed poses another major challenge to the regulators.
52. As for the damage to ecosystems and adverse effects on water quality, it is unclear to
what extent current agricultural practices may be contributing to high levels of agrochemical
residues in some samples. Monitoring data of agrochemicals in water and soils of the watershed
are very limited and little is known about current application patterns, apart from the application
levels recommended by MAGFOR guidelines. Systematic ambient monitoring data as well as
data on actual field applications are needed to facilitate quantitative assessments of risks to
health and ecosystems. In the Nicaraguan portion of the Lake Cocibolca watershed,
agrochemicals are mainly used in rice and sugar cultivation, while in the Costa Rican portion
they are mainly used in citrus plantations. It is unclear to what extent current practices contribute
to soil and water contamination, because data are not available or not disclosed. Obtaining better
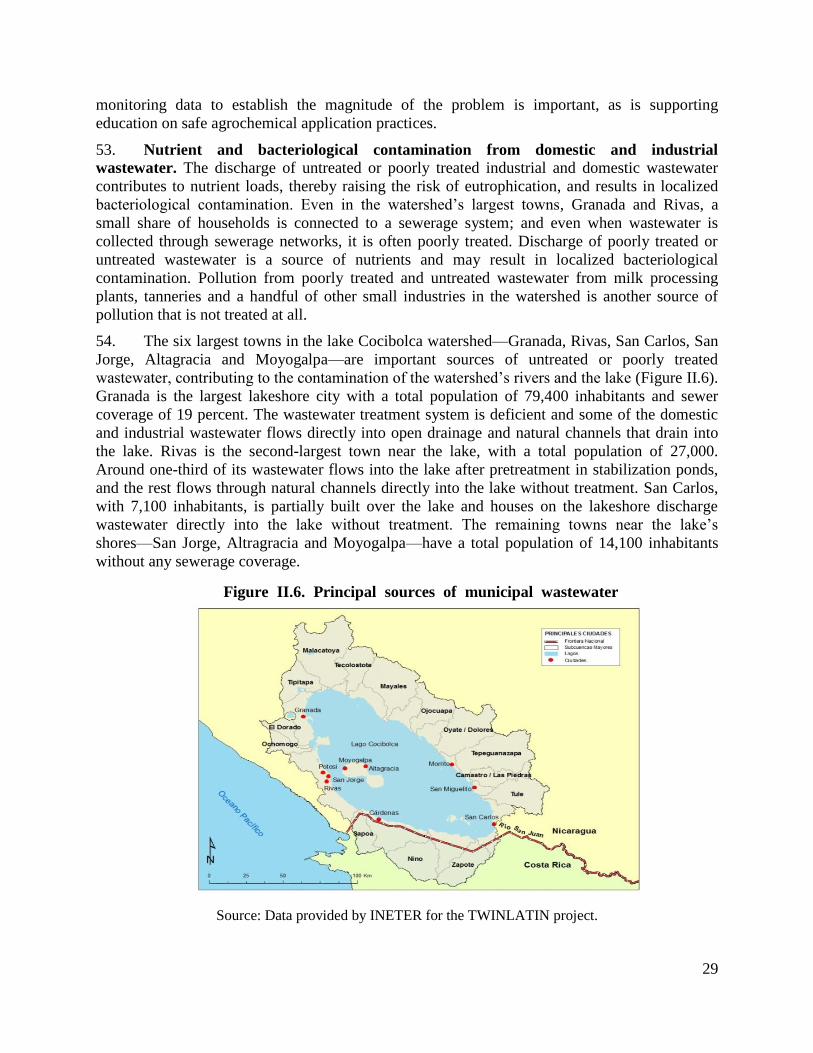
29
monitoring data to establish the magnitude of the problem is important, as is supporting
education on safe agrochemical application practices.
53. Nutrient and bacteriological contamination from domestic and industrial
wastewater. The discharge of untreated or poorly treated industrial and domestic wastewater
contributes to nutrient loads, thereby raising the risk of eutrophication, and results in localized
bacteriological contamination. Even in the watershed’s largest towns, Granada and Rivas, a
small share of households is connected to a sewerage system; and even when wastewater is
collected through sewerage networks, it is often poorly treated. Discharge of poorly treated or
untreated wastewater is a source of nutrients and may result in localized bacteriological
contamination. Pollution from poorly treated and untreated wastewater from milk processing
plants, tanneries and a handful of other small industries in the watershed is another source of
pollution that is not treated at all.
54. The six largest towns in the lake Cocibolca watershed—Granada, Rivas, San Carlos, San
Jorge, Altagracia and Moyogalpa—are important sources of untreated or poorly treated
wastewater, contributing to the contamination of the watershed’s rivers and the lake (Figure II.6).
Granada is the largest lakeshore city with a total population of 79,400 inhabitants and sewer
coverage of 19 percent. The wastewater treatment system is deficient and some of the domestic
and industrial wastewater flows directly into open drainage and natural channels that drain into
the lake. Rivas is the second-largest town near the lake, with a total population of 27,000.
Around one-third of its wastewater flows into the lake after pretreatment in stabilization ponds,
and the rest flows through natural channels directly into the lake without treatment. San Carlos,
with 7,100 inhabitants, is partially built over the lake and houses on the lakeshore discharge
wastewater directly into the lake without treatment. The remaining towns near the lake’s
shores—San Jorge, Altragracia and Moyogalpa—have a total population of 14,100 inhabitants
without any sewerage coverage.
Source: Data provided by INETER for the TWINLATIN project.
Figure II.6. Principal sources of municipal wastewater
discharge
30
55. Part of the reason for the disrepair of oxidation ponds and other basic wastewater
treatment facilities is the lack of funding. Financing wastewater treatment investments and
operating costs is a formidable challenge in low-income countries. Raising water tariffs and
payment collection rates is often politically difficult, even when such rate increases are
accompanied by targeted social assistance programs for low-income households. Other sources
of financing for wastewater treatment are efficiency gains through operational improvements of
the public utility companies ENACAL, which is responsible for water and sanitation networks in
urban areas, and FISE, responsible for the rural areas. But the lack of financing is not the only
culprit; sometimes the poor operating condition of wastewater treatment facilities is the result of
coordination failures among municipalities that share or could share and cofinance treatment
facilities. Resolving coordination failures and clarifying responsibilities for treatment facilities
that serve more than one municipality may often be an effective way forward.
56. Nutrient runoff from tilapia farming and possible risks to biodiversity from an
invasive species. Tilapia production in the middle of the lake is the subject of heated debate in
Nicaragua. One view is that this is an important economic activity and source of employment,
associated with low environmental risks. The Environmental Impact Assessment (EIA) found
that the project did not pose significant risks; and that the nutrient load from tilapia farming at
current production levels is not a cause for concern given the lake’s hydrology. The opponents of
that view cite risks to native and endemic species and advocate alternative production methods
and monitoring of water quality and the possible effects on native fish species. This study does
not shed light on this debate apart from providing a rough estimate of the nutrient load from
tilapia farming at current production levels and comparing it with other sources of nutrients.
Box II.1. Tilapia farming can pose risks to the lake’s biodiversity
The tilapia species (Oreochromis niloticus) was accidentally introduced into Lake Cocibolca during hurricane
Juana in 1988, when fish that had been cultivated in tanks for research led by the Central American
University escaped into the lake. Tilapia also reached the lake during the hurricane from controlled
production in the Las Canoas reservoir on the Malacatoya River.
Currently, the only commercial aquaculture taking place in Lake Cocibolca is the “Tilapia Produced in
Floating Cages” project managed by the NICANOR Company. NICANOR began tilapia production in 2003
when the government granted it a concession to develop 86.87 hectares of lake area located in the community
of San Ramón on Ometepe Island. In 2003, an estimated 350 tons of tilapia were produced, most of which
was sold in the international market for approximately US$677,600 (OSPESCA 2006). According to AdPesca
(the Nicaraguan National Fisheries and Aquaculture Administration), NICANOR exported 56 tons of tilapia
filet and 83 tons of whole fish in 2005, which resulted in a contribution of US$555,000 to the national
economy. An estimated 1,388 tons of tilapia were produced in 2008.
Plans by NICANOR to expand production to approximately 3,000 tons of tilapia per year have been
documented. This expansion, if it occurs, would follow international trends, because tilapia is the second most
important commercially farmed fish after carp, and is an increasingly popular food in countries around the
world (FAO 2005–2009). However, the new Nicaraguan National Water Law No. 620, Article 97, prohibits
the introduction and cultivation of exotic, invasive species in Lake Cocibolca. As a non-native species to the
lake, intrusion of tilapia threatens biodiversity and the health of the ecosystem. Tilapia can compete with
native species for food and habitat, threatening native fish species. For example, blue tilapia has displaced
many native fish in the Gulf of Mexico area (GSMFC 2003). Tilapia also has the capacity to interbreed with
native fish populations and form hybrids, which can place additional pressures on ecosystems (Costa-Pierce,
2003).
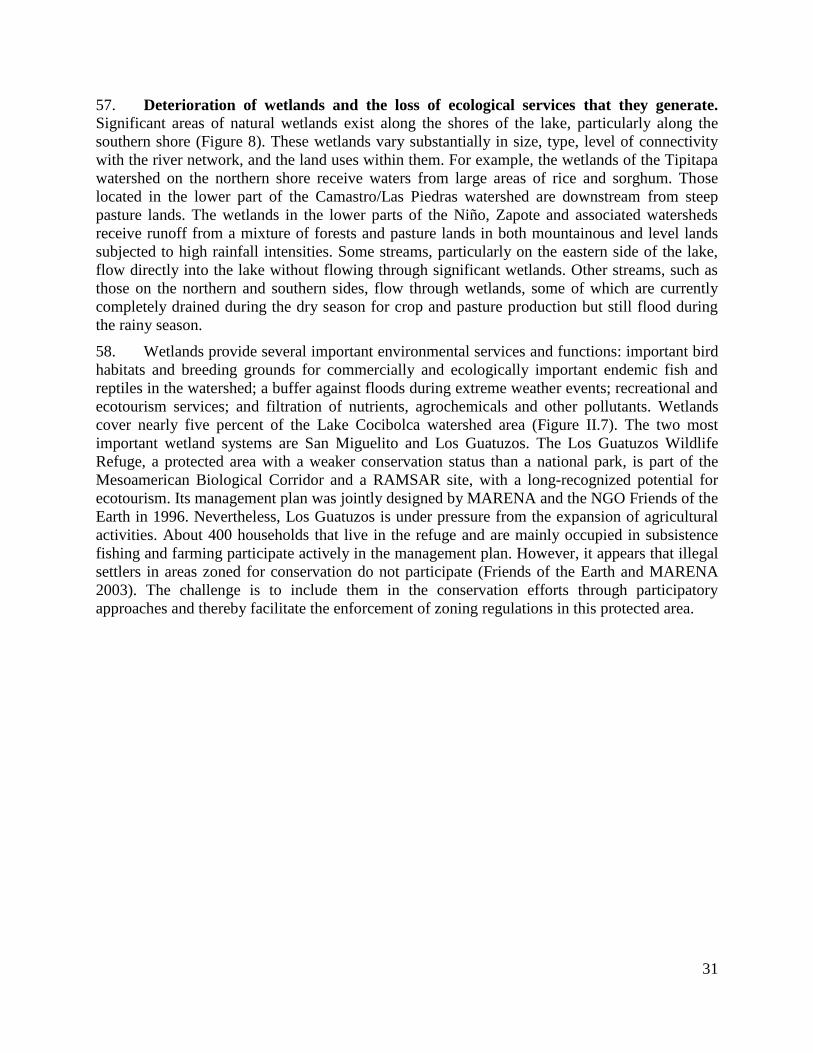
31
57. Deterioration of wetlands and the loss of ecological services that they generate.
Significant areas of natural wetlands exist along the shores of the lake, particularly along the
southern shore (Figure 8). These wetlands vary substantially in size, type, level of connectivity
with the river network, and the land uses within them. For example, the wetlands of the Tipitapa
watershed on the northern shore receive waters from large areas of rice and sorghum. Those
located in the lower part of the Camastro/Las Piedras watershed are downstream from steep
pasture lands. The wetlands in the lower parts of the Niño, Zapote and associated watersheds
receive runoff from a mixture of forests and pasture lands in both mountainous and level lands
subjected to high rainfall intensities. Some streams, particularly on the eastern side of the lake,
flow directly into the lake without flowing through significant wetlands. Other streams, such as
those on the northern and southern sides, flow through wetlands, some of which are currently
completely drained during the dry season for crop and pasture production but still flood during
the rainy season.
58. Wetlands provide several important environmental services and functions: important bird
habitats and breeding grounds for commercially and ecologically important endemic fish and
reptiles in the watershed; a buffer against floods during extreme weather events; recreational and
ecotourism services; and filtration of nutrients, agrochemicals and other pollutants. Wetlands
cover nearly five percent of the Lake Cocibolca watershed area (Figure II.7). The two most
important wetland systems are San Miguelito and Los Guatuzos. The Los Guatuzos Wildlife
Refuge, a protected area with a weaker conservation status than a national park, is part of the
Mesoamerican Biological Corridor and a RAMSAR site, with a long-recognized potential for
ecotourism. Its management plan was jointly designed by MARENA and the NGO Friends of the
Earth in 1996. Nevertheless, Los Guatuzos is under pressure from the expansion of agricultural
activities. About 400 households that live in the refuge and are mainly occupied in subsistence
fishing and farming participate actively in the management plan. However, it appears that illegal
settlers in areas zoned for conservation do not participate (Friends of the Earth and MARENA
2003). The challenge is to include them in the conservation efforts through participatory
approaches and thereby facilitate the enforcement of zoning regulations in this protected area.
32
Figure II.7. Wetlands in the Lake Cocibolca watershed
Source: TWINLATIN, 2009.
59. Other sources of contamination and future pressures. Another possible contamination
source for Cocibolca is through the Tipitapa River from the highly contaminated Lake Managua.
Although Tipitapa is not normally connected to Lake Cocibolca by means of surface flows, at
times, such as during extreme weather events, it becomes interconnected with Lake Cocibolca,
resulting in pollution spills. The increasing frequency of hurricanes due to climate change could
raise these risks but little can be done to prevent it. Lake navigation, so far not very developed, is
another source of pollution. If it ever materializes, construction of the Húmedo Canal—an
alternative to the Panama Canal—would pass through Lake Cocibolca and undoubtedly pose
high environmental risks that would need to be carefully assessed. Finally, a large area in the
lake’s watershed is now under consideration for the development of large new areas of irrigated
agriculture.
60. The degradation of the Lake Cocibolca watershed may already be adversely affecting its
many uses and the ecosystem services it provides, and may be giving rise to a range of current
and potential problems, including health risks from exposure to contamination in pollution
hotspots; loss of biodiversity; emission of greenhouse gases from pasture burning and
deforestation; increased vulnerability to extreme weather events and risk of landslides; the higher
future costs of water treatment due to eutrophication; and—very importantly—maintaining
navigability in the confluence of the San Juan River with the lake and realizing the potential to
develop sustainable tourism in the watershed. Because no assessment of the impact of

33
sedimentation on the navigability of the San Juan River is available, it was not possible to
estimate the associated economic costs in this study.
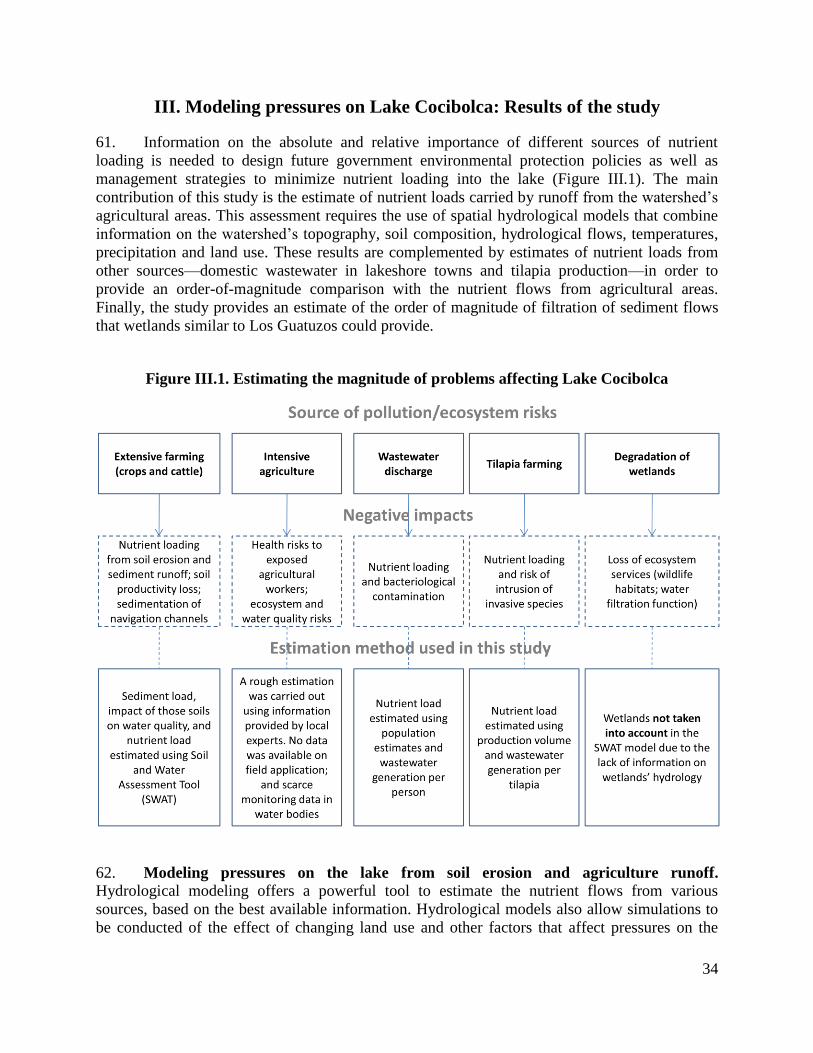
34
III. Modeling pressures on Lake Cocibolca: Results of the study
61. Information on the absolute and relative importance of different sources of nutrient
loading is needed to design future government environmental protection policies as well as
management strategies to minimize nutrient loading into the lake (Figure III.1). The main
contribution of this study is the estimate of nutrient loads carried by runoff from the watershed’s
agricultural areas. This assessment requires the use of spatial hydrological models that combine
information on the watershed’s topography, soil composition, hydrological flows, temperatures,
precipitation and land use. These results are complemented by estimates of nutrient loads from
other sources—domestic wastewater in lakeshore towns and tilapia production—in order to
provide an order-of-magnitude comparison with the nutrient flows from agricultural areas.
Finally, the study provides an estimate of the order of magnitude of filtration of sediment flows
that wetlands similar to Los Guatuzos could provide.
Figure III.1. Estimating the magnitude of problems affecting Lake Cocibolca
62. Modeling pressures on the lake from soil erosion and agriculture runoff. Hydrological modeling offers a powerful tool to estimate the nutrient flows from various
sources, based on the best available information. Hydrological models also allow simulations to
be conducted of the effect of changing land use and other factors that affect pressures on the
35
lake, thus helping to identify and assess possible policy responses. Such models also allow the
effect of changes in baseline conditions to be assessed, including the possible impacts of climate
change. The Soil and Water Assessment Tool (SWAT) was selected for this purpose, because of
its capabilities and extensive experience in its application throughout the world (Box III.1),
Annex A provides additional details on SWAT and its application to the Lake Cocibolca
watershed.
63. Application of SWAT. Modeling was undertaken by a team of international and local
scientists with support of the Technical Working Group and the Steering Committee for the
study. Since time and resources were limited, World Bank staff, consultants and government
ministry leaders decided to conduct a preliminary SWAT analysis in cooperation with a small
multi-institutional team of Nicaraguan scientists and specialists who would help collect available
data required by SWAT and be trained to implement the model in more detailed studies after the
completion of this study.15
This approach to training multi-institutional teams in the use of
15
Fourshort SWAT courses were conducted: three in Managua and one in College Station, Texas. During these
short courses, over 15 Nicaraguan scientists and agency specialists were trained in the use of SWAT and related
software.
Box III.1. The Soil and Water Assessment Tool (SWAT)
The Soil and Water Assessment Tool (SWAT) is a software system designed to help scientists and decision
makers manage soil and water resources at watershed and river basin scales. The SWAT system was developed
over the last 25 years by a team composed of engineers and scientists from the United States Department of
Agriculture’s (USDA) Agricultural Research Service (ARS) and Natural Resources Conservation Service (NRCS)
and from Texas A&M University, with major support from the United States Environmental Protection Agency
(US EPA) and numerous local, state and international cooperators. Many engineers and scientists in the United
States and around the world have contributed to the model, its databases, and interface development.
The SWAT system is a multi-unctional tool that can be used to answer a wide variety of questions about the
function and management of watersheds, both large and small. Its major capabilities relevant to this study include:
Hydrology: daily simulation of the surface and sub-surface hydrology of a watershed, including impacts of
climate change, soil and water conservation practices, urbanization, deforestation, reforestation, brush
control, and construction of ponds and reservoirs.
Land Use: the effects of changing land use on the amount and quality of water in our streams and reservoirs,
including urbanization, increase or decrease in forest cover, conversion of forest and range lands to
agriculture (or the reverse), and construction of reservoirs.
Water Quality: simulation of point and non-point sources of pollution, including sediment, nutrients (nitrogen
and phosphorus), chlorophyll, pesticides and bacteria.
Climate Change: the impacts of past or future climate change on the hydrology, soil erosion, water quality,
and agricultural production of watersheds, including management practices and infrastructure (such as ponds,
reservoirs or irrigation systems) designed to adapt and mitigate the negative impacts of climate change.
The SWAT system has been used successfully in many projects worldwide, which are documented in over 500
peer-reviewed scientific publications. It is used by more than 30 universities. Over the last decade, international
and regional meetings of SWAT users and developers have been held in the US, Netherlands, Italy, Germany,
China, Korea, Thailand, Chile, Portugal, and Spain. Most of the SWAT system software, manuals, databases, and
peer-reviewed literature are in the public domain and can be downloaded at <http://www.brc.tamus.edu/swat>.
The SWAT 2005 Theoretical Documentation was translated into Spanish as part of this study and will soon be
available at the same web address.
36
SWAT to execute specific watershed projects has been successful in a number of river basins
around the world, including the Indus, Ganges, Brahmaputra, Mekong, Nile, Yellow and
Yangtze, and numerous watersheds in North America and Europe. Application of SWAT was
based on available data on topography, hydrology, land use, climate, stream flows, water quality,
topography, soils, agricultural practices, waste water loads, tilapia production, water quality and
nutrient loading of Lake Cocibolca. An important source of information in this process was the
Environmental Database for the Lake Cocibolca Watershed developed under the TWINLATIN
project.
64. Estimated soil erosion, agriculture runoff and nutrient flows. SWAT was used to
simulate the movement of different fractions of phosphorus and nitrogen off the land, down
streams, and into lakes and reservoirs, using 11 years of daily weather data for a large number of
weather stations in and surrounding the watershed. Land use data were taken from maps
prepared during the last decade, based on satellite imagery. Figures III.2a and III.2b show the
estimated mean annual soil erosion within the lake’s watershed and the forest cover. For baseline
(current) conditions, the mean annual sediment loads delivered to Lake Cocibolca are estimated
to be 17.8 million tons (or 13.3 tons/ha/yr),16
while total nitrogen (N) loads are estimated to be
7,419 tons (or 5.55 kg/ha/yr) and total phosphorus (P) loads are estimated to be 593 tons (or 0.44
kg/ha/yr).17
These results are similar to previous estimates from the Procuenca San Juan project
of total nitrogen (3,139 t/yr) and total phosphorus (571 t/yr) delivered to Lake Cocibolca from its
principal sediment-contributing tributaries. In addition, the Procuenca San Juan project reported
very shallow water depths and substantial sediment deposition near San Carlos and the mouths of
the Mayales, Tepenaguasapa and Tule Rivers in Nicaragua, each of which contributes more than
2.5 percent of the total sediment deposited in the lake.
65. Origins of sediment and nutrient loads. The principal rivers and streams that deliver
sediments to Lake Cocibolca have been ranked based on the results of the SWAT simulations
(Annex Figure A.10). The greatest sediment loads are carried by streams in the southern part of
the watershed, with lesser but very significant amounts carried by streams in the northern and
eastern parts of the watershed. Similar analyses have been conducted for nutrients, resulting in a
ranking of the sub-watersheds in terms of their nutrient contributions to the lake (Annex Figure
A.11 and Table A.8). Somewhat counter-intuitively at a first glance, the rankings in terms of
sediment and of nutrient loads are not well correlated. An analysis was conducted to assess the
correlation between the average annual load of sediments and nutrients (total P and total N) by
sub-watershed. The analysis reveals that the sediment load explains between 62 and 67 percent
of the nutrient loads. This result is not surprising after the land use patterns in the sub-watersheds
with the highest nutrient loads (El Dorado, Ochomogo and Tipitapa) are more closely viewed.
Apart from sediment and the nutrients associated with sediment particles, another factor
influencing nutrient loads is the direct application of fertilizers, which is high in areas of rice,
sugarcane and corn cultivation (Annex A, Tables A.2 and A.3).
16
These results suggest that at current rates of sedimentation (assuming a sediment density of 1.4 tons/m3 and no
outflow of sediment from the lake), over 8,000 years would be required to completely fill the lake with sediment. 17
Equivalent mean values plus/minus one standard deviation are: for sediments, 10.3–25.3 million tons (or 7.7–18.9
tons/ha/yr); for total N, 5,290–9,550 tons (or 3.96–7.15 kg/ha/yr); and for total P, 364–822 tons (or 0.270.62
kg/ha/yr).
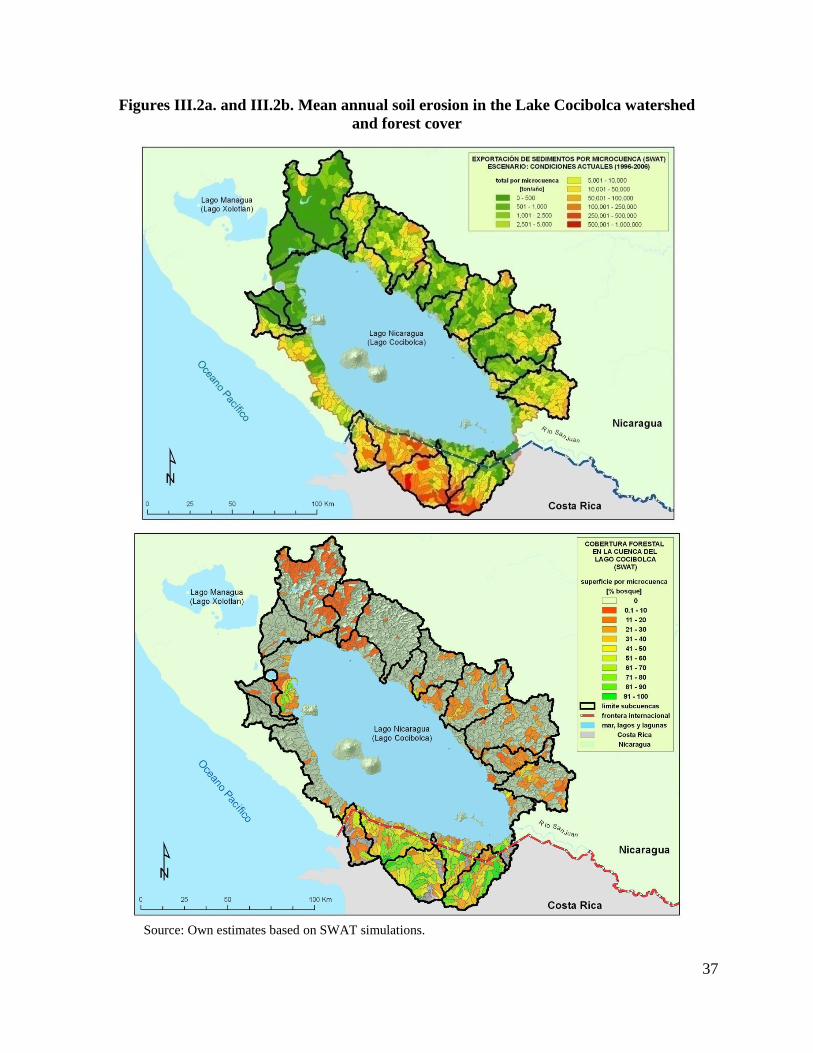
37
Figures III.2a. and III.2b. Mean annual soil erosion in the Lake Cocibolca watershed
and forest cover
Source: Own estimates based on SWAT simulations.
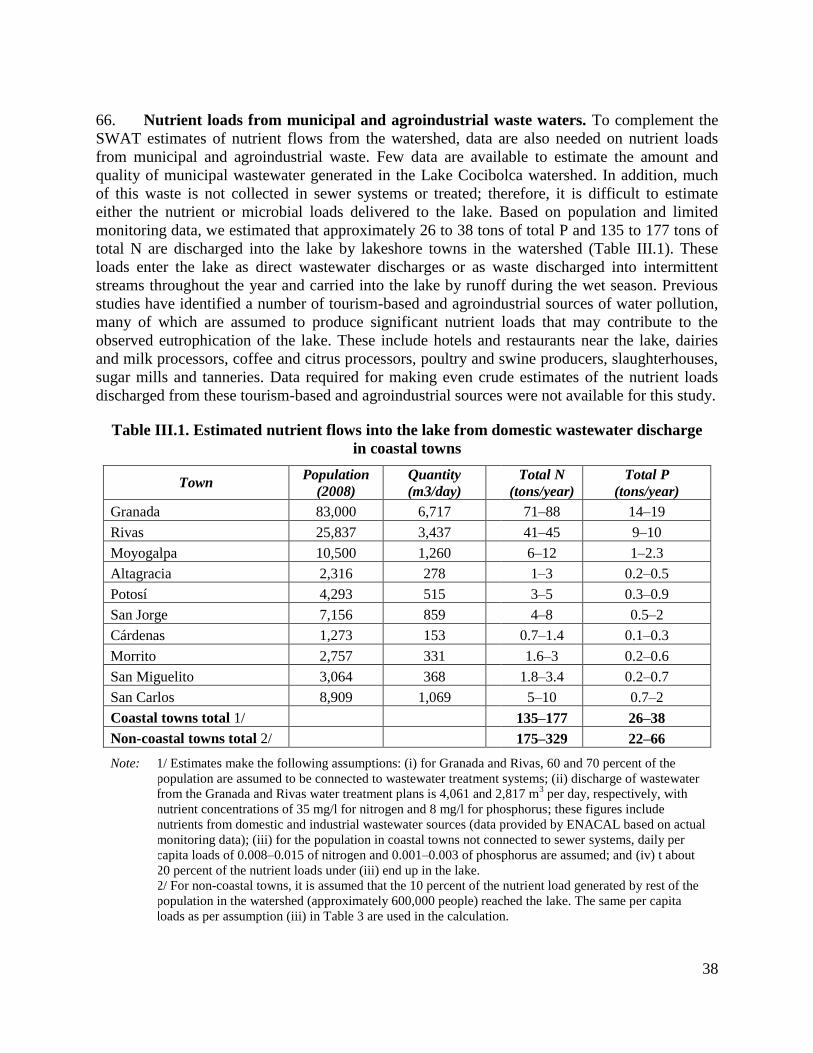
38
66. Nutrient loads from municipal and agroindustrial waste waters. To complement the
SWAT estimates of nutrient flows from the watershed, data are also needed on nutrient loads
from municipal and agroindustrial waste. Few data are available to estimate the amount and
quality of municipal wastewater generated in the Lake Cocibolca watershed. In addition, much
of this waste is not collected in sewer systems or treated; therefore, it is difficult to estimate
either the nutrient or microbial loads delivered to the lake. Based on population and limited
monitoring data, we estimated that approximately 26 to 38 tons of total P and 135 to 177 tons of
total N are discharged into the lake by lakeshore towns in the watershed (Table III.1). These
loads enter the lake as direct wastewater discharges or as waste discharged into intermittent
streams throughout the year and carried into the lake by runoff during the wet season. Previous
studies have identified a number of tourism-based and agroindustrial sources of water pollution,
many of which are assumed to produce significant nutrient loads that may contribute to the
observed eutrophication of the lake. These include hotels and restaurants near the lake, dairies
and milk processors, coffee and citrus processors, poultry and swine producers, slaughterhouses,
sugar mills and tanneries. Data required for making even crude estimates of the nutrient loads
discharged from these tourism-based and agroindustrial sources were not available for this study.
Table III.1. Estimated nutrient flows into the lake from domestic wastewater discharge
in coastal towns
Town Population
(2008)
Quantity
(m3/day)
Total N
(tons/year)
Total P
(tons/year)
Granada 83,000 6,717
71–88 14–19
Rivas 25,837 3,437
41–45 9–10
Moyogalpa 10,500 1,260
6–12 1–2.3
Altagracia 2,316 278
1–3 0.2–0.5
Potosí 4,293 515
3–5 0.3–0.9
San Jorge 7,156 859
4–8 0.5–2
Cárdenas 1,273 153
0.7–1.4 0.1–0.3
Morrito 2,757 331
1.6–3 0.2–0.6
San Miguelito 3,064 368
1.8–3.4 0.2–0.7
San Carlos 8,909 1,069
5–10 0.7–2
Coastal towns total 1/
135–177 26–38
Non-coastal towns total 2/
175–329 22–66
Note:
1/ Estimates make the following assumptions: (i) for Granada and Rivas, 60 and 70 percent of the
population are assumed to be connected to wastewater treatment systems; (ii) discharge of wastewater
from the Granada and Rivas water treatment plans is 4,061 and 2,817 m3 per day, respectively, with
nutrient concentrations of 35 mg/l for nitrogen and 8 mg/l for phosphorus; these figures include
nutrients from domestic and industrial wastewater sources (data provided by ENACAL based on actual
monitoring data); (iii) for the population in coastal towns not connected to sewer systems, daily per
capita loads of 0.008–0.015 of nitrogen and 0.001–0.003 of phosphorus are assumed; and (iv) t about
20 percent of the nutrient loads under (iii) end up in the lake.
2/ For non-coastal towns, it is assumed that the 10 percent of the nutrient load generated by rest of the
population in the watershed (approximately 600,000 people) reached the lake. The same per capita
loads as per assumption (iii) in Table 3 are used in the calculation.
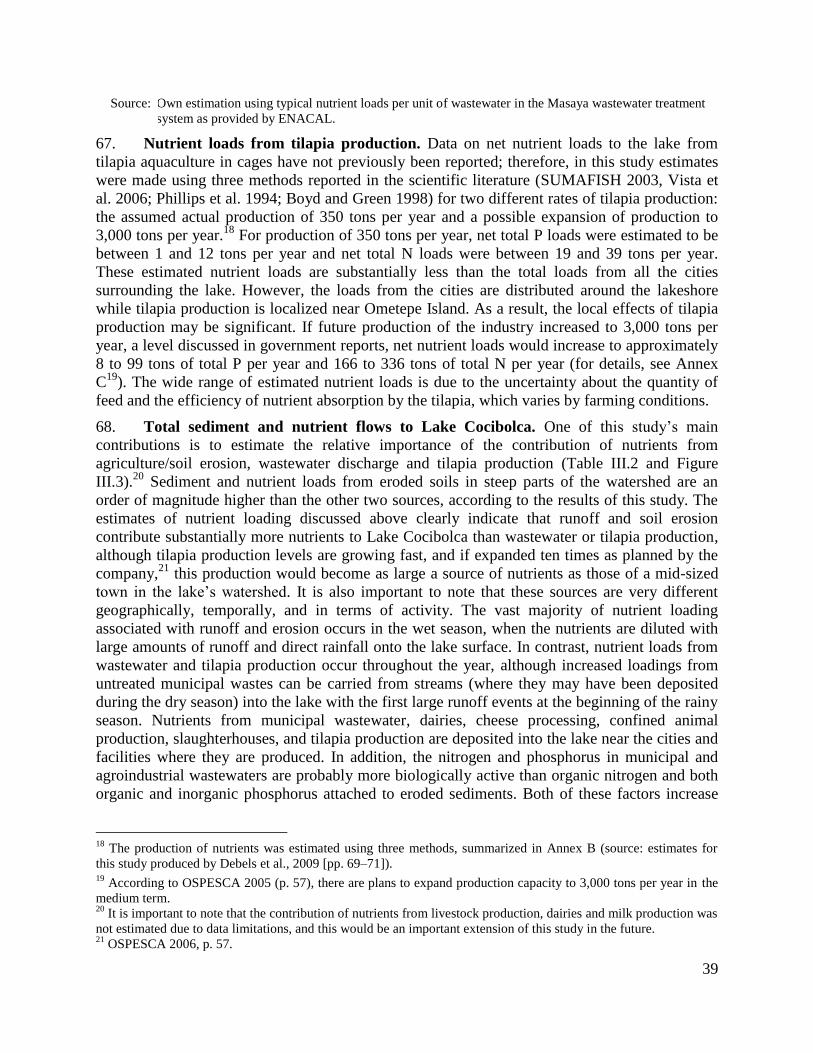
39
Source: Own estimation using typical nutrient loads per unit of wastewater in the Masaya wastewater treatment
system as provided by ENACAL.
67. Nutrient loads from tilapia production. Data on net nutrient loads to the lake from
tilapia aquaculture in cages have not previously been reported; therefore, in this study estimates
were made using three methods reported in the scientific literature (SUMAFISH 2003, Vista et
al. 2006; Phillips et al. 1994; Boyd and Green 1998) for two different rates of tilapia production:
the assumed actual production of 350 tons per year and a possible expansion of production to
3,000 tons per year.18
For production of 350 tons per year, net total P loads were estimated to be
between 1 and 12 tons per year and net total N loads were between 19 and 39 tons per year.
These estimated nutrient loads are substantially less than the total loads from all the cities
surrounding the lake. However, the loads from the cities are distributed around the lakeshore
while tilapia production is localized near Ometepe Island. As a result, the local effects of tilapia
production may be significant. If future production of the industry increased to 3,000 tons per
year, a level discussed in government reports, net nutrient loads would increase to approximately
8 to 99 tons of total P per year and 166 to 336 tons of total N per year (for details, see Annex
C19
). The wide range of estimated nutrient loads is due to the uncertainty about the quantity of
feed and the efficiency of nutrient absorption by the tilapia, which varies by farming conditions.
68. Total sediment and nutrient flows to Lake Cocibolca. One of this study’s main
contributions is to estimate the relative importance of the contribution of nutrients from
agriculture/soil erosion, wastewater discharge and tilapia production (Table III.2 and Figure
III.3).20
Sediment and nutrient loads from eroded soils in steep parts of the watershed are an
order of magnitude higher than the other two sources, according to the results of this study. The
estimates of nutrient loading discussed above clearly indicate that runoff and soil erosion
contribute substantially more nutrients to Lake Cocibolca than wastewater or tilapia production,
although tilapia production levels are growing fast, and if expanded ten times as planned by the
company,21
this production would become as large a source of nutrients as those of a mid-sized
town in the lake’s watershed. It is also important to note that these sources are very different
geographically, temporally, and in terms of activity. The vast majority of nutrient loading
associated with runoff and erosion occurs in the wet season, when the nutrients are diluted with
large amounts of runoff and direct rainfall onto the lake surface. In contrast, nutrient loads from
wastewater and tilapia production occur throughout the year, although increased loadings from
untreated municipal wastes can be carried from streams (where they may have been deposited
during the dry season) into the lake with the first large runoff events at the beginning of the rainy
season. Nutrients from municipal wastewater, dairies, cheese processing, confined animal
production, slaughterhouses, and tilapia production are deposited into the lake near the cities and
facilities where they are produced. In addition, the nitrogen and phosphorus in municipal and
agroindustrial wastewaters are probably more biologically active than organic nitrogen and both
organic and inorganic phosphorus attached to eroded sediments. Both of these factors increase
18
The production of nutrients was estimated using three methods, summarized in Annex B (source: estimates for
this study produced by Debels et al., 2009 [pp. 69–71]). 19
According to OSPESCA 2005 (p. 57), there are plans to expand production capacity to 3,000 tons per year in the
medium term. 20
It is important to note that the contribution of nutrients from livestock production, dairies and milk production was
not estimated due to data limitations, and this would be an important extension of this study in the future. 21
OSPESCA 2006, p. 57.
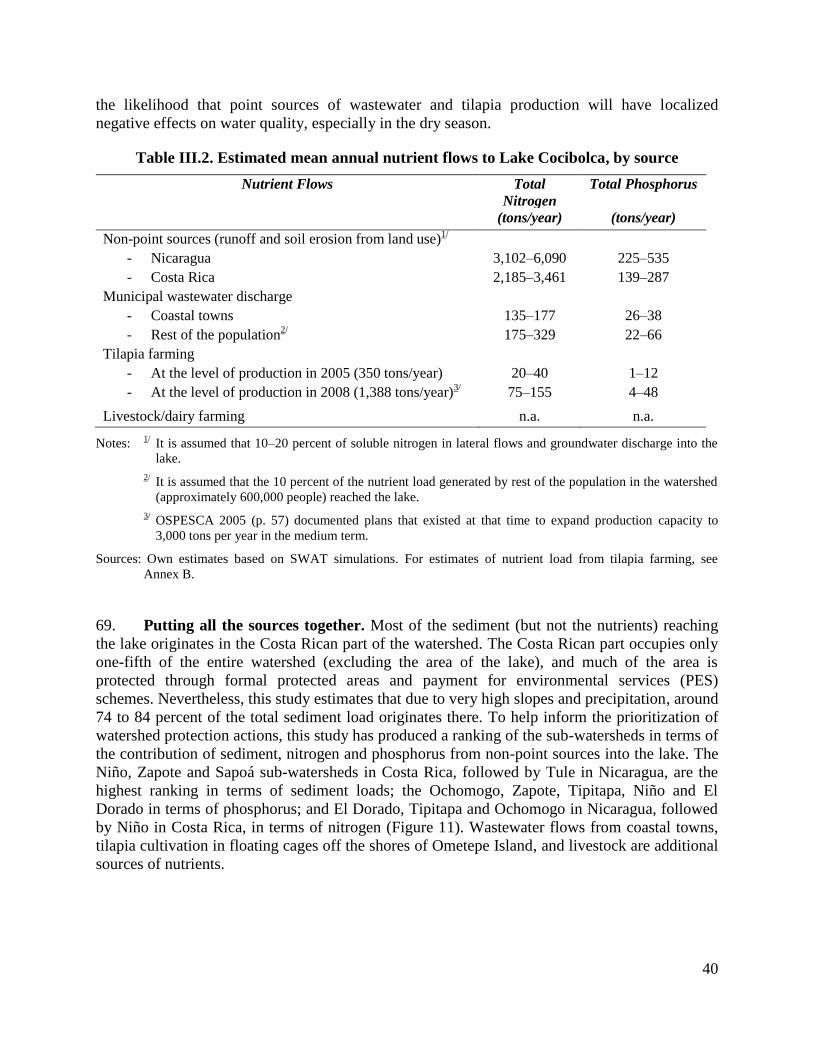
40
the likelihood that point sources of wastewater and tilapia production will have localized
negative effects on water quality, especially in the dry season.
Table III.2. Estimated mean annual nutrient flows to Lake Cocibolca, by source
Nutrient Flows Total
Nitrogen
Total Phosphorus
(tons/year) (tons/year)
Non-point sources (runoff and soil erosion from land use)1/
- Nicaragua 3,102–6,090 225–535
- Costa Rica 2,185–3,461 139–287
Municipal wastewater discharge
- Coastal towns 135–177 26–38
- Rest of the population2/ 175–329 22–66
Tilapia farming
- At the level of production in 2005 (350 tons/year) 20–40 1–12
- At the level of production in 2008 (1,388 tons/year)3/ 75–155 4–48
Livestock/dairy farming n.a. n.a.
Notes: 1/
It is assumed that 10–20 percent of soluble nitrogen in lateral flows and groundwater discharge into the
lake.
2/
It is assumed that the 10 percent of the nutrient load generated by rest of the population in the watershed
(approximately 600,000 people) reached the lake.
3/ OSPESCA 2005 (p. 57) documented plans that existed at that time to expand production capacity to
3,000 tons per year in the medium term.
Sources: Own estimates based on SWAT simulations. For estimates of nutrient load from tilapia farming, see
Annex B.
69. Putting all the sources together. Most of the sediment (but not the nutrients) reaching
the lake originates in the Costa Rican part of the watershed. The Costa Rican part occupies only
one-fifth of the entire watershed (excluding the area of the lake), and much of the area is
protected through formal protected areas and payment for environmental services (PES)
schemes. Nevertheless, this study estimates that due to very high slopes and precipitation, around
74 to 84 percent of the total sediment load originates there. To help inform the prioritization of
watershed protection actions, this study has produced a ranking of the sub-watersheds in terms of
the contribution of sediment, nitrogen and phosphorus from non-point sources into the lake. The
Niño, Zapote and Sapoá sub-watersheds in Costa Rica, followed by Tule in Nicaragua, are the
highest ranking in terms of sediment loads; the Ochomogo, Zapote, Tipitapa, Niño and El
Dorado in terms of phosphorus; and El Dorado, Tipitapa and Ochomogo in Nicaragua, followed
by Niño in Costa Rica, in terms of nitrogen (Figure 11). Wastewater flows from coastal towns,
tilapia cultivation in floating cages off the shores of Ometepe Island, and livestock are additional
sources of nutrients.
41
Figure III.3. Pollution from sediment and nutrients, coastal towns and tilapia farming
Note: The thickness of the streams represents the magnitude of the sediment load reaching the lake (thicker
lines denote higher sediment loads).
Source: Own estimates based on SWAT simulations (for runoff and soil erosion) and based on other estimates
(for the other sources).
70. Sediment and nutrient flows from Costa Rica. Less than 23 percent of the Lake’s
watershed is in Costa Rican territory, but this study has revealed that it is a source of a very large
share of sediment and nutrients that flow into the lake from agricultural lands (Table III.3). The
three Costa Rican cantons within the watershed of the lakes—Upala, La Cruz and Los Chiles—
are sparsely populated and relatively poor. They have a total population of about 61,000. Half of
the area is devoted to agriculture—mainly rice, oranges, pineapples, tiquizque (a native tuber
plant) and livestock—and about a third is under forests. No data are available for the remaining
area because of cloud cover (FONAFIFO 2005). Cultivation of rice, pineapples and tiquizque
tend to result in high erosion rates in this area with uneven terrain and high slopes. Despite
significant watershed protection efforts—around 22,000 hectares are under conservation—
erosion appears to be very high. According to the estimates from this study using the SWAT
model, 74-84 percent of the total sediment load and about 35-41 percent of the associated
nutrient loads originate in the Costa Rican part of the watershed (Table III.3). Application of
agrochemicals in areas of intensive agriculture, particularly in citrus plantations, is a further
source of contamination but the extent of this problem is not clear and requires further study and
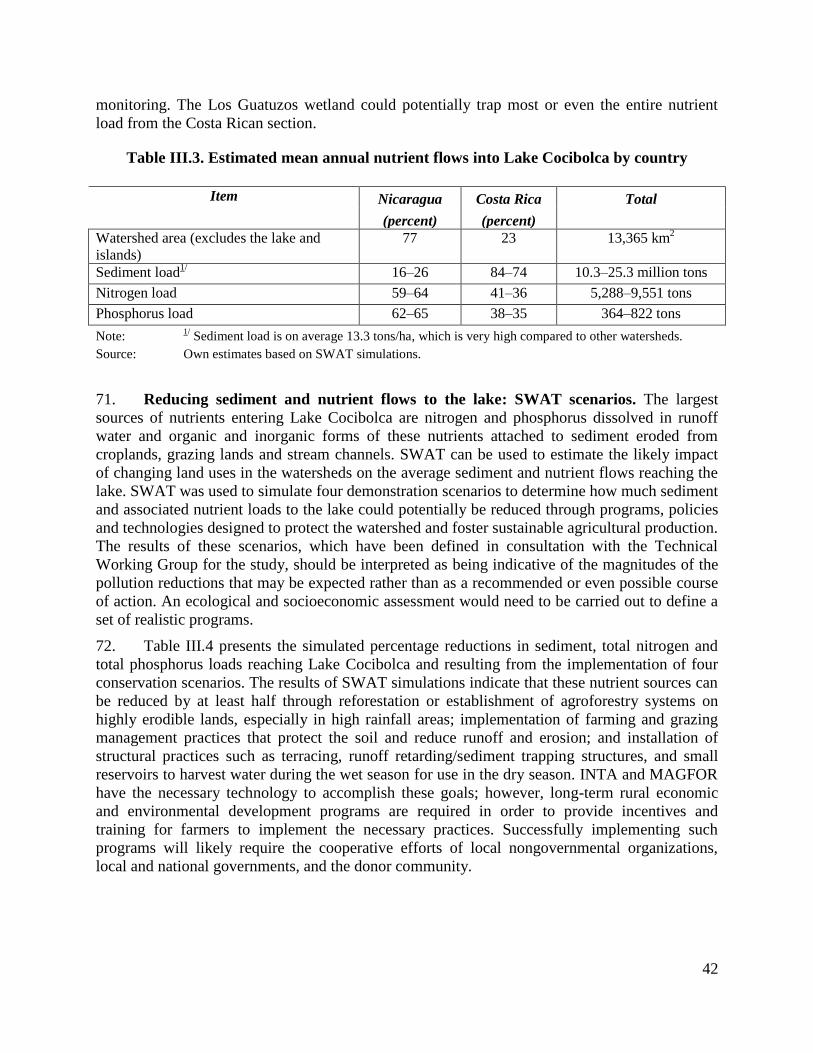
42
monitoring. The Los Guatuzos wetland could potentially trap most or even the entire nutrient
load from the Costa Rican section.
Table III.3. Estimated mean annual nutrient flows into Lake Cocibolca by country
Item
Nicaragua Costa Rica Total
(percent) (percent)
Watershed area (excludes the lake and
islands)
77 23 13,365 km2
Sediment load1/ 16–26 84–74 10.3–25.3 million tons
Nitrogen load 59–64 41–36 5,288–9,551 tons
Phosphorus load 62–65 38–35 364–822 tons
Note:
Source:
1/ Sediment load is on average 13.3 tons/ha, which is very high compared to other watersheds.
Own estimates based on SWAT simulations.
71. Reducing sediment and nutrient flows to the lake: SWAT scenarios. The largest
sources of nutrients entering Lake Cocibolca are nitrogen and phosphorus dissolved in runoff
water and organic and inorganic forms of these nutrients attached to sediment eroded from
croplands, grazing lands and stream channels. SWAT can be used to estimate the likely impact
of changing land uses in the watersheds on the average sediment and nutrient flows reaching the
lake. SWAT was used to simulate four demonstration scenarios to determine how much sediment
and associated nutrient loads to the lake could potentially be reduced through programs, policies
and technologies designed to protect the watershed and foster sustainable agricultural production.
The results of these scenarios, which have been defined in consultation with the Technical
Working Group for the study, should be interpreted as being indicative of the magnitudes of the
pollution reductions that may be expected rather than as a recommended or even possible course
of action. An ecological and socioeconomic assessment would need to be carried out to define a
set of realistic programs.
72. Table III.4 presents the simulated percentage reductions in sediment, total nitrogen and
total phosphorus loads reaching Lake Cocibolca and resulting from the implementation of four
conservation scenarios. The results of SWAT simulations indicate that these nutrient sources can
be reduced by at least half through reforestation or establishment of agroforestry systems on
highly erodible lands, especially in high rainfall areas; implementation of farming and grazing
management practices that protect the soil and reduce runoff and erosion; and installation of
structural practices such as terracing, runoff retarding/sediment trapping structures, and small
reservoirs to harvest water during the wet season for use in the dry season. INTA and MAGFOR
have the necessary technology to accomplish these goals; however, long-term rural economic
and environmental development programs are required in order to provide incentives and
training for farmers to implement the necessary practices. Successfully implementing such
programs will likely require the cooperative efforts of local nongovernmental organizations,
local and national governments, and the donor community.
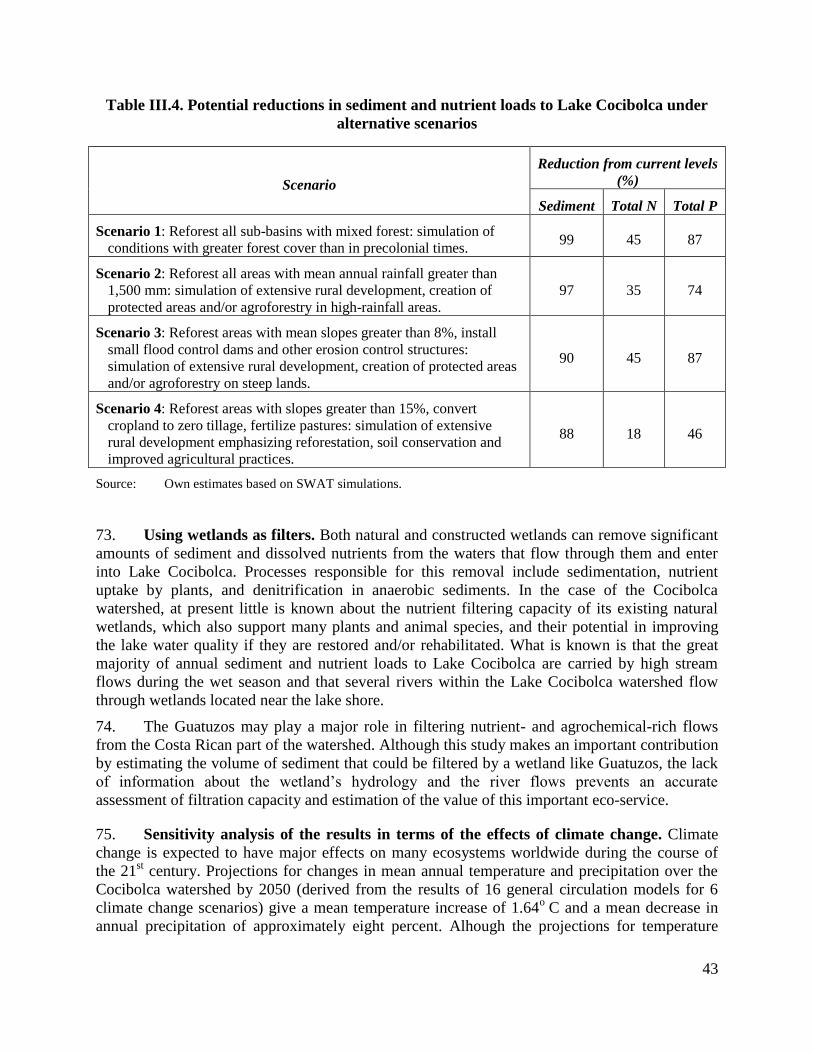
43
Table III.4. Potential reductions in sediment and nutrient loads to Lake Cocibolca under
alternative scenarios
Scenario
Reduction from current levels
(%)
Sediment Total N Total P
Scenario 1: Reforest all sub-basins with mixed forest: simulation of
conditions with greater forest cover than in precolonial times. 99 45 87
Scenario 2: Reforest all areas with mean annual rainfall greater than
1,500 mm: simulation of extensive rural development, creation of
protected areas and/or agroforestry in high-rainfall areas.
97 35 74
Scenario 3: Reforest areas with mean slopes greater than 8%, install
small flood control dams and other erosion control structures:
simulation of extensive rural development, creation of protected areas
and/or agroforestry on steep lands.
90 45 87
Scenario 4: Reforest areas with slopes greater than 15%, convert
cropland to zero tillage, fertilize pastures: simulation of extensive
rural development emphasizing reforestation, soil conservation and
improved agricultural practices.
88 18 46
Source: Own estimates based on SWAT simulations.
73. Using wetlands as filters. Both natural and constructed wetlands can remove significant
amounts of sediment and dissolved nutrients from the waters that flow through them and enter
into Lake Cocibolca. Processes responsible for this removal include sedimentation, nutrient
uptake by plants, and denitrification in anaerobic sediments. In the case of the Cocibolca
watershed, at present little is known about the nutrient filtering capacity of its existing natural
wetlands, which also support many plants and animal species, and their potential in improving
the lake water quality if they are restored and/or rehabilitated. What is known is that the great
majority of annual sediment and nutrient loads to Lake Cocibolca are carried by high stream
flows during the wet season and that several rivers within the Lake Cocibolca watershed flow
through wetlands located near the lake shore.
74. The Guatuzos may play a major role in filtering nutrient- and agrochemical-rich flows
from the Costa Rican part of the watershed. Although this study makes an important contribution
by estimating the volume of sediment that could be filtered by a wetland like Guatuzos, the lack
of information about the wetland’s hydrology and the river flows prevents an accurate
assessment of filtration capacity and estimation of the value of this important eco-service.
75. Sensitivity analysis of the results in terms of the effects of climate change. Climate
change is expected to have major effects on many ecosystems worldwide during the course of
the 21st century. Projections for changes in mean annual temperature and precipitation over the
Cocibolca watershed by 2050 (derived from the results of 16 general circulation models for 6
climate change scenarios) give a mean temperature increase of 1.64o
C and a mean decrease in
annual precipitation of approximately eight percent. Alhough the projections for temperature
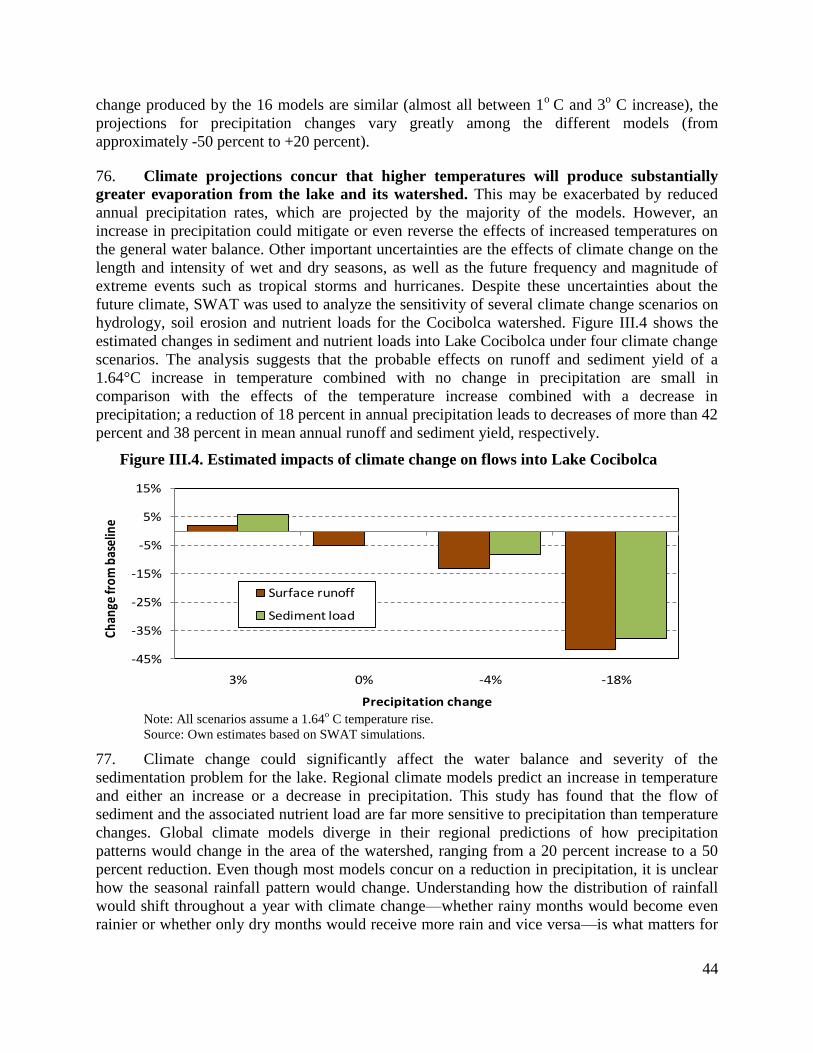
44
change produced by the 16 models are similar (almost all between 1o
C and 3o C increase), the
projections for precipitation changes vary greatly among the different models (from
approximately -50 percent to +20 percent).
76. Climate projections concur that higher temperatures will produce substantially
greater evaporation from the lake and its watershed. This may be exacerbated by reduced
annual precipitation rates, which are projected by the majority of the models. However, an
increase in precipitation could mitigate or even reverse the effects of increased temperatures on
the general water balance. Other important uncertainties are the effects of climate change on the
length and intensity of wet and dry seasons, as well as the future frequency and magnitude of
extreme events such as tropical storms and hurricanes. Despite these uncertainties about the
future climate, SWAT was used to analyze the sensitivity of several climate change scenarios on
hydrology, soil erosion and nutrient loads for the Cocibolca watershed. Figure III.4 shows the
estimated changes in sediment and nutrient loads into Lake Cocibolca under four climate change
scenarios. The analysis suggests that the probable effects on runoff and sediment yield of a
1.64°C increase in temperature combined with no change in precipitation are small in
comparison with the effects of the temperature increase combined with a decrease in
precipitation; a reduction of 18 percent in annual precipitation leads to decreases of more than 42
percent and 38 percent in mean annual runoff and sediment yield, respectively.
Figure III.4. Estimated impacts of climate change on flows into Lake Cocibolca
Note: All scenarios assume a 1.64
o C temperature rise.
Source: Own estimates based on SWAT simulations.
77. Climate change could significantly affect the water balance and severity of the
sedimentation problem for the lake. Regional climate models predict an increase in temperature
and either an increase or a decrease in precipitation. This study has found that the flow of
sediment and the associated nutrient load are far more sensitive to precipitation than temperature
changes. Global climate models diverge in their regional predictions of how precipitation
patterns would change in the area of the watershed, ranging from a 20 percent increase to a 50
percent reduction. Even though most models concur on a reduction in precipitation, it is unclear
how the seasonal rainfall pattern would change. Understanding how the distribution of rainfall
would shift throughout a year with climate change—whether rainy months would become even
rainier or whether only dry months would receive more rain and vice versa—is what matters for
-45%
-35%
-25%
-15%
-5%
5%
15%
3% 0% -4% -18%
Chan
ge fr
om b
asel
ine
Precipitation change
Surface runoff
Sediment load
45
understanding what would happen to the water balance and contamination impacts. Extreme
weather events, which are likely to increase in their frequency and severity, may further
compound the sedimentation problem of the watershed’s fragile soils and increase the risk of
landslides in degraded areas.
78. In the absence of scientific certainty, the precautionary principle would suggest that the
possibly adverse future impacts of climate change on the watershed’s sustainability increase the
urgency to identify win-win solutions and understand and implement wetland protection
measures. In view of the great differences among climate change models with regard to predicted
future precipitation, it would be difficult for decision makers to implement programs based on
specific future precipitation scenarios. A wiser decision might be to implement programs that
will enhance resilience and adaptive capacity, and mitigate the effects of both probable climate
change and existing weather variability, such as droughts, tropical storms and hurricanes. Such
programs could promote soil and water conservation on agricultural lands and reforestation of
steep lands and stream corridors to minimize erosion and stream bank degradation.
46
IV. Setting research priorities
79. This study has built upon the results of previous efforts, including the TWINLATIN and
Procuenca San Juan projects, has trained a multi-institutional team of experts, and has
implemented the SWAT model for the current baseline and several future land use, soil
conservation and climate change scenarios. As a result, future analysis of other scenarios, more
detailed studies of specific sub-basins, and improvements in natural resource data can be
implemented quickly and cost-effectively. This section describes the research priorities that have
emerged from the modeling efforts and dialogue with local and international experts in the
course of this study.
80. Limitations of this study. It is important to point out several shortcomings of the
analysis so that they can be addressed in future analytical efforts. In spite of these limitations, the
study has contributed to a better understanding of the watershed’s environmental pressures and
of the key gaps in the monitoring data that would permit much more robust modeling and a
better understanding of the watershed’s environmental pressures in the future (Table IV.1).
Limited hydrometeorological and stream water quality monitoring data do not allow
for adequate model input and for calibration and validation of model results. For this
reason, expert judgment was used with limited stream water quality data to evaluate
and improve model performance.
The available representation (GIS layers) of land use/land cover for the Lake
Cocibolca watershed could not be verified with ground truthing data during the
limited time available for the study. In addition, the different land use classification
schemes used in Nicaragua and Costa Rica made data integration and interpretation
difficult.
The soil characterization data available for the modeling exercise were very limited,
causing substantial uncertainty in the amounts of phosphorus (and to a lesser extent,
nitrogen) in eroded sediments. This is of concern because many of the soils,
especially in steep landscapes, are highly erodible and of volcanic origin, and
volcanic soils are quite variable in phosphorus content.
No data were available on pesticide use, and time was insufficient to conduct
adequate assessments of pesticide losses from rice and other intensive agricultural
systems.
Lack of detailed information concerning stream interactions with wetlands prevented
any attempt to simulate the effects of natural or constructed wetlands on nutrient
loads to the lake. A preliminary assessment of the ability of wetlands to reduce
sediment and nutrient loads would be feasible if data were available that describe the
size, depth and hydrological connectivity of these wetland sites.
Attempts to predict the impacts of climate change on hydrology and water quality in
the watershed were limited by uncertainties about the effects of global climate change
on regional precipitation patterns and intensities. However, the results show how
SWAT can be used to estimate the likely interactions of land use and soil and water
conservation practices for different climate change scenarios, thereby helping
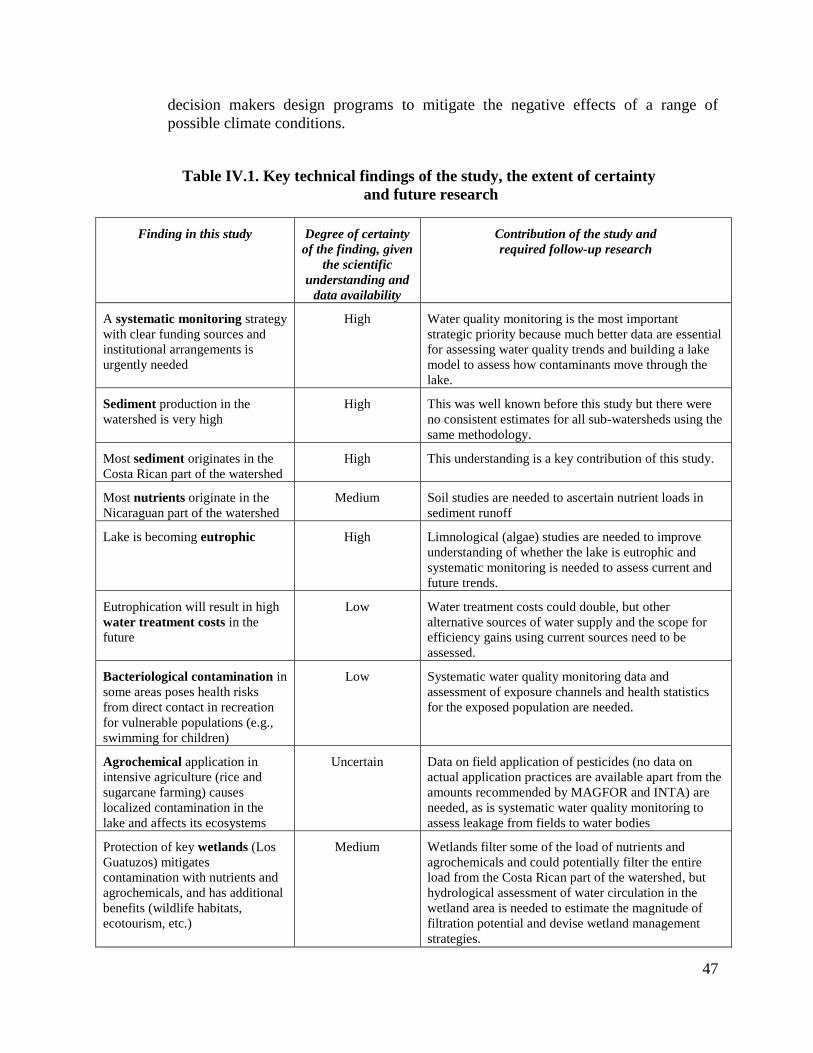
47
decision makers design programs to mitigate the negative effects of a range of
possible climate conditions.
Table IV.1. Key technical findings of the study, the extent of certainty
and future research
Finding in this study Degree of certainty
of the finding, given
the scientific
understanding and
data availability
Contribution of the study and
required follow-up research
A systematic monitoring strategy
with clear funding sources and
institutional arrangements is
urgently needed
High Water quality monitoring is the most important
strategic priority because much better data are essential
for assessing water quality trends and building a lake
model to assess how contaminants move through the
lake.
Sediment production in the
watershed is very high
High This was well known before this study but there were
no consistent estimates for all sub-watersheds using the
same methodology.
Most sediment originates in the
Costa Rican part of the watershed
High This understanding is a key contribution of this study.
Most nutrients originate in the
Nicaraguan part of the watershed
Medium Soil studies are needed to ascertain nutrient loads in
sediment runoff
Lake is becoming eutrophic High Limnological (algae) studies are needed to improve
understanding of whether the lake is eutrophic and
systematic monitoring is needed to assess current and
future trends.
Eutrophication will result in high
water treatment costs in the
future
Low Water treatment costs could double, but other
alternative sources of water supply and the scope for
efficiency gains using current sources need to be
assessed.
Bacteriological contamination in
some areas poses health risks
from direct contact in recreation
for vulnerable populations (e.g.,
swimming for children)
Low Systematic water quality monitoring data and
assessment of exposure channels and health statistics
for the exposed population are needed.
Agrochemical application in
intensive agriculture (rice and
sugarcane farming) causes
localized contamination in the
lake and affects its ecosystems
Uncertain Data on field application of pesticides (no data on
actual application practices are available apart from the
amounts recommended by MAGFOR and INTA) are
needed, as is systematic water quality monitoring to
assess leakage from fields to water bodies
Protection of key wetlands (Los
Guatuzos) mitigates
contamination with nutrients and
agrochemicals, and has additional
benefits (wildlife habitats,
ecotourism, etc.)
Medium Wetlands filter some of the load of nutrients and
agrochemicals and could potentially filter the entire
load from the Costa Rican part of the watershed, but
hydrological assessment of water circulation in the
wetland area is needed to estimate the magnitude of
filtration potential and devise wetland management
strategies.
48
81. Despite these limitations, the general conclusions of this analysis are thought to be
reliable. In addition, nearly all these limitations can be addressed in more detailed studies by the
team of Nicaraguan SWAT specialists trained during the study, assisted as necessary by
consultants with experience using SWAT in other parts of the world.
Monitoring needs. Several previous studies have emphasized the need for an
adequate hydrometeorological monitoring network and consistent long-term lake and
stream water quality monitoring. In addition, this study emphasizes the importance of
accurate information about soils, land use and agricultural practices. Adequate input
data sets on these basic environmental parameters, including time series data on past
changes in land use and agricultural practices, are essential for realistic simulation of
the different processes influencing hydrology and water quality. However, when such
data are available and the SWAT model has been calibrated and validated, the user
will be able to confidently predict the environmental effects of possible future
technologies and policies.
Future research involving systematic monitoring of water quality, studies focusing on
blue-green algae growth and the associated toxicity levels, bathymetric studies, and
modeling of water (and contaminant) movement throughout the lake are needed for
definitive conclusions about the severity of current and future eutrophication levels.
Modeling needs. In addition, any long-term effort to understand and manage Lake
Cocibolca requires the implementation of a lake model with the capability of
simulating spatial and temporal dynamics in water quantity and quality, including
mixing, nutrient cycling, chlorophyll concentrations, and (eventually) microbial and
fish population dynamics. Data from stream and lake monitoring programs and
watershed models such as SWAT will be needed to provide inputs required by the
lake model, which can be used to simulate both past and possible future changes in
lake water balance, hydrodynamics and water quality.
Institutional responsibilities. Only with an integrated program of monitoring,
watershed and lake modeling and data management will we be able to achieve a
better understanding of the actual status of lake water quality and confidently predict
the impacts, both positive and negative, of future socioeconomic, technological and
climate changes. However, few institutions have the responsibilities and capabilities
to implement such an integrated program. Working together, the institutions that
participated in this study have such capacity. CIRA-UNAN has a long history of
water quality monitoring and related limnologic research, and it has recently begun
calibration of the PC-Lake lake water quality model for Lake Cocibolca. CIEMA was
the host of the TWINLATIN project that collected and systematized much of the data
used in this project. INTA and MAGFOR have an excellent understanding of
agricultural and soil conservation practices. INETER has responsibility for the
generation and administration of much of the natural resource data needed for both
research and policy development. MARENA is responsible for implementation of
environmental policies, and MINSA and ENACAL are keys to promoting public
health. A team of specialists from these organizations, working together with their
counterparts in Costa Rica and supported by donor agencies, can provide decision
49
makers with the information needed to wisely manage Lake Cocibolca and its
watershed.
Certainty about the extent of the impacts estimated in this study and the associated
economic costs varies depending on scientific certainty and the available data. The
results of the modeling effort have helped advance scientific understanding and
establish some priorities, but precise estimates need to be interpreted with significant
caution because the model has not been calibrated. The model’s outputs have been
compared to the scarce available monitoring data whenever possible and the
international and local experts involved in the study concur with the results, but the
limited data availability has prevented calibration of the model and estimates of
pollution loads need to be taken as indicative measures of magnitude rather than as
precise estimates. Furthermore, the degree of certainty with respect to the technical
findings from this study varies depending on the extent of the scientific understanding
and data availability to assess the severity of the environmental problems and their
likely social, environmental and economic impacts. Table 8 summarizes the areas of
greater and lesser certainty.
82. Filling the critical knowledge gaps. Any long-term effort to understand and manage
Lake Cocibolca requires the implementation of a lake model with the capability of simulating
spatial and temporal dynamics in water quantity and quality, including mixing, nutrient cycling,
chlorophyll concentrations, and (eventually) microbial and fish population dynamics. Data from
stream and lake monitoring programs and from watershed models such as SWAT will be needed
to provide inputs required by the lake model, which can be used to simulate both past and
possible future changes in lake water balance, hydrodynamics and water quality. Only with an
integrated program of monitoring, watershed and lake modeling and data management will it be
possible to achieve a better understanding of the actual status of lake water quality and
confidently predict the impacts, both positive and negative, of future socioeconomic,
technological and climate changes. Implementation of a long-term monitoring plan, which
includes both Nicaragua and Costa Rica, and which involves both the lake and its watershed,
would need to begin now in order to generate the baseline data for future assessments of the
watershed’s health. As a follow-up to this study, efforts have begun to prepare an atlas of the
Lake Cocibolca watershed and the environmental database, collected through the TWINLATIN
project and this study, in a format that would be easily accessible by Nicaraguan experts and
decision makers.
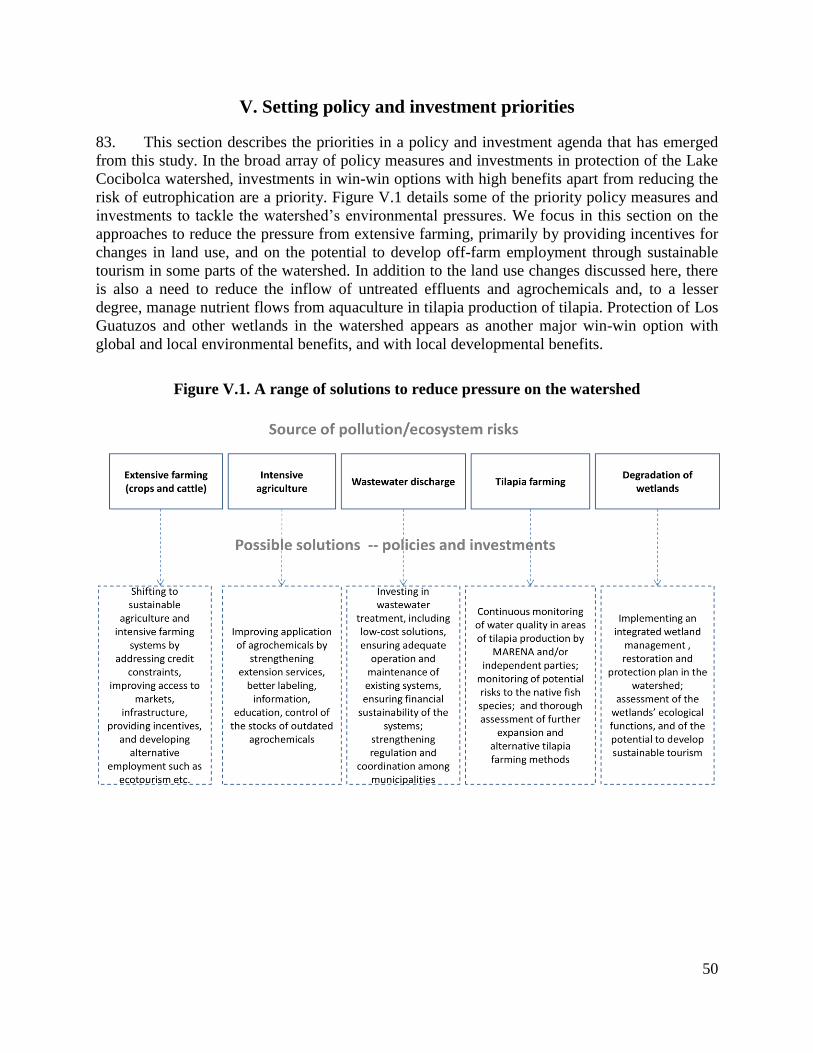
50
V. Setting policy and investment priorities
83. This section describes the priorities in a policy and investment agenda that has emerged
from this study. In the broad array of policy measures and investments in protection of the Lake
Cocibolca watershed, investments in win-win options with high benefits apart from reducing the
risk of eutrophication are a priority. Figure V.1 details some of the priority policy measures and
investments to tackle the watershed’s environmental pressures. We focus in this section on the
approaches to reduce the pressure from extensive farming, primarily by providing incentives for
changes in land use, and on the potential to develop off-farm employment through sustainable
tourism in some parts of the watershed. In addition to the land use changes discussed here, there
is also a need to reduce the inflow of untreated effluents and agrochemicals and, to a lesser
degree, manage nutrient flows from aquaculture in tilapia production of tilapia. Protection of Los
Guatuzos and other wetlands in the watershed appears as another major win-win option with
global and local environmental benefits, and with local developmental benefits.
Figure V.1. A range of solutions to reduce pressure on the watershed
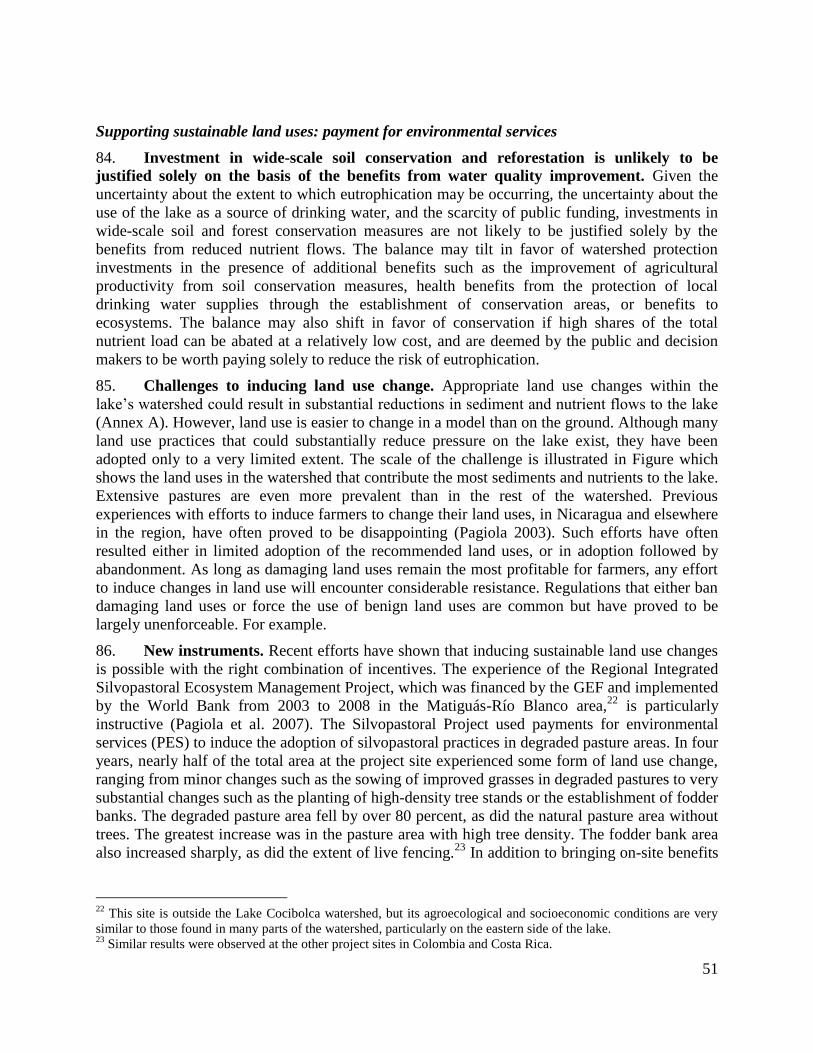
51
Supporting sustainable land uses: payment for environmental services
84. Investment in wide-scale soil conservation and reforestation is unlikely to be
justified solely on the basis of the benefits from water quality improvement. Given the
uncertainty about the extent to which eutrophication may be occurring, the uncertainty about the
use of the lake as a source of drinking water, and the scarcity of public funding, investments in
wide-scale soil and forest conservation measures are not likely to be justified solely by the
benefits from reduced nutrient flows. The balance may tilt in favor of watershed protection
investments in the presence of additional benefits such as the improvement of agricultural
productivity from soil conservation measures, health benefits from the protection of local
drinking water supplies through the establishment of conservation areas, or benefits to
ecosystems. The balance may also shift in favor of conservation if high shares of the total
nutrient load can be abated at a relatively low cost, and are deemed by the public and decision
makers to be worth paying solely to reduce the risk of eutrophication.
85. Challenges to inducing land use change. Appropriate land use changes within the
lake’s watershed could result in substantial reductions in sediment and nutrient flows to the lake
(Annex A). However, land use is easier to change in a model than on the ground. Although many
land use practices that could substantially reduce pressure on the lake exist, they have been
adopted only to a very limited extent. The scale of the challenge is illustrated in Figure which
shows the land uses in the watershed that contribute the most sediments and nutrients to the lake.
Extensive pastures are even more prevalent than in the rest of the watershed. Previous
experiences with efforts to induce farmers to change their land uses, in Nicaragua and elsewhere
in the region, have often proved to be disappointing (Pagiola 2003). Such efforts have often
resulted either in limited adoption of the recommended land uses, or in adoption followed by
abandonment. As long as damaging land uses remain the most profitable for farmers, any effort
to induce changes in land use will encounter considerable resistance. Regulations that either ban
damaging land uses or force the use of benign land uses are common but have proved to be
largely unenforceable. For example.
86. New instruments. Recent efforts have shown that inducing sustainable land use changes
is possible with the right combination of incentives. The experience of the Regional Integrated
Silvopastoral Ecosystem Management Project, which was financed by the GEF and implemented
by the World Bank from 2003 to 2008 in the Matiguás-Río Blanco area,22
is particularly
instructive (Pagiola et al. 2007). The Silvopastoral Project used payments for environmental
services (PES) to induce the adoption of silvopastoral practices in degraded pasture areas. In four
years, nearly half of the total area at the project site experienced some form of land use change,
ranging from minor changes such as the sowing of improved grasses in degraded pastures to very
substantial changes such as the planting of high-density tree stands or the establishment of fodder
banks. The degraded pasture area fell by over 80 percent, as did the natural pasture area without
trees. The greatest increase was in the pasture area with high tree density. The fodder bank area
also increased sharply, as did the extent of live fencing.23
In addition to bringing on-site benefits
22
This site is outside the Lake Cocibolca watershed, but its agroecological and socioeconomic conditions are very
similar to those found in many parts of the watershed, particularly on the eastern side of the lake. 23
Similar results were observed at the other project sites in Colombia and Costa Rica.
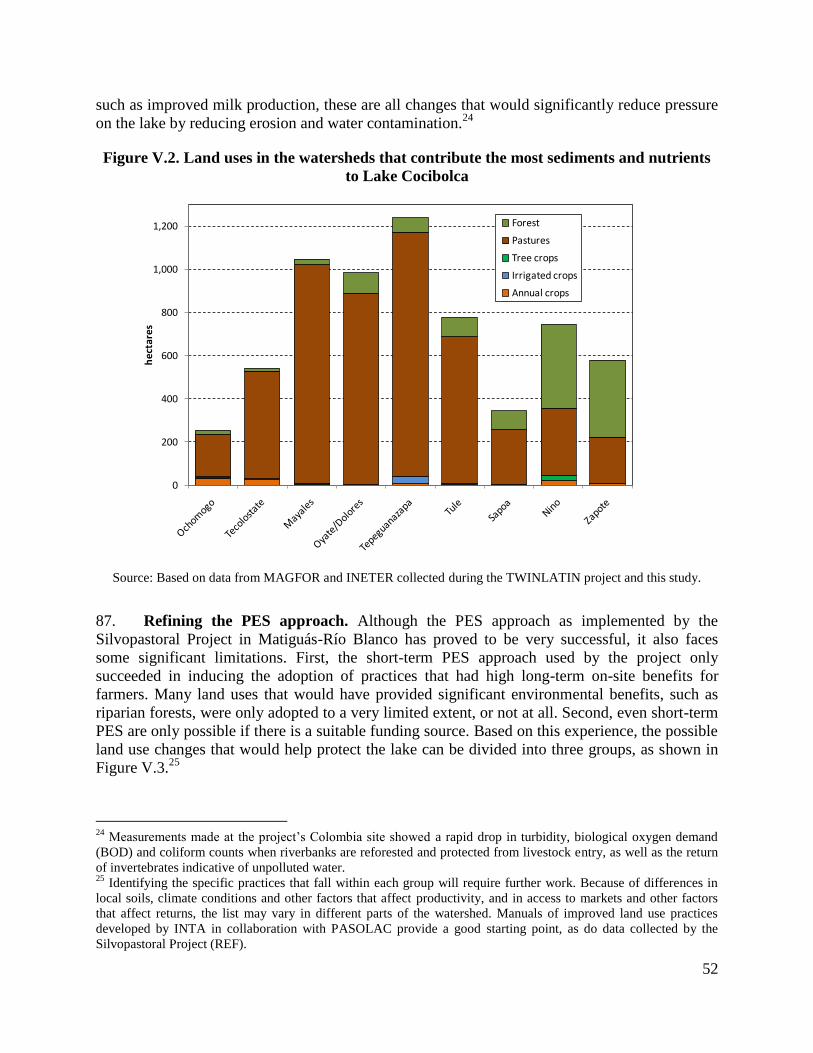
52
such as improved milk production, these are all changes that would significantly reduce pressure
on the lake by reducing erosion and water contamination.24
Figure V.2. Land uses in the watersheds that contribute the most sediments and nutrients
to Lake Cocibolca
Source: Based on data from MAGFOR and INETER collected during the TWINLATIN project and this study.
87. Refining the PES approach. Although the PES approach as implemented by the
Silvopastoral Project in Matiguás-Río Blanco has proved to be very successful, it also faces
some significant limitations. First, the short-term PES approach used by the project only
succeeded in inducing the adoption of practices that had high long-term on-site benefits for
farmers. Many land uses that would have provided significant environmental benefits, such as
riparian forests, were only adopted to a very limited extent, or not at all. Second, even short-term
PES are only possible if there is a suitable funding source. Based on this experience, the possible
land use changes that would help protect the lake can be divided into three groups, as shown in
Figure V.3.25
24
Measurements made at the project’s Colombia site showed a rapid drop in turbidity, biological oxygen demand
(BOD) and coliform counts when riverbanks are reforested and protected from livestock entry, as well as the return
of invertebrates indicative of unpolluted water. 25
Identifying the specific practices that fall within each group will require further work. Because of differences in
local soils, climate conditions and other factors that affect productivity, and in access to markets and other factors
that affect returns, the list may vary in different parts of the watershed. Manuals of improved land use practices
developed by INTA in collaboration with PASOLAC provide a good starting point, as do data collected by the
Silvopastoral Project (REF).
0
200
400
600
800
1,000
1,200
he
ctar
es
Forest
Pastures
Tree crops
Irrigated crops
Annual crops
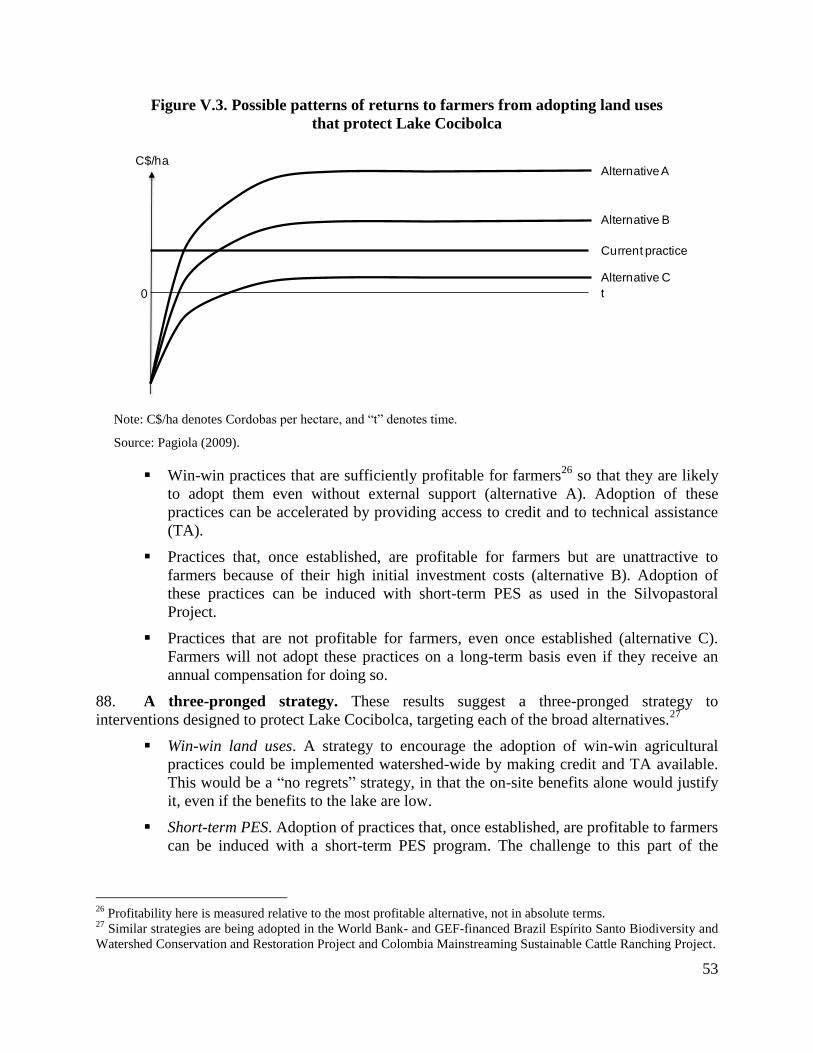
53
Figure V.3. Possible patterns of returns to farmers from adopting land uses
that protect Lake Cocibolca
Note: C$/ha denotes Cordobas per hectare, and “t” denotes time.
Source: Pagiola (2009).
Win-win practices that are sufficiently profitable for farmers26
so that they are likely
to adopt them even without external support (alternative A). Adoption of these
practices can be accelerated by providing access to credit and to technical assistance
(TA).
Practices that, once established, are profitable for farmers but are unattractive to
farmers because of their high initial investment costs (alternative B). Adoption of
these practices can be induced with short-term PES as used in the Silvopastoral
Project.
Practices that are not profitable for farmers, even once established (alternative C).
Farmers will not adopt these practices on a long-term basis even if they receive an
annual compensation for doing so.
88. A three-pronged strategy. These results suggest a three-pronged strategy to
interventions designed to protect Lake Cocibolca, targeting each of the broad alternatives.27
Win-win land uses. A strategy to encourage the adoption of win-win agricultural
practices could be implemented watershed-wide by making credit and TA available.
This would be a “no regrets” strategy, in that the on-site benefits alone would justify
it, even if the benefits to the lake are low.
Short-term PES. Adoption of practices that, once established, are profitable to farmers
can be induced with a short-term PES program. The challenge to this part of the
26
Profitability here is measured relative to the most profitable alternative, not in absolute terms. 27
Similar strategies are being adopted in the World Bank- and GEF-financed Brazil Espírito Santo Biodiversity and
Watershed Conservation and Restoration Project and Colombia Mainstreaming Sustainable Cattle Ranching Project.
C$/ha
0
Current practice
Alternative A
Alternative B
Alternative C
t
54
strategy is to secure financing to make the necessary short-term payments.28
Because
many of the same practices also generate substantial biodiversity and carbon
sequestration benefits, it may be possible to secure at least partial financing from GEF
or from sales of carbon credits. Because the payments required are only short term,
such a program could also be financed with donor support. The program should be
targeted to the watersheds that have been identified as being particularly significant
sources of sediments and nutrients discharged into the lake.
Long-term PES. Land uses that, because of their nature or location, are particularly
valuable for protecting the lake, such as riparian forests,29
but that provide low returns
to farmers require a long-term PES program. Financing such a program is particularly
challenging because the required payments to farmers would have to last indefinitely.
Therefore, this program could not rely on funding from donors, because such funding
is always of limited duration. The obvious source of financing would be those who
stand to benefit from these protective actions, namely the users of Lake Cocibolca.
Because these users would receive a stream of benefits, in the form of lower water
treatment costs, from a lake in good condition, they could provide a stream of
financing. However, because the most important uses are potential future ones, it will
be difficult to secure funding in the short and medium terms.
89. Local PES mechanisms. In the meantime, however, many individual water users within
the Lake Cocibolca watershed currently obtain their water supplies from surface and ground
water sources that later flow into the lake. These water users could finance long-term PES
mechanisms aimed at conserving their individual water supply areas.
90. Box 4 gives an example of such water users and of what would be involved. This would
bring them direct benefits by preserving or improving their water supplies, and also contribute to
protecting the lake by reducing at least some of the sources of contamination. Nicaragua already
has considerable experience in developing such local PES mechanisms, with active mechanisms
in San Pedro del Norte (Chinandega), Regadío, San Luis de los Andes (Estelí), and Quilalí
(Nueva Segovia) (Marín et al. 2006; Obando 2007). To assess the potential for such mechanisms
in the Lake Cocibolca watershed, a partial inventory was conducted in three of the sub-
watersheds that flow into the lake: Ochomogo, Malacatoya and Mayales.
91. Table 7 shows the principal water users that have been identified in these watersheds. Of
these, one town (Juigalpa) and two irrigation systems in the Mayales watershed obtain their
water from the lake. All the other users are potential candidates for local PES mechanisms that
would protect their water sources. Such local interventions would not by themselves solve the
problem, but they would contribute to doing so, together with the other prongs of the strategy.
28
The experience of the Silvopastoral Project suggests that payments of US$30 to US$80/ha for two to four years
may be needed. 29
In principle, land users are required by law to maintain forest cover within 50 m on either side of a river or stream.
However, this law has proved to be unenforceable. Moreover, if the law were enforced it could cause significant
hardship to small farmers who might lose the use of large portions of their land. It is worth noting that many PES
programs, such as those in Costa Rica and Mexico, are paying land users to maintain forest cover even though
deforestation is illegal.
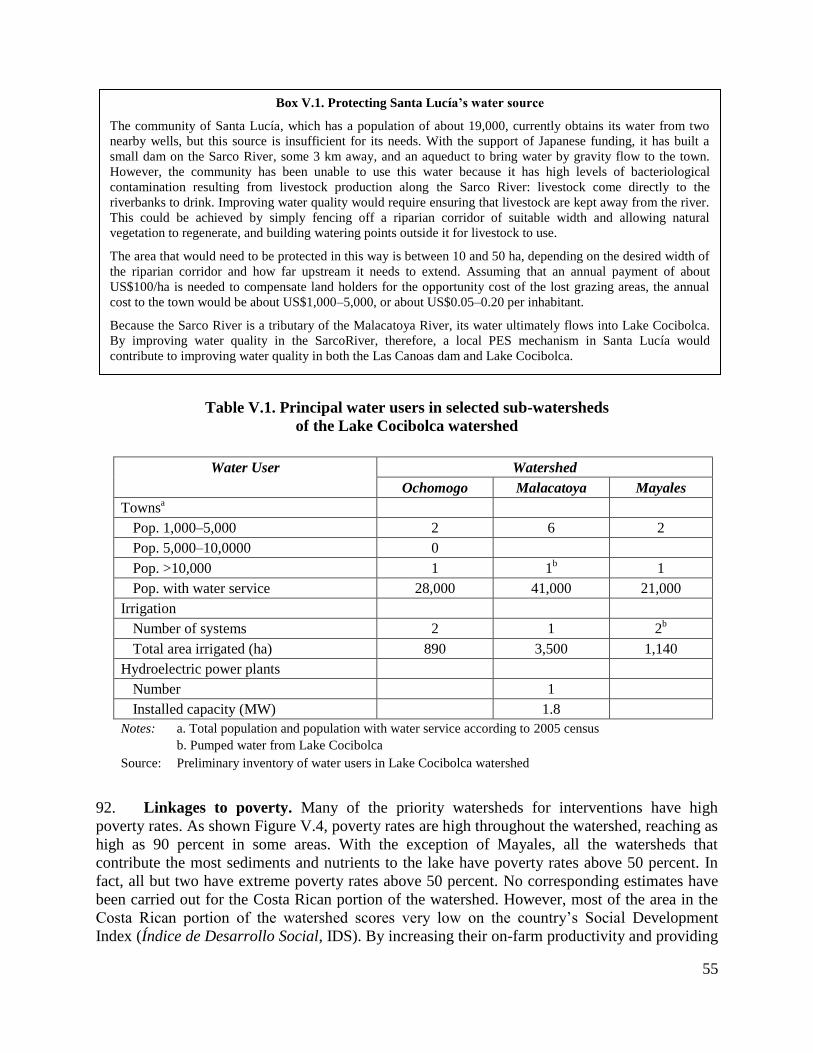
55
Table V.1. Principal water users in selected sub-watersheds
of the Lake Cocibolca watershed
Water User Watershed
Ochomogo Malacatoya Mayales
Townsa
Pop. 1,000–5,000 2 6 2
Pop. 5,000–10,0000 0
Pop. >10,000 1 1b
1
Pop. with water service 28,000 41,000 21,000
Irrigation
Number of systems 2 1 2b
Total area irrigated (ha) 890 3,500 1,140
Hydroelectric power plants
Number 1
Installed capacity (MW) 1.8
Notes: a. Total population and population with water service according to 2005 census
b. Pumped water from Lake Cocibolca
Source: Preliminary inventory of water users in Lake Cocibolca watershed
92. Linkages to poverty. Many of the priority watersheds for interventions have high
poverty rates. As shown Figure V.4, poverty rates are high throughout the watershed, reaching as
high as 90 percent in some areas. With the exception of Mayales, all the watersheds that
contribute the most sediments and nutrients to the lake have poverty rates above 50 percent. In
fact, all but two have extreme poverty rates above 50 percent. No corresponding estimates have
been carried out for the Costa Rican portion of the watershed. However, most of the area in the
Costa Rican portion of the watershed scores very low on the country’s Social Development
Index (Índice de Desarrollo Social, IDS). By increasing their on-farm productivity and providing
Box V.1. Protecting Santa Lucía’s water source
The community of Santa Lucía, which has a population of about 19,000, currently obtains its water from two
nearby wells, but this source is insufficient for its needs. With the support of Japanese funding, it has built a
small dam on the Sarco River, some 3 km away, and an aqueduct to bring water by gravity flow to the town.
However, the community has been unable to use this water because it has high levels of bacteriological
contamination resulting from livestock production along the Sarco River: livestock come directly to the
riverbanks to drink. Improving water quality would require ensuring that livestock are kept away from the river.
This could be achieved by simply fencing off a riparian corridor of suitable width and allowing natural
vegetation to regenerate, and building watering points outside it for livestock to use.
The area that would need to be protected in this way is between 10 and 50 ha, depending on the desired width of
the riparian corridor and how far upstream it needs to extend. Assuming that an annual payment of about
US$100/ha is needed to compensate land holders for the opportunity cost of the lost grazing areas, the annual
cost to the town would be about US$1,000–5,000, or about US$0.05–0.20 per inhabitant.
Because the Sarco River is a tributary of the Malacatoya River, its water ultimately flows into Lake Cocibolca.
By improving water quality in the SarcoRiver, therefore, a local PES mechanism in Santa Lucía would
contribute to improving water quality in both the Las Canoas dam and Lake Cocibolca.
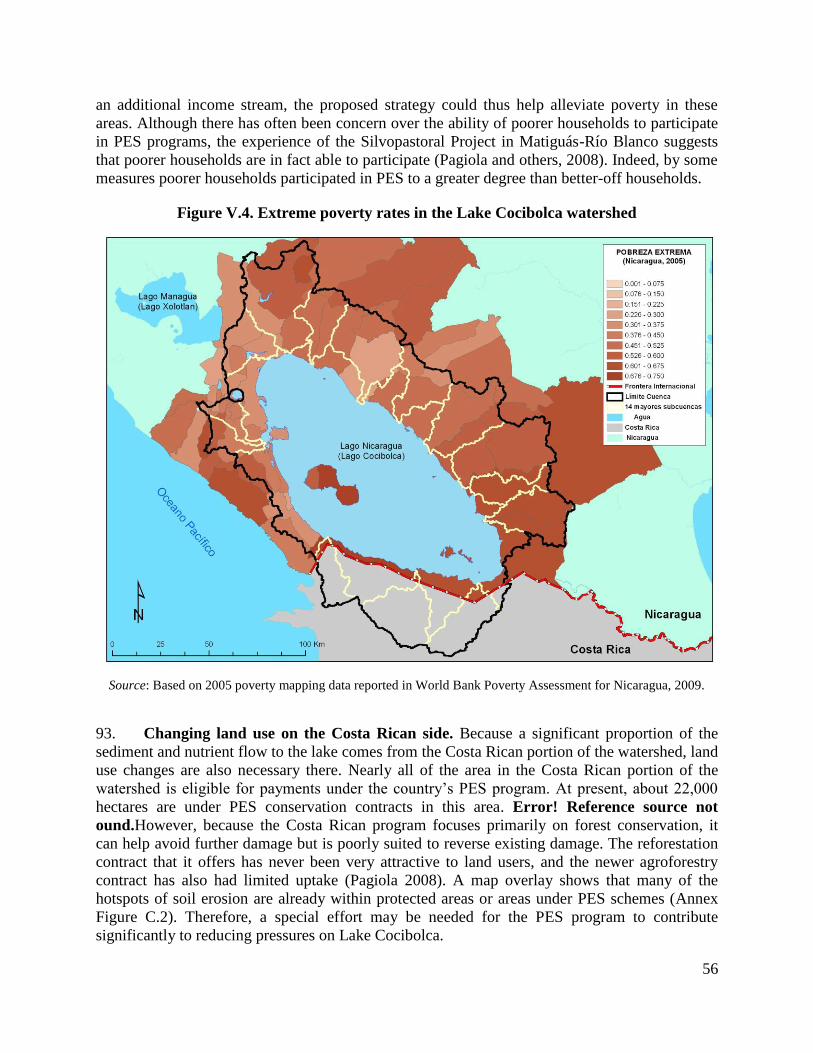
56
an additional income stream, the proposed strategy could thus help alleviate poverty in these
areas. Although there has often been concern over the ability of poorer households to participate
in PES programs, the experience of the Silvopastoral Project in Matiguás-Río Blanco suggests
that poorer households are in fact able to participate (Pagiola and others, 2008). Indeed, by some
measures poorer households participated in PES to a greater degree than better-off households.
Figure V.4. Extreme poverty rates in the Lake Cocibolca watershed
Source: Based on 2005 poverty mapping data reported in World Bank Poverty Assessment for Nicaragua, 2009.
93. Changing land use on the Costa Rican side. Because a significant proportion of the
sediment and nutrient flow to the lake comes from the Costa Rican portion of the watershed, land
use changes are also necessary there. Nearly all of the area in the Costa Rican portion of the
watershed is eligible for payments under the country’s PES program. At present, about 22,000
hectares are under PES conservation contracts in this area. Error! Reference source not
ound.However, because the Costa Rican program focuses primarily on forest conservation, it
can help avoid further damage but is poorly suited to reverse existing damage. The reforestation
contract that it offers has never been very attractive to land users, and the newer agroforestry
contract has also had limited uptake (Pagiola 2008). A map overlay shows that many of the
hotspots of soil erosion are already within protected areas or areas under PES schemes (Annex
Figure C.2). Therefore, a special effort may be needed for the PES program to contribute
significantly to reducing pressures on Lake Cocibolca.

57
Supporting off-farm employment: realizing the watershed’s potential for sustainable tourism
94. The provision of direct economic incentives through PES programs and investments that
help intensify agricultural production in the watershed are two ways to help reduce the pressure
from extensive crop and cattle farming. Another way to help achieve more sustainable use of
natural resources is by supporting the growth of environmentally sustainable off-farm activities.
The Lake Cocibolca watershed is part of the corridor that passes from Lake Managua south to
the San Juan River, which was recognized as the best opportunity in the country for ecotourism
development (Aviles 2000). The Ministry of Tourism (INTUR) has acknowledged ecotourism
projects in the Lake Cocibolca watershed, including Ometepe Island, the Solentiname Islands,
and the San Juan River, as one of the best opportunities to develop ecotourism (Barany et al.
2001). Increasing off-farm rural employment through the development of ecotourism, cultural
tourism and other forms of sustainable tourism can help protect the natural resource base by
reducing the pressure on soils, forests, biodiversity and water resources.
95. The tourism sector has grown rapidly in Latin American countries over the last decade
and has become an important source of foreign exchange and an impetus for overall economic
growth. Tourist arrivals rose by about 68 percent worldwide over the 1995–2007 period and by
about 50 percent in Latin American countries (Fayissa et al. 2009). In Nicaragua, tourist arrivals
more than doubled from 1995 to 2007, and nearly tripled in Costa Rica. In 2008, tourist arrivals
reached 858,000 in Nicaragua and 2.3 million in Costa Rica. The tourism sector makes an
increasingly large contribution to the overall economy and foreign exchange earnings.
Nicaragua’s receipts from the tourism sector grew nearly fourfold in absolute terms from 1995 to
2008, rising from 3.2 to 5.6 percent of GDP. The 2008 tourism receipts in Nicaragua reached
US$276 million, or nearly 12 percent of total exports (INTUR 2008; World Bank 2008). In
comparison, the 2008 tourism receipts in Costa Rica of US$2.1 billion were more than seven
times higher than those in Nicaragua and constituted around 18 percent of the country’s total
exports.
96. Recent studies show that growth of the tourism sector has contributed to overall
economic growth and development in Latin American countries. A cross-country econometric
study of the determinants of economic growth in 17 Latin American countries over the 1995–
2004 period found that a 10 percent increase in the spending of international tourists leads to a
0.4 percent increase in GDP per capita (Fayissa et al. 2009: 13). Another study examined the
growth performance of Nicaragua and found that of the three sectors, including agriculture,
manufacture, and tourism, the latter offered the largest potential to generate foreign exchange
earnings, increases in job creation, increases in economic expansion and impacts on income
distribution (Vanegas and Croes 2007). The coffee and manufacturing sectors have also played
an important role in the country’s overall growth, but the impact of the tourism sector was found
to be higher. The findings of this study have also suggested that a five percent increase in
tourism receipts leads to a 3.1 percent decrease in poverty in Nicaragua. Other studies have
found high potential benefits to the poor associated with an increase in tourism spending (Box
V.2). Thus, the tourism sector can become a powerful driver of pro-poor growth in Nicaragua
and elsewhere because of its strong potential to create jobs and stimulate agricultural production
in marginal areas, the traditional sector (handicrafts and souvenirs) and transport services.

58
Box V.2 High multiplier effects and potential benefits to the poor from the tourism sector
A recent study has assessed the effects of tourism spending on the incomes of the poor in
Panama, using the data from 2007–2008 tourism surveys and a household income and
expenditure survey. The study found that growth of the tourism sector has had the highest
multiplier effect on the overall economic growth than any other sector, even including the
Panama Canal and the Colón free economic zone sectors. This is explained by the tourism
sector’s strong reliance on inputs from the primary production sector and from other service
sectors. The share of income earned by the rural poor and indigenous groups was found to be
highest in areas where they constitute the largest share of the labor force. Thus, the poor may
benefit from the growth of the tourism sector, but these benefits cannot be assumed because they
are not automatic. Survey data at the level of tourist destinations and enterprises are needed to
ascertain the share of the benefits that reach the poor in each particular case.
Source: Klytchnikova and Dorosh (2009).
97. Ecotourism is thought to be the fastest-growing segment of the Nicaraguan tourism
industry (Barany et al. 2001). According to the results of a 2008 survey of tourists, half of the
tourists arrive mainly for recreation, and around one-third may engage in nature-based activities,
although the survey results may be biased (INTUR 2008).30
As part of the overall growth
strategy that seeks to maximize the benefits from the tourism sector, ecotourism holds the
promise of delivering environmental benefits, in addition to well-documented economic and
important social benefits. The passage of legislation in 1999 that allowed the establishment of
private wildlife reserves in Nicaragua has facilitated domestic and foreign investment in
ecotourism-based enterprises. The Domitila Private Wildlife Reserve in the Lake Cocibolca
watershed has become Nicaragua’s first legally recognized private reserve. Because public
resources for financing and management of protected areas are severely constrained in
Nicaragua, the development of a well-functioning network of private reserves can play an
important role (Barany et al. 2001).
98. Just as the benefits to the poor from ecotourism projects are not automatic, neither are the
benefits to the environment. The links between the tourism sector and the environment can go in
two directions: the ecological footprint of tourism through its potential adverse effects, and the
potential of nature-based tourism to stimulate the local economy, generate jobs and earmark
financing for the management of protected areas. The government has an important role to play
in providing regulations and certification for ecotourism enterprises and in monitoring
compliance with environmental standards. Local communities need to be active participants in
the development of regional and local ecotourism strategies, in order for these projects to be
successful and beneficial for the local populations.
30
Of the 12,454 tourists interviewed in 2008, 50 percent responded that vacation/recreation was the purpose of their
trip. Of the 4,193 survey respondents who answered the question about the activities they undertook during the trip,
33 percent replied that they went hiking, 25 percent went surfing, 18 percent climbed volcanoes, 9 percent went
kayaking, 6 percent went cycling, and 8 percent engaged in other activities. It is unclear whether the answers of the
other respondents are missing and therefore affected by the non-response bias, or whether respondents did not
engage in these activities (INTUR 2008).
59
Box V.3. Public disclosure can be an effective way to strengthen compliance
Mechanisms to disseminate information in an easily interpretable manner can allow communities to function
as informal regulators. Such mechanisms also promote accountability on the part of those being regulated.
An example is the pioneering public disclosure scheme in Indonesia (PROPER), which encouraged firms to
clean up their air and water pollution. In a second phase of the program, the government made the disclosure
program compulsory. Other examples of accountability mechanisms include actions implemented by the
government in the Mexico Programmatic Environment Development Policy Loan. These include public
disclosure of funds returned to municipalities for water treatment investment programs to encourage greater
scrutiny and accountability on the part of the public and the requirement to post on the Internet the
processing status of all environmental licenses. The requirement is intended to improve the transparency of
government procedures, thereby reducing nontransparent practices. A transparency law that was passed in
2001 greatly facilitated these actions (Ahmed and Sánchez-Triana, 2008).
Reducing pressures from point sources of pollution through improvement in wastewater
treatment and through stronger environmental regulation
99. Reducing contamination from point sources, such as industrial and municipal wastewater
sources, is an urgent priority where contamination has high health and environmental costs. The
solution is threefold: (i) extending access to sewerage, (ii) improving the maintenance of
wastewater treatment facilities, and (iii) reducing industrial pollution by enforcing wastewater
discharge standards and providing economic incentives and technical assistance to facilitate
compliance. ENACAL is the main entity in charge of developing wastewater projects in the Lake
Cocibolca watershed. ENACAL’s 2008–2012 Institutional Development Plan—the company’s
investment plan—has prioritized the extension of the sewerage system and the upgrading of the
wastewater treatment plant in Granada, with a total investment cost of around US$20 million.
Financing sources for half of the necessary investment have been identified. ENACAL is also
jointly working with an NGO and MARENA to provide sewerage and wastewater treatment for
the town of San Carlos. MARENA is currently developing a strategy to enforce industrial
enterprises’ compliance with wastewater discharge standards.
100. International experiences, such as the mandatory disclosure of enterprises’ air and water
pollution data in Indonesia and the publication of information on the status of environmental
licenses in Mexico, show that public disclosure of environmental information can be very
effective in strengthening enforcement and creating a culture of compliance (Box V.3). In
Nicaragua, public disclosure is likely to be particularly effective because of the strong support by
national- and local-level decision makers and community leaders for environmental education,
and to be an opportunity to mobilize grassroots environmental monitoring initiatives through
better provision of environmental information. Legal environmental actions tend to be effective
in countries with strong legal frameworks and enforcement mechanisms, such as the experience
with the public prosecutors model in Brazil, and less effective in countries that face serious
enforcement challenges.
101. Strengthening water resources governance and institutions. Much progress needs to
occur in enhancing adaptive water governance in Nicaragua and in particular the Lake Cocibolca
watershed, including the strengthening of the institutional and regulatory framework for water
resources management. Important steps in this regard have taken place. At national level, an
institutional and regulatory framework has been worked out under the new Water Law, but
implementation still needs to be carried out. At municipal level, local actors are actively engaged
60
in the process of planning watershed protection actions. Making the National Water Authority
(ANA) and the Secretariat of the Cocibolca Watershed Commission operational, and establishing
clear coordination mechanisms among municipalities in the watershed, are the crucially needed
institutional bases for watershed protection. A good foundation for integrated water resources
management exists in Nicaragua and several institutions at different levels are taking actions in
this regard (Table V.2).

61
Table V.2. Institutional profile of water resources management in Nicaragua.
Agency Relevance to the management of the Lake Cocibolca watershed
MARENA Ministry of Environment
and Natural Resources
Implementation of environmental policies and regulations, including
the enforcement of wastewater discharge standards, the management
of protected areas including the wetlands, and the Environmental
Impact Assessment process.
MAGFOR Nicaraguan Institute of
Agricultural Technology
Support for a range of programs, extension services and education
campaigns on sustainable agriculture, pasture management and soil
conservation practices; guidelines for the agrochemical application.
INTA Ministry of Agriculture,
Livestock and Forestry
INETER Nicaraguan Institute of
Territorial Studies
Collection and analysis of meteorological, geological and other
environmental data; and, jointly with MARENA, provision of zoning
guidelines to municipalities.
CIRA-UNAN Center for Water
Resources Research
Applied research on water resources, water quality monitoring and
related limnologic (algae) research; calibration of the PC-Lake water
quality model for Lake Cocibolca recently began.
CIEMA Center for Environmental
Research and Studies
Applied research on water resources; host to the TWINLATIN
program that collected and systemized much of the data used in this
study.
ENACAL Nicaraguan Water Supply
and Sanitary Sewage
Company
Provision of water and sanitation in most urban areas.
FISE Nicaraguan Emergency
Social Investment Fund
Provision of water and sanitation in rural areas.
AMUNIC Association of
Nicaraguan
Municipalities
Coordination of local development programs for Nicaragua’s 68
municipalities, including the coordination of local-level
environmental planning.
AMUGRAN Association of
Nicaraguan
Municipalities of the
Great Lake
Coordination of watershed protection actions at municipal level and
organization of annual Cocibolca Forums.
INTUR Nicaraguan Institute of
Tourism
Preparation of tourism sector strategies, including tourism planning in
the Lake Cocibolca watershed.
The Lake
Commission
Commission for the
Sustainable Development
of the Lake Cocibolca and
San Juan River
Watersheds (created by
Law 626 of 2007)
Development, approval, and facilitation of the implementation of the
action plan and a zoning plan for the watershed, and coordination of
donor support and management of the corresponding financial
resources. The commission includes the Water and Sanitation
Institute (INAA), ENACAL, INTUR, MAGFOR, ANA, CIRA-
UNAN, representatives of municipalities and other agencies. The
Commission’s Secretariat has been created but does not have an
operating budget.
ANA National Water Authority Agency created by the 2007 Water Law (Law 620) and responsible
for integrated water resources management but not yet operational.
62
102. An investment and policy agenda for the lake’s watershed will need to include the
following key elements: (i) institutional strengthening, including the establishment of the
institutional framework, a sustainable and ongoing monitoring program for water quality and
quantity, and the strengthening of environmental regulation and public access to environmental
information and education; (ii) introduction of measures to support a shift to more sustainable
agriculture in extensive and intensive farming systems; (iii) a comprehensive wetland
management plan as part of the overall framework for integrated water resources management in
the watershed; and (iv) investment in wastewater treatment, with an emphasis on financial
sustainability and on overcoming coordination challenges among neighboring municipalities to
ensure adequate maintenance of the system. Many of the priority measures—in particular,
reducing the degradation of the watershed’s soils through improved pasture management and
agroforestry or afforestation programs—have great potential to store carbon in soils and trees,
apart from the potential increases in agricultural productivity. The large scope to reduce carbon
emissions, the local benefits to farmers, and environmental benefits to the lake make it a
potentially large source of win-win-win options with these three types of benefits. The lake’s
watershed is uniquely suited to become a pilot region for pushing the envelope on innovative
carbon finance mechanisms for carbon storage in soils.
63
Box VI.1. Project profiles defined in the 2004 Strategic Action Program
The SAP developed project profiles in the greater San Juan River watershed that would support the
Procuenca Project’s broad “Eco-management vision, Tourism and Rural Development,” including:
Agroecological zoning to support integrated watershed and farm management
Implementation of zoning plans in the watershed’s urban areas
Financing of investments in wastewater treatment systems in selected municipalities
Strengthening of the participation of civil society organizations in the integrated watershed
management process
Environmental education to improve the sustainability of the use of natural resources in the watershed
Water quality monitoring and strengthening of meteorological data provision
Integrated management of the Malacatoya and other prioritized sub-watersheds
Conservation of the biological corridor’s ecosystems, the coastal zone and other biodiversity hotspots
Management plans for the prioritized Nicaraguan and transboundary wildlife refuges
Payment for environmental services in several prioritized areas of the watershed
Support for sustainable fishing activities and agro- and ecotourism.
VI. Conclusions and policy implications
103. It is possible to achieve the long-term vision of better livelihoods and sustainable use of
natural resources in the Lake Cocibolca watershed. The Government of Nicaragua has made
important efforts and achieved significant progress in raising public awareness of the
environmental problems of the watershed, seeking solutions and implementing programs to
improve sanitation systems and wastewater treatment, promote sustainable agricultural practices
and support the development of sustainable tourism. Prior to this study, a broad group of
stakeholders, including national- and local-level government institutions and civil society
organizations of the watershed, identified the strategic vision and a long series of investments to
implement this vision in the watershed (Box VI.1). This study has built upon these efforts,
identified the most critical gaps in scientific understanding and investment, and helped place the
series of investments identified by the SAP within a broader watershed-wide perspective. Future
efforts to reduce environmental and health risks in the watershed need to include a range of
measures to tackle health and environmental risks from municipal wastewater discharge,
industrial water sources, agrochemicals, tilapia farming, as well as a series of investments and
policies to promote sustainable land use practices and reduce wetland degradation.
104. The need to identify win-win solutions with benefits for the lake but also for people
who live in the watershed and/or whose livelihoods depend on the watershed’s natural
resources. Public resources are scarce; without greater certainty about the severity of the
economic, ecological, and health impacts of environmental degradation in the watershed, it is
unclear what level of investment in mitigation measures is justified. The scientific uncertainty
about the impact of contamination on water quality, ecosystems and public health, and on the
resulting economic costs preclude even a rough estimate of the investment needed in mitigation
solely on the basis of the benefits to the lake. Given the current state of knowledge, the policy
agenda for the watershed needs to advance on two fronts: ascertaining the severity of the
environmental degradation and its impacts, and identifying win-win options or policy changes

64
and investments with significant local benefits apart from the benefits for the lake. Many such
options exist: treating wastewater in areas where localized bacteriological contamination is so
high that it poses risks to health and limits recreation and tourism; supporting sustainable land
uses that raise agricultural productivity and protect local water sources while also reducing the
sedimentation of wetlands and the San Juan River; reducing health and ecosystem risks from
pesticide application in intensive agriculture; and other options. The GoN is supporting the
identification of these win-win options by providing the discussion forums and mechanisms to
facilitate the active engagement of local communities in the formulation of the action plan for the
watershed, and of the municipal environmental and zoning plans.
105. Based on the findings of this study and the series of consultations held with state and
non-state actors in Nicaragua in the course of this study’s implementation, the required actions
fall into four broad areas: (i) supporting sustainable agriculture and alternative livelihood
sources, such as sustainable tourism, (ii) strengthening wetland protection and integrating
wetland management in broader-scale river basin management, (iii) investing in wastewater
treatment, water supply and hygiene, and (iv) strengthening the regulatory framework for
environmental management and the enforcement of key regulations (Figure VI.1). The
strengthening of information provision, education, environmental information, monitoring data,
and the institutional framework for integrated water resources management in the watershed are
the “enabling environment” to ensure successful implementation of the strategic agenda.
Figure VI.1. The range of policies and investments to reduce pressures on the watershed
106. Within this broad range of policy measures and investments to help shift to a more
sustainable path, some measures are more urgent than others and some are very costly, but low-
cost solutions and win-win measures that are good for the environment, for people’s livelihoods,
65
and for the lake’s ecology can also be found. The following general and more specific technical
conclusions have emerged from this study and can inform the setting of the investment and
policy priorities:
Making extensive and intensive agriculture more sustainable. Extensive cattle and crop
farming systems have led to the degradation of the watershed’s forests and soils. The common
practice of burning pastures to control weeds is especially damaging in extensive pasture
systems, especially in steeply sloped areas with soils vulnerable to erosion. Switching to more
sustainable land uses, such as silvopastoral systems that combine animal farming and tree
cultivation, requires an integrated approach to help overcome barriers to their adoption:
providing incentives to farmers to adopt such land uses, strengthening agricultural extension
services and environmental education, supporting improvements in infrastructure, strengthening
access to markets, and improving access to credit to allow farmers to make the up-front
investments that may be required for switching to more sustainable farming systems. Other
options for reducing the pressures on forests and soils from extensive systems are a transition to
more intensive agriculture and an expansion of opportunities for off-farm employment. Intensive
agriculture—rice, sugarcane and cotton cultivation in the watershed—has its own set of
problems: pollution of water and soils with agrochemicals and the impacts on farm workers’
health. Better education by scaling up the successful experiences with the provision of
agricultural extension services, support for the adoption of integrated pest management practices,
controlling stocks of outdated pesticides, and monitoring the actual application rates of the most
polluting agrochemicals are important priorities in the watershed. This study has identified
erosion hotspots in the areas of extensive agriculture, and the hotspots of contamination with
agrochemicals in the watershed are known (but not monitored), thus facilitating the setting of
priority areas to be addressed most urgently. An expansion of off-farm employment
opportunities is another way to promote a shift to a more sustainable pattern of land use in the
watershed, although in the short term the scope for this may be limited.
In the long term, the development of sustainable tourism has significant potential to
stimulate economic growth, provide alternative livelihoods for the rural population and
generate major benefits for the poor. The lake’s watershed is rich with cultural and ecological
attractions that can serve as the basis for tourism development. Experience in Latin America
shows that development of the tourism sector not only positively impacts economic growth, but
also has very high potential to benefit the poor because of strong backward linkages with
primary production and the resulting large-scale multiplier effects. Just as the benefits to the poor
from ecotourism projects are not automatic, so are the benefits to the environment. The links
between the tourism sector and the environment can go in two directions—the ecological
footprint of tourism through its potential adverse effects, and the potential of nature-based
tourism to stimulate the local economy, generate jobs and earmark financing for the management
of protected areas. The government has an important role to play in providing the regulations and
certification for ecotourism enterprises and in monitoring compliance with environmental
standards. Local communities need to be active participants in the development of regional and
local ecotourism strategies, in order for these projects to be successful and beneficial for the local
source of nutrient pollution. Tilapia cultivation in the lake near Ometepe Island has received
much public attention and is the subject of heated debate. This study did not conduct out an in-
depth assessment of the environmental effects of tilapia production in the lake, but it is clear that
the environmental risks of increasing tilapia production levels need to be regularly assessed both

66
in terms of nutrient contamination and in terms of risks to native and endemic fish species. It is
important to continue the independent monitoring of possible impacts of tilapia production on
water quality through the affluence of nutrients from tilapia as well as its impacts on the native
fish population, since tilapia can be an invasive species.
Weltand protection and the implementation of management plans will have multiple
benefits. Another source of pollution is the degradation of wetlands, which may be affected by
the encroachment of agriculture. According to the calculations in this study, Los Guatuzos and
other wetlands could be playing a very important role in the filtration of sediment and nutrient
loads from agricultural fields and point sources of pollution, but technical studies are needed to
ascertain how much pollution they filter. The watershed’s wetlands undoubtedly provide other
globally and locally important ecological and socioeconomic benefits such as fish hatcheries and
habitats for endemic and native species of fish, reptiles and birds. Devising strategies that place
the local communities in the driver’s seat as the stewards of conservation will help ensure that
management plans are effective. Sustainable sources of financing for the implementation of a
watershed-wide wetland management plan, well integrated in the overall plan for the
management of the lake’s watershed, may include innovative approaches such as sustainable
tourism, creation of environmental conservation funds for wetland protection, and payment for
environmental services (PES) mechanisms with local and international funding.
Much progress needs to take place in enhancing adaptive water governance in
Nicaragua and the Lake Cocibolca watershed; this includes the strengthening of the
institutional and regulatory framework for water resources management. Important steps in
this regard have taken place. At national level, an institutional and regulatory framework has
been worked out under the new Water Law, but implementation still needs to be carried out. At
municipal level, local actors are actively engaged in the process of planning the watershed
protection actions. Making the National Water Authority (ANA) and the Secretariat of the
Cocibolca Watershed Commission operational, and establishing clear coordination mechanisms
among municipalities in the watershed, are the crucially needed institutional bases for watershed
protection. Strengthening the required technical capacity at local level together with the use of
innovative approaches may to some extent help to reduce the high costs of implementation and
regulatory enforcement and to enhance adaptive capacity. Such approaches may include the use
of remote sensing and satellite technologies to monitor land use and water quantity, and the
promotion of public access to environmental information and of community-based
environmental monitoring initiatives.
Putting a monitoring strategy in place is urgent. The limited available evidence suggests
that contamination from nutrients carried into the lake with sediment flows is not yet severe in
the watershed as a whole, but action now may help to avoid potentially irreversible consequences
in the future. Although it is unclear how far the lake is from reaching a critical threshold at which
the ecosystems would be severely or irreversibly affected, the case is strong for urgent policy
actions to begin shifting to a more sustainable future development path for this important
watershed. As a first step, putting in place a strategy of systematic hydrometeorological and
water quality monitoring with clear institutional arrangements and sources of financing is an
urgent priority. Since the study has found that most of the runoff, sediments and some nutrients
originate from the Costa Rican part of the watershed, cooperation with Costa Rica at scientific
and policy levels is essential. Nicaraguan experts cite successful experiences of cooperation with
scientific laboratories in Costa Rica and Colombia that could be scaled up within the framework
67
of the SAP implementation and joint monitoring efforts. This study has also identified the critical
parameters that need to be monitored: precipitation, water flows, agrochemical runoff from
agriculture, and the nutrient content of the watershed’s soils. Some of the monitoring, such as for
precipitation and stream flow, needs to occur continuously while other parameters, such as soil
quality, can be established through discrete monitoring efforts. Ensuring the financial
sustainability and clear assignment of institutional responsibilities for a monitoring program of
this nature is an essential element for its successful implementation.
107. In the short term, financing of targeted interventions and the selected priorities
identified by the SAP and by this study will help the transition toward more sustainable use of
the watershed’s natural resources. In the long term, the broader economic policy and
institutional change will ultimately determine the watershed’s development pattern. The
broader economic policies and institutional factors, such as access to markets, agricultural
extension services, land tenure security and adequate regulation of access to water, will play a
key role in determining the longer-term pattern of economic development, agricultural
production structure, agrochemical use and land use in the watershed, as well as the prospects for
developing the region as the country’s prime tourist destination. Thus, many solutions lie within
the broader policy realm and require inter-agency coordination and bringing the environmental
problems of the watershed into the core development agenda, with a focus on sustainable growth,
protection of the watershed’s globally important ecosystems, and improvement of livelihoods.
68
References
Arnold, J.G., R. Srinivasan, R.S. Muttiah, and J.R. Williams. 1998. “Large area hydrologic
modeling and assessment, Part I: Model development.” Journal of the Amercian Water
Resources Association, 34(1), pp. 73–89.
Boyd, C.E., and B. Green. 1998. “Dry matter, ash, and elemental composition of pond-cultured
tilapia (Oreochromis aureus and O. niloticus).” Journal of the World Aquaculture Society, 29,
pp. 125–128.
CIRA/UNAN. 2009. “Recursos Hídricos de Nicaragua una Visión Estratégica.” Presentación en
cuarta reunión de programa de agua de la red interamericana de academias de ciencia.
Costa-Pierce, Barry. 2003. Rapid evolution of an established feral tilapia (Oreochromis spp.):
the need to incorporate invasion science into regulatory structures. Biological Invasions 5: 71–
84. Cited from Massachusetts Institute of Technology 2006. Tilapia Fact Sheet. June 28, 2006.
http://massbay.mit.edu/seafood/tilapia.pdf. Accessed: 20 October 2009.
Do Monte, Marecos, H., Angelakis, A. and Asano, T. (1996). Necessity and basis for
establishment of European guidelines for reclaimed wastewater in the Mediterranean region.
Wat. Sci. Tech., 33 (10–11), 303–316.
Di Bernardo, L .1995. “Algas e suas Influências na Qualidade das Aguas e nas Tecnologias de
Tratamiento.”
ENACAL. 2009. “Nicaragua, Cocibolca, agua, vida, calidad de vida.” Presentación del Primer
Foro de Agua y Saneamiento.
FAO. 2005–2009. Cultured Aquatic Species Information Programme. Oreochromis niloticus.
Cultured Aquatic Species Information Programme. Text by Rakocy, J. E. In: FAO Fisheries and
Aquaculture Department [online]. Rome. Updated May 19, 2006.
http://www.fao.org/fishery/culturedspecies/Oreochromis_niloticus/en. Accessed: October 20,
2009.
FUNDAR-MARENA (2003). Plan de Manejo del Refugio de Vida Silvestre Los Guatuzos.
Período 2003–2008. Proyecto Gestión Ambiental Amigos de la Tierra España – Cooperación
Española, Managua, Nicaragua.
García Galán, R., and S. Hernández. 2004. “Evolución trófica del Lago Cocibolca: Indicadores
de desarrollo sostenible de la gestión empresarial. Serie 1: Sector lácteo, planificación, pesca,
bebidas, frutas y vegetales y cerámica de barro.” Managua: MARENA, Embajada Real de los
Países Bajos, UNI, CPML, SINIA.
GSMFC (Gulf States Marine Fisheries Commission) 2003. Fact Sheet for Oreochromis aureus.
November 21, 2003. http://nis.gsmfc.org/nis_factsheet.php?toc_id=194. Accessed: October 19,
2009.
Hruska, A. 1990. “Government Pesticide Policy in Nicaragua 1985–1989.” Global Pesticide
Monitor, 1(2), May 1990.
JICA. 1993. “Estudio sobre el proyecto de abastecimiento de agua en Managua.” Managua:
JICA.
69
JICA. 2005. “El estudio para el desarrollo para el abastecimiento de agua potable a mediano y
largo plazo de la ciudad de Managua. Informe Final. VI: Informe Principal.” Managua: JICA.
Koster, Sarian; A. Kamarainen; E. Jeppesen; E. van Nes; E. Peeters; N. Masseo; L. Sass; J.
Hauxwell; N. Hansel-Welch; T. Lauridsen; M. Søndergaard; R. Bachmann; G. Lacerot and M.
Scheffer. 2009. “Climate-related differences in the dominance of submerged macrophytes in
shallow lakes.” Global Change Biology, 15(10), pp. 2503–2517.
Marín, X., M. Ogier, C. Pérez, and M.A. Martínez. 2007. “Elementos metodológicos para la
implementación de pagos por servicios ambientales hídricos a nivel municipal en
Centroamerica.” Serie Técnica No. 2/2006. Tegucigalpa: PASOLAC.
Montenegro-Guillén, Salvador. 2005. “Lake Cocibolca/Nicaragua: Experience and Lessons
Learned Brief.” Managing Lakes and Their Basin for Sustainable Use: A Report for Lake Basin
Managers and Stakeholders. International Lake Environment Committee Foundation: Kasatsu,
Japan.
Moriasi, D.N., J.G. Arnold, M.W. Van Liew, R.L. Bingner, R.D. Harmel, and T.L. Veith. 2007.
“Model evaluation guidelines for systematic quantification of accuracy in watershed
simulations.” American Society of Agricultural and Biological Engineers, 50 (3), pp. 885–900.
Murray, D., C. Wesseling, and M. Keifer. 2002. “Surveillance of Pesticide-Relatd Illness in the
Developing World,” International Journal of Occupancy Environment Health. Vol 8, pp. 243–
248.
Obando Espinoza, M. 2007. “Evolución de la experiencia de los PSA hídricos en Nicaragua: El
caso de la micro cuenca Paso de los Caballos, Municipio de San Pedro del Norte, Chinandega.”
Serie Técnica No. 2/2007. Tegucigalpa: PASOLAC.
OSPESCA, 2006. Caracterización del Cuadrante Suroeste del Lago Cocibolca con Énfasis en la
Pesca y la Acuicultura. Octubre 2005–Marzo 2006. Proyecto “Plan Regional de Pesca y
Acuicultura Continental” – PREPAC (OSPESCA/TAIWAN/OIRSA). Organización del Sector
Pesquero y Acuícola del Istmo Centroamericano, Sistema de la Integración Centroamericana
SICA.
Pagiola, S. 2003. “Farmer responses to land degradation.” In: K.D. Wiebe, ed., Land Quality,
Agricultural Productivity, and Food Security: Biophysical Processes and Economic Choices at
Local, Regional, and Global Levels. Cheltenham: Edward Elgar Publishing.
Pagiola, S. 2008. “Payments for environmental services in Costa Rica.” Ecological Economics,
65(4), pp. 712–724.
Pagiola, S., A. Rios, and A. Arcenas. 2008. “Can the poor participate in payments for
environmental services? Lessons from the Silvopastoral Project in Nicaragua.” Environment and
Development Economics, 13(3), pp. 299–325.
Pagiola, S., E. Ramírez, J. Gobbi, C. de Haan, M. Ibrahim, E. Murgueitio, and J.P. Ruíz. 2007.
“Paying for the environmental services of silvopastoral practices in Nicaragua.” Ecological
Economics, 64, pp. 374–385.
Phillips, G., R. Jackson, C. Bennett, and A. Chilvers. 1994. “The importance of sediment
phosphorus release in the restoration of very shallow lakes (The Norfolk Broads, England) and
implications for biomanipulation.” Hydrobiologia, 275/276, pp. 445–456.
70
Salvatierra Suárez, Thelma and Yader Caballero Arbizú (2006). “Calidad del agua del Lago de
Nicaragua (Cocibolca) en el área de influencia municipal del sur de la Isla de Ometepe. Un
aporte de información científico-técnica para el desarrollo de una estrategia de gestión integral
para la cuenca del Gran Lago de Nicaragua.” Report prepared for CIRA/UNAN.
Schuol, J., K.C. Abbaspour, H. Yang, and R. Srinivasan. 2008. “Modeling blue and green water
availability in Africa.” Water Resource Research, 44: w07046.
Stehr A., P. Debels, F. Romero, and H. Alcalaga. 2008. “Hydrological modelling with SWAT
under conditions of limited data availability: Evaluation of results from a Chilean case study.”
Journal des Sciences Hydrologiques, 53(3), pp. 588–600
SUMAFISH. (2003). “Strategies for sustainable management of fisheries resources in the Pasak
Jolasid Reservoir, Thailand, through ecological and socioeconomic assessment.” PLACE:
ASEAN Regional Center for Biodiversity and the European Commission.
TWINLATIN Twinning European and Latin American River Basins for Research Enabling
Sustainable Water Resources Management. Final Reports [Report]. 2009.
Vista, A., P. Norris, and F.A. Lupi. 2006. “Nutrient loading and efficiency of tilapia cage culture
in Taal Lake, Philippines.” The Philippine Agricultural Scientist, 89(1), pp. 48–57.
Wesseling, Corriols; and M. Bravo. 2005. “Acute Pesticide Poisoning and Pesticide Registration
in Central America.” Toxicol Appl Pharmacol. 207, pp. 697–705. Review.
Winchell, M., R. Srinivasan, M. Di Luzio, and J.G. Arnold. 2009. “Arc SWAT interface for
SWAT2005 – User’s guide.” Temple: Blackland Research Center, Texas Agricultural
Experiment Station and Grassland, Soil and Water Research Laboratory, USDA Agricultural
Research Service.
World Bank. 2003. Nicaragua Land Policy and Administration: Toward a More Secure Property
Rights Regime. Report No. 26683-NI. Washington, D.C.
World Bank. 2005. Living Standards Measurement Survey for Nicaragua. Washington, D.C.
71
Annex A. Technical Description of the SWAT Modeling
of the Lake Cocibolca Watershed
This annex describes the hydrological modeling of the Lake Cocibolca watershed, using the Soil
and Water Assessment Tool (SWAT) tool. It describes the procedures followed in setting up the
model, as well as the data sources used. In addition, it provides a brief description of the
approach used to assess the potential impacts of climate change scenarios in the watershed.
Modeling Approach
In order to quantify the water quality impacts of point and non-point pollution sources in the
Lake Cocibolca watershed and to assess the possible effects of specific land use changes, the
study made use of the SWAT tool. This tool is a long-term hydrological and water quality
simulation model that operated on a daily time step and is able to assess the impacts of
alternative land use management options on water, sediment and agrochemical yield. SWAT
takes into account the following data: topography, soil type, land use and climate.
SWAT is a generic, freely downloadable package, with good user documentation and graphic
user interfaces for widely used geographic information system (GIS) software, e.g., ArcView,
ArcGIS 9.x, etc. It includes a stochastic weather generation module, and makes it possible to
assess how climate change might impact the basin hydrology. SWAT is subject to ongoing
improvements and has been successfully applied in many developing countries throughout the
world.
A distributed rainfall-runoff model such as SWAT makes it possible to route water, sediments
and contaminants from individual sub-basins through the entire watershed. In order to do so,
SWAT divides the watershed into multiple sub-basins that act as outlets. This division can be
based on the configuration of tributaries in the river and combined with the hand-selection of
additional points (e.g., limnigraph stations). The sub-basins are then further sub-divided into
hydrological response units (HRUs), which are assumed to be homogeneous with respect to their
hydrological features. HRUs are semi-automatically derived by SWAT based on soil type, land
use/cover, topographic characteristics and other user-defined criteria. The water balance for
HRU is computed by SWAT on a daily time step.
SWAT requires a geo-database, which contains the coefficients or parameters related to physical
and chemical characteristics of the different available soil types, land cover/plant growth,
inorganic and organic fertilizers, pesticides, tillage, urban land, and weather stations. These
coefficients or parameters are used in the several formulations (e.g., Hargreaves equation, Soil
Conservation Service (SCS) Curve Number method, nitrogen and phosphorus loading equations,
Manning equation, etc.) performed by SWAT to achieve a successful simulation.
Data sources
The hydrological model for the Cocibolca watershed was mostly built using information from a
geo-database developed under the EU-funded Twinning European and Latin American River
Basins for Research Enabling Sustainable Water Resources Management (commonly known as
the TWINLATIN Project). In the case of Nicaragua, TWINLATIN worked closely with the
Centro de Investigación y Estudios de Medio Ambiente (CIEMA) and the Instituto Nicaragüense
de Estudios Territoriales (INETER).
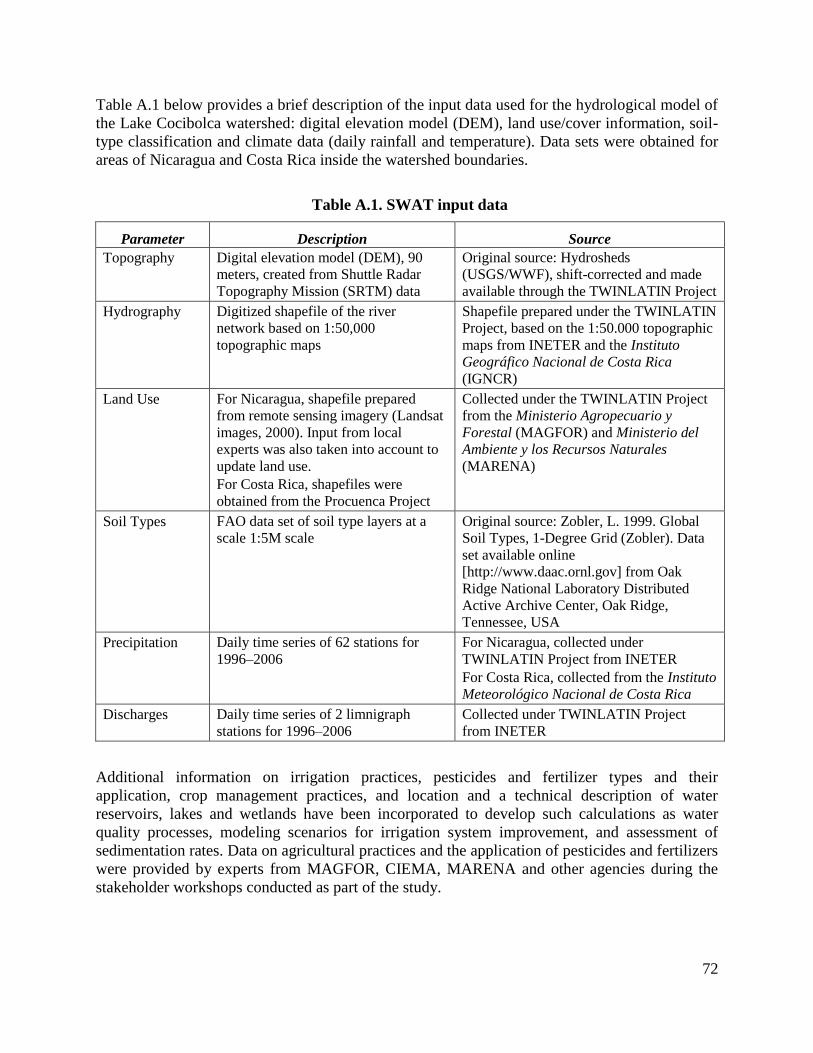
72
Table A.1 below provides a brief description of the input data used for the hydrological model of
the Lake Cocibolca watershed: digital elevation model (DEM), land use/cover information, soil-
type classification and climate data (daily rainfall and temperature). Data sets were obtained for
areas of Nicaragua and Costa Rica inside the watershed boundaries.
Table A.1. SWAT input data
Parameter Description Source
Topography
Digital elevation model (DEM), 90
meters, created from Shuttle Radar
Topography Mission (SRTM) data
Original source: Hydrosheds
(USGS/WWF), shift-corrected and made
available through the TWINLATIN Project
Hydrography Digitized shapefile of the river
network based on 1:50,000
topographic maps
Shapefile prepared under the TWINLATIN
Project, based on the 1:50.000 topographic
maps from INETER and the Instituto
Geográfico Nacional de Costa Rica
(IGNCR)
Land Use For Nicaragua, shapefile prepared
from remote sensing imagery (Landsat
images, 2000). Input from local
experts was also taken into account to
update land use.
For Costa Rica, shapefiles were
obtained from the Procuenca Project
Collected under the TWINLATIN Project
from the Ministerio Agropecuario y
Forestal (MAGFOR) and Ministerio del
Ambiente y los Recursos Naturales
(MARENA)
Soil Types FAO data set of soil type layers at a
scale 1:5M scale
Original source: Zobler, L. 1999. Global
Soil Types, 1-Degree Grid (Zobler). Data
set available online
[http://www.daac.ornl.gov] from Oak
Ridge National Laboratory Distributed
Active Archive Center, Oak Ridge,
Tennessee, USA
Precipitation Daily time series of 62 stations for
1996–2006
For Nicaragua, collected under
TWINLATIN Project from INETER
For Costa Rica, collected from the Instituto
Meteorológico Nacional de Costa Rica
Discharges Daily time series of 2 limnigraph
stations for 1996–2006
Collected under TWINLATIN Project
from INETER
Additional information on irrigation practices, pesticides and fertilizer types and their
application, crop management practices, and location and a technical description of water
reservoirs, lakes and wetlands have been incorporated to develop such calculations as water
quality processes, modeling scenarios for irrigation system improvement, and assessment of
sedimentation rates. Data on agricultural practices and the application of pesticides and fertilizers
were provided by experts from MAGFOR, CIEMA, MARENA and other agencies during the
stakeholder workshops conducted as part of the study.
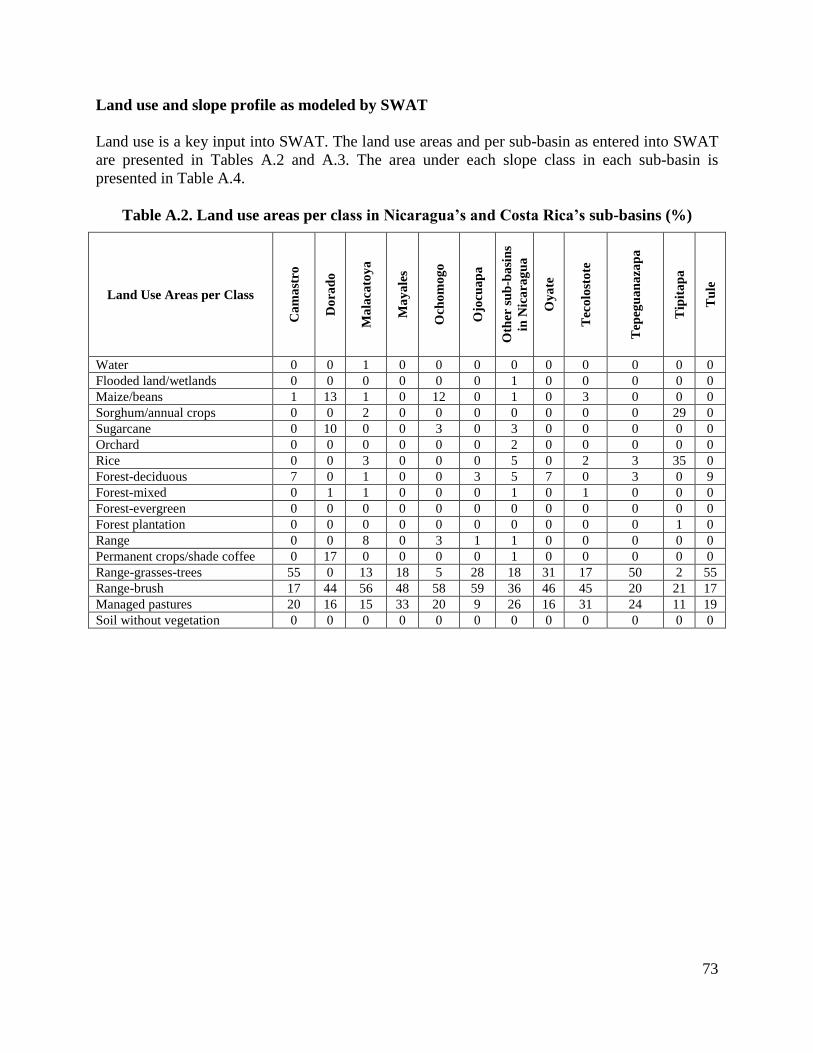
73
Land use and slope profile as modeled by SWAT
Land use is a key input into SWAT. The land use areas and per sub-basin as entered into SWAT
are presented in Tables A.2 and A.3. The area under each slope class in each sub-basin is
presented in Table A.4.
Table A.2. Land use areas per class in Nicaragua’s and Costa Rica’s sub-basins (%)
Land Use Areas per Class C
am
ast
ro
Do
rad
o
Ma
laca
toy
a
Ma
ya
les
Och
om
og
o
Ojo
cua
pa
Oth
er s
ub
-ba
sin
s
in N
ica
rag
ua
Oy
ate
Tec
olo
sto
te
Tep
egu
an
aza
pa
Tip
ita
pa
Tu
le
Water 0 0 1 0 0 0 0 0 0 0 0 0
Flooded land/wetlands 0 0 0 0 0 0 1 0 0 0 0 0
Maize/beans 1 13 1 0 12 0 1 0 3 0 0 0
Sorghum/annual crops 0 0 2 0 0 0 0 0 0 0 29 0
Sugarcane 0 10 0 0 3 0 3 0 0 0 0 0
Orchard 0 0 0 0 0 0 2 0 0 0 0 0
Rice 0 0 3 0 0 0 5 0 2 3 35 0
Forest-deciduous 7 0 1 0 0 3 5 7 0 3 0 9
Forest-mixed 0 1 1 0 0 0 1 0 1 0 0 0
Forest-evergreen 0 0 0 0 0 0 0 0 0 0 0 0
Forest plantation 0 0 0 0 0 0 0 0 0 0 1 0
Range 0 0 8 0 3 1 1 0 0 0 0 0
Permanent crops/shade coffee 0 17 0 0 0 0 1 0 0 0 0 0
Range-grasses-trees 55 0 13 18 5 28 18 31 17 50 2 55
Range-brush 17 44 56 48 58 59 36 46 45 20 21 17
Managed pastures 20 16 15 33 20 9 26 16 31 24 11 19
Soil without vegetation 0 0 0 0 0 0 0 0 0 0 0 0
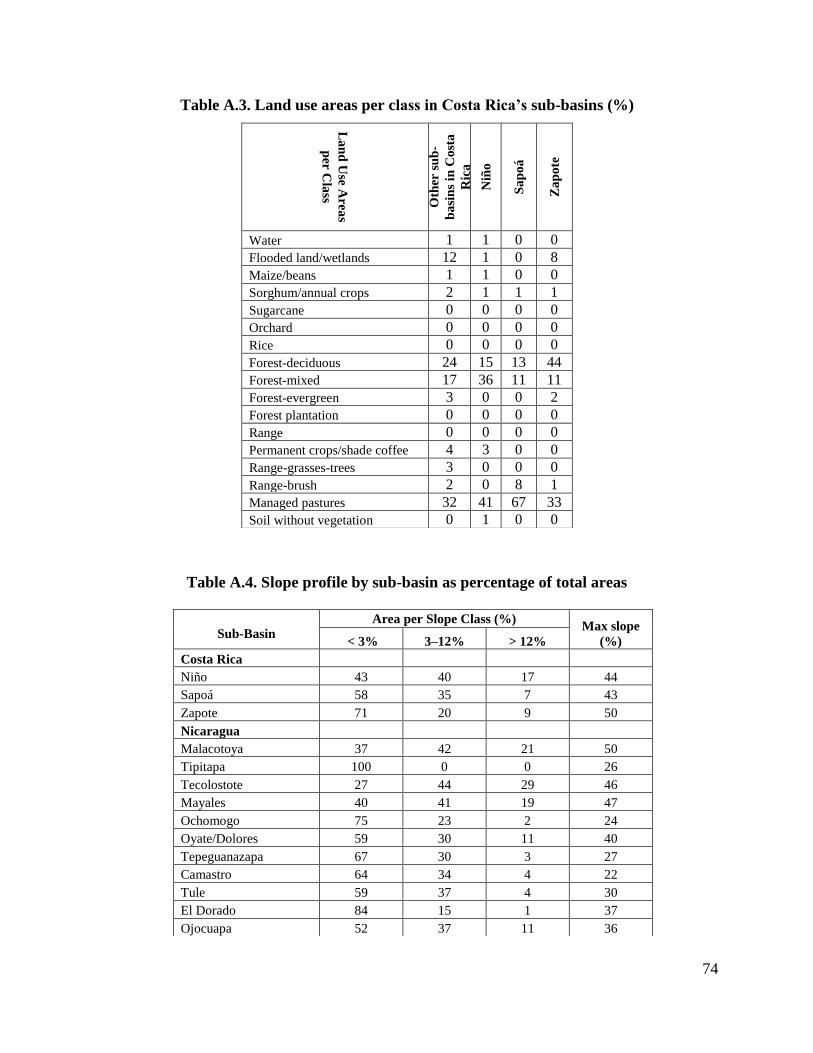
74
Table A.3. Land use areas per class in Costa Rica’s sub-basins (%)
Table A.4. Slope profile by sub-basin as percentage of total areas
La
nd
Use A
rea
s
per C
lass O
ther
su
b-
ba
sin
s in
Co
sta
Ric
a
Niñ
o
Sa
po
á
Za
po
te
Water 1 1 0 0
Flooded land/wetlands 12 1 0 8
Maize/beans 1 1 0 0
Sorghum/annual crops 2 1 1 1
Sugarcane 0 0 0 0
Orchard 0 0 0 0
Rice 0 0 0 0
Forest-deciduous 24 15 13 44
Forest-mixed 17 36 11 11
Forest-evergreen 3 0 0 2
Forest plantation 0 0 0 0
Range 0 0 0 0
Permanent crops/shade coffee 4 3 0 0
Range-grasses-trees 3 0 0 0
Range-brush 2 0 8 1
Managed pastures 32 41 67 33
Soil without vegetation 0 1 0 0
Sub-Basin
Area per Slope Class (%) Max slope
(%) < 3% 3–12% > 12%
Costa Rica
Niño 43 40 17 44
Sapoá 58 35 7 43
Zapote 71 20 9 50
Nicaragua
Malacotoya 37 42 21 50
Tipitapa 100 0 0 26
Tecolostote 27 44 29 46
Mayales 40 41 19 47
Ochomogo 75 23 2 24
Oyate/Dolores 59 30 11 40
Tepeguanazapa 67 30 3 27
Camastro 64 34 4 22
Tule 59 37 4 30
El Dorado 84 15 1 37
Ojocuapa 52 37 11 36
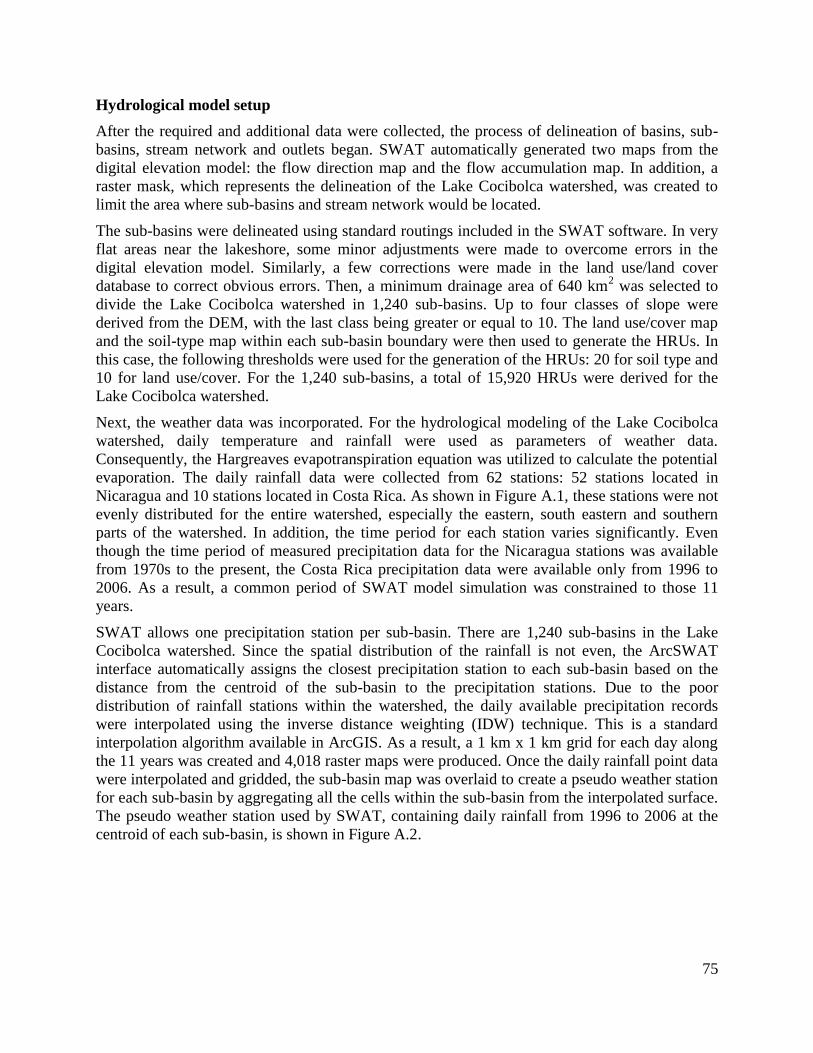
75
Hydrological model setup
After the required and additional data were collected, the process of delineation of basins, sub-
basins, stream network and outlets began. SWAT automatically generated two maps from the
digital elevation model: the flow direction map and the flow accumulation map. In addition, a
raster mask, which represents the delineation of the Lake Cocibolca watershed, was created to
limit the area where sub-basins and stream network would be located.
The sub-basins were delineated using standard routings included in the SWAT software. In very
flat areas near the lakeshore, some minor adjustments were made to overcome errors in the
digital elevation model. Similarly, a few corrections were made in the land use/land cover
database to correct obvious errors. Then, a minimum drainage area of 640 km2 was selected to
divide the Lake Cocibolca watershed in 1,240 sub-basins. Up to four classes of slope were
derived from the DEM, with the last class being greater or equal to 10. The land use/cover map
and the soil-type map within each sub-basin boundary were then used to generate the HRUs. In
this case, the following thresholds were used for the generation of the HRUs: 20 for soil type and
10 for land use/cover. For the 1,240 sub-basins, a total of 15,920 HRUs were derived for the
Lake Cocibolca watershed.
Next, the weather data was incorporated. For the hydrological modeling of the Lake Cocibolca
watershed, daily temperature and rainfall were used as parameters of weather data.
Consequently, the Hargreaves evapotranspiration equation was utilized to calculate the potential
evaporation. The daily rainfall data were collected from 62 stations: 52 stations located in
Nicaragua and 10 stations located in Costa Rica. As shown in Figure A.1, these stations were not
evenly distributed for the entire watershed, especially the eastern, south eastern and southern
parts of the watershed. In addition, the time period for each station varies significantly. Even
though the time period of measured precipitation data for the Nicaragua stations was available
from 1970s to the present, the Costa Rica precipitation data were available only from 1996 to
2006. As a result, a common period of SWAT model simulation was constrained to those 11
years.
SWAT allows one precipitation station per sub-basin. There are 1,240 sub-basins in the Lake
Cocibolca watershed. Since the spatial distribution of the rainfall is not even, the ArcSWAT
interface automatically assigns the closest precipitation station to each sub-basin based on the
distance from the centroid of the sub-basin to the precipitation stations. Due to the poor
distribution of rainfall stations within the watershed, the daily available precipitation records
were interpolated using the inverse distance weighting (IDW) technique. This is a standard
interpolation algorithm available in ArcGIS. As a result, a 1 km x 1 km grid for each day along
the 11 years was created and 4,018 raster maps were produced. Once the daily rainfall point data
were interpolated and gridded, the sub-basin map was overlaid to create a pseudo weather station
for each sub-basin by aggregating all the cells within the sub-basin from the interpolated surface.
The pseudo weather station used by SWAT, containing daily rainfall from 1996 to 2006 at the
centroid of each sub-basin, is shown in Figure A.2.

76
Figure A.1. Actual rainfall stations
Figure A.2. Pseudo weather stations for precipitation used in SWAT
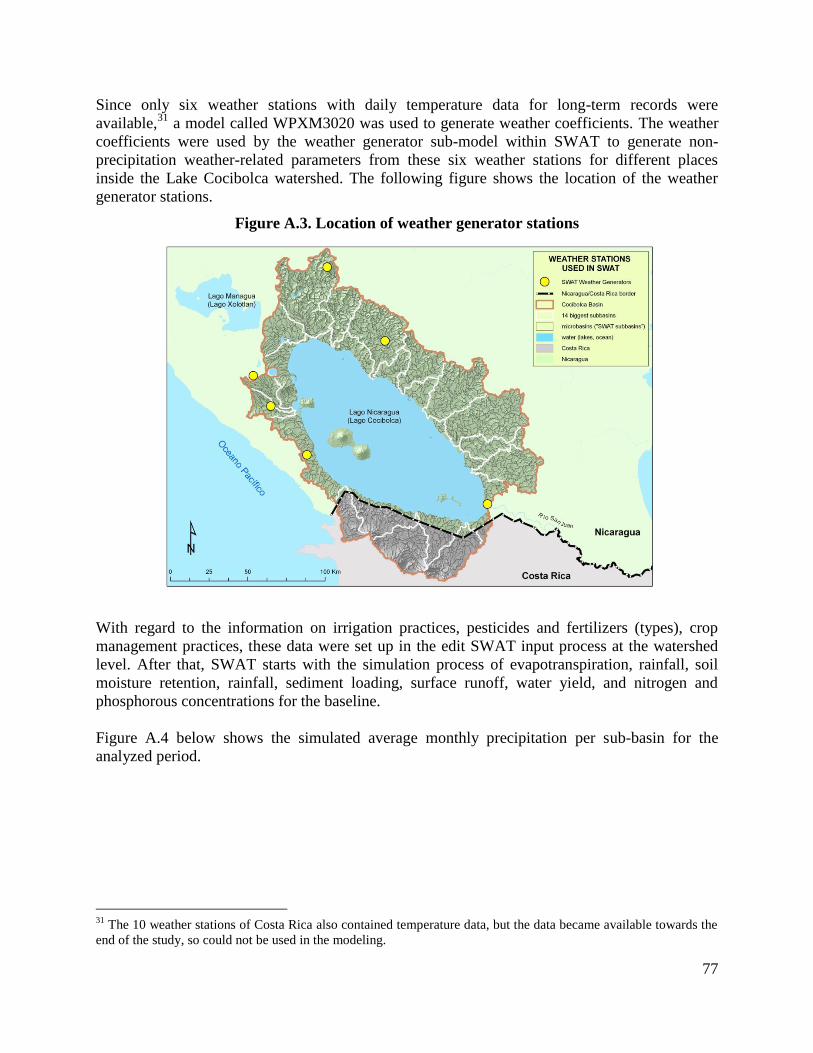
77
Since only six weather stations with daily temperature data for long-term records were
available,31
a model called WPXM3020 was used to generate weather coefficients. The weather
coefficients were used by the weather generator sub-model within SWAT to generate non-
precipitation weather-related parameters from these six weather stations for different places
inside the Lake Cocibolca watershed. The following figure shows the location of the weather
generator stations.
Figure A.3. Location of weather generator stations
With regard to the information on irrigation practices, pesticides and fertilizers (types), crop
management practices, these data were set up in the edit SWAT input process at the watershed
level. After that, SWAT starts with the simulation process of evapotranspiration, rainfall, soil
moisture retention, rainfall, sediment loading, surface runoff, water yield, and nitrogen and
phosphorous concentrations for the baseline.
Figure A.4 below shows the simulated average monthly precipitation per sub-basin for the
analyzed period.
31
The 10 weather stations of Costa Rica also contained temperature data, but the data became available towards the
end of the study, so could not be used in the modeling.
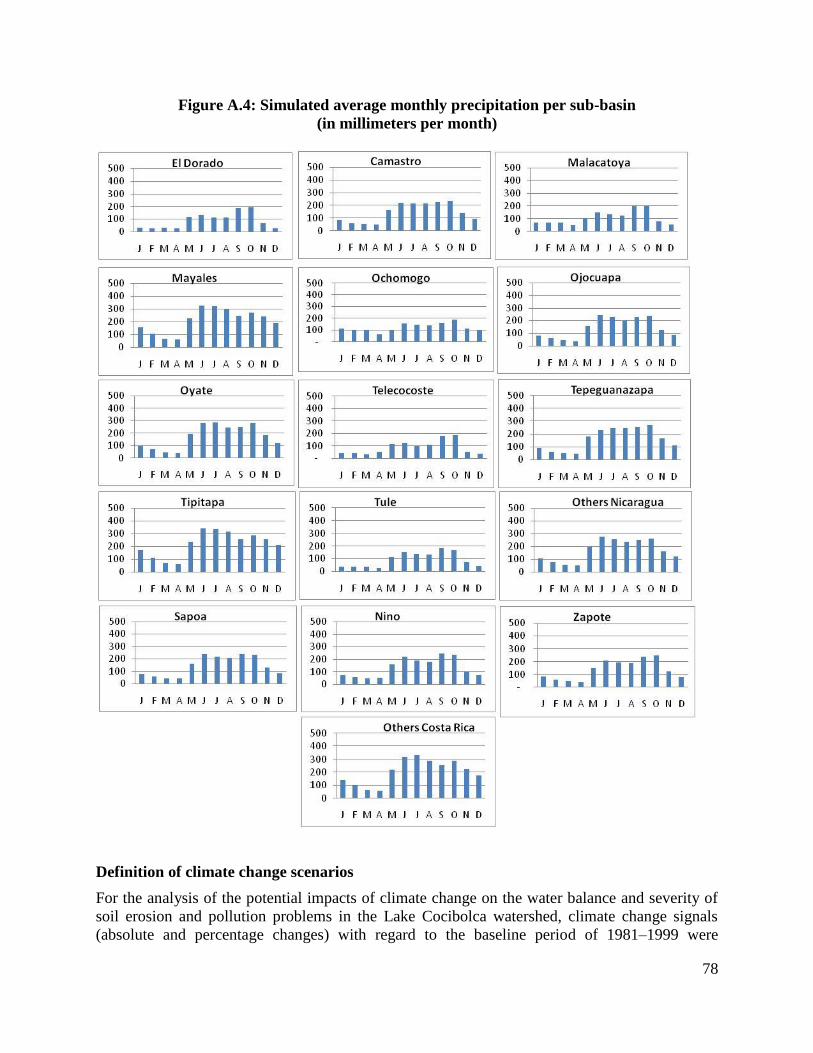
78
Figure A.4: Simulated average monthly precipitation per sub-basin
(in millimeters per month)
Definition of climate change scenarios
For the analysis of the potential impacts of climate change on the water balance and severity of
soil erosion and pollution problems in the Lake Cocibolca watershed, climate change signals
(absolute and percentage changes) with regard to the baseline period of 1981–1999 were

79
generated by applying MAGICC/SCENGEN 5.3v2 tool to two cells: the Pacific cell, 87º30’–85º
W |10º–12º30’N, and the Atlantic cell, 85º–82º30’ W |10º–12º30’N. Outputs of 16 Global
Circulation Models (GCMs) and 6 marker scenarios (A1FI, A1T, A1B, A2, B2 and B1) from the
Special Report on Emissions Scenarios (SRES) were used to obtain change signals for mean
annual temperature and mean annual precipitation for a future 30-year window centered on the
year 2050. Figures A.5 and A.6 below show the mean annual changes relative to the baseline
scenario (1981–1999) from MAGICC/SCENGEN for the Pacific and Atlantic cells.
Figure A.5. Precipitation and temperature changes for the Pacific Cell
Figure A.6. Precipitation and temperature changes for the Atlantic Cell
-60
-40
-20
0
20
40
60
-3 -2 -1 0 1 2 3
ΔP
[%]
ΔT [ºC]
Cambios en valores promedio anuales
1990 - 2050MAGICC-SCENGEN 5.3v2
NICARAGUA "Pacífico"
Lat: 10º00' - 12º30' NorteLong: 87º'30' - 85º00' Oeste
BCCR-BCM2.0 [Noruega]
CGCM3.1(T47) [Canada]
CCSM3 [EEUU]
CNRM-CM3 [Francia]
CSIRO-Mk3.0 [Australia]
ECHO-G [Alemaña/Corea]
GFDL-CM2.0 [EEUU]
GFDL-CM2.1 [EEUU]
GISS-EH [EEUU]
INM-CM3.0 [Rusia]
IPSL-CM4 [Francia]
MIROC3.2(hires) [Japón]
MIROC3.2(medres) [Japón]
ECHAM5/MPI-OM [Alemaña]
MRI-CGCM2.3.2 [Japón]
UKMO-HadCM3 [Reino Unido]
promedio GCMs
-60
-40
-20
0
20
40
60
-3 -2 -1 0 1 2 3
ΔP
[%]
ΔT [ºC]
Cambios en valores promedio anuales
1990 - 2050MAGICC-SCENGEN 5.3v2
NICARAGUA "Atlántico"
Lat: 10º00' - 12º30' NorteLong: 85º'00' - 82º30' Oeste
BCCR-BCM2.0 [Noruega]
CGCM3.1(T47) [Canada]
CCSM3 [EEUU]
CNRM-CM3 [Francia]
CSIRO-Mk3.0 [Australia]
ECHO-G [Alemaña/Corea]
GFDL-CM2.0 [EEUU]
GFDL-CM2.1 [EEUU]
GISS-EH [EEUU]
INM-CM3.0 [Rusia]
IPSL-CM4 [Francia]
MIROC3.2(hires) [Japón]
MIROC3.2(medres) [Japón]
ECHAM5/MPI-OM [Alemaña]
MRI-CGCM2.3.2 [Japón]
UKMO-HadCM3 [Reino Unido]
promedio GCMs
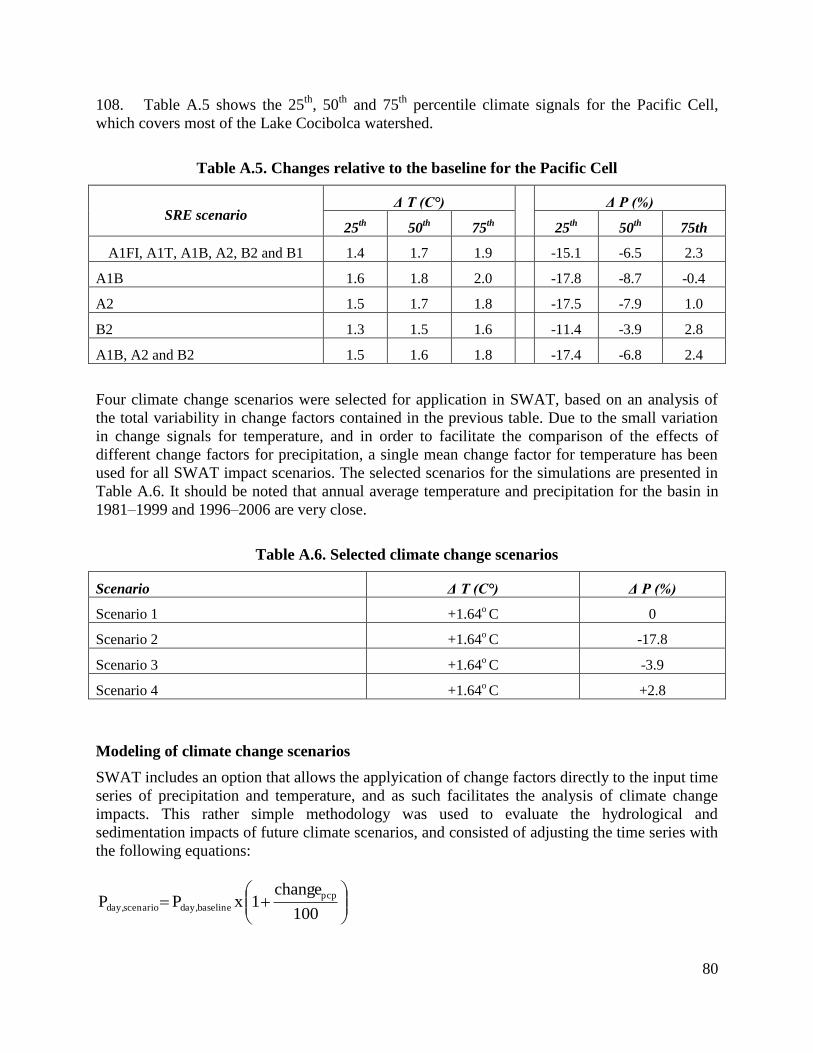
80
108. Table A.5 shows the 25th
, 50th
and 75th
percentile climate signals for the Pacific Cell,
which covers most of the Lake Cocibolca watershed.
Table A.5. Changes relative to the baseline for the Pacific Cell
SRE scenario Δ T (C°)
Δ P (%)
25th
50th
75th
25th
50th
75th
A1FI, A1T, A1B, A2, B2 and B1 1.4 1.7 1.9 -15.1 -6.5 2.3
A1B 1.6 1.8 2.0 -17.8 -8.7 -0.4
A2 1.5 1.7 1.8 -17.5 -7.9 1.0
B2 1.3 1.5 1.6 -11.4 -3.9 2.8
A1B, A2 and B2 1.5 1.6 1.8 -17.4 -6.8 2.4
Four climate change scenarios were selected for application in SWAT, based on an analysis of
the total variability in change factors contained in the previous table. Due to the small variation
in change signals for temperature, and in order to facilitate the comparison of the effects of
different change factors for precipitation, a single mean change factor for temperature has been
used for all SWAT impact scenarios. The selected scenarios for the simulations are presented in
Table A.6. It should be noted that annual average temperature and precipitation for the basin in
1981–1999 and 1996–2006 are very close.
Table A.6. Selected climate change scenarios
Scenario Δ T (C°) Δ P (%)
Scenario 1 +1.64o C 0
Scenario 2 +1.64o C -17.8
Scenario 3 +1.64o C -3.9
Scenario 4 +1.64o C +2.8
Modeling of climate change scenarios
SWAT includes an option that allows the applyication of change factors directly to the input time
series of precipitation and temperature, and as such facilitates the analysis of climate change
impacts. This rather simple methodology was used to evaluate the hydrological and
sedimentation impacts of future climate scenarios, and consisted of adjusting the time series with
the following equations:
100
change 1 x P P
pcp
baseline day,scenario day,
81
Where Pday is the precipitation that falls in a particular location on a given day, and changepcp is
the percentage of estimated change for the rainfall.
tmpbaseline max,scenario max, changeT T
tmpbaseline min,scenario min, change T T
Where Tmax is the daily maximum temperature, Tmin is the minimum daily temperature and
changetmp is the estimated change in temperature. In this particular case, the change terms are
annual. Although it is possible to estimate the changes from month to month so seasonal
variation can be taken into account, this was not done given the mismatch in the spatial
resolution of MAGICC/SCENGEN and the spatial resolution of the pseudo weather stations.
The abovementioned changes in temperature and precipitation, in addition to the corresponding
changes in carbon dioxide (CO2), were added in the Edit SWAT Sub-basin parameters dialog.
Once these changes were introduced, SWAT was able to simulate the sediment loading and
surface runoff, considering climate change until 2050.
SWAT includes an option that makes it possible to apply changes in mean temperature and
precipitation in degrees (°C) and percentages (%) directly to the input time series. This option is
found in the sub-basin data of the Edit SWAT Input menu. Once these changes are introduced,
SWAT is able to project the sediment loading, water quality and surface runoff to 2050 with
regard to the baseline (1996–2006). Carbon dioxide (CO2) projected to 2050 is also implemented
in the hydrological modeling.
Hydrological modeling evaluation
Simple evaluation procedures were run to evaluate the hydrological performance of the model.
Two sub-basins inside the Lake Cocibolca watershed were selected for the evaluation: the
Mayales sub-basin and the Oyate/Dolores sub-basin. Their location is shown in Figure A.7. Both
sub-basins are located in the northeastern part of the watershed. The first sub-basin has an
extension of 1,200 km2 and all the surface and lateral runoff and groundwater flow into Lake
Cocibolca. The second sub-basin extends over an area of about 870 km2 and its surface runoff
and groundwater also flow into the lake. The monthly simulated flows were compared with the
monthly observed discharges from two limnigraph stations located at the sub-basin outlets.
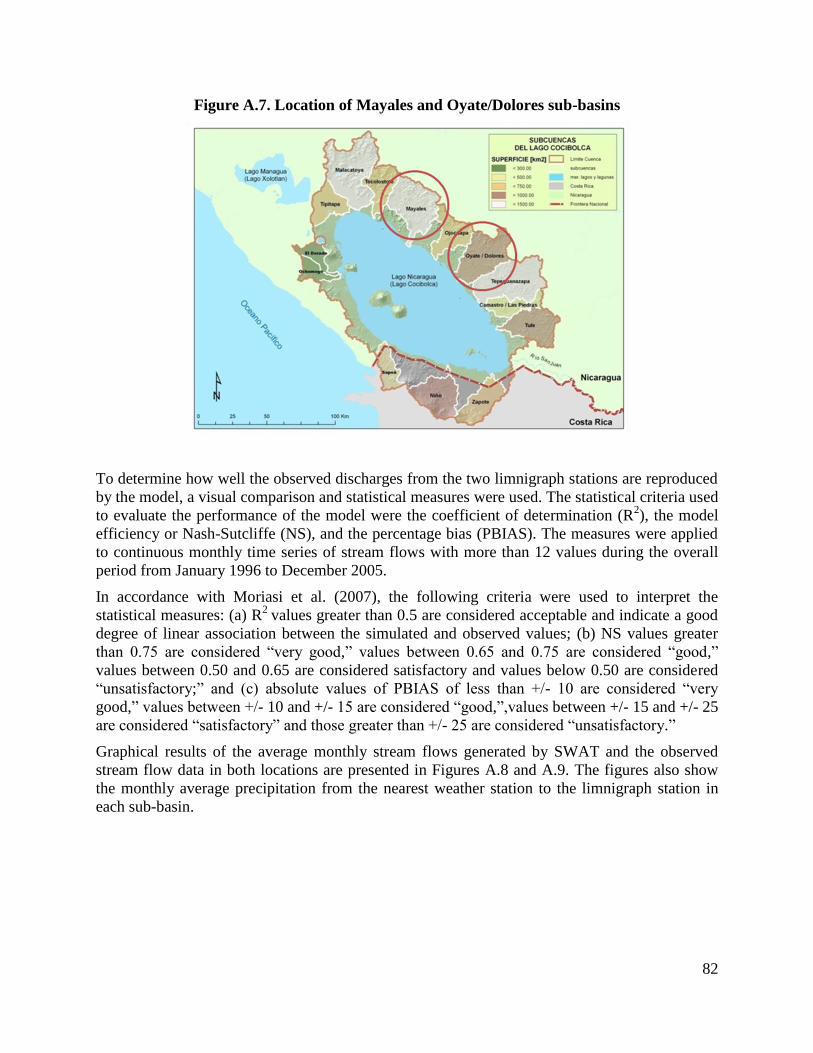
82
Figure A.7. Location of Mayales and Oyate/Dolores sub-basins
To determine how well the observed discharges from the two limnigraph stations are reproduced
by the model, a visual comparison and statistical measures were used. The statistical criteria used
to evaluate the performance of the model were the coefficient of determination (R2), the model
efficiency or Nash-Sutcliffe (NS), and the percentage bias (PBIAS). The measures were applied
to continuous monthly time series of stream flows with more than 12 values during the overall
period from January 1996 to December 2005.
In accordance with Moriasi et al. (2007), the following criteria were used to interpret the
statistical measures: (a) R2
values greater than 0.5 are considered acceptable and indicate a good
degree of linear association between the simulated and observed values; (b) NS values greater
than 0.75 are considered “very good,” values between 0.65 and 0.75 are considered “good,”
values between 0.50 and 0.65 are considered satisfactory and values below 0.50 are considered
“unsatisfactory;” and (c) absolute values of PBIAS of less than +/- 10 are considered “very
good,” values between +/- 10 and +/- 15 are considered “good,”,values between +/- 15 and +/- 25
are considered “satisfactory” and those greater than +/- 25 are considered “unsatisfactory.”
Graphical results of the average monthly stream flows generated by SWAT and the observed
stream flow data in both locations are presented in Figures A.8 and A.9. The figures also show
the monthly average precipitation from the nearest weather station to the limnigraph station in
each sub-basin.
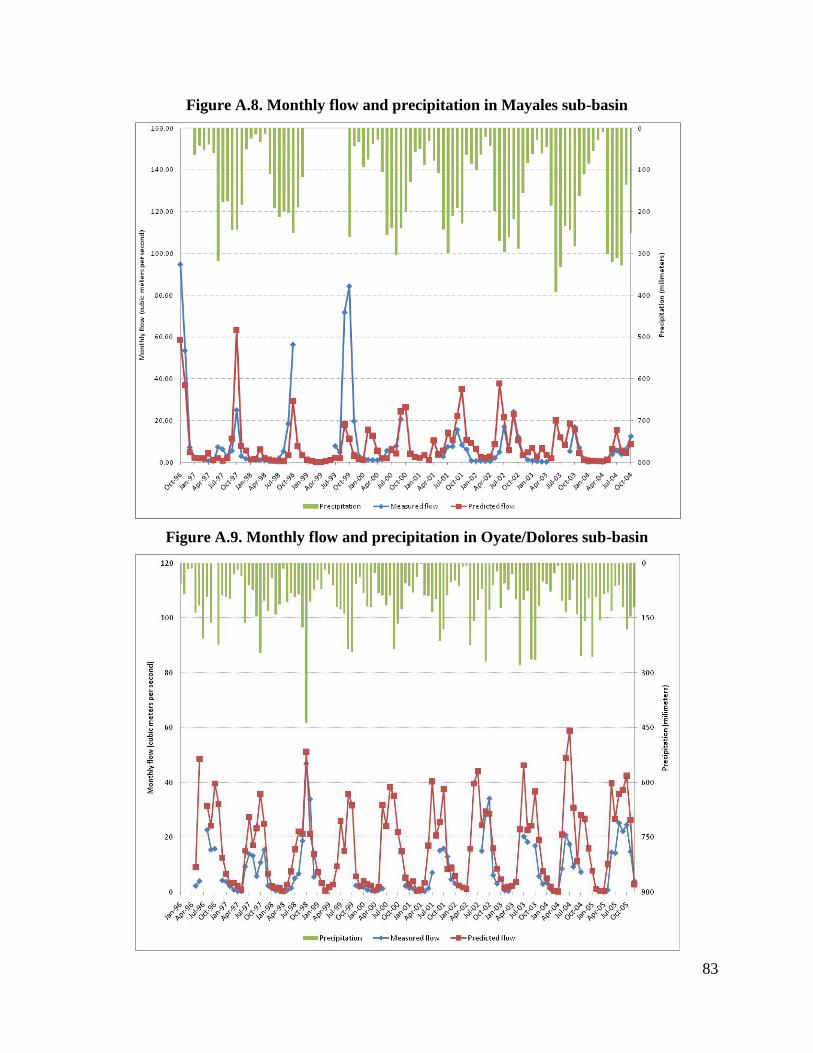
83
Figure A.8. Monthly flow and precipitation in Mayales sub-basin
Figure A.9. Monthly flow and precipitation in Oyate/Dolores sub-basin
84
Table A.7. Statistical indicators of model performance in two sub-basins
Sub-Basin/Period R2 EF PBIAS
Mayales Sub-Basin
- Oct’96-Oct’98 (25)
- Jul’99-Sep’00 (15)
- Jul’01- Sept’03 (23)
0.68
0.20
0.36
0.67
0.06
-1.43
17.1
54.2
109.4
Oyate/Dolores Sub-Basin
- Dec’96-Dec’98 (25)
- Oct’03-Oct’04 (13)
0.68
0.83
0.33
-0.64
-67.9
-156.2
Note: Number in parenthesis indicates the size of the sample.
From the results shown in Table A.7 and a closer look at Figure A.8, it can be seen that the
model tends to represent relatively well the intra- and inter-annual variability of stream flow
values for October 1996–October 1998 in the Mayales sub-basin. Poorer results are obtained for
the other two periods: July 1999–September 2000 and July 2001–September 2003. Large
discrepancies are observed in some individual years. Possible explanations for the observed
discrepancies are: inadequate representation of spatial precipitation by the model, limited number
of measurements at high flows affecting the derivation of the rating curves, no changes in the
rating curves after peak flow events that affect the cross-section geometry of the river, among
others.
On the other hand, from the results in Table A.7 and Figure A.9, it can be seen that the model
tends to overestimate stream flows. However, a high degree of collinearity is observed between
simulated and observed data. Possible explanations for the differences between the simulated and
observed flows are: the presence of upstream hydraulic structures (for example, dam/reservoir)
or diversions upstream from the limnigraph station, which may not be represented by SWAT due
to lack of data, rating curves not properly calibrated, etc. A more detailed look at Figure A.8
shows that the limnigraph station at Oyate/Dolores is not recording the increased flow during the
storm events that took place in February 1998, March 2000, February 2003 and March 2005.
Although a detailed calibration and validation process could improve the results of the model, in
this study such a process could not be performed due to the lack of a sufficiently long time series
of observed flows, at sufficient locations in space.
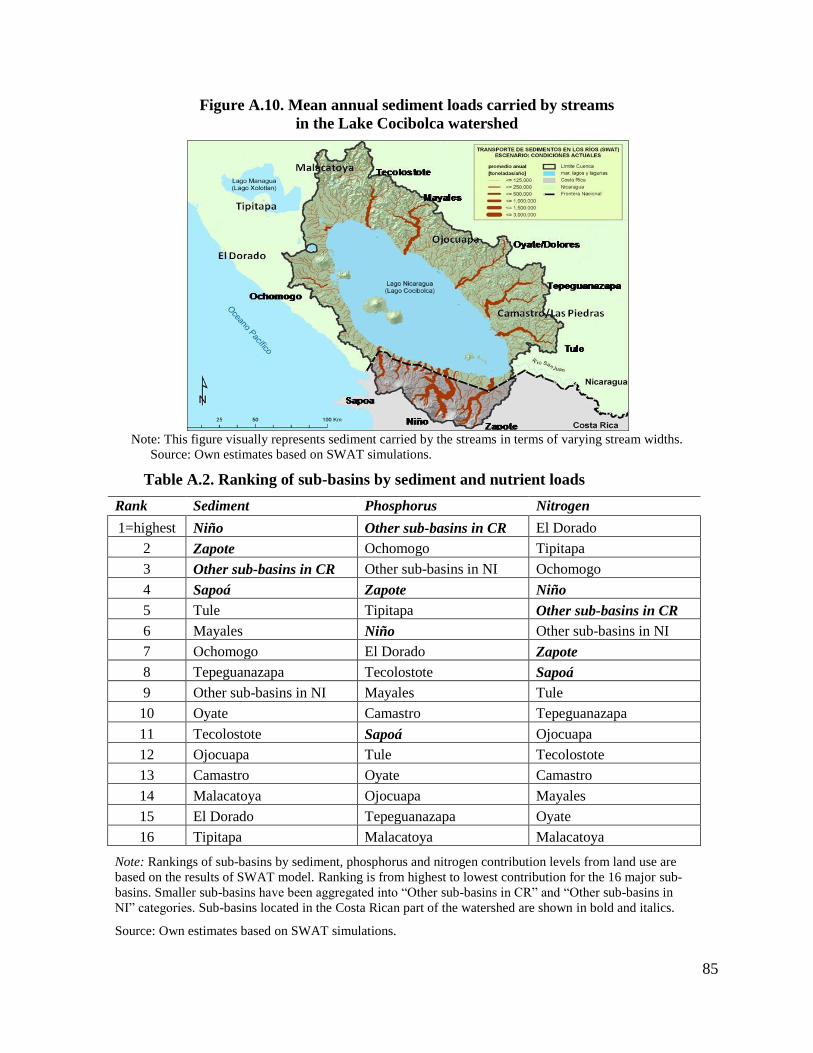
85
Figure A.10. Mean annual sediment loads carried by streams
in the Lake Cocibolca watershed
Note: This figure visually represents sediment carried by the streams in terms of varying stream widths.
Source: Own estimates based on SWAT simulations.
Table A.2. Ranking of sub-basins by sediment and nutrient loads
Rank Sediment Phosphorus Nitrogen
1=highest Niño Other sub-basins in CR El Dorado
2 Zapote Ochomogo Tipitapa
3 Other sub-basins in CR Other sub-basins in NI Ochomogo
4 Sapoá Zapote Niño
5 Tule Tipitapa Other sub-basins in CR
6 Mayales Niño Other sub-basins in NI
7 Ochomogo El Dorado Zapote
8 Tepeguanazapa Tecolostote Sapoá
9 Other sub-basins in NI Mayales Tule
10 Oyate Camastro Tepeguanazapa
11 Tecolostote Sapoá Ojocuapa
12 Ojocuapa Tule Tecolostote
13 Camastro Oyate Camastro
14 Malacatoya Ojocuapa Mayales
15 El Dorado Tepeguanazapa Oyate
16 Tipitapa Malacatoya Malacatoya
Note: Rankings of sub-basins by sediment, phosphorus and nitrogen contribution levels from land use are
based on the results of SWAT model. Ranking is from highest to lowest contribution for the 16 major sub-
basins. Smaller sub-basins have been aggregated into “Other sub-basins in CR” and “Other sub-basins in
NI” categories. Sub-basins located in the Costa Rican part of the watershed are shown in bold and italics.
Source: Own estimates based on SWAT simulations.
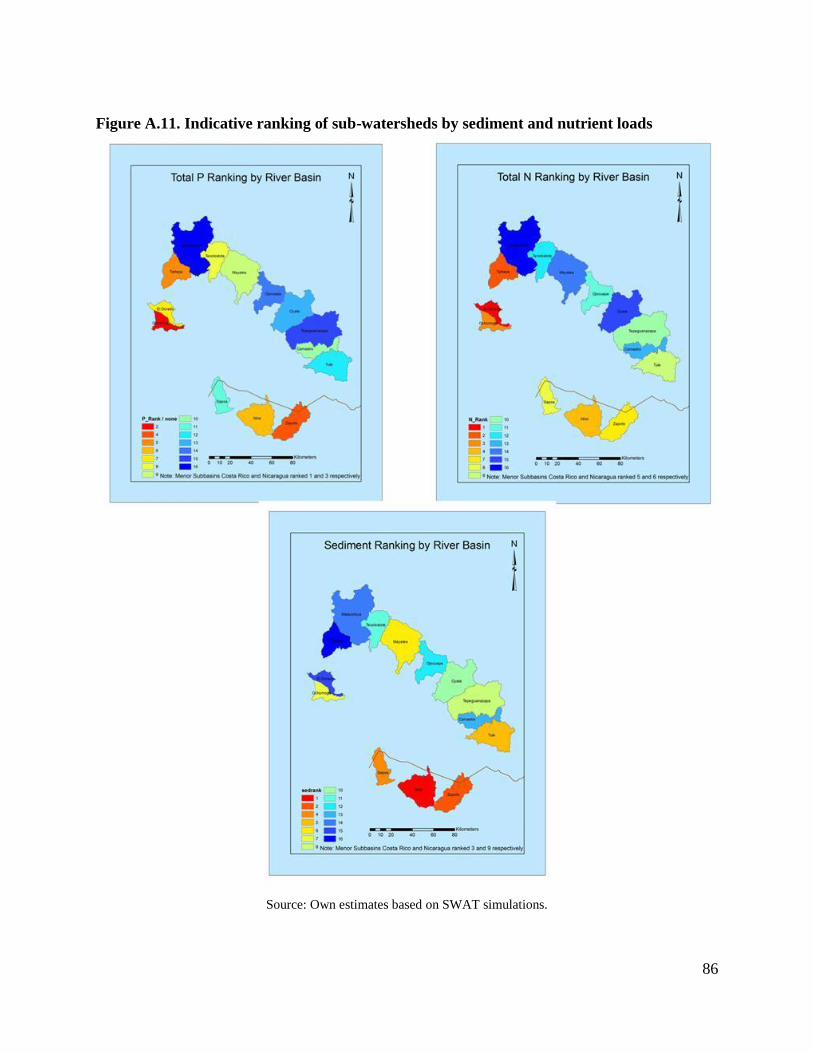
86
Figure A.11. Indicative ranking of sub-watersheds by sediment and nutrient loads
Source: Own estimates based on SWAT simulations.
87
Annex B. Estimation of nutrient load from tilapia farming in Lake Cocibolca
On Lake Cocibolca, near Ometepe Island, there is a commercial project dedicated to harvesting
tilapia in floating cages. Several stakeholders in Nicaraguan perceive a strong negative impact
associated with this activity on the quality of the Lake Cocibolca ecosystem. For this reason, and
in the context of the overall quantification of nutrient loads to the lake, we considered it relevant
to quantify the nutrient loads of this particular activity.
Tilapia are aquaculture is fed a high-protein diet, around 28 to 30 percent of the total food weight
(Al Hafedh 1999). Nitrogen (N) accounts for 4.5 to 5.8 percent of this diet. The phosphorous (P)
requirement is lower than 0.9 percent in the diet of Oreochromis niloticus, and usually ranges
from 0.5 to 0.8 percent (Watanabe, Takeuchi, Murakami and Ogino 1980) (Boyd C. 2005).
According to OSPESCA (2006), tilapia raised in this fish farm on Lake Cocibolca exhibit a
conversion factor of 1.5, meaning that during the feeding phase 1.5 kg of fish food is required to
produce a 1 kg increment in tilapia biomass. This value is within the ranges of the average values
found in specialized literature (e.g., Boyd C. 2005) and it corresponds to the use of a high-yield
food source.
If we assume an annual production of 350 tons of tilapia (OSPESCA 2006), with a feeding factor
of 1.5, this activity is releasing about 525 tons of food per year into the aquatic system.
Assuming this food has an estimated 5.2 percent of N and 0.7 percent of P, the net load of
nutrients N and P released into the aquatic ecosystem would be 27.3 and 3.7 tons/year
respectively. Obviously, an important part is eliminated with the harvesting of adult tilapia.
In another study on nutrient loads and the efficiency of tilapia farming in floating cages in the
Philippines (Vista, Norris, Lupi and Bernsten 2006), the authors applied a factor for nutrient loss
of 76.56 percent and 85 percent for N and P, respectively, using data from Beveridge and
Phillips (1993) and Phillips et al. (1994). When these factors are applied to the study case of
Lake Cocibolca, we obtain a net nutrient load of 20.9 Tm of N and 3.1 tons of P, for a
hypothetical annual yield of 3,000 tons of tilapia (this figure is based on current projections from
the company, as mentioned in the OSPESCA report).32
According to estimates by Boyd and Green (1998), tilapia produce 26.5 percent of dry matter; of
this dry matter 8.5 percent is N and 3.0 percent is P. Using this information, it is possible to
calculate the proportion of N and P nutrients introduced in the ecosystem that are removed
through tilapia harvesting (Boyd 2005): An annual yield of 350 tons would remove 7.9 and 2.8
tons of N and P, respectively, through the tilapia biomass. In this case, the annual net load of
nutrients in the ecosystem would be 19.4 and 0.9 tons of N and P, respectively. In the case of an
annual tilapia production of 3,000 tons, these values would increase to 166.4 tons of N and 7.7
tons of P.
In another study, and using a different method (SUMAFISH 2003), the author estimated a net
nutrient load in the ecosystem of 112 kg N and 33 Kg of P for each Tm of red tilapia harvested in
floating cages in Thailand. If this method is used to provide an alternative estimate of the
potential nutrient load of total N and P in Lake Cocibolca, we obtain a net load of 39.2 tons of N
32
It is worthwhile to mention that, more recently, article 97 of the new General Law of National Waters bans the
introduction and farming of invasive exotic species in Lake Cocibolca.
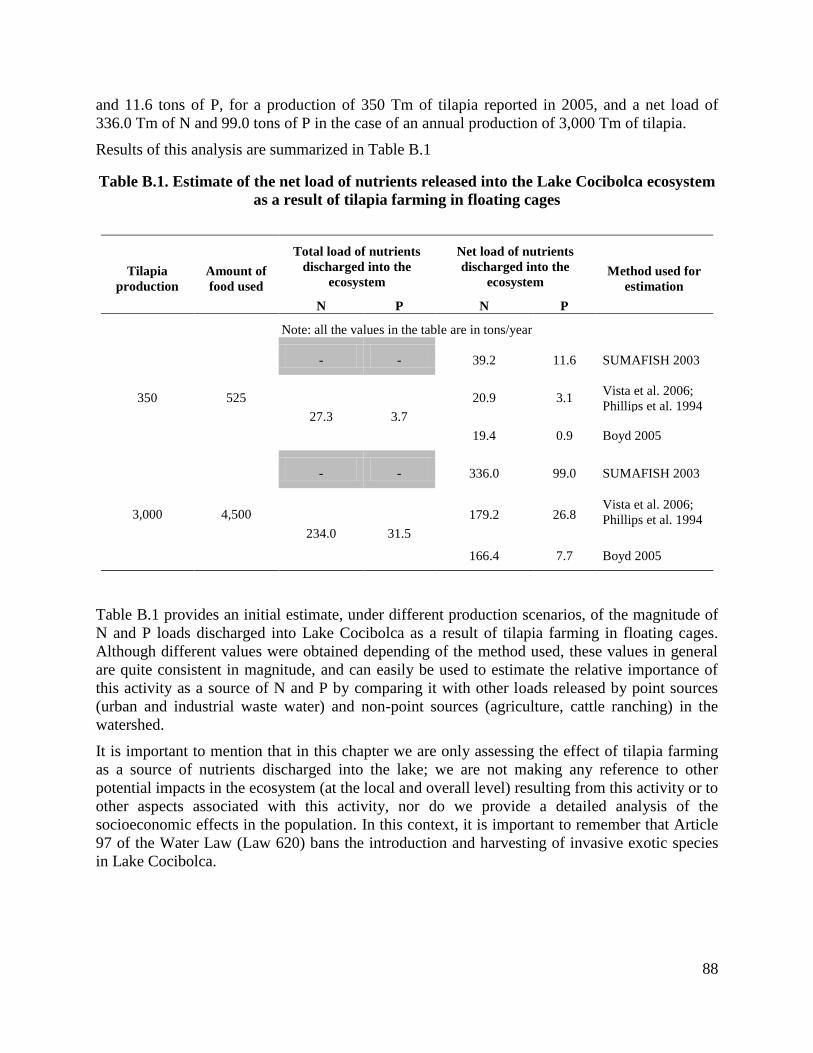
88
and 11.6 tons of P, for a production of 350 Tm of tilapia reported in 2005, and a net load of
336.0 Tm of N and 99.0 tons of P in the case of an annual production of 3,000 Tm of tilapia.
Results of this analysis are summarized in Table B.1
Table B.1. Estimate of the net load of nutrients released into the Lake Cocibolca ecosystem
as a result of tilapia farming in floating cages
Tilapia
production
Amount of
food used
Total load of nutrients
discharged into the
ecosystem
Net load of nutrients
discharged into the
ecosystem Method used for
estimation
N P N P
Note: all the values in the table are in tons/year
350 525
- - 39.2 11.6 SUMAFISH 2003
27.3 3.7
20.9 3.1 Vista et al. 2006;
Phillips et al. 1994
Beveridge &
Phillips; 19.4 0.9 Boyd 2005
3,000 4,500
- - 336.0 99.0 SUMAFISH 2003
234.0 31.5
179.2 26.8 Vista et al. 2006;
Phillips et al. 1994
Beveridge &
Phillips; 166.4 7.7 Boyd 2005
Table B.1 provides an initial estimate, under different production scenarios, of the magnitude of
N and P loads discharged into Lake Cocibolca as a result of tilapia farming in floating cages.
Although different values were obtained depending of the method used, these values in general
are quite consistent in magnitude, and can easily be used to estimate the relative importance of
this activity as a source of N and P by comparing it with other loads released by point sources
(urban and industrial waste water) and non-point sources (agriculture, cattle ranching) in the
watershed.
It is important to mention that in this chapter we are only assessing the effect of tilapia farming
as a source of nutrients discharged into the lake; we are not making any reference to other
potential impacts in the ecosystem (at the local and overall level) resulting from this activity or to
other aspects associated with this activity, nor do we provide a detailed analysis of the
socioeconomic effects in the population. In this context, it is important to remember that Article
97 of the Water Law (Law 620) bans the introduction and harvesting of invasive exotic species
in Lake Cocibolca.
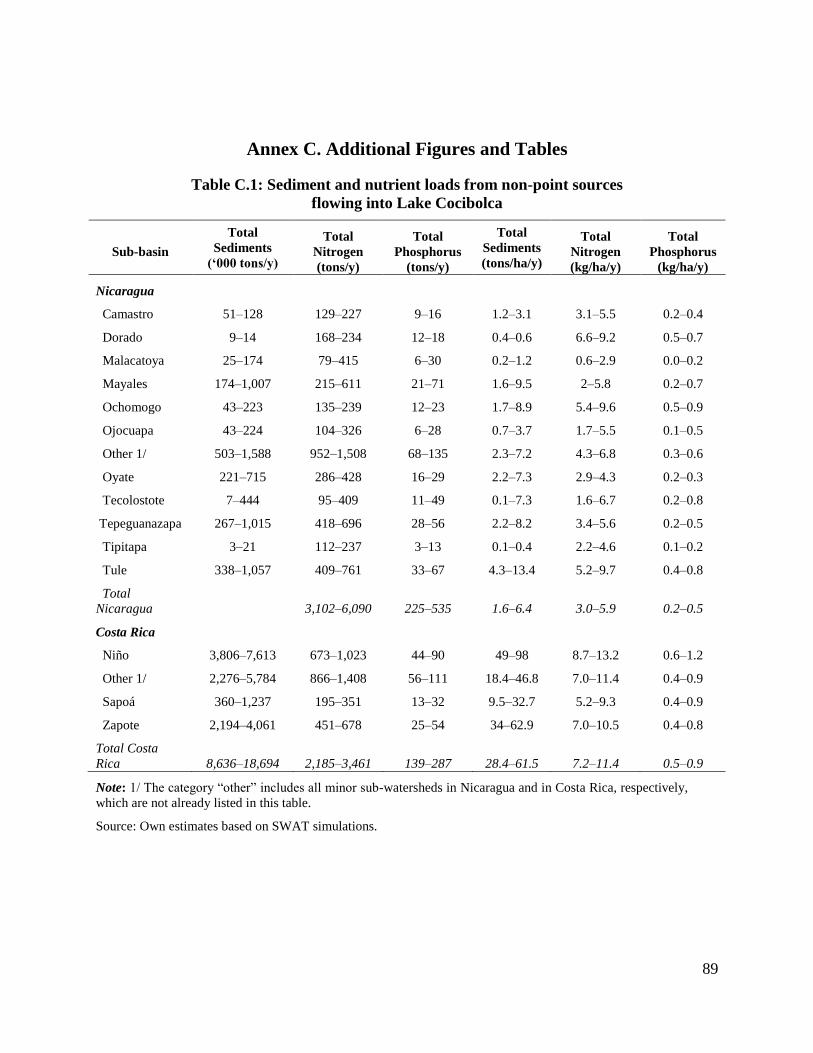
89
Annex C. Additional Figures and Tables
Table C.1: Sediment and nutrient loads from non-point sources
flowing into Lake Cocibolca
Sub-basin
Total
Sediments
(‘000 tons/y)
Total
Nitrogen
(tons/y)
Total
Phosphorus
(tons/y)
Total
Sediments
(tons/ha/y)
Total
Nitrogen
(kg/ha/y)
Total
Phosphorus
(kg/ha/y)
Nicaragua
Camastro 51–128 129–227 9–16 1.2–3.1 3.1–5.5 0.2–0.4
Dorado 9–14 168–234 12–18 0.4–0.6 6.6–9.2 0.5–0.7
Malacatoya 25–174 79–415 6–30 0.2–1.2 0.6–2.9 0.0–0.2
Mayales 174–1,007 215–611 21–71 1.6–9.5 2–5.8 0.2–0.7
Ochomogo 43–223 135–239 12–23 1.7–8.9 5.4–9.6 0.5–0.9
Ojocuapa 43–224 104–326 6–28 0.7–3.7 1.7–5.5 0.1–0.5
Other 1/ 503–1,588 952–1,508 68–135 2.3–7.2 4.3–6.8 0.3–0.6
Oyate 221–715 286–428 16–29 2.2–7.3 2.9–4.3 0.2–0.3
Tecolostote 7–444 95–409 11–49 0.1–7.3 1.6–6.7 0.2–0.8
Tepeguanazapa 267–1,015 418–696 28–56 2.2–8.2 3.4–5.6 0.2–0.5
Tipitapa 3–21 112–237 3–13 0.1–0.4 2.2–4.6 0.1–0.2
Tule 338–1,057 409–761 33–67 4.3–13.4 5.2–9.7 0.4–0.8
Total
Nicaragua
3,102–6,090 225–535 1.6–6.4 3.0–5.9 0.2–0.5
Costa Rica
Niño 3,806–7,613 673–1,023 44–90 49–98 8.7–13.2 0.6–1.2
Other 1/ 2,276–5,784 866–1,408 56–111 18.4–46.8 7.0–11.4 0.4–0.9
Sapoá 360–1,237 195–351 13–32 9.5–32.7 5.2–9.3 0.4–0.9
Zapote 2,194–4,061 451–678 25–54 34–62.9 7.0–10.5 0.4–0.8
Total Costa
Rica 8,636–18,694 2,185–3,461 139–287 28.4–61.5 7.2–11.4 0.5–0.9
Note: 1/ The category “other” includes all minor sub-watersheds in Nicaragua and in Costa Rica, respectively,
which are not already listed in this table.
Source: Own estimates based on SWAT simulations.
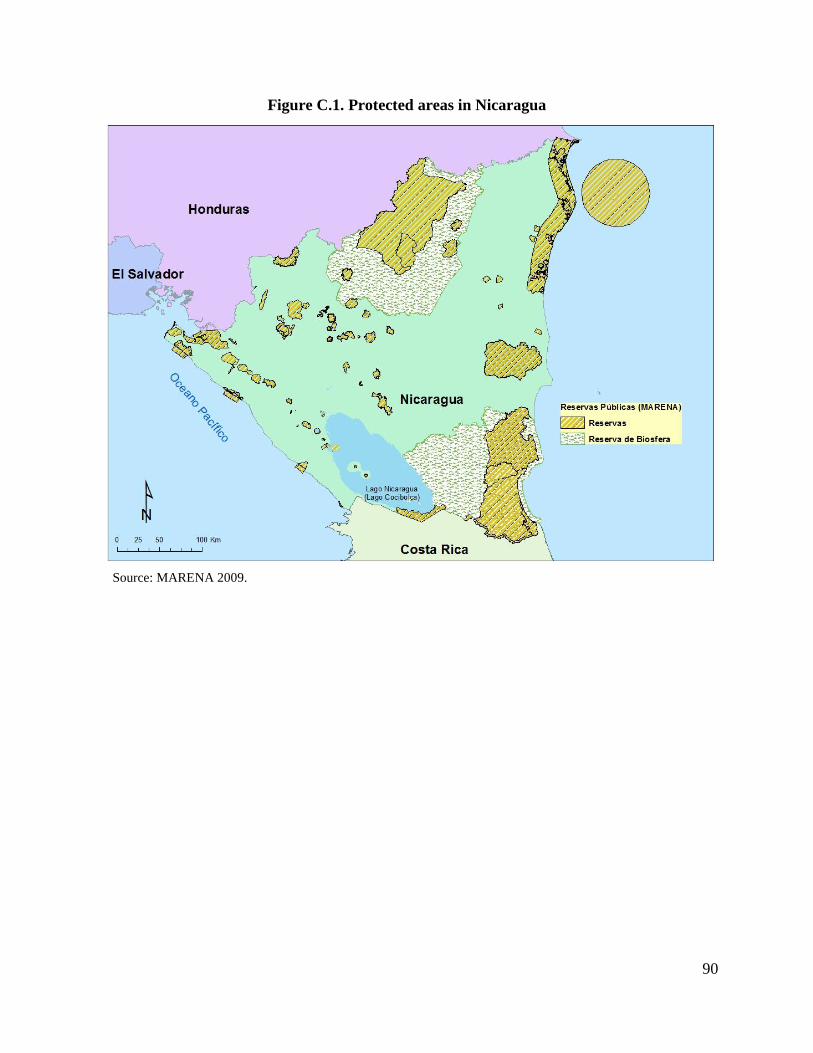
90
Figure C.1. Protected areas in Nicaragua
Source: MARENA 2009.
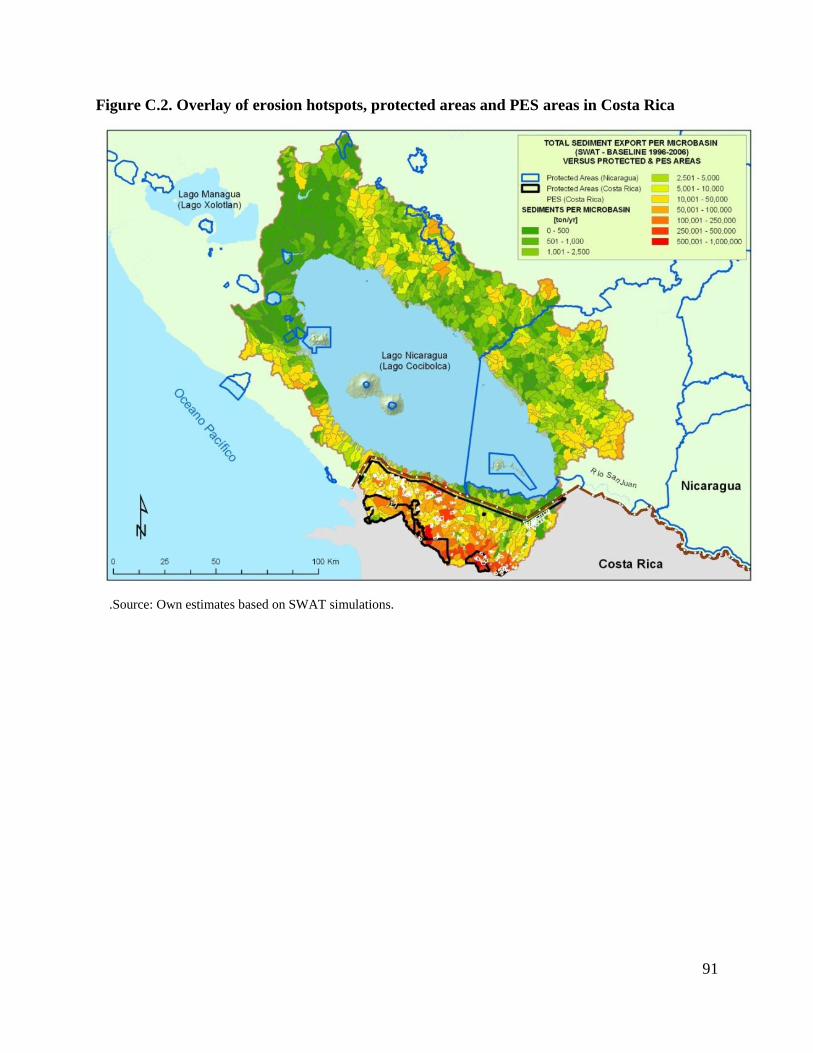
91
Figure C.2. Overlay of erosion hotspots, protected areas and PES areas in Costa Rica
.Source: Own estimates based on SWAT simulations.