Our children, our choice: priorities for policy - … · Our children, our choice: priorities for...
134
A Child Poverty Action Group Monograph Edited by M. Claire Dale, Mike O’Brien and Susan St John Our children, our choice: priorities for policy
Transcript of Our children, our choice: priorities for policy - … · Our children, our choice: priorities for...
A Child Poverty Action Group Monograph
Edited by M. Claire Dale, Mike O’Brien and Susan St John
Our children, our choice: priorities for policy
About Child Poverty Action GroupChild Poverty Action Group (CPAG) is an independent charity working to eliminate child poverty in New Zealand through research, education and advocacy. CPAG believes that New Zealand’s high rate of child poverty is not the result of economic necessity, but is due to policy neglect and a flawed ideological emphasis on economic incentives. Through research, CPAG highlights the position of tens of thousands of New Zealand children, and promotes public policies that address the underlying causes of the poverty they live in.
If you would like to support CPAG’s work, please visit our website: www.cpag.org.nz
About the EditorsThis series is edited by M.Claire Dale, Mike O’Brien and Susan St John.
Dr M.Claire Dale is Research Fellow with the Retirement Policy and Research Centre, University of Auckland, and a researcher and policy analyst for Child Poverty Action Group.
Dr Mike O’Brien is Associate Professor, School of Counselling Human Services and Social Work, University of Auckland, and a member of the Management Committee of Child Poverty Action Group.
Dr Susan St John, QSO, is Associate Professor of Economics, University of Auckland, co-director of the Retirement Policy and Research Centre, and a member of the Management Committee of Child Poverty Action Group.
Each topic-based part of the series is authored by experts in the field. The series would not be possible without their contributions and we thank them on behalf of Child Poverty Action Group.
Disclaimer: This publication is intended to provide accurate and adequate information on the matters contained herein and every effort has been made to ensure its accuracy. However, it has been written, edited and published and made available to all persons and entities strictly on the basis that its author, editors and publishers are fully excluded from any liability or responsibility by all or any of them in any way to any person or entity for anything done or omitted to be done by any person or entity in reliance, whether totally or partially, on the contents of this publication for any purpose whatsoever.
Our children, our choice: priorities for policy. ISBN: 978-0-9941105-5-8© September 2014Child Poverty Action Group Inc.PO Box 5611 Wellesley StAuckland 1141 New Zealand
www.cpag.org.nz
1
ContentsIntroduction to the series ........................................................................................................................................................ 3
Chapter summaries ......................................................................................................................................................... 7
Introductory recommendations: ..............................................................................................................................12
PART ONE: Child poverty and health .................................................................................................................................13
The context of child poverty and health in New Zealand ..............................................................................13
New Zealand compared with other OECD countries .......................................................................................15
Child health outcomes in New Zealand affected by poverty........................................................................16
Material deprivation for New Zealand children ..................................................................................................17
Some gains.........................................................................................................................................................................19
Areas of concern ........................................................................................................................................................... 20
Maori children’s high rates of disease .................................................................................................................. 25
Pasifika children’s high rates of disease .............................................................................................................. 26
Antenatal care .................................................................................................................................................................27
Financial barriers to accessing health care........................................................................................................ 28
Housing ............................................................................................................................................................................. 30
Nutrition .............................................................................................................................................................................31
Youth health .....................................................................................................................................................................32
Recent reports and recommendations ...............................................................................................................33
The way forward ............................................................................................................................................................ 36
Full list of recommendations .....................................................................................................................................37
Audio-visual resources .................................................................................................................................................37
PART TWO: Early childhood care and education, and child poverty ................................................................. 38
Overview ........................................................................................................................................................................... 38
High quality, culturally responsive care in a super-diverse society ......................................................... 42
Valuing children’s language, culture and identity .......................................................................................... 44
Barriers to participation .............................................................................................................................................48
Recognising rights of beneficiaries and their children ...................................................................................51
Reliance on for-profit sector for ECCE provision ............................................................................................. 52
Increased provision of home-based ECCE .......................................................................................................... 53
Conclusion ........................................................................................................................................................................ 55
Full list of recommendations: ..................................................................................................................................56
Audio-visual resources .................................................................................................................................................57
2
PART THREE: Compulsory schooling and child poverty .........................................................................................58
Overview ........................................................................................................................................................................... 58
Socioeconomic disadvantage ....................................................................................................................................61
A schooling system that values children ............................................................................................................. 62
Decile funding ................................................................................................................................................................. 65
An equitable schooling system .................................................................................................................................67
Conclusion ........................................................................................................................................................................69
Full list of recommendations ................................................................................................................................... 70
Audio-visual resources ................................................................................................................................................ 70
PART FOUR: Housing market changes and their impact on children .................................................................71
Overview .............................................................................................................................................................................71
New Zealand’s children and housing ......................................................................................................................71
New Zealand’s house prices ......................................................................................................................................73
Children and their households ................................................................................................................................75
Social housing reforms ................................................................................................................................................77
Housing occupancy and overcrowding ................................................................................................................80
Housing tenure change ..............................................................................................................................................84
Housing affordability ....................................................................................................................................................88
Conclusion ........................................................................................................................................................................ 92
Full list of recommendations .................................................................................................................................... 94
Audio-visual resources ................................................................................................................................................ 94
Appendices .......................................................................................................................................................................95
PART FIVE: Adequate incomes to address child poverty ........................................................................................ 101
Overview .......................................................................................................................................................................... 101
Incomes and child poverty .......................................................................................................................................103
Past and present social assistance and children’s wellbeing .....................................................................104
What does it take to close the gap? ................................................................................................................... 108
Working for Families..................................................................................................................................................... 112
A way forward ................................................................................................................................................................120
Is a universal payment for children the answer? ........................................................................................... 123
Unintended consequences of bad policy ........................................................................................................... 124
Conclusion ....................................................................................................................................................................... 125
Full list of recommendations ................................................................................................................................... 126
Audiovisual resources ................................................................................................................................................ 126
Appendix: Australia ...................................................................................................................................................... 127
Concluding comments and recommendations.......................................................................................................... 128
3
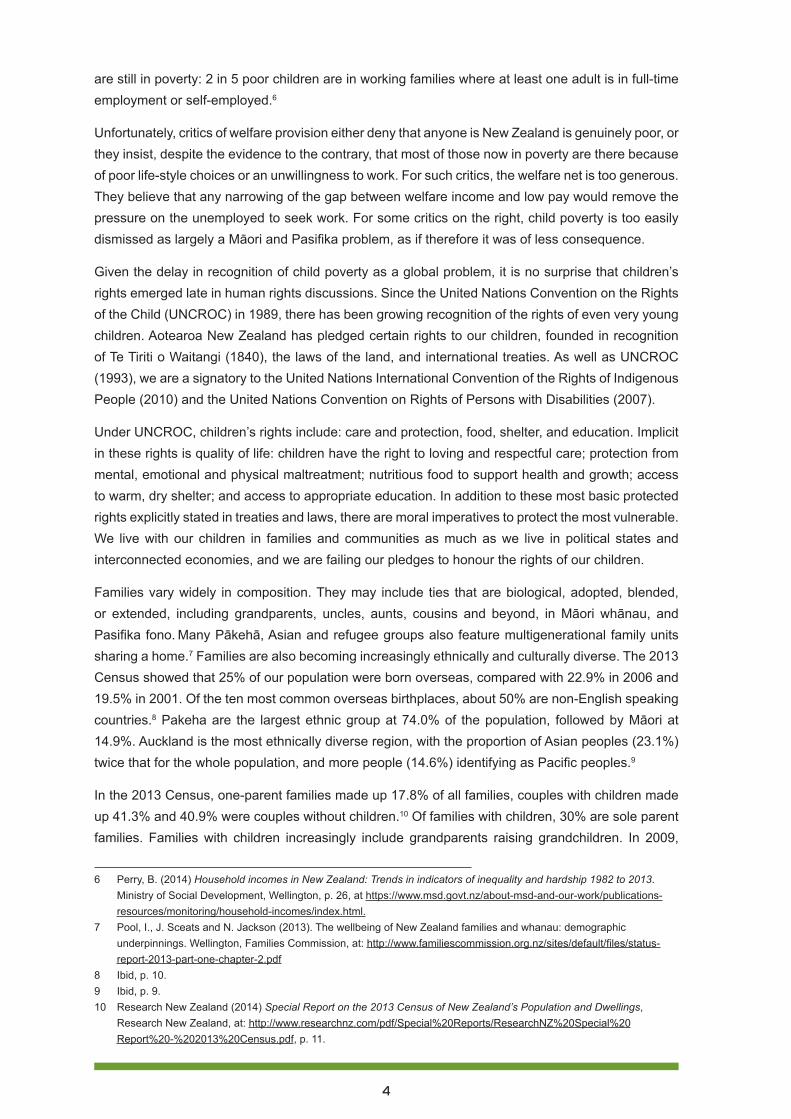
Introduction to the seriesPeters and Besley (2014) write of child poverty:1
Too often western countries have dismissed such as issues within the developing world. However, the alarming trend is that child poverty levels in advanced economies have also increased markedly with clear consequences for the health and cognitive development of children, the huge social costs associated with long-term unemployment and poverty, the effects on educational achievement and the prospects of future citizenship.
In the advanced economy of Aotearoa New Zealand in 2014, child poverty is now more entrenched and difficult to address than when Child Poverty Action Group published Left further behind in 2011.2 Since then, the long recession after the global financial crisis has seen many families losing their employment, or managing on reduced work hours, and depleting their remaining resources. The situation for families in receipt of a benefit has worsened with the imposition of sanctions reducing benefit incomes by 50% or more if strict and often unreasonable requirements are not met.3 The full benefits of the ‘Working for Families’ (WFF) package are still only available to those families who meet a work-test and are not on any benefit, thus widening the gap between families ‘in work’ and others, between those seen as ‘deserving’ and the ‘undeserving’.
The evidence is overwhelming: in 2012 around 285,000 of our children (27% of all children) were under the 60% After Housing Costs relative poverty line used by the Ministry of Social Development (MSD).Reflecting the recovery, figures were a little better in 2013 but still far too high at 24% or 260,000 children. For 3 out of 5 of those children, poverty persists over at least seven years,4 and all the evidence shows that the longer the period in poverty, the greater the harm.5
Since the 1990s, the Government’s social policy has been driven by a focus on paid work, and has increasingly ignored the vital and time-consuming work of parenting. When parents for whatever reason cannot meet norms of paid hours and require state assistance, a discourse emerges of ‘benefit dependency’ in which parents are blamed for their poverty. Such narratives generate support for punitive sanctions and harsh conditions around benefit receipt, yet the vast majority of people currently poor are poor in spite of their own best efforts. They are poor because welfare payments are low and limited, and the welfare system does not allow them to supplement their benefits in meaningful ways in paid employment. They are poor because involuntary unemployment has eroded their assets and their capabilities. They may be poor because employment is so low-paid that they
1 Peters and Besley (2014) Child Poverty, Globalization and Human Rights Educational Philosophy and Theory. Special Issue: Children in Crisis: Child Poverty, Education and Social Justice, Vol46, Issue9, http://www.tandfonline.com/doi/full/10.1080/00131857.2014.935280.
2 Dale, M.C., O’Brien, M. and St John, S. (Eds) (2011) Left Further Behind: how policies fail the poorest children in New Zealand, Child Poverty Action Group Inc., http://www.cpag.org.nz/assets/Publications/121204%20LFB%20CPAG%202011.pdf
3 Wynd,D (2013). Benefit sanctions: creating an invisible underclass of children? Child Poverty Action Group, at http://www.cpag.org.nz/assets/Backgrounders/2-0%2028509%20Benefit%20Sanctions%20Report%20Sept%202013.pdf.
4 Craig E., Reddington A., Wicken A., Oben G., & Simpson J. (2013) Child Poverty Monitor 2013 Technical Report (Updated 2014). Dunedin. NZ Child & Youth Epidemiology Service, University of Otago. http://www.nzchildren.co.nz/document_downloads/2013%20Child%20Poverty%20Monitor%20Technical%20Report%20MASTER.pdf.
5 Mayer, S. (2002) The Influence of Parental Income on Children’s Outcomes, Ministry of Social Development, p. 6. at https://www.msd.govt.nz/documents/about-msd-and-our-work/publications-resources/research/influence-parental-income/influence-of-parental-income.pdf.
4
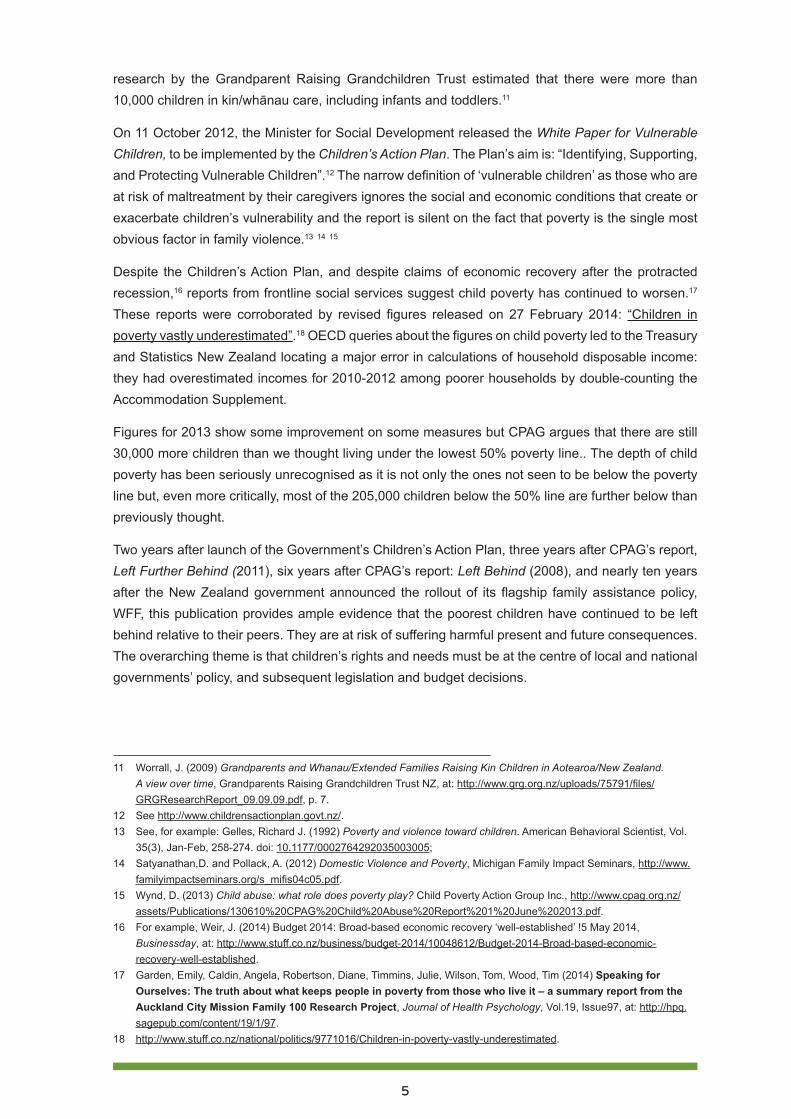
are still in poverty: 2 in 5 poor children are in working families where at least one adult is in full-time employment or self-employed.6
Unfortunately, critics of welfare provision either deny that anyone is New Zealand is genuinely poor, or they insist, despite the evidence to the contrary, that most of those now in poverty are there because of poor life-style choices or an unwillingness to work. For such critics, the welfare net is too generous. They believe that any narrowing of the gap between welfare income and low pay would remove the pressure on the unemployed to seek work. For some critics on the right, child poverty is too easily dismissed as largely a Māori and Pasifika problem, as if therefore it was of less consequence.
Given the delay in recognition of child poverty as a global problem, it is no surprise that children’s rights emerged late in human rights discussions. Since the United Nations Convention on the Rights of the Child (UNCROC) in 1989, there has been growing recognition of the rights of even very young children. Aotearoa New Zealand has pledged certain rights to our children, founded in recognition of Te Tiriti o Waitangi (1840), the laws of the land, and international treaties. As well as UNCROC (1993), we are a signatory to the United Nations International Convention of the Rights of Indigenous People (2010) and the United Nations Convention on Rights of Persons with Disabilities (2007).
Under UNCROC, children’s rights include: care and protection, food, shelter, and education. Implicit in these rights is quality of life: children have the right to loving and respectful care; protection from mental, emotional and physical maltreatment; nutritious food to support health and growth; access to warm, dry shelter; and access to appropriate education. In addition to these most basic protected rights explicitly stated in treaties and laws, there are moral imperatives to protect the most vulnerable. We live with our children in families and communities as much as we live in political states and interconnected economies, and we are failing our pledges to honour the rights of our children.
Families vary widely in composition. They may include ties that are biological, adopted, blended, or extended, including grandparents, uncles, aunts, cousins and beyond, in Māori whānau, and Pasifika fono. Many Pākehā, Asian and refugee groups also feature multigenerational family units sharing a home.7 Families are also becoming increasingly ethnically and culturally diverse. The 2013 Census showed that 25% of our population were born overseas, compared with 22.9% in 2006 and 19.5% in 2001. Of the ten most common overseas birthplaces, about 50% are non-English speaking countries.8 Pakeha are the largest ethnic group at 74.0% of the population, followed by Māori at 14.9%. Auckland is the most ethnically diverse region, with the proportion of Asian peoples (23.1%) twice that for the whole population, and more people (14.6%) identifying as Pacific peoples.9
In the 2013 Census, one-parent families made up 17.8% of all families, couples with children made up 41.3% and 40.9% were couples without children.10 Of families with children, 30% are sole parent families. Families with children increasingly include grandparents raising grandchildren. In 2009,
6 Perry, B. (2014) Household incomes in New Zealand: Trends in indicators of inequality and hardship 1982 to 2013. Ministry of Social Development, Wellington, p. 26, at https://www.msd.govt.nz/about-msd-and-our-work/publications-resources/monitoring/household-incomes/index.html.
7 Pool, I., J. Sceats and N. Jackson (2013). The wellbeing of New Zealand families and whanau: demographic underpinnings. Wellington, Families Commission, at: http://www.familiescommission.org.nz/sites/default/files/status-report-2013-part-one-chapter-2.pdf
8 Ibid, p. 10.9 Ibid, p. 9.10 Research New Zealand (2014) Special Report on the 2013 Census of New Zealand’s Population and Dwellings,
Research New Zealand, at: http://www.researchnz.com/pdf/Special%20Reports/ResearchNZ%20Special%20Report%20-%202013%20Census.pdf, p. 11.
5
research by the Grandparent Raising Grandchildren Trust estimated that there were more than 10,000 children in kin/whānau care, including infants and toddlers.11
On 11 October 2012, the Minister for Social Development released the White Paper for Vulnerable Children, to be implemented by the Children’s Action Plan. The Plan’s aim is: “Identifying, Supporting, and Protecting Vulnerable Children”.12 The narrow definition of ‘vulnerable children’ as those who are at risk of maltreatment by their caregivers ignores the social and economic conditions that create or exacerbate children’s vulnerability and the report is silent on the fact that poverty is the single most obvious factor in family violence.13 14 15
Despite the Children’s Action Plan, and despite claims of economic recovery after the protracted recession,16 reports from frontline social services suggest child poverty has continued to worsen.17 These reports were corroborated by revised figures released on 27 February 2014: “Children in poverty vastly underestimated”.18 OECD queries about the figures on child poverty led to the Treasury and Statistics New Zealand locating a major error in calculations of household disposable income: they had overestimated incomes for 2010-2012 among poorer households by double-counting the Accommodation Supplement.
Figures for 2013 show some improvement on some measures but CPAG argues that there are still 30,000 more children than we thought living under the lowest 50% poverty line.. The depth of child poverty has been seriously unrecognised as it is not only the ones not seen to be below the poverty line but, even more critically, most of the 205,000 children below the 50% line are further below than previously thought.
Two years after launch of the Government’s Children’s Action Plan, three years after CPAG’s report, Left Further Behind (2011), six years after CPAG’s report: Left Behind (2008), and nearly ten years after the New Zealand government announced the rollout of its flagship family assistance policy, WFF, this publication provides ample evidence that the poorest children have continued to be left behind relative to their peers. They are at risk of suffering harmful present and future consequences. The overarching theme is that children’s rights and needs must be at the centre of local and national governments’ policy, and subsequent legislation and budget decisions.
11 Worrall, J. (2009) Grandparents and Whanau/Extended Families Raising Kin Children in Aotearoa/New Zealand. A view over time, Grandparents Raising Grandchildren Trust NZ, at: http://www.grg.org.nz/uploads/75791/files/GRGResearchReport_09.09.09.pdf, p. 7.
12 See http://www.childrensactionplan.govt.nz/.13 See, for example: Gelles, Richard J. (1992) Poverty and violence toward children. American Behavioral Scientist, Vol.
35(3), Jan-Feb, 258-274. doi: 10.1177/0002764292035003005;14 Satyanathan,D. and Pollack, A. (2012) Domestic Violence and Poverty, Michigan Family Impact Seminars, http://www.
familyimpactseminars.org/s_mifis04c05.pdf.15 Wynd, D. (2013) Child abuse: what role does poverty play? Child Poverty Action Group Inc., http://www.cpag.org.nz/
assets/Publications/130610%20CPAG%20Child%20Abuse%20Report%201%20June%202013.pdf.16 For example, Weir, J. (2014) Budget 2014: Broad-based economic recovery ‘well-established’ !5 May 2014,
Businessday, at: http://www.stuff.co.nz/business/budget-2014/10048612/Budget-2014-Broad-based-economic-recovery-well-established.
17 Garden, Emily, Caldin, Angela, Robertson, Diane, Timmins, Julie, Wilson, Tom, Wood, Tim (2014) Speaking for Ourselves: The truth about what keeps people in poverty from those who live it – a summary report from the Auckland City Mission Family 100 Research Project, Journal of Health Psychology, Vol.19, Issue97, at: http://hpq.sagepub.com/content/19/1/97.
18 http://www.stuff.co.nz/national/politics/9771016/Children-in-poverty-vastly-underestimated.
6
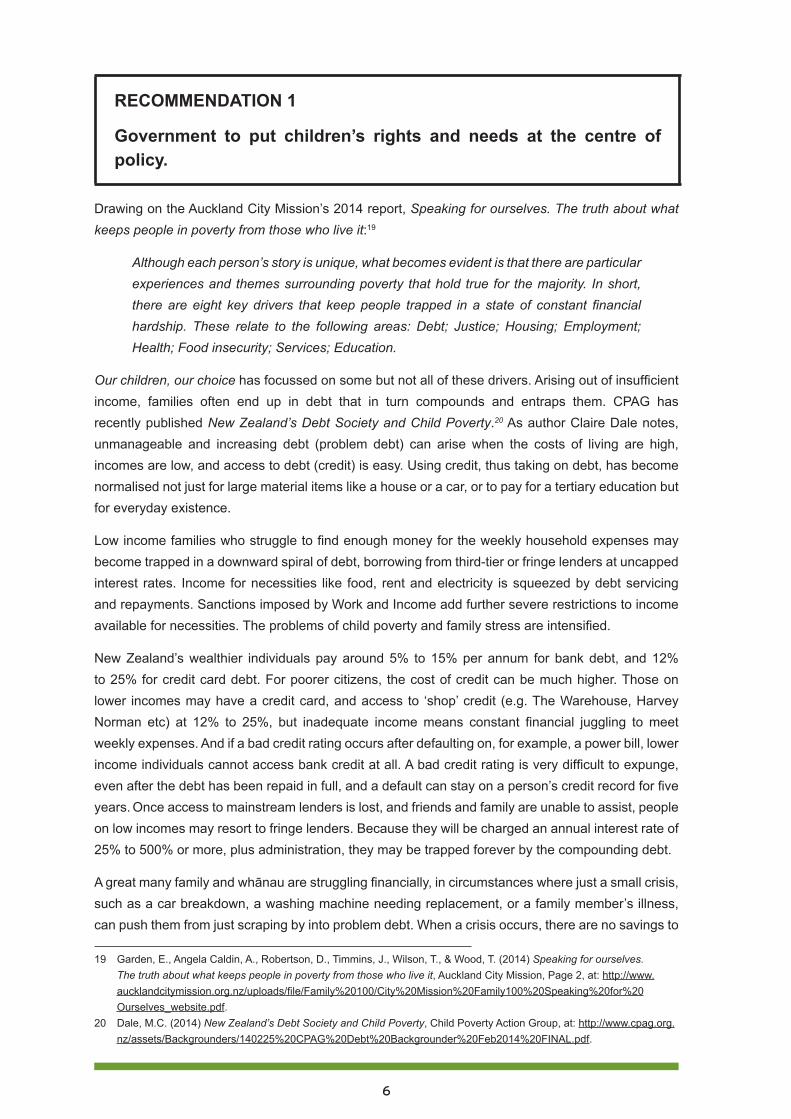
RECOMMENDATION 1
Government to put children’s rights and needs at the centre of policy.
Drawing on the Auckland City Mission’s 2014 report, Speaking for ourselves. The truth about what keeps people in poverty from those who live it:19
Although each person’s story is unique, what becomes evident is that there are particular experiences and themes surrounding poverty that hold true for the majority. In short, there are eight key drivers that keep people trapped in a state of constant financial hardship. These relate to the following areas: Debt; Justice; Housing; Employment; Health; Food insecurity; Services; Education.
Our children, our choice has focussed on some but not all of these drivers. Arising out of insufficient income, families often end up in debt that in turn compounds and entraps them. CPAG has recently published New Zealand’s Debt Society and Child Poverty.20 As author Claire Dale notes, unmanageable and increasing debt (problem debt) can arise when the costs of living are high, incomes are low, and access to debt (credit) is easy. Using credit, thus taking on debt, has become normalised not just for large material items like a house or a car, or to pay for a tertiary education but for everyday existence.
Low income families who struggle to find enough money for the weekly household expenses may become trapped in a downward spiral of debt, borrowing from third-tier or fringe lenders at uncapped interest rates. Income for necessities like food, rent and electricity is squeezed by debt servicing and repayments. Sanctions imposed by Work and Income add further severe restrictions to income available for necessities. The problems of child poverty and family stress are intensified.
New Zealand’s wealthier individuals pay around 5% to 15% per annum for bank debt, and 12% to 25% for credit card debt. For poorer citizens, the cost of credit can be much higher. Those on lower incomes may have a credit card, and access to ‘shop’ credit (e.g. The Warehouse, Harvey Norman etc) at 12% to 25%, but inadequate income means constant financial juggling to meet weekly expenses. And if a bad credit rating occurs after defaulting on, for example, a power bill, lower income individuals cannot access bank credit at all. A bad credit rating is very difficult to expunge, even after the debt has been repaid in full, and a default can stay on a person’s credit record for five years. Once access to mainstream lenders is lost, and friends and family are unable to assist, people on low incomes may resort to fringe lenders. Because they will be charged an annual interest rate of 25% to 500% or more, plus administration, they may be trapped forever by the compounding debt.
A great many family and whānau are struggling financially, in circumstances where just a small crisis, such as a car breakdown, a washing machine needing replacement, or a family member’s illness, can push them from just scraping by into problem debt. When a crisis occurs, there are no savings to
19 Garden, E., Angela Caldin, A., Robertson, D., Timmins, J., Wilson, T., & Wood, T. (2014) Speaking for ourselves. The truth about what keeps people in poverty from those who live it, Auckland City Mission, Page 2, at: http://www.aucklandcitymission.org.nz/uploads/file/Family%20100/City%20Mission%20Family100%20Speaking%20for%20Ourselves_website.pdf.
20 Dale, M.C. (2014) New Zealand’s Debt Society and Child Poverty, Child Poverty Action Group, at: http://www.cpag.org.nz/assets/Backgrounders/140225%20CPAG%20Debt%20Backgrounder%20Feb2014%20FINAL.pdf.
7
draw on, fewer family members are able to offer assistance, and high rents must still be paid. Many of these families have no option but to borrow from the fringe lender.
As well as having negative effects on parents, enduring and mounting debt impacts heavily on the children. Their wellbeing is compromised by reduced access to nutritious food, healthcare, and educational resources. Low disposable income compels families to accept sub-standard and crowded housing conditions which compromise children’s health. High mobility arising from unaffordable rents disrupts the children’s education
The current legal and policy framework associated with consumer credit is not consumer-oriented or founded on human rights. In particular, unlike most of the rest of the world, including Australia, USA, Canada, 21 European nations, Japan, and Bangladesh, New Zealand does not have a legislated ‘cap’ or maximum for interest rates. Proposed changes to consumer protections laws do not address those flaws in the focus or foundation of the legal and economic credit environment. There is a need for socially just alternatives, including safe, fair, affordable credit.
RECOMMENDATION 2
Government to introduce an interest rate cap on consumer credit.
Chapter summaries
Part one: Child poverty and healthThe future health and wellbeing of any country is dependent on the well-being of its children. A much greater proportion of New Zealand children are affected by poverty now than 2-3 decades ago, with accompanying ill health. Poverty is one of the leading factors contributing to childhood illness, disease, disability and deaths in New Zealand. In addition to those immediate consequences, many major health issues in adulthood have origins in childhood poverty, such as cardiovascular disease, mental illness, dental decay and lowered longevity.21 22 23
The long term impact of poverty on child health and wellbeing involves multiple causes and pathways. One important example as described by D’Souza et al24 is the impact of ‘enforced lacks’, of families having to cut back on essentials because of money, such as children having to share a bed, or several to a bedroom; less fresh fruit and vegetables; difficulties heating the house in winter; exposure to damp or mouldy housing; and postponing doctors’ visits and not collecting prescriptions because of costs. These ‘economising behaviours’ are a common experience for children living in poverty.
21 Gluckman P, Hayne H (2011) Improving the Transition: Reducing social and psychological morbidity during adolescence. A report from the Prime Minister’s chief scientific advisor, Office of the Prime Minister’s Chief Scientific Advisor Auckland. http://www.pmcsa.org.nz/wp-content/uploads/Improving-the-Transition-report.pdf#page=97.
22 Shonkoff J, Boyce W, McEwen (2009) Neuroscience, Molecular Biology, and the Childhood Roots of Health Disparities: Building a New Framework for Health Promotion and Disease Prevention. JAMA 2009; 301(21):2252-2259. http://www.ncbi.nlm.nih.gov/pubmed/19491187.
23 Poulton, R., B. J. Caspi, W. M. Thomson, A. Taylor, M. R. Sears, T. E. Moffitt (2002). Association between Children’s Experience of Socioeconomic Disadvantage and Adult Health: a Life-Course Study. The Lancet 360 (9346). http://ac.els-cdn.com/S0140673602116023/1-s2.0-S0140673602116023-main.pdf?_tid=d58caeae-b6db-11e3-b31e-00000aacb35f&acdnat=1396054284_d907bbc7133e172e5caa00ae3aa33a62.
24 D’Souza A, Turner N, Simmers D, Craig E, Dowell T (2012) ‘Every child to thrive, belong and achieve? Time to reflect and act in New Zealand’, New Zealand Medical Journal;125:1352. http://www.ncbi.nlm.nih.gov/pubmed/22472714.
8
Sixteen years ago the National Health Committee25 (quoted above) made strong evidence-based recommendations to improve the health of New Zealanders, including strong political leadership, and health, income, housing and intersectorial initiatives but many have yet to be implemented. More recently the Commissioner for Children, prioritising child poverty as the key issue in his first term, commissioned an Expert Advisory Group to report on Solutions to Child Poverty published in November 2012,26 and most of these also have not yet been implemented.
The basis of our high rates of preventable diseases lie in New Zealand’s triple jeopardy for child health,27 that is, a combination of problems in three critical areas at once: income poverty, unhealthy housing and inadequate basic health care.
All the issues leading to poor child health could be dramatically reduced, if we choose to do so. We need leadership and collective responsibility. A cross-party accord is urgently needed to comprehensively address all the factors. Examples of effective child health policies which have been successfully championed by the Minister of Health in recent times include immunisation coverage and free doctor’s visits for under sixes. Other contributions to the large burden of preventable ill health in our children could be lessened if New Zealand chose to follow these health-related recommendations.
Part two: Early childhood care and education, and child povertyIncreasing diversity amongst the children in their care generates extra challenges for providers of early childhood care and education (ECCE) services, and the nature and quality of provision becomes more critical as children are expected to spend ever more time in care. In 2000, children under 5 years spent an average of 13.5 hours in ECCE, and by 2013 that had increased to an average of 21.7 hours.28 29 Of particular concern is the rise in the number of children under 1 year spending increasing amounts of time in childcare, up from an average of 15 hours in 2000 to 20 hours a week in 2014.30
A further concern is the inequitable delivery of culturally appropriate ECCE services to Māori and Pacific Islands families. The Education Review Office (ERO) noted in 2013 “the lack of responsiveness to Māori and Pacific children in many of the services”.31
Over recent decades, successive Governments have encouraged New Zealand’s already high rates of participation in ECCE,32 telling parents their children will be advantaged. But parents are not told about the potential risks. As ERO also notes, problems include “children getting sick, stressed or anxious, missing out on warm, stable relationships or becoming the victim of violence from other
25 National Health Committee (1998) The Social, Cultural and Economic Determinants of Health in New Zealand: Action to Improve Health, National Health Committee. http://nhc.health.govt.nz/system/files/documents/publications/det-health.pdf.
26 Expert Advisory Group on Solutions to Child Poverty commissioned by the Office of the Commissioner for Children: http://www.occ.org.nz/publications/expert-advisory-group/?category=12.
27 Asher, I. (2010) Porritt Lecture, at: http://www.cpag.org.nz/assets/Health/MIAsherPorrittLecture3Nov2010%20(2).pdf. 28 Education Counts (2013) Annual ECE Census: Summary Report 2013, at: http://www.educationcounts.govt.nz/
statistics/ece2/annual-ece-summary-reports.29 Woulfe, C. (2014) “Early Warnings”, New Zealand Listener 19 April www.listener.co.nz, p.18. 30 Ibid.31 Education Review Office (2013) Priorities for Children’s Learning in Early Childhood Services (May 2013) New
Zealand Government, at: http://www.ero.govt.nz/index.php/National-Reports/Priorities-for-Children-s-Learning-in-Early-Childhood-Services-May-2013/Conclusion.
32 The project is called ‘Engaging Priority Families’. See: http://www.lead.ece.govt.nz/ProgrammesAndInitiatives/ECEParticipationProgramme/EngagingPriorityFamilies.aspx.
9
children”.33 That concern is made more urgent by increasing levels of direct and indirect compulsion for children under 5 to attend ECCE,34 35 and the increasing numbers of children under the age of 1 year in care.36
The Government‘s policy promotes institutional provision of early child care and education,37 yet recent policy changes have failed to increase the requirement for ECCE centres to be fully staffed by qualified, registered teachers. Success is measured by the number of hours that children, including those under the age of 1 year, attend a licensed form of ECCE. CPAG argues that given concerns about quality, success cannot be judged on this basis.
Part two looks carefully at the quality of education and care provided under current policy. Children’s healthy mental, emotional and physical development will benefit their current and future families and communities. We urge adoption of the recommendations under cross-party agreements, so they will be applied, monitored, and evaluated in a reflective and ongoing long-term process. Then we would be more likely to ensure for all our children the rights we have already pledged to deliver.
Part three: Compulsory schooling and child povertyIn Part three, the focus is on compulsory schooling, and how children disadvantaged by poverty fare in that sector. The Organisation for Economic Cooperation and Development (OECD) 2013 report Education at a Glance38 reminds us that education impacts lifetime earnings39 as well as health.40 That report shows New Zealand is in the lower half of OECD countries for secondary school success, and largely as a consequence of this, less than 60% of our students entering a tertiary programme will graduate with a first degree, compared to more than 75% graduating in Australia, Denmark, Finland, France, Japan and Spain.41 Those students who don’t graduate are still likely to have incurred a large student loan that will impact negatively on their net incomes and their future ability to save. They may also be compromised by a sense of failure at their first adult endeavour.
Since the late 1980s, inequality has increased in New Zealand, largely because average to high incomes grew faster than lower incomes. However, while New Zealand’s income mobility is about average for the OECD, as the Treasury (2013) reports, educational mobility is low.42
33 Woulfe, C. (2014) “Early Warnings”, New Zealand Listener 19 April www.listener.co.nz, p.22.34 See Bennett, P. Social obligations mean better outcomes for children, September 2012, at: http://beehive.govt.nz/
release/social-obligations-mean-better-outcomes-children. 35 Collins, S. (2012) Fear over beneficiary child changes, New Zealand Herald, 12 September, at http://www.nzherald.
co.nz/nz/news/article.cfm?c_id=1&objectid=10833412.36 Education Counts (2013) Annual ECE Census: Summary Report 2013, at: http://www.educationcounts.govt.nz/
statistics/ece2/annual-ece-summary-reports.37 Ministry of Education website: http://www.lead.ece.govt.nz/ManagementInformation/RecentAnnouncements/
ECESocialObligation.aspx, states: Young children benefit most from sustained participation in good quality ECE. Parents will be encouraged to have their children attend at least 15 hours of ECE each week, however this is a target and not a minimum requirement. The policy recognises that there is a wide variety in the hours offered by early childhood education services, and some service types that prefer parents to attend alongside their children.
38 OECD (2013) Education at a Glance, at: http://www.oecd.org/edu/eag2013%20(eng)--FINAL%2020%20June%202013.pdf.
39 Ibid, p. 74.40 Ibid, p. 150.41 Ibid, p. 65.42 New Zealand Treasury (2013) Living Standards Background Note: ‘Increasing Equity’, New Zealand Treasury, at http://
www.treasury.govt.nz/abouttreasury/higherlivingstandards/hls-bg-equity-jan13.pdf.
10
The link between parents’ socioeconomic status and a child’s educational outcome is very high in New Zealand compared internationally, suggesting that New Zealand’s education system does not lean against socioeconomic background as much as the education systems of other countries.43
There is no natural mechanism to prevent extreme inequality of income and wealth. As Thomas Piketty (2014) argues:
Historically the main mechanism to reduce inequality has been the diffusion of knowledge, skills and education. This is the most powerful force to reduce inequality between countries …. Sometimes this can also work within countries if we have sufficiently inclusive educational and social institutions which allow large segments of the population to access the right skills and the right jobs.44
Successful outcomes from compulsory schooling for our children, particularly for children who are disadvantaged by poverty, depend on a complex but achievable range of conditions. We urge adoption of the recommendations under cross-party agreements, so they will be applied, monitored, and evaluated in a reflective and ongoing long-term process. Then the system is more likely to deliver better outcomes for all our children, and provide them with improved opportunities for their futures.
Part four: Housing market changes and their impact on childrenWhile this focus on housing shows that the issues are complex, the principal barrier to access to quality housing is the high price of housing compared to wages. Increasing numbers of families are unlikely to ever own a house. For families who are renting, the problem is threefold: house rents are high and increasing, the quality of many rental properties is substandard and deteriorating, and the rental market provides few rights and protections for renters.
For the whole of New Zealand, rents have increased by around 11% since 2009, which is around the same as Consumer Price Index inflation. But Christchurch rents have increased by 20% to 30% over the past five years, with almost all of this increase since the 2011 earthquakes;45 and in Auckland, rents are rising faster than incomes, increasing by 17% in nominal terms between 2009 and 2013.46
A consequence of low income and high rents is household crowding which increases the risk from infectious diseases. Families in their own home, with or without a mortgage, are likely to be in better health than those who rent their house, either from private or public landlords. Substandard housing can adversely affect the physical and mental health of the occupants, and children are particularly vulnerable to prolonged exposure to poor housing.47 Damp housing is related to respiratory conditions in both adults and children. Mould, more likely to grow in damp houses, has been shown to have a small but significant respiratory effect on children. A likely consequence of low income and badly
43 Ibid, p. 2.44 Piketty, T. (2014) Why We Don’t Need 19th Century Inequality To Generate Growth, European Politics and Policy,
London School of Economics, EUROPP@LSE. 45 Johnson, A. Striking a better balance, The Salvation Army Social Policy and Parliamentary Unit 2014,http://www.
salvationarmy.org.nz/sites/default/files/uploads/20140211SONStriking%20a%20Better%20Balance%20-%20Final%20Web.pdf.
46 Ibid.47 Howden-Chapman, P., Housing standards: a glossary of housing and health, Journal of Epidemiology & Community
Health 2004; Vol. 58:162–168. http://www.ncbi.nlm.nih.gov/pmc/articles/PMC1732704/pdf/v058p00162.pdf.

11
constructed housing is fuel poverty, the inability to heat the indoor environment to healthy levels.48 49
The price of housing reflects location, size, and demand and supply but is a poor indicator of quality. This is where myriad possibilities emerge in the concept of a ‘Housing Warrant of Fitness’, including, as well as weather-tightness, electrical integrity, security against theft or intrusion, security of tenure; access to public spaces and quality public schooling. In short, making housing ‘fit for purpose’.
Our focus is establishing a baseline of the housing sector in New Zealand in 2014 from the perspective of the median family, at the mid-point in the income distribution, and those below, rather than the average. ‘Housing affordability’ involves multiple stories. So too does ‘housing and child poverty’. When the worst of these stories is the lived experience for a child, the effects endure and the outcomes can be dire. We could choose not to inflict that bleak future on our children. The housing recommendations are straightforward, and achievable. While the initial cost in money terms may seem large, in the long-run, for our children, they are economically efficient and socially just choices.
Part five: Tax, welfare and adequate incomes to address child povertyThe Children’s Commissioner’s Expert Advisory Group (2012) defined child poverty:50
Children living in poverty are those who experience deprivation of the material resources and income that is required for them to develop and thrive, leaving such children unable to enjoy their rights, achieve their full potential and participate as full and equal members of New Zealand society.
Adequate family income is central to ending children’s material deprivation and achieving a fully participatory society. Improvements to health and access to health services, or access to and provision of affordable and appropriate housing are important but must be done alongside not instead of building adequate family incomes. A constructive discussion on child poverty needs to include an examination of income requirements and proposals to improve family incomes.
One important factor determining disposable income for most low income families is employment. The 2014 gross minimum wage rate of $14.25 puts a floor under hourly earnings, while the total wage income of a family is related to the hours of work they can supply. Extra hours worked, especially by the primary caregiver, may sacrifice precious family time. Raising the minimum wage while adequately protecting the real value of Working for Families tax credits may be more satisfactory than a blanket ‘living wage’ approach.
The second major influence on family incomes is income taxes levied on earnings, and consumption tax ie GST. New Zealand has a remarkably flat tax scale, with 10.5% tax on the first $14,000, a top rate of only 33% for income over $70,000, and GST at 15%. In Australia the first $18,200 is tax free, the top rate is 45% on income over $180,000, and GST is levied at only 10% (with many basic items
48 McChesney, I. (2013) Child Poverty the ‘fuel poverty’ dimension, Policy Quarterly, V9, 2, May 2013, at: http://igps.victoria.ac.nz/publications/files/f7937a94644.pdf.
49 Howden-Chapman, P., Michael G. Baker, M.G. & and Sarah Bierre, S. (2013) “The Houses Children Live In, policies to improve housing quality”, Policy Quarterly, Volume 9, Issue 2 – May 2013, at: http://igps.victoria.ac.nz/publications/files/f79b9f69dfa.pdf.
50 Expert Advisory Group (2012) Solutions to child poverty in New Zealand. Evidence for Action. Office of the Children’s Commissioner, p. 2, at http://www.occ.org.nz/assets/Uploads/EAG/Final-report/Final-report-Solutions-to-child-poverty-evidence-for-action.pdf.
12
excluded). Reform of the tax system to make it more progressive could be an important element in tackling child poverty.
The third major influence is redistribution of income through social welfare benefits, housing subsidies (especially the Accommodation Supplement), and child-related payments such as Working for Families tax credits. To address growing inequality, well-supported, deliberatively redistributive programmes are required. This is especially important In New Zealand because of the stagnation of wages at the lower end of the distribution, the fairly flat income tax structure and the high rate of GST. Three important programmes of cash redistribution are New Zealand Superannuation for the old, Working for Families (WFF) for the young, and welfare benefits for those unable to participate in the workforce. Part five. focuses on the last two of these and argues for major reforms to provide solutions to child poverty.
Introductory recommendations:1. Government to put children’s rights and needs at the centre of policy.
2. Government to introduce an interest rate cap on consumer credit.
Each part of this publication is authored by experts in their field, and contains links to other resources including audio-visual material. We offer special tribute and appreciation to the J.R. McKenzie Trust who have provided support for much of this valuable research and reporting. The 2014 publications recommend changes to current policy around children’s health; housing; early childhood education and care; provision of compulsory education; and family incomes. Each part of this publication reveals how current Government policies and budget and reporting priorities are contributing to keeping poor families poor, and recommends solutions.
The 20th September is the 2014 election date. Children are waiting for a better future. The aim of CPAG’s Our children, our choice: priorities for policy, is to support the next Government, no matter what its makeup, in the immediate adoption of child-focussed policies to reduce child poverty and mitigate its effects.
13
PART ONE: Child poverty and health51
Nikki Turner and Innes Asher
Dr Nikki Turner, Health Spokesperson for Child Poverty Action Group, is Associate Professor, Department of General Practice and Primary Care, University of Auckland; Director, Conectus child health services including the Immunisation Advisory Centre; and General Practitioner with NUHS Pacific Health Clinic, Strathmore, Wellington. Nikki is a member of the Management Committee of Child Poverty Action Group.
Dr Innes Asher, ONZM, is Professor and Head of Department of Paediatrics: Child and Youth Health, University of Auckland; and Honorary Consultant in Paediatric Respiratory Medicine, Starship Children’s Health. Innes is a member of the Management Committee of Child Poverty Action Group.
The context of child poverty and health in New Zealand
Social, cultural and economic factors are the most important determinants of health(p.3) … increase in poverty is leading to worsening health among people on the lowest incomes(p.81) …There are immediate health gains to be made by applying information and knowledge that is already available.(letter accompanying report)
New Zealand National Health Committee (1998) The Social, Cultural and Economic Determinants of Health in New Zealand: Action to Improve Health.52
The future health and wellbeing of any country is dependent on the wellbeing of its children. A much greater proportion of New Zealand children are affected by poverty now than 2-3 decades ago (see figure 1 in Part 5, p105), with an accompanying increase in ill health. Poverty is one of the leading factors contributing to childhood illness, disease, disability and deaths in New Zealand. In addition to those immediate consequences, many major health issues in adulthood have their origins in childhood poverty.
51 Acknowledgements: Our thanks to the Children’s Commissioner, Dr Russell Wills, for commissioning the Expert Advisory Group to produce Solutions to Child Poverty (2012); and to the NZ Child and Youth Epidemiology Service and Dr Elizabeth Craig for permission to reproduce the selected graphs and tables from the Child Poverty Monitor 2013 Technical Report. Also, our thanks to Associate Professor Simon Denny, Department of Paediatrics: Child and Youth Health, University of Auckland, who contributed to the section on Youth Health; to Associate Professor Sally Merry, Department of Psychological Medicine, University of Auckland, who reviewed the recommendations; Dr Rhys Jones, Senior Lecturer, Te Kupenga Hauora Māori, University of Auckland and Dr Paula King, Public Health Physician, who contributed to the sections on Māori children; Dr Katie Bach, Paediatric Dentist, who contributed to the section on oral health; and Dr Stuti Misra, Post-Doctoral Clinical Research Fellow, Department of Ophthalmology, University of Auckland, who contributed to the section on optometry.
52 National Health Committee (1998) The Social, Cultural and Economic Determinants of Health in New Zealand: Action to Improve Health, National Health Committee. http://nhc.health.govt.nz/system/files/documents/publications/det-health.pdf.
14
These include cardiovascular disease, mental illness, dental decay and lowered longevity.53 54 55
The long term impact of poverty on child health and wellbeing involves multiple causes and pathways. One important example described by D’Souza et al56 is the impact of ‘enforced lacks’, of families having to cut back on essentials because of lack of money, such as children having to share a bed, or sleep several to a bedroom; less fresh fruit and vegetables; difficulties heating the house in winter; exposure to damp or mouldy housing; and postponing doctors’ visits and not collecting prescriptions because of costs. These ‘economising behaviours’ are a common experience for children living in poverty.
Sixteen years ago the National Health Committee57 (quoted above) made strong evidence-based recommendations to improve the health of New Zealanders, including strong political leadership, and health, income, housing and intersectorial initiatives, but many have yet to be implemented.
Most recently the Commissioner for Children, prioritising child poverty as the key issue in his first term, commissioned an Expert Advisory Group to report on Solutions to Child Poverty. Their report was published in November 2012,58 and is referred to later in this chapter.
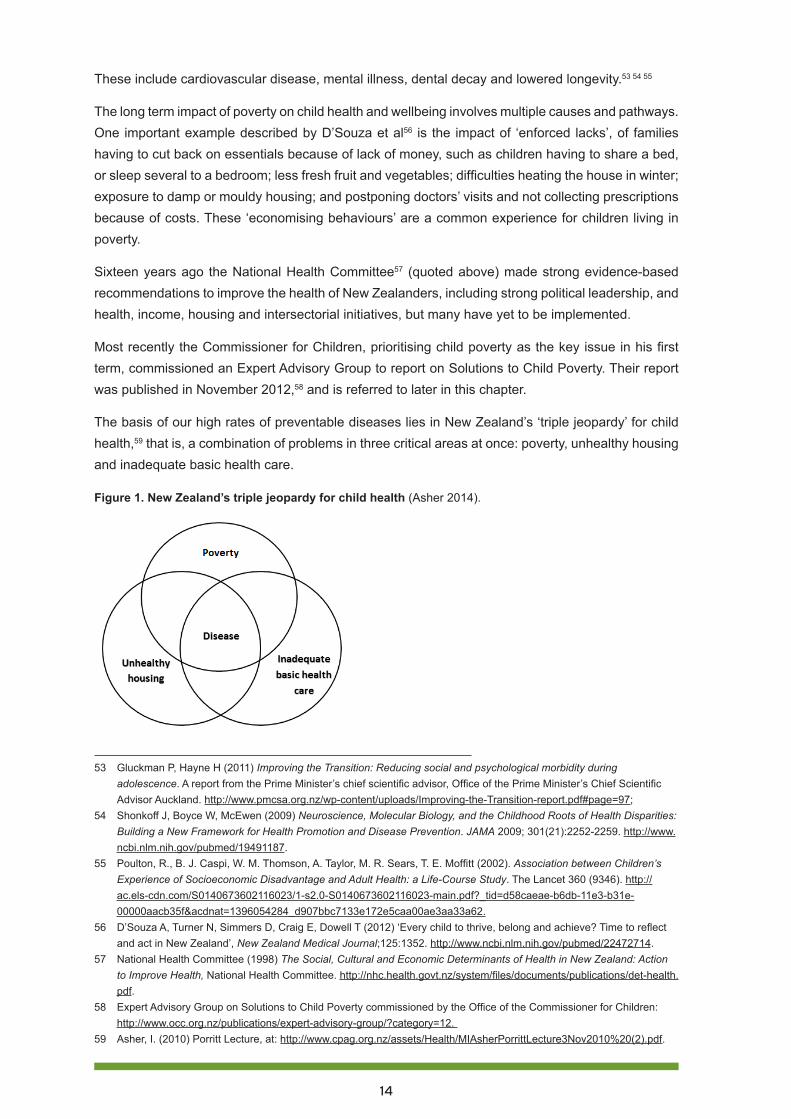
The basis of our high rates of preventable diseases lies in New Zealand’s ‘triple jeopardy’ for child health,59 that is, a combination of problems in three critical areas at once: poverty, unhealthy housing and inadequate basic health care.
Figure 1. New Zealand’s triple jeopardy for child health (Asher 2014).
53 Gluckman P, Hayne H (2011) Improving the Transition: Reducing social and psychological morbidity during adolescence. A report from the Prime Minister’s chief scientific advisor, Office of the Prime Minister’s Chief Scientific Advisor Auckland. http://www.pmcsa.org.nz/wp-content/uploads/Improving-the-Transition-report.pdf#page=97;
54 Shonkoff J, Boyce W, McEwen (2009) Neuroscience, Molecular Biology, and the Childhood Roots of Health Disparities: Building a New Framework for Health Promotion and Disease Prevention. JAMA 2009; 301(21):2252-2259. http://www.ncbi.nlm.nih.gov/pubmed/19491187.
55 Poulton, R., B. J. Caspi, W. M. Thomson, A. Taylor, M. R. Sears, T. E. Moffitt (2002). Association between Children’s Experience of Socioeconomic Disadvantage and Adult Health: a Life-Course Study. The Lancet 360 (9346). http://ac.els-cdn.com/S0140673602116023/1-s2.0-S0140673602116023-main.pdf?_tid=d58caeae-b6db-11e3-b31e-00000aacb35f&acdnat=1396054284_d907bbc7133e172e5caa00ae3aa33a62.
56 D’Souza A, Turner N, Simmers D, Craig E, Dowell T (2012) ‘Every child to thrive, belong and achieve? Time to reflect and act in New Zealand’, New Zealand Medical Journal;125:1352. http://www.ncbi.nlm.nih.gov/pubmed/22472714.
57 National Health Committee (1998) The Social, Cultural and Economic Determinants of Health in New Zealand: Action to Improve Health, National Health Committee. http://nhc.health.govt.nz/system/files/documents/publications/det-health.pdf.
58 Expert Advisory Group on Solutions to Child Poverty commissioned by the Office of the Commissioner for Children: http://www.occ.org.nz/publications/expert-advisory-group/?category=12.
59 Asher, I. (2010) Porritt Lecture, at: http://www.cpag.org.nz/assets/Health/MIAsherPorrittLecture3Nov2010%20(2).pdf.
15
• Poverty: New Zealand rates of child poverty are very high, as is the proportion of children staying in significant poverty for long periods. Poverty has a deep impact on child health, leading to more severe and recurrent illnesses in ways which are under-recognised. These include the ill-effects on growing children of a lack of regular nutritious food, and the effects on immune system functioning for children living with high levels of household stress and insecure living situations, all also creating further difficulties for learning and education.
• Unhealthy housing: Many of our houses are cold, damp and unheated or heated with unhealthy fuel. Fuel and rental accommodation are expensive and often lead to crowding, in an attempt to lower these expenses.
• Inadequate basic healthcare: Nationally there is no co-ordinated framework which effectively engages all children in healthcare, from pregnancy to adulthood, in ways that everyone can access.
When families experience problems in all these areas at once, some diseases may become almost inevitable for these children, as they did in the times of Dickens. All these factors affecting wellbeing can be changed, if we choose to do so.
RECOMMENDATION 1
Government to design a comprehensive plan to reduce child poverty that includes actions, targets, measurable outcomes and regular reporting requirements.
New Zealand compared with other OECD countriesNew Zealand is seen as a world leader in child health and development research.60 Despite our reputation, in 2009 New Zealand was ranked second to last in health and safety of 30 countries in an OECD report on child wellbeing, and did not score highly in any category.61 While some of this data is now dated, the current New Zealand rates of hospitalisation for potentially preventable illness suggest that we have had little improvement in most areas.62
Other OECD countries do not have such high rates of serious skin or respiratory diseases, or of rheumatic fever, which is virtually unknown in countries such as Sweden, the UK and the USA.
Of additional concern is New Zealand’s low public financial investment in children by OECD standards, with investment in young children being less than half the OECD national average.63
60 Gluckman P, Hayne H (2011) Improving the Transition: Reducing social and psychological morbidity during adolescence. A report from the Prime Minister’s chief scientific advisor, Office of the Prime Minister’s Chief Scientific Advisor Auckland. http://www.pmcsa.org.nz/wp-content/uploads/Improving-the-Transition-report.pdf#page=97
61 OECD (2009) Doing Better for Children, Paris, Organization for Economic Co-operation and Development. http://www.oecd.org/social/family/doingbetterforchildren.htm.
62 Craig E., Reddington A., Wicken A., Oben G., & Simpson J. (2013) Child Poverty Monitor 2013 Technical Report (Updated 2014). Dunedin. NZ Child & Youth Epidemiology Service, University of Otago. http://www.nzchildren.co.nz/document_downloads/2013%20Child%20Poverty%20Monitor%20Technical%20Report%20MASTER.pdf.
63 OECD (2009) Doing Better for Children, Paris, Organization for Economic Co-operation and Development. http://www.oecd.org/social/family/doingbetterforchildren.htm.
16
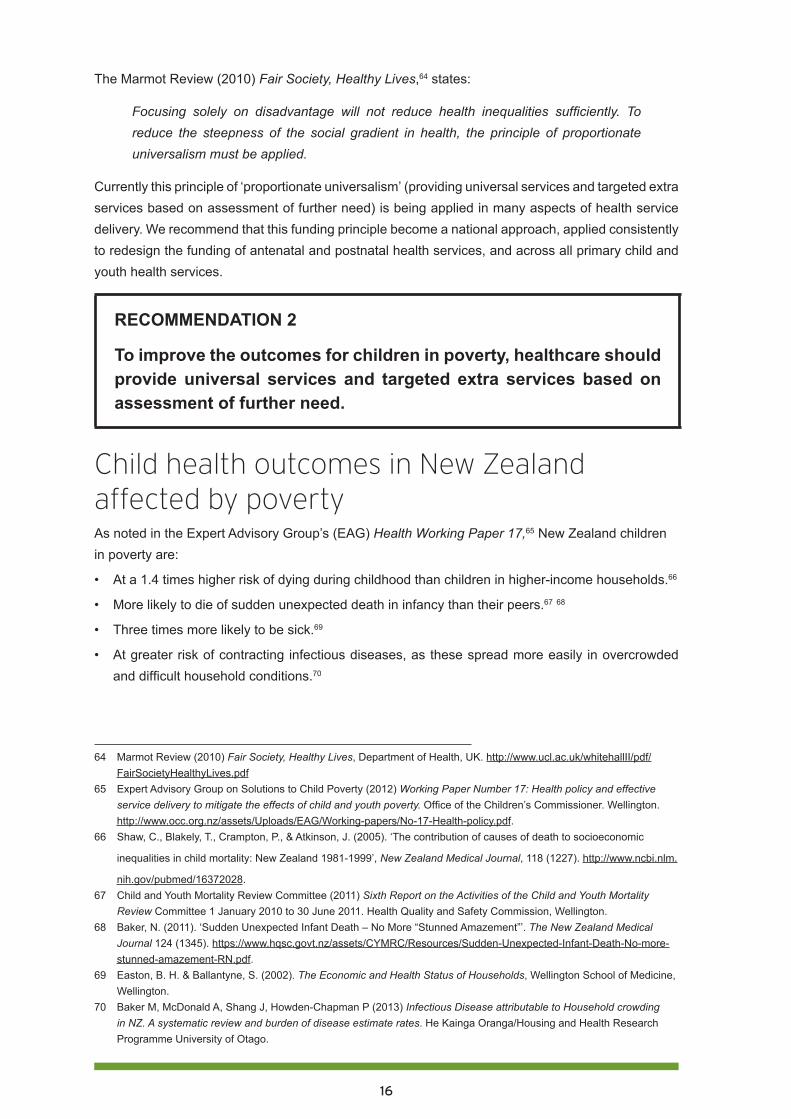
The Marmot Review (2010) Fair Society, Healthy Lives,64 states:
Focusing solely on disadvantage will not reduce health inequalities sufficiently. To reduce the steepness of the social gradient in health, the principle of proportionate universalism must be applied.
Currently this principle of ‘proportionate universalism’ (providing universal services and targeted extra services based on assessment of further need) is being applied in many aspects of health service delivery. We recommend that this funding principle become a national approach, applied consistently to redesign the funding of antenatal and postnatal health services, and across all primary child and youth health services.
RECOMMENDATION 2
To improve the outcomes for children in poverty, healthcare should provide universal services and targeted extra services based on assessment of further need.
Child health outcomes in New Zealand affected by povertyAs noted in the Expert Advisory Group’s (EAG) Health Working Paper 17,65 New Zealand children in poverty are:
• At a 1.4 times higher risk of dying during childhood than children in higher-income households.66
• More likely to die of sudden unexpected death in infancy than their peers.67 68
• Three times more likely to be sick.69
• At greater risk of contracting infectious diseases, as these spread more easily in overcrowded and difficult household conditions.70
64 Marmot Review (2010) Fair Society, Healthy Lives, Department of Health, UK. http://www.ucl.ac.uk/whitehallII/pdf/FairSocietyHealthyLives.pdf
65 Expert Advisory Group on Solutions to Child Poverty (2012) Working Paper Number 17: Health policy and effective service delivery to mitigate the effects of child and youth poverty. Office of the Children’s Commissioner. Wellington. http://www.occ.org.nz/assets/Uploads/EAG/Working-papers/No-17-Health-policy.pdf.
66 Shaw, C., Blakely, T., Crampton, P., & Atkinson, J. (2005). ‘The contribution of causes of death to socioeconomic
inequalities in child mortality: New Zealand 1981-1999’, New Zealand Medical Journal, 118 (1227). http://www.ncbi.nlm.
nih.gov/pubmed/16372028.67 Child and Youth Mortality Review Committee (2011) Sixth Report on the Activities of the Child and Youth Mortality
Review Committee 1 January 2010 to 30 June 2011. Health Quality and Safety Commission, Wellington. 68 Baker, N. (2011). ‘Sudden Unexpected Infant Death – No More “Stunned Amazement”’. The New Zealand Medical
Journal 124 (1345). https://www.hqsc.govt.nz/assets/CYMRC/Resources/Sudden-Unexpected-Infant-Death-No-more-stunned-amazement-RN.pdf.
69 Easton, B. H. & Ballantyne, S. (2002). The Economic and Health Status of Households, Wellington School of Medicine, Wellington.
70 Baker M, McDonald A, Shang J, Howden-Chapman P (2013) Infectious Disease attributable to Household crowding in NZ. A systematic review and burden of disease estimate rates. He Kainga Oranga/Housing and Health Research Programme University of Otago.
17
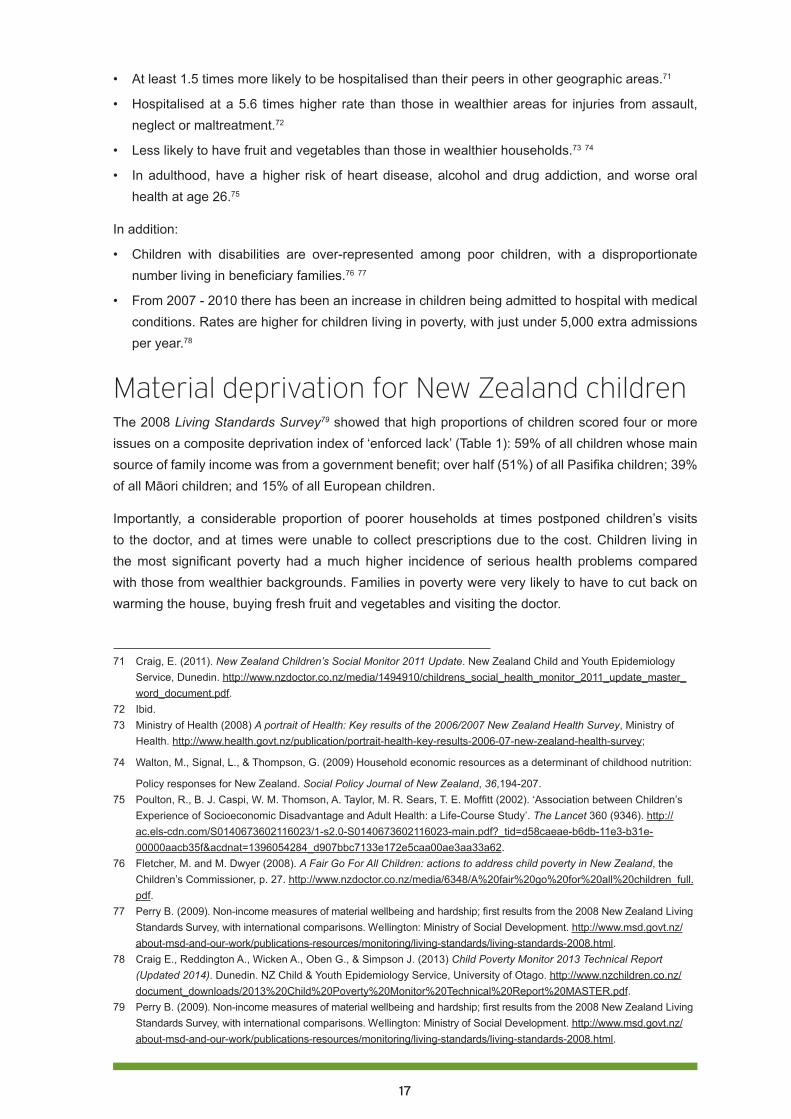
• At least 1.5 times more likely to be hospitalised than their peers in other geographic areas.71
• Hospitalised at a 5.6 times higher rate than those in wealthier areas for injuries from assault, neglect or maltreatment.72
• Less likely to have fruit and vegetables than those in wealthier households.73 74
• In adulthood, have a higher risk of heart disease, alcohol and drug addiction, and worse oral health at age 26.75
In addition:
• Children with disabilities are over-represented among poor children, with a disproportionate number living in beneficiary families.76 77
• From 2007 - 2010 there has been an increase in children being admitted to hospital with medical conditions. Rates are higher for children living in poverty, with just under 5,000 extra admissions per year.78
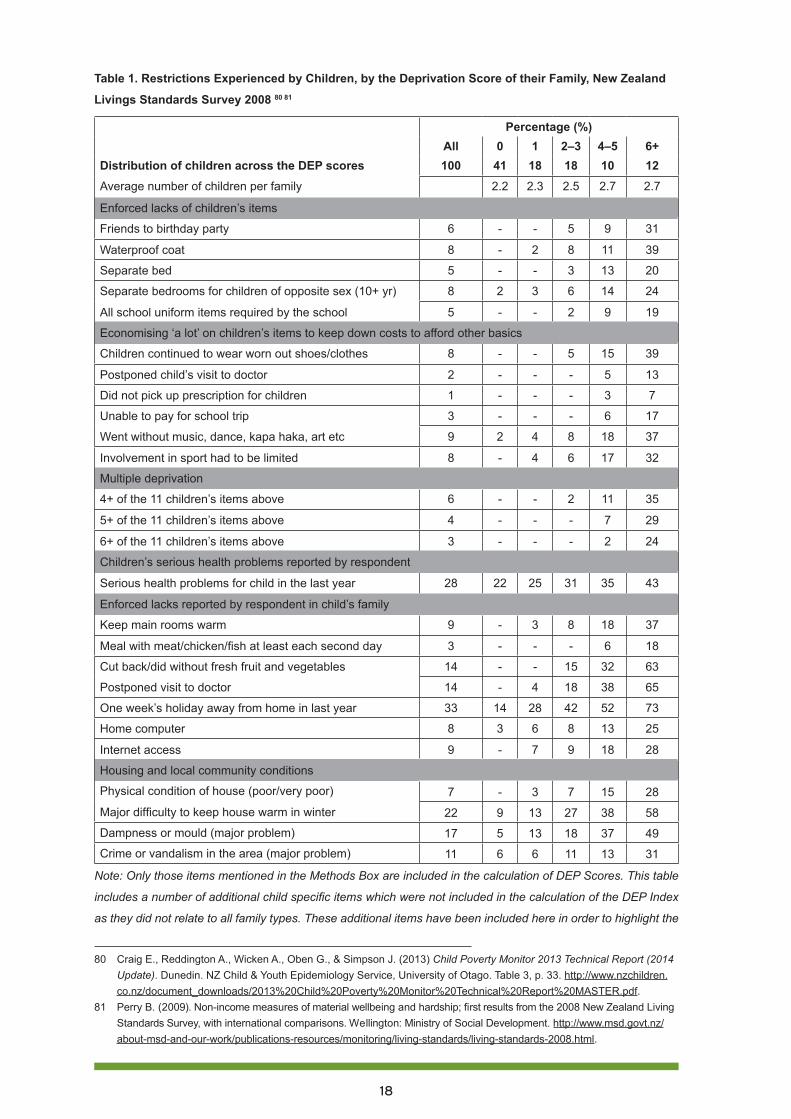
Material deprivation for New Zealand childrenThe 2008 Living Standards Survey79 showed that high proportions of children scored four or more issues on a composite deprivation index of ‘enforced lack’ (Table 1): 59% of all children whose main source of family income was from a government benefit; over half (51%) of all Pasifika children; 39% of all Māori children; and 15% of all European children.
Importantly, a considerable proportion of poorer households at times postponed children’s visits to the doctor, and at times were unable to collect prescriptions due to the cost. Children living in the most significant poverty had a much higher incidence of serious health problems compared with those from wealthier backgrounds. Families in poverty were very likely to have to cut back on warming the house, buying fresh fruit and vegetables and visiting the doctor.
71 Craig, E. (2011). New Zealand Children’s Social Monitor 2011 Update. New Zealand Child and Youth Epidemiology Service, Dunedin. http://www.nzdoctor.co.nz/media/1494910/childrens_social_health_monitor_2011_update_master_word_document.pdf.
72 Ibid.73 Ministry of Health (2008) A portrait of Health: Key results of the 2006/2007 New Zealand Health Survey, Ministry of
Health. http://www.health.govt.nz/publication/portrait-health-key-results-2006-07-new-zealand-health-survey;
74 Walton, M., Signal, L., & Thompson, G. (2009) Household economic resources as a determinant of childhood nutrition:
Policy responses for New Zealand. Social Policy Journal of New Zealand, 36,194-207.75 Poulton, R., B. J. Caspi, W. M. Thomson, A. Taylor, M. R. Sears, T. E. Moffitt (2002). ‘Association between Children’s
Experience of Socioeconomic Disadvantage and Adult Health: a Life-Course Study’. The Lancet 360 (9346). http://ac.els-cdn.com/S0140673602116023/1-s2.0-S0140673602116023-main.pdf?_tid=d58caeae-b6db-11e3-b31e-00000aacb35f&acdnat=1396054284_d907bbc7133e172e5caa00ae3aa33a62.
76 Fletcher, M. and M. Dwyer (2008). A Fair Go For All Children: actions to address child poverty in New Zealand, the Children’s Commissioner, p. 27. http://www.nzdoctor.co.nz/media/6348/A%20fair%20go%20for%20all%20children_full.pdf.
77 Perry B. (2009). Non-income measures of material wellbeing and hardship; first results from the 2008 New Zealand Living Standards Survey, with international comparisons. Wellington: Ministry of Social Development. http://www.msd.govt.nz/about-msd-and-our-work/publications-resources/monitoring/living-standards/living-standards-2008.html.
78 Craig E., Reddington A., Wicken A., Oben G., & Simpson J. (2013) Child Poverty Monitor 2013 Technical Report (Updated 2014). Dunedin. NZ Child & Youth Epidemiology Service, University of Otago. http://www.nzchildren.co.nz/document_downloads/2013%20Child%20Poverty%20Monitor%20Technical%20Report%20MASTER.pdf.
79 Perry B. (2009). Non-income measures of material wellbeing and hardship; first results from the 2008 New Zealand Living Standards Survey, with international comparisons. Wellington: Ministry of Social Development. http://www.msd.govt.nz/about-msd-and-our-work/publications-resources/monitoring/living-standards/living-standards-2008.html.
18
Table 1. Restrictions Experienced by Children, by the Deprivation Score of their Family, New Zealand
Livings Standards Survey 2008 80 81
Percentage (%)All 0 1 2–3 4–5 6+
Distribution of children across the DEP scores 100 41 18 18 10 12Average number of children per family 2.2 2.3 2.5 2.7 2.7
Enforced lacks of children’s items
Friends to birthday party 6 - - 5 9 31
Waterproof coat 8 - 2 8 11 39
Separate bed 5 - - 3 13 20
Separate bedrooms for children of opposite sex (10+ yr) 8 2 3 6 14 24
All school uniform items required by the school 5 - - 2 9 19
Economising ‘a lot’ on children’s items to keep down costs to afford other basics
Children continued to wear worn out shoes/clothes 8 - - 5 15 39
Postponed child’s visit to doctor 2 - - - 5 13
Did not pick up prescription for children 1 - - - 3 7
Unable to pay for school trip 3 - - - 6 17
Went without music, dance, kapa haka, art etc 9 2 4 8 18 37
Involvement in sport had to be limited 8 - 4 6 17 32
Multiple deprivation
4+ of the 11 children’s items above 6 - - 2 11 35
5+ of the 11 children’s items above 4 - - - 7 29
6+ of the 11 children’s items above 3 - - - 2 24
Children’s serious health problems reported by respondent
Serious health problems for child in the last year 28 22 25 31 35 43
Enforced lacks reported by respondent in child’s family
Keep main rooms warm 9 - 3 8 18 37
Meal with meat/chicken/fish at least each second day 3 - - - 6 18
Cut back/did without fresh fruit and vegetables 14 - - 15 32 63
Postponed visit to doctor 14 - 4 18 38 65
One week’s holiday away from home in last year 33 14 28 42 52 73
Home computer 8 3 6 8 13 25
Internet access 9 - 7 9 18 28
Housing and local community conditions
Physical condition of house (poor/very poor) 7 - 3 7 15 28
Major difficulty to keep house warm in winter 22 9 13 27 38 58
Dampness or mould (major problem) 17 5 13 18 37 49
Crime or vandalism in the area (major problem) 11 6 6 11 13 31
Note: Only those items mentioned in the Methods Box are included in the calculation of DEP Scores. This table
includes a number of additional child specific items which were not included in the calculation of the DEP Index
as they did not relate to all family types. These additional items have been included here in order to highlight the
80 Craig E., Reddington A., Wicken A., Oben G., & Simpson J. (2013) Child Poverty Monitor 2013 Technical Report (2014 Update). Dunedin. NZ Child & Youth Epidemiology Service, University of Otago. Table 3, p. 33. http://www.nzchildren.co.nz/document_downloads/2013%20Child%20Poverty%20Monitor%20Technical%20Report%20MASTER.pdf.
81 Perry B. (2009). Non-income measures of material wellbeing and hardship; first results from the 2008 New Zealand Living Standards Survey, with international comparisons. Wellington: Ministry of Social Development. http://www.msd.govt.nz/about-msd-and-our-work/publications-resources/monitoring/living-standards/living-standards-2008.html.

19
experiences of children living in households with differing experiences of material deprivation. This is why some
of the percentages for individual items are >0 in the DEP 0 column i.e. a family may have scored 0 for the 14 items
in the DEP Index, but did report an enforced lack for some of the other child specific measures.
Some gains
Immunisation coverage There has been improvement in some areas of health. One particularly positive example is in childhood immunisation coverage rates.
In 1992 the national coverage rate for 2 year olds was 56%, with even lower rates for Māori and Pasifika children. In 2014, coverage is now just below the 95% target for all groups. Socioeconomic and ethnic gaps close almost completely at 2 years of age (Figure 2) and timeliness of delivery is much improved. This is a fantastic achievement, unique in the New Zealand child health environment, which traditionally is dominated by inequalities in service delivery and outcomes.
Figure 2. Percentage fully immunised at 2 years of age by deprivation, June 2009 to December 201382
The achievements for immunisations have been attributed to strong leadership and community support, the effective use of target setting, appropriate infrastructure such as the national immunisation register, effective service delivery and feedback loops, and the use of specific evidence-based strategies.83
This is clearly a successful example of the government making a comprehensive plan, with targets and measurable outcomes, which are being achieved.
Declining rates of sudden unexpected infant deathMortality from sudden unexpected death in infancy has declined dramatically in the past 20 years, falling from 200 to around 60 per annum.84 This improvement is attributed mainly to placing infants to sleep on their backs. However, New Zealand still has one of the highest rates of sudden unexpected
82 Source: Data: NIR 2014; graph courtesy of Immunisation Advisory Centre, University of Auckland.83 Turner N (2012) The challenge of improving immunization coverage: the New Zealand example. Expert review of
Vaccines; 11 (1): 9-11. http://www.expert-reviews.com/doi/pdf/10.1586/erv.11.15784 Abel S, Tipene-Leech D. (2013) SUDI prevention: a review of Māori safe sleep innovations for infants. The New
Zealand Medical Journal.126(1379):86-94.
20
death in infancy among industrialised countries, with the risk being disproportionately high in the Māori community and those population groups that experience high deprivation85 86. Unintentional suffocation is recognised increasingly as a significant contributor to the ongoing rates of sudden unexpected death in infancy, particularly with co-sleeping with adults.87
Increased attention and resourcingThere has been new health spending, and particular attention has been given to rheumatic fever prevention, Whanau Ora, Gateway Assessments, Integrated Family Health Centres, and quality indicators in maternal and child health, including a focus on timely newborn enrolment with primary care. There has generally been greater attention to child health concerns, as seen with the Government’s 2012 Green paper on vulnerable children88 and White paper on vulnerable children,89
the Māori Affairs Select Committee Inquiry into the Determinants of Wellbeing for Māori Children,90
and the Health Select Committee Inquiry into improving child health outcomes and preventing child abuse with a focus from preconception under three years of age.91 However, action remains fragmented, insufficient and lacking a coordinated national framework across health and other sectors.92
Areas of concern
Recent trends in hospital admissions related to povertyIn 2013 the New Zealand Child Youth and Epidemiology Service (NZCYES) at the University of Otago, working in partnership with the JR McKenzie Trust and the Office of the Children’s Commissioner, produced a report designed to monitor child poverty, using a range of measures to capture different aspects of poverty. The tables and figures below are reproduced from their 2013 report health and wellbeing indicators.93
85 Abel S, Tipene-Leech D. (2013) SUDI prevention: a review of Māori safe sleep innovations for infants. The New Zealand Medical Journal.126(1379):86-94.
86 NZ Mortality Review Data Group (2013) NZ Child and Youth Mortality Review Committee 9th Data Report: University of Otago.
87 CYMRC (2013) Special Report: Unintentional suffocation, foreign body inhalation and strangulation, March https://www.hqsc.govt.nz/assets/CYMRC/Publications/CMYRC-special-report-March-2013.pdf)
88 Green Paper on Vulnerable Children (2012) Every child thrives, belongs, achieves, Ministry of Social Development. http://www.msd.govt.nz/documents/about-msd-and-our-work/work-programmes/policy-development/green-paper-vulnerable-children/green-paper-for-vulnerable-children.pdf.
89 Ministry of Social Development (2012) White Paper for Vulnerable Children. Ministry of Social Development. http://www.msd.govt.nz/documents/about-msd-and-our-work/work-programmes/policy-development/white-paper-vulnerable-children/white-paper-for-vulnerable-children-volume-1.pdf.
90 Maori Affairs Select Committee (2013) Inquiry into the Determinants of Wellbeing for Tamariki Maori. Ka whai oranga, ka whai wahi, ka whai taumata ia tamaiti. Maori Affairs Committee. http://www.parliament.nz/resource/0002082460.
91 Health Select Committee (2013) Inquiry into improving child health outcomes and preventing child abuse with a focus from preconception under three years of age. Health Select Committee, Part 1 http://www.parliament.nz/resource/0002018580; Part 2 http://www.parliament.nz/resource/0002018582.
92 D’Souza A, Turner N, Simmers D, Craig E, Dowell T (2012) ‘Every child to thrive, belong and achieve? Time to reflect and act in New Zealand’, The New Zealand Medical Journal;125:1352. http://www.ncbi.nlm.nih.gov/pubmed/22472714.
93 Craig E., Reddington A., Wicken A., Oben G., & Simpson J. (2013) Child Poverty Monitor 2013 Technical Report (2014 Update). Dunedin. NZ Child & Youth Epidemiology Service, University of Otago. Table 3, p. 33. http://www.nzchildren.co.nz/document_downloads/2013%20Child%20Poverty%20Monitor%20Technical%20Report%20MASTER.pdf.
21
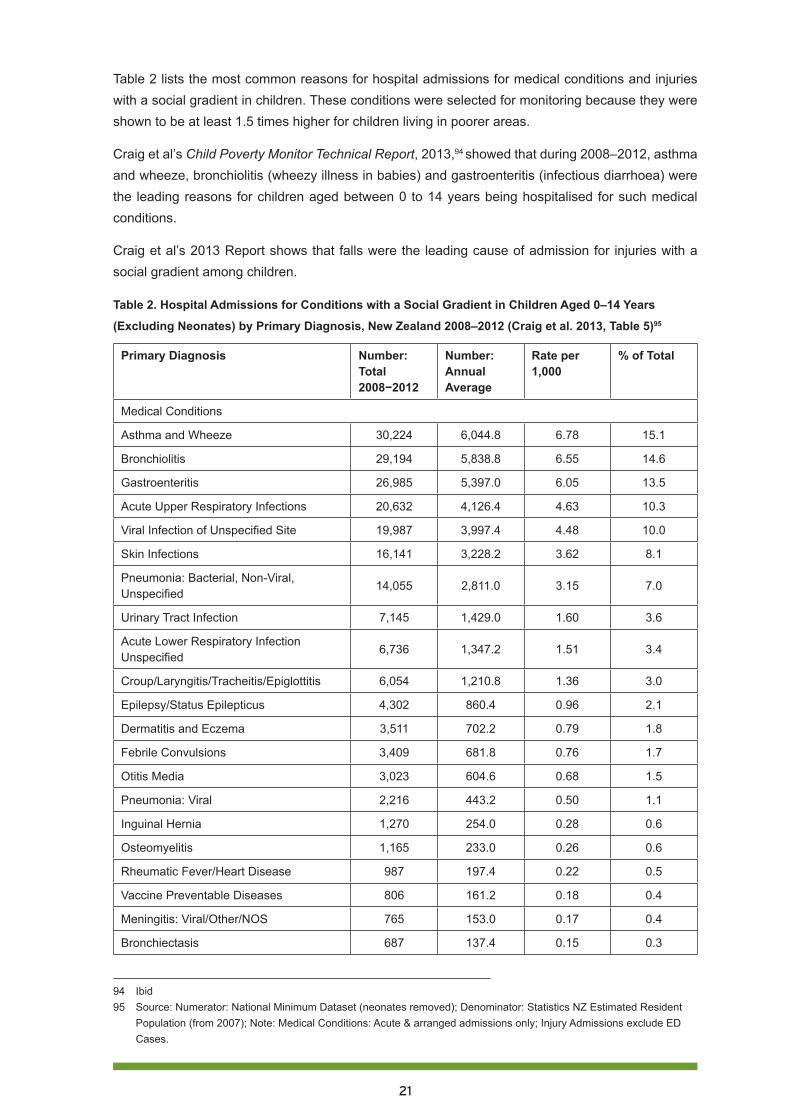
Table 2 lists the most common reasons for hospital admissions for medical conditions and injuries with a social gradient in children. These conditions were selected for monitoring because they were shown to be at least 1.5 times higher for children living in poorer areas.
Craig et al’s Child Poverty Monitor Technical Report, 2013,94 showed that during 2008–2012, asthma and wheeze, bronchiolitis (wheezy illness in babies) and gastroenteritis (infectious diarrhoea) were the leading reasons for children aged between 0 to 14 years being hospitalised for such medical conditions.
Craig et al’s 2013 Report shows that falls were the leading cause of admission for injuries with a social gradient among children.
Table 2. Hospital Admissions for Conditions with a Social Gradient in Children Aged 0–14 Years
(Excluding Neonates) by Primary Diagnosis, New Zealand 2008–2012 (Craig et al. 2013, Table 5)95
Primary Diagnosis Number: Total 2008−2012
Number: Annual Average
Rate per 1,000
% of Total
Medical Conditions
Asthma and Wheeze 30,224 6,044.8 6.78 15.1
Bronchiolitis 29,194 5,838.8 6.55 14.6
Gastroenteritis 26,985 5,397.0 6.05 13.5
Acute Upper Respiratory Infections 20,632 4,126.4 4.63 10.3
Viral Infection of Unspecified Site 19,987 3,997.4 4.48 10.0
Skin Infections 16,141 3,228.2 3.62 8.1
Pneumonia: Bacterial, Non-Viral, Unspecified
14,055 2,811.0 3.15 7.0
Urinary Tract Infection 7,145 1,429.0 1.60 3.6
Acute Lower Respiratory Infection Unspecified
6,736 1,347.2 1.51 3.4
Croup/Laryngitis/Tracheitis/Epiglottitis 6,054 1,210.8 1.36 3.0
Epilepsy/Status Epilepticus 4,302 860.4 0.96 2.1
Dermatitis and Eczema 3,511 702.2 0.79 1.8
Febrile Convulsions 3,409 681.8 0.76 1.7
Otitis Media 3,023 604.6 0.68 1.5
Pneumonia: Viral 2,216 443.2 0.50 1.1
Inguinal Hernia 1,270 254.0 0.28 0.6
Osteomyelitis 1,165 233.0 0.26 0.6
Rheumatic Fever/Heart Disease 987 197.4 0.22 0.5
Vaccine Preventable Diseases 806 161.2 0.18 0.4
Meningitis: Viral/Other/NOS 765 153.0 0.17 0.4
Bronchiectasis 687 137.4 0.15 0.3
94 Ibid95 Source: Numerator: National Minimum Dataset (neonates removed); Denominator: Statistics NZ Estimated Resident
Population (from 2007); Note: Medical Conditions: Acute & arranged admissions only; Injury Admissions exclude ED Cases.
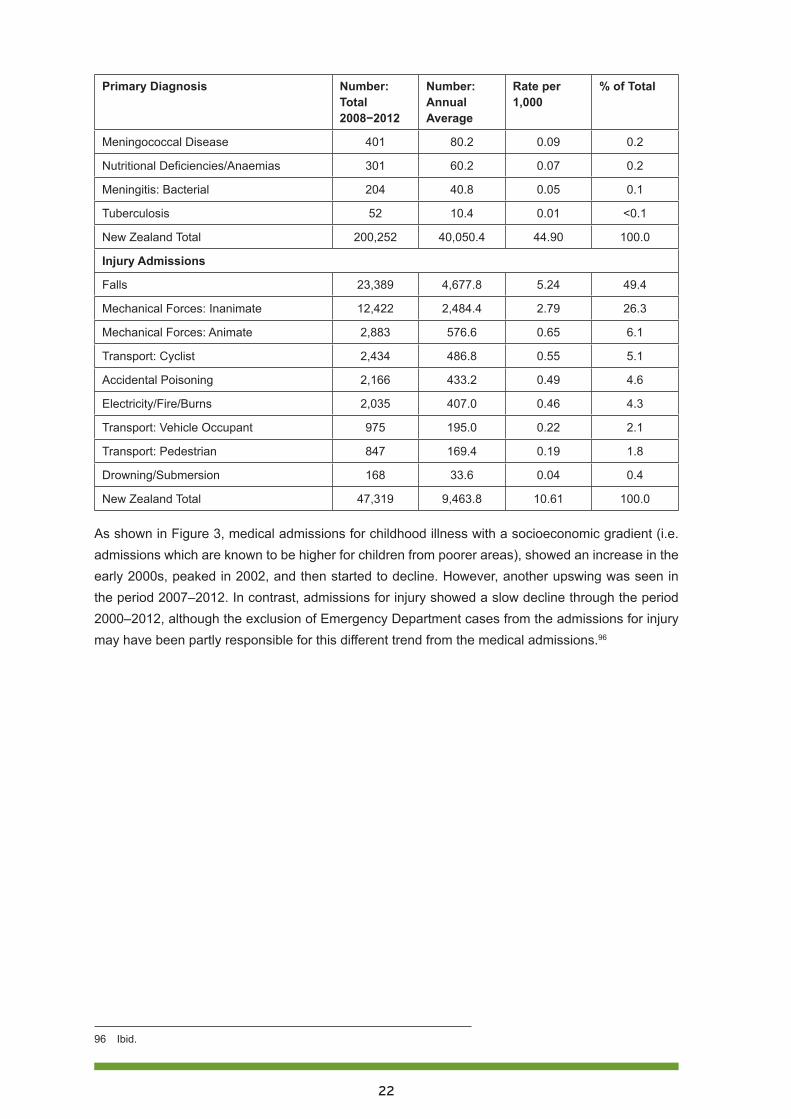
22
Primary Diagnosis Number: Total 2008−2012
Number: Annual Average
Rate per 1,000
% of Total
Meningococcal Disease 401 80.2 0.09 0.2
Nutritional Deficiencies/Anaemias 301 60.2 0.07 0.2
Meningitis: Bacterial 204 40.8 0.05 0.1
Tuberculosis 52 10.4 0.01 <0.1
New Zealand Total 200,252 40,050.4 44.90 100.0
Injury Admissions
Falls 23,389 4,677.8 5.24 49.4
Mechanical Forces: Inanimate 12,422 2,484.4 2.79 26.3
Mechanical Forces: Animate 2,883 576.6 0.65 6.1
Transport: Cyclist 2,434 486.8 0.55 5.1
Accidental Poisoning 2,166 433.2 0.49 4.6
Electricity/Fire/Burns 2,035 407.0 0.46 4.3
Transport: Vehicle Occupant 975 195.0 0.22 2.1
Transport: Pedestrian 847 169.4 0.19 1.8
Drowning/Submersion 168 33.6 0.04 0.4
New Zealand Total 47,319 9,463.8 10.61 100.0
As shown in Figure 3, medical admissions for childhood illness with a socioeconomic gradient (i.e. admissions which are known to be higher for children from poorer areas), showed an increase in the early 2000s, peaked in 2002, and then started to decline. However, another upswing was seen in the period 2007–2012. In contrast, admissions for injury showed a slow decline through the period 2000–2012, although the exclusion of Emergency Department cases from the admissions for injury may have been partly responsible for this different trend from the medical admissions.96
96 Ibid.
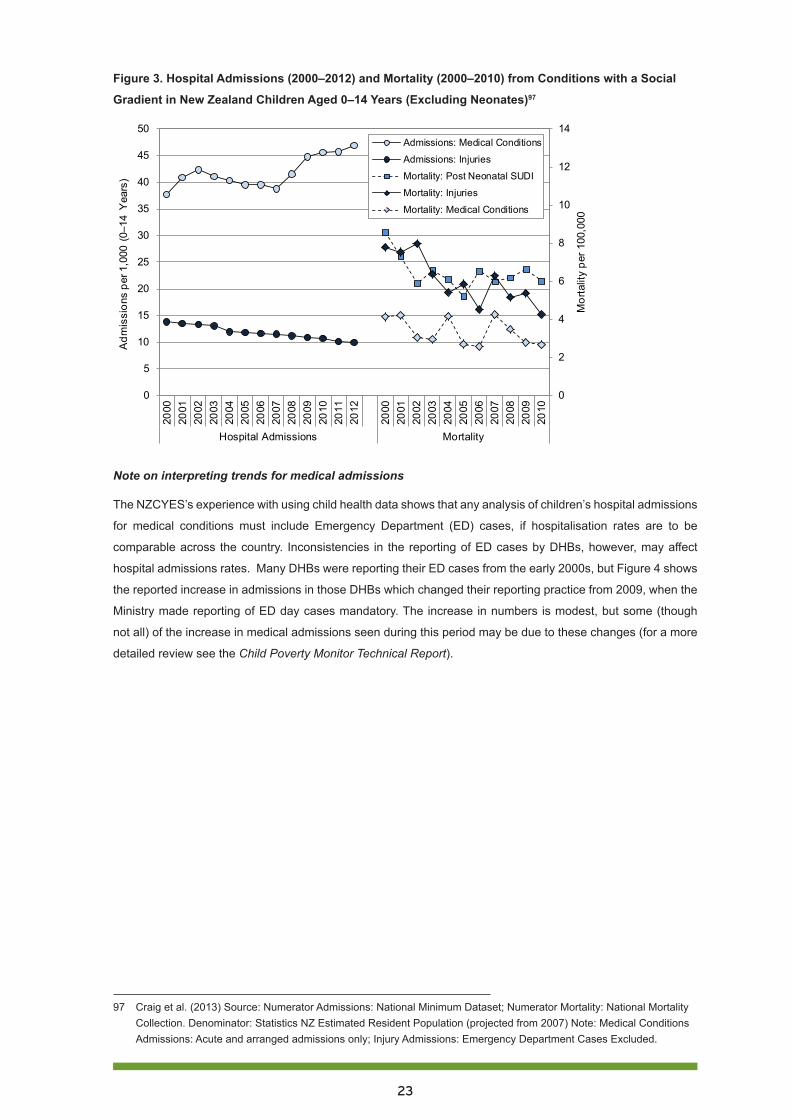
23
Figure 3. Hospital Admissions (2000–2012) and Mortality (2000–2010) from Conditions with a Social
Gradient in New Zealand Children Aged 0–14 Years (Excluding Neonates)97
0
2
4
6
8
10
12
14
0
5
10
15
20
25
30
35
40
45
50
2000
2001
2002
2003
2004
2005
2006
2007
2008
2009
2010
2011
2012
2000
2001
2002
2003
2004
2005
2006
2007
2008
2009
2010
Hospital Admissions Mortality
Mor
talit
y pe
r 100
,000
Adm
issi
ons
per 1
,000
(0–
14 Y
ears
)
Admissions: Medical Conditions
Admissions: Injuries
Mortality: Post Neonatal SUDI
Mortality: Injuries
Mortality: Medical Conditions
Note on interpreting trends for medical admissions
The NZCYES’s experience with using child health data shows that any analysis of children’s hospital admissions
for medical conditions must include Emergency Department (ED) cases, if hospitalisation rates are to be
comparable across the country. Inconsistencies in the reporting of ED cases by DHBs, however, may affect
hospital admissions rates. Many DHBs were reporting their ED cases from the early 2000s, but Figure 4 shows
the reported increase in admissions in those DHBs which changed their reporting practice from 2009, when the
Ministry made reporting of ED day cases mandatory. The increase in numbers is modest, but some (though
not all) of the increase in medical admissions seen during this period may be due to these changes (for a more
detailed review see the Child Poverty Monitor Technical Report).
97 Craig et al. (2013) Source: Numerator Admissions: National Minimum Dataset; Numerator Mortality: National Mortality Collection. Denominator: Statistics NZ Estimated Resident Population (projected from 2007) Note: Medical Conditions Admissions: Acute and arranged admissions only; Injury Admissions: Emergency Department Cases Excluded.
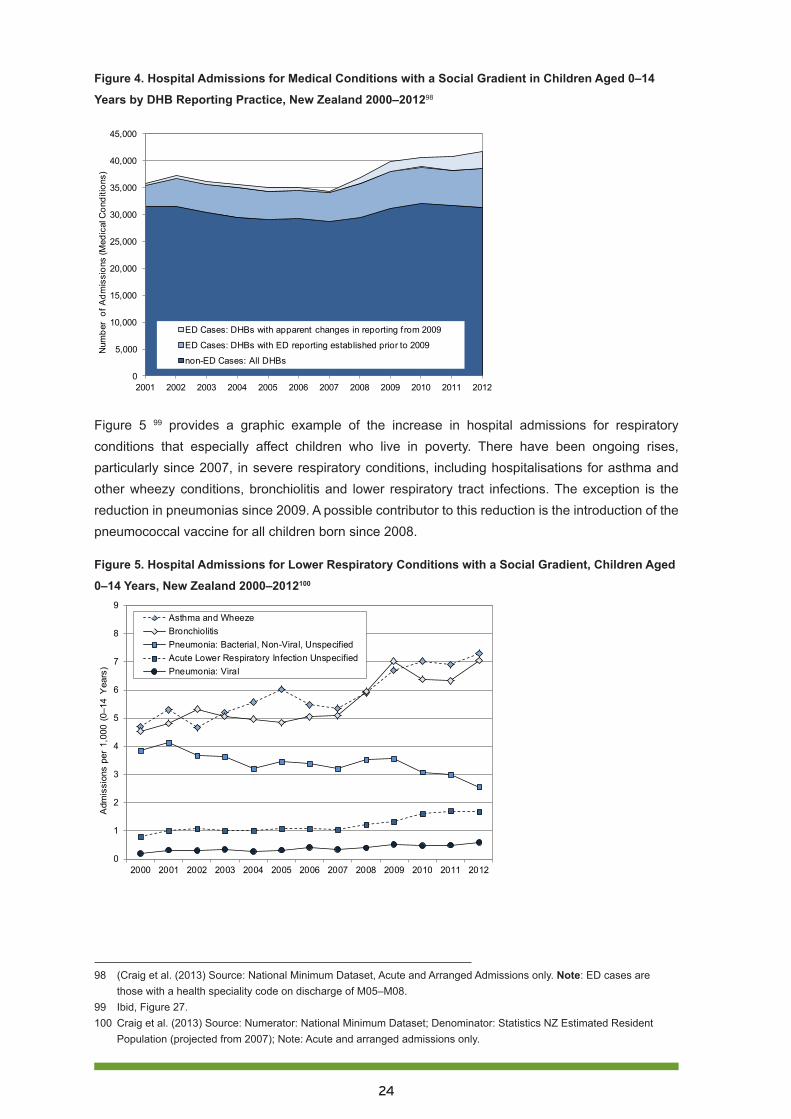
24
Figure 4. Hospital Admissions for Medical Conditions with a Social Gradient in Children Aged 0–14
Years by DHB Reporting Practice, New Zealand 2000–201298
0
5,000
10,000
15,000
20,000
25,000
30,000
35,000
40,000
45,000
2001 2002 2003 2004 2005 2006 2007 2008 2009 2010 2011 2012
Num
ber
of A
dmis
sion
s (M
edic
al C
ondi
tions
)
ED Cases: DHBs with apparent changes in reporting f rom 2009
ED Cases: DHBs with ED reporting established prior to 2009
non-ED Cases: All DHBs
Figure 5 99 provides a graphic example of the increase in hospital admissions for respiratory conditions that especially affect children who live in poverty. There have been ongoing rises, particularly since 2007, in severe respiratory conditions, including hospitalisations for asthma and other wheezy conditions, bronchiolitis and lower respiratory tract infections. The exception is the reduction in pneumonias since 2009. A possible contributor to this reduction is the introduction of the pneumococcal vaccine for all children born since 2008.
Figure 5. Hospital Admissions for Lower Respiratory Conditions with a Social Gradient, Children Aged
0–14 Years, New Zealand 2000–2012100
0
1
2
3
4
5
6
7
8
9
2000 2001 2002 2003 2004 2005 2006 2007 2008 2009 2010 2011 2012
Adm
issi
ons
per
1,00
0 (0
–14
Yea
rs)
Asthma and WheezeBronchiolitisPneumonia: Bacterial, Non-Viral, UnspecifiedAcute Lower Respiratory Infection UnspecifiedPneumonia: Viral
98 (Craig et al. (2013) Source: National Minimum Dataset, Acute and Arranged Admissions only. Note: ED cases are those with a health speciality code on discharge of M05–M08.
99 Ibid, Figure 27.100 Craig et al. (2013) Source: Numerator: National Minimum Dataset; Denominator: Statistics NZ Estimated Resident
Population (projected from 2007); Note: Acute and arranged admissions only.
25
Maori children’s high rates of diseaseIn addition to the attainment of health equity as a moral imperative, tamariki Māori as tangata whenua have the right to experience equitable health, as affirmed by Te Tiriti o Waitangi (1840), the United Nations Convention on the Rights of the Child,101 the United Nations Declaration on the Rights of Indigenous Peoples,102 and within the broader frameworks of international human rights pertaining to indigenous peoples. However, such protection generally does not occur and Māori children disproportionately experience poor health outcomes. Recent data show the very high rates for Māori children of some preventable diseases, such as acute rheumatic fever, which are even more common now than they were a decade ago.103 104
The adverse effects start from pregnancy onwards, with Māori mothers more likely to have stillbirths, pre-term births and newborn deaths. Māori babies are more likely to be exposed to risk during the antenatal period. The proportion of Māori babies born to mothers without a Lead Maternity Carer (LMC) at the time of delivery and the proportion of mothers of Māori babies smoking at time of first LMC contact are significantly higher than for non-Māori.105
Many potentially avoidable hospital admissions for poverty-related infectious diseases, such as serious skin infections, respiratory infections such as bronchiectasis (chronic lung damage), influenza, pneumonia and gastroenteritis, are higher for Māori children. The gaps have widened over the last two decades, as Figure 5106 clearly demonstrates. For Māori children, rates of admissions for these diseases remained fairly constant in the early 2000s, then increased during 2007–2009.107 In 2012, compared with 2000, proportionately more Māori children were hospitalised than European children (whose rates did not fall during those 12 years), meaning that this ethnicity gap has widened.
From 2000 to 2012, admissions for injuries from assault, neglect or maltreatment of children aged 0 to 14 years were higher for Māori children. Poverty plays a key role in child abuse, as it does in preventable diseases, and we can change this too if we choose to.108
101 See http://www.hrc.co.nz/international-human-rights-new/new-zealands-international-obligations/united-nations-convention-on-the-rights-of-the-child/.
102 See: http://www.un.org/esa/socdev/unpfii/documents/DRIPS_en.pdf. 103 Milne R.J., Lennon D., Stewart J.M., Vander Hoorn S., Scuffham P.A (2012) ‘Mortality and hospitalisation costs of
rheumatic fever and rheumatic heart disease in New Zealand’. Journal of Paediatrics and Child Health; V.48(8):692-7. DOI: 10.1111/j.1440-1754.2012.02446.x.
104 Craig E., Reddington A., Wicken A., Oben G., & Simpson J. (2013) Child Poverty Monitor 2013 Technical Report (2014 Update). Dunedin. NZ Child & Youth Epidemiology Service, University of Otago. Figure 31. http://www.nzchildren.co.nz/document_downloads/2013%20Child%20Poverty%20Monitor%20Technical%20Report%20MASTER.pdf.
105 Ministry of Health (2009) A Focus on the Health of Māori and Pacific Children Key Findings of the 2006/07 New Zealand Health Survey. Wellington: Ministry of Health. http://www.health.govt.nz/system/files/documents/publications/focus-on-health-maori-pacific-children.pdf.
106 Craig E., Reddington A., Wicken A., Oben G., & Simpson J. (2013) Child Poverty Monitor 2013 Technical Report. Dunedin. NZ Child & Youth Epidemiology Service, University of Otago. Figure 31. http://www.nzchildren.co.nz/document_downloads/2013%20Child%20Poverty%20Monitor%20Technical%20Report%20MASTER.pdf.
107 Ibid, Table 3, p. 33. 108 Wynd, D. (2013) Child abuse: what role does poverty play? June. Child Poverty Action Group Inc. http://www.cpag.org.
nz/assets/Publications/130610%20CPAG%20Child%20Abuse%20Report%201%20June%202013.pdf.

26
The racism which underpins the lack of progress in many areas in the determinants of health and the health care system perpetuates this profound disadvantage. The association between racism and poverty can also be altered if we have the will to make the necessary changes in ourselves and our systems.109
Pasifika children’s high rates of diseaseNew Zealand is a signatory to the United Nations Convention on the Rights of the Child, and as such is compelled to protect all children from poor health outcomes.110 Yet Pasifika children are more at risk than children from other ethnic groups for many of the same diseases and poor health outcomes, as Figure 6 shows. It is of particular concern that Pasifika children and young adults are nearly 50 times more likely than New Zealand European children, and twice as likely as Māori children, to be admitted to hospital with acute rheumatic fever.111 112
The ‘triple jeopardy’ of preventable poverty, unhealthy housing and inadequate basic health care underpins these shocking figures.
The top three barriers to primary health care for Pacific peoples are identified as cost, transport and language. Other barriers include family commitments, difficulty in meeting appointment times, difficulty in understanding the nature/necessity of an appointment, lack of access to after hours services, communication barriers, inflexible employment, and feeling cultural discomfort when discussing health issues with non-Pacific practitioners. Structural problems associated with long waiting times, lack of discussion time with the doctor, crowded clinics, and the bringing and minding of other children have also been reported as barriers.113
That Asian and Indian children are relatively protected from these preventable diseases (Figure 6) illustrates that high rates of disease are not inevitable for non-European children in New Zealand.
109 Dr Rhys Jones (2014) Child health inequities: How do we become part of the solution? Starship Children’s Health, Paediatric Update: https://www.starship.org.nz/for-health-professionals/paediatric-update/2014-archive/child-health-inequities-how-do-we-become-part-of-the-solution/.
110 See http://www.hrc.co.nz/international-human-rights-new/new-zealands-international-obligations/united-nations-convention-on-the-rights-of-the-child/.
111 Craig, E. (2011). New Zealand Children’s Social Monitor 2011 Update. New Zealand Child and Youth Epidemiology Service, Dunedin. http://www.nzdoctor.co.nz/media/1494910/childrens_social_health_monitor_2011_update_master_word_document.pdf;.
112 Craig, L., J. Adams, G. Oben, A. Reddington, A. Wicken, and J. Simpson (2012). ‘Te Ohonga Ake: The Health Status of Maori Children and Young People in New Zealand’. Dunedin, New Zealand: University of Otago, New Zealand Child and Youth Epidemiology Service. http://dnmeds.otago.ac.nz/departments/womens/paediatrics/research/nzcyes/pdf/Health_Status_of_Maori_Children_and_Young_People_in_New_Zealand.pdf
113 M Southwick, T Kenealy, D Ryan 2012. Primary Care for Pacific People: A Pacific and Health Systems Approach. Wellington: Pacific Perspectives, at http://www.health.govt.nz/system/files/documents/publications/primary-care-pacific-people-pacific-health-systems-approach.pdf, p. 20

27
Figure 6. Hospital Admissions for Conditions with a Social Gradient in Children Aged 0–14 Years
(Excluding Neonates) by Ethnicity, New Zealand 2000–2012114
RECOMMENDATION 3
Increase health funding for children to a level that achieves equal child health outcomes for all ethnic groups.
Antenatal careEarly engagement in pregnancy with health providers is likely to lead to better maternal and child health outcomes.115 Early engagement can enable providers to offer regular antenatal care, as well as informing and supporting pregnant women with important issues such as better antenatal nutrition, discontinuation of smoking and alcohol use. It can also identify important health and social concerns, such as mental health issues, poor housing and family violence.
Currently pregnant women from backgrounds of poverty, and particularly Pasifika women, often present late in pregnancy and receive limited antenatal care. Data from 2010 indicated that more than one third of Pasifika women and nearly one sixth of Māori women were not attended at all by a Lead Maternity Carer (midwife, general practitioner or obstetrician) during their pregnancy.116 Early engagement with maternity services can be a greater challenge for women living in disadvantaged neighbourhoods, and greater resourcing is required. Effective engagement strategies have been
114 Craig et al. (2013) Source: Numerator: National Minimum Dataset (neonates removed); Denominator: Statistics NZ Estimated Resident Population (projected from 2007); Note: Medical Conditions: Acute and arranged admissions only; Injury Admissions: Emergency Department Cases Excluded; Ethnicity is Level 1 Prioritised.
115 Expert Advisory Group on Solutions to Child Poverty (2012) Working Paper Number 17: Health policy and effective service delivery to mitigate the effects of child and youth poverty. Office of the Children’s Commissioner. Wellington. http://www.occ.org.nz/assets/Uploads/EAG/Working-papers/No-17-Health-policy.pdf.
116 Ibid.

28
documented in the international literature and with a range of New Zealand local services.117 These need to be applied so that all women in New Zealand are engaged early in pregnancy.
RECOMMENDATION 4
Effective and universal antenatal care/maternity services to be provided that include national targets and ensure all pregnant women are enrolled with maternity services as early as possible in their pregnancy.
National coordination Nationally there is no co-ordinated framework which effectively engages all children in accessible healthcare from pregnancy to adulthood. Current health and social services are often very fragmented. This leads to inefficiencies, particularly for children in poverty, whose families face greater challenges in navigating and accessing services. Many of these challenges can be reduced by developing and sustaining engaged relationships with health care providers and between providers, starting antenatally and continuing throughout the early childhood years.
Currently families say they have to repeat their stories often to multiple professionals from different disciplines.118 Taking a common assessment approach to service planning and delivery for all children from the antenatal period has the potential to identify needs and respond more systematically, reduce fragmentation in services, improve communication and trust with families, and target extra resources more effectively when needed.
RECOMMENDATION 5
Develop and share across all health service providers a universal common assessment plan and pathway for all children starting ante-natally; including universal enrolment at birth with primary care, national immunisation register, well child/tamariki ora provider and dental provider.
Financial barriers to accessing health careIn July 2012 the government implemented free after hours primary care visits for children from birth to age 6 years, in addition to the free regular hours care already provided. All DHBs are required to have a minimum of 60% coverage, with 100% to be achieved ‘as soon as practicable’. Good progress has been made in achieving this. Although not complete, it is estimated that approximately 80% of practices currently offer free visits for this age group during regular hours.119 In February 2013, a survey undertaken by CPAG found that the average fee for children under 6 visiting a general practitioner was $1.30 (range $0-45) in office hours, and $3.60 (range $0-60) out of hours. However,
117 Ibid.118 Ibid. 119 Ibid.
29
the cost for children aged 6-17 years was much steeper, with an average of $24 (range $0-60) in hours and $44 ($0-89) out of hours.120 121
In 2011 there was an increase in prescription charges for people 6 years and older, from $3 per item to $5 per item. It was predicted that those who have the most health problems would be the ones most adversely affected.122 The 2008 Livings Standards Survey showed that 10% of poorer households at times were unable to collect prescriptions due to the cost.123 This proportion is now expected to be higher, since the charges have almost doubled. For low income families, medication costs often have to be weighed against more immediate household needs, such as food and rent.
The 2012 health report of the Office of the Commissioner for Children report on Solutions to Child Poverty124 125 commented that Emergency Department visits and hospitalisations of young children for infectious diseases could be reduced if children were able to receive free primary care services and free after hours services at any time of the day or night. Supporting this is the published data from Capital and Coast DHB, which showed a link between increased investment in primary healthcare and increased access to primary care among low income and high needs groups. This would be expected to lead to reductions in preventable ED visits and hospitalisations.126
Dental caries remains the most common chronic disease of childhood, and one of the most common reasons for hospital admissions for children in New Zealand. The most vulnerable children are shouldering the burden of this disease, with Māori and Pasifika children experiencing greater prevalence and severity of dental caries. Early childhood caries has deleterious effects on a child’s oral and general health, and significant numbers of preschool aged children experience pain and infection. There is enormous scope to reduce these inequalities, as most dental disease is preventable.127
Children require access to dental services to prevent problems and to avoid carrying serious problems into adulthood. For example, oral health status at age 5 predicts oral health at age 26.128 While dental services for children are free, there is maldistribution of these services and lack of resourcing in some areas, usually where the need is greatest. There is also a lack of monitoring to establish whether
120 Ruscoe, C., Haran, C. (2013) Implementation of free after-hours services for children under six in New Zealand, Child Poverty Action Group. http://www.cpag.org.nz/assets/Backgrounders/131105%20CPAG%20%20Under%206s%20afterhours%20healthcare%20final%20docx.pdf.
121 Haran C, Ruscoe C. (2013) Primary health care cost for children between 6 years and 17 years in New Zealand. Proceedings of Paediatric Society of New Zealand Annual Scientific Meeting.
122 Jatrana S, Crampton P, Richardson K, Norris P. (2012) Increasing prescription part charges will increase health inequalities in New Zealand. New Zealand Medical Journal; 125(1355):78-80. http://www.ncbi.nlm.nih.gov/pubmed/22722220.
123 Perry B. (2009). Non-income measures of material wellbeing and hardship; first results from the 2008 New Zealand Living Standards Survey, with international comparisons. Wellington: Ministry of Social Development. http://www.msd.govt.nz/about-msd-and-our-work/publications-resources/monitoring/living-standards/living-standards-2008.html.
124 Expert Advisory Group commissioned by the Office of the Commissioner for Children (2012) EAG Working Papers: Solutions to Child Poverty http://www.occ.org.nz/publications/expert-advisory-group/?category=12.
125 Expert Advisory Group on Solutions to Child Poverty (2012) Working Paper Number 17: Health policy and effective service delivery to mitigate the effects of child and youth poverty. Office of the Children’s Commissioner. Wellington. http://www.occ.org.nz/assets/Uploads/EAG/Working-papers/No-17-Health-policy.pdf.
126 Tan L, Carr J, Reidy J (2012). New Zealand evidence for the impact of primary healthcare investment in Capital and Coast District Health Board. New Zealand Medical Journal, 30, pp. 1325-1352. http://www.ncbi.nlm.nih.gov/pubmed/22472709.
127 Bach K, Manton DJ. (2014 in press) Early childhood caries: a New Zealand perspective. J Prim Health Care. 2014;6(2).128 Ministry of Health (2013) Review of Access to and Service Coverage of Community Oral Health Services. Wellington.
30
children most in need are actually receiving adequate services.129
An often overlooked problem in children is the need for spectacles to correct refractive errors. Visits to an optometrist, eye tests and spectacles (which are easily broken by children), all cost money which has to be balanced against other needs in low income families. Thus many children who need spectacles miss out, impairing their intellectual, psychological and social development.
RECOMMENDATION 6
Primary health care services are free for all children from maternity through to age 18, including general practice services, prescriptions, dental and optometry care.
Housing About 300,000 older New Zealand homes are un-insulated, damp and cold. Insulation for new housing became compulsory only in 1978 (see also Part 4 in this series).130 The high cost of heating cold, damp homes is unaffordable for many low income families; moreover, many of those who cannot afford to heat their homes choose expedient non-flued gas heating, which is unhealthy and worsens asthma.131 Houses become crowded because of the high cost of renting and buying. Māori and Pasifika children are more likely than others to be living in overcrowded homes, even within the same neighbourhood deprivation decile.132 Cold and damp homes with mould can cause ill health, such as cough or asthma.133 All of these unhealthy housing factors individually and collectively combine to cause disease.
New Zealand-based research has shown that improving housing quality improved self-rated health and self-reported wheezing, and reduced days off school and work, visits to general practitioners, and hospital admissions for respiratory conditions; for children with asthma, it significantly reduced their symptoms, days off school and healthcare visits.134 135 While there are a range of governmental and non-governmental initiatives to improve insulation, these have reached only a minority of the homes needing them. The government’s own state housing stock is not yet reliably healthy; and the
129 Expert Advisory Group on Solutions to Child Poverty (2012) Working Paper Number 17: Health policy and effective service delivery to mitigate the effects of child and youth poverty. Office of the Children’s Commissioner. Wellington. http://www.occ.org.nz/assets/Uploads/EAG/Working-papers/No-17-Health-policy.pdf.
130 Johnson, A. (2014) Part 4: Housing market changes and their impact on children, Child Poverty Action Group, at http://www.cpag.org.nz/assets/Publications/140812%20CPAG%20OurChildrenOurChoice-Part4Housing%202014.pdf.
131 Philippa Howden-Chapman, P. et al (2008) Effects of improved home heating on asthma in community dwelling children: randomised controlled trial. British Medical Journal, 2008: 337:a1411. http://www.bmj.com/content/337/bmj.a1411.
132 Craig E, Dell R, Reddington A, et al. (2013) Te Ohonga Ake: The Determinants of Health for Māori Children and Young People in New Zealand. Dunedin: NZ Child and Youth Epidemiology Service;2013.
133 Weinmayr G, Gehring U, Genuneit J, Büchele G, Kleiner A, Siebers R, Wickens K, Crane J, Brunekreef B, Strachan (2013) ‘Dampness and moulds in relation to respiratory and allergic symptoms in children: results from Phase Two of the International Study of Asthma and Allergies in Childhood (ISAAC Phase Two)’. Clinical and Experimental Allergy: Exp Allergy. 43(7):762-74. http://www.ncbi.nlm.nih.gov/pubmed/23786283.
134 R Chapman, P Howden-Chapman, H Viggers, D O’Dea, M Kennedy (2009). Retrofitting houses with insulation: a cost–benefit analysis of a randomised community trial, Journal of epidemiology and community health, 63 (4), 271-277. Stable URL: http://www.jstor.org/stable/20720939.
135 Jackson G, Thornley S, Woolston J, Papa D, Bernacchi A, Moore T (2011) Reduced acute hospitalisation with the health housing programme Journal of Epidemiology and Community Health; 65:588- 593. http://jech.bmj.com/content/65/7/588.full.pdf+html.
31
number of houses in New Zealand is insufficient for the population’s needs, especially in Auckland and Christchurch.136 A cross-party accord is needed to comprehensively address these issues.
RECOMMENDATION 7
Develop and fund programmes to ensure all homes are adequately insulated over the next decade; and develop a ten year national plan to overcome the shortage of healthy affordable housing.
Nutrition Inadequate and nutritionally poor food during pregnancy and childhood is linked to poor health outcomes. These include more frequent and more severe acute illnesses, but also poor long term outcomes such as high cholesterol and obesity,137 an increasing problem in New Zealand.138
There have been a range of efforts to raise awareness of healthy eating and to improve the eating habits of New Zealanders. Positive examples of public health programmes include the national Healthy Eating Healthy Action139 initiatives and Project Energise Waikato.140 However, these valuable programmes have not resulted in any overall consistent government strategy on nutrition, and there has been no particular focus on the challenges of nutrition for children living in poverty. The high cost of providing nutritious food for children is beyond the budget of some low income families, with teenagers’ meals being especially expensive.141
A Ministry of Health survey in 2003 revealed that around 20% of households with school-age children experienced food insecurity, with rates significantly higher among Pasifika, Māori, large families, and families from the lowest socio-economic groups.142
Children going to school hungry has been a topic for public discussion in the past few years, stimulated by CPAG’s own research.143 Breakfast is an important meal for improving uptake of nutrients, including iron, and regular breakfasts can reduce children’s likelihood of being overweight or obese. Hunger impairs children’s learning, and thus their life chances. While families have the responsibility to feed their children, when income is very low this may not be feasible at times (see
136 Johnson, A. (2013) Give me shelter, Salvation Army Social Policy and Parliamentary Unit, http://www.salvationarmy.org.nz/sites/default/files/uploads/GiveMeShelter2013FinalWeb.pdf.
137 World Health Organization (2003). Diet, Nutrition and the Prevention of Chronic Diseases. WHO Technical Report Series 916. Geneva: World Health Organization. Available online. URL: http://www.who.int/dietphysicalactivity/publications/trs916/en/.
138 Quigley R, Watts C (2005) Challenging beliefs about the marketing of food, NZMJ; 115: 1218.139 Ministry of Health (2014) Regional results from the 2011-2013 New Zealand Health Survey, at: http://www.health.govt.
nz/publication/regional-results-2011-2013-new-zealand-health-survey. 140 Waikato District Health Board (2014) Project Energize, http://www.waikatodhb.health.nz/public-health-advice/project-
energize/. 141 Hopgood, T., Asher, I., Wall, C., Grant, C., Stewart, J., Muimuiheata, S., et al. (2010). ‘Crunching the Numbers:
The Affordability of Nutritious Food for New Zealand Children’. Nutrition and Dietetics, 67(4), 251 – 257, at: http://weightmanagement.hiirc.org.nz/page/22905/crunching-the-numbers-the-affordability-of/;jsessionid=E2FE3660028BE09907CA1F05C832D77A?contentType=166§ion=466.
142 Ministry of Health (2003) NZ Food NZ Children: Key results of the 2002 national children’s nutrition survey. Wellington: Ministry of Health; http://www.health.govt.nz/system/files/documents/publications/nzfoodnzchildren-summary.pdf.
143 Wynd,D. (2011) Hunger for learning, Child poverty Action Group inc., http://www.cpag.org.nz/assets/Publications/2-0%2025804%20Hunger%20for%20Learning%20Brochure.pdf.
32
section on material deprivation). Children need to be fed regardless of their parents’ income.
To this end, CPAG has recommended that nutritional breakfasts should be made available universally to children in decile 1 and 2 primary, intermediate and primary/intermediate combined schools. Breakfast programmes need to be resourced properly through regular and secure partial funding from central government to cover most of the costs, and local businesses, parents and suitable non-governmental organisations need to seek partnerships with schools to assist with the provision of nutritional food.144
RECOMMENDATION 8
Develop a national child nutrition strategy, including a ‘food in schools’ programme.
Youth healthThe New Zealand Youth 2000 studies have studied teenagers in schools in 2000, 2007 and 2012.145 The 2012 study146 shows a more healthy generation of teenagers, with a marked reduction in tobacco use, alcohol consumption, binge drinking and illegal drug use, as well as lower rates of dangerous driving and small positive shifts in school life. The significant overall reduction in risk-taking behaviours among adolescents is a cause for optimism.
However, this ‘more healthy generation of teenagers’ are the young people with access to education and more likely to be non-Māori. The results of the survey demonstrated that Māori continue to leave school at an earlier age. In addition there are a number of young people excluded from school whose voices are not heard in the surveys. The report clearly identifies divisions between the ‘haves’ and ‘have nots’ in healthcare access and nutrition, and in the outlook for future education and training.
Young people in low income families are aware of the challenges their parents face living in surroundings that are less than ideal. The survey showed 43% of youth indicating that their parents worried about not having enough money for food. Living rooms used as bedrooms was a reality for 22% of survey participants, and 10% said the garage was used as a bedroom.
There is increasing evidence that the school environment can positively influence outcomes for teenagers.
In addition to access to education functioning as a structural determinant, there is strong evidence from high-income countries that stronger connection of young people and their parents with their school, together with aspects of school environment such as leadership and safety, positively affect many health outcomes directly. There is also emerging evidence that connections within school protects against a wide range of
144 Hopgood, T., Asher, I., Wall, C., Grant, C., Stewart, J., Muimuiheata, S., et al. (2010). ‘Crunching the Numbers: The Affordability of Nutritious Food for New Zealand Children’. Nutrition and Dietetics, 67(4), 251 – 257, at: http://weightmanagement.hiirc.org.nz/page/22905/crunching-the-numbers-the-affordability-of/;jsessionid=E2FE3660028BE09907CA1F05C832D77A?contentType=166§ion=466.
145 The Adolescent Health Research Group (AHRG) (2012) http://www.fmhs.auckland.ac.nz/faculty/ahrg/. 146 Clark, T. C., Lucassen, M. F. G., Bullen, P., Denny, S. J., Fleming, T. M., Robinson, E. M., & Rossen, F. V. (2014).
‘The Health and Well-Being of Transgender High School Students: Results From the New Zealand Adolescent Health Survey (Youth’12)’. Journal of Adolescent Health, (0) 1-7. http://dx.doi.org/10.1016/j.jadohealth.2013.11.008.
33
health risk behaviours in middle-income and low-income countries. Programmes that improve secondary school environment and connectedness are the most promising large-scale interventions for improving health outcomes in adolescence.147
RECOMMENDATION 9
Establish youth-friendly health and social services in all low decile secondary schools, with sustained Government funding.
Recent reports and recommendations In the last two years there have been several national reports on child poverty and child health. CPAG has developed our recommendations based on evidence, including evidence in these reports. We have summarised the recommendations in these recent reports relevant to child poverty and child health in relation to CPAG’s recommendations below and in Table 3.
Expert Advisory Group on Solutions to Child Poverty commissioned by the Office of the Commissioner for ChildrenThe most specific recent report on child poverty was the November 2012 report from the Expert Advisory Group (EAG) on Solutions to Child Poverty, commissioned by the Office of the Commissioner for Children.148 This has 78 recommendations to government on wide ranging areas, including on many of the issues covered in this chapter. Of the nine recommendations of CPAG in this chapter, eight are mirrored in that report (see Table 3).
Health Committee Report on improving child health outcomes and preventing child abuseThe Health Committee Report to Parliament, Inquiry into improving child health outcomes and preventing child abuse, with a focus on pre-conception until three years of age,149 was released in November 2013. It is a comprehensive and broad-reaching health report with three key areas of focus:
• Early intervention and the social and economic determinants of health and wellbeing
• Coordinated action across the government sector
• Improving specific services.
Many key recommendations related to child poverty and health, and all of them are supported by CPAG. Those mirrored by CPAG are summarised in Table 3 below.
147 Viner RM, Ozer, E.M., Denny, S., Marmot, M., Resnick, M., Fatusi, A., Currie, C. (2012) ‘Adolescence and the social determinants of health’. The Lancet Vol 379, pp 1641-52. http://dx.doi.org/10.1016/S0140-6736(12)60149-4.
148 Expert Advisory Group on Solutions to Child Poverty commissioned by the Office of the Commissioner for Children (2012): http://www.occ.org.nz/publications/expert-advisory-group/?category=12.
149 Health Select Committee (2013) Inquiry into improving child health outcomes and preventing child abuse with a focus from preconception under three years of age. Health Select Committee, Part 1 http://www.parliament.nz/resource/0002018580; Part 2 http://www.parliament.nz/resource/0002018582.

34
Maori Affairs Committee on determinants of wellbeing for tamariki MaoriThe Report of the Māori Affairs Committee, Inquiry into the determinants of wellbeing for tamariki Māori, was released in December 2013.150 This Committee agreed with the basic principles of the Health Committee’s Report (above). Poverty was highlighted throughout the report. The introduction states:
Around 22% of our 1.07 million children live in poverty. One in six of these children is Pakeha and one in three is Māori. There is evidence that the incidence of poverty is getting worse. The Children’s Commissioner told us that before 1988, income poverty rates were similar for Māori and Pakeha, but by 1994 the income poverty rate (after housing costs) for tamariki Māori jumped from somewhere under 10% to 50%. While the child poverty rate in the 1980s was around 11%, in 2012 it was between 25% and 27% in real terms. This trend appears to be disproportionately affecting Māori.
The conclusion of the report states:
Poverty is a major barrier to the wellbeing of tamariki Māori, and often has a domino effect in all areas of a tamaiti’s life. We believe that moving whanau out of poverty will benefit tamariki and allow whanau to build a strong foundation for a positive future.151
Among the 48 far-reaching recommendations, 40% were directly related to health. All of those recommendations are supported by CPAG. Those mirrored by CPAG are summarised in Table 3.
Child Wellbeing NetworkThere are common themes for action in all these reports, which are well expressed in the New Zealand Medical Association equity statement.152 This advocated for strong nationwide leadership with a voice for children at the highest level of Cabinet. All policies and strategies need child and equity impact assessments. Healthy children’s policy requires measures for, and monitoring of, progress on child hardship. Greater co-ordination and integration is required across all policy and service delivery domains. Enhanced effort and integrated approaches are required particularly in the early childhood years, with adequate investment and time to develop and be reviewed.
A group of child health experts have made more specific recommendations:153
• The approach needs to be based on a universal platform to enable identification of need
• Build on existing quality improvement and integrating frameworks for children’s services
• Resource effective community-led development initiatives to improve child wellbeing and reduce inequities
• Introduce evidence-based measures to protect children from harmful exposures
• Implement or broaden specific evidence-based measures in important child health areas –
150 Maori Affairs Select Committee (2013) Inquiry into the Determinants of Wellbeing for Tamariki Maori. Maori Affairs Committee. http://www.parliament.nz/resource/0002082460.
151 Ibid.152 Blakely T, Simmers D, Sharpe N (2011) ‘Inequalities in health and the Marmot Symposia: time for a stock take’, New
Zealand Medical Journal, 2011:124:1388. http://www.nzma.org.nz/sites/all/files/Marmot_NZMJeditorial.pdf.153 D’Souza A, Turner N, Simmers D, Craig E, Dowell T (2012) ‘Every child to thrive, belong and achieve? Time to reflect
and act in New Zealand’, New Zealand Medical Journal;125:1352. http://www.ncbi.nlm.nih.gov/pubmed/22472714.

35
particularly for child nutrition, infant and child mental health, respiratory and infectious diseases, injury prevention, oral health and sudden unexpected death in infancy prevention
• Continue and broaden the programmes which improve home heating and insulation
• Ensure the momentum towards all children having free access to primary care services continues and that the additional services that they and their parents need are available at no cost and in a timely fashion.
The White Paper for Vulnerable ChildrenThe Government’s White Paper for Vulnerable Children October 2012154 followed the Green Paper 2011, which held promise because of its title: Every child thrives, belongs, achieves. Ka whai oranga, ka whai wahi, ka whai taumata ia tamaiti.155
However, there was scant analysis in these papers of the role of poverty in child health and wellbeing. The higher rates of child ill health and abuse among Māori were inadequately considered, as illustrated by the Treaty of Waitangi being mentioned only once in the Green Paper, and not at all in the White Paper. This is disappointing, given New Zealand’s obligations to the Treaty of Waitangi and as a signatory to the United Nations Convention on the Rights of the Child, and the large disparities between ethnicities evident in children’s health and child abuse. The extraordinary efforts required to rectify these disparities seem to be overlooked by these governmental reports.156
Table 3 compares CPAG recommendations with the reports referenced above, and indicates the lack of attention in the White Paper to critical issues.
Table 3. Summary of recommendations from recent reports on child health and wellbeing compared
with CPAG’s recommendations
Children’s Commissioner (EAG)
Health Committee
Māori Affairs Committee
Child Wellbeing Network
White Paper on vulnerable children
CPAG recommends
A govt* plan to reduce child poverty
yes yes yes
Increased health funding for children
yes
Proportionate universalism for resourcing child health
yes yes yes
Free doctor’s visits yes yes yes yesMaternity care early and full enrolment
yes yes yes
154 Ministry of Social Development (2012) White Paper for Vulnerable Children. Ministry of Social Development. http://www.msd.govt.nz/documents/about-msd-and-our-work/work-programmes/policy-development/white-paper-vulnerable-children/white-paper-for-vulnerable-children-volume-1.pdf.
155 Maori Affairs Select Committee (2013) Inquiry into the Determinants of Wellbeing for Tamariki Maori. Ka whai oranga, ka whai wahi, ka whai taumata ia tamaiti. Maori Affairs Committee. http://www.parliament.nz/resource/0002082460.
156 Wynd, D. (2013) Child abuse: what role does poverty play? June. Child Poverty Action Group Inc. http://www.cpag.org.nz/assets/Publications/130610%20CPAG%20Child%20Abuse%20Report%201%20June%202013.pdf.
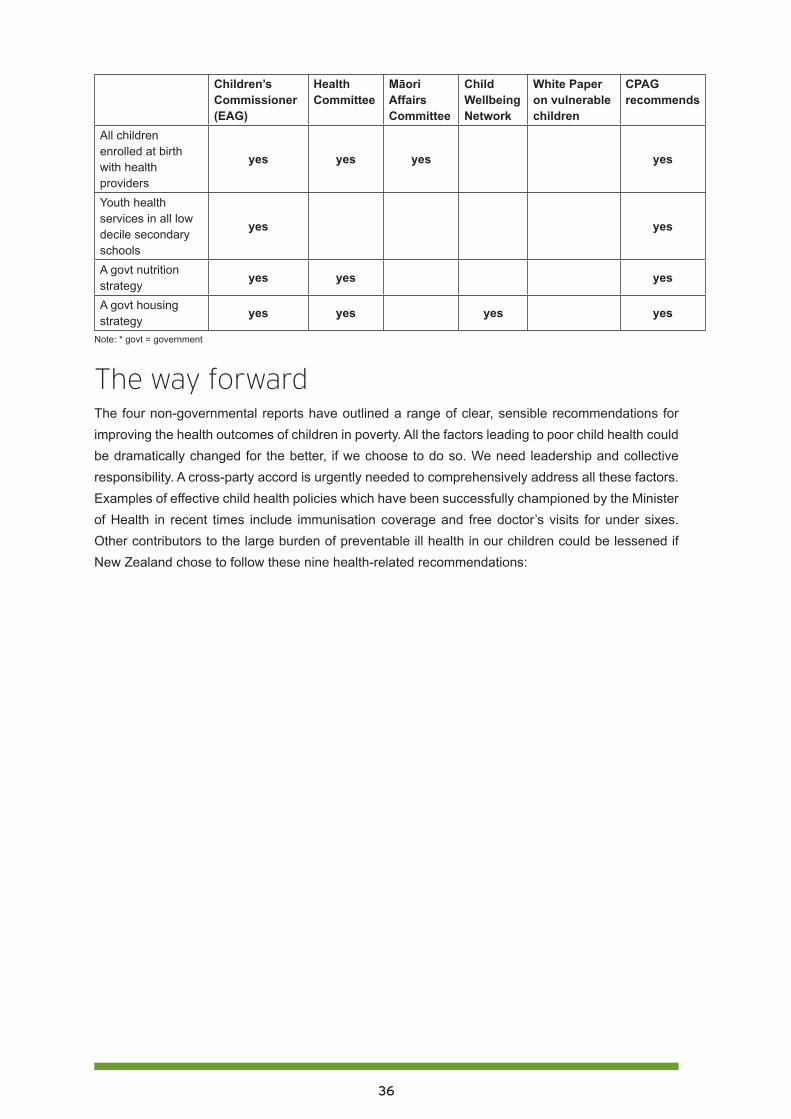
36
Children’s Commissioner (EAG)
Health Committee
Māori Affairs Committee
Child Wellbeing Network
White Paper on vulnerable children
CPAG recommends
All children enrolled at birth with health providers
yes yes yes yes
Youth health services in all low decile secondary schools
yes yes
A govt nutrition strategy
yes yes yes
A govt housing strategy
yes yes yes yes
Note: * govt = government
The way forwardThe four non-governmental reports have outlined a range of clear, sensible recommendations for improving the health outcomes of children in poverty. All the factors leading to poor child health could be dramatically changed for the better, if we choose to do so. We need leadership and collective responsibility. A cross-party accord is urgently needed to comprehensively address all these factors. Examples of effective child health policies which have been successfully championed by the Minister of Health in recent times include immunisation coverage and free doctor’s visits for under sixes. Other contributors to the large burden of preventable ill health in our children could be lessened if New Zealand chose to follow these nine health-related recommendations:
37
Full list of recommendations1. Government to design a comprehensive plan to reduce child poverty that includes actions,
targets, measurable outcomes and regular reporting requirements.
2. To improve the outcomes for children in poverty, provide universal healthcare services and targeted extra services based on assessment of further need.
3. Increase health funding for children to a level that achieves equal child health outcomes for all ethnic groups.
4. Provide effective and universal antenatal care/maternity services that include national targets and ensure all pregnant women are enrolled with maternity services as early as possible in their pregnancy.
5. Develop and share across all health service providers a universal common assessment plan and pathway for all children, starting antenatally and including universal enrolment at birth with primary care, national immunisation register, well child /tamariki ora providers and dental provider.
6. Make primary health care services free for all children from maternity through to age 18, including general practice services, prescriptions, dental and optometry care.
7. Develop and fund programmes to ensure all homes are adequately insulated over the next decade; and develop a ten year national plan to overcome the shortage of healthy affordable housing.
8. Develop a national child nutrition strategy, including a ‘food in schools’ programme.
9. Establish youth-friendly health and social services in all low decile secondary schools, with sustained Government funding.
Audio-visual resourcesBryan Bruce (2013) Inside Child Poverty: a special report: http://www.tv3.co.nz/Shows/InsideNZ/InsideChildPovertyASpecialReport.aspx.
Dr Rhys Jones (2014) Child health inequities: How do we become part of the solution? Starship Children’s Health, Paediatric Update (open with Internet Explorer) : https://www.starship.org.nz/for-health-professionals/paediatric-update/2014-archive/child-health-inequities-how-do-we-become-part-of-the-solution/.
Professor Innes Asher (2014) Recent welfare reform and sanctions. How might this affect your patients? Starship, Children’s Health. (Open with Internet Explorer): https://www.starship.org.nz/for-health-professionals/paediatric-update/2014-archive/recent-welfare-reform-and-sanctions-how-might-this-affect-your-patients/.
38
PART TWO: Early childhood care and education, and child poverty157
Jenny Ritchie, with Nola Harvey, Marianne Kayes, and Carol Smith
Dr Jenny Ritchie is Associate Professor, Early Childhood Teacher Education, at Te Whare Wānanga o Wairaka, Unitec Institute of Technology, Auckland
Nola Harvey is Senior Lecturer, Early Childhood Teacher Education, School of Curriculum and Pedagogy, Faculty of Education, University of Auckland
Marianne Kayes is an Early Childhood Teacher, University Supervisor and Hospital Play Specialist
Carol Smith, Te Rarawa, Pouako, Te Whare Wananga o Wairaka, Unitec Institute of Technology, Auckland
OverviewRecent information from the Ministry of Social Development (MSD) reveals that the nature and extent of child poverty in Aotearoa New Zealand is worse than previously acknowledged.158 159 The figure of 265,000 children below the poverty line of 60% of median income after housing costs was revised to 285,000 after a mistake (counting the accommodation supplement twice) was detected in early 2014. Not only are there 20,000 more children in poverty than previously thought, but most of those 285,000 children are further below the poverty line and have a greater depth of poverty than was understood. We now know that 205,000 children are below the very lowest poverty line of 50% of median household income. Independent measures of hardship, such as those shown in Figure 1, reveal alarmingly high levels of hardship among children in Māori and Pasifika groups and in families on benefits.
157 Acknowledgements: Our thanks to Janfrie Wakim, Co-convenor of Child Poverty Action Group, Dr M.Claire Dale and Associate Professor Susan St John, University of Auckland Business School, and Linda Petrenko, Small Kauri Childcare Centre, Mangere Bridge, for supporting us in the development of this policy paper.
158 Perry, B. (2014) Household Incomes in New Zealand: trends in indicators of inequality and hardship 1982 to 2012. Revisions 27 February 2014, Ministry of Social Development, at: https://www.msd.govt.nz/about-msd-and-our-work/publications-resources/monitoring/household-incomes/.
159 Rashbrooke, M. (2014). Poverty in New Zealand: even worse than we thought. Inequality. A New Zealand Conversation. Sparking debate about income gaps, the damage they do, and how to narrow them: Retrieved from http://www.inequality.org.nz/poverty-in-new-zealand-even-worse-than-we-thought/.
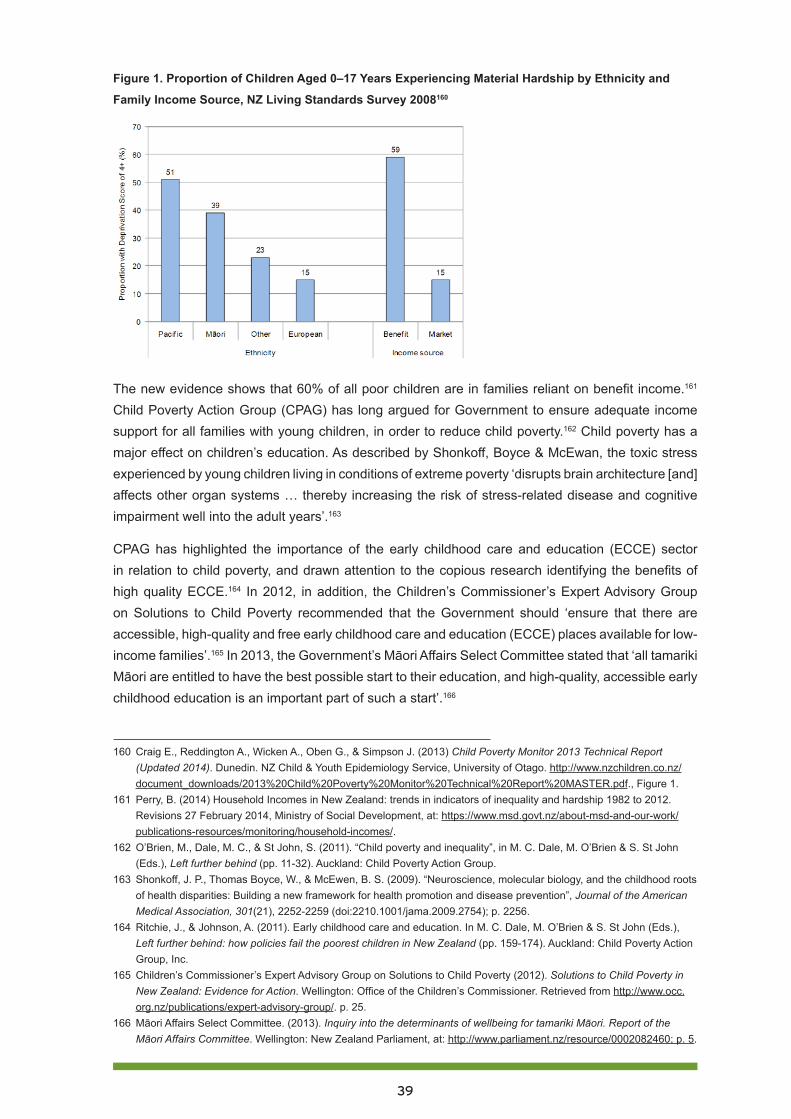
39
Figure 1. Proportion of Children Aged 0–17 Years Experiencing Material Hardship by Ethnicity and
Family Income Source, NZ Living Standards Survey 2008160
The new evidence shows that 60% of all poor children are in families reliant on benefit income.161 Child Poverty Action Group (CPAG) has long argued for Government to ensure adequate income support for all families with young children, in order to reduce child poverty.162 Child poverty has a major effect on children’s education. As described by Shonkoff, Boyce & McEwan, the toxic stress experienced by young children living in conditions of extreme poverty ‘disrupts brain architecture [and] affects other organ systems … thereby increasing the risk of stress-related disease and cognitive impairment well into the adult years’.163
CPAG has highlighted the importance of the early childhood care and education (ECCE) sector in relation to child poverty, and drawn attention to the copious research identifying the benefits of high quality ECCE.164 In 2012, in addition, the Children’s Commissioner’s Expert Advisory Group on Solutions to Child Poverty recommended that the Government should ‘ensure that there are accessible, high-quality and free early childhood care and education (ECCE) places available for low-income families’.165 In 2013, the Government’s Māori Affairs Select Committee stated that ‘all tamariki Māori are entitled to have the best possible start to their education, and high-quality, accessible early childhood education is an important part of such a start’.166
160 Craig E., Reddington A., Wicken A., Oben G., & Simpson J. (2013) Child Poverty Monitor 2013 Technical Report (Updated 2014). Dunedin. NZ Child & Youth Epidemiology Service, University of Otago. http://www.nzchildren.co.nz/document_downloads/2013%20Child%20Poverty%20Monitor%20Technical%20Report%20MASTER.pdf., Figure 1.
161 Perry, B. (2014) Household Incomes in New Zealand: trends in indicators of inequality and hardship 1982 to 2012. Revisions 27 February 2014, Ministry of Social Development, at: https://www.msd.govt.nz/about-msd-and-our-work/publications-resources/monitoring/household-incomes/.
162 O’Brien, M., Dale, M. C., & St John, S. (2011). “Child poverty and inequality”, in M. C. Dale, M. O’Brien & S. St John (Eds.), Left further behind (pp. 11-32). Auckland: Child Poverty Action Group.
163 Shonkoff, J. P., Thomas Boyce, W., & McEwen, B. S. (2009). “Neuroscience, molecular biology, and the childhood roots of health disparities: Building a new framework for health promotion and disease prevention”, Journal of the American Medical Association, 301(21), 2252-2259 (doi:2210.1001/jama.2009.2754); p. 2256.
164 Ritchie, J., & Johnson, A. (2011). Early childhood care and education. In M. C. Dale, M. O’Brien & S. St John (Eds.), Left further behind: how policies fail the poorest children in New Zealand (pp. 159-174). Auckland: Child Poverty Action Group, Inc.
165 Children’s Commissioner’s Expert Advisory Group on Solutions to Child Poverty (2012). Solutions to Child Poverty in New Zealand: Evidence for Action. Wellington: Office of the Children’s Commissioner. Retrieved from http://www.occ.org.nz/publications/expert-advisory-group/. p. 25.
166 Māori Affairs Select Committee. (2013). Inquiry into the determinants of wellbeing for tamariki Māori. Report of the Māori Affairs Committee. Wellington: New Zealand Parliament, at: http://www.parliament.nz/resource/0002082460; p. 5.
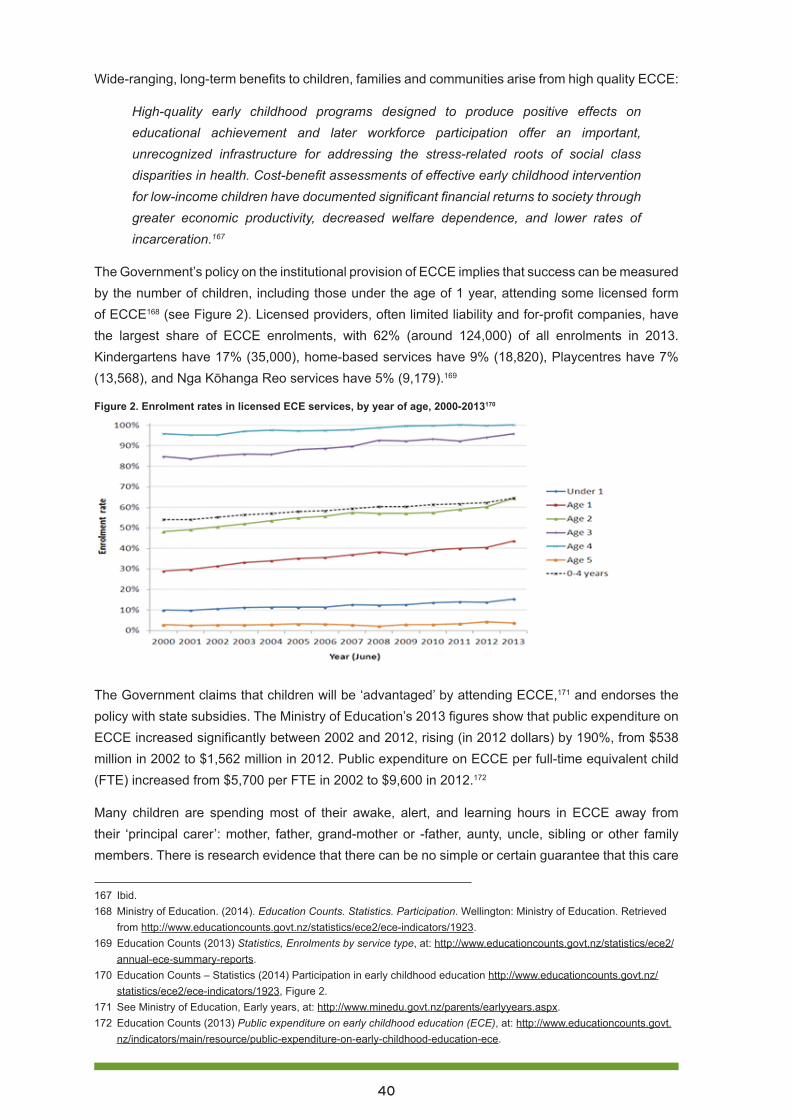
40
Wide-ranging, long-term benefits to children, families and communities arise from high quality ECCE:
High-quality early childhood programs designed to produce positive effects on educational achievement and later workforce participation offer an important, unrecognized infrastructure for addressing the stress-related roots of social class disparities in health. Cost-benefit assessments of effective early childhood intervention for low-income children have documented significant financial returns to society through greater economic productivity, decreased welfare dependence, and lower rates of incarceration.167
The Government’s policy on the institutional provision of ECCE implies that success can be measured by the number of children, including those under the age of 1 year, attending some licensed form of ECCE168 (see Figure 2). Licensed providers, often limited liability and for-profit companies, have the largest share of ECCE enrolments, with 62% (around 124,000) of all enrolments in 2013. Kindergartens have 17% (35,000), home-based services have 9% (18,820), Playcentres have 7% (13,568), and Nga Kōhanga Reo services have 5% (9,179).169
Figure 2. Enrolment rates in licensed ECE services, by year of age, 2000-2013170
The Government claims that children will be ‘advantaged’ by attending ECCE,171 and endorses the policy with state subsidies. The Ministry of Education’s 2013 figures show that public expenditure on ECCE increased significantly between 2002 and 2012, rising (in 2012 dollars) by 190%, from $538 million in 2002 to $1,562 million in 2012. Public expenditure on ECCE per full-time equivalent child (FTE) increased from $5,700 per FTE in 2002 to $9,600 in 2012.172
Many children are spending most of their awake, alert, and learning hours in ECCE away from their ‘principal carer’: mother, father, grand-mother or -father, aunty, uncle, sibling or other family members. There is research evidence that there can be no simple or certain guarantee that this care
167 Ibid.168 Ministry of Education. (2014). Education Counts. Statistics. Participation. Wellington: Ministry of Education. Retrieved
from http://www.educationcounts.govt.nz/statistics/ece2/ece-indicators/1923.169 Education Counts (2013) Statistics, Enrolments by service type, at: http://www.educationcounts.govt.nz/statistics/ece2/
annual-ece-summary-reports. 170 Education Counts – Statistics (2014) Participation in early childhood education http://www.educationcounts.govt.nz/
statistics/ece2/ece-indicators/1923, Figure 2.171 See Ministry of Education, Early years, at: http://www.minedu.govt.nz/parents/earlyyears.aspx. 172 Education Counts (2013) Public expenditure on early childhood education (ECE), at: http://www.educationcounts.govt.
nz/indicators/main/resource/public-expenditure-on-early-childhood-education-ece.

41
is always in the best interests of the child. As the Centre for Attachment states:
Because we live in a society that lacks sufficient paid parental leave policies, undervalues the work of parenting and lacks financial supports for parents who stay at home with their children, it can be very difficult to decide what is right, when to return to work, how many hours to work, and what your child really needs. Thankfully, several decades of research now exist in the field of early childhood care and its impact on babies, toddlers and young children. This data has shown that while there are many benefits of early childhood care and education, placing a child in non-maternal care can have a lasting negative impact on that child’s life unless there is sensitive consideration of timing, quality and goodness of fit for the child.173
Correlation is not causation. There is a great deal of discussion among politicians, educators and parents about the issue of increased participation in ECCE, particularly by children under 2 years.174 Consideration of this issue must include how to ensure that parents are not under pressure to choose any particular arrangement for infant care. ‘Politicians may lead the way by giving parents more freedom of choice in who cares for their infant’.175
There are many centre-based, parent-led ECCE services (although these are diminishing in number and enrolments). They include Playcentres, Ngā Kōhanga Reo, and licensed playgroups. In many cases, such services can and do cater well for families who want to be engaged with their children during the hours of ECCE (especially for infants and toddlers, in the case of playgroups) and do not want or need extended hours of out-of-family ECCE provision. The issues of quality and safety are much more critical in situations where parents place their children in the care of others for extended and ongoing periods. Therefore, this article focuses on ECCE provision in teacher-led centre-based services and in services based in the homes of non-family carers, rather than on parent-led services.
The 2012 Early Childhood Education Sector Advisory Group Report, Sector-wide quality, defined quality ECCE as:
evidenced where all children experience learning and teaching interactions which lead to those learning outcomes valued by whānau. The ERO has found that it is the combination of many aspects of practice that underpins the quality of education and care provided, rather than one factor on its own. These relate to both structures and processes and include governance and management, professional leadership, philosophy, vision, relationships and interactions, teaching and learning, assessment and planning, professional qualifications and support, and self review.176
173 Centre for Attachment (2014) The Basics of Attachment, at: http://www.centreforattachment.com/index.php?option=com_content&task=view&id=27&Itemid=45.
174 See, for example, Smith, A. B. (2006) “Early Childhood Theory, Research and Policy in Aotearoa-New Zealand: Their Development and Linkages”, Childrenz Issues: Journal of the Children’s Issues Centre, Vol. 10, No. 1, 2006: 23-29, 36, at: http://search.informit.com.au/fullText;dn=351771271596723;res=IELFSC.
175 White, C. (2013) Current perspectives on the increase of infants attending early childcare settings: The impact on children, families, teachers, the sector and wider society, He Kupu, at: http://www.hekupu.ac.nz/Journal%20files/Issue1%20June%202012/Current%20perspectives%20on%20the%20increase%20of%20infants%20attending%20early%20childcare%20settings%20The%20impact%20on%20children%20families%20teachers%20the%20sector%20and%20wider%20society.pdf.
176 Early Childhood Education Sector Advisory Group Report – Sector-wide quality http://www.lead.ece.govt.nz/~/media/Educate/Files/Reference%20Downloads/Lead/Files/RecentAnnouncements/SAGSectorQualityReport.pdf.
42
A key requirement for high quality ECCE in centre-based, teacher-led early childhood services is that the teachers be qualified,177 with that qualification recognised for teacher registration purposes.
There is consensus in the literature that staff need to be well educated and professional, with qualifications directly relevant to early childhood education, in order to deliver better outcomes and services that focus on the social, emotional, cognitive and physical development and learning of children attending formal early childhood services.178
Ensuring that such services are fully staffed with qualified and registered ECCE teachers not only meets the structural requirement of having qualified teachers, but is also more likely to deliver on the process aspects of quality, by increasing the likelihood of children being engaged in responsive, attuned, culturally relevant interactions in the context of stimulating programming.179 Other structural factors include ratios of teachers to children, small group sizes, and quality environments.180
ECCE caters for children in very diverse circumstances, as families vary widely in composition. They may include ties that are biological, adopted, blended and reconstituted, or extended. The family may include grandparents, uncles, aunts, cousins and beyond, in Māori ‘whānau’, Pasifika ‘fono’, and Pākehā, Asian and refugee group-based multigenerational family units sharing a home.181
Throughout the following discussion, we make recommendations to address the quality of ECCE provision in our ethnically diverse society, particularly provision for children under 2, and for Māori speaking and multilingual children. We also address the barriers to participation, especially for low income families. We discuss the increased reliance on the for-profit sector for provision of ECCE services; as well as issues for children in home-based care and children of beneficiaries. We position our concerns and recommendations alongside the Government’s obligations to protect children’s rights, which include the right to access to high quality, culturally and linguistically appropriate early childhood care and education. To ensure the rights we have already pledged to deliver for all our children, we urge adoption of these recommendations under cross-party agreements, so they will be applied, monitored, and evaluated in a reflective and ongoing long-term process.
High quality, culturally responsive care in a super-diverse societyThe demands on educators in Aotearoa, and particularly in Auckland, have been increased by what the Royal Society of New Zealand has termed a situation of ‘super-diversity’.182 New Zealand still
177 Saracho, O. N., & Spodek, B. (2007). Early childhood teachers’ preparation and the quality of program outcomes. Early child development and care, 177(1), 71-91.
178 Meade,A., Robinson, L., Smorti, S., Stuart, M., Williamson, J. with Carroll-Lind, J., Meagher-Lundberg, P. and Te Whau, S. (2012) Early Childhood Teachers’ Work in Education and Care Centres: Profiles, patterns and purposes, NZ Childcare Association, at: https://nzca.ac.nz/assets/RelatedDocuments/Early-Childhood-Teachers-work-in-education-and-carecentres-web-090812.pdf, p. 21.
179 Ibid, p. xii.180 Pariman, A. (2012). The relationship between the physical environment and learning: A blind spot in New Zealand early
childhood education discourse? New Zealand Annual Review of Education, 21, 21-45.181 Pool, I., J. Sceats and N. Jackson (2013). The wellbeing of New Zealand families and whanau: demographic
underpinnings. Wellington, Families Commission, at: http://www.familiescommission.org.nz/sites/default/files/status-report-2013-part-one-chapter-2.pdf
182 Royal Society of New Zealand. (2013). Languages in Aotearoa New Zealand. Wellington: Royal Society of New Zealand. Retrieved from http://www.royalsociety.org.nz/expert-advice/information-papers/yr2013/languages-in-aotearoa-new-zealand/.
43
lacks a national languages policy that would mandate expectations for our education system with regard to languages other than English. While responsive early childhood care and education is best achieved when the educator speaks the home language of the child(ren) in her/his care, this is not always possible in ‘super-diverse’ environments.
Responsive ECCE is even less likely to occur when children are being cared for and educated by unqualified caregivers who may lack the necessary range of knowledge, skills, and dispositions required to provide the learning environment stipulated under Te Whāriki, the internationally highly regarded New Zealand early childhood curriculum. A recent Education Review Office (ERO) national report highlighted the greater effectiveness of centre-based, teacher-led services with high levels of qualified teachers, such as the state kindergarten sector.183
The background to the issues of use of qualified teachers is set out in Meade et al’s Early Childhood Teachers’ Work in Education and Care Centres.184 Briefly, in 2002 the government developed a 10 year strategy, Pathways to the Future, to increase the proportion of qualified teachers in ECCE centres to match those in kindergartens. Until early 2011, New Zealand had a higher funding category for teaching teams with 100% qualified teachers. Most ECCE centres had between 50% and 95% qualified, with 50% set as the minimum requirement. Under the plan, 100% of regulated staff in every teacher-led service were required to be registered by 2012, matched by higher levels of subsidy to centres to cover the higher salary costs. There was some slippage in moving to this goal, and in 2010 the National-led Government abandoned the 100% target, and in 2011 they removed the special category of higher funding for centres with 100% qualified teachers. Those centres now receive only the lower level of subsidy for centres with 80% or more qualified teachers, and that level of subsidy has since been reduced.
The Government’s Early Childhood Education Sector Advisory Group reported that in 2011, ECCE services in poorer areas were over-represented in the numbers of services which received ERO reviews, indicating poor quality provision. This means that children in these low socio-economic circumstances are more likely to receive poor quality ECCE experiences.185
Children from disadvantaged circumstances stand to gain the most from high quality ECCE experiences. However, poor quality ECCE is potentially very damaging to infants and young children. Services with lower proportions of qualified and registered teachers are more likely to have a high percentage of Māori and Pasifika children, and to be situated in high social deprivation areas. The impact is therefore greater on the most disadvantaged children. The lowest quality ECCE centres are likely to be found in areas where there is the least ECCE provision or choice.186
183 Education Review Office. (2013). Priorities for children’s learning in early childhood services. Wellington: Education Review Office. Retrieved from http://www.ero.govt.nz/National-Reports/Priorities-for-Children-s-Learning-in-Early-Childhood-Services-May-2013.
184 Meade,A., Robinson, L., Smorti, S., Stuart, M., Williamson, J. with Carroll-Lind, J., Meagher-Lundberg, P. and Te Whau, S. (2012) Early Childhood Teachers’ Work in Education and Care Centres: Profiles, patterns and purposes, NZ Childcare Association, at: https://nzca.ac.nz/assets/RelatedDocuments/Early-Childhood-Teachers-work-in-education-and-carecentres-web-090812.pdf.
185 Early Childhood Education (ECE) Sector Advisory Group. (2012). Early Childhood Education Sector Advisory Group Report – Sector-wide quality. Wellington: Ministry of Education. Retrieved from http://www.lead.ece.govt.nz/~/media/Educate/Files/Reference%20Downloads/Lead/Files/RecentAnnouncements/SAGSectorQualityReport.pdf.
186 Early Childhood Education (ECE) Sector Advisory Group. (2012). Early Childhood Education Sector Advisory Group Report – Sector-wide quality. Wellington: Ministry of Education. Retrieved from http://www.lead.ece.govt.nz/~/media/Educate/Files/Reference%20Downloads/Lead/Files/RecentAnnouncements/SAGSectorQualityReport.pdf.
44
RECOMMENDATION 1
Require all staff in centre-based, teacher-led services who are counted in the teacher: child ratio to be qualified, registered teachers.
Valuing children’s language, culture and identity Despite the fact that Māori families consistently stipulate that they value highly ECCE provision that reflects their language and cultural values,187 only 23% of settings in a recent ERO national review of ECCE services were assessed as valuing the language, culture and identity of Māori children.188
A recent report from ERO suggests that a large number of services do not deliver education that is responsive to Māori identity, language, and culture. Two-thirds of Māori learners that participate in ECE participate in mainstream ECE services; this suggests that some 27,000 Māori learners may be experiencing variable quality of ECE. On the same basis, it is possible that many of the 8,200 Pasifika learners not enrolled in Pasifika immersion or bilingual services may be experiencing ECE that is not responsive to their identity, language, and culture, although there is less direct evidence for this.189
A similar lack of linguistic and cultural synergy may also be a key factor in the lower participation of those for whom the dominant New Zealand English language and culture are additional to their home languages and cultures. There is a need for teacher education providers to ensure the adequacy of teacher preparation in this regard.
A 2013 ERO national report found that only 14% of ECCE services demonstrated ‘very responsive practices that focused on achieving success for Māori children’.190 In the Government’s Māori Affairs Select Committee Report,191 192 Recommendation 16 states: Ensuring access for all whānau to well-designed pre-birth programmes, ante-natal care and education, and early childhood development
187 Dixon, R., Widdowson, D., Meagher-Lundberg, P., McMurchy-Pilkington, A., & McMurchy-Pilkington, C. (2007). Evaluation of Promoting Early Childhood Education (ECE) Participation Project. Report to the Ministry of Education. Wellington: Ministry of Education.
188 Early Childhood Education (ECE) Sector Advisory Group. (2012). Early Childhood Education Sector Advisory Group Report – Sector-wide quality. Wellington: Ministry of Education. Retrieved from http://www.lead.ece.govt.nz/~/media/Educate/Files/Reference%20Downloads/Lead/Files/RecentAnnouncements/SAGSectorQualityReport.pdf.
189 Early Childhood Education Sector Advisory Group Report (2012) Sector-wide quality http://www.lead.ece.govt.nz/~/media/Educate/Files/Reference%20Downloads/Lead/Files/RecentAnnouncements/SAGSectorQualityReport.pdf, p. 2.
190 Education Review Office (2013). Priorities for children’s learning in early childhood services. Wellington: Education Review Office. Retrieved from http://www.ero.govt.nz/National-Reports/Priorities-for-Children-s-Learning-in-Early-Childhood-Services-May-2013; p. 19.
191 Māori Affairs Select Committee. (2013). Inquiry into the determinants of wellbeing for tamariki Māori. Report of the Māori Affairs Committee. Wellington: New Zealand Parliament. Retrieved from http://www.parliament.nz/resource/0002082460.
192 New Zealand Government. (2014). Government response to report of Māori Affairs Committee on Inquiry into the Determinants of Wellbeing for Tamariki Māori. Wellington: New Zealand Parliament. Retrieved from http://www.parliament.nz/resource/0002231588.
45
programmes.193 In its response, the Government accepted this recommendation, and referred to its ECCE participation programme, but did not acknowledge barriers such as poverty and the lack of high quality, culturally appropriate services in many localities and communities.194
Similar concerns exist regarding the provision of quality for Pasifika communities in relation to home language retention. These have been highlighted by parents and grandparents and community elders.195 Further, the Government’s Select Committee Inquiry into Pacific Languages in Early Childhood Education gathered compelling evidence for the value and benefits of stronger support for home languages for Pasifika children, and many submitters expressed their concerns about quality of services and effective support for Pasifika cultures and languages.196
The New Zealand Teachers Council (NZTC) currently has the role of setting requirements, approval and processes for the monitoring and review of Initial Teacher Education (ITE) programmes and the Graduating Teacher Standards: Aotearoa New Zealand (2007).197 The NZTC is to be replaced by the Education Council of Aotearoa New Zealand (EDUCANZ), and the scope of this body ‘will be broadened to invest in leadership as well as quality teaching across the early childhood education and schooling sectors’,198 under a brief in the 2013 Budget to ‘lift the entry standards and quality of initial teacher education, including Māori medium programmes, the quality of practicum support for trainee teachers and coaching and mentoring for beginning teachers’.199
RECOMMENDATION 2
The Ministry of Education and ERO work together to ensure provision of high quality, culturally and linguistically responsive ECCE services, with particular emphasis on quality for infants and toddlers; EDUCANZ must ensure that students graduating from Initial Teacher Education programmes have the knowledge, competence and dispositions to implement and sustain high quality provision for all children.
A recent submission by New Zealand Kindergartens Inc. included recommendations that Government ensure that resources be made available to ECCE services to meet good practice indicators for bilingual/immersion programmes in early childhood education and throughout the education sector; the implementation of data gathering and goal setting in order to increase numbers of qualified
193 Māori Affairs Select Committee (2013). Inquiry into the determinants of wellbeing for tamariki Māori. Report of the Māori Affairs Committee. Wellington: New Zealand Parliament. Retrieved from http://www.parliament.nz/resource/0002082460; p. 7.
194 New Zealand Government. (2014). Government response to report of Māori Affairs Committee on Inquiry into the Determinants of Wellbeing for Tamariki Māori. Wellington: New Zealand Parliament. Retrieved from http://www.parliament.nz/resource/0002231588.
195 McCaffery, J., & McFall-McCaffery, J. (2010). O Tatatou o aga’i i fea?/’Oku tatu o ki fe?/ Where are we heading?: Pacific languages in Aotearoa/New Zealand. AlterNative Special Supplement Issue Ngaahi Lea ‘a e Kakai Pasifiki: Endangered Pacific Languages and Cultures, 6(2), 86– 121.
196 Report of the Education and Science Committee (2013) Inquiry into Pacific languages in early childhood education, at: http://www.parliament.nz/resource/en-nz/50DBSCH_SCR6016_1/58901894ca7314cece165273904eda601ad39934.
197 See: http://www.teacherscouncil.govt.nz/content/approval-review-and-monitoring-processes-and-requirements-initial-teacher-education-.
198 See: http://www.minedu.govt.nz/theMinistry/EducationInitiatives/ANewEducationProfessionalBodyEDUCANZ.aspx. 199 See: http://www.minedu.govt.nz/theMinistry/Budget/Budget13/PrimaryAndSecondary.aspx.
46
ECCE teachers who are fluent in a Pacific language; strengthening of content regarding teaching and learning for bilingual children, and language acquisition for all teachers through pre-service teacher education and on-going professional learning provision.200
RECOMMENDATION 3
Policies be generated and resources made available to oversee the enhancement of te reo Māori and Pacific Islands communities’ languages and cultures within the ECCE sector.
Reliance on market-driven provision of ECCE services also fails to meet the needs of refugee families, who aspire to ‘access the services that will enable them to reach their goals for productive participation in life in New Zealand’.201 Government funding of professional orientation and placement for teacher aides from refugee and Pacific Islands communities who speak the children’s respective home languages would assist this process.
The notion of ECCE services serving as community hubs, as raised by the Ministry’s ECE Taskforce,202 has the potential to meet the needs of refugee as well as other communities, providing it is culturally responsive:
Integrated multi-service early childhood education and care provision that encompasses children’s education and offers integrated support for families has the potential to offer wider possibilities for learning and for enhancing the agency of children and families than do stand-alone education services.203
RECOMMENDATION 4
Culturally attentive ECCE services be resourced to serve as community hubs, providing integrated responses to local needs.
The Government’s response to the Māori Affairs Select Committee Report204 205 accepts Recommendation 26, which affirms that teacher education programmes play a key role in developing teacher capacity to deliver high quality, culturally appropriate services, as guided by the New Zealand
200 New Zealand Kindergartens. Te Putahi Kura Puhou O Aotearoa. (2012). Inquiry into Pacific languages in early childhood education. Submission to the Education and Science Committee. Wellington: New Zealand Kindergartens. Te Putahi Kura Puhou O Aotearoa. Retrieved from http://www.nzkindergarten.org.nz/resources.html.
201 Mitchell, L., & Ouko, A. (2012). Experiences of Congolese refugee families in New Zealand: Challenges and possibilities for early childhood provision. Australasian Journal of Early Childhood, 37(1), 99-107; p. 106.
202 New Zealand Ministry of Education. (2011). An agenda for amazing children. Final report of the ECE taskforce. Wellington: Ministry of Education. Retrieved from http://www.taskforce.ece.govt.nz/wp-content/uploads/2011/06/Final_Report_ECE_Taskforce.pdf.
203 Mitchell, L., & Ouko, A. (2012). Experiences of Congolese refugee families in New Zealand: Challenges and possibilities for early childhood provision. Australasian Journal of Early Childhood, 37(1), 99-107; p. 106.
204 Māori Affairs Select Committee. (2013). Inquiry into the determinants of wellbeing for tamariki Māori. Report of the Māori Affairs Committee. Wellington: New Zealand Parliament. Retrieved from http://www.parliament.nz/resource/0002082460.
205 New Zealand Government. (2014). Government response to report of Māori Affairs Committee on Inquiry into the Determinants of Wellbeing for Tamariki Māori. Wellington: New Zealand Parliament. Retrieved from http://www.parliament.nz/resource/0002231588.
47
Teachers Council (NZTC) key framing documents:
• Graduating Teacher Standards: Aotearoa New Zealand (2007)
• Registered Teacher Criteria (2009)
• Tātaiako: Cultural Competencies for Teachers of Māori Learners (2011)206 207 208 209
However, it is ironic that this Government affirmation of aspirations articulated by the NZTC comes whilst it is simultaneously proposing the Education Amendment Bill No 2.210 This will replace the NZTC with the new body, EDUCANZ, members of which will be Government appointees, charged with changing the NZTC Code of Ethics to a new ‘Code of Conduct’.
There is a need for this new Council to uphold the current NZTC guiding documents, including the following over-arching aspirations:
• The Treaty of Waitangi extends equal status and rights to Māori and Pakeha. This places a particular responsibility on all teachers in Aotearoa New Zealand to promote equitable learning outcomes;
• In an increasingly multi-cultural Aotearoa New Zealand, teachers need to be aware of and respect the languages, heritages and cultures of all akonga/learners; and
• In Aotearoa New Zealand, the Code of Ethics/Ngā Tikanga Matatika commits registered teachers to the highest standards of professional service in promoting the learning of those they teach.211 212
Current policy does not prioritise high quality provision in the burgeoning private ECCE centres, despite the Government-commissioned ECE Taskforce Report highlighting the research which demonstrates the educational benefits to children of attending high quality ECCE programmes.213 Additional evidence is provided by a literature review commissioned by the Ministry of Education.214 This highlights the extreme importance of high quality provision for infants and toddlers in ECCE settings, since the absence of ‘attuned responsive care giving constrains the developing brain creating “black holes”… in the architecture of the brain that can persist throughout a lifetime’.215
206 New Zealand Ministry of Education, & New Zealand Teachers Council. (2011). Tātaiako: Cultural Competencies for Teachers of Mäori Learners. Wellington: New Zealand Ministry of Education & New Zealand Teachers Council. Retrieved from http://akoaotearoa.ac.nz/mi/download/ng/file/group-199/a-literature-review-of-kaupapa-maori-and-maori-education-pedagogy.pdf.
207 New Zealand Teachers Council. (2004). Code of ethics for registered teachers. Wellington: New Zealand Teachers Council. Retrieved from http://www.teacherscouncil.co.nz/content/code-ethics-registered-teachers-0.
208 New Zealand Teachers Council. (2007). Graduating Teacher Standards: Aotearoa New Zealand. Wellington: New Zealand Teachers Council. Retrieved from http://www.teacherscouncil.govt.nz/te/gts/index.stm.
209 New Zealand Teachers Council. (2009). Registered Teacher Criteria. Wellington: New Zealand Teachers Council. Retrieved from http://archive.teacherscouncil.govt.nz/rtc/rtcposter-english.pdf.
210 See: http://www.legislation.govt.nz/bill/government/2014/0193/latest/whole.html. 211 New Zealand Teachers Council. (2004). Code of ethics for registered teachers. Wellington: New Zealand Teachers
Council. Retrieved from http://www.teacherscouncil.co.nz/content/code-ethics-registered-teachers-0.212 New Zealand Teachers Council. (2009). Registered Teacher Criteria. Wellington: New Zealand Teachers Council.
Retrieved from http://archive.teacherscouncil.govt.nz/rtc/rtcposter-english.pdf.213 New Zealand Ministry of Education. (2011). An agenda for amazing children. Final report of the ECE taskforce.
Wellington: Ministry of Education. Retrieved from http://www.taskforce.ece.govt.nz/wp-content/uploads/2011/06/Final_Report_ECE_Taskforce.pdf.
214 Dalli, C., White, E. J., Rockel, J., & Duhn, I. (2011). Quality early childhood education for under-two-year-olds: What should it look like? A literature review. Report to the Ministry of Education. Wellington: Ministry of Education.
215 Ibid, p. 3.
48
Current regulations do not stipulate that there be a minimum number of qualified educators in infant and toddler sections of ECCE centres. Nor are the current minimum ratios of one educator to five babies adequate to ensure quality, engaged and responsive care.
Services are now able to have a maximum of 150 children enrolled (with a maximum of 75 babies and toddlers under 2), with no limits set for group size. These conditions were not amended even when, in 2011, the ECE Taskforce report recommended regulating for a minimum of 80% registered staff in teacher-led, centre-based services, as well as strengthening quality measures for home-based services, education and care for children under 2, and reducing maximum group sizes.216
RECOMMENDATION 5
Increase the ratios of adults to children for infants and toddlers, and provide clear recommendations and guidance regarding appropriate group size.
Barriers to participationECCE is provided in a range of environments with variable costs. On 15 May 2014, the Finance Minister announced a funding increase of $155.7 million for early childhood education. Nearly $54 million is for increasing subsidy rates, ‘to help keep fees affordable for parents’. The remainder will be allocated over the next four years to help meet the forecast extra demand to be created by increased participation, as the Government seeks to have 98% of children enrolled in ECCE by 2016.217
Despite the increase, subsidy rates will still not reach the levels that applied prior to the National Government’s funding cuts in 2011. Then, the top subsidy rate for 20 hours ECCE was $12.73 per child per hour for kindergartens and childcare centres in the 100% fully qualified staff funding band, and $11.78 for those in the 80-99% funding band. From July 2014, after the increase, the top rate will be just $11.43 for childcare centres and $11.72 for kindergartens; for those under 2, the top rate will be $12.12 per child per hour in childcare, compared with $13.35 in 2010. Rates for sessional services will continue to be significantly lower than those for all-day services.218 The cost of high quality, appropriate ECCE will remain a barrier for many families.
216 New Zealand Ministry of Education. (2011). An agenda for amazing children. Final report of the ECE taskforce. Wellington: Ministry of Education. Retrieved from http://www.taskforce.ece.govt.nz/wp-content/uploads/2011/06/Final_Report_ECE_Taskforce.pdf.
217 Child Forum, May Newsletter, (2014), at: http://www.childforum.com/index.php?option=com_content&view=article&id=1194:budget-2014-spending-increases-and-new-initiatives-for-the-early-childhood-education-ece-sector&catid=64:news-for-early-childhood-education-&Itemid=172.
218 Ibid.

49
ECCE is only ‘free’ to parents for 20 hours for 3 and 4 year olds. Typical charges faced by parents in Auckland may be around $270 a week for a child under 2 for a full week and $166 for a child 3 and over, but can be much higher.
A 2011 survey of income, expenditure and fees of ECCE providers, (Table 2) showed estimates of fees charged, in addition to Government subsidies and fund-raising, and excluding optional charges for discrete items and one-off activities.219 Parental charges for ‘20 hours ECE’ include optional charges for care, not for discrete items and one-off activities, and nearly 40% of services levied additional charges.
The distribution of fees varied between service types. Playcentres’ charges were less than $1 an hour at 95% of services, while 72% of home-based services charged between $5 and $6 an hour. Education and care services and kindergartens had wider distributions, with 68% of education and care services charging between $4 and $7 an hour, and 76% of kindergartens’ charges between $2 and $4 an hour.220
Table 2. Average parental charges per hour221
Work and Income provides an income tested per hour subsidy to help low income parents. As Table 3 shows, for 2014, the subsidies reduce very rapidly as soon as income is earned over the threshold. For a one child family on a gross annual income of $62,400, earning another gross $10,400 a year means that all the subsidy disappears. Even without allowing for other imposts on that extra $10,400 such as tax, this operates like an effective 100% tax. It is a confusing and scary picture for families with incomes around the threshold amounts.
219 Arnold, J., Scott, D. (2012) 2011 Survey of Income, Expenditure and Fees of Early Childhood Education Providers in New Zealand, Ministry of Education, http://www.educationcounts.govt.nz/publications/ECE/income-expenditure-and-fees-of-ece-providers-in-new-zealand.
220 Ibid.221 Ibid, Table 3.

50
Table 3. Work and Income childcare subsidies, 2014222
Families struggling with financial deprivation face overwhelming challenges in ensuring that their children gain access to high quality ECCE services. They may not have a vehicle, and may live some distance from public transport, which also entails costs. Many ECCE services charge additional fees beyond the 20 hours subsidy even if the family requires only 20 hours. There are bureaucratic hurdles to overcome, including complex family income forms to fill in when applying to Work and Income for childcare subsidies.
Children require adequate nutrition in order to face a day of active engagement in an educational setting, and parents may be required to provide a lunchbox full of (costly) ‘healthy kai’ for their child to eat during the day. Other additional costs include clothing, sunhats, footwear, raincoats, and medical costs for older family members if their child brings home an illness picked up from other children at the ECCE setting. The illness of a parent or caregiver, particularly in winter, can mean that a child is unable to be transported to the ECCE service, which may result in that child losing her/his place on the roll.
Additional problems confront low income families who are compelled to move frequently as they seek affordable rental accommodation. Places are lost where families cannot maintain continuity of residence near the ECCE service.
222 See: http://www.workandincome.govt.nz/manuals-and-procedures/deskfile/extra_help_information/childcare_assistance_tables/childcare_subsidy_income_limits_and_rates.htm.
51
ECCE centres point to numerous problems regarding the administration of this programme, many of which add to the barriers faced by families.223 For example, for parents in education or training, Work and Income subsidies cease during term breaks. This creates either an impossible cost burden for the family to retain the place for that child and maintain attendance; or a dilemma for the service provider: do they keep the child’s place and the necessary staff at their own cost, or do they open that space for another child who will generate the income for the centre to remain viable?
There is another set of problems for families and providers around accessing the support funding for children with special needs or with health problems.
RECOMMENDATION 6
Government acknowledge the hidden costs of attendance at ECCE and subsidise or fund low income families to enable timely, equitable access to quality ECCE services.
Recognising rights of beneficiaries and their childrenIt is now mandatory for beneficiaries to ensure that their 3-5 year-old children are enrolled in and regularly attend a licensed ECCE service or that they themselves participate in a MSD-approved early parenting programme.224 If they fail to ensure their child’s attendance, benefits can be reduced by up to 50%.225 226 This compulsory ECCE attendance is not required of any children other than those of beneficiaries, and is imposed in a context in which the quality and relevance of the provision accessible to these children may be questionable, and may even be found wanting by Government agencies such as ERO.
Such discrimination against beneficiary families flouts the research on bonding and intellectual and social development for children, as discussed above. In this reprehensible, discriminatory situation, beneficiary families and their children receive messages that they are second-class citizens, and that as parents they are unqualified to determine the best form of care and support for their young children. Such discrimination may offend against our own human rights legislation, and there is no doubt that it contravenes Article 2 of the UNCROC to which New Zealand is a signatory:
1. States Parties shall respect and ensure the rights set forth in the present Convention to each child within their jurisdiction without discrimination of any kind, irrespective of the child’s or his or her parent’s or legal guardian’s race, colour, sex, language, religion,
223 See: Catriona MacLennan (2014) Child Poverty in Aotearoa Episode 4: the focus is on early childhood care and education and features interviews with Carol Smith (Te Rarawa no Ahipara, Te Whare Wananga o Wairaka), Lucy Koro (Fa’amasani Aoga Preschool/ Daycare), Linda Petrenko (Small Kauri Childcare Centre), and Meg Moss (MARC Early Learning Centre): http://www.youtube.com/watch?v=nyTtJi-Pr_E.
224 Social Security (Benefit Categories and Work Focus) Amendment Act 2013, 60RA Social obligations of certain beneficiaries with dependent children (3) at: http://www.legislation.govt.nz/act/public/2013/0013/latest/DLM4542304.html.
225 Collins, S. (2012) Fear over beneficiary child changes, New Zealand Herald, 12 September, at http://www.nzherald.co.nz/nz/news/article.cfm?c_id=1&objectid=10833412.
226 Wynd, D. (2013) Benefit sanctions: creating an invisible underclass of children? Child Poverty Action Group Inc.; http://www.cpag.org.nz/assets/Backgrounders/2-0%2028509%20Benefit%20Sanctions%20Report%20Sept%202013.pdf.
52
political or other opinion, national, ethnic or social origin, property, disability, birth or other status.
2. States Parties shall take all appropriate measures to ensure that the child is protected against all forms of discrimination or punishment on the basis of the status, activities, expressed opinions, or beliefs of the child’s parents, legal guardians, or family members.227
RECOMMENDATION 7
Government end the discriminatory policy of enforcing compulsory ECCE participation for individual beneficiary families and children who are already struggling with multiple challenges, not least of which is poverty.
Reliance on for-profit sector for ECCE provisionSince the 1990s there has been a lack of Government oversight of the growth of the for-profit ECCE sector. This is despite the dramatic increase in the enrolments of children in private for-profit ECCE centres (excluding home-based centres), from 36,950 in 2000 to 83,349 in 2013.228
Historically the ECCE sector has been seen as non-compulsory, and therefore has not been viewed by Government as a core responsibility. More recently, to support the political preference to encourage women to engage in the workforce, it became economically useful to have places for young children available in ECCE services, although there have never been enough high quality, culturally responsive, affordable and accessible places available nationwide. In this context ECCE meets the needs of the economy and of Government policy, rather than meeting the needs of children for high quality, culturally responsive ECCE provision.
The 2007 Labour-led Government’s introduction of ‘20 Hours Free ECE’ (subsequently changed to be no longer fully ‘free’) was a huge boon to the private ECCE sector,229 230 and the resultant mushrooming of for-profit centres led to Government concern about this expenditure. However, there was no mechanism to deliver equitable access to ECCE services in low socio-economic and rural areas, and for-profit services showed little interest in filling this gap. While some efforts are now being made to address this gap through targeted participation programmes, nevertheless the ‘model of market-based provision and demand subsidies has clearly not worked for New Zealand’s poorest and most vulnerable children’.231
227 United Nations Convention on the Rights of the Child (1989) http://www.ohchr.org/EN/ProfessionalInterest/Pages/CRC.aspx
228 Ministry of Education. (2014). Education Counts. Statistics. Participation. Wellington: Ministry of Education. Retrieved from http://www.educationcounts.govt.nz/statistics/ece2/participation.
229 Ritchie, J. (2008). The 20 hours free policy In S. St John & D. Wynd (Eds.), Left behind. How social and economic inequalities damage New Zealand’s children (pp. 103-109). Auckland: Child Poverty Action Group.
230 Ritchie, J., & Johnson, A. (2011). Early childhood care and education. In M. C. Dale, M. O’Brien & S. St John (Eds.), Left further behind: how policies fail the poorest children in New Zealand (pp. 159-174). Auckland: Child Poverty Action Group, Inc.
231 Ibid, p. 173.
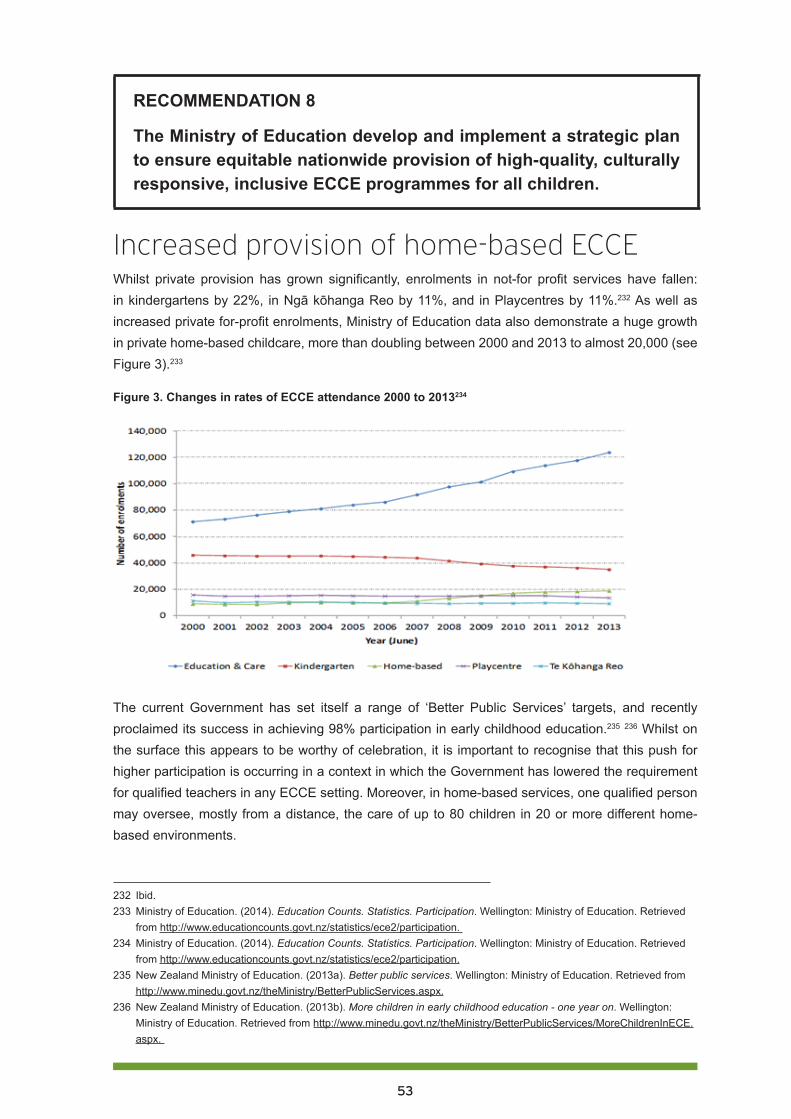
53
RECOMMENDATION 8
The Ministry of Education develop and implement a strategic plan to ensure equitable nationwide provision of high-quality, culturally responsive, inclusive ECCE programmes for all children.
Increased provision of home-based ECCEWhilst private provision has grown significantly, enrolments in not-for profit services have fallen: in kindergartens by 22%, in Ngā kōhanga Reo by 11%, and in Playcentres by 11%.232 As well as increased private for-profit enrolments, Ministry of Education data also demonstrate a huge growth in private home-based childcare, more than doubling between 2000 and 2013 to almost 20,000 (see Figure 3).233
Figure 3. Changes in rates of ECCE attendance 2000 to 2013234
The current Government has set itself a range of ‘Better Public Services’ targets, and recently proclaimed its success in achieving 98% participation in early childhood education.235 236 Whilst on the surface this appears to be worthy of celebration, it is important to recognise that this push for higher participation is occurring in a context in which the Government has lowered the requirement for qualified teachers in any ECCE setting. Moreover, in home-based services, one qualified person may oversee, mostly from a distance, the care of up to 80 children in 20 or more different home-based environments.
232 Ibid.233 Ministry of Education. (2014). Education Counts. Statistics. Participation. Wellington: Ministry of Education. Retrieved
from http://www.educationcounts.govt.nz/statistics/ece2/participation. 234 Ministry of Education. (2014). Education Counts. Statistics. Participation. Wellington: Ministry of Education. Retrieved
from http://www.educationcounts.govt.nz/statistics/ece2/participation.235 New Zealand Ministry of Education. (2013a). Better public services. Wellington: Ministry of Education. Retrieved from
http://www.minedu.govt.nz/theMinistry/BetterPublicServices.aspx.236 New Zealand Ministry of Education. (2013b). More children in early childhood education - one year on. Wellington:
Ministry of Education. Retrieved from http://www.minedu.govt.nz/theMinistry/BetterPublicServices/MoreChildrenInECE.aspx.

54
Given the range of responsibilities of the educator, it is also of some concern that included in the 2009 amendments to the Education (Early Childhood Services) Regulations 2008 was an amendment lowering the age at which a person is counted as an adult from 20 to 17 years, for the purposes of the requirements for working in both home-based services and centre-based services (see Schedule 2 of the ECE Regulations). Under UNCROC, a person under 18 years of age is defined as a child.237
In 2011, the Ministry of Education’s ECE Taskforce reported that:
While home-based services have some strong quality characteristics, such as small group sizes and low ratios, they do not have a qualified, professional workforce, which we regard to be essential to good outcomes from early childhood education. Instead, up to twenty educators without high-level early childhood education teaching qualifications are supervised by a single qualified teacher in the role of the network’s coordinator.238
Furthermore, the Taskforce was concerned that ‘One teacher can be responsible for educators in charge of 80 children in total. Despite this, home-based services are funded as teacher-led services in the existing funding system. This is unacceptable.’239 The Taskforce described ERO concerns regarding home-based ECCE provision as ‘deeply troubling’.240
RECOMMENDATION 9
The Ministry of Education provide clear expectations for the extent and nature of supervision of home-based carers, and the Education Review Office be resourced to undertake careful monitoring of the quality of home-based ECCE provision.
RECOMMENDATION 10
The Ministry of Education require all home-based educarers to be either qualified teachers, or to attend and complete a required set of professional learning opportunities for home-based provision, which could be offered as modules toward an NZQA certificate in home-based ECCE.
237 Ministry of Education, ECE Lead, 2008 Regulations Amendments, at http://www.lead.ece.govt.nz/ManagementInformation/RegulatoryFrameworkForECEServices/2008RegulationsAmendments.aspx.
238 New Zealand Ministry of Education. (2011). An agenda for amazing children. Final report of the ECE taskforce. Wellington: Ministry of Education. Retrieved from http://www.taskforce.ece.govt.nz/wp-content/uploads/2011/06/Final_Report_ECE_Taskforce.pdf; p. 45.
239 Ibid, p. 57.240 Ibid.
55
ConclusionCurrently, the New Zealand Government is failing in its obligations to protect children’s rights, which include the right to be able to access high quality, culturally appropriate education. While there has been a concerted focus on improving participation – and even of requiring participation by some beneficiary families – this has not been accompanied by an equal focus on ensuring that all services are of high quality. A recent article analysing UK and Australian ECCE policies could be applied equally here, in that our Government’s market-oriented approach and preference for private provision is ‘in tension with their rhetorical commitment to social investment in children and ECCE. Consequently, Governments’ objectives about investing in high quality ECCE for all children have been overshadowed by the imperatives of providing opportunities for private investment.’241
It is of great concern to CPAG that low income children and families, made increasingly vulnerable by punitive and targeted social policies, may in addition suffer the harm of poor quality early childhood care and education. Given the huge growth in private providers of what is essentially a state responsibility, there must be accountability not only for Government funding, but also for ensuring that services are responsive to families’ values and aspirations for their children. Regardless of the type of service, or the ownership – private, community or state – the Government has a responsibility to ensure that each and every child who participates in ECCE experiences a learning environment where they and their families feel that they belong and where their wellbeing is nurtured. If this approach is followed, the potential benefits of ECCE are more likely to be realised for children, their families, and our communities.
We urge adoption of these recommendations under cross-party agreements, to ensure that the children’s rights we have already committed to deliver will be applied, monitored, and evaluated in a reflective and ongoing long-term process. We know that age- appropriate participation in high quality ECCE benefits children, whereas poor quality services and over-provision do damage. We also know that children who are already disadvantaged are the most likely to benefit from high quality ECCE provision, and at the same time are the most vulnerable to potential harm. It is essential therefore that Government policies to increase participation are accompanied by an equal focus on ensuring that all ECCE services are of high quality and are culturally responsive, putting the needs of children before the needs of the economy, and ensuring that there are no barriers to participation by our poorest children and their families. Moreover, compulsory participation for the children of one group of parents only should have no place in government policies.
241 Adamson, E., & Brennan, D. (2014). Social investment or private profit? Diverging notions of ‘investment’ in early childhood education and care. International Journal of Early Childhood, 46, 47-61. DOI 10.1007/s13158-13013-10098-x; p. 59.
56
Full list of recommendations: 1. Require all staff in centre-based, teacher-led services who are counted in the teacher: child ratio
to be qualified, registered teachers.
2. The Ministry of Education and ERO work together to ensure provision of high quality, culturally and linguistically responsive ECCE services, with particular emphasis on quality for infants and toddlers; EDUCANZ must ensure that students graduating from Initial Teacher Education programmes have the knowledge, competence and dispositions to implement and sustain high quality provision for all children.
3. Policies be generated and resources made available to oversee the enhancement of te reo Māori and Pacific Islands communities’ languages and cultures within the ECCE sector.
4. Culturally attentive ECCE services be resourced to serve as community hubs, providing integrated responses to local needs.
5. Increase the ratios of adults to children for infants and toddlers, and provide clear recommendations and guidance regarding appropriate group size.
6. Government acknowledge the hidden costs of attendance at ECCE and subsidise or fund low income families to enable timely, equitable access to quality ECCE services.
7. Government ends the discriminatory policy of enforcing compulsory ECCE participation for individual beneficiary families and children who are already struggling with multiple challenges, not least of which is poverty.
8. The Ministry of Education develop and implement a strategic plan to ensure equitable nationwide provision of high-quality, culturally responsive, inclusive ECCE programmes for all children.
9. The Ministry of Education provide clear expectations for the extent and nature of supervision of home-based carers, and the Education Review Office be resourced to undertake careful monitoring of the quality of home-based ECCE provision.
10. The Ministry of Education require all home-based educarers to be either qualified teachers, or to attend and complete a required set of professional learning opportunities for home-based provision, which could be offered as modules toward an NZQA certificate in home-based ECCE.
57
Audio-visual resourcesCatriona MacLennan (2014) Child Poverty in Aotearoa Episode 4: early childhood care and education and features interviews with Carol Smith (Te Rarawa no Ahipara, Te Whare Wananga o Wairaka), Lucy Koro (Fa’amasani Aoga Preschool/ Daycare), Linda Petrenko (Small Kauri Childcare Centre), and Meg Moss (MARC Early Learning Centre): http://www.youtube.com/watch?v=nyTtJi-Pr_E.
NZEI Te Riu Roa (2014) Quality for infants and toddlers: what does quality look like in the care and education of children who are under two? https://www.youtube.com/watch?v=xs9bd1RV_Fw
Humewood House Association (2013) First Five Years Fund, at: http://www.youtube.com/watch?v=Eis-CLs6ds8
The Ounce (2011) Quality Preschool Teacher-Child Interaction, at: http://www.youtube.com/watch?v=82wIKsW8tfo&index=13&list=PLoYCO2fwBJJpPrIy7mLNSWnOPoSKdMk-R.
The Ounce (2013) Skilled Teaching, at http://www.youtube.com/watch?v=82wIKsW8tfo&index=13&list=PLoYCO2fwBJJpPrIy7mLNSWnOPoSKdMk-R.
58
PART THREE: Compulsory schooling and child povertyJohn O’Neill
Dr John O’Neill is Professor and Associate Director (Research), Institute of Education, Massey University, based in Palmerston North.
OverviewAll state schools in New Zealand are allocated to one of ten deciles, with decile 1 schools having the highest proportion of students from socio-economically disadvantaged communities. The socio-economic status (SES) or relative disadvantage of each school is determined using census information at meshblock level on five indicators: household income, parental occupation, household crowding, parents without qualifications, and parental receipt of income support.242 The decile rating applies to the school as a whole and does not measure socio-economic disadvantage at the individual family level. SES includes direct measures of relative income poverty, but also non-income indicators that have been shown in empirical research to be strongly associated with socio-economic disadvantage.
All school communities in the same low decile band are not necessarily disadvantaged in identical ways; nor are all families in the same low-decile school necessarily disadvantaged in identical ways. These qualifications are particularly important when considering claims that some disadvantaged school communities do better than others in helping their poorer students to achieve in what may appear to be very similar socio-economic circumstances. It would be quite wrong, for example, to infer that because 285,000 or one in four children in New Zealand live in poverty,243 or in households at medium or high risk of poor child outcomes,244 these children all attend decile 1 to 3 schools. Families and/or individual children can, of course, overcome disadvantage, and often do. The issue is the extent to which the compulsory education system makes that struggle easier or more difficult for all children.
New entrants to schoolingHow well do today’s children who live in poverty fare in the New Zealand compulsory schooling system, compared with others who are more advantaged socio-economically? The current Government’s Better Public Services early childhood care and education (ECCE) target is that by 2016, 98% of children starting school will have participated in ‘quality’ ECCE.245 For children entering decile 1-3 schools, this requires an increase in ECCE participation from 89% in December 2012.246
242 http://www.minedu.govt.nz/NZEducation/EducationPolicies/Schools/SchoolOperations/Resourcing/OperationalFunding/Deciles/HowTheDecileIsCalculated.aspx.
243 Craig E, Reddington A, Wicken A, Oben G, & Simpson J. (2013) Child Poverty Monitor 2013 Technical Report (Updated 2014). Dunedin. NZ Child & Youth Epidemiology Service, University of Otago, p. 14.
244 Statistics New Zealand (2012). Vulnerable children and families: Some findings from the New Zealand general social survey. Downloaded from http://www.stats.govt.nz/browse_for_stats/people_and_communities/Children/vulnerable-children.aspx.
245 See Part two in Our children, our choice series, “Early Childhood care and education, and child poverty”, at: http://www.cpag.org.nz/assets/Publications/1-0%20Our%20Children%20Our%20Choice%20Part%202.pdf.
246 Statistics New Zealand (2012). Vulnerable children and families: Some findings from the New Zealand general social survey. Downloaded from http://www.stats.govt.nz/browse_for_stats/people_and_communities/Children/vulnerable-children.aspx., p. 24.

59
In the December 2013 quarter, of those children who had participated in ECCE irregularly or for only the last six months of last year, 37.5% entered decile 1 schools, while only 20.5% entered decile 10 schools.247 In contrast, of those children who had attended ECCE for the previous two, three or four years, 59.9% entered decile 1 schools, compared with 77.0% entering decile 10 schools. While these latter statistics are only a snapshot, and no data are provided on the relative quality of the ECCE attended, it seems reasonable to observe that the children in our society who are already the most socio-economically advantaged typically attend ECCE more regularly and for longer than do children who start life in poverty and associated forms of disadvantage.
A significant problem in measuring the consequences of differences in ECCE attendance rates for children in poverty is the absence of national level data on children’s cognitive, affective and developmental progress on entry to school. In other words, what are their educational needs when they start school? For some years from the mid-1990s, the Ministry of Education developed and supported the use of a School Entry Assessment (SEA) tool, which measured children’s awareness of print and books, knowledge of basic numeracy and aspects of oral readiness. Analysis of the 1997-2000 data reported that there was a wide range of children’s scores within all deciles: children with low, average and high scores were likely to be found in all schools. However, on all three assessment measures the average score for children entering higher decile schools was consistently higher than for those entering lower decile schools, and the proportion of new entrant children with lower scores on all three measures was larger in low decile schools.248 Educational researcher Cathy Wylie has summarised the magnitude of these differences: reading scores for children aged 5 in decile 1 schools were, on average, almost half those of children in decile 7-10 schools, and mathematics scores were, on average, a third lower.249 These differences provide the evidence needed to make the decisions on the extra resources needed to mitigate educational disadvantage for the poorest children.
Another potentially useful national monitoring measure of children’s educational needs on entry to school250 is the B4 School Check, administered by the Ministry of Health. In addition to various health indicators, the check includes behavioural and developmental screening, using a Strengths and Difficulties Questionnaire. However, the purpose of the health check is to inform and support parents, rather than to inform policy at the national level. Without national data on children’s educational needs when they enter school, it is difficult to see how genuinely equitable resourcing decisions can be made.
RECOMMENDATION 1
Develop culturally appropriate measures of new entrant children’s cognitive, affective, behavioural and developmental needs. Use the data to inform decile related school funding allocation decisions.
247 Education Counts (2014). Prior participation in ECE (PPN11). Downloaded from http://www.educationcounts.govt.nz/statistics/ece2/participation.
248 Davis, D. (2001). School entry assessment: June 1997-December 2000, pp. 37-38. Downloaded from: http://www.educationcounts.govt.nz/__data/assets/pdf_file/0016/7522/sea.pdf
249 Wylie, C. (2013). Schools and inequality. In M. Rashbrooke (Ed.). Inequality: A New Zealand crisis (pp. 134-144). Wellington: Bridget Williams Books, p. 135. See: www.inequality.org.nz.
250 T. McLaughlin, personal communication, May 22, 2014.

60
National Standards have been widely criticised as a narrow measure of outcomes. To have primary school curricula with a narrow focus on the achievement of normative National Standards in reading, writing and mathematics may be especially limiting for children in poverty. As reported in the New Zealand Council for Educational Research (NZCER) survey of primary and intermediate schools (2014), ‘… on the whole principals and teachers did not find that their National Standards work was improving student achievement. They remained sceptical about the Standards achieving this purpose.’251
Children in poverty require meaningful, enjoyable and empowering experiences to address their disadvantage, not a narrow focus on standards.
RECOMMENDATION 2
Abandon National Standards because they seem ineffective while disadvantaging poor children’s learning and teaching in low decile schools.
School leaversThe Government’s other headline indicator of successful schooling outcomes is the proportion of school leavers with National Certificate of Educational Achievement (NCEA) Level 2 or equivalent (Table 1).
Table 1. Percentage of school leavers with NCEA Level 2 or above, by ethnic group and school quintile
(2012)252
Gender Ethnic Group
Quintile Total Female Male Māori Pasifika Asian MELAA Other European
1 58.1 61.8 54.3 49.5 62.6 78.6 72.3 63.2 62.3
2 66.8 70.7 63.4 54.2 63.0 82.2 65.9 67.2 72.0
3 72.7 77.6 67.9 59.2 66.4 82.7 80.7 68.1 76.0
4 82.0 85.6 78.8 67.5 76.7 89.3 82.8 82.9 83.4
5 89.6 92.1 87.0 78.6 80.0 91.6 83.2 85.7 90.4
NCEA level 2 is claimed by Government to be the minimum qualification necessary for successful economic and social participation in adult life.253 Table 1 reports NCEA Level 2 achievement levels by quintile, gender and ethnicity. Of students from quintile 5 (deciles 9 & 10), 89.6% gain NCEA Level 2, compared with only 58.1% in quintile 1 (deciles 1 & 2). Socio-economic disadvantage is clearly a major predictor of educational achievement. This holds true for boys and girls, and within all ethnic sub-groups.
251 Wylie, C., Bonne, l. (2014) Primary and intermediate schools in 2013 Main findings from the NZCER national
Survey, New Zealand Council for Educational Research, at: http://www.nzcer.org.nz/research/publications/primary-and-intermediate-schools-2013, p. 3.
252 Education Counts (2013). School leavers with NCEA Level 2 or above, Table 3. Downloaded from: http://www.educationcounts.govt.nz/indicators/data/education-and-learning-outcomes/3664
253 Makhlouf, G. (2012). Article on education by Secretary to the Treasury, Gabriel Makhlouf, published in the Dominion Post on 27 March 2012. Downloaded from http://www.treasury.govt.nz/publications/media-speeches/speeches/economicleadership/educ-art-27mar12.pdf.

61
The Government’s Better Public Services target is for 85% of all school leavers to reach this benchmark by 2017. For students leaving decile 1-3 schools, this requires an increase from 70.2% in 2011.254 Other decile-related targets over the same period require an increase in the retention of students to age 17 in decile 1-3 schools from 73.6% to 77.4% (compared with an all schools target increase from 80.0% to 82%), and a reduction in suspensions per 1,000 students from 8.5 to 6.9 students (all schools target reduction from 5.2 to 4.8).
Socioeconomic disadvantageSocioeconomic factors and social class are fundamental determinants of human functioning across the life span, including development, well-being, and physical and mental health.255
It is clear that there is a pervasive influence of socio-economic disadvantage throughout the schooling system. On the basis of the Government’s key education indicators at the beginning and end of compulsory schooling, the schooling system at present does not enable all students to overcome the effects of poverty and socio-economic disadvantage. An obvious question is, what can we do in order to resolve these disparities?
One of the editors’ seven key recommendations in Left Further Behind in 2011 was to ‘provide adequate funding for low decile schools to ensure that all children have access to high quality education’. The authors of the 2011 schooling chapter, Vicki Carpenter and Martin Thrupp, argued specifically for more careful trialling of any new policies designed to raise student underachievement, and for ‘sustained’ action to improve the supply of high quality teachers to low decile schools.256 Such observations force us to evaluate the most basic policy settings in our compulsory schooling system. In doing so, we have to face the possibilities that:
1. funding to our most disadvantaged schools may be inadequate for its stated purpose;
2. some raising achievement policies may actually harm the very students they are intended to benefit most; and
3. our most disadvantaged school communities may struggle to recruit and retain the best teachers.
If one or more of these is correct, it raises quite disturbing doubts about the extent to which our compulsory schooling system may be regarded as just, a system that distributes schooling resources to children fairly.
A major purpose of compulsory schooling is to prepare children for the most appropriate further vocational education for their aspirations, to confidently enter the workplace and to participate successfully in the society and the economy. Yet children (and their families) in low-mid decile schools may not be able to successfully negotiate the complexities of NCEA course choice, compared with
254 Ministry of Education (2013). Statement of Intent 2013-2018, May, p. 33. Downloaded from http://www.minedu.govt.nz/theMinistry/AboutUs/~/media/MinEdu/Files/TheMinistry/2013SOI/StatementOfIntent2013.pdf.
255 American Psychological Association, Task Force on Socioeconomic Status. (2007). Report of the APA Task Force on Socioeconomic Status. Washington, DC: American Psychological Association, at: http://www.apa.org/pi/ses/resources/publications/task-force-2006.pdf, p. 1.
256 See Left further behind at: http://www.cpag.org.nz/assets/Publications/121204%20LFB%20CPAG%202011.pdf, pp. 175 – 181.

62
their peers in higher decile schools.257 These include exam fees and assessment of eligibility for additional examination support. It makes sense, then, to ensure that:
1. any systemic barrier to children who live in poverty succeeding at school is removed; and
2. children who live in poverty are actively supported to make informed decisions about educational and career pathways that are in their best interests.
RECOMMENDATION 3
Provide a 100% government subsidy in all decile 1-4 secondary schools for NCEA and scholarship examination fees; and provide NCEA subject pathway guidance to tertiary study on entry to secondary school.
It is a truism that New Zealand society outside school is very unequal.258 Our children are born into diverse family and community circumstances. The quality of life they enjoy as children varies enormously as a consequence not only of the family’s disposable income, but also of the love, care and nurture their parents provide to them, and the ability of the family to negotiate life’s challenges on their behalf and to prepare them to negotiate their own life challenges. Income or material poverty does not alone determine schooling failure; the reasons for success or failure at school are socially constructed and many factors contribute to a particular child succeeding or failing ‘against the odds’.259
Nevertheless, compulsory schooling provides an opportunity for the state to mitigate the worst effects of the arbitrary and unnecessary inequalities of life chance that are associated with income poverty, its antecedents and its consequences.260 In this sense, schooling can contribute to greater justice: it can redistribute financial resources so that those who live in:
1. material poverty, and / or
2. poverty of development
do not fall further behind their more advantaged peers. The first of these is a question of financial resources; the second of learning resources.
A schooling system that values childrenThe Harvard philosopher, Michael Sandel, identifies three approaches to justice: maximizing utility or welfare; freedom of choice; and ‘cultivating virtue and reasoning about the common good’.261 Of the three, Sandel favours the third approach. on the grounds that ‘justice is not only about the right way to distribute things. It is also about the right way to value things.’262 In this sense, questions about how
257 Madjar, I., McKinley, E., Jensen, S. & van der Merwe, A. (2009). Towards university: Navigating NCEA course choices in low-mid decile schools. Downloaded from: https://cdn.auckland.ac.nz/assets/education/about/research/docs/starpath/Towards-university-Navigating-NCEA-course-choices-in-low-mid-decile-schools.pdf
258 Rashbrooke, M. (2013). Inequality and New Zealand. In M. Rashbrooke (Ed.), Inequality: A New Zealand crisis (pp. 20-34). Wellington: Bridget Williams Books.
259 Nash, R. (1997). Inequality/difference: A sociology of education. Palmerston North: Kanuka Grove Press.260 Snook, I. & O’Neill, J. (2010). Social class and educational achievement: Beyond ideology. New Zealand Journal of
Educational Studies, 45(2), 3-18.261 Sandel, M. (2009). Justice: What’s the right thing to do? London: Penguin, p. 260.262 Ibid, p. 261.
63
we should approach decisions regarding educational funding, increasing achievement and improving teaching are also fundamentally questions about the right way to value children.
One of the comments often made about the much-vaunted Finnish schooling system is that it places the needs and interests of all children at the centre of educational decision-making. Whether we regard compulsory schooling more as a taxpayer expense to be minimized than as an investment in the collective future; learning more as an outcome to be measured than as an experience to be enjoyed for its own sake; or teachers more as servants of the government than as members of their local school community, how we value all children will be reflected in the compulsory schooling policy settings that we decide to, or permit to be, put in place.
These are undoubtedly challenging value judgments for our society to make, yet in 2014 we are arguably in a more informed position to be able to do so because of three significant poverty and inequality public policy oriented projects undertaken since the 2011 version of this chapter was written.
In 2012, the Expert Advisory Group on Solutions to Child Poverty (EAG), established by the Children’s Commissioner, produced a landmark report challenging the New Zealand Government to meaningful action on child poverty.263 In 2013, the first child poverty monitoring report was published, providing annual updates on changes in the nature and extent of child poverty via a range of internationally accepted measures.264 Also in 2013, the journalist Max Rashbrooke published an edited collection of papers on inequality in New Zealand, accompanied by a national lecture tour and website.265 Together these contributions have helped to create a popular agenda for eradicating child poverty, an evidence-based language and set of policy solutions to promote this, and indicators to evaluate Government commitment, funding priorities and policy effects.
One of the EAG working papers was devoted to evidence-based education solutions.266 It reported that children from socially and economically disadvantaged backgrounds gained most from good quality ECCE in terms of their cognitive and social-emotional development, that their parents and communities also benefited from good quality ECCE and from multi-agency social, educational and health services, and that some parents and families would benefit from additional targeted information and support for the ECCE to school transition.
This suggests very strongly that we cannot consider the schooling needs and interests of children in poverty separately from their ECCE needs and interests, nor can we consider the needs and interests of children in isolation from those of their families and communities.267 Nor, indeed, can we consider the effects of politicians and policy makers separately from those of teachers and other education professionals, families and students who have to enact policy decisions in educational
263 Children’s Commissioner’s Expert Advisory Group on Solutions to Child Poverty (2012). Solutions to child poverty in New Zealand: Evidence for Action, December. Downloaded from http://www.occ.org.nz/assets/Uploads/EAG/Final-report/Final-report-Solutions-to-child-poverty-evidence-for-action.pdf.
264 Craig, E., Reddington, A., Wicken, A., Oben, G. & Simpson, J (2013). Child poverty monitor 2013 technical report (updated 2014). Dunedin: NZ Child & Youth Epidemiology centre, University of Otago.
265 Rashbrooke, M. (Ed.) (2013). Inequality: A New Zealand crisis. Wellington: Bridget Williams Books. See: www.inequality.org.nz.
266 Expert Advisory Group on Solutions to Child Poverty (2012). Working Paper No. 16: Education solutions to mitigate child poverty, August 2012. Downloaded from: http://www.occ.org.nz/assets/Uploads/EAG/Working-papers/No-16-Education-solutions.pdf.
267 Machin, S., Vignoles, A. (2005) Educational inequality: the widening socio-economic gap. Fiscal Studies. The Journal of Applied Public Economics, V. 25, Issue 2, pp. 107–128, June 2004, at http://onlinelibrary.wiley.com/doi/10.1111/j.1475-5890.2004.tb00099.x/full.

64
settings. This line of argument is for a complex view of educational success and failure, one which in turn calls for complex, multi-layered education policy solutions that may take more than a few years to demonstrate significant, measurable beneficial effects.268
The schooling solutions advocated by the EAG were similarly multi-faceted and complex, notably bringing together education, health and welfare services in a local community setting to address deeply entrenched social and economic challenges that affect schooling access, participation, engagement and achievement. The proposed solutions included: a food in schools strategy involving public, private and philanthropic funding sources.
RECOMMENDATION 4
Free breakfast and lunch in decile 1-4 schools.
Poor youth health statistics show needs not being met by existing primary care services. From 2008, funding was provided for school nurses or school-based health services in the secondary schools attended by young people of highest need: in decile 1 and 2 secondary schools, teen parent units and alternative education facilities. This was extended in 2013 to decile 3 schools. Simon Denny et al’s recent survey of the health services in a random sample of 125 secondary schools269 revealed that 12% of secondary schools report no health services beyond the minimum requirement of first aid provision; in 56% of schools, health service provision is by visiting health professionals; 20% have an on-site health professional (a school nurse); and 12% have a collaborative team of health and other professionals on site for most of the week.
The survey found that schools with an on-site school nurse or health team were more likely to have more facilities, better integrated with the school, the community and local Primary Health Organisations, and providing more routine comprehensive health assessments.270 Importantly, there was significantly less depression and suicide risk where the school health services had health professionals on site; where the hours of health professional time per week per 100 students were higher; where the health professionals were trained in youth health and well supported through professional peer review; and where the health professionals were well integrated with the school and with the local community. In schools that provided sexual health services and where the health professionals had received training in youth health, there was better contraceptive use by female students; and there is also evidence that high quality school health services lessen students’ use of hospital A & E. But full school health services are not available in all secondary schools. ;Further investment and resourcing of school health services could have a positive impact on the health and wellbeing of secondary school students in New Zealand.’271
268 Murnane, R. & Levy F. (1996). Evidence from fifteen schools in Arizona, Texas. In G. Burtless (Ed.) Does money matter? The effect of school resources on student achievement and adult success (pp. 93-96). Washington: Brookings Institution Press.
269 Denny S., Grant S., Galbreath R., Clark, T.C., Fleming, T., Bullen, P., Dyson, B., Crengle, S., Fortune, S., Peiris-John, R.,
Utter, J., Robinson, E., Rossen, F., Sheridan, J., Teevale, T. (2014). Health Services in New Zealand Secondary Schools
and the Associated Health Outcomes for Students. Auckland, New Zealand: University of Auckland, at: http://syhpanz.co.nz/uploads/editor/files/Health%20Services%20in%20New%20Zealand%20Secondary%20Schools.pdf, pp. 4 – 5.
270 Ibid, pp. 4 – 5.271 Ibid, p. 5.
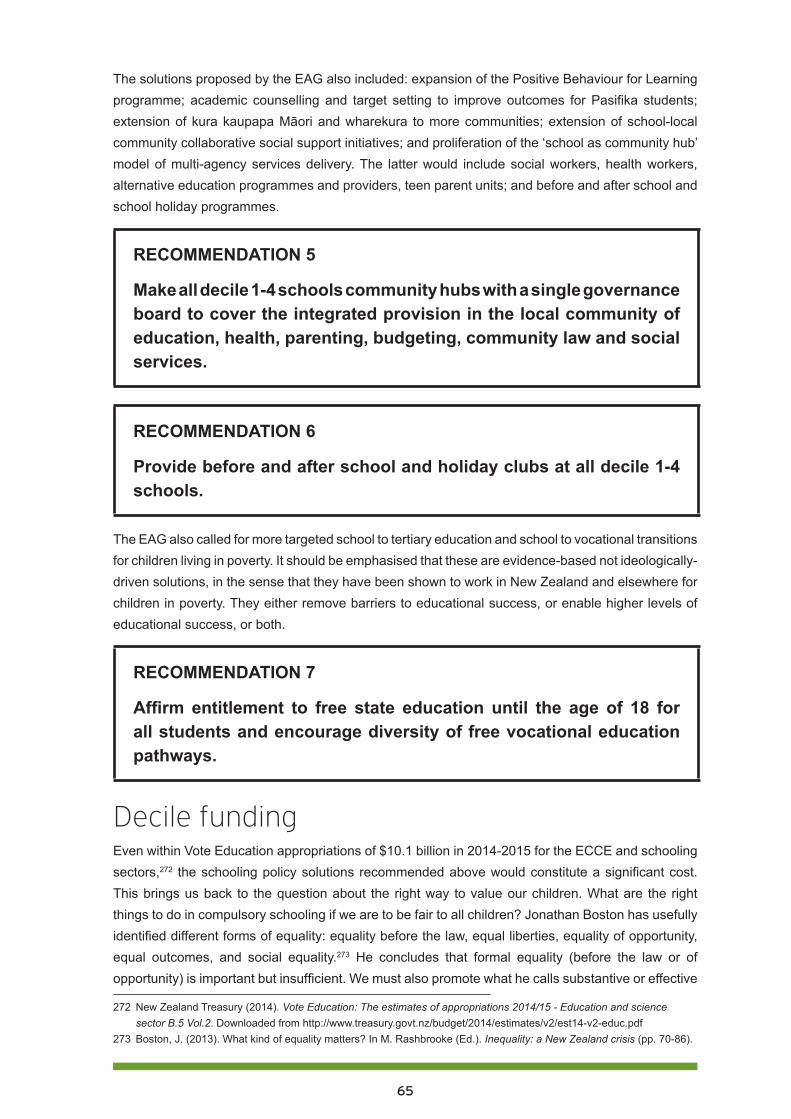
65
The solutions proposed by the EAG also included: expansion of the Positive Behaviour for Learning programme; academic counselling and target setting to improve outcomes for Pasifika students; extension of kura kaupapa Māori and wharekura to more communities; extension of school-local community collaborative social support initiatives; and proliferation of the ‘school as community hub’ model of multi-agency services delivery. The latter would include social workers, health workers, alternative education programmes and providers, teen parent units; and before and after school and school holiday programmes.
RECOMMENDATION 5
Make all decile 1-4 schools community hubs with a single governance board to cover the integrated provision in the local community of education, health, parenting, budgeting, community law and social services.
RECOMMENDATION 6
Provide before and after school and holiday clubs at all decile 1-4 schools.
The EAG also called for more targeted school to tertiary education and school to vocational transitions for children living in poverty. It should be emphasised that these are evidence-based not ideologically-driven solutions, in the sense that they have been shown to work in New Zealand and elsewhere for children in poverty. They either remove barriers to educational success, or enable higher levels of educational success, or both.
RECOMMENDATION 7
Affirm entitlement to free state education until the age of 18 for all students and encourage diversity of free vocational education pathways.
Decile fundingEven within Vote Education appropriations of $10.1 billion in 2014-2015 for the ECCE and schooling sectors,272 the schooling policy solutions recommended above would constitute a significant cost. This brings us back to the question about the right way to value our children. What are the right things to do in compulsory schooling if we are to be fair to all children? Jonathan Boston has usefully identified different forms of equality: equality before the law, equal liberties, equality of opportunity, equal outcomes, and social equality.273 He concludes that formal equality (before the law or of opportunity) is important but insufficient. We must also promote what he calls substantive or effective
272 New Zealand Treasury (2014). Vote Education: The estimates of appropriations 2014/15 - Education and science sector B.5 Vol.2. Downloaded from http://www.treasury.govt.nz/budget/2014/estimates/v2/est14-v2-educ.pdf
273 Boston, J. (2013). What kind of equality matters? In M. Rashbrooke (Ed.). Inequality: a New Zealand crisis (pp. 70-86).

66
equality by giving people the means to enjoy and take advantage of their freedoms.
If we examine New Zealand compulsory schooling law and policy, we may see these various forms of equality being promoted to some degree: notably, the view that a common curriculum and credential framework provides equality of opportunity for all, that the Education Act 1989 provides equal rights to enrol at a state school of one’s choice and to free public schooling, that the Better Public Services targets demand equality of educational outcome, and so on.
However, these policy settings appear to promote mostly formal equalities, and the public policy commitment to them is equivocal: free state schooling is increasingly subsidized by so-called voluntary donations by families;274 access to over-subscribed state schools is determined by private mortgage; the introduction of national benchmark standards of achievement by set age points has disproportionately narrowed both the curriculum and the quality of learning for children in disadvantaged school communities;275 and equality of treatment is used to argue both that families whose children attend private schools should also receive significant public tuition subsidy or scholarship, and that failing private schools should be integrated into the state system.276 If, however, education policy settings were to be governed by considerations of substantive or effective equality, then they might begin to look quite different.
RECOMMENDATION 8
Reduce class sizes in all decile 1-4 primary schools (if necessary by proportionately increasing class sizes in decile 8-10 schools) and provide salary incentives to encourage the best teachers to teach in these schools.
RECOMMENDATION 9
Use the Investing in Success funding to build collaborative school and teacher clusters across the socio-economic spectrum.
274 Auckland school donation exceeds $1k. Downloaded from http://www.nzherald.co.nz/nz/news/article.cfm?c_id=1&objectid=11192103; ‘Free’ education costs thousands. Downloaded from http://www.stuff.co.nz/the-press/news/schools/9645490/Free-education-costs-thousands.
275 Thrupp. M. & White, M. (2013). Research, analysis and insight into national standards (RAINS) project, final report: national standards and the damage done, November. Downloaded from http://www.waikato.ac.nz/__data/assets/pdf_file/0010/179407/RAINS-Final-report_2013-11-22.pdf.
276 Education Circular 2012/07 Private school subsidy funding 2013. Downloaded from http://www.minedu.govt.nz/NZEducation/EducationPolicies/Schools/PublicationsAndResources/Circulars/Circulars2012/Circular201207.aspx; Private schools want funding indexed to state schools. Downloaded from http://www.radionz.co.nz/news/national/132786/private-schools-want-funding-indexed-to-state-schools; Integrated schools get more money. Downloaded from http://www.stuff.co.nz/national/education/4962879/Integrated-schools-get-more-money ; Wanganui Collegiate reveals high fees. Downloaded from http://www.radionz.co.nz/news/national/126891/wanganui-collegiate-reveals-high-fees.
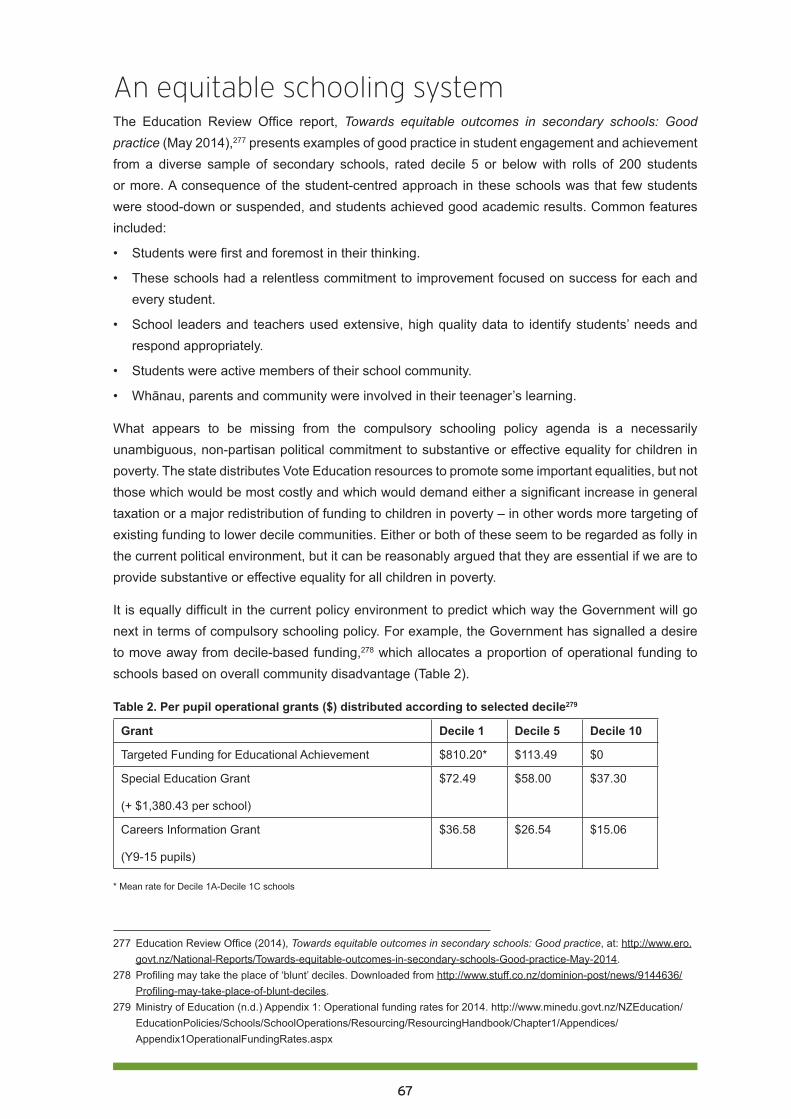
67
An equitable schooling systemThe Education Review Office report, Towards equitable outcomes in secondary schools: Good practice (May 2014),277 presents examples of good practice in student engagement and achievement from a diverse sample of secondary schools, rated decile 5 or below with rolls of 200 students or more. A consequence of the student-centred approach in these schools was that few students were stood-down or suspended, and students achieved good academic results. Common features included:
• Students were first and foremost in their thinking.
• These schools had a relentless commitment to improvement focused on success for each and every student.
• School leaders and teachers used extensive, high quality data to identify students’ needs and respond appropriately.
• Students were active members of their school community.
• Whānau, parents and community were involved in their teenager’s learning.
What appears to be missing from the compulsory schooling policy agenda is a necessarily unambiguous, non-partisan political commitment to substantive or effective equality for children in poverty. The state distributes Vote Education resources to promote some important equalities, but not those which would be most costly and which would demand either a significant increase in general taxation or a major redistribution of funding to children in poverty – in other words more targeting of existing funding to lower decile communities. Either or both of these seem to be regarded as folly in the current political environment, but it can be reasonably argued that they are essential if we are to provide substantive or effective equality for all children in poverty.
It is equally difficult in the current policy environment to predict which way the Government will go next in terms of compulsory schooling policy. For example, the Government has signalled a desire to move away from decile-based funding,278 which allocates a proportion of operational funding to schools based on overall community disadvantage (Table 2).
Table 2. Per pupil operational grants ($) distributed according to selected decile279
Grant Decile 1 Decile 5 Decile 10
Targeted Funding for Educational Achievement $810.20* $113.49 $0
Special Education Grant
(+ $1,380.43 per school)
$72.49 $58.00 $37.30
Careers Information Grant
(Y9-15 pupils)
$36.58 $26.54 $15.06
* Mean rate for Decile 1A-Decile 1C schools
277 Education Review Office (2014), Towards equitable outcomes in secondary schools: Good practice, at: http://www.ero.govt.nz/National-Reports/Towards-equitable-outcomes-in-secondary-schools-Good-practice-May-2014.
278 Profiling may take the place of ‘blunt’ deciles. Downloaded from http://www.stuff.co.nz/dominion-post/news/9144636/Profiling-may-take-place-of-blunt-deciles.
279 Ministry of Education (n.d.) Appendix 1: Operational funding rates for 2014. http://www.minedu.govt.nz/NZEducation/EducationPolicies/Schools/SchoolOperations/Resourcing/ResourcingHandbook/Chapter1/Appendices/Appendix1OperationalFundingRates.aspx
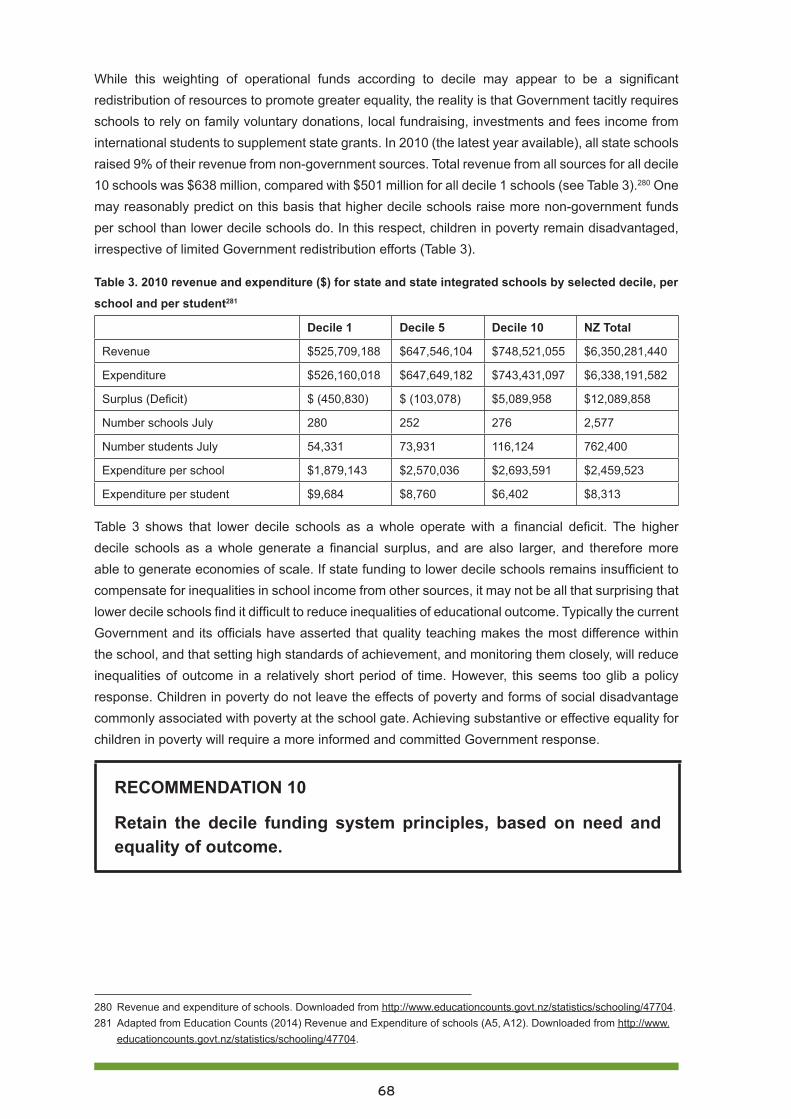
68
While this weighting of operational funds according to decile may appear to be a significant redistribution of resources to promote greater equality, the reality is that Government tacitly requires schools to rely on family voluntary donations, local fundraising, investments and fees income from international students to supplement state grants. In 2010 (the latest year available), all state schools raised 9% of their revenue from non-government sources. Total revenue from all sources for all decile 10 schools was $638 million, compared with $501 million for all decile 1 schools (see Table 3).280 One may reasonably predict on this basis that higher decile schools raise more non-government funds per school than lower decile schools do. In this respect, children in poverty remain disadvantaged, irrespective of limited Government redistribution efforts (Table 3).
Table 3. 2010 revenue and expenditure ($) for state and state integrated schools by selected decile, per
school and per student281
Decile 1 Decile 5 Decile 10 NZ Total
Revenue $525,709,188 $647,546,104 $748,521,055 $6,350,281,440
Expenditure $526,160,018 $647,649,182 $743,431,097 $6,338,191,582
Surplus (Deficit) $ (450,830) $ (103,078) $5,089,958 $12,089,858
Number schools July 280 252 276 2,577
Number students July 54,331 73,931 116,124 762,400
Expenditure per school $1,879,143 $2,570,036 $2,693,591 $2,459,523
Expenditure per student $9,684 $8,760 $6,402 $8,313
Table 3 shows that lower decile schools as a whole operate with a financial deficit. The higher decile schools as a whole generate a financial surplus, and are also larger, and therefore more able to generate economies of scale. If state funding to lower decile schools remains insufficient to compensate for inequalities in school income from other sources, it may not be all that surprising that lower decile schools find it difficult to reduce inequalities of educational outcome. Typically the current Government and its officials have asserted that quality teaching makes the most difference within the school, and that setting high standards of achievement, and monitoring them closely, will reduce inequalities of outcome in a relatively short period of time. However, this seems too glib a policy response. Children in poverty do not leave the effects of poverty and forms of social disadvantage commonly associated with poverty at the school gate. Achieving substantive or effective equality for children in poverty will require a more informed and committed Government response.
RECOMMENDATION 10
Retain the decile funding system principles, based on need and equality of outcome.
280 Revenue and expenditure of schools. Downloaded from http://www.educationcounts.govt.nz/statistics/schooling/47704. 281 Adapted from Education Counts (2014) Revenue and Expenditure of schools (A5, A12). Downloaded from http://www.
educationcounts.govt.nz/statistics/schooling/47704.
69
ConclusionThere is unequivocal research evidence that the major predictor of educational success is socio-economic circumstances at birth.282 Since the early 2000s, successive Governments and their officials have argued that improving the quality of classroom teaching is the most effective way to reduce the inequalities of educational outcomes that exist between children who begin life in material disadvantage and those who do not.
Whatever the relative merits of each argument and each set of evidence, there remain 285,000 children in New Zealand who live 24 hours a day in poverty and with the consequences of poverty. Morally, Governments are required to do whatever they can now to mitigate the effects of everyday child poverty, because if they do not, the chances are that these 285,000 children will lead less happy, productive and successful lives than they otherwise could. This is simply unjust.
In order to gauge the extent of the challenge facing the education system, we need much better data on children’s educational needs (broadly defined) when they start school. This is necessary to make evidence-based intervention decisions and needs-based resourcing decisions for the remainder of their 13 years at school.
The discussion and recommendations in this chapter are based on a simple reality of childhood that seems all too often to escape ministers and their officials: children in poverty do not leave their daily life circumstances at the school gate, and whatever the child learns at school will not change those daily life circumstances in the short term. Children’s identities, capabilities, capacities, aspirations and wellbeing are formed through their lives both inside and outside school. To improve their life chances, education policy has to address the conditions of both.
This means that Governments must think beyond the ‘quality teaching’ mantra to develop, resource and enact complex multi-agency education and education-related strategies that simultaneously address the poverty of material circumstance in which too many of our children are forced to subsist outside school.
If we consider the lives of children in poverty inside and outside school holistically, and through a lens of social justice, we inevitably arrive at a much broader set of educational challenges that must be addressed. In response to recent very powerful arguments and evidence from groups throughout society, the current Government has begun to take modest steps in some of the right multi-agency, multi-strategy education policy directions. Politicians on all sides now need to have the collective courage and commitment to do far more if we are to ensure that the compulsory schooling rights and interests of children in poverty are met.
282 Snook, I. & O’Neill, J. (2010). Social class and educational achievement: Beyond ideology. New Zealand Journal of Educational Studies, 45(2), 3-18.
70
Full list of recommendations 1. Develop culturally appropriate measures of new entrant children’s cognitive, affective,
behavioural and developmental needs. Use the data to inform decile related school funding allocation decisions.
2. Abandon National Standards because they seem ineffective while disadvantaging poor children’s learning and teaching in low decile schools.
3. Provide a 100% government subsidy in all decile 1-4 secondary schools for NCEA and scholarship examination fees; and provide NCEA subject pathway guidance to tertiary study on entry to secondary school.
4. Provide free breakfast and lunch in decile 1-4 schools.
5. Make all decile 1-4 schools community hubs with a single governance board to cover the integrated provision in the local community of education, health, parenting, budgeting, community law and social services.
6. Provide before and after school and holiday clubs at all decile 1-4 schools.
7. Affirm entitlement to free state education until the age of 18 for all students and encourage diversity of free vocational education pathways.
8. Reduce class sizes in all decile 1-4 primary schools (if necessary by proportionately increasing class sizes in decile 8-10 schools) and provide salary incentives to encourage the best teachers to teach in these schools.
9. Use the Investing in Success funding to build collaborative school and teacher clusters across the socio-economic spectrum.
10. Retain the decile funding system principles, based on need and equality of outcome.
Audio-visual resourcesCatriona MacLennan (2014) Child Poverty in Aotearoa Episode 5: Education, at: https://www.youtube.com/watch?v=wWt2R35XvhM
NZEI Te Riu Roa (2014) How the Government plans to spend $359 million, at: https://www.youtube.com/watch?v=nO5UGJmVpmg
UNICEF UK video (2012) Pupils speak out about UK child poverty, at: http://www.youtube.com/watch?v=aBVYA-3ASt0 .
TV1 (2014), Sunday. Episode 31 [Classification: PGR]. Miriama Kamo presents: Kerry Owen has one mission in life - to make sure no child in New Zealand goes hungry, at: http://tvnz.co.nz/sunday/s2014-ep31-video-6068228.
71
PART FOUR: Housing market changes and their impact on childrenAlan Johnson
Alan Johnson is Social Policy Analyst with the Salvation Army Social Policy & Parliamentary Unit, and Co-Convener of Child Poverty Action Group Inc.
OverviewChildren’s housing position is of course inseparable from that of their family. While it is possible to take a specific child focus on the housing conditions in which children live, that is not particularly useful from a policy perspective. While the circumstances of children who are poorly housed may be used as a justification for changes in housing policies, any policy responses are unlikely to be specific to the needs of children, in contrast with health and education responses, but would be directed toward the housing and income needs of their families or households.
For this reason, this part considers the probable housing position of low-income households which are most likely to contain dependent children (aged 0 to 18 years). It focuses specifically on recent housing market and housing policy changes which are likely to affect such households. These include changes in housing tenure, availability, conditions and affordability for low-income households. As well, this paper briefly considers the current state of housing policy, particularly around the provision of social and affordable housing.
New Zealand’s children and housingThere are around 1.7 million occupied dwellings in New Zealand of which just over 1.1 million, 64%, are owned either by their occupants or by a related family trust. Of the 567,000 rented dwellings, around 85% are owned by private investors, with the remaining 15%, approximately 80,000, being provided as social housing. Of this social housing stock, 68,000 units, around 15%, are owned by Housing New Zealand Corporation (HNZC), central government’s housing agency; 10,000 units are owned by local government; and approximately 2,000 are owned by non-government organisation (NGO) housing providers.
The Ministry of Social Development’s (MSD) regular Household Income Reports provide some useful indication of where children in poverty are likely to be living. These results are summarised in Table 4. They show that while a high proportion of children in HNZC housing (54%) are likely to be living in relative poverty, because there is a larger proportion of children living in private rental property (33% of all children, compared with 9% of all children in HNZC housing), more than half (53%) of all children in relative poverty live in private rental housing. These estimates, based on a sample of 3,000 households involved in the Household Economic Survey, are not entirely consistent in terms of total numbers.
Table 1 gives an indication of the likely housing tenure of poor children’s households. Applying the various percentages both to the total number of children and to those judged to be living in relative poverty suggests that of New Zealand’s poorest children, 45,000 to 50,000 (19%) are likely to be living in HNZC housing, 130,000 to 135,000 (53%) in private rental housing, and 65,000 to 70,000
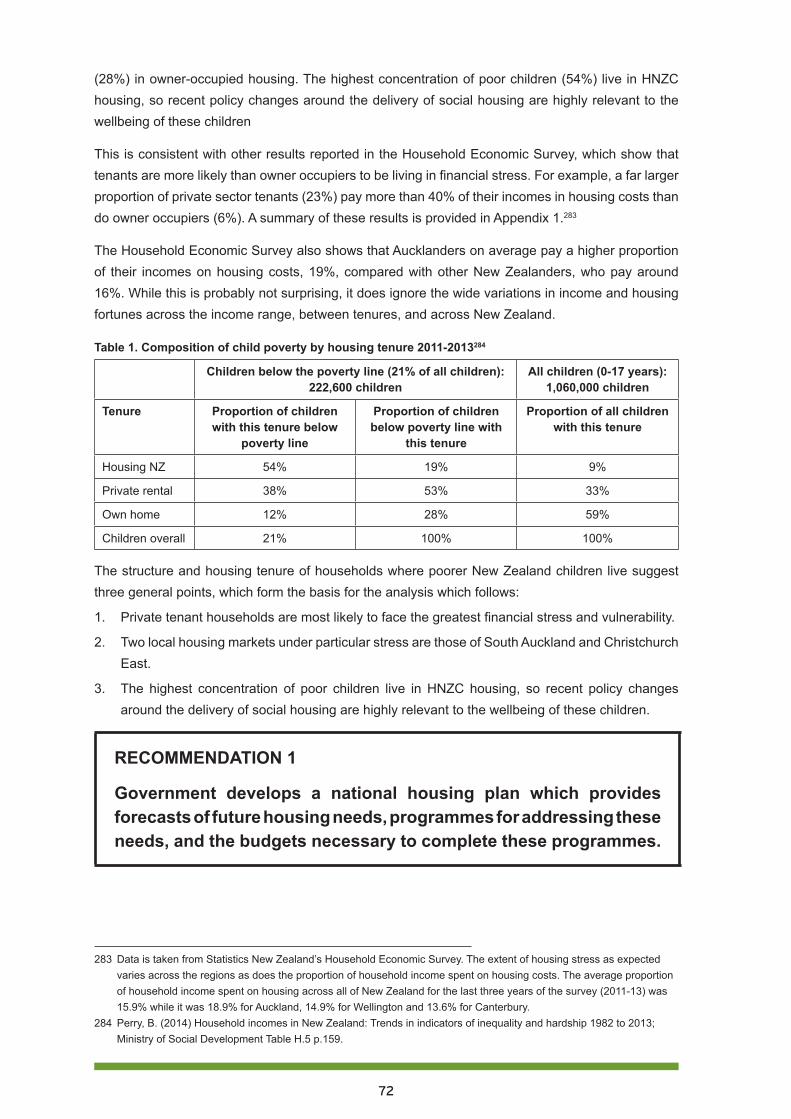
72
(28%) in owner-occupied housing. The highest concentration of poor children (54%) live in HNZC housing, so recent policy changes around the delivery of social housing are highly relevant to the wellbeing of these children
This is consistent with other results reported in the Household Economic Survey, which show that tenants are more likely than owner occupiers to be living in financial stress. For example, a far larger proportion of private sector tenants (23%) pay more than 40% of their incomes in housing costs than do owner occupiers (6%). A summary of these results is provided in Appendix 1.283
The Household Economic Survey also shows that Aucklanders on average pay a higher proportion of their incomes on housing costs, 19%, compared with other New Zealanders, who pay around 16%. While this is probably not surprising, it does ignore the wide variations in income and housing fortunes across the income range, between tenures, and across New Zealand.
Table 1. Composition of child poverty by housing tenure 2011-2013284
Children below the poverty line (21% of all children): 222,600 children
All children (0-17 years): 1,060,000 children
Tenure Proportion of children with this tenure below
poverty line
Proportion of children below poverty line with
this tenure
Proportion of all children with this tenure
Housing NZ 54% 19% 9%
Private rental 38% 53% 33%
Own home 12% 28% 59%
Children overall 21% 100% 100%
The structure and housing tenure of households where poorer New Zealand children live suggest three general points, which form the basis for the analysis which follows:
1. Private tenant households are most likely to face the greatest financial stress and vulnerability.
2. Two local housing markets under particular stress are those of South Auckland and Christchurch East.
3. The highest concentration of poor children live in HNZC housing, so recent policy changes around the delivery of social housing are highly relevant to the wellbeing of these children.
RECOMMENDATION 1
Government develops a national housing plan which provides forecasts of future housing needs, programmes for addressing these needs, and the budgets necessary to complete these programmes.
283 Data is taken from Statistics New Zealand’s Household Economic Survey. The extent of housing stress as expected varies across the regions as does the proportion of household income spent on housing costs. The average proportion of household income spent on housing across all of New Zealand for the last three years of the survey (2011-13) was 15.9% while it was 18.9% for Auckland, 14.9% for Wellington and 13.6% for Canterbury.
284 Perry, B. (2014) Household incomes in New Zealand: Trends in indicators of inequality and hardship 1982 to 2013; Ministry of Social Development Table H.5 p.159.
73
New Zealand’s house pricesIn June 2014 the median sale price of a New Zealand house was $430,000. This is 76% higher in nominal terms than ten years previously. In June 2004 it took 6.1 years of the average weekly wage or salary to purchase the median priced house. This ratio rose to 7.8 years just prior to the global financial crisis (GFC) in early 2008, and fell immediately afterwards to 6.8 years in March 2009, subsequently rising slowly to 7.6 years by June 2014. This progress is shown in Figure 1.
Figure 1 also traces the median sale price of housing in Auckland and Canterbury, relative to average wages and salaries over the decade 2004-2014. This illustrates how housing prices in Auckland and Canterbury have trended along different pathways from other parts of New Zealand.
In Auckland, while the median house price and therefore the time required to purchase it also dipped after the GFC, by March 2013 it had risen back to the pre-GFC high of 9.9 years, and by June 2014 had risen further to 11.0 years. The historical significance of Auckland house prices is well canvassed in the media and public policy discourse, with suggestions that the current market settings are a consequence of restrictive urban planning policies285 or the influence of foreign buyers.286 Regardless of the impact of such factors, it seems likely that Auckland’s rapid population growth is also an important influence on house prices.287 288
House price trends in the Canterbury housing market are a direct result of the earthquakes, and especially of the most damaging earthquake of 21 February 2011.289 Although Canterbury house prices (relative to wages and salaries) appear in Figure 1 to track below the median national house price, it is probably the case that prior to the 2010/2011 earthquakes, Canterbury’s house price history
285 The conventional wisdom from Auckland-specific studies of the impact of urban limits is that these unnecessarily restrict land supply which subsequently raises house prices within the urban limits. See for example Department of Building & Housing (2008) Adequacy of Auckland Region’s residential land supply, Department of Building & Housing and Grimes, A and Liang, Y. (2007) Spatial determinants of land prices in Auckland: Does the metropolitan urban limit have an effect? Motu Working Paper 07-09; Motu Economic & Public Policy Research. Evidence from outside of New Zealand suggests that the relationship between urban planning restrictions and house prices is more complex – see for example Buxton, M and Taylor E. (2011) Urban land supply, governance and the supply of land; Urban Policy & Research 29.1 pp. 5-22.
286 Mainstream media encouraged by opposition parties’ proposals to curb foreign ownership of property have canvassed the link between foreign buyers and rising house prices in Auckland - see for example TV3 article of ‘Chinese buying up big time’ of 20/11/13 at http://www.3news.co.nz/Chinese-buying-up-big-time/tabid/423/articleID/322163/Default.aspx. This link has been refuted by the Government – see TV3 article of 14/-5/14 ‘Govt: Foreign buyers not part of the housing problem’ at http://www.3news.co.nz/Govt-Foreign-buyers-not-part-of-housing-problem/tabid/1607/articleID/344017/Default.aspx. The Government has been reluctant to gather better information on the impact of foreign buyers on house prices conceding to political pressure but not agreeing to undertake any specific research. NZ Herald article of 15/04/14 “PM agrees ownership data worth closer look as NZ First pursue bill to set up register”, at http://www.nzherald.co.nz/nz/news/article.cfm?c_id=1&objectid=11238208.
287 There is little solid research linking the pattern of Auckland’s house price increases to rates of population growth. The table below compares Auckland’s population growth and median house price change over the past decade.
288 Stillman and Mare (2008) found a very slight relationship between population growth and house prices (a 1% increase in a local population is associated with 0.2% to 0.5% increase in local house prices), and that the largest driver of house price growth was returning expatriate New Zealanders rather than recently settled foreign born migrants (Stillman, S. and Mare, C. (2008) Housing markets and migration: Evidence from New Zealand; Department of Labour). Chanpiwat (2013) however found a much stronger relationship with a 1% increase in population due to external migration leading to a 7.5% increase in house prices (Chanpiwat, N. (2013) Estimating the impact of immigration on housing prices and housing affordability in New Zealand; - dissertation for Master of Business degree at Auckland University of Technology).
289 Statistics New Zealand reports that, as a result of the earthquakes, 7,857 houses had been red zoned and marked for demolition at the end of 2012. See: http://www.stats.govt.nz/browse_for_stats/snapshots-of-nz/yearbook/people/region/cera.aspx.

74
stayed close to the median for New Zealand, excluding Auckland.290 At the time of the February 2011 earthquakes, purchasing the median priced Canterbury house took around 6.1 years of average weekly wage/salary. By June 2014 this had risen to 7.5 years.
Figure 1. Median house prices in terms of average wages and salaries 2004-2014
These data suggests that New Zealand’s current housing purchase story is really two stories – one involving shortages and rapid real increases in house prices in Auckland and Christchurch, and the other involving stable prices and even stagnant conditions in most other regional housing markets. This framework of two housing purchase stories is developed further in this paper.
Table 2. Summary of changes in median sale prices of houses by region 2009-2014 (June years)291
Region Median price Jun-14 $s Change 2013-14 Change 2009-14
Northland 295,000 0.7% -3.3%
Auckland 600,000 9.3% 36.4%
Waikato-Bay of Plenty 336,000 5.0% 6.7%
Hawkes Bay 271,500 0.0% 0.6%
Manawatu-Whanganui 231,000 4.5% 5.0%
Taranaki 306,250 8.1% 14.3%
Wellington 385,000 -3.8% 2.7%
Nelson-Marlborough 362,000 6.1% 11.4%
Canterbury-Westland 409,900 12.3% 40.4%
Central Otago-Lakes 463,000 12.9% 10.9%
Otago 235,000 -4.1% 6.8%
Southland 165,000 -17.9% -13.2%
New Zealand 427,250 8.4% 25.7%
290 During the year to 30 June 2014 the Auckland housing market accounted for almost 55% of the New Zealand housing market by value of sales ($20.8 billion against $38.1 billion) so it can be expected that Auckland will have disproportionate influence on the value of New Zealand wide market indicators such as median and average sale prices (Real Estate of New Zealand’s Market Facts Graphs https://www.reinz.co.nz/reinz/public/reinz-statistics/reinz-statistics_home.cfm).
291 Source of data - Real Estate of New Zealand’s Market Facts Graphs.
75
Children and their households Children make up a falling share of New Zealand’s population, in part because the population is getting older and in part because fertility rates are just above replacement levels.292 At March 2014, there were around 1.07 million children in New Zealand, the same number as a decade before in 2004; but whereas children then made up 26.3% of the population, by 2014 they made up only 23.7%. This trend is projected to continue as average life expectancy increases.
A consequence of this aging population and declining proportion of children is the likely prospect that households will become smaller and the average number of people occupying each dwelling will decline. Statistics New Zealand is projecting that the proportion of childless households will increase from 40% in 2006 to between 45% and 50% by 2031, and that single person households will rise from 23% of all households in 2006 to between 27% and 30% by 2031.293
Such changes in household composition are of course dependent on economic opportunity. There is emerging evidence that household formation choices have been squeezed by economic necessity, at least in Auckland, and especially in South Auckland. Some of this evidence is presented in the following two tables.
Table 3 reports the numbers of occupied dwellings with children living in them for the three census years 2001, 2006 and 2013, as well as these numbers as proportions of all occupied dwellings. These data are reported for Auckland, Christchurch and New Zealand as a whole, and for South Auckland and Christchurch East, two low-income areas where housing-related stress is likely to be high.
As expected from population projections, the proportion of households with children fell slightly between 2006 and 2013, with the exception of Auckland, where not only is there a much higher proportion of households with children than in the rest of New Zealand, but this proportion is increasing. In South Auckland this proportion is increasing at an even faster rate: more than two thirds of households have children, compared with around half of households in the rest of Auckland, and around 40% of households in the rest of New Zealand.
292 The fertility rate in 2013 was 1.95 and for the decade to December 2013 average 2.06. New Zealand’s recorded fertility rate peaked in 1961 at 4.31 (Statistics New Zealand Info database).
293 Statistics New Zealand’s National Family and Household Projections at http://www.stats.govt.nz/browse_for_stats/population/estimates_and_projections/NationalFamilyAndHouseholdProjections_HOTP2006-2031update.aspx.
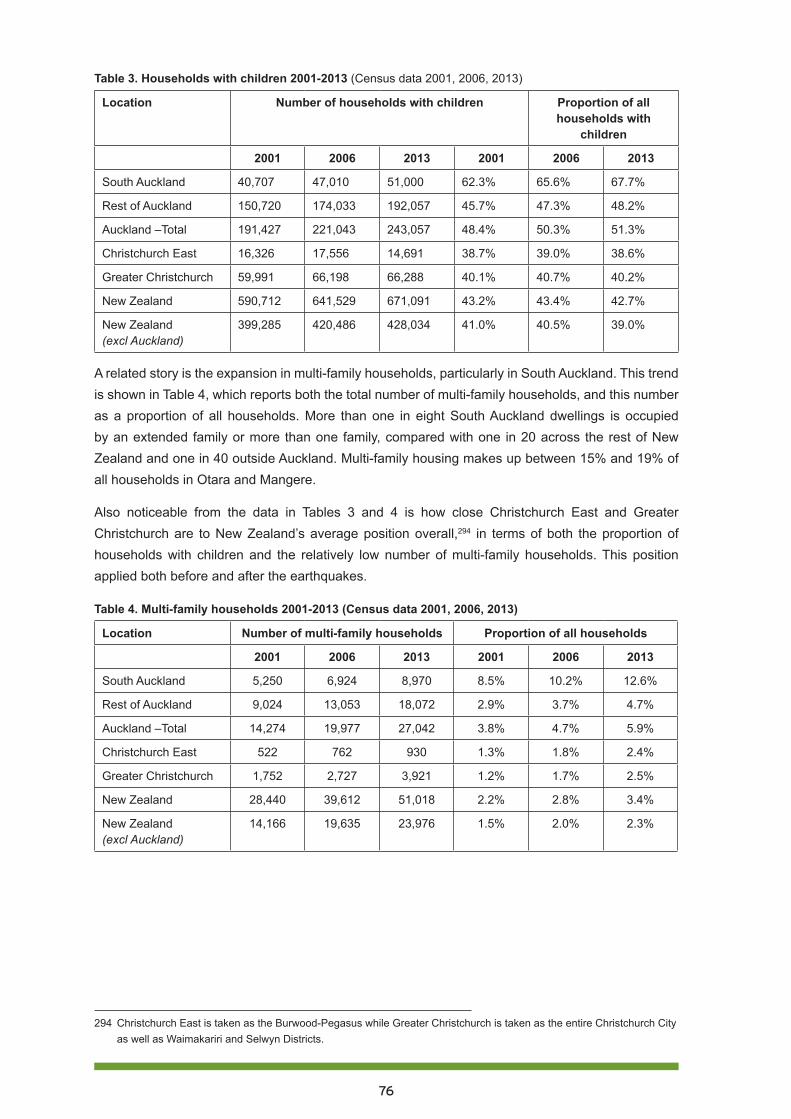
76
Table 3. Households with children 2001-2013 (Census data 2001, 2006, 2013)
Location Number of households with children Proportion of all households with
children
2001 2006 2013 2001 2006 2013
South Auckland 40,707 47,010 51,000 62.3% 65.6% 67.7%
Rest of Auckland 150,720 174,033 192,057 45.7% 47.3% 48.2%
Auckland –Total 191,427 221,043 243,057 48.4% 50.3% 51.3%
Christchurch East 16,326 17,556 14,691 38.7% 39.0% 38.6%
Greater Christchurch 59,991 66,198 66,288 40.1% 40.7% 40.2%
New Zealand 590,712 641,529 671,091 43.2% 43.4% 42.7%
New Zealand (excl Auckland)
399,285 420,486 428,034 41.0% 40.5% 39.0%
A related story is the expansion in multi-family households, particularly in South Auckland. This trend is shown in Table 4, which reports both the total number of multi-family households, and this number as a proportion of all households. More than one in eight South Auckland dwellings is occupied by an extended family or more than one family, compared with one in 20 across the rest of New Zealand and one in 40 outside Auckland. Multi-family housing makes up between 15% and 19% of all households in Otara and Mangere.
Also noticeable from the data in Tables 3 and 4 is how close Christchurch East and Greater Christchurch are to New Zealand’s average position overall,294 in terms of both the proportion of households with children and the relatively low number of multi-family households. This position applied both before and after the earthquakes.
Table 4. Multi-family households 2001-2013 (Census data 2001, 2006, 2013)
Location Number of multi-family households Proportion of all households
2001 2006 2013 2001 2006 2013
South Auckland 5,250 6,924 8,970 8.5% 10.2% 12.6%
Rest of Auckland 9,024 13,053 18,072 2.9% 3.7% 4.7%
Auckland –Total 14,274 19,977 27,042 3.8% 4.7% 5.9%
Christchurch East 522 762 930 1.3% 1.8% 2.4%
Greater Christchurch 1,752 2,727 3,921 1.2% 1.7% 2.5%
New Zealand 28,440 39,612 51,018 2.2% 2.8% 3.4%
New Zealand (excl Auckland)
14,166 19,635 23,976 1.5% 2.0% 2.3%
294 Christchurch East is taken as the Burwood-Pegasus while Greater Christchurch is taken as the entire Christchurch City as well as Waimakariri and Selwyn Districts.
77
Social housing reformsIn the 2013 Budget the Government announced its social housing reform agenda.295 This agenda was selectively based on prior work undertaken by the Shareholders’ Advisory Group, established in 2011 to provide the shareholding ministers of HNZC with independent advice on how that organisation might be reconfigured to deliver better financial and housing outcomes. The Government’s agenda was also influenced by a report on housing affordability by the Productivity Commission.296
The Government’s social housing reform agenda appears to have four strands, as follows:
1. A desire to undertake a radical reconfiguration of HNZC’s rental housing stock through redevelopment, disposals and renewals, in order to provide more modern housing of the right size and in the right locations to meet demand for social housing.
2. The transfer of housing needs assessment from HNZC to Work and Income, the Government’s agency for delivery and administration of welfare benefits. This transfer has also been associated with the narrowing down of HNZC’s operational purpose to a social housing provider.
3. A shift in focus for the provision of social housing away from direct provision by a state agency (HNZC) to third party providers such as NGOs and perhaps for-profit companies. This shift has been associated with the limited extension of income related rent subsidies to a small number of NGO social housing agencies.
4. A requirement for a more commercial focus by HNZC and with this, a requirement for higher dividends from the company to its owner – the Crown.297
Many aspects of these reforms can be justified and even viewed as being overdue. For example, HNZC’s housing stock was old, with the majority built before the 1980s and designed for families and households which were typical of the 1940s, 1950s and 1960s.298 This housing stock was widely distributed across New Zealand, and much was in areas of low housing demand, while demand in Auckland went unmet. The potential reconfiguration may involve up $6 billion of HNZC’s stock, or perhaps as much as 50% of all its housing, so should be seen as the most significant change in the 75 year history of social housing.299
The transfer of ‘housing needs assessment’ away from HNZC can also be seen as a desirable move. Previously HNZC was responsible for both assessing housing need and allocating housing, and its performance measures included the length of waiting lists. This created the incentives to use and perhaps the practice of using the needs assessment process as a rationing tool, to ensure that the waiting list did not get too long. The assessment of need by an independent party avoids such compromise.
HNZC was also restructured by the Labour-led governments of 1999 to 2008 as a one-stop housing shop. It was responsible for not only the delivery of social housing, but also all housing policy development, and the delivery of other housing programmes such as the Welcome Loan mortgage guarantee programme and the Housing Innovation Fund. This later programme was intended
295 English, B. & Smith, N. (2013) Housing package improves affordability, access, 16 May 2013, at: http://www.beehive.govt.nz/release/housing-package-improves-affordability-access.
296 New Zealand Productivity Commission (2012) Housing affordability inquiry; The New Zealand Productivity Commission.297 2013 Budget Speech, p.10, at http://www.treasury.govt.nz/budget/2013/speech/b13-speech.pdf. 298 66% of Housing NZ’s stock was built before 1980 and just 11% built since 2000 - see Housing New Zealand
Corporation Annual Report 2012/13 p.19. 299 For an indication of HNZC’s asset sales and reconfiguration plans, see p. 29 in its 2012-15 Statement of Intent.

78
to provide funding to NGO social housing providers – HNZC’s competitors. The result of such a conflicting agenda was that policy ideas were seldom contestable and quite often self-serving, and scrutiny around delivery of programmes was seldom robust.300
While, at a high level, the present Government’s reform agenda appears reasonable and even overdue, some concern must be raised over the way this agenda is being executed. These concerns are around the lack of transparency over both method and intent, and some of the inevitable adjustment problems associated with change of this scale and extent.
HNZC is not particularly forthcoming with information on its plans and in any case, these seem to change from year to year.301 The redevelopment of Tamaki, a predominantly state housing community in eastern Auckland, is an example of such vagueness and ambiguity. The HNZC’s most recent Statement of Intent, 2013-16, refers to the first stage of the Tamaki redevelopment process:
The project will see 156 state houses in two areas of northern Glen Innes redeveloped to create at least 260 new houses, including 78 state houses and at least 39 other social housing properties. The remaining new homes built by the project will provide a mix of affordable rentals and affordable home ownership opportunities.302
Yet HNZC’s website has more recently offered this view of the future ownership of the northern Glen Innes development:
In northern Glen Innes, we have expensive state houses on big sections in an area close to the city and we need to use that land wisely to help address Auckland’s growing housing problems. This is a priority area for both Auckland Council and Housing New Zealand.
To achieve our goals for the area, we plan to redevelop 156 properties to create at least 260 new houses, including: 78 owned by Housing New Zealand, at least 39 other market-based affordable houses and the remainder for private sale.303
In other words the 39 ‘other social housing properties’ have become 39 ‘other market-based affordable houses’, whatever this means, and the remaining additional houses have gone from providing ‘a mix of affordable rentals and affordable homeownership opportunities’ to being for ‘private sale’. Under this most recent scenario, 156 state houses are turned into 78 new state houses, making it difficult to believe that this first stage of the Tamaki redevelopment is not some form of state sponsored gentrification.
300 For example Housing New Zealand undertook the only review of the Housing Innovation Fund (see Housing New Zealand (2007) Research and Evaluation Summary Report: The Housing Innovation Fund Outcomes Evaluation, Housing New Zealand Corporation Ltd) and a review of the Accommodation Supplement undertaken by the Corporation in 2006-7 simply petered out without any findings, conclusions or recommendations. See initial efforts in Housing New Zealand (2007) Review of the Accommodation Supplement: summary of consultation workshops and stakeholder submissions, Housing New Zealand, at: http://www.hnzc.co.nz/our-publications/research/housing-research-and-evaluation/summaries-of-reports/accommodation-supplement-april-2007.
301 For example in its 2012-15 Statement of Intent Housing New Zealand forecast capital expenditure of $1.47 billion over the 2013/14 to 2105/16 years which was to be funded by $716 billion in asset sales and $255 million in impairments and loss on sales (p.29). A year later the 2013-16 Statement of Intent forecast capital spending of $2.47 billion which was to be funded from $910 million in asset sales and $156 million in impairments and loss on sale (p.30).
302 HNZC (2013) Statement of intent 2013-2016, at: http://www.hnzc.co.nz/our-publications/statement-of-intent/statement-of-intent-2013-2016/statement-of-intent_2013-16.pdf, at p.22.
303 HNZC at: http://www.hnzc.co.nz/housing-development/auckland/northern-glen-innes-redevelopment-1/faqs-about-Glen-Innes%20.
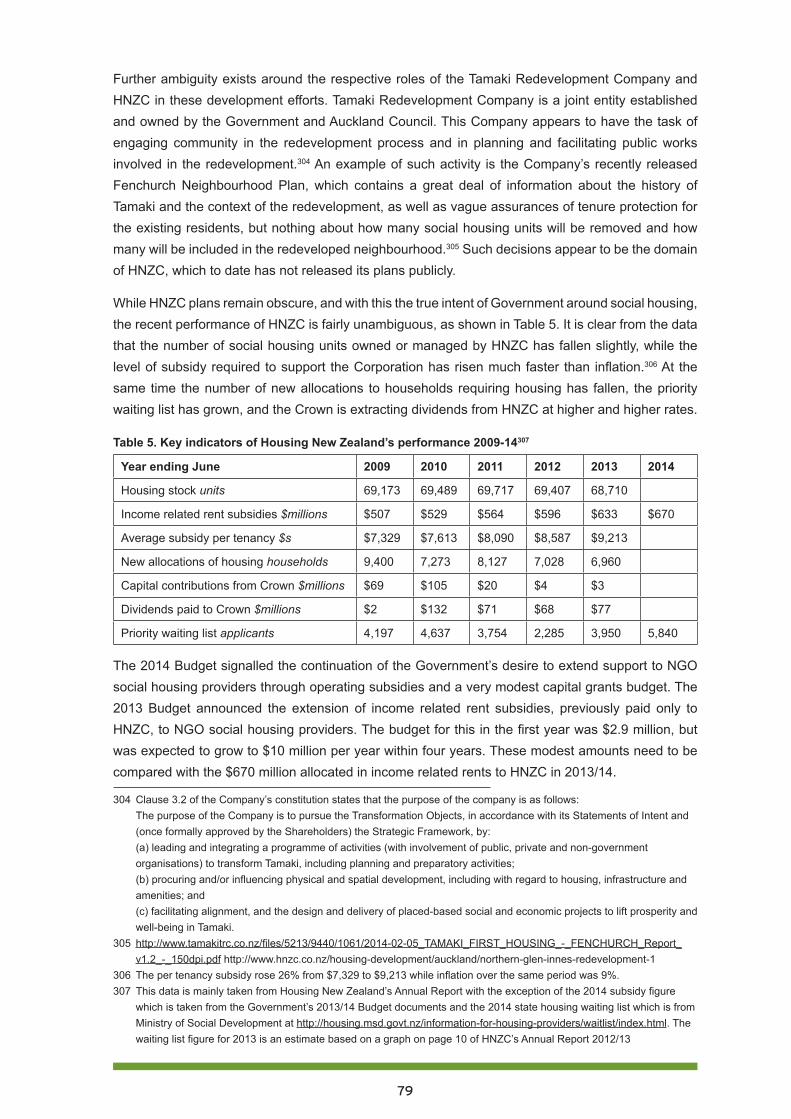
79
Further ambiguity exists around the respective roles of the Tamaki Redevelopment Company and HNZC in these development efforts. Tamaki Redevelopment Company is a joint entity established and owned by the Government and Auckland Council. This Company appears to have the task of engaging community in the redevelopment process and in planning and facilitating public works involved in the redevelopment.304 An example of such activity is the Company’s recently released Fenchurch Neighbourhood Plan, which contains a great deal of information about the history of Tamaki and the context of the redevelopment, as well as vague assurances of tenure protection for the existing residents, but nothing about how many social housing units will be removed and how many will be included in the redeveloped neighbourhood.305 Such decisions appear to be the domain of HNZC, which to date has not released its plans publicly.
While HNZC plans remain obscure, and with this the true intent of Government around social housing, the recent performance of HNZC is fairly unambiguous, as shown in Table 5. It is clear from the data that the number of social housing units owned or managed by HNZC has fallen slightly, while the level of subsidy required to support the Corporation has risen much faster than inflation.306 At the same time the number of new allocations to households requiring housing has fallen, the priority waiting list has grown, and the Crown is extracting dividends from HNZC at higher and higher rates.
Table 5. Key indicators of Housing New Zealand’s performance 2009-14307
Year ending June 2009 2010 2011 2012 2013 2014
Housing stock units 69,173 69,489 69,717 69,407 68,710
Income related rent subsidies $millions $507 $529 $564 $596 $633 $670
Average subsidy per tenancy $s $7,329 $7,613 $8,090 $8,587 $9,213
New allocations of housing households 9,400 7,273 8,127 7,028 6,960
Capital contributions from Crown $millions $69 $105 $20 $4 $3
Dividends paid to Crown $millions $2 $132 $71 $68 $77
Priority waiting list applicants 4,197 4,637 3,754 2,285 3,950 5,840
The 2014 Budget signalled the continuation of the Government’s desire to extend support to NGO social housing providers through operating subsidies and a very modest capital grants budget. The 2013 Budget announced the extension of income related rent subsidies, previously paid only to HNZC, to NGO social housing providers. The budget for this in the first year was $2.9 million, but was expected to grow to $10 million per year within four years. These modest amounts need to be compared with the $670 million allocated in income related rents to HNZC in 2013/14.
304 Clause 3.2 of the Company’s constitution states that the purpose of the company is as follows: The purpose of the Company is to pursue the Transformation Objects, in accordance with its Statements of Intent and (once formally approved by the Shareholders) the Strategic Framework, by: (a) leading and integrating a programme of activities (with involvement of public, private and non-government organisations) to transform Tamaki, including planning and preparatory activities; (b) procuring and/or influencing physical and spatial development, including with regard to housing, infrastructure and amenities; and (c) facilitating alignment, and the design and delivery of placed-based social and economic projects to lift prosperity and well-being in Tamaki.
305 http://www.tamakitrc.co.nz/files/5213/9440/1061/2014-02-05_TAMAKI_FIRST_HOUSING_-_FENCHURCH_Report_v1.2_-_150dpi.pdf http://www.hnzc.co.nz/housing-development/auckland/northern-glen-innes-redevelopment-1
306 The per tenancy subsidy rose 26% from $7,329 to $9,213 while inflation over the same period was 9%.307 This data is mainly taken from Housing New Zealand’s Annual Report with the exception of the 2014 subsidy figure
which is taken from the Government’s 2013/14 Budget documents and the 2014 state housing waiting list which is from Ministry of Social Development at http://housing.msd.govt.nz/information-for-housing-providers/waitlist/index.html. The waiting list figure for 2013 is an estimate based on a graph on page 10 of HNZC’s Annual Report 2012/13
80
In 2014/15 the Government has budgeted $718 million in income related rents subsidies, although the division of this between HNZC and NGO social housing providers is unknown. The details behind claims by Housing Minister Dr Smith308 that the Government was allocating $30 million in capital subsidies for new social housing showed that this sum is to be provided over three years from 2015/16. In addition, the Government budgeted $1,140 million in 2014/15 in housing subsidies through the Accommodation Supplement. This compares with a slightly higher figure of $1,149 million in 2013/14.309
In April 2014, Community Housing Aotearoa, the Government-funded umbrella organisation for NGO housing organisations, released a discussion paper on ways in which the Government could transfer state houses to the so-called ‘community housing sector’.310 This was followed by Dr Smith’s announcement of the establishment of an inter-ministry entity to oversee the transfer of state houses to NGO housing providers.311 The conditions and terms for such transfers are apparently still to be developed.
RECOMMENDATION 2
Based on the national housing plan and on the current shortage of social housing, the Government commits to building an additional 1,000 social housing units per year either in the state or non-state sectors, and in areas of high need.
Housing occupancy and overcrowdingWhile children are more likely than adults to live in overcrowded housing, there is limited evidence that levels of overcrowding are increasing significantly. In 2006, while 7% of adults aged over 25 years were judged to be living in overcrowded accommodation, children fared much worse:
17 percent of children under 15 years (136,563 children) and 17 percent of young people aged 15–24 years (89,076) were living in crowded households. The proportion of children under 15 living in crowded households remained fairly steady at around 16 to 17 percent between 1986 and 2006.312
The link between overcrowded housing and poor health outcomes is well documented, although the value of such research and documentation in influencing meaningful housing policy change is difficult to identify at this stage (see also the section on health, above). The New Zealand focused literature
308 Dr Smith’s press release $30m Budget boost for Social Housing Fund – 15th May 2014 available at http://www.beehive.govt.nz/release/30m-budget-boost-social-housing-fund.
309 Figures on housing spend are taken from 2013 and 2014 Budget documents and in particular Vote Housing and Vote Social Development Estimates and Appropriations.
310 Community Housing Aotearoa (2014) A Way Forward for Stock Transfers available at http://communityhousing.org.nz/news/way-forward-stock-transfers/.
311 NZ Herald, “Govt sets up agency to transfer state houses”, 28 May 2014, at http://www.nzherald.co.nz/nz/news/article.cfm?c_id=1&objectid=11263269.
312 Ministry of Social Development (2008) Children and Young People: Indicators of Wellbeing in New Zealand 2008; Ministry of Social Development p.191
81
relating overcrowded housing to poor health outcomes, especially for children, is extensive.313 314 315 316 This literature, including CPAG’s Our children, our choice, Part One: Child poverty and health,317 has identified overall that there are ‘higher rates of infectious diseases in areas with higher proportions of crowded households’.318 These include acute rheumatic fever, meningococcal and pneumococcal meningitis, and meningococcal disease. Further, meta-analysis evidence has shown that ‘household crowding was associated with increased risk of gastroenteritis, pneumonia/lower respiratory tract infection (LRTI), Haemophilus influenzae (Hib) disease and respiratory syncytial virus (RSV) bronchiolitis’.319
Of these diseases, rheumatic fever is the most topical at present. Rheumatic fever is a debilitating and preventable illness which is closely linked to poverty and overcrowded housing.320 New Zealand has a high rate of rheumatic fever in comparison with other OECD countries, and Māori and Pasifika people, particularly children, suffer disproportionately from the disease. In 2013 the incidence of rheumatic fever amongst Māori was 13.5 per 100,000, and amongst Pacific people it was 32.4 per 100,000, compared with a nation-wide rate of just 4.3 per 100,000.321
Amongst the Government’s better public service targets is an ambition to reduce rates of rheumatic fever by two thirds to 1.4 cases per 100,000 by June 2017.322 Although this ambition has become one of the Government’s headline priorities, its commitment to it is quite minimal, accounting for just 0.075% of total health spending, or around $11 million per year.323 The programme itself began in the 2012/13 financial year, and although early results were not and cannot be expected, the 2013 results showed an increase in infection rates from 3.7 cases per 100,000 in 2012 to 4.3 cases per 100,000. This increase was mainly due to a rapid rise in Pasifika infection rates, from 19.3 in 2012 to 32.5 in 2013.324
313 for example Baker, M. McDonald, A. Zhang, J. and Howden-Chapman, P. (2013) Infectious Diseases Attributable to Household Crowding in New Zealand: A Systematic Review and Burden of Disease Estimate He Kainga Oranga: Housing and Health Research Programme, University of Otago.
314 Neuwelt, P. and Simmonds, G. (2006) A Public Health Portrait of Severe Paediatric Gastroenteritis in the Auckland Region: Report of the 2005 Auckland Paediatric Gastroenteritis Investigation; Auckland Regional Public Health Service
315 Auckland Regional Public Health Service (2005) Health and housing Auckland: A summary of selected research.316 Baker, M, Goodyear, R. and Howden-Chapman, P (2003) Chapter 5 Household Crowding and Health in Statistics
New Zealand (2003) What is the extent of crowding in New Zealand? pp. 58-87 available at http://www.stats.govt.nz/browse_for_stats/people_and_communities/housing/crowding-analytical-report.aspx#report.
317 Part one: Child poverty and health, available at http://www.cpag.org.nz/assets/Publications/140501%202-0%20CPAG%20Our%20Children%20Our%20Choice%20Part%201%20FINAL%20COPY.pdf.
318 Baker, M, Goodyear, R. and Howden-Chapman, P (2003) Chapter 5 Household Crowding and Health in Statistics New Zealand (2003) What is the extent of crowding in New Zealand? At: http://www.stats.govt.nz/browse_for_stats/people_and_communities/housing/crowding-analytical-report.aspx#report, p. 79.
319 Baker, M. McDonald, A. Zhang, J. and Howden-Chapman, P. (2013) Infectious Diseases Attributable to Household Crowding in New Zealand: A Systematic Review and Burden of Disease Estimate He Kainga Oranga: Housing and Health Research Programme, University of Otago, p.9.
320 Robin, A. Mills, C. Tuck. R and Lennon, D, (2013) The epidemiology of acute rheumatic fever in Northland 2002-2011, The New Zealand Medical Journal, 126/1373.
321 Ibid.322 For details on the Better Public Services Targets see the National Party website at https://www.national.org.nz/news/
features/public-services. A discussion on the targets around reductions in rheumatic fever rates is at: http://www.health.govt.nz/about-ministry/what-we-do/strategic-direction/better-public-services/progress-better-public-services-rheumatic-fever-target.
323 Minister of Health’s press release ‘Budget 2014: Additional $20m to help fight rheumatic fever’ on 01/052014 which promised $65.3 million over six years on the programme, at: http://www.beehive.govt.nz/release/budget-2014-additional-20m-help-fight-rheumatic-feve.
324 Ministry of Health report and data at http://www.health.govt.nz/about-ministry/what-we-do/strategic-direction/better-public-services/progress-better-public-services-rheumatic-fever-target.
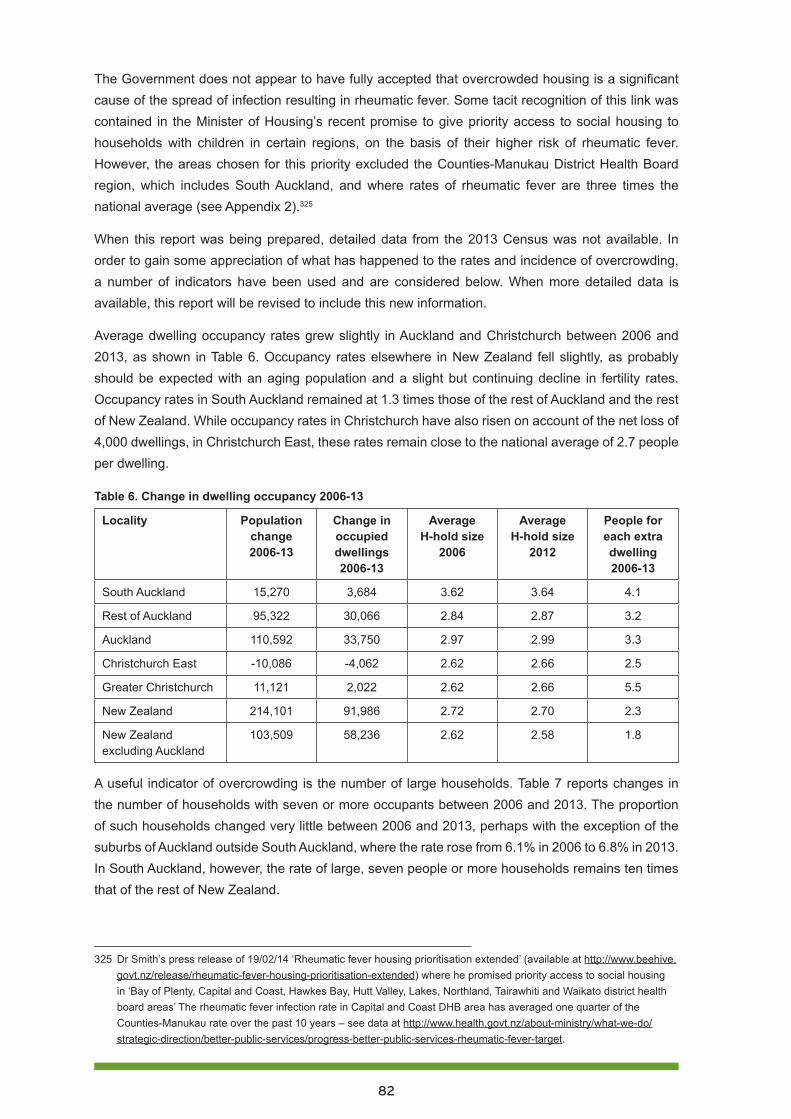
82
The Government does not appear to have fully accepted that overcrowded housing is a significant cause of the spread of infection resulting in rheumatic fever. Some tacit recognition of this link was contained in the Minister of Housing’s recent promise to give priority access to social housing to households with children in certain regions, on the basis of their higher risk of rheumatic fever. However, the areas chosen for this priority excluded the Counties-Manukau District Health Board region, which includes South Auckland, and where rates of rheumatic fever are three times the national average (see Appendix 2).325
When this report was being prepared, detailed data from the 2013 Census was not available. In order to gain some appreciation of what has happened to the rates and incidence of overcrowding, a number of indicators have been used and are considered below. When more detailed data is available, this report will be revised to include this new information.
Average dwelling occupancy rates grew slightly in Auckland and Christchurch between 2006 and 2013, as shown in Table 6. Occupancy rates elsewhere in New Zealand fell slightly, as probably should be expected with an aging population and a slight but continuing decline in fertility rates. Occupancy rates in South Auckland remained at 1.3 times those of the rest of Auckland and the rest of New Zealand. While occupancy rates in Christchurch have also risen on account of the net loss of 4,000 dwellings, in Christchurch East, these rates remain close to the national average of 2.7 people per dwelling.
Table 6. Change in dwelling occupancy 2006-13
Locality Population change 2006-13
Change in occupied dwellings 2006-13
Average H-hold size
2006
Average H-hold size
2012
People for each extra dwelling 2006-13
South Auckland 15,270 3,684 3.62 3.64 4.1
Rest of Auckland 95,322 30,066 2.84 2.87 3.2
Auckland 110,592 33,750 2.97 2.99 3.3
Christchurch East -10,086 -4,062 2.62 2.66 2.5
Greater Christchurch 11,121 2,022 2.62 2.66 5.5
New Zealand 214,101 91,986 2.72 2.70 2.3
New Zealand excluding Auckland
103,509 58,236 2.62 2.58 1.8
A useful indicator of overcrowding is the number of large households. Table 7 reports changes in the number of households with seven or more occupants between 2006 and 2013. The proportion of such households changed very little between 2006 and 2013, perhaps with the exception of the suburbs of Auckland outside South Auckland, where the rate rose from 6.1% in 2006 to 6.8% in 2013. In South Auckland, however, the rate of large, seven people or more households remains ten times that of the rest of New Zealand.
325 Dr Smith’s press release of 19/02/14 ‘Rheumatic fever housing prioritisation extended’ (available at http://www.beehive.govt.nz/release/rheumatic-fever-housing-prioritisation-extended) where he promised priority access to social housing in ‘Bay of Plenty, Capital and Coast, Hawkes Bay, Hutt Valley, Lakes, Northland, Tairawhiti and Waikato district health board areas’ The rheumatic fever infection rate in Capital and Coast DHB area has averaged one quarter of the Counties-Manukau rate over the past 10 years – see data at http://www.health.govt.nz/about-ministry/what-we-do/strategic-direction/better-public-services/progress-better-public-services-rheumatic-fever-target.
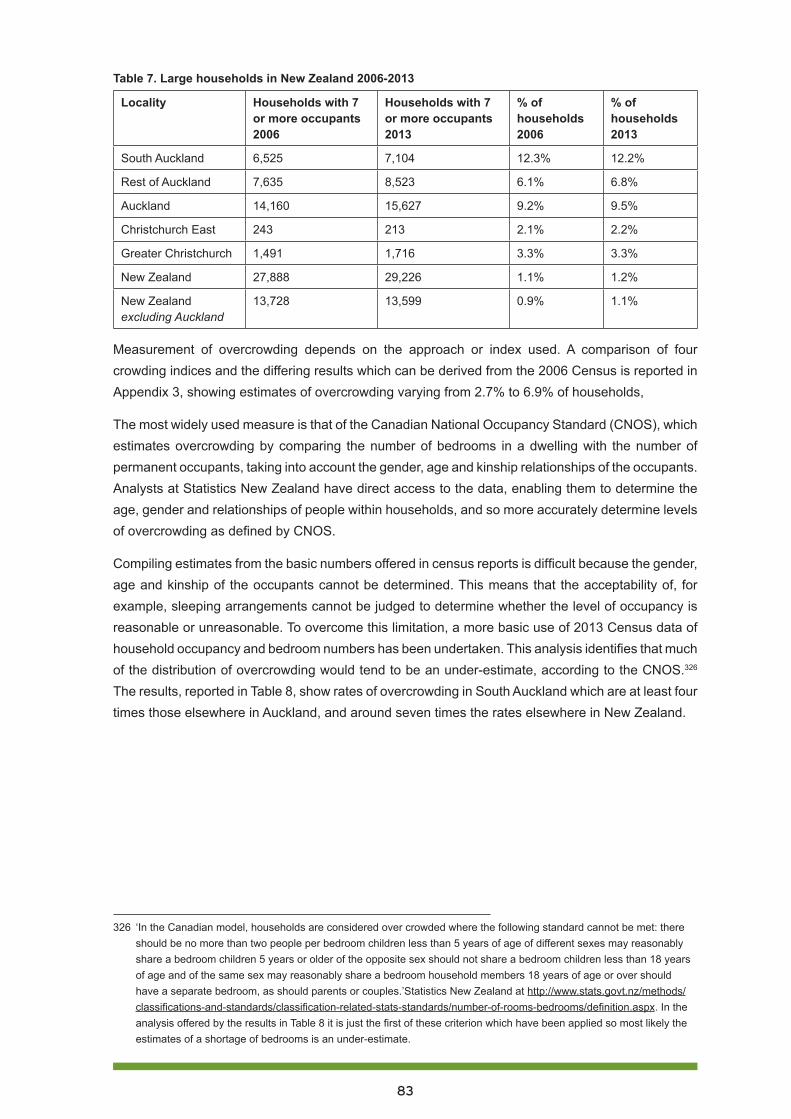
83
Table 7. Large households in New Zealand 2006-2013
Locality Households with 7 or more occupants 2006
Households with 7 or more occupants 2013
% of households 2006
% of households 2013
South Auckland 6,525 7,104 12.3% 12.2%
Rest of Auckland 7,635 8,523 6.1% 6.8%
Auckland 14,160 15,627 9.2% 9.5%
Christchurch East 243 213 2.1% 2.2%
Greater Christchurch 1,491 1,716 3.3% 3.3%
New Zealand 27,888 29,226 1.1% 1.2%
New Zealand excluding Auckland
13,728 13,599 0.9% 1.1%
Measurement of overcrowding depends on the approach or index used. A comparison of four crowding indices and the differing results which can be derived from the 2006 Census is reported in Appendix 3, showing estimates of overcrowding varying from 2.7% to 6.9% of households,
The most widely used measure is that of the Canadian National Occupancy Standard (CNOS), which estimates overcrowding by comparing the number of bedrooms in a dwelling with the number of permanent occupants, taking into account the gender, age and kinship relationships of the occupants. Analysts at Statistics New Zealand have direct access to the data, enabling them to determine the age, gender and relationships of people within households, and so more accurately determine levels of overcrowding as defined by CNOS.
Compiling estimates from the basic numbers offered in census reports is difficult because the gender, age and kinship of the occupants cannot be determined. This means that the acceptability of, for example, sleeping arrangements cannot be judged to determine whether the level of occupancy is reasonable or unreasonable. To overcome this limitation, a more basic use of 2013 Census data of household occupancy and bedroom numbers has been undertaken. This analysis identifies that much of the distribution of overcrowding would tend to be an under-estimate, according to the CNOS.326 The results, reported in Table 8, show rates of overcrowding in South Auckland which are at least four times those elsewhere in Auckland, and around seven times the rates elsewhere in New Zealand.
326 ‘In the Canadian model, households are considered over crowded where the following standard cannot be met: there should be no more than two people per bedroom children less than 5 years of age of different sexes may reasonably share a bedroom children 5 years or older of the opposite sex should not share a bedroom children less than 18 years of age and of the same sex may reasonably share a bedroom household members 18 years of age or over should have a separate bedroom, as should parents or couples.’Statistics New Zealand at http://www.stats.govt.nz/methods/classifications-and-standards/classification-related-stats-standards/number-of-rooms-bedrooms/definition.aspx. In the analysis offered by the results in Table 8 it is just the first of these criterion which have been applied so most likely the estimates of a shortage of bedrooms is an under-estimate.

84
Table 8. Estimates of overcrowded dwellings from 2013 Census327
Location Overcrowded dwellings
Total dwellings Overcrowding as % of total dwellings
South Auckland 5,000 74,901 6.7%
Rest of Auckland 6,000 394,599 1.5%
Auckland total 11,000 469,500 2.3%
New Zealand 20,200 1,549,890 1.3%
New Zealand excluding Auckland 9,200 1,080,393 0.9%
Although there is limited data on overcrowding available from the 2013 Census, this data would suggest that, excluding South Auckland, overall rates of overcrowding have not become worse over the past decade. The size distribution of households has changed little, although, as expected, there has been a small increase in the proportion of single person households (see Appendix 4). Also as expected, the proportion of households with children has fallen. As a whole, household size has changed little across New Zealand and the average remains at around 2.7 people per dwelling.
Further analysis is required, once data are available from the 2013 Census, in order to establish the extent of children living in overcrowded housing. At this stage the evidence points to a persistent, although perhaps not worsening, problem in Auckland, and in particular in South Auckland.
RECOMMENDATION 3
Prioritise access to social housing for households with children in certain regions, including the Counties-Manukau District Health Board region, on the basis of their higher risk of rheumatic fever.
Housing tenure changeThe 1991 Budget not only signalled significant reductions in welfare benefits on the basis of incentivising work, but also introduced market rents for state houses. With this change came a reliance on demand subsidy as the only form of housing assistance provided. This demand subsidy is the Accommodation Supplement, and at the time of its introduction, one of its claimed virtues was that it was tenure neutral and did not distort the tenure ‘preferences’ of those receiving the subsidy.328
The Accommodation Supplement provides slightly more generous subsidies for tenants than for those repaying mortgages, and the imposition of maximum payments has more or less limited its use to those either renting or paying board. Only around 10% of payments of the Accommodation Supplement by number, and 12% by value, are provided to households repaying mortgages, and this proportion has fallen over time.329
327 This table is based on data from the 2013 Census which was provided preferentially to Auckland Council and supplied to the author. This data did not include local figures for New Zealand outside of Auckland.
328 Luxton, J. (1991) Housing and Accommodation Assistance. A Statement of Government Policy on Housing and Accommodation, NZ Government Printer.
329 The proportion of Accommodation Supplement recipients who were homeowners fell from 17% in 2008 to 13% in 2013 and in 2013 the proportion of such payments by value was also 13%. See Johnson, A. (2013) Give me shelter: An assessment of New Zealand’s housing assistance policies; The Salvation Army, at: http://www.salvationarmy.org.nz/sites/default/files/uploads/GiveMeShelter2013FinalWeb.pdf, pp. 45-47.
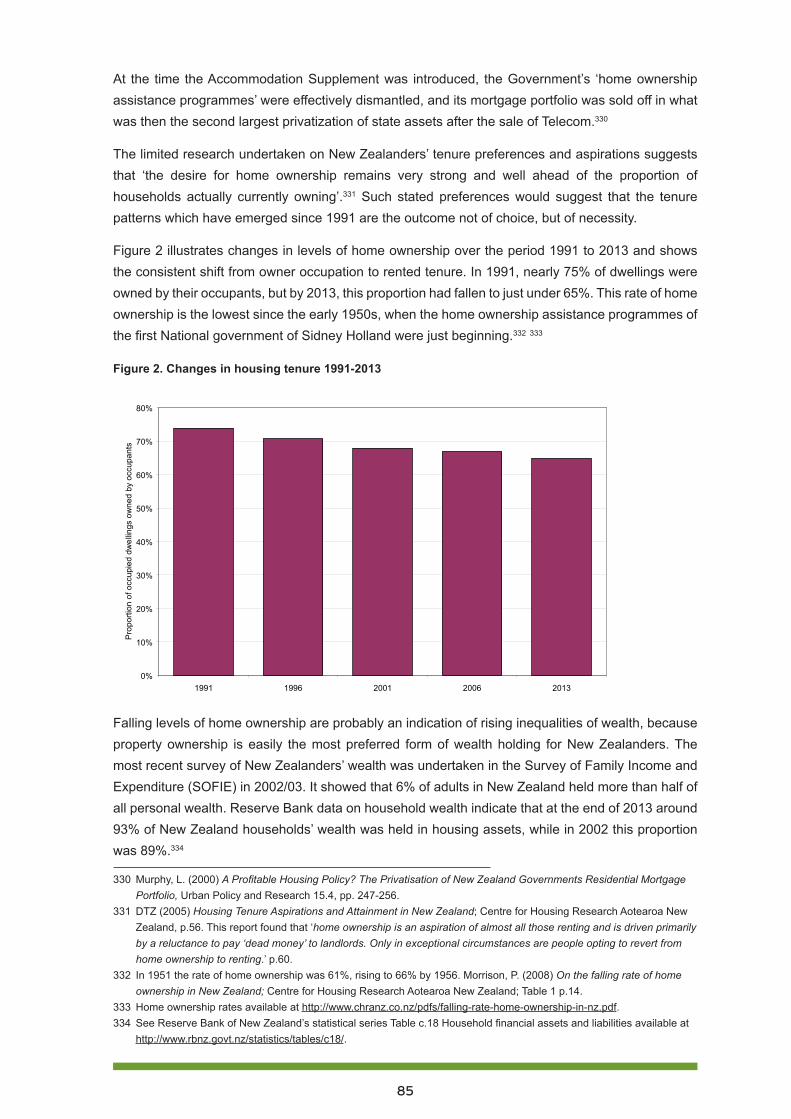
85
At the time the Accommodation Supplement was introduced, the Government’s ‘home ownership assistance programmes’ were effectively dismantled, and its mortgage portfolio was sold off in what was then the second largest privatization of state assets after the sale of Telecom.330
The limited research undertaken on New Zealanders’ tenure preferences and aspirations suggests that ‘the desire for home ownership remains very strong and well ahead of the proportion of households actually currently owning’.331 Such stated preferences would suggest that the tenure patterns which have emerged since 1991 are the outcome not of choice, but of necessity.
Figure 2 illustrates changes in levels of home ownership over the period 1991 to 2013 and shows the consistent shift from owner occupation to rented tenure. In 1991, nearly 75% of dwellings were owned by their occupants, but by 2013, this proportion had fallen to just under 65%. This rate of home ownership is the lowest since the early 1950s, when the home ownership assistance programmes of the first National government of Sidney Holland were just beginning.332 333
Figure 2. Changes in housing tenure 1991-2013
0%
10%
20%
30%
40%
50%
60%
70%
80%
1991 1996 2001 2006 2013
Pro
porti
on o
f occ
upie
d dw
ellin
gs o
wne
d by
occ
upan
ts
Falling levels of home ownership are probably an indication of rising inequalities of wealth, because property ownership is easily the most preferred form of wealth holding for New Zealanders. The most recent survey of New Zealanders’ wealth was undertaken in the Survey of Family Income and Expenditure (SOFIE) in 2002/03. It showed that 6% of adults in New Zealand held more than half of all personal wealth. Reserve Bank data on household wealth indicate that at the end of 2013 around 93% of New Zealand households’ wealth was held in housing assets, while in 2002 this proportion was 89%.334
330 Murphy, L. (2000) A Profitable Housing Policy? The Privatisation of New Zealand Governments Residential Mortgage Portfolio, Urban Policy and Research 15.4, pp. 247-256.
331 DTZ (2005) Housing Tenure Aspirations and Attainment in New Zealand; Centre for Housing Research Aotearoa New Zealand, p.56. This report found that ‘home ownership is an aspiration of almost all those renting and is driven primarily by a reluctance to pay ‘dead money’ to landlords. Only in exceptional circumstances are people opting to revert from home ownership to renting.’ p.60.
332 In 1951 the rate of home ownership was 61%, rising to 66% by 1956. Morrison, P. (2008) On the falling rate of home ownership in New Zealand; Centre for Housing Research Aotearoa New Zealand; Table 1 p.14.
333 Home ownership rates available at http://www.chranz.co.nz/pdfs/falling-rate-home-ownership-in-nz.pdf. 334 See Reserve Bank of New Zealand’s statistical series Table c.18 Household financial assets and liabilities available at
http://www.rbnz.govt.nz/statistics/tables/c18/.
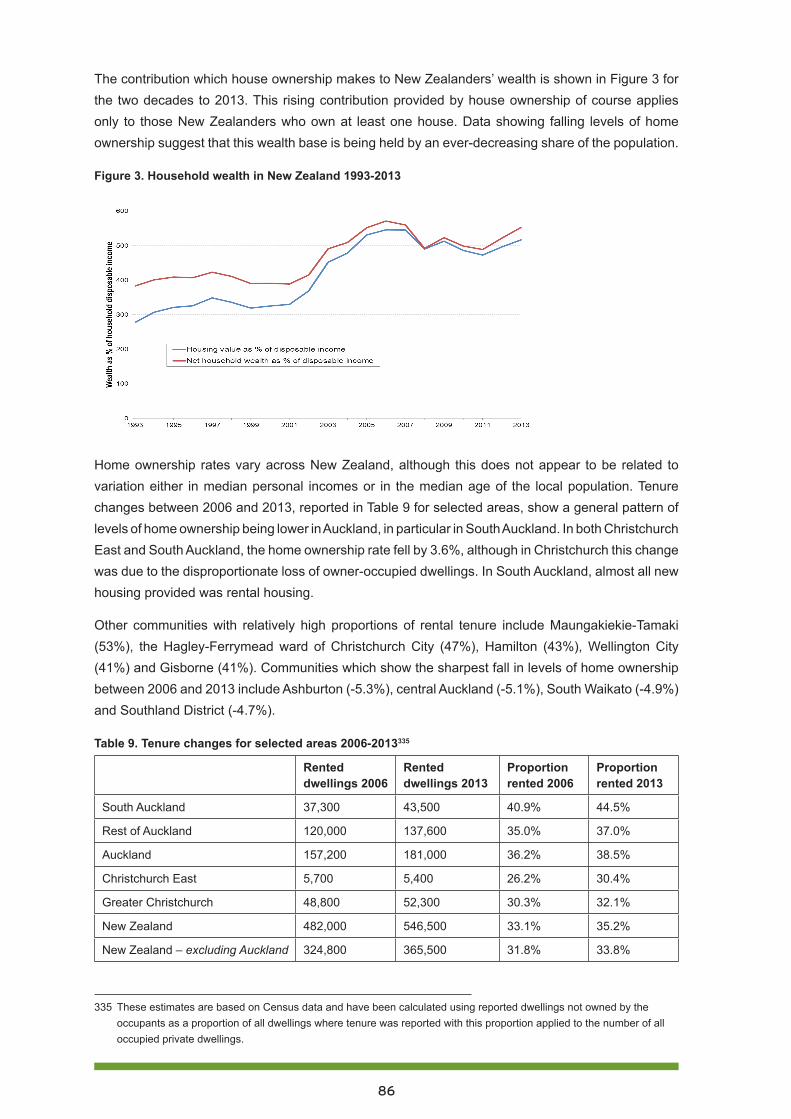
86
The contribution which house ownership makes to New Zealanders’ wealth is shown in Figure 3 for the two decades to 2013. This rising contribution provided by house ownership of course applies only to those New Zealanders who own at least one house. Data showing falling levels of home ownership suggest that this wealth base is being held by an ever-decreasing share of the population.
Figure 3. Household wealth in New Zealand 1993-2013
Home ownership rates vary across New Zealand, although this does not appear to be related to variation either in median personal incomes or in the median age of the local population. Tenure changes between 2006 and 2013, reported in Table 9 for selected areas, show a general pattern of levels of home ownership being lower in Auckland, in particular in South Auckland. In both Christchurch East and South Auckland, the home ownership rate fell by 3.6%, although in Christchurch this change was due to the disproportionate loss of owner-occupied dwellings. In South Auckland, almost all new housing provided was rental housing.
Other communities with relatively high proportions of rental tenure include Maungakiekie-Tamaki (53%), the Hagley-Ferrymead ward of Christchurch City (47%), Hamilton (43%), Wellington City (41%) and Gisborne (41%). Communities which show the sharpest fall in levels of home ownership between 2006 and 2013 include Ashburton (-5.3%), central Auckland (-5.1%), South Waikato (-4.9%) and Southland District (-4.7%).
Table 9. Tenure changes for selected areas 2006-2013335
Rented dwellings 2006
Rented dwellings 2013
Proportion rented 2006
Proportion rented 2013
South Auckland 37,300 43,500 40.9% 44.5%
Rest of Auckland 120,000 137,600 35.0% 37.0%
Auckland 157,200 181,000 36.2% 38.5%
Christchurch East 5,700 5,400 26.2% 30.4%
Greater Christchurch 48,800 52,300 30.3% 32.1%
New Zealand 482,000 546,500 33.1% 35.2%
New Zealand – excluding Auckland 324,800 365,500 31.8% 33.8%
335 These estimates are based on Census data and have been calculated using reported dwellings not owned by the occupants as a proportion of all dwellings where tenure was reported with this proportion applied to the number of all occupied private dwellings.
87
Data on the tenure of households with children are not yet available from the 2013 Census, although the pattern of this distribution is unlikely to have changed much since 2006, when 39.1% of children aged under 15 lived in accommodation which was not owned by its occupants.336 This compares with an overall ‘non-ownership’ rate of 33.1% of occupied dwellings. On the basis of the increase in this ‘non-ownership’ rate to 35.2% in 2013, it seems reasonable to expect that around 40% to 41% of children are now living in rented accommodation.
The relatively high and probably rising proportion of children living in rented accommodation is problematic, because this form of housing tenure is more likely to be overcrowded and less likely to be well maintained. In addition, tenant households shift more frequently than owner-occupier households, and this mobility is likely to disrupt children’s schooling and socialisation, as identified in Part 3: Compulsory education and child poverty.337 338
Estimates of household overcrowding from the 2006 Census suggest that rented housing is three to four times more likely to be overcrowded than owner-occupied housing, and that, depending on the crowding definition used, between 5% and 12% of all rented dwellings are overcrowded.339
Results from Statistics New Zealand’s New Zealand General Social Survey for 2012 suggest that nearly 50% of tenants report problems with their housing, compared with just over 25% of owner-occupiers.340 Such perceptions are supported by a ‘housing condition’ survey undertaken by BRANZ in 2010, which showed that 44% of rented dwellings were assessed as being in a poor state of repair, compared with 25% of owner-occupied dwellings.341
Over the ten years to June 2014, the annual turnover of tenancies has averaged 51%, while the turnover of the housing stock through sales has averaged just 14%. This means a tenant household shifts house on average every two years, while an owner-occupier household does so on average every six years.342
Increasingly, children’s housing fortunes and especially poor children’s housing fortunes are tied to the changes in rental housing markets and to physical conditions offered by this housing. Rental housing is in general of lower quality than owner-occupied housing. Those living in rental housing are more likely to have children and to be living in financial stress caused by high housing costs relative
336 James, B. and Saville-Smith, K. (2010) Children’s housing future, Centre for Housing Research Aotearoa New Zealand, p.31.
337 O’Neill, J. (2014) Part three: Compulsory education and child poverty, Child Poverty Action Group, at: http://www.cpag.org.nz/assets/Publications/1-0%20Our%20Children%20Our%20Choice%20Part%203.pdf.
338 See also: Wynd, D. (2014) The revolving door: Student mobility in Auckland schools, Child Poverty Action Group, at http://www.cpag.org.nz/assets/Backgrounders/140523%20CPAG%20Transience%20Report%20May2014%20FINAL.pdf.
339 Goodyear, R. Fabian, A. and Hay, J. (2012) Finding the crowding index that works best for New Zealand; Statistics New Zealand, p.28.
340 Statistics New Zealand’s interactive table for NZGSS, at: http://nzdotstat.stats.govt.nz/wbos/Index.aspx?DataSetCode=TABLECODE7902at.
341 Buckett, N. Jones, M. and Martson, n. (2012) BRANZ 2010 Housing Condition Survey – Condition Comparison by Tenure, Building Research Association of New Zealand; p.10.
342 Tenancy data is taken from Ministry of Building Employment and Innovation’s tenancy bonds database at: http://www.dbh.govt.nz/nz-housing-and-co construction-quarterly-open-data. This data shows that over the ten years to 30 June 2014 an average 176,000 new bonds were lodged each year against an average of 310,000 active bonds giving a turnover rate of 57%. House sales data from the Real Estate of New Zealand reports that over the same 10 years annual sales (through a licensed real estate agent) averaged 78,400. Statistics New Zealand’s estimates for occupied dwellings suggest an average number of dwellings of 1.7 million over this period representing an annual turnover of 4.7%. Most likely the turnover would be higher than this on account of house sales being undertaken without a licensed agent.
88
to income. Perhaps due to this stress, these households move more frequently than owner-occupier households, and such shifting creates further stress on the households and their children.
On 19 February 2014, the Housing Minister announced the start of a trial Housing Warrant of Fitness scheme for HNZC homes:343
This Government is committed to improving the quality of housing to help achieve our goals of better social, health and educational outcomes for New Zealanders. Our first step was to insulate every state house that could be insulated. This was completed last year. The next step is developing a practical minimum standard and applying this to our state houses.
CPAG congratulates the Government on these housing warrant of fitness and housing insulation programmes, but suggests that, using a child-centred or humane approach, a house that cannot be insulated is not ‘fit for purpose’ and should not receive a Warrant of Fitness (HWoF). At the very least, such houses are likely to induce fuel poverty.344
RECOMMENDATION 4
A housing warrant of fitness for all rental properties be put in place within five years to ensure that all rental properties meet acceptable health and living standards.
Housing affordabilityThe New Zealand media and business research frame housing affordability as the ‘affordability of purchasing a home’, or more specifically, the ‘affordability of paying off a mortgage’, typically held by middle class and often younger persons. The leading affordability indices are the Roost Home Mortgage Affordability Report345 and the Massey University Home Affordability Index.346
Figure 1 above provides a simple measure of housing affordability based on house prices, but not taking account of debt servicing costs, which change circumstances in money markets. As discussed above, since late 2011 there has been a consistent decline in housing affordability in Auckland, while conditions outside of Auckland have remained relatively flat and may have even improved a little. Affordability measured by more sophisticated measures, such as the Roost Home Mortgage Affordability measure or the Massey University index, shows a slightly different trend, mainly because
343 http://www.beehive.govt.nz/release/housing-wof-trial-gets-underway. 344 Howden-Chapman, P., Baker, M.G. & and Bierre, S. (2013) “The Houses Children Live In, policies to improve housing
quality”, Policy Quarterly, Volume 9, Issue 2 – May 2013, at: http://igps.victoria.ac.nz/publications/files/f79b9f69dfa.pdf..345 The Roost Home Mortgage Affordability Report is prepared by Interest.co.nz and is available at http://interest.co.nz/
property/home-loan-affordability. The affordability measure is reported as a percentage which is an estimate of the proportion of a median income that it would take to take to pay the mortgage on a median priced house purchased at that time, assuming the median income of a typical buyer in the 30-34 age group. The measure is calculated across 24 housing markets, with Invercargill the most affordable, and Queenstown then Central Auckland as least affordable.
346 The Massey University Home Affordability Report is at: http://www.massey.ac.nz/massey/fms/Colleges/College%20of%20Business/School%20of%20Economics%20&%20Finance/research-outputs/mureau/home-affordability/157939%20-%20Home%20Affordability%20FEB%202014%20V2.pdf?78026AD2AA81D84C8EEBA0F989297DC9. This index is based on average weekly earnings, mortgage interest rates and median house sale prices and is reported across 12 regions. The most affordable region in this survey is Southland and least affordable is Auckland followed closely by Central Otago Lakes.

89
of historically low mortgage interest rates between late 2009 and late 2013.347 This trend is illustrated in Figure 4 for the Massey University index, which shows a slight deterioration in housing affordability across New Zealand, but especially in Auckland, since mortgage interest rates began to rise in late 2013.
Figure 4. Massey University Home Affordability Index 2009-2014348
As noted previously, the New Zealand index is likely to be biased by the impact that Auckland house prices and the volume of house sales have on national averages, given that Auckland accounts for around half of the total house sales market by value. This will mean the trends for ‘the rest of New Zealand’ (excluding Auckland) will be somewhat different from the New Zealand trends shown in Figures 1 and 4. Similarly, the relativity between Christchurch and New Zealand will be different if the ‘New Zealand’ in the comparison includes or excludes Auckland. Both Figures 1 and 4 indicate that Christchurch’s housing affordability has caught up to the average New Zealand affordability since the 2010/11 earthquakes. Perhaps a more accurate situation was that Christchurch affordability, at least in terms of purchase and mortgage servicing, was close to the New Zealand average (excluding Auckland) prior to the earthquakes, and that since the earthquakes, that affordability has deteriorated at much the same rate as Auckland’s. The rest of New Zealand (excluding both Auckland and Christchurch) has in general become relatively more affordable for those households that have managed to maintain their employment and incomes during the recession.
Perhaps one of the limitations with any affordability measure based on purchasing a house on a mortgage is that it presents a relevant snapshot of housing affordability for the part of the community above the median. These measures rely on the set of circumstances where a household is configured as the mythical ‘average’ or ‘typical’ household, participating in the labour market as the typical or average household does, earning average incomes and working average hours, paying an average sized mortgage at an average interest rate and purchasing a median price house each quarter (or whatever the frequency of the measure is). It is important also to consider the circumstances of households and individuals who work and live at a bleak distance from these norms.
347 The Reserve Bank of New Zealand estimates that the effective floating mortgage rate fell from 10.21% in October 2008 to 5.97% in October 2009. The ‘floating first mortgage new customer housing rate’ which probably best represents a market rate sat at 5.86-5.87% from March 2011 to February 2014. This was the lowest level in this rate since June 1965. Source Reserve Bank of New Zealand Table B3 Retail interest rates on lending and deposits available at http://www.rbnz.govt.nz/statistics/tables/b3/.
348 Data available at Massey University Real Estate Analysis Unit’s website at http://www.massey.ac.nz/massey/learning/colleges/college-business/school-of-economics-and-finance/research/mureau.cfm.
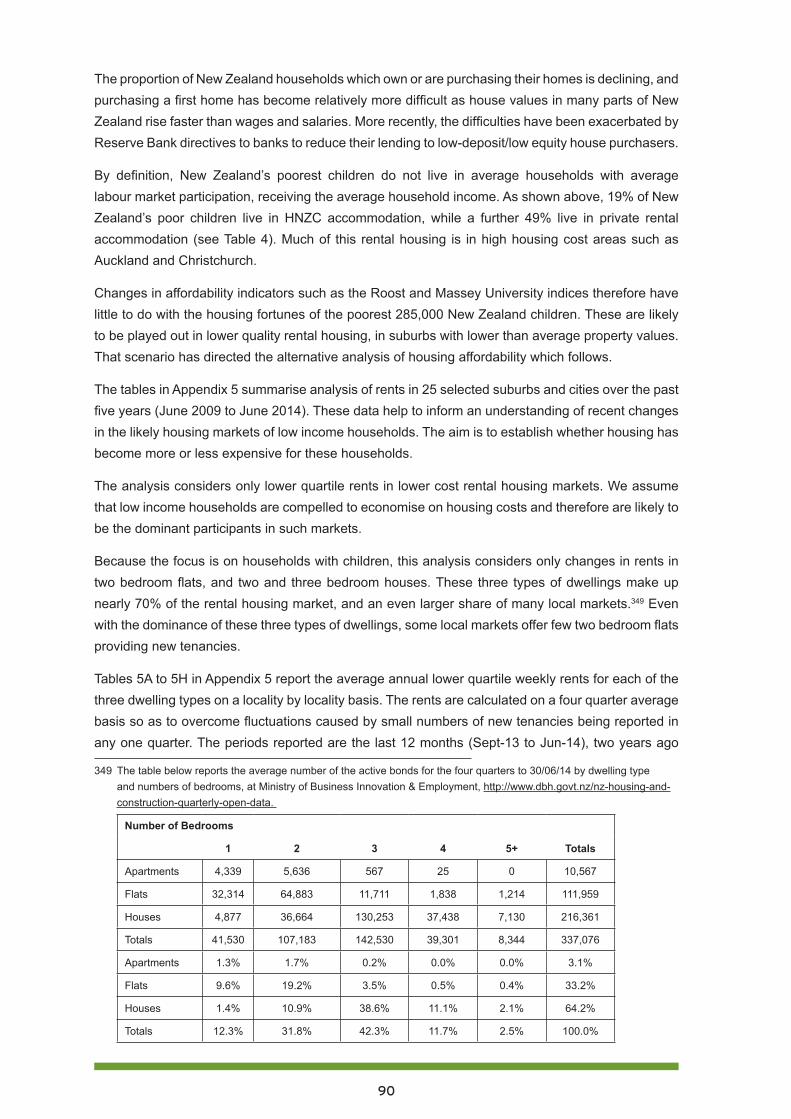
90
The proportion of New Zealand households which own or are purchasing their homes is declining, and purchasing a first home has become relatively more difficult as house values in many parts of New Zealand rise faster than wages and salaries. More recently, the difficulties have been exacerbated by Reserve Bank directives to banks to reduce their lending to low-deposit/low equity house purchasers.
By definition, New Zealand’s poorest children do not live in average households with average labour market participation, receiving the average household income. As shown above, 19% of New Zealand’s poor children live in HNZC accommodation, while a further 49% live in private rental accommodation (see Table 4). Much of this rental housing is in high housing cost areas such as Auckland and Christchurch.
Changes in affordability indicators such as the Roost and Massey University indices therefore have little to do with the housing fortunes of the poorest 285,000 New Zealand children. These are likely to be played out in lower quality rental housing, in suburbs with lower than average property values. That scenario has directed the alternative analysis of housing affordability which follows.
The tables in Appendix 5 summarise analysis of rents in 25 selected suburbs and cities over the past five years (June 2009 to June 2014). These data help to inform an understanding of recent changes in the likely housing markets of low income households. The aim is to establish whether housing has become more or less expensive for these households.
The analysis considers only lower quartile rents in lower cost rental housing markets. We assume that low income households are compelled to economise on housing costs and therefore are likely to be the dominant participants in such markets.
Because the focus is on households with children, this analysis considers only changes in rents in two bedroom flats, and two and three bedroom houses. These three types of dwellings make up nearly 70% of the rental housing market, and an even larger share of many local markets.349 Even with the dominance of these three types of dwellings, some local markets offer few two bedroom flats providing new tenancies.
Tables 5A to 5H in Appendix 5 report the average annual lower quartile weekly rents for each of the three dwelling types on a locality by locality basis. The rents are calculated on a four quarter average basis so as to overcome fluctuations caused by small numbers of new tenancies being reported in any one quarter. The periods reported are the last 12 months (Sept-13 to Jun-14), two years ago
349 The table below reports the average number of the active bonds for the four quarters to 30/06/14 by dwelling type and numbers of bedrooms, at Ministry of Business Innovation & Employment, http://www.dbh.govt.nz/nz-housing-and-construction-quarterly-open-data.
Number of Bedrooms
1 2 3 4 5+ Totals
Apartments 4,339 5,636 567 25 0 10,567
Flats 32,314 64,883 11,711 1,838 1,214 111,959
Houses 4,877 36,664 130,253 37,438 7,130 216,361
Totals 41,530 107,183 142,530 39,301 8,344 337,076
Apartments 1.3% 1.7% 0.2% 0.0% 0.0% 3.1%
Flats 9.6% 19.2% 3.5% 0.5% 0.4% 33.2%
Houses 1.4% 10.9% 38.6% 11.1% 2.1% 64.2%
Totals 12.3% 31.8% 42.3% 11.7% 2.5% 100.0%
91
(Sept-12 to Jun-13) and five years ago (Sept-08 to Jun-09). Changes in rents are compared on an inflation adjusted basis using the Consumer Price Index All Groups index. These real changes in rents are reported over the past year and the past five years.
The general pattern of rent changes for these three dwelling types over the past five years shows that:
1. Auckland rents have increased by around 5% to 15% in real terms, although there are some changes outside these bounds which are mainly caused by small numbers of new tenancies within the sample (Appendix 5. Table 5A).
2. In Hamilton rental housing markets appear soft, with rents remaining stable or having fallen by up to 10% (Appendix 5. Table 5B).
3. Wellington rents also appear to have remained stable, with changes of between -5% to +5% (Appendix 5. Table 5C).
4. Rents in other North Island centres have also been soft, with changes in this -5% to +5% range. The exceptions are Kaikohe, which has seen rent falls of 6% to 20%, and Tauranga which has seen consistent real rent increases of up to 7%. (Appendix 5. Table 5D).
5. Probably due to the disruption caused by the earthquakes, Canterbury rents have risen by between 5% and 25% over the past five years. with most increases being around 15%. Around half this increase has taken place over the past year. (Appendix 5. Table 145E).
6. Rents in other parts of the South Island have remained relatively stable, although they have risen by as much as 5% in real terms over the past five years (Appendix 5. Table 5F).
With such variation, there is little value is discussing averages across New Zealand, but Appendix 5. Table 5G does provide these nationwide averages, to enable comparison between the lower quartile rents by suburb or city against the national average. Appendix 5. Table 5H shows this comparison, based on the 2013-14 lower quartile rents reported in Appendix 5. Tables 5A to 5F.350 The general pattern which emerges has four elements:
1. Most provincial towns or cities have rents which are around 70% to 90% of the national average, with exceptions for notably prosperous provincial cities such as New Plymouth, Tauranga and Nelson, where rents are around 10% higher than the national average.
In Auckland, even lower quartile rents in lower income suburbs tend to be 20% to 60% higher than average national lower quartile rents, although this margin is smallest in South Auckland suburbs.
2. Rents in Wellington’s lower income suburbs are close to the national averages.
3. Rents in Christchurch’s lower income suburbs are now around 20% to 30% higher than the national averages. Prior to the earthquakes, rents were around the national averages.
RECOMMENDATION 5
Government provides adequate subsidies to landlords to insulate their houses as a means of improving the living conditions of tenants.
350 The multiples reported in Table 17 are the averages across the three dwellings types – not the weighted average
92
RECOMMENDATION 6
The Accommodation Supplement be reviewed urgently with the aim of better integration of housing assistance into overall family income support and with a view to reducing complexity and high abatement rates and to improving housing affordability.
In summary, housing affordability is not one story but several. There are very different stories for home buyers and tenants in Auckland, Christchurch, Wellington, and prosperous provincial cities, and for buyers and tenants in provincial towns and cities which have stable or even declining populations.
These differing stories do not allow for broad generalisations or construction of a national narrative around housing affordability.
In the same way it is not possible to tell a single story about children’s housing in New Zealand, although a sharp distinction can be made for children in low income households in Auckland and Christchurch and those everywhere else. Low income households with children, especially those on minimum wage of benefits in Auckland and Christchurch not only pay appreciably more for their housing than other New Zealanders, but have also seen their housing costs rise by 10% to 20% in real terms over the past five years. Similar households elsewhere in New Zealand, especially in places with stable or even declining populations, have paid less for their housing overall and have seen housing costs rise at around the same rate as wages and salaries.
ConclusionThe 2013 Census data have confirmed the continuing decline in rates of home ownership. This can be seen as a sign of both growing wealth inequalities within New Zealand, and a source of these inequalities. The rising rate of rented tenure, especially for households with children, is of concern for children’s wellbeing for at least two reasons: rental housing is more often in sub-standard condition, and tenant households are likely to shift more frequently, disrupting children’s education and socialisation.
The housing fortunes of New Zealanders, including New Zealand’s children, depend very much on which suburb, town or city they live in. A majority of New Zealanders live in places without a housing shortage, although in some areas, such as Northland, the eastern Bay of Plenty, and the East Coast, the housing stock is frequently in unacceptable condition. For these communities without a housing shortage, housing costs have tended to keep pace with general inflation and earnings, and increases in the housing stock have overall been more than adequate to meet population growth.
However, the affordable housing stock in such places is likely to be old and in poor repair. It seems unlikely that this will change much in the medium term, given the financial settings around high replacement costs and inadequate rents to justify further private investment. The sell-off of state houses in such areas will increase the reliance on private investors to provide affordable housing, and this is likely to worsen the problems related to an ageing and deteriorating housing stock.
By contrast, in Auckland and Christchurch the stock of affordable housing has disappeared, and low- and modest-income households are being squeezed by a rental housing market where rents
93
have risen sharply over the past two years. The causes of the shortages for each of these cities are different and well known. The Christchurch earthquakes destroyed around 8,000 houses, and while rebuilding has begun to replace these, there has been a net loss of affordable houses which is not easily recognised simply by counting new and existing houses. This loss of affordable housing occurred in part through the concentration of the destruction in Christchurch’s eastern suburbs, where much of the lower value housing was located. More recently it has played out in a rental housing market which may have shrunk, but has seen rents increase by 25% or more in real terms. How low- and modest-income households in Christchurch have coped is still being understood. The influx of construction workers for the rebuild has created a relatively short-term dynamic which has made the position of low-income households more difficult, although this may be a temporary phase. The Christchurch housing market post-rebuild will most likely be very different from that in 2014, and the buoyancy and robustness of this market will then depend on the longer-term economic fortunes of Christchurch.
In terms of poor children and housing, the 2013 Census results suggest that even in Christchurch East, Christchurch has relatively fewer households with children and a lower proportion of multi-family and large households than the New Zealand average. Changes in household size and housing tenure patterns across Christchurch have been consistent with New Zealand overall, so it does not appear that children have been disproportionately affected by the housing changes brought about by the earthquakes. This suggests that problems with secure, adequate housing are likely to be quite localised and specific around the loss of affordable and social housing. Given the high rents in Christchurch at present, more attention and priority should be given to the adequacy of the supply of affordable housing.
Auckland’s housing shortage stems from population growth, and as the exodus of New Zealanders to Australia turns to a trickle, this population pressure is likely to get worse. While the number of new dwellings being built in Auckland is recovering to pre-GFC levels, the type of housing being built will not be accessible to low and modest income families with children. The Minister of Housing’s ambition of 33,500351 additional dwellings emerging from his housing accord with Auckland Council may well prove fanciful, since this will require $9 to 18 billion of further investment from the ‘mum and dad’ investors who dominate the private rental market.352 The main reason such investment appears unlikely, at least as a solution to the shortage of affordable housing, is that modest income
351 This figure of 33,500 is frequently cited by Dr Smith. In his announcement on 7 May 2014 of the third tranche of ‘Special Housing Areas’ in Auckland he stated “The Auckland Housing Accord is continuing to gain momentum in enabling thousands more sections to be developed and thousands more homes to be built. The first tranche in October provided 11 Special Housing Areas and 6000 homes, and the second a further 11 and 9500 homes. This third tranche brings the total to 63 Special Housing Areas and 33,500 homes and is the scale we need to address the section and house shortage in Auckland.” At: http://www.aucklandcouncil.govt.nz/EN/newseventsculture/OurAuckland/mediareleases/Pages/aucklandhousingaccordfacilitatesanother18000homes.aspx.
352 Dr Smith’s claims of 33,500 additional dwellings either naively or disingenuously assume that rezoned land equates to more sections for residential development and that more land for residential development equates to more houses. Clearly in order to achieve such an outcome investors and buyers will need to be convinced that it is worthwhile. In June 2014 the average build cost of a new dwellings was $323,000 or $1,632/m2 for a 198m2 dwelling. Allowing $200,000 for land and consent costs means that an average new dwelling in Auckland is around $525,000. This would require further investment of $17.5 billion which is just over 9% of the present mortgage market. Between the 2006 and 2013 Censuses 68% of the additional 35,000 dwellings added to Auckland’s housing stock were rented. If such a proportion is to apply to the 33,500 additional units speculated by Dr Smith a further investment of $9 billion would be required. By comparison the total capitalisation of the New Zealand stock market was estimated at $88 billion in July 2014.
94
households simply cannot affordable modest priced new dwellings without assistance.353 Some realism is required to address Auckland’s housing crisis, including an understanding that more interventionist approaches by Government and the Council are required to ensure that there is an adequate supply of healthy affordable housing for low and modest income Auckland families and households.
CPAG recommends the following responses to address these challenges. By doing this, we could ensure all New Zealand children would grow up in a warm, dry, secure house.
Full list of recommendations1. Government develops a national housing plan which provides forecasts of future housing
needs, programmes for addressing these needs and the budgets necessary to complete these programmes.
2. Based on the national housing plan and on the current shortage of social housing, the Government commits to building an additional 1,000 social housing units per year either in the state or non-state sectors, and in areas of high need.
3. Prioritise access to social housing for households with children in certain regions, including the Counties-Manukau District Health Board region, on the basis of their higher risk of rheumatic fever.
4. A housing warrant of fitness for all rental properties be put in place within five years to ensure that all rental properties meet acceptable health and living standards.
5. Government provides adequate subsidies to landlords to insulate their houses as a means of improving the living conditions of tenants.
6. The Accommodation Supplement be reviewed urgently with the aim of better integration of housing assistance into overall family income support and with a view to reducing complexity and high abatement rates and to improving housing affordability.
Audio-visual resourcesCatriona MacLennan (2014) Child Poverty in Aotearoa Episode 3: Housing Catriona MacLennan interviews Alan Johnson, Social Policy Analyst, Salvation Army Social Policy & Parliamentary Unit; and interviews Mangere College nurse Heather Laxon about wrap-around health and social services for students, at: http://www.youtube.com/watch?v=JtEA1JwHkt4.
Bryan Bruce (2013), Inside Child Poverty - A Special Report, On Demand, at http://www.tv3.co.nz/Shows/InsideNZ/InsideChildPovertyASpecialReport.aspx.
Bryan Bruce (2014) Where is all started. The full Inside Child Poverty documentary, Parts 1 to 5, at http://bryanbruce.co.nz/feature/child-poverty/inside-child-poverty-full-documentary.
353 If an affordable new house cost $400,000 and rental property investors were prepared to accept gross yields of 5% weekly rents of $400 would be required to make such an investment attractive to new investors. The affordability of such rents needs be seen against individual and household incomes current evidence of the affordability of rents. The 2013 Census reported median household incomes of $66,100 in the Tamaki-Maungakiekie, ward $60,400 in the Manukau ward and $67,000 in the Manurewa-Papakura ward. Income tax data suggests that half of taxpayers earn less than $30,000 gross per annum and nearly 70% earn less than $50,000 (Key facts for taxpayers from Treasury’s Budget website). The Household Economic Survey 2013 reported that 23% of tenant households reported spending more than 40% of their household income on housing costs while the overall ratio of housing costs to household incomes was highest in Auckland at 18.4% against the national average of 15.4%.
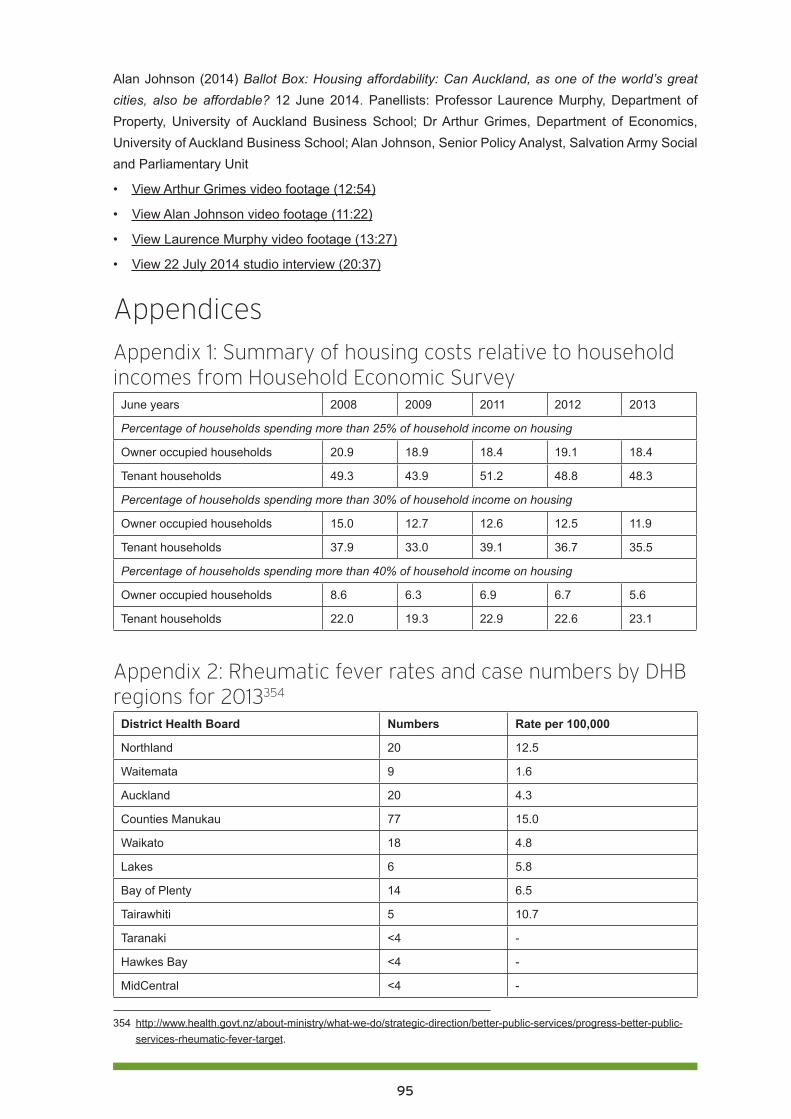
95
Alan Johnson (2014) Ballot Box: Housing affordability: Can Auckland, as one of the world’s great cities, also be affordable? 12 June 2014. Panellists: Professor Laurence Murphy, Department of Property, University of Auckland Business School; Dr Arthur Grimes, Department of Economics, University of Auckland Business School; Alan Johnson, Senior Policy Analyst, Salvation Army Social and Parliamentary Unit
• View Arthur Grimes video footage (12:54)
• View Alan Johnson video footage (11:22)
• View Laurence Murphy video footage (13:27)
• View 22 July 2014 studio interview (20:37)
Appendices
Appendix 1: Summary of housing costs relative to household incomes from Household Economic Survey
June years 2008 2009 2011 2012 2013
Percentage of households spending more than 25% of household income on housing
Owner occupied households 20.9 18.9 18.4 19.1 18.4
Tenant households 49.3 43.9 51.2 48.8 48.3
Percentage of households spending more than 30% of household income on housing
Owner occupied households 15.0 12.7 12.6 12.5 11.9
Tenant households 37.9 33.0 39.1 36.7 35.5
Percentage of households spending more than 40% of household income on housing
Owner occupied households 8.6 6.3 6.9 6.7 5.6
Tenant households 22.0 19.3 22.9 22.6 23.1
Appendix 2: Rheumatic fever rates and case numbers by DHB regions for 2013354
District Health Board Numbers Rate per 100,000
Northland 20 12.5
Waitemata 9 1.6
Auckland 20 4.3
Counties Manukau 77 15.0
Waikato 18 4.8
Lakes 6 5.8
Bay of Plenty 14 6.5
Tairawhiti 5 10.7
Taranaki <4 -
Hawkes Bay <4 -
MidCentral <4 -
354 http://www.health.govt.nz/about-ministry/what-we-do/strategic-direction/better-public-services/progress-better-public-services-rheumatic-fever-target.
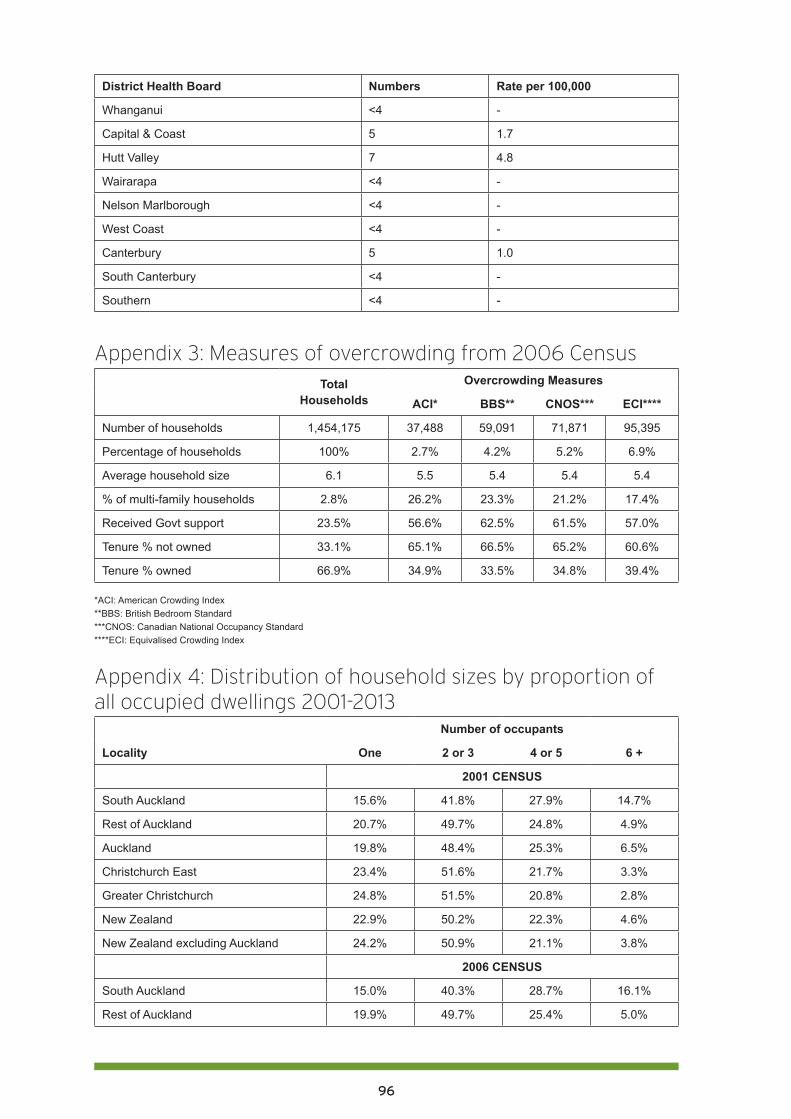
96
District Health Board Numbers Rate per 100,000
Whanganui <4 -
Capital & Coast 5 1.7
Hutt Valley 7 4.8
Wairarapa <4 -
Nelson Marlborough <4 -
West Coast <4 -
Canterbury 5 1.0
South Canterbury <4 -
Southern <4 -
Appendix 3: Measures of overcrowding from 2006 CensusTotal
HouseholdsOvercrowding Measures
ACI* BBS** CNOS*** ECI****
Number of households 1,454,175 37,488 59,091 71,871 95,395
Percentage of households 100% 2.7% 4.2% 5.2% 6.9%
Average household size 6.1 5.5 5.4 5.4 5.4
% of multi-family households 2.8% 26.2% 23.3% 21.2% 17.4%
Received Govt support 23.5% 56.6% 62.5% 61.5% 57.0%
Tenure % not owned 33.1% 65.1% 66.5% 65.2% 60.6%
Tenure % owned 66.9% 34.9% 33.5% 34.8% 39.4%
*ACI: American Crowding Index**BBS: British Bedroom Standard***CNOS: Canadian National Occupancy Standard****ECI: Equivalised Crowding Index
Appendix 4: Distribution of household sizes by proportion of all occupied dwellings 2001-2013
Number of occupants
Locality One 2 or 3 4 or 5 6 +
2001 CENSUS
South Auckland 15.6% 41.8% 27.9% 14.7%
Rest of Auckland 20.7% 49.7% 24.8% 4.9%
Auckland 19.8% 48.4% 25.3% 6.5%
Christchurch East 23.4% 51.6% 21.7% 3.3%
Greater Christchurch 24.8% 51.5% 20.8% 2.8%
New Zealand 22.9% 50.2% 22.3% 4.6%
New Zealand excluding Auckland 24.2% 50.9% 21.1% 3.8%
2006 CENSUS
South Auckland 15.0% 40.3% 28.7% 16.1%
Rest of Auckland 19.9% 49.7% 25.4% 5.0%
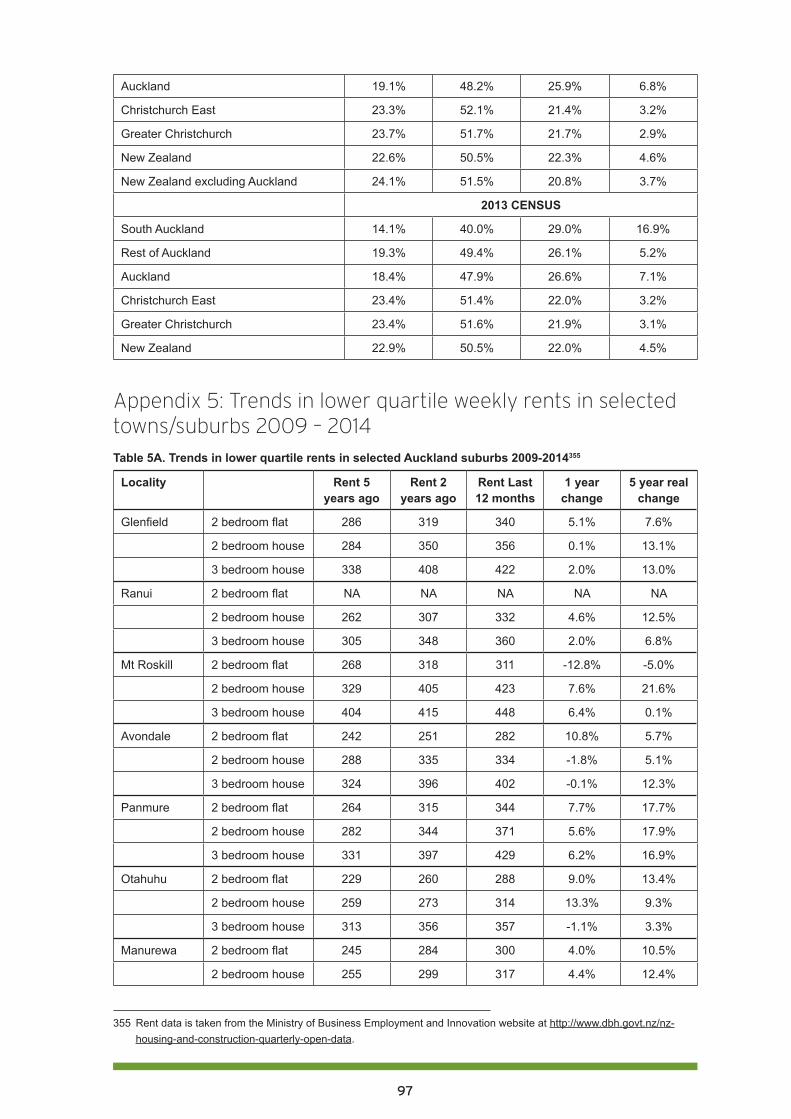
97
Auckland 19.1% 48.2% 25.9% 6.8%
Christchurch East 23.3% 52.1% 21.4% 3.2%
Greater Christchurch 23.7% 51.7% 21.7% 2.9%
New Zealand 22.6% 50.5% 22.3% 4.6%
New Zealand excluding Auckland 24.1% 51.5% 20.8% 3.7%
2013 CENSUS
South Auckland 14.1% 40.0% 29.0% 16.9%
Rest of Auckland 19.3% 49.4% 26.1% 5.2%
Auckland 18.4% 47.9% 26.6% 7.1%
Christchurch East 23.4% 51.4% 22.0% 3.2%
Greater Christchurch 23.4% 51.6% 21.9% 3.1%
New Zealand 22.9% 50.5% 22.0% 4.5%
Appendix 5: Trends in lower quartile weekly rents in selected towns/suburbs 2009 – 2014Table 5A. Trends in lower quartile rents in selected Auckland suburbs 2009-2014355
Locality Rent 5 years ago
Rent 2 years ago
Rent Last 12 months
1 year change
5 year real change
Glenfield 2 bedroom flat 286 319 340 5.1% 7.6%
2 bedroom house 284 350 356 0.1% 13.1%
3 bedroom house 338 408 422 2.0% 13.0%
Ranui 2 bedroom flat NA NA NA NA NA
2 bedroom house 262 307 332 4.6% 12.5%
3 bedroom house 305 348 360 2.0% 6.8%
Mt Roskill 2 bedroom flat 268 318 311 -12.8% -5.0%
2 bedroom house 329 405 423 7.6% 21.6%
3 bedroom house 404 415 448 6.4% 0.1%
Avondale 2 bedroom flat 242 251 282 10.8% 5.7%
2 bedroom house 288 335 334 -1.8% 5.1%
3 bedroom house 324 396 402 -0.1% 12.3%
Panmure 2 bedroom flat 264 315 344 7.7% 17.7%
2 bedroom house 282 344 371 5.6% 17.9%
3 bedroom house 331 397 429 6.2% 16.9%
Otahuhu 2 bedroom flat 229 260 288 9.0% 13.4%
2 bedroom house 259 273 314 13.3% 9.3%
3 bedroom house 313 356 357 -1.1% 3.3%
Manurewa 2 bedroom flat 245 284 300 4.0% 10.5%
2 bedroom house 255 299 317 4.4% 12.4%
355 Rent data is taken from the Ministry of Business Employment and Innovation website at http://www.dbh.govt.nz/nz-housing-and-construction-quarterly-open-data.
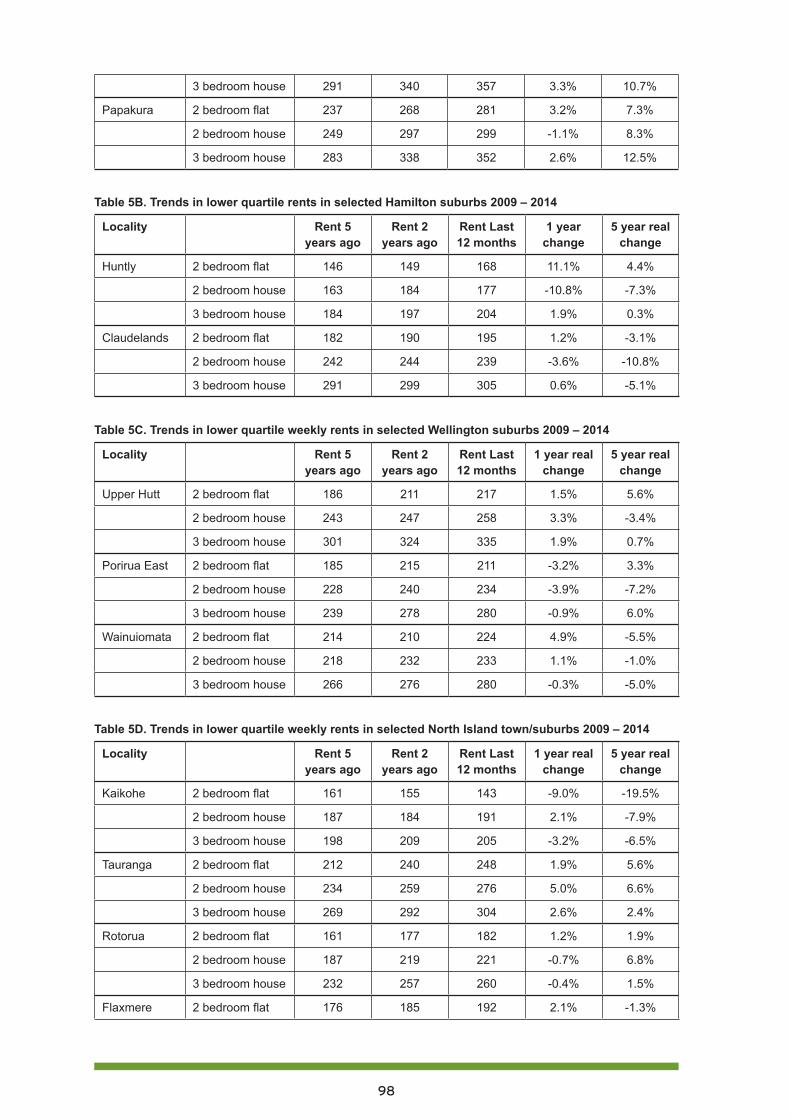
98
3 bedroom house 291 340 357 3.3% 10.7%
Papakura 2 bedroom flat 237 268 281 3.2% 7.3%
2 bedroom house 249 297 299 -1.1% 8.3%
3 bedroom house 283 338 352 2.6% 12.5%
Table 5B. Trends in lower quartile rents in selected Hamilton suburbs 2009 – 2014
Locality Rent 5 years ago
Rent 2 years ago
Rent Last 12 months
1 year change
5 year real change
Huntly 2 bedroom flat 146 149 168 11.1% 4.4%
2 bedroom house 163 184 177 -10.8% -7.3%
3 bedroom house 184 197 204 1.9% 0.3%
Claudelands 2 bedroom flat 182 190 195 1.2% -3.1%
2 bedroom house 242 244 239 -3.6% -10.8%
3 bedroom house 291 299 305 0.6% -5.1%
Table 5C. Trends in lower quartile weekly rents in selected Wellington suburbs 2009 – 2014
Locality Rent 5 years ago
Rent 2 years ago
Rent Last 12 months
1 year real change
5 year real change
Upper Hutt 2 bedroom flat 186 211 217 1.5% 5.6%
2 bedroom house 243 247 258 3.3% -3.4%
3 bedroom house 301 324 335 1.9% 0.7%
Porirua East 2 bedroom flat 185 215 211 -3.2% 3.3%
2 bedroom house 228 240 234 -3.9% -7.2%
3 bedroom house 239 278 280 -0.9% 6.0%
Wainuiomata 2 bedroom flat 214 210 224 4.9% -5.5%
2 bedroom house 218 232 233 1.1% -1.0%
3 bedroom house 266 276 280 -0.3% -5.0%
Table 5D. Trends in lower quartile weekly rents in selected North Island town/suburbs 2009 – 2014
Locality Rent 5 years ago
Rent 2 years ago
Rent Last 12 months
1 year real change
5 year real change
Kaikohe 2 bedroom flat 161 155 143 -9.0% -19.5%
2 bedroom house 187 184 191 2.1% -7.9%
3 bedroom house 198 209 205 -3.2% -6.5%
Tauranga 2 bedroom flat 212 240 248 1.9% 5.6%
2 bedroom house 234 259 276 5.0% 6.6%
3 bedroom house 269 292 304 2.6% 2.4%
Rotorua 2 bedroom flat 161 177 182 1.2% 1.9%
2 bedroom house 187 219 221 -0.7% 6.8%
3 bedroom house 232 257 260 -0.4% 1.5%
Flaxmere 2 bedroom flat 176 185 192 2.1% -1.3%
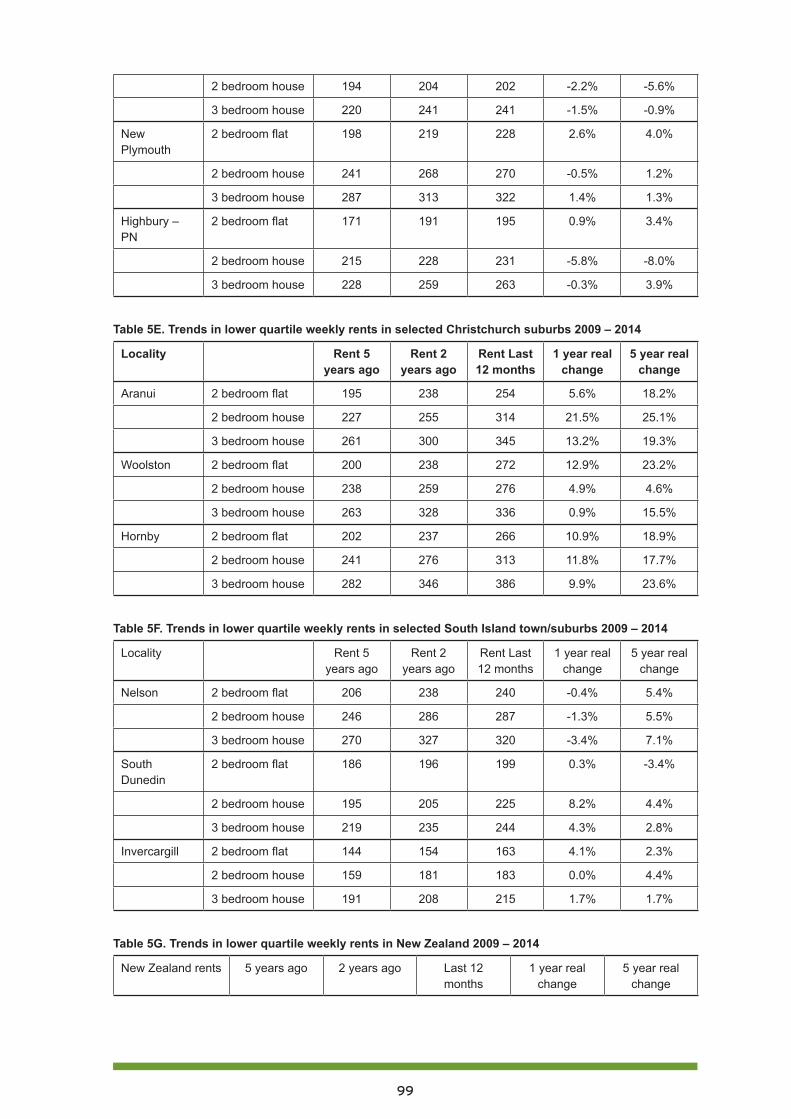
99
2 bedroom house 194 204 202 -2.2% -5.6%
3 bedroom house 220 241 241 -1.5% -0.9%
New Plymouth
2 bedroom flat 198 219 228 2.6% 4.0%
2 bedroom house 241 268 270 -0.5% 1.2%
3 bedroom house 287 313 322 1.4% 1.3%
Highbury – PN
2 bedroom flat 171 191 195 0.9% 3.4%
2 bedroom house 215 228 231 -5.8% -8.0%
3 bedroom house 228 259 263 -0.3% 3.9%
Table 5E. Trends in lower quartile weekly rents in selected Christchurch suburbs 2009 – 2014
Locality Rent 5 years ago
Rent 2 years ago
Rent Last 12 months
1 year real change
5 year real change
Aranui 2 bedroom flat 195 238 254 5.6% 18.2%
2 bedroom house 227 255 314 21.5% 25.1%
3 bedroom house 261 300 345 13.2% 19.3%
Woolston 2 bedroom flat 200 238 272 12.9% 23.2%
2 bedroom house 238 259 276 4.9% 4.6%
3 bedroom house 263 328 336 0.9% 15.5%
Hornby 2 bedroom flat 202 237 266 10.9% 18.9%
2 bedroom house 241 276 313 11.8% 17.7%
3 bedroom house 282 346 386 9.9% 23.6%
Table 5F. Trends in lower quartile weekly rents in selected South Island town/suburbs 2009 – 2014
Locality Rent 5 years ago
Rent 2 years ago
Rent Last 12 months
1 year real change
5 year real change
Nelson 2 bedroom flat 206 238 240 -0.4% 5.4%
2 bedroom house 246 286 287 -1.3% 5.5%
3 bedroom house 270 327 320 -3.4% 7.1%
South Dunedin
2 bedroom flat 186 196 199 0.3% -3.4%
2 bedroom house 195 205 225 8.2% 4.4%
3 bedroom house 219 235 244 4.3% 2.8%
Invercargill 2 bedroom flat 144 154 163 4.1% 2.3%
2 bedroom house 159 181 183 0.0% 4.4%
3 bedroom house 191 208 215 1.7% 1.7%
Table 5G. Trends in lower quartile weekly rents in New Zealand 2009 – 2014
New Zealand rents 5 years ago 2 years ago Last 12 months
1 year real change
5 year real change
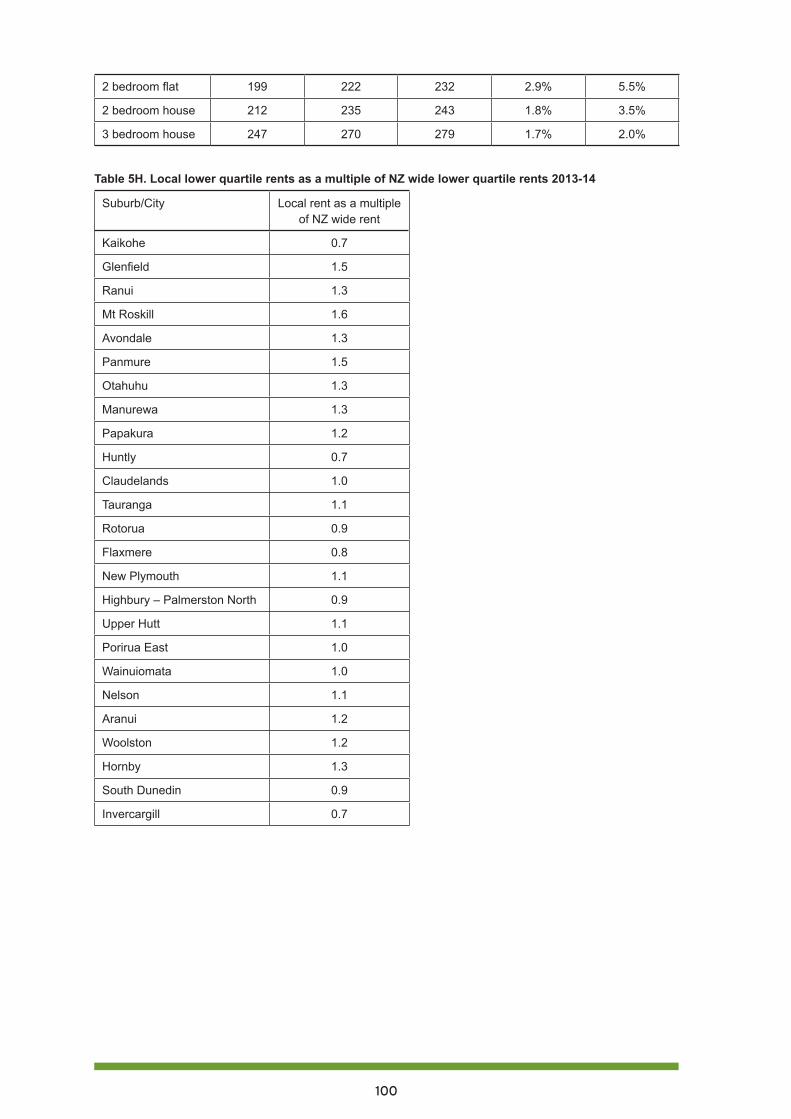
100
2 bedroom flat 199 222 232 2.9% 5.5%
2 bedroom house 212 235 243 1.8% 3.5%
3 bedroom house 247 270 279 1.7% 2.0%
Table 5H. Local lower quartile rents as a multiple of NZ wide lower quartile rents 2013-14
Suburb/City Local rent as a multiple of NZ wide rent
Kaikohe 0.7
Glenfield 1.5
Ranui 1.3
Mt Roskill 1.6
Avondale 1.3
Panmure 1.5
Otahuhu 1.3
Manurewa 1.3
Papakura 1.2
Huntly 0.7
Claudelands 1.0
Tauranga 1.1
Rotorua 0.9
Flaxmere 0.8
New Plymouth 1.1
Highbury – Palmerston North 0.9
Upper Hutt 1.1
Porirua East 1.0
Wainuiomata 1.0
Nelson 1.1
Aranui 1.2
Woolston 1.2
Hornby 1.3
South Dunedin 0.9
Invercargill 0.7

101
PART FIVE: Adequate incomes to address child poverty356
Mike O’Brien and Susan St John
Dr Mike O’Brien, Associate Professor School of Counselling Human Services and Social Work, University of Auckland, and member of the Management Committee of Child Poverty Action Group.
Dr Susan St John QSO, Associate Professor of Economics, University of Auckland, co-director of the Retirement Policy and Research Centre, and member of the Management Committee of Child Poverty Action Group.
Overview Brian Easton has written extensively about the growth of poverty in New Zealand. In a 1995 paper357 he estimated that between 1989/90 and 1991/2, the number of the poor grew by between 35 and 52%, with the largest groups in the lowest decile families with children. He wrote:
Allowing that these figures may be conservative, because of the equivalence scale used, we must conclude that the situation first identified two decades ago – of children being the greatest reason for poverty – remains true to this day. … The data seems to suggest [that] the size of the income gap seems to have gone up in the early 1990s, relative to the 1980s. Thus there are not only more poor, but the hardship of the poor has been greater. … In policy terms we know that benefits underpin the bottom of the income distribution, that our poor are children and their parents, and that the aged are not our worst off. We knew all this two decades ago. Hopefully over the next few years policy will develop in a manner which will mean such insights need not remain research results with so little practical policy input.
Easton’s hope has not been realised. While today there is now a greater appreciation of the damage low incomes can do to children, the inaction over many decades of evidence is remarkable. In 2014 Brian Easton continues to draw attention to this issue:358
The children identified as in poverty 40 years ago have become adults. Many of their children have experienced poverty and their grandchildren are probably in poverty today. It is not only a question of justice; we underinvested in them, so society as a whole suffers.
356 Acknowledgements: Much of the data has been sourced from Bryan Perry (2014) Household Incomes in New Zealand: trends in indicators of inequality and hardship 1982 to 2013. Ministry of Social Development. Wellington. We acknowledge this valuable data is crucial to ongoing monitoring of child in poverty in New Zealand. Thanks to Anne Else for editing assistance and to other anonymous commentators.
357 Easton, B. (1995) Poverty in New Zealand – 1981 to 1993, New Zealand Sociology November 1995, 10 (2), pp.182-214.
358 Easton, B. (2014) Poor Show, at http://www.eastonbh.ac.nz/2014/01/poor-show/
102
Child poverty in New Zealand may not be third world grinding poverty, but is real and costly for both individual children and society. The Children’s Commissioner’s Expert Advisory Group (2012) defined child poverty this way:359
Children living in poverty are those who experience deprivation of the material resources and income that is required for them to develop and thrive, leaving such children unable to enjoy their rights, achieve their full potential and participate as full and equal members of New Zealand society.
Immediate and critical considerations emerge from this definition. First, the implications of children’s material deprivation for achieving a fully participatory society; and secondly, the right of children to food, shelter, education and freedom from harm, so they are enabled to reach their full potential. Central to both these components is family income. While the other dimensions of poverty, such as participation and employment, all have important links, none of these can replace the need for adequate income. Improvements to health and access to health services, or access to and provision of affordable and appropriate housing, cannot replace the need for adequate income either. It is not possible to engage effectively with a constructive and productive discussion on child poverty without building into that discussion an examination of income adequacy, income requirements and proposals to improve family incomes.
Wages matterThere are three major ways in which disposable income for low income families is determined. The first and prime way is through earning an income. The 2014 gross minimum wage rate of $14.25 puts a floor under hourly earnings, while the total wage income of a family is related to the hours of work they can supply or are called on to supply (for example in on-call jobs). It is simplistic to argue that making both parents work is the best way to increase family income, as extra hours worked, especially by the primary caregiver, may sacrifice precious family time. When families are time-poor it is hard to maintain careful budgeting of household income, or prepare nutritious meals, let alone undertake other valuable parenting activities.
There is a case for a higher minimum wage to be part of the solution to child poverty, and raising the minimum wage while adequately protecting the real value of Working for Families tax credits for working poor families may be more satisfactory than a blanket ‘living wage’ that only some get, and in only some industries. Wages as part of the income adequacy equation are not further discussed in this chapter.
Taxes matterThe second major influence on family incomes is through income taxes levied on earnings. The rate of GST is also important as it affect how much a given family income will buy. New Zealand has a remarkably flat or unprogressive tax scale, with tax of 10.5% on the first $14,000, and a top rate of only 33% for income over $70,000. In Australia the first $18,200 is tax free, and there is a top rate of 45% on income over $180,000. Not only is the tax scale more progressive, but GST is levied there at only 10%, in contrast to New Zealand where it is 15%. Moreover, in Australia, basic items that affect low income people, such as healthcare, education, childcare and fresh food, are all GST-free.
359 Expert Advisory Group (2012) Solutions to child poverty in New Zealand. Evidence for Action. Office of the Children’s Commissioner, p. 2, at http://www.occ.org.nz/assets/Uploads/EAG/Final-report/Final-report-Solutions-to-child-poverty-evidence-for-action.pdf.
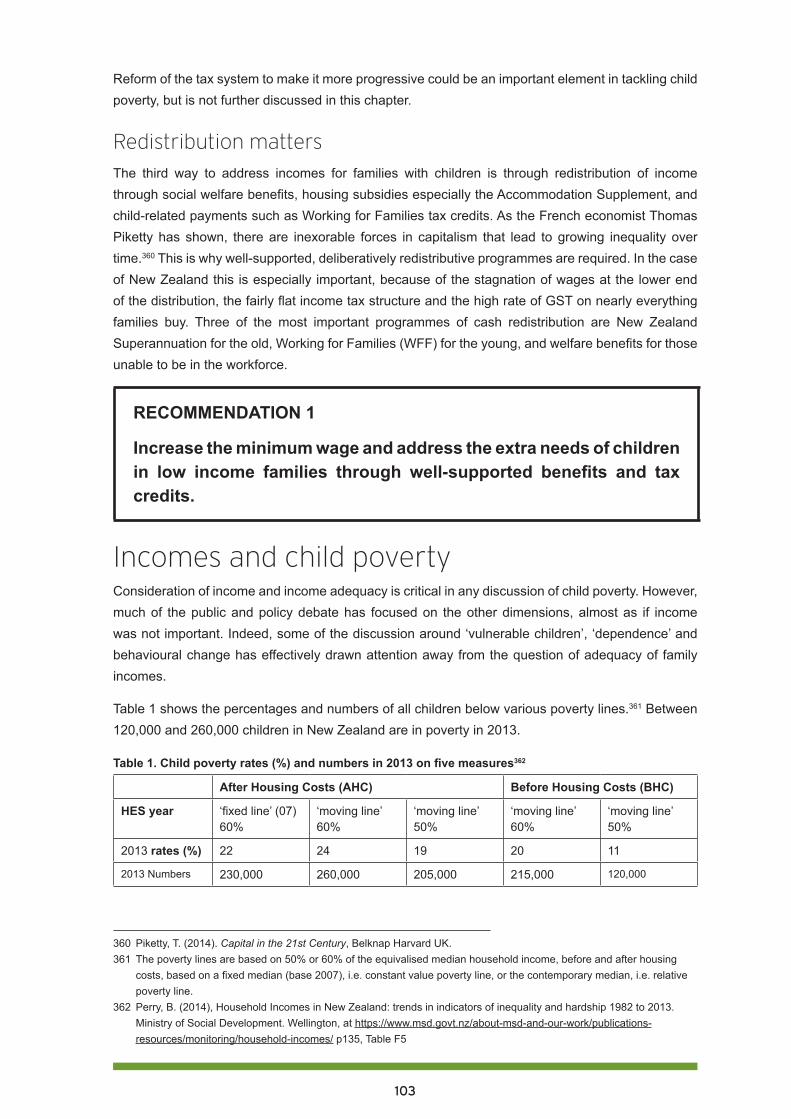
103
Reform of the tax system to make it more progressive could be an important element in tackling child poverty, but is not further discussed in this chapter.
Redistribution mattersThe third way to address incomes for families with children is through redistribution of income through social welfare benefits, housing subsidies especially the Accommodation Supplement, and child-related payments such as Working for Families tax credits. As the French economist Thomas Piketty has shown, there are inexorable forces in capitalism that lead to growing inequality over time.360 This is why well-supported, deliberatively redistributive programmes are required. In the case of New Zealand this is especially important, because of the stagnation of wages at the lower end of the distribution, the fairly flat income tax structure and the high rate of GST on nearly everything families buy. Three of the most important programmes of cash redistribution are New Zealand Superannuation for the old, Working for Families (WFF) for the young, and welfare benefits for those unable to be in the workforce.
RECOMMENDATION 1
Increase the minimum wage and address the extra needs of children in low income families through well-supported benefits and tax credits.
Incomes and child povertyConsideration of income and income adequacy is critical in any discussion of child poverty. However, much of the public and policy debate has focused on the other dimensions, almost as if income was not important. Indeed, some of the discussion around ‘vulnerable children’, ‘dependence’ and behavioural change has effectively drawn attention away from the question of adequacy of family incomes.
Table 1 shows the percentages and numbers of all children below various poverty lines.361 Between 120,000 and 260,000 children in New Zealand are in poverty in 2013.
Table 1. Child poverty rates (%) and numbers in 2013 on five measures362
After Housing Costs (AHC) Before Housing Costs (BHC)
HES year ‘fixed line’ (07) 60%
‘moving line’ 60%
‘moving line’ 50%
‘moving line’ 60%
‘moving line’ 50%
2013 rates (%) 22 24 19 20 11
2013 Numbers 230,000 260,000 205,000 215,000 120,000
360 Piketty, T. (2014). Capital in the 21st Century, Belknap Harvard UK.361 The poverty lines are based on 50% or 60% of the equivalised median household income, before and after housing
costs, based on a fixed median (base 2007), i.e. constant value poverty line, or the contemporary median, i.e. relative poverty line.
362 Perry, B. (2014), Household Incomes in New Zealand: trends in indicators of inequality and hardship 1982 to 2013. Ministry of Social Development. Wellington, at https://www.msd.govt.nz/about-msd-and-our-work/publications-resources/monitoring/household-incomes/ p135, Table F5
104
Beneficiaries, particularly sole parents and their children, are over-represented among those living in poverty, irrespective of how the poverty line is measured. Using the fixed line 60% AHC measure, which gives 230,000 children in poverty, around 63% of poor children are in households reliant on benefit income.363 Approximately 80% of the children in households on income-tested benefits are living in poverty.364 Of course this means there is a problem of living standards for their parents as well, and indicates that the combined income from benefits, housing assistance and child tax credits is too low.
Certain groups are disproportionately affected. Māori and Pasifika children are twice as likely as Pakeha children to be in poverty. While overall 47% of all poor children are Māori or Pasifika, 38% are Pakeha.365
Equally important is recognition of the ‘working poor’, those in paid work whose low wage income, even though supplemented with WFF tax credits, is insufficient to move them and their children above the poverty line. Around 85,000 or 37% of poor children are in households whose main source of income is paid work.
Past and present social assistance and children’s wellbeingFigure 1 depicts changes in relative poverty, using the 60% moving line measure from Table 1, for both overall poverty and child poverty over the last 30 years. The early 1990s saw a sudden, large and sustained rise in child poverty following policies that cut social welfare benefits by up to 25% in 1991.366 These cuts have had a major impact on creating and sustaining the levels of child poverty shown in Figure 1.
All the weekly family assistance paid to the mother based on the numbers and ages of the children in her care, including the previously universal family benefit, became targeted against total family income in 1991. During the 1990s there was inadequate adjustment of this family assistance to account for inflation, and child poverty quickly reached 30%.
An adjustment of $20 per child per week was announced in 1996, but families deemed to be dependent on the state (that is, receiving a welfare benefit) were given only $5 of this, or $15 less per week than other children. The discriminatory payment of $15 (later called the Child Tax Credit) to the children of the ‘deserving poor’, that is, parents in paid employment, had a slight impact on child poverty, as the shallow dip shows in Figure 1. Poverty was reduced only for those children in ‘working’ families.
363 Perry, B. (2014). p159, Table H5 averaged for 2011-2013364 Ibid, p157.365 Ibid.366 Ministry of Social Development (2005) A Social Services Primer, www.nzherald.co.nz/documents. January 2005, at http://media.nzherald.co.nz/webcontent/document/pdf/msdprimer.pdf, p. 3: While Invalids Benefit
recipients and New Zealand Superannuitants had their benefit rates frozen for 1991 (i.e. no annual indexation), all other recipients faced a fall in their benefit income. The reductions ranged from 8.9% for a sole parent with two children, to 25% for a 20 year old single unemployment beneficiary.
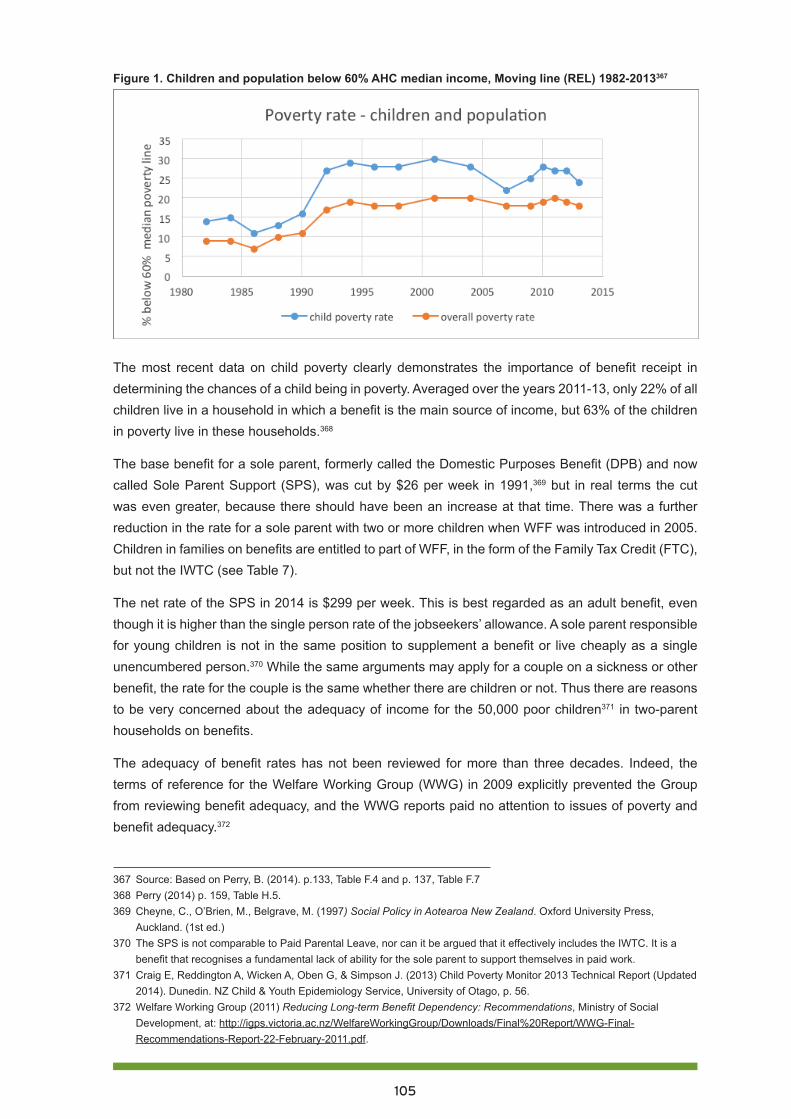
105
Figure 1. Children and population below 60% AHC median income, Moving line (REL) 1982-2013367
The most recent data on child poverty clearly demonstrates the importance of benefit receipt in determining the chances of a child being in poverty. Averaged over the years 2011-13, only 22% of all children live in a household in which a benefit is the main source of income, but 63% of the children in poverty live in these households.368
The base benefit for a sole parent, formerly called the Domestic Purposes Benefit (DPB) and now called Sole Parent Support (SPS), was cut by $26 per week in 1991,369 but in real terms the cut was even greater, because there should have been an increase at that time. There was a further reduction in the rate for a sole parent with two or more children when WFF was introduced in 2005. Children in families on benefits are entitled to part of WFF, in the form of the Family Tax Credit (FTC), but not the IWTC (see Table 7).
The net rate of the SPS in 2014 is $299 per week. This is best regarded as an adult benefit, even though it is higher than the single person rate of the jobseekers’ allowance. A sole parent responsible for young children is not in the same position to supplement a benefit or live cheaply as a single unencumbered person.370 While the same arguments may apply for a couple on a sickness or other benefit, the rate for the couple is the same whether there are children or not. Thus there are reasons to be very concerned about the adequacy of income for the 50,000 poor children371 in two-parent households on benefits.
The adequacy of benefit rates has not been reviewed for more than three decades. Indeed, the terms of reference for the Welfare Working Group (WWG) in 2009 explicitly prevented the Group from reviewing benefit adequacy, and the WWG reports paid no attention to issues of poverty and benefit adequacy.372
367 Source: Based on Perry, B. (2014). p.133, Table F.4 and p. 137, Table F.7368 Perry (2014) p. 159, Table H.5.369 Cheyne, C., O’Brien, M., Belgrave, M. (1997) Social Policy in Aotearoa New Zealand. Oxford University Press,
Auckland. (1st ed.)370 The SPS is not comparable to Paid Parental Leave, nor can it be argued that it effectively includes the IWTC. It is a
benefit that recognises a fundamental lack of ability for the sole parent to support themselves in paid work. 371 Craig E, Reddington A, Wicken A, Oben G, & Simpson J. (2013) Child Poverty Monitor 2013 Technical Report (Updated
2014). Dunedin. NZ Child & Youth Epidemiology Service, University of Otago, p. 56.372 Welfare Working Group (2011) Reducing Long-term Benefit Dependency: Recommendations, Ministry of Social
Development, at: http://igps.victoria.ac.nz/WelfareWorkingGroup/Downloads/Final%20Report/WWG-Final-Recommendations-Report-22-February-2011.pdf.
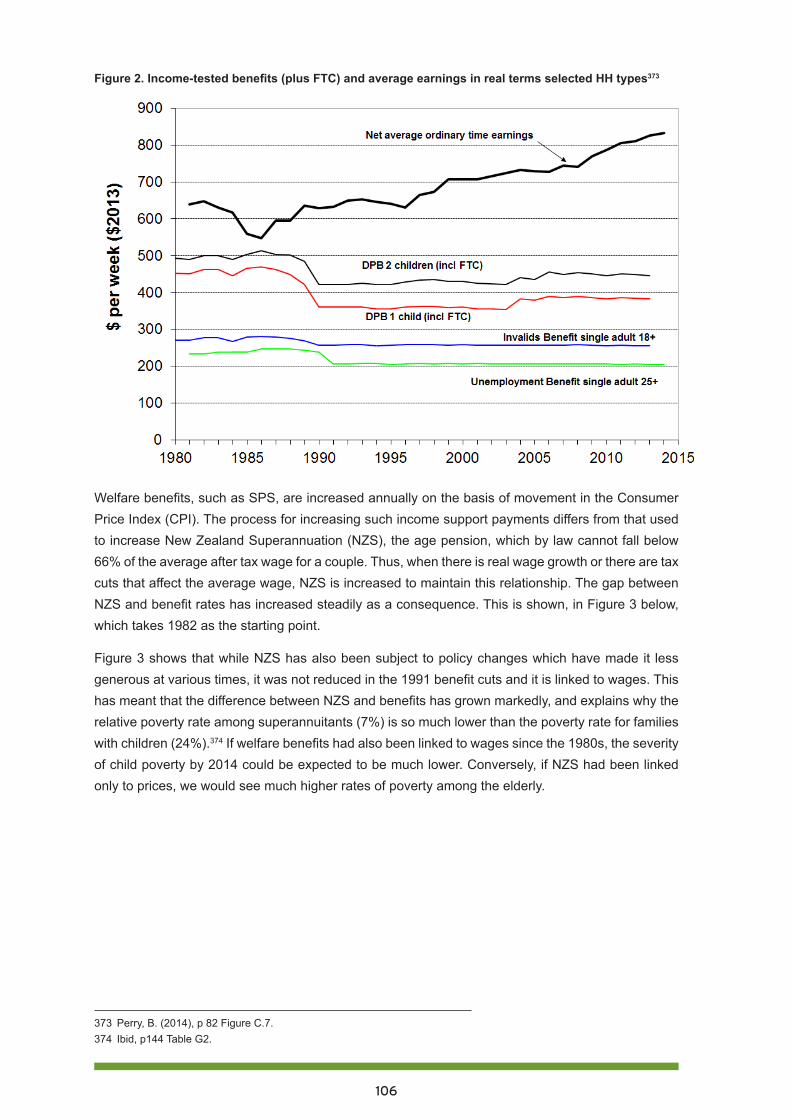
106
Figure 2. Income-tested benefits (plus FTC) and average earnings in real terms selected HH types373
Welfare benefits, such as SPS, are increased annually on the basis of movement in the Consumer Price Index (CPI). The process for increasing such income support payments differs from that used to increase New Zealand Superannuation (NZS), the age pension, which by law cannot fall below 66% of the average after tax wage for a couple. Thus, when there is real wage growth or there are tax cuts that affect the average wage, NZS is increased to maintain this relationship. The gap between NZS and benefit rates has increased steadily as a consequence. This is shown, in Figure 3 below, which takes 1982 as the starting point.
Figure 3 shows that while NZS has also been subject to policy changes which have made it less generous at various times, it was not reduced in the 1991 benefit cuts and it is linked to wages. This has meant that the difference between NZS and benefits has grown markedly, and explains why the relative poverty rate among superannuitants (7%) is so much lower than the poverty rate for families with children (24%).374 If welfare benefits had also been linked to wages since the 1980s, the severity of child poverty by 2014 could be expected to be much lower. Conversely, if NZS had been linked only to prices, we would see much higher rates of poverty among the elderly.
373 Perry, B. (2014), p 82 Figure C.7.374 Ibid, p144 Table G2.
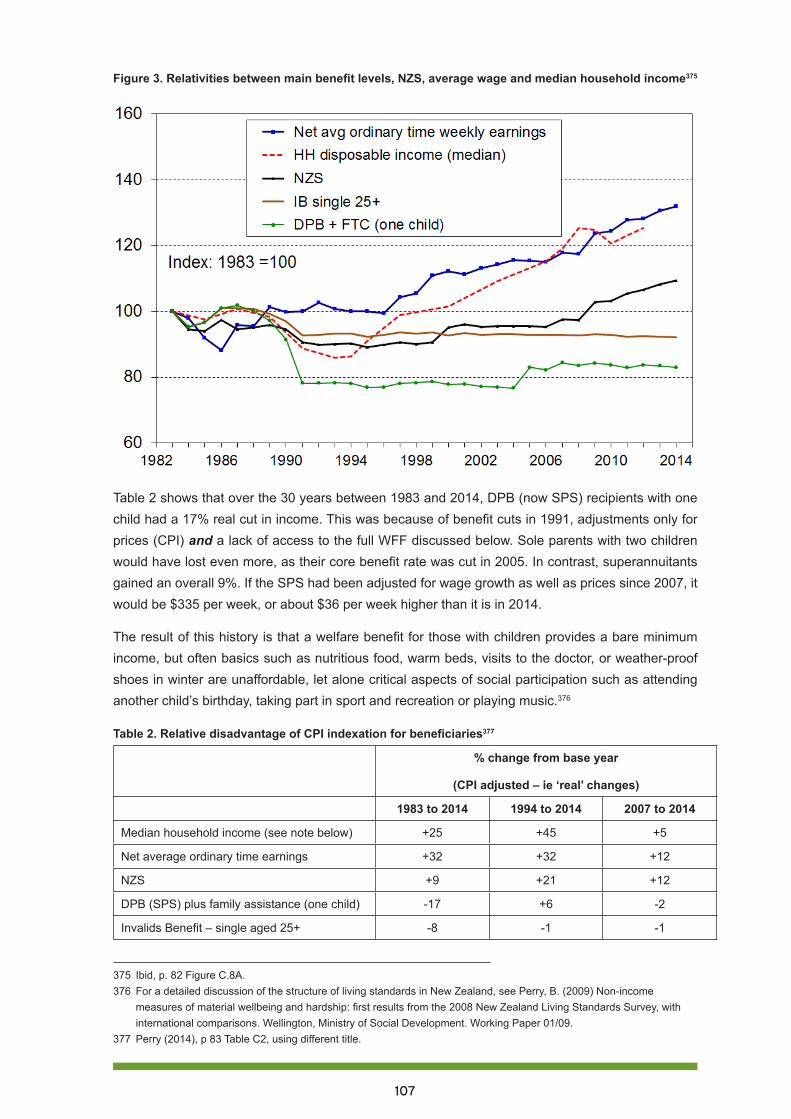
107
Figure 3. Relativities between main benefit levels, NZS, average wage and median household income375
Table 2 shows that over the 30 years between 1983 and 2014, DPB (now SPS) recipients with one child had a 17% real cut in income. This was because of benefit cuts in 1991, adjustments only for prices (CPI) and a lack of access to the full WFF discussed below. Sole parents with two children would have lost even more, as their core benefit rate was cut in 2005. In contrast, superannuitants gained an overall 9%. If the SPS had been adjusted for wage growth as well as prices since 2007, it would be $335 per week, or about $36 per week higher than it is in 2014.
The result of this history is that a welfare benefit for those with children provides a bare minimum income, but often basics such as nutritious food, warm beds, visits to the doctor, or weather-proof shoes in winter are unaffordable, let alone critical aspects of social participation such as attending another child’s birthday, taking part in sport and recreation or playing music.376
Table 2. Relative disadvantage of CPI indexation for beneficiaries377
% change from base year
(CPI adjusted – ie ‘real’ changes)
1983 to 2014 1994 to 2014 2007 to 2014
Median household income (see note below) +25 +45 +5
Net average ordinary time earnings +32 +32 +12
NZS +9 +21 +12
DPB (SPS) plus family assistance (one child) -17 +6 -2
Invalids Benefit – single aged 25+ -8 -1 -1
375 Ibid, p. 82 Figure C.8A.376 For a detailed discussion of the structure of living standards in New Zealand, see Perry, B. (2009) Non-income
measures of material wellbeing and hardship: first results from the 2008 New Zealand Living Standards Survey, with international comparisons. Wellington, Ministry of Social Development. Working Paper 01/09.
377 Perry (2014), p 83 Table C2, using different title.
108
RECOMMENDATION 2
Review social welfare benefits for adequacy then, in future, adjust on the basis of relationship to the average wage, as is done for the age pension, New Zealand Superannuation.
What does it take to close the gap?
How does the income a family on a benefit receives from all sources relate to the family’s basic expenditure needs? Some international work has been undertaken on budget standards378 but there is little detailed published work for New Zealand, except for some work done for a couple with two children in connection with the living wage campaign.379 Anecdotal information from budgeting services reveals that many beneficiaries have a serious shortfall in their budgets.
An interesting example of an invalid parent with one child was documented by Brian Easton in a recent article: Chips with Everything: It is a fallacy to claim the poor just need financial advice to improve their lot.380 The budget for this family was based on their 2012 weekly income of $484. Food costs for simple but nutritious meals were estimated at $130, state house rent $119, power $40, medical and educational costs $53, transport $97, and phone $26. These basic costs totalled $465, leaving just $19 a week for everything else.
There is an uninformed view that all such people really need is financial advice…Few do-gooders’ ideas for reducing poverty are relevant. The conclusion from the budget is that poor families have insufficient income to lead a decent life.25
Circumstances vary, especially around housing and transport. Increasing numbers of families do not have subsidised rent in a state house, but have to fend for themselves in a tight private rental market. Consider a sole parent with two young children living in a typical rental house in Waitakere. In 2014 the major sources of income are the SPS of $299.45 per week (net) and the FTC of $157: a total of $457 (after rounding).
We have drawn on available sources to provide some indication of the budget shortfall for this family, using the limited data available. This basic estimation of expenditure cannot be interpreted to provide any indication of the adequacy of the budget to meet minimal standards. For example, the calculation of housing costs does not provide any indication of whether the homes are appropriate, warm or meet warrant of fitness standards – they are simply a measure of the cost of the housing.
378 For example, Bradshaw (1993) used detailed calculations of the various components of household and family lives in order to calculate either what is possible on a given income level, or what is required to meet minimum standards across a range of dimensions. Bradshaw’s work in the United Kingdom incorporated housing, fuel food, clothing, goods and services, personal care, transport and leisure and included a discussion on the cost of a child and the costs of lone parents Bradshaw, J. (ed.) (1993). Budget Standards for the United Kingdom. Avebury, Aldershot.
379 King and Waldegrave (2012) Report of an investigation into defining a living wage for New Zealand, Family Centre Social Policy Research Unit. Commissioned For The Living Wage Campaign.
380 Easton, B. (2014) Listener: 10 April, 2014.
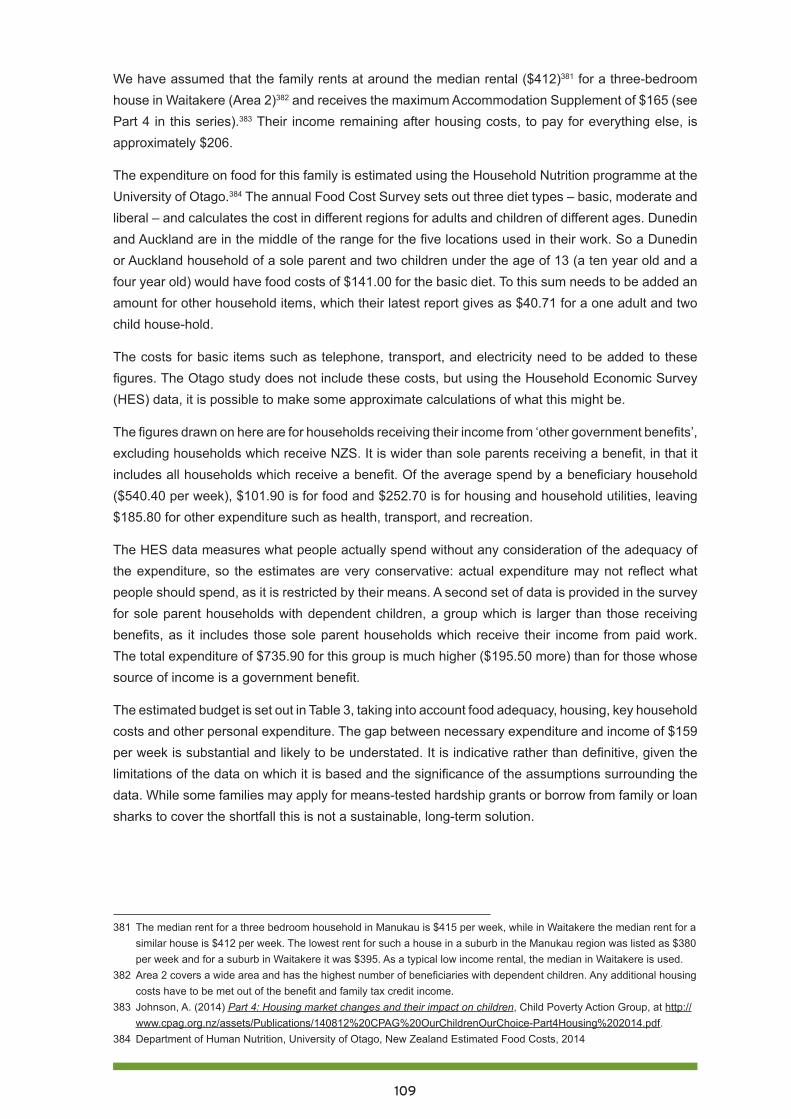
109
We have assumed that the family rents at around the median rental ($412)381 for a three-bedroom house in Waitakere (Area 2)382 and receives the maximum Accommodation Supplement of $165 (see Part 4 in this series).383 Their income remaining after housing costs, to pay for everything else, is approximately $206.
The expenditure on food for this family is estimated using the Household Nutrition programme at the University of Otago.384 The annual Food Cost Survey sets out three diet types – basic, moderate and liberal – and calculates the cost in different regions for adults and children of different ages. Dunedin and Auckland are in the middle of the range for the five locations used in their work. So a Dunedin or Auckland household of a sole parent and two children under the age of 13 (a ten year old and a four year old) would have food costs of $141.00 for the basic diet. To this sum needs to be added an amount for other household items, which their latest report gives as $40.71 for a one adult and two child house-hold.
The costs for basic items such as telephone, transport, and electricity need to be added to these figures. The Otago study does not include these costs, but using the Household Economic Survey (HES) data, it is possible to make some approximate calculations of what this might be.
The figures drawn on here are for households receiving their income from ‘other government benefits’, excluding households which receive NZS. It is wider than sole parents receiving a benefit, in that it includes all households which receive a benefit. Of the average spend by a beneficiary household ($540.40 per week), $101.90 is for food and $252.70 is for housing and household utilities, leaving $185.80 for other expenditure such as health, transport, and recreation.
The HES data measures what people actually spend without any consideration of the adequacy of the expenditure, so the estimates are very conservative: actual expenditure may not reflect what people should spend, as it is restricted by their means. A second set of data is provided in the survey for sole parent households with dependent children, a group which is larger than those receiving benefits, as it includes those sole parent households which receive their income from paid work. The total expenditure of $735.90 for this group is much higher ($195.50 more) than for those whose source of income is a government benefit.
The estimated budget is set out in Table 3, taking into account food adequacy, housing, key household costs and other personal expenditure. The gap between necessary expenditure and income of $159 per week is substantial and likely to be understated. It is indicative rather than definitive, given the limitations of the data on which it is based and the significance of the assumptions surrounding the data. While some families may apply for means-tested hardship grants or borrow from family or loan sharks to cover the shortfall this is not a sustainable, long-term solution.
381 The median rent for a three bedroom household in Manukau is $415 per week, while in Waitakere the median rent for a similar house is $412 per week. The lowest rent for such a house in a suburb in the Manukau region was listed as $380 per week and for a suburb in Waitakere it was $395. As a typical low income rental, the median in Waitakere is used.
382 Area 2 covers a wide area and has the highest number of beneficiaries with dependent children. Any additional housing costs have to be met out of the benefit and family tax credit income.
383 Johnson, A. (2014) Part 4: Housing market changes and their impact on children, Child Poverty Action Group, at http://www.cpag.org.nz/assets/Publications/140812%20CPAG%20OurChildrenOurChoice-Part4Housing%202014.pdf.
384 Department of Human Nutrition, University of Otago, New Zealand Estimated Food Costs, 2014
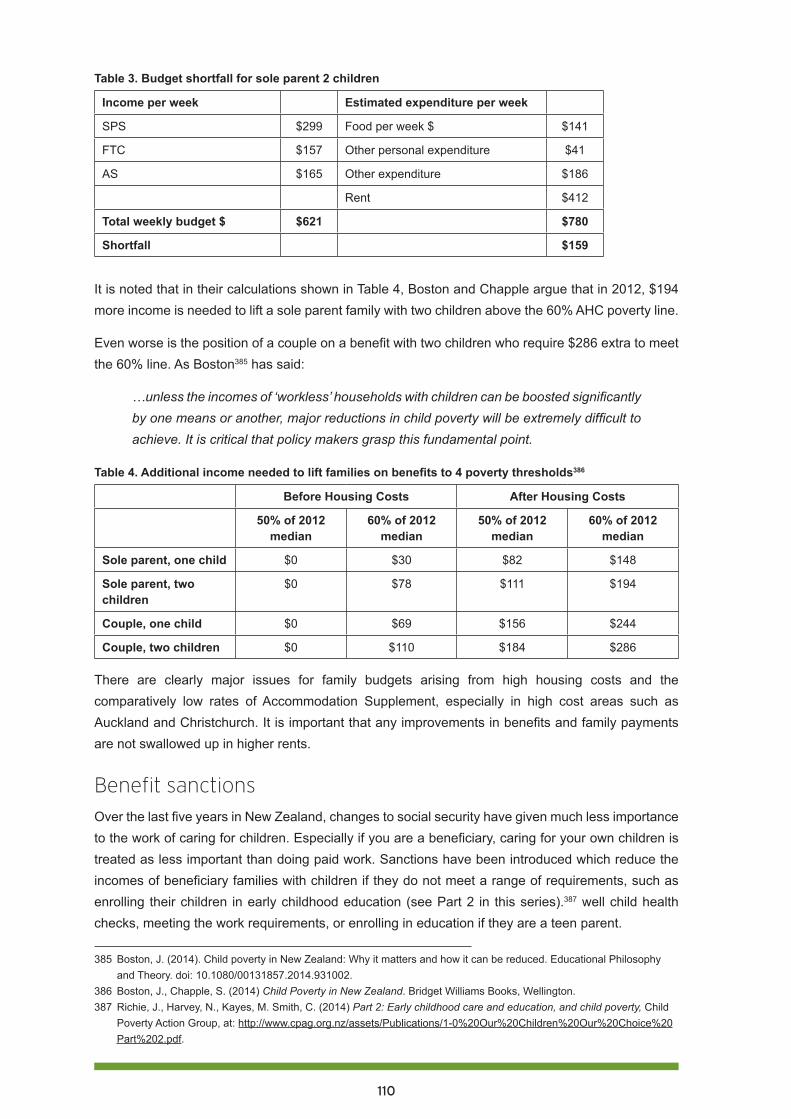
110
Table 3. Budget shortfall for sole parent 2 children
Income per week Estimated expenditure per week
SPS $299 Food per week $ $141
FTC $157 Other personal expenditure $41
AS $165 Other expenditure $186
Rent $412
Total weekly budget $ $621 $780
Shortfall $159
It is noted that in their calculations shown in Table 4, Boston and Chapple argue that in 2012, $194 more income is needed to lift a sole parent family with two children above the 60% AHC poverty line.
Even worse is the position of a couple on a benefit with two children who require $286 extra to meet the 60% line. As Boston385 has said:
…unless the incomes of ‘workless’ households with children can be boosted significantly by one means or another, major reductions in child poverty will be extremely difficult to achieve. It is critical that policy makers grasp this fundamental point.
Table 4. Additional income needed to lift families on benefits to 4 poverty thresholds386
Before Housing Costs After Housing Costs
50% of 2012 median
60% of 2012 median
50% of 2012 median
60% of 2012 median
Sole parent, one child $0 $30 $82 $148
Sole parent, two children
$0 $78 $111 $194
Couple, one child $0 $69 $156 $244
Couple, two children $0 $110 $184 $286
There are clearly major issues for family budgets arising from high housing costs and the comparatively low rates of Accommodation Supplement, especially in high cost areas such as Auckland and Christchurch. It is important that any improvements in benefits and family payments are not swallowed up in higher rents.
Benefit sanctionsOver the last five years in New Zealand, changes to social security have given much less importance to the work of caring for children. Especially if you are a beneficiary, caring for your own children is treated as less important than doing paid work. Sanctions have been introduced which reduce the incomes of beneficiary families with children if they do not meet a range of requirements, such as enrolling their children in early childhood education (see Part 2 in this series).387 well child health checks, meeting the work requirements, or enrolling in education if they are a teen parent.
385 Boston, J. (2014). Child poverty in New Zealand: Why it matters and how it can be reduced. Educational Philosophy and Theory. doi: 10.1080/00131857.2014.931002.
386 Boston, J., Chapple, S. (2014) Child Poverty in New Zealand. Bridget Williams Books, Wellington.387 Richie, J., Harvey, N., Kayes, M. Smith, C. (2014) Part 2: Early childhood care and education, and child poverty, Child
Poverty Action Group, at: http://www.cpag.org.nz/assets/Publications/1-0%20Our%20Children%20Our%20Choice%20Part%202.pdf.

111
Benefit sanctions range between a 50% reduction in the benefit payment for a grade one failure to meet obligations, and cancellation of the benefit for a grade three failure. The maximum reduction to the benefit for a family with children is supposed to be only 50%. Grade one occurs on the first occasion when a beneficiary has not met their obligations and fails to do so within five working days. A grade three arises from a third failure to meet obligations within a 12 month period. The lack of available data makes it difficult to be precise about the extent of the application of sanctions to beneficiaries with children. Table 5 below summarises the data supplied by MSD to Child Poverty Action Group in 2014 and suggests that the numbers of children affected by sanctions are significant. The effects of these cuts are particularly severe for children who are almost certainly already among the most impoverished and deprived children in New Zealand.
Table 5. Sanctions applied to clients with children, April 2013 – December 2013388
Sanction Grade 1
Sanction Grade 2 Sanction Grade 3
Sanction Type
Sanction Type % Suspended/Cancelled
Sanction Type % Suspended/CancelledYear Graduated Graduated Suspended/
CancelledGraduated Suspended/
Cancelled
April 2013-15 July 2013
3226 841 165 19.6 342 90 26.3
15 July-30 September 2013
2469 760 8 1.1 271 1 0.4
1 October-31 December 2013
3012 1159 7 0.6 388 2 0.5
RECOMMENDATION 3
Abolish sanctions which reduce the income of beneficiary families with dependent children.
RECOMMENDATION 4
Undertake and publish independent research on the extent of sanctions and their effects on children.
388 Wynd,D (2014) Benefit sanctions, see http://www.cpag.org.nz/resources/publications/
112
Working for FamiliesThe structure of WFF is very complex, with different rules of eligibility for different parts. It was built on the existing framework of weekly family assistance paid to the caregiver. When fully implemented in 2007, it made a significant difference for families that gained the full amount. Without this improvement in weekly child payments, child poverty would have been very much higher.
The MSD notes, however, that children in workless households were helped little by WFF:
From 1992 to 2004, children in workless households generally had poverty rates around four times higher than for those in households where at least one adult was in full-time work. From 2007 to 2012, the difference was even greater – around six to seven times higher for children in workless households. This to a large degree reflects the greater WFF assistance for working families than for beneficiary families…The fall in child poverty rates from 2004 to 2007 for children in one-full-time-one-workless 2 parent households was very large (28% to 9%), reflecting the WFF impact, especially through the In-work Tax Credit. 389
The biggest problem is that the design of WFF does not put the needs of the child at the centre of policy design.390 It excludes the poorest children for a good part of it, and its critical purpose has become lost in a morass of arguments over entitlements, overpayments, abatements and work tests.
In the aftermath of the Global Financial Crisis, child poverty rates began to rise in the OECD generally. At the release of a 2011 OECD report on family well-being, Doing Better for Families, Secretary-General Angel Gurría warned that: 391
Family benefits need to be well designed to maintain work incentives, but they need to be effective in protecting the most vulnerable, otherwise we risk creating high, long-term social costs for future generations.
CPAG New Zealand has long argued that the work incentive aspect of WFF is very badly designed and has been ineffective in protecting vulnerable children whose parents, for whatever reason, cannot work. The slight impact, if indeed any, on work incentives for a handful of sole parents does not justify the harm to 230,000 children whose families have been left out and left behind.392
The two major WFF tax credits are set out in Table 6. The Family Tax Credit (FTC) goes to all low income children on the same basis; but to qualify for the In Work Tax Credit (IWTC), families must work a minimum number of hours and not be on any welfare benefit or student allowance. These two tax credits are added together, paid to the caregiver and reduced at a rate of 21.5% for each dollar of family income earned over the threshold. The FTC abates first, followed by the IWTC.
389 Perry (2014) p. 156.390 St John, S. (2014): Putting Children at the Centre: Making policy as if children mattered, Educational Philosophy and
Theory, DOI: 10.1080/00131857.2014.931005. 391 OECD (2011) Doing Better for Families ar http://www.oecd.org/els/family/doingbetterforfamilies.htm. 392 St John, S. and M. C. Dale (2012). “Evidence-based Evaluation: Working for Families.” Policy Quarterly 8(1): 39 - 51.
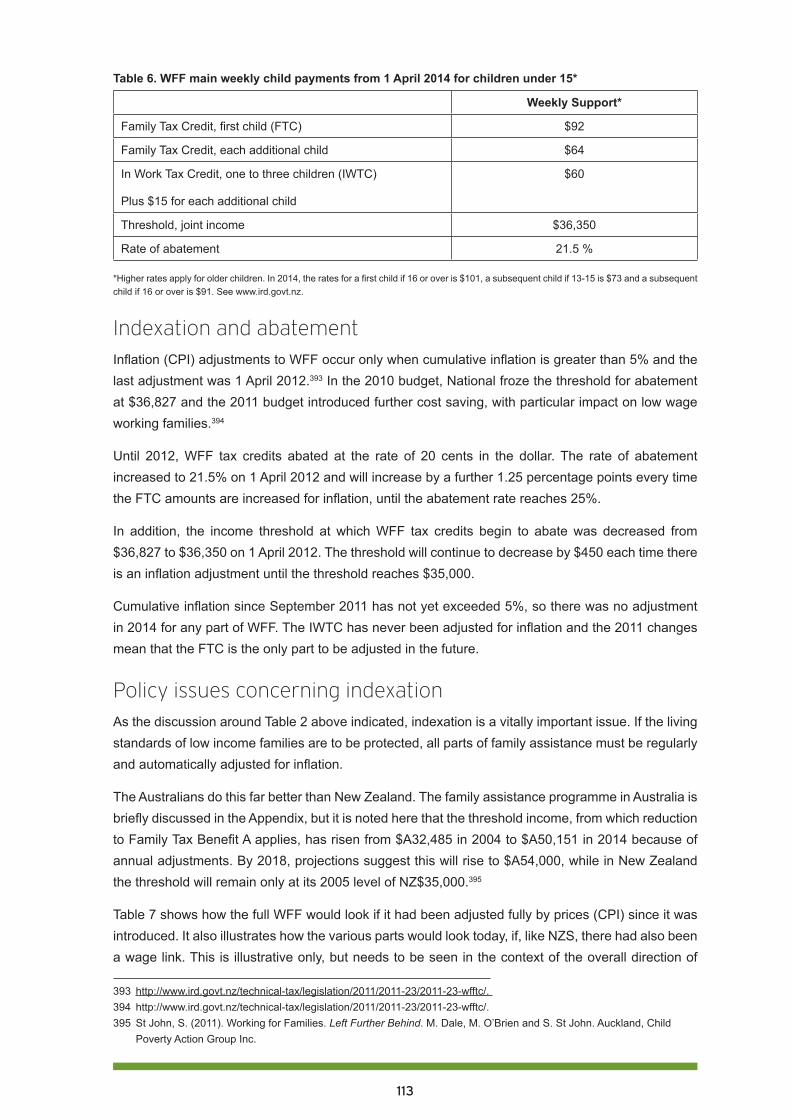
113
Table 6. WFF main weekly child payments from 1 April 2014 for children under 15*
Weekly Support*
Family Tax Credit, first child (FTC) $92
Family Tax Credit, each additional child $64
In Work Tax Credit, one to three children (IWTC)
Plus $15 for each additional child
$60
Threshold, joint income $36,350
Rate of abatement 21.5 %
*Higher rates apply for older children. In 2014, the rates for a first child if 16 or over is $101, a subsequent child if 13-15 is $73 and a subsequent child if 16 or over is $91. See www.ird.govt.nz.
Indexation and abatementInflation (CPI) adjustments to WFF occur only when cumulative inflation is greater than 5% and the last adjustment was 1 April 2012.393 In the 2010 budget, National froze the threshold for abatement at $36,827 and the 2011 budget introduced further cost saving, with particular impact on low wage working families.394
Until 2012, WFF tax credits abated at the rate of 20 cents in the dollar. The rate of abatement increased to 21.5% on 1 April 2012 and will increase by a further 1.25 percentage points every time the FTC amounts are increased for inflation, until the abatement rate reaches 25%.
In addition, the income threshold at which WFF tax credits begin to abate was decreased from $36,827 to $36,350 on 1 April 2012. The threshold will continue to decrease by $450 each time there is an inflation adjustment until the threshold reaches $35,000.
Cumulative inflation since September 2011 has not yet exceeded 5%, so there was no adjustment in 2014 for any part of WFF. The IWTC has never been adjusted for inflation and the 2011 changes mean that the FTC is the only part to be adjusted in the future.
Policy issues concerning indexationAs the discussion around Table 2 above indicated, indexation is a vitally important issue. If the living standards of low income families are to be protected, all parts of family assistance must be regularly and automatically adjusted for inflation.
The Australians do this far better than New Zealand. The family assistance programme in Australia is briefly discussed in the Appendix, but it is noted here that the threshold income, from which reduction to Family Tax Benefit A applies, has risen from $A32,485 in 2004 to $A50,151 in 2014 because of annual adjustments. By 2018, projections suggest this will rise to $A54,000, while in New Zealand the threshold will remain only at its 2005 level of NZ$35,000.395
Table 7 shows how the full WFF would look if it had been adjusted fully by prices (CPI) since it was introduced. It also illustrates how the various parts would look today, if, like NZS, there had also been a wage link. This is illustrative only, but needs to be seen in the context of the overall direction of
393 http://www.ird.govt.nz/technical-tax/legislation/2011/2011-23/2011-23-wfftc/. 394 http://www.ird.govt.nz/technical-tax/legislation/2011/2011-23/2011-23-wfftc/. 395 St John, S. (2011). Working for Families. Left Further Behind. M. Dale, M. O’Brien and S. St John. Auckland, Child
Poverty Action Group Inc.
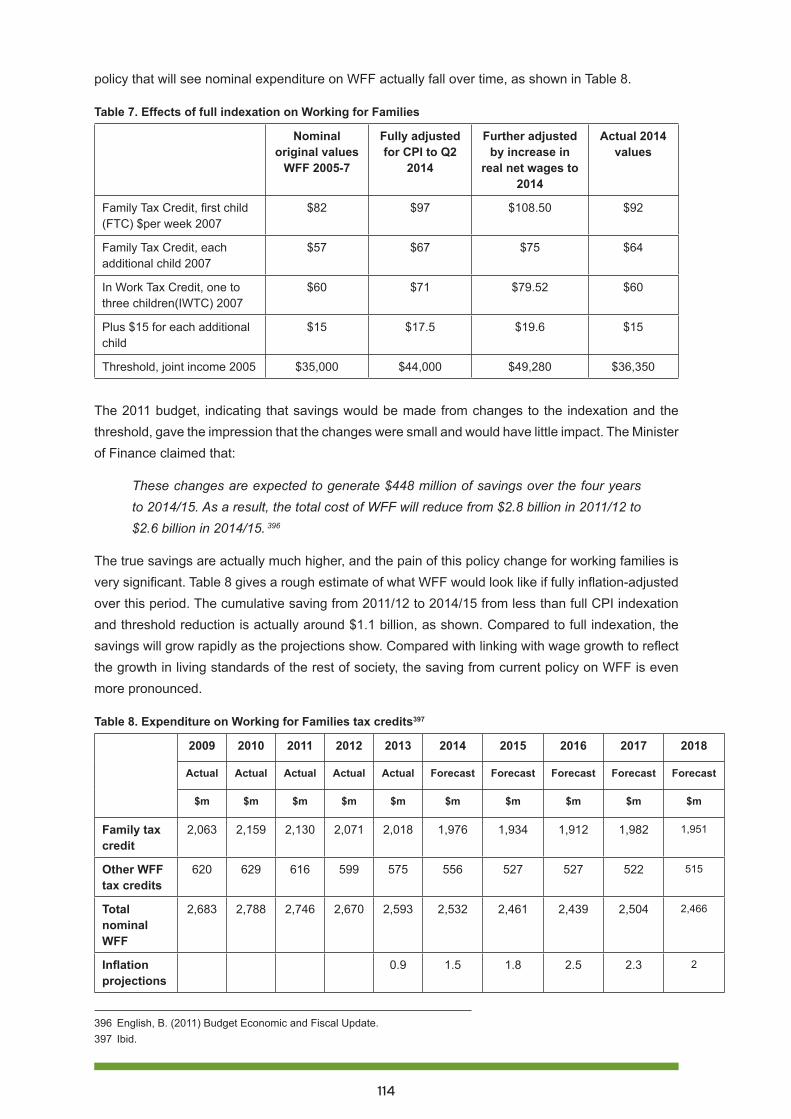
114
policy that will see nominal expenditure on WFF actually fall over time, as shown in Table 8.
Table 7. Effects of full indexation on Working for Families
Nominal original values
WFF 2005-7
Fully adjusted for CPI to Q2
2014
Further adjusted by increase in
real net wages to 2014
Actual 2014 values
Family Tax Credit, first child (FTC) $per week 2007
$82 $97 $108.50 $92
Family Tax Credit, each additional child 2007
$57 $67 $75 $64
In Work Tax Credit, one to three children(IWTC) 2007
$60 $71 $79.52 $60
Plus $15 for each additional child
$15 $17.5 $19.6 $15
Threshold, joint income 2005 $35,000 $44,000 $49,280 $36,350
The 2011 budget, indicating that savings would be made from changes to the indexation and the threshold, gave the impression that the changes were small and would have little impact. The Minister of Finance claimed that:
These changes are expected to generate $448 million of savings over the four years to 2014/15. As a result, the total cost of WFF will reduce from $2.8 billion in 2011/12 to $2.6 billion in 2014/15. 396
The true savings are actually much higher, and the pain of this policy change for working families is very significant. Table 8 gives a rough estimate of what WFF would look like if fully inflation-adjusted over this period. The cumulative saving from 2011/12 to 2014/15 from less than full CPI indexation and threshold reduction is actually around $1.1 billion, as shown. Compared to full indexation, the savings will grow rapidly as the projections show. Compared with linking with wage growth to reflect the growth in living standards of the rest of society, the saving from current policy on WFF is even more pronounced.
Table 8. Expenditure on Working for Families tax credits397
2009 2010 2011 2012 2013 2014 2015 2016 2017 2018
Actual Actual Actual Actual Actual Forecast Forecast Forecast Forecast Forecast
$m $m $m $m $m $m $m $m $m $m
Family tax credit
2,063 2,159 2,130 2,071 2,018 1,976 1,934 1,912 1,982 1,951
Other WFF tax credits
620 629 616 599 575 556 527 527 522 515
Total nominal WFF
2,683 2,788 2,746 2,670 2,593 2,532 2,461 2,439 2,504 2,466
Inflation projections
0.9 1.5 1.8 2.5 2.3 2
396 English, B. (2011) Budget Economic and Fiscal Update.397 Ibid.
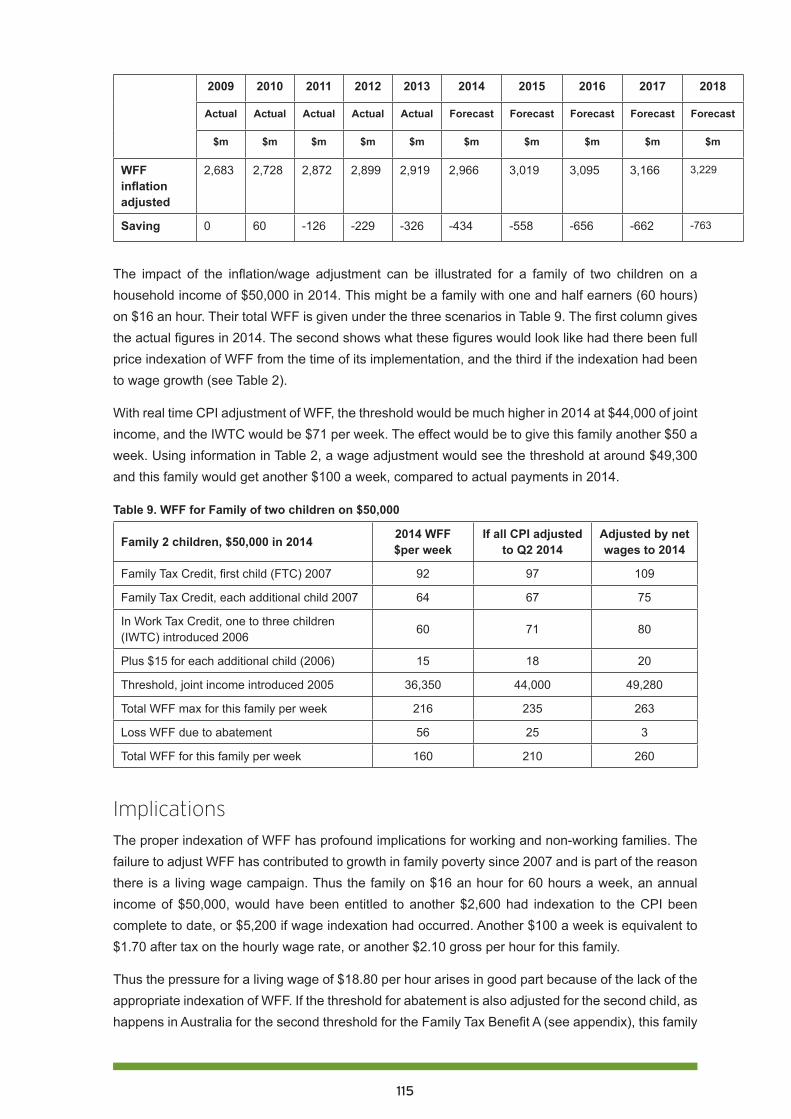
115
2009 2010 2011 2012 2013 2014 2015 2016 2017 2018
Actual Actual Actual Actual Actual Forecast Forecast Forecast Forecast Forecast
$m $m $m $m $m $m $m $m $m $m
WFF inflation adjusted
2,683 2,728 2,872 2,899 2,919 2,966 3,019 3,095 3,166 3,229
Saving 0 60 -126 -229 -326 -434 -558 -656 -662 -763
The impact of the inflation/wage adjustment can be illustrated for a family of two children on a household income of $50,000 in 2014. This might be a family with one and half earners (60 hours) on $16 an hour. Their total WFF is given under the three scenarios in Table 9. The first column gives the actual figures in 2014. The second shows what these figures would look like had there been full price indexation of WFF from the time of its implementation, and the third if the indexation had been to wage growth (see Table 2).
With real time CPI adjustment of WFF, the threshold would be much higher in 2014 at $44,000 of joint income, and the IWTC would be $71 per week. The effect would be to give this family another $50 a week. Using information in Table 2, a wage adjustment would see the threshold at around $49,300 and this family would get another $100 a week, compared to actual payments in 2014.
Table 9. WFF for Family of two children on $50,000
Family 2 children, $50,000 in 2014 2014 WFF $per week
If all CPI adjusted to Q2 2014
Adjusted by net wages to 2014
Family Tax Credit, first child (FTC) 2007 92 97 109
Family Tax Credit, each additional child 2007 64 67 75
In Work Tax Credit, one to three children (IWTC) introduced 2006
60 71 80
Plus $15 for each additional child (2006) 15 18 20
Threshold, joint income introduced 2005 36,350 44,000 49,280
Total WFF max for this family per week 216 235 263
Loss WFF due to abatement 56 25 3
Total WFF for this family per week 160 210 260
Implications The proper indexation of WFF has profound implications for working and non-working families. The failure to adjust WFF has contributed to growth in family poverty since 2007 and is part of the reason there is a living wage campaign. Thus the family on $16 an hour for 60 hours a week, an annual income of $50,000, would have been entitled to another $2,600 had indexation to the CPI been complete to date, or $5,200 if wage indexation had occurred. Another $100 a week is equivalent to $1.70 after tax on the hourly wage rate, or another $2.10 gross per hour for this family.
Thus the pressure for a living wage of $18.80 per hour arises in good part because of the lack of the appropriate indexation of WFF. If the threshold for abatement is also adjusted for the second child, as happens in Australia for the second threshold for the Family Tax Benefit A (see appendix), this family
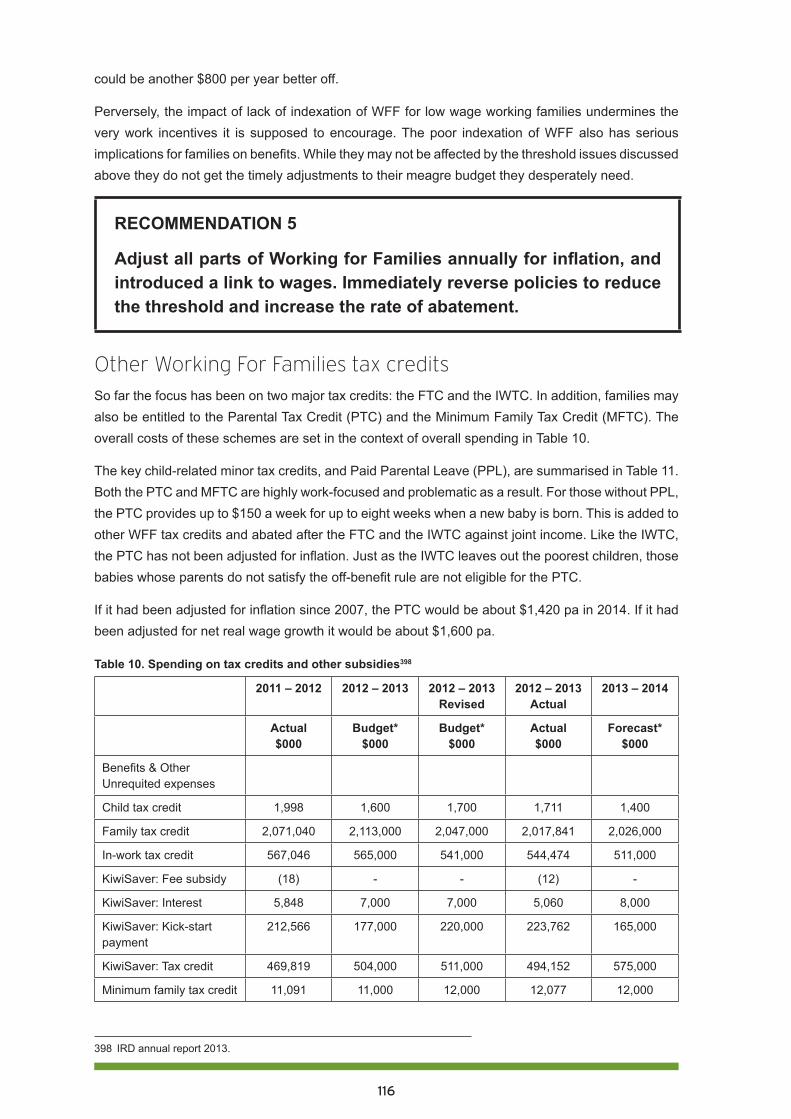
116
could be another $800 per year better off.
Perversely, the impact of lack of indexation of WFF for low wage working families undermines the very work incentives it is supposed to encourage. The poor indexation of WFF also has serious implications for families on benefits. While they may not be affected by the threshold issues discussed above they do not get the timely adjustments to their meagre budget they desperately need.
RECOMMENDATION 5
Adjust all parts of Working for Families annually for inflation, and introduced a link to wages. Immediately reverse policies to reduce the threshold and increase the rate of abatement.
Other Working For Families tax creditsSo far the focus has been on two major tax credits: the FTC and the IWTC. In addition, families may also be entitled to the Parental Tax Credit (PTC) and the Minimum Family Tax Credit (MFTC). The overall costs of these schemes are set in the context of overall spending in Table 10.
The key child-related minor tax credits, and Paid Parental Leave (PPL), are summarised in Table 11. Both the PTC and MFTC are highly work-focused and problematic as a result. For those without PPL, the PTC provides up to $150 a week for up to eight weeks when a new baby is born. This is added to other WFF tax credits and abated after the FTC and the IWTC against joint income. Like the IWTC, the PTC has not been adjusted for inflation. Just as the IWTC leaves out the poorest children, those babies whose parents do not satisfy the off-benefit rule are not eligible for the PTC.
If it had been adjusted for inflation since 2007, the PTC would be about $1,420 pa in 2014. If it had been adjusted for net real wage growth it would be about $1,600 pa.
Table 10. Spending on tax credits and other subsidies398
2011 – 2012 2012 – 2013 2012 – 2013 Revised
2012 – 2013 Actual
2013 – 2014
Actual $000
Budget* $000
Budget* $000
Actual $000
Forecast* $000
Benefits & Other Unrequited expenses
Child tax credit 1,998 1,600 1,700 1,711 1,400
Family tax credit 2,071,040 2,113,000 2,047,000 2,017,841 2,026,000
In-work tax credit 567,046 565,000 541,000 544,474 511,000
KiwiSaver: Fee subsidy (18) - - (12) -
KiwiSaver: Interest 5,848 7,000 7,000 5,060 8,000
KiwiSaver: Kick-start payment
212,566 177,000 220,000 223,762 165,000
KiwiSaver: Tax credit 469,819 504,000 511,000 494,152 575,000
Minimum family tax credit 11,091 11,000 12,000 12,077 12,000
398 IRD annual report 2013.
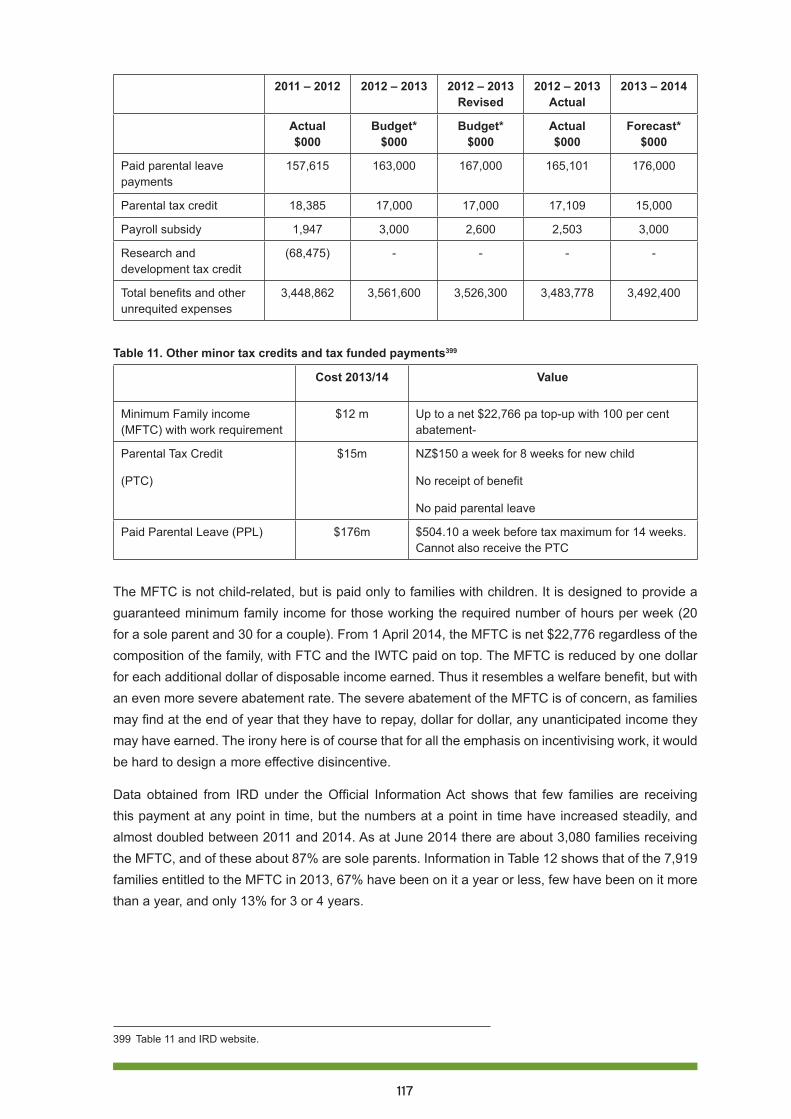
117
2011 – 2012 2012 – 2013 2012 – 2013 Revised
2012 – 2013 Actual
2013 – 2014
Actual $000
Budget* $000
Budget* $000
Actual $000
Forecast* $000
Paid parental leave payments
157,615 163,000 167,000 165,101 176,000
Parental tax credit 18,385 17,000 17,000 17,109 15,000
Payroll subsidy 1,947 3,000 2,600 2,503 3,000
Research and development tax credit
(68,475) - - - -
Total benefits and other unrequited expenses
3,448,862 3,561,600 3,526,300 3,483,778 3,492,400
Table 11. Other minor tax credits and tax funded payments399
Cost 2013/14 Value
Minimum Family income (MFTC) with work requirement
$12 m Up to a net $22,766 pa top-up with 100 per cent abatement-
Parental Tax Credit
(PTC)
$15m NZ$150 a week for 8 weeks for new child
No receipt of benefit
No paid parental leave
Paid Parental Leave (PPL) $176m $504.10 a week before tax maximum for 14 weeks. Cannot also receive the PTC
The MFTC is not child-related, but is paid only to families with children. It is designed to provide a guaranteed minimum family income for those working the required number of hours per week (20 for a sole parent and 30 for a couple). From 1 April 2014, the MFTC is net $22,776 regardless of the composition of the family, with FTC and the IWTC paid on top. The MFTC is reduced by one dollar for each additional dollar of disposable income earned. Thus it resembles a welfare benefit, but with an even more severe abatement rate. The severe abatement of the MFTC is of concern, as families may find at the end of year that they have to repay, dollar for dollar, any unanticipated income they may have earned. The irony here is of course that for all the emphasis on incentivising work, it would be hard to design a more effective disincentive.
Data obtained from IRD under the Official Information Act shows that few families are receiving this payment at any point in time, but the numbers at a point in time have increased steadily, and almost doubled between 2011 and 2014. As at June 2014 there are about 3,080 families receiving the MFTC, and of these about 87% are sole parents. Information in Table 12 shows that of the 7,919 families entitled to the MFTC in 2013, 67% have been on it a year or less, few have been on it more than a year, and only 13% for 3 or 4 years.
399 Table 11 and IRD website.
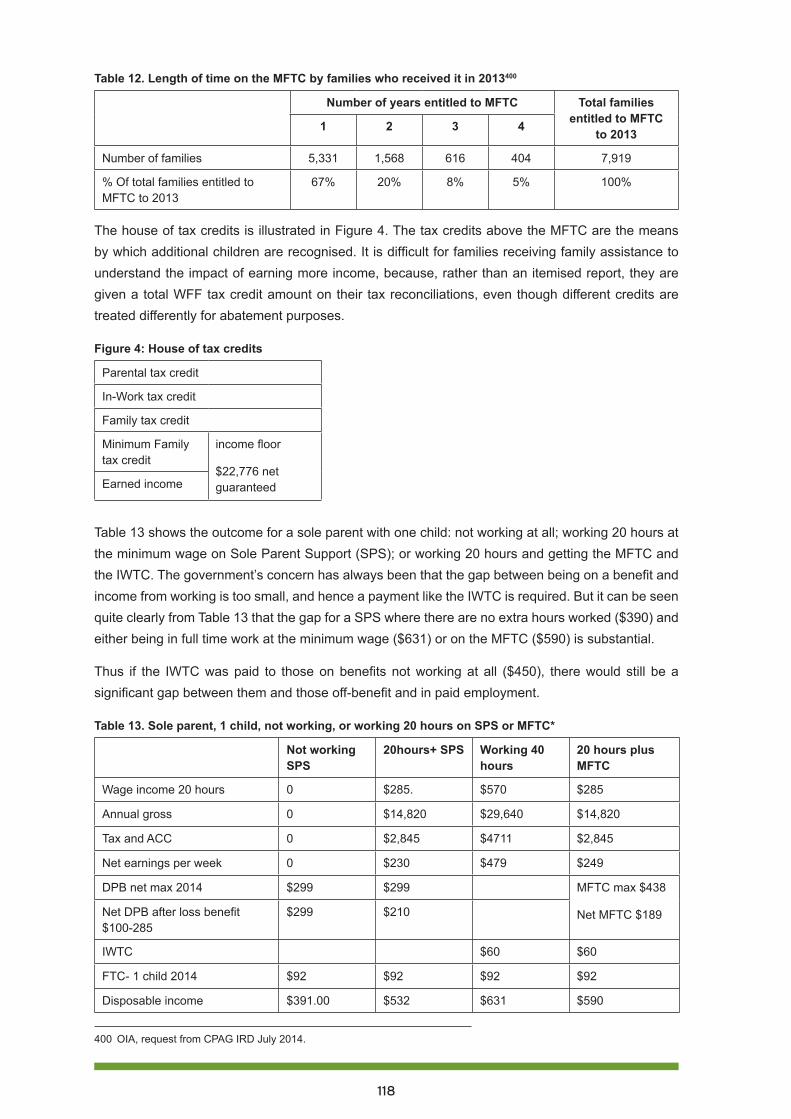
118
Table 12. Length of time on the MFTC by families who received it in 2013400
Number of years entitled to MFTC Total families entitled to MFTC
to 20131 2 3 4
Number of families 5,331 1,568 616 404 7,919
% Of total families entitled to MFTC to 2013
67% 20% 8% 5% 100%
The house of tax credits is illustrated in Figure 4. The tax credits above the MFTC are the means by which additional children are recognised. It is difficult for families receiving family assistance to understand the impact of earning more income, because, rather than an itemised report, they are given a total WFF tax credit amount on their tax reconciliations, even though different credits are treated differently for abatement purposes.
Figure 4: House of tax credits
Parental tax credit
In-Work tax credit
Family tax credit
Minimum Family tax credit
income floor
$22,776 net guaranteedEarned income
Table 13 shows the outcome for a sole parent with one child: not working at all; working 20 hours at the minimum wage on Sole Parent Support (SPS); or working 20 hours and getting the MFTC and the IWTC. The government’s concern has always been that the gap between being on a benefit and income from working is too small, and hence a payment like the IWTC is required. But it can be seen quite clearly from Table 13 that the gap for a SPS where there are no extra hours worked ($390) and either being in full time work at the minimum wage ($631) or on the MFTC ($590) is substantial.
Thus if the IWTC was paid to those on benefits not working at all ($450), there would still be a significant gap between them and those off-benefit and in paid employment.
Table 13. Sole parent, 1 child, not working, or working 20 hours on SPS or MFTC*
Not working SPS
20hours+ SPS Working 40 hours
20 hours plus MFTC
Wage income 20 hours 0 $285. $570 $285
Annual gross 0 $14,820 $29,640 $14,820
Tax and ACC 0 $2,845 $4711 $2,845
Net earnings per week 0 $230 $479 $249
DPB net max 2014 $299 $299 MFTC max $438
Net MFTC $189Net DPB after loss benefit $100-285
$299 $210
IWTC $60 $60
FTC- 1 child 2014 $92 $92 $92 $92
Disposable income $391.00 $532 $631 $590
400 OIA, request from CPAG IRD July 2014.
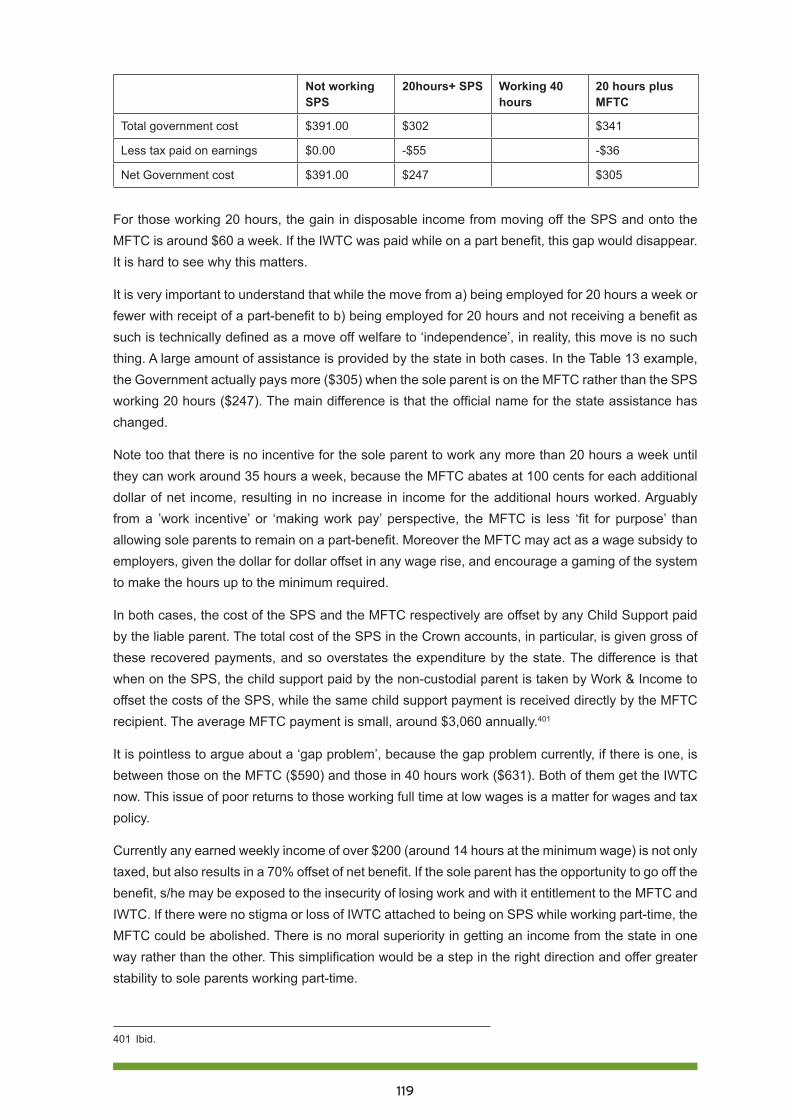
119
Not working SPS
20hours+ SPS Working 40 hours
20 hours plus MFTC
Total government cost $391.00 $302 $341
Less tax paid on earnings $0.00 -$55 -$36
Net Government cost $391.00 $247 $305
For those working 20 hours, the gain in disposable income from moving off the SPS and onto the MFTC is around $60 a week. If the IWTC was paid while on a part benefit, this gap would disappear. It is hard to see why this matters.
It is very important to understand that while the move from a) being employed for 20 hours a week or fewer with receipt of a part-benefit to b) being employed for 20 hours and not receiving a benefit as such is technically defined as a move off welfare to ‘independence’, in reality, this move is no such thing. A large amount of assistance is provided by the state in both cases. In the Table 13 example, the Government actually pays more ($305) when the sole parent is on the MFTC rather than the SPS working 20 hours ($247). The main difference is that the official name for the state assistance has changed.
Note too that there is no incentive for the sole parent to work any more than 20 hours a week until they can work around 35 hours a week, because the MFTC abates at 100 cents for each additional dollar of net income, resulting in no increase in income for the additional hours worked. Arguably from a ’work incentive’ or ‘making work pay’ perspective, the MFTC is less ‘fit for purpose’ than allowing sole parents to remain on a part-benefit. Moreover the MFTC may act as a wage subsidy to employers, given the dollar for dollar offset in any wage rise, and encourage a gaming of the system to make the hours up to the minimum required.
In both cases, the cost of the SPS and the MFTC respectively are offset by any Child Support paid by the liable parent. The total cost of the SPS in the Crown accounts, in particular, is given gross of these recovered payments, and so overstates the expenditure by the state. The difference is that when on the SPS, the child support paid by the non-custodial parent is taken by Work & Income to offset the costs of the SPS, while the same child support payment is received directly by the MFTC recipient. The average MFTC payment is small, around $3,060 annually.401
It is pointless to argue about a ‘gap problem’, because the gap problem currently, if there is one, is between those on the MFTC ($590) and those in 40 hours work ($631). Both of them get the IWTC now. This issue of poor returns to those working full time at low wages is a matter for wages and tax policy.
Currently any earned weekly income of over $200 (around 14 hours at the minimum wage) is not only taxed, but also results in a 70% offset of net benefit. If the sole parent has the opportunity to go off the benefit, s/he may be exposed to the insecurity of losing work and with it entitlement to the MFTC and IWTC. If there were no stigma or loss of IWTC attached to being on SPS while working part-time, the MFTC could be abolished. There is no moral superiority in getting an income from the state in one way rather than the other. This simplification would be a step in the right direction and offer greater stability to sole parents working part-time.
401 Ibid.
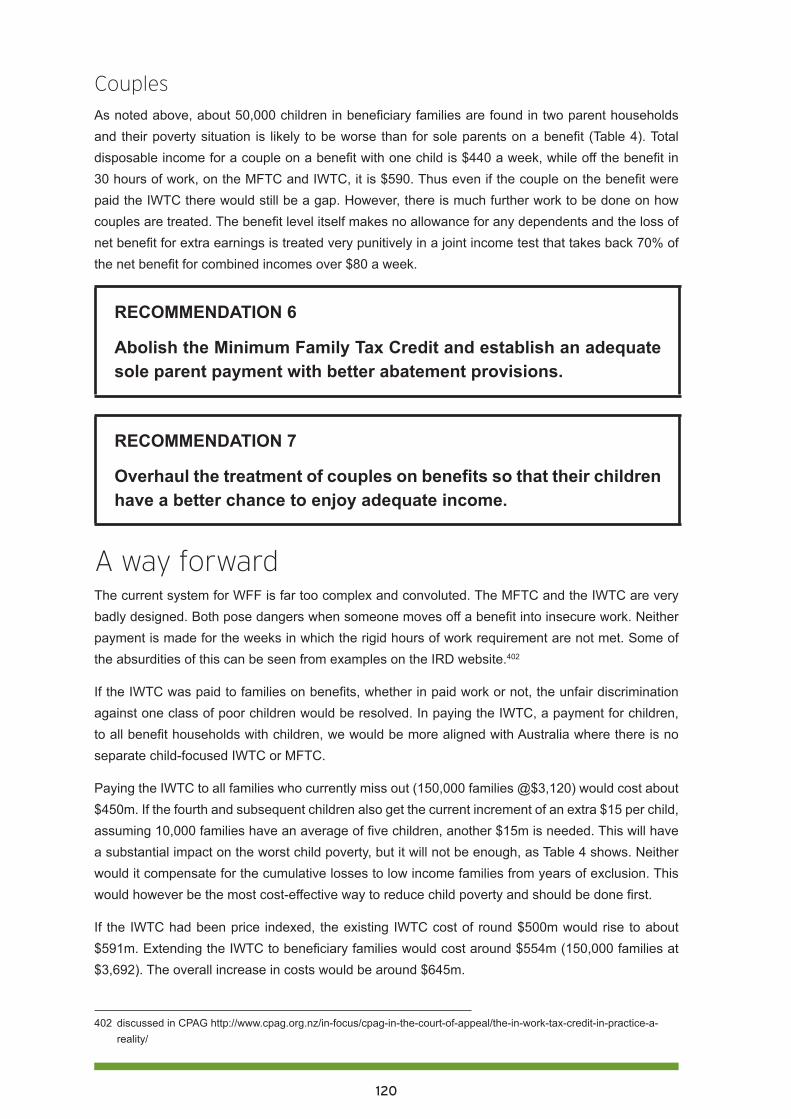
120
CouplesAs noted above, about 50,000 children in beneficiary families are found in two parent households and their poverty situation is likely to be worse than for sole parents on a benefit (Table 4). Total disposable income for a couple on a benefit with one child is $440 a week, while off the benefit in 30 hours of work, on the MFTC and IWTC, it is $590. Thus even if the couple on the benefit were paid the IWTC there would still be a gap. However, there is much further work to be done on how couples are treated. The benefit level itself makes no allowance for any dependents and the loss of net benefit for extra earnings is treated very punitively in a joint income test that takes back 70% of the net benefit for combined incomes over $80 a week.
RECOMMENDATION 6
Abolish the Minimum Family Tax Credit and establish an adequate sole parent payment with better abatement provisions.
RECOMMENDATION 7
Overhaul the treatment of couples on benefits so that their children have a better chance to enjoy adequate income.
A way forwardThe current system for WFF is far too complex and convoluted. The MFTC and the IWTC are very badly designed. Both pose dangers when someone moves off a benefit into insecure work. Neither payment is made for the weeks in which the rigid hours of work requirement are not met. Some of the absurdities of this can be seen from examples on the IRD website.402
If the IWTC was paid to families on benefits, whether in paid work or not, the unfair discrimination against one class of poor children would be resolved. In paying the IWTC, a payment for children, to all benefit households with children, we would be more aligned with Australia where there is no separate child-focused IWTC or MFTC.
Paying the IWTC to all families who currently miss out (150,000 families @$3,120) would cost about $450m. If the fourth and subsequent children also get the current increment of an extra $15 per child, assuming 10,000 families have an average of five children, another $15m is needed. This will have a substantial impact on the worst child poverty, but it will not be enough, as Table 4 shows. Neither would it compensate for the cumulative losses to low income families from years of exclusion. This would however be the most cost-effective way to reduce child poverty and should be done first.
If the IWTC had been price indexed, the existing IWTC cost of round $500m would rise to about $591m. Extending the IWTC to beneficiary families would cost around $554m (150,000 families at $3,692). The overall increase in costs would be around $645m.
402 discussed in CPAG http://www.cpag.org.nz/in-focus/cpag-in-the-court-of-appeal/the-in-work-tax-credit-in-practice-a-reality/
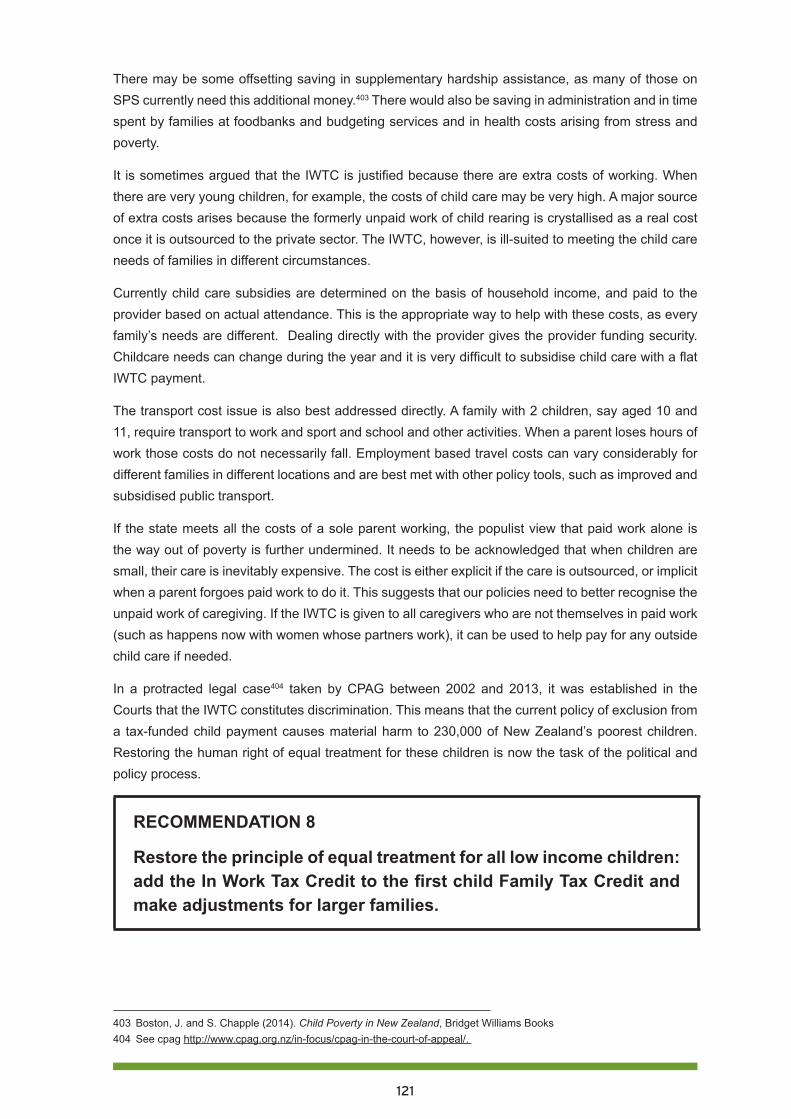
121
There may be some offsetting saving in supplementary hardship assistance, as many of those on SPS currently need this additional money.403 There would also be saving in administration and in time spent by families at foodbanks and budgeting services and in health costs arising from stress and poverty.
It is sometimes argued that the IWTC is justified because there are extra costs of working. When there are very young children, for example, the costs of child care may be very high. A major source of extra costs arises because the formerly unpaid work of child rearing is crystallised as a real cost once it is outsourced to the private sector. The IWTC, however, is ill-suited to meeting the child care needs of families in different circumstances.
Currently child care subsidies are determined on the basis of household income, and paid to the provider based on actual attendance. This is the appropriate way to help with these costs, as every family’s needs are different. Dealing directly with the provider gives the provider funding security. Childcare needs can change during the year and it is very difficult to subsidise child care with a flat IWTC payment.
The transport cost issue is also best addressed directly. A family with 2 children, say aged 10 and 11, require transport to work and sport and school and other activities. When a parent loses hours of work those costs do not necessarily fall. Employment based travel costs can vary considerably for different families in different locations and are best met with other policy tools, such as improved and subsidised public transport.
If the state meets all the costs of a sole parent working, the populist view that paid work alone is the way out of poverty is further undermined. It needs to be acknowledged that when children are small, their care is inevitably expensive. The cost is either explicit if the care is outsourced, or implicit when a parent forgoes paid work to do it. This suggests that our policies need to better recognise the unpaid work of caregiving. If the IWTC is given to all caregivers who are not themselves in paid work (such as happens now with women whose partners work), it can be used to help pay for any outside child care if needed.
In a protracted legal case404 taken by CPAG between 2002 and 2013, it was established in the Courts that the IWTC constitutes discrimination. This means that the current policy of exclusion from a tax-funded child payment causes material harm to 230,000 of New Zealand’s poorest children. Restoring the human right of equal treatment for these children is now the task of the political and policy process.
RECOMMENDATION 8
Restore the principle of equal treatment for all low income children: add the In Work Tax Credit to the first child Family Tax Credit and make adjustments for larger families.
403 Boston, J. and S. Chapple (2014). Child Poverty in New Zealand, Bridget Williams Books404 See cpag http://www.cpag.org.nz/in-focus/cpag-in-the-court-of-appeal/.
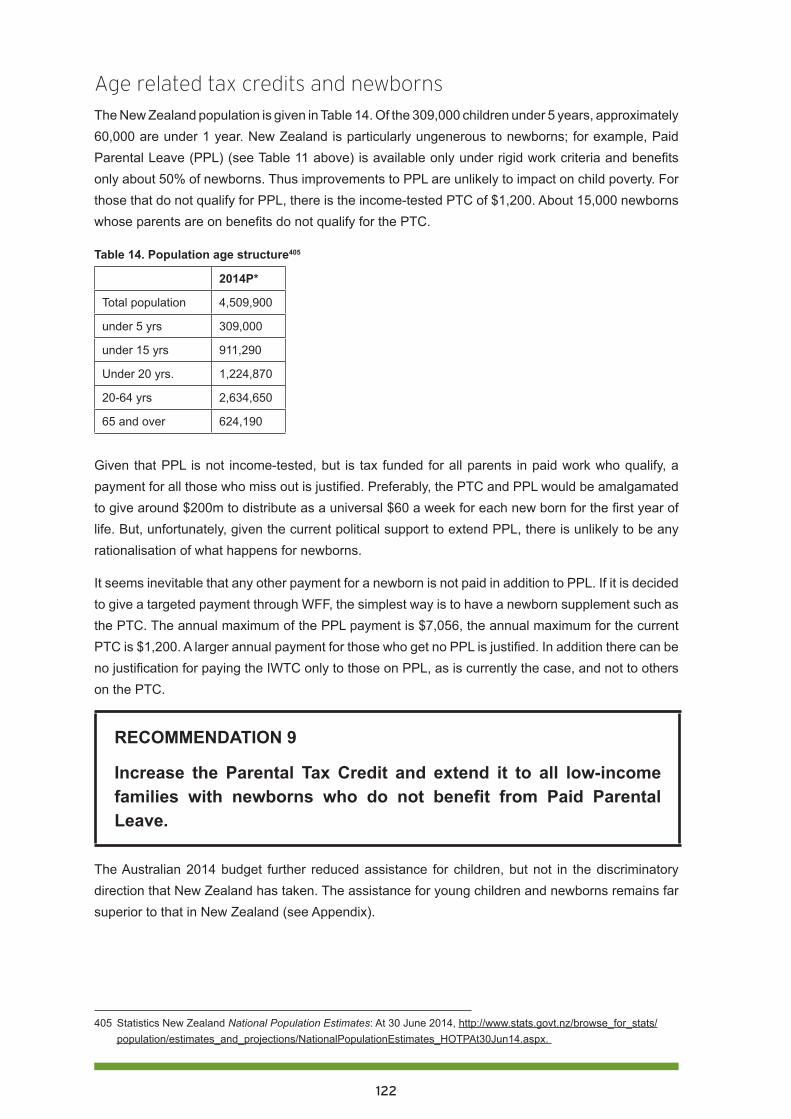
122
Age related tax credits and newbornsThe New Zealand population is given in Table 14. Of the 309,000 children under 5 years, approximately 60,000 are under 1 year. New Zealand is particularly ungenerous to newborns; for example, Paid Parental Leave (PPL) (see Table 11 above) is available only under rigid work criteria and benefits only about 50% of newborns. Thus improvements to PPL are unlikely to impact on child poverty. For those that do not qualify for PPL, there is the income-tested PTC of $1,200. About 15,000 newborns whose parents are on benefits do not qualify for the PTC.
Table 14. Population age structure405
2014P*
Total population 4,509,900
under 5 yrs 309,000
under 15 yrs 911,290
Under 20 yrs. 1,224,870
20-64 yrs 2,634,650
65 and over 624,190
Given that PPL is not income-tested, but is tax funded for all parents in paid work who qualify, a payment for all those who miss out is justified. Preferably, the PTC and PPL would be amalgamated to give around $200m to distribute as a universal $60 a week for each new born for the first year of life. But, unfortunately, given the current political support to extend PPL, there is unlikely to be any rationalisation of what happens for newborns.
It seems inevitable that any other payment for a newborn is not paid in addition to PPL. If it is decided to give a targeted payment through WFF, the simplest way is to have a newborn supplement such as the PTC. The annual maximum of the PPL payment is $7,056, the annual maximum for the current PTC is $1,200. A larger annual payment for those who get no PPL is justified. In addition there can be no justification for paying the IWTC only to those on PPL, as is currently the case, and not to others on the PTC.
RECOMMENDATION 9
Increase the Parental Tax Credit and extend it to all low-income families with newborns who do not benefit from Paid Parental Leave.
The Australian 2014 budget further reduced assistance for children, but not in the discriminatory direction that New Zealand has taken. The assistance for young children and newborns remains far superior to that in New Zealand (see Appendix).
405 Statistics New Zealand National Population Estimates: At 30 June 2014, http://www.stats.govt.nz/browse_for_stats/population/estimates_and_projections/NationalPopulationEstimates_HOTPAt30Jun14.aspx.
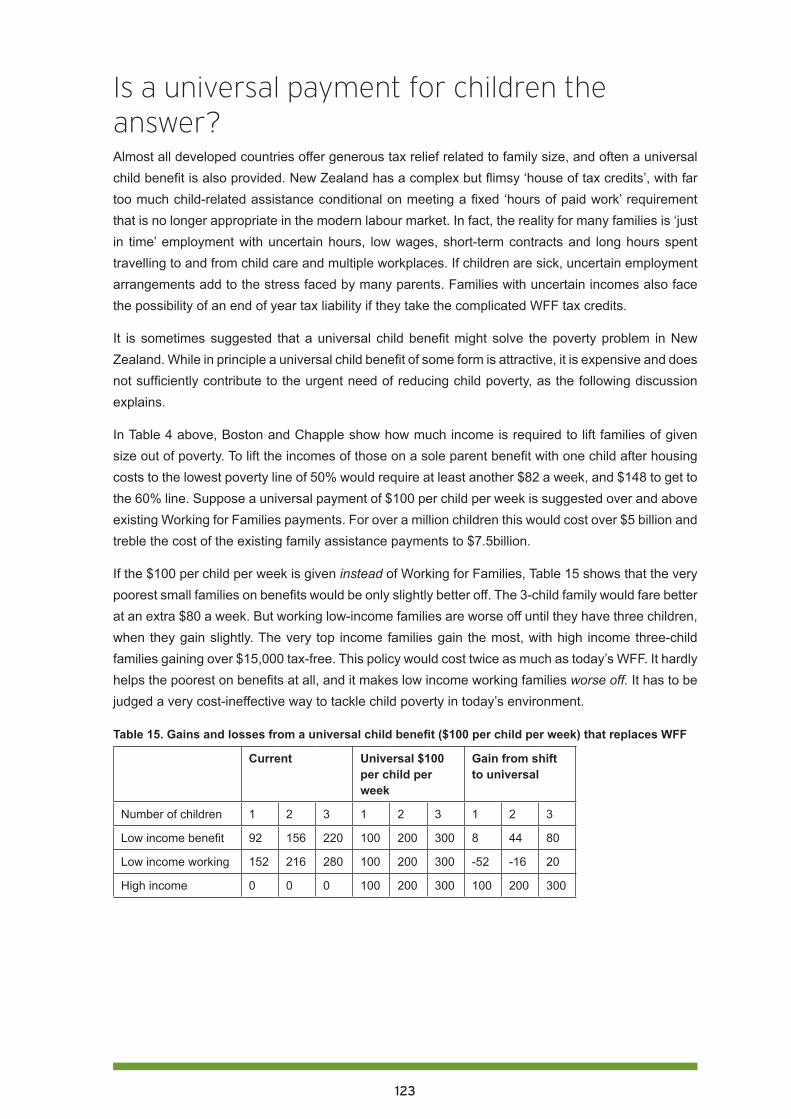
123
Is a universal payment for children the answer?Almost all developed countries offer generous tax relief related to family size, and often a universal child benefit is also provided. New Zealand has a complex but flimsy ‘house of tax credits’, with far too much child-related assistance conditional on meeting a fixed ‘hours of paid work’ requirement that is no longer appropriate in the modern labour market. In fact, the reality for many families is ‘just in time’ employment with uncertain hours, low wages, short-term contracts and long hours spent travelling to and from child care and multiple workplaces. If children are sick, uncertain employment arrangements add to the stress faced by many parents. Families with uncertain incomes also face the possibility of an end of year tax liability if they take the complicated WFF tax credits.
It is sometimes suggested that a universal child benefit might solve the poverty problem in New Zealand. While in principle a universal child benefit of some form is attractive, it is expensive and does not sufficiently contribute to the urgent need of reducing child poverty, as the following discussion explains.
In Table 4 above, Boston and Chapple show how much income is required to lift families of given size out of poverty. To lift the incomes of those on a sole parent benefit with one child after housing costs to the lowest poverty line of 50% would require at least another $82 a week, and $148 to get to the 60% line. Suppose a universal payment of $100 per child per week is suggested over and above existing Working for Families payments. For over a million children this would cost over $5 billion and treble the cost of the existing family assistance payments to $7.5billion.
If the $100 per child per week is given instead of Working for Families, Table 15 shows that the very poorest small families on benefits would be only slightly better off. The 3-child family would fare better at an extra $80 a week. But working low-income families are worse off until they have three children, when they gain slightly. The very top income families gain the most, with high income three-child families gaining over $15,000 tax-free. This policy would cost twice as much as today’s WFF. It hardly helps the poorest on benefits at all, and it makes low income working families worse off. It has to be judged a very cost-ineffective way to tackle child poverty in today’s environment.
Table 15. Gains and losses from a universal child benefit ($100 per child per week) that replaces WFF
Current Universal $100 per child per week
Gain from shift to universal
Number of children 1 2 3 1 2 3 1 2 3
Low income benefit 92 156 220 100 200 300 8 44 80
Low income working 152 216 280 100 200 300 -52 -16 20
High income 0 0 0 100 200 300 100 200 300
124
Unintended consequences of bad policyWFF is far too complicated. Navigating the maze of benefits, supplementary payments, family tax credits, abatements, shared care rules, hours of paid work requirements, reassessments, demands for payments, and penalties, is hugely demanding even for the most expert. Without understanding how the various tax credits work, a sole parent is supposed to respond by getting a job, any job. The IWTC, the FTC, the PTC and the MFTC have different criteria and abatements. The required fixed weekly hours of work are far too difficult to police and monitor consistently in a modern, casualised labour market.
It is possible for a sole parent to receive demands for reassessed WFF tax credits for previous tax years. While the IRD will write off such assessments in cases where she has no money, this is a very scary time for her. Furthermore, under the newly adopted definitions of ’family scheme income’,406 payments from grandparents trying to assist their struggling children and grandchildren may also be treated as family income for abatement purposes.
Work & Income wants to know about every single extra dollar that comes the way of the sole parent, including any helpful payments from the other parent or from the whanau or extended family. The IRD and Work & Income definitions of what constitutes a relationship are inconsistent, with Work & Income keen to say there is a relationship if there is evidence of financial support. Work & Income peers into the bedrooms of the poor to see if the sole parent is co-habiting and therefore not entitled to a benefit. On the other hand, the IRD, even less qualified in social matters, peers into the bedrooms of the poor to see if she is not co-habiting, so that she can be denied the IWTC for her children. Families can receive a torrent of letters from different parts of the IRD and Work & Income and become confused and anxious, especially when overpayments of WFF are alleged, accompanied by demands for interest payments on debts accrued.
In contrast, the IWTC can be paid to a mother while she is in a relationship even if she is not in paid work, providing her partner works 30 or more hours. However, note that any overpayment becomes her debt even when it is caused by an increase in his income. If they split up, and even if they remain independent from the benefit system and he continues as before to support her in a full-time care-giving role, she loses entitlement to the IWTC and is thus liable for repaying any so-defined ‘overpayment’. The work-based logic appears to be that because she is living on her own, she should now be expected to work 20 hours a week outside the home. There is no regard for the needs of the young child, nor respect for the considerable unpaid work of fulfilling her primary duty of care. The interests of the child have completely vanished from the policy.
Shared care has emerged as another issue. If a couple is separated, the WFF is apportioned provided the other parent provides care for 5/14ths of the time in each fortnight. This might be every second weekend and some overnight stays. It is therefore possible for a sole parent to get a reduced WFF of only $56.37, even though s/he has the child all of the days of the entire working week and cannot work, while the other parent gets $91 because the IWTC is not apportioned for shared care, and only the parent in paid work is entitled to it. If the couple were not separated, the at-home parent would be paid all of the WFF money.
406 Legislation designed to reduce the ability of higher-income families to reorder their affairs and use vehicles such as trusts and PIEs to limit their income and maximise their WFF.
125
The Human Rights Tribunal decision clearly states that, the IWTC is a payment for children.
The Crown’s argument that the challenged tax credits cannot be described as ‘child-related’ has no basis whatsoever in the evidence we heard.407
It is also noted that the criteria for shared care are different for WFF and Child Support. This causes an enormous amount of confusion. If the tax credits were associated solely with the child rather than work status of the parent/s, they could be left un-apportioned and paid to the primary caregiver, with only Child Support adjusted, and then, only if genuine shared care of a significant nature was in place.
Recommendation 10.
Act with urgency to gain cross party support for an overhaul of all parts of the welfare and tax credit system that affect families with children.
ConclusionCurrent benefit policy is entirely focused on moving people from a benefit into paid work, without any consideration of income adequacy, or the short- and long- term health and well-being of children. It is acknowledged that paid work is part of a poverty reduction and elimination strategy, but it is only a part. Beneficiaries with children often cannot undertake paid work because of personal needs and circumstances. Others cannot find work that allows them to meet their parenting obligations satisfactorily. It is unacceptable that these families live in poverty because of the currently inadequate levels of social assistance, originally introduced to keep families out of poverty.
In addition, as the data on the distribution of child poverty indicates, paid work in itself does not guarantee that children will move above the poverty line: 37% of the children living in poverty are in households reliant on market income.408 ‘Paid work’ does not in and of itself guarantee that children will be moved above the poverty line. Nor does it suggest that WFF payments for children are overly generous. Moreover, current policy is cutting WFF over time for low wage earners with perverse effects.
We are at a critical tipping point. The proposed recommendations may appear expensive, but can be regarded as an investment in the future of our children and our communities. The alternative of inaction to address the problems outlined here is far more costly to individual children, and to all New Zealanders.
407 Human Rights Tribunal, 2008, p. 63.408 Perry, B. (2014). Table H.5.
126
Full list of recommendations1. Increase the minimum wage and address the extra needs of children in low income families
through well-supported benefits and tax credits.
2. Review social welfare benefits for adequacy then, in future, adjust on the basis of relationship to the average wage, as is done for the age pension, New Zealand Superannuation.
3. Abolish sanctions which reduce the income of beneficiary families with dependent children.
4. Undertake and publish independent research on the extent of sanctions and their effects on children.
5. Adjust all parts of Working for Families annually for inflation, and introduce a link to wages. Immediately reverse policies that reduce the threshold and increase the rate of abatement.
6. Abolish the Minimum Family Tax Credit and establish an adequate sole parent payment with better abatement provisions.
7. Overhaul the treatment of couples on benefits so that their children have a better chance to enjoy adequate income.
8. Restore the principle of equal treatment for all low income children: add the In Work Tax Credit to the first child Family Tax Credit and make adjustments for larger families.
9. Increase the Parental Tax Credit and extend it to all low-income families with newborns that do not benefit from Paid Parental Leave.
10. Act with urgency to gain cross party support for an overhaul of all parts of the welfare and tax credit system that affect families with children.
Audiovisual resourcesCatriona MacLennan (May 14, 2014) Child Poverty in Aotearoa 2014 Episode 1: The Big Picture. An overview of child poverty in New Zealand in the lead up to the 2014 budget featuring interviews with Dr Nikki Turner; Nadia Shanab and Associate Professor Mike O’Brien, at https://www.youtube.com/watch?v=9t_HDffwU9A, FACETV.
Catriona MacLennan (Jun 18, 2014) Child Poverty in Aotearoa 2014. Episode 6. Providing adequate family incomes. Associate Professors Susan St John and Gail Pacheco and Professor Jonathan Boston; putting child poverty on the map in election year, at https://www.youtube.com/watch?v=TYqlopesVIo, FACETV.
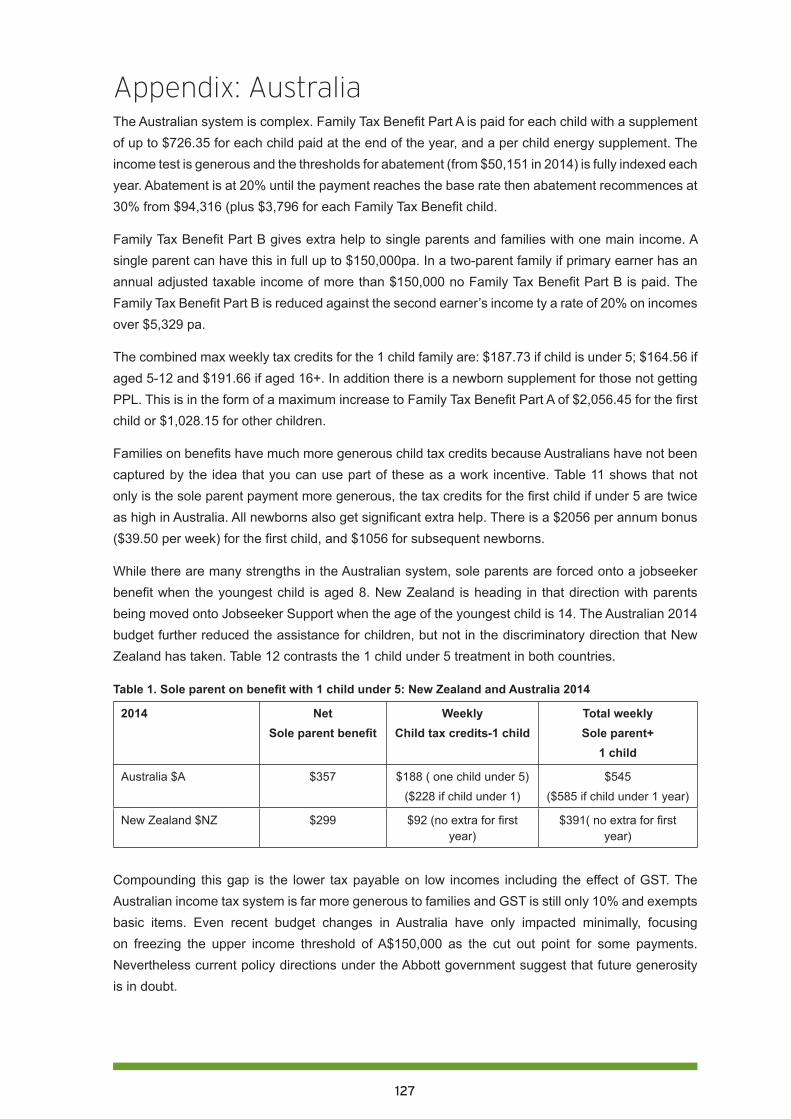
127
Appendix: AustraliaThe Australian system is complex. Family Tax Benefit Part A is paid for each child with a supplement of up to $726.35 for each child paid at the end of the year, and a per child energy supplement. The income test is generous and the thresholds for abatement (from $50,151 in 2014) is fully indexed each year. Abatement is at 20% until the payment reaches the base rate then abatement recommences at 30% from $94,316 (plus $3,796 for each Family Tax Benefit child.
Family Tax Benefit Part B gives extra help to single parents and families with one main income. A single parent can have this in full up to $150,000pa. In a two-parent family if primary earner has an annual adjusted taxable income of more than $150,000 no Family Tax Benefit Part B is paid. The Family Tax Benefit Part B is reduced against the second earner’s income ty a rate of 20% on incomes over $5,329 pa.
The combined max weekly tax credits for the 1 child family are: $187.73 if child is under 5; $164.56 if aged 5-12 and $191.66 if aged 16+. In addition there is a newborn supplement for those not getting PPL. This is in the form of a maximum increase to Family Tax Benefit Part A of $2,056.45 for the first child or $1,028.15 for other children.
Families on benefits have much more generous child tax credits because Australians have not been captured by the idea that you can use part of these as a work incentive. Table 11 shows that not only is the sole parent payment more generous, the tax credits for the first child if under 5 are twice as high in Australia. All newborns also get significant extra help. There is a $2056 per annum bonus ($39.50 per week) for the first child, and $1056 for subsequent newborns.
While there are many strengths in the Australian system, sole parents are forced onto a jobseeker benefit when the youngest child is aged 8. New Zealand is heading in that direction with parents being moved onto Jobseeker Support when the age of the youngest child is 14. The Australian 2014 budget further reduced the assistance for children, but not in the discriminatory direction that New Zealand has taken. Table 12 contrasts the 1 child under 5 treatment in both countries.
Table 1. Sole parent on benefit with 1 child under 5: New Zealand and Australia 2014
2014 NetSole parent benefit
WeeklyChild tax credits-1 child
Total weeklySole parent+
1 child
Australia $A $357 $188 ( one child under 5)($228 if child under 1)
$545($585 if child under 1 year)
New Zealand $NZ $299 $92 (no extra for first year)
$391( no extra for first year)
Compounding this gap is the lower tax payable on low incomes including the effect of GST. The Australian income tax system is far more generous to families and GST is still only 10% and exempts basic items. Even recent budget changes in Australia have only impacted minimally, focusing on freezing the upper income threshold of A$150,000 as the cut out point for some payments. Nevertheless current policy directions under the Abbott government suggest that future generosity is in doubt.
128
Concluding comments and recommendationsIn the publications that form Our children, our choice, we have focussed on the core areas of child poverty and health, early childhood care and education, compulsory education, housing, and incomes. We have urged a shift in Government policy to a child-centred future. Current focus on ‘work’ meaning ‘paid employment’ as the answer to all our social and economic problems is backward-looking, and the past cannot be undone. The future of this country depends on the capability of our children, and their capability depends on the choices we make to provide for them.
The future of this land depends on our choices as individuals, families, whanau, communities, and neighbourhoods; and on the local and national governing bodies we elect. We offer these Recommendations, and urge you to consider them. We offer them also to the incoming Government, to be elected on 20 September 2014.
The arguments for adopting these Recommendations are clear. Our choices determine the possible and probable futures for our children.
Introduction: Recommendations1. Government to put children’s rights and needs at the centre of policy.
2. Government to introduce an interest rate cap on consumer credit.
Part one. Child health and poverty: Recommendations1. Government to design a comprehensive plan to reduce child poverty that includes actions,
targets, measurable outcomes and regular reporting requirements.
2. To improve the outcomes for children in poverty healthcare should provide universal services and targeted extra services based on assessment of further need.
3. Increase health funding for children to a level that achieves equal child health outcomes for all ethnic groups.
4. Effective and universal antenatal care/maternity services to be provided that include national targets and ensure all pregnant women are enrolled with maternity services as early as possible in their pregnancy.
5. Develop and share across all health service providers a universal common assessment plan and pathway for all children starting antenatally; including universal enrolment at birth with primary care, national immunisation register, well child /tamariki ora providers and dental provider.
6. Primary health care services are free for all children from maternity through to age 18, including general practice services, prescriptions, dental and optometry care.
7. Develop and fund programmes to ensure all homes are adequately insulated over the next decade; and develop a ten year national plan to overcome the shortage of affordable housing.
8. Develop a national child nutrition strategy, including a ‘food in schools’ programme.
9. Establish youth-friendly health and social services in all low decile secondary schools, with sustained Government funding.
129
Part two. Early childhood care and education and child poverty: Recommendations1. Require all staff in centre-based, teacher-led services who are counted in the teacher: child ratio
to be qualified, registered teachers.
2. The Ministry of Education and ERO work together to ensure provision of high quality, culturally and linguistically responsive ECCE services, with particular emphasis on quality for infants and toddlers; EDUCANZ must ensure that students graduating from Initial Teacher Education programmes have the knowledge, competence and dispositions to implement and sustain high quality provision for all children.
3. Policies be generated and resources made available to oversee the enhancement of te reo Māori and Pacific Islands communities’ languages and cultures within the ECCE sector.
4. Culturally attentive ECCE services be resourced to serve as community hubs, providing integrated responses to local needs.
5. Increase the ratios of adults to children for infants and toddlers, and provide clear recommendations and guidance regarding appropriate group size.
6. Government acknowledge the hidden costs of attendance at ECCE and subsidise or fund low income families to enable timely, equitable access to quality ECCE services.
7. Government ends the discriminatory policy of enforcing compulsory ECCE participation for individual beneficiary families and children who are already struggling with multiple challenges, not least of which is poverty.
8. The Ministry of Education develop and implement a strategic plan to ensure equitable nationwide provision of high-quality, culturally responsive, inclusive ECCE programmes for all children.
9. The Ministry of Education provide clear expectations for the extent and nature of supervision of home-based carers, and the Education Review Office be resourced to undertake careful monitoring of the quality of home-based ECCE provision.
10. The Ministry of Education require all home-based educarers to be either qualified teachers, or to attend and complete a required set of professional learning opportunities for home-based provision, which could be offered as modules toward an NZQA certificate in home-based ECCE.
Part three. Compulsory schooling and child poverty: Recommendations1. Develop culturally appropriate measures of new entrant children’s cognitive, affective,
behavioural and developmental needs. Use the data to inform decile related school funding allocation decisions.
2. Abandon National Standards because they seem ineffective while disadvantaging poor children’s learning and teaching in low decile schools.
3. Provide a 100% government subsidy in all decile 1-4 secondary schools for NCEA and scholarship examination fees; and provide NCEA subject pathway guidance to tertiary study on entry to secondary school.
4. Provide free breakfast and lunch in decile 1-4 schools.
5. Make all decile 1-4 schools community hubs with a single governance board to cover the integrated provision in the local community of education, health, parenting, budgeting, community
130
law and social services.
6. Provide before and after school and holiday clubs at all decile 1-4 schools.
7. Affirm entitlement to free state education until the age of 18 for all students and encourage diversity of free vocational education pathways.
8. Reduce class sizes in all decile 1-4 primary schools (if necessary by proportionately increasing class sizes in decile 8-10 schools) and provide salary incentives to encourage the best teachers to teach in these schools.
9. Use the Investing in Success funding to build collaborative school and teacher clusters across the socio-economic spectrum.
10. Retain the decile funding system principles, based on need and equality of outcome.
Part four. Housing market changes and their impact on children: Recommendations1. Government develops a national housing plan which provides forecasts of future housing
needs, programmes for addressing these needs and the budgets necessary to complete these programmes.
2. Based on the national housing plan and on the current shortage of social housing, the Government commits to building an additional 1,000 social housing units per year either in the state or non-state sectors, and in areas of high need.
3. Prioritise access to social housing for households with children in certain regions, including the Counties-Manukau District Health Board region, on the basis of their higher risk of rheumatic fever.
4. A housing warrant of fitness for all rental properties be put in place within five years to ensure that all rental properties meet acceptable health and living standards.
5. Government provides adequate subsidies to landlords to insulate their houses as a means of improving the living conditions of tenants.
6. The Accommodation Supplement be reviewed urgently with the aim of better integration of housing assistance into overall family income support and with a view to reducing complexity and high abatement rates and to improving housing affordability.
Part five. Adequate incomes to address child poverty: Recommendations1. Increase the minimum wage and address the extra needs of children in low income families
through well-supported benefits and tax credits.
2. Review social welfare benefits for adequacy and then in future adjust on the basis of relationship to the average wage as is the age pension, New Zealand Superannuation.
3. Abolish sanctions which reduce the income of beneficiary families with dependent children.
4. Undertake and publish independent research on the extent of sanctions and their effects on children.
5. Adjust all parts of Working For Families annually for inflation, and introduced a link to wages. Immediately reverse policies to reduce the threshold and increase the rate of abatement.
6. Abolish the Minimum Family Tax Credit and establish and adequate sole parent payment with better abatement provisions.
131
7. Overhaul the treatment of couples on benefits so that their children have a better chance to enjoy adequate income.
8. Restore the principle of equal treatment for all low income children: add the In Work Tax Credit to the first child Family Tax Credit and make adjustments for larger families
9. Increase the Parental Tax Credit and extend it to all low-income families with newborns that do not benefit from Paid Parental Leave.
10. Act urgently to gain cross party support for an overhaul of all parts of the welfare and tax credit system that affect families with children.

Our children, our choice: priorities for policy. ISBN: 978-0-9941105-5-8© September 2014Child Poverty Action Group Inc.PO Box 5611 Wellesley StAuckland 1141 New Zealandwww.cpag.org.nz