Reproductive constraints influence habitat accessibility ...
24
RESEARCH Open Access Reproductive constraints influence habitat accessibility, segregation, and preference of sympatric albatross species Michelle A. Kappes 1,4* , Scott A. Shaffer 1,5 , Yann Tremblay 1,6 , David G. Foley 2,3 , Daniel M. Palacios 2,3 , Steven J. Bograd 2 and Daniel P. Costa 1 Abstract Background: The spatiotemporal distribution of animals is dependent on a suite of factors, including the distribution of resources, interactions within and between species, physiological limitations, and requirements for reproduction, dispersal, or migration. During breeding, reproductive constraints play a major role in the distribution and behavior of central place foragers, such as pelagic seabirds. We examined the foraging behavior and marine habitat selection of Laysan (Phoebastria immutabilis) and black-footed (P. nigripes) albatrosses throughout their eight month breeding cycle at Tern Island, Northwest Hawaiian Islands to evaluate how variable constraints of breeding influenced habitat availability and foraging decisions. We used satellite tracking and light-based geolocation to determine foraging locations of individuals, and applied a biologically realistic null usage model to generate control locations and model habitat preference under a case–control design. Remotely sensed oceanographic data were used to characterize albatross habitats in the North Pacific. Results: Individuals of both species ranged significantly farther and for longer durations during incubation and chick-rearing compared to the brooding period. Interspecific segregation of core foraging areas was observed during incubation and chick-rearing, but not during brooding. At-sea activity patterns were most similar between species during brooding; neither species altered foraging effort to compensate for presumed low prey availability and high energy demands during this stage. Habitat selection during long-ranging movements was most strongly associated with sea surface temperature for both species, with a preference for cooler ocean temperatures compared to overall availability. During brooding, lower explanatory power of habitat models was likely related to the narrow range of ocean temperatures available for selection. Conclusions: Laysan and black-footed albatrosses differ from other albatross species in that they breed in an oligotrophic marine environment. During incubation and chick-rearing, they travel to cooler, more productive waters, but are restricted to the low-productivity environment near the colony during brooding, when energy requirements are greatest. Compared to other albatross species, Laysan and black-footed albatrosses spend a greater proportion of time in flight when foraging, especially during the brooding period; this strategy may be adaptive for locating dispersed prey in an oligotrophic environment. Keywords: Laysan albatross, Black-footed albatross, Foraging behavior, Activity patterns, Spatial segregation, Habitat selection, Satellite tracking, Geolocation, Spatial modeling * Correspondence: [email protected] 1 Department of Ecology and Evolutionary Biology, University of California Santa Cruz, 100 Shaffer Road, Santa Cruz, California 95060, USA 4 Present address: Department of Fisheries and Wildlife, Oregon State University, 104 Nash Hall, Corvallis, Oregon 97331, USA Full list of author information is available at the end of the article © 2015 Kappes et al. Open Access This article is distributed under the terms of the Creative Commons Attribution 4.0 International License (http://creativecommons.org/licenses/by/4.0/), which permits unrestricted use, distribution, and reproduction in any medium, provided you give appropriate credit to the original author(s) and the source, provide a link to the Creative Commons license, and indicate if changes were made. The Creative Commons Public Domain Dedication waiver (http://creativecommons.org/publicdomain/zero/1.0/) applies to the data made available in this article, unless otherwise stated. Kappes et al. Movement Ecology (2015) 3:34 DOI 10.1186/s40462-015-0063-4
Transcript of Reproductive constraints influence habitat accessibility ...

RESEARCH Open Access
Reproductive constraints influence habitataccessibility, segregation, and preference ofsympatric albatross speciesMichelle A. Kappes1,4*, Scott A. Shaffer1,5, Yann Tremblay1,6, David G. Foley2,3, Daniel M. Palacios2,3,Steven J. Bograd2 and Daniel P. Costa1
Abstract
Background: The spatiotemporal distribution of animals is dependent on a suite of factors, including the distributionof resources, interactions within and between species, physiological limitations, and requirements for reproduction,dispersal, or migration. During breeding, reproductive constraints play a major role in the distribution and behavior ofcentral place foragers, such as pelagic seabirds. We examined the foraging behavior and marine habitat selection ofLaysan (Phoebastria immutabilis) and black-footed (P. nigripes) albatrosses throughout their eight month breeding cycleat Tern Island, Northwest Hawaiian Islands to evaluate how variable constraints of breeding influenced habitatavailability and foraging decisions. We used satellite tracking and light-based geolocation to determine foraging locationsof individuals, and applied a biologically realistic null usage model to generate control locations and model habitatpreference under a case–control design. Remotely sensed oceanographic data were used to characterizealbatross habitats in the North Pacific.
Results: Individuals of both species ranged significantly farther and for longer durations during incubationand chick-rearing compared to the brooding period. Interspecific segregation of core foraging areas wasobserved during incubation and chick-rearing, but not during brooding. At-sea activity patterns were mostsimilar between species during brooding; neither species altered foraging effort to compensate for presumedlow prey availability and high energy demands during this stage. Habitat selection during long-rangingmovements was most strongly associated with sea surface temperature for both species, with a preferencefor cooler ocean temperatures compared to overall availability. During brooding, lower explanatory power ofhabitat models was likely related to the narrow range of ocean temperatures available for selection.
Conclusions: Laysan and black-footed albatrosses differ from other albatross species in that they breed in anoligotrophic marine environment. During incubation and chick-rearing, they travel to cooler, more productivewaters, but are restricted to the low-productivity environment near the colony during brooding, when energyrequirements are greatest. Compared to other albatross species, Laysan and black-footed albatrosses spend agreater proportion of time in flight when foraging, especially during the brooding period; this strategy maybe adaptive for locating dispersed prey in an oligotrophic environment.
Keywords: Laysan albatross, Black-footed albatross, Foraging behavior, Activity patterns, Spatial segregation,Habitat selection, Satellite tracking, Geolocation, Spatial modeling
* Correspondence: [email protected] of Ecology and Evolutionary Biology, University of CaliforniaSanta Cruz, 100 Shaffer Road, Santa Cruz, California 95060, USA4Present address: Department of Fisheries and Wildlife, Oregon StateUniversity, 104 Nash Hall, Corvallis, Oregon 97331, USAFull list of author information is available at the end of the article
© 2015 Kappes et al. Open Access This article is distributed under the terms of the Creative Commons Attribution 4.0International License (http://creativecommons.org/licenses/by/4.0/), which permits unrestricted use, distribution, andreproduction in any medium, provided you give appropriate credit to the original author(s) and the source, provide a link tothe Creative Commons license, and indicate if changes were made. The Creative Commons Public Domain Dedication waiver(http://creativecommons.org/publicdomain/zero/1.0/) applies to the data made available in this article, unless otherwise stated.
Kappes et al. Movement Ecology (2015) 3:34 DOI 10.1186/s40462-015-0063-4
BackgroundTo maximize fitness, animals can optimize energy acqui-sition through the selection of favorable habitats [1–4].Foraging habitat use is constrained not only by the dis-tribution of resources, but also by the physiological cap-abilities of the animal, memory and learned behaviors,intra- and interspecific interactions, and requirementsfor activities other than foraging, such as reproductionor migration [5–11].Central place foragers, animals constrained by the
need to return to a particular place (e.g., breeding col-ony) after a foraging trip, have a limited window of time,and therefore space, in which to search for and obtainfood [12, 13]. Marine species that forage at sea whileconducting breeding activities on land exemplify this be-havior. The proximity of suitable foraging habitat tobreeding sites has profound implications for behavior,habitat use, and energetics of central place foragers[14–20]. The extent to which marine animals are con-strained in this context can depend on the particularstage of reproduction, especially when coupled withtemporally changing energetic demands of offspring[15, 18, 21–24].Albatrosses are pelagic seabirds that exhibit three distinct
reproductive stages: (1) the incubation period (parentsalternate between fasting at the nest to incubate the egg,and foraging at sea); (2) the brooding period (breedingpairs alternate between fasting at the nest to brood andprovision the chick, and foraging at sea); and (3) the chick-rearing stage (breeding pairs forage independently at sea,returning to the nest periodically to quickly provision thechick). Differing energetic demands during these repro-ductive stages [18, 21, 25] constrain the duration and rangeof foraging movements, and ultimately influence the acces-sibility of foraging habitats to breeding adults [20, 26–29].Habitat accessibility is additionally influenced by spatio-temporal variation in the distribution of preferred marinehabitats e.g., [30–32].Laysan (Phoebastria immutabilis) and black-footed
(P. nigripes) albatrosses are long-ranging pelagic sea-birds of the North Pacific that breed primarily in thewarm, oligotrophic marine environment of the NorthwestHawaiian Islands [33, 34]. This is in contrast to other alba-tross species that nest in closer proximity to more pro-ductive marine habitats, such as subtropical and polarconvergences, continental shelf-breaks and slopes, andcoastal upwelling zones [35, 36]. Albatrosses use energet-ically efficient gliding flight to make long distancemovements, allowing Laysan and black-footed alba-trosses to travel to more productive habitats of theNorth Pacific during the incubation and chick-rearingstages [28, 29, 32]. During brooding, however, theyare restricted to the oligotrophic waters close to theirbreeding colonies, where prey abundance is likely
lower [37, 38]. Even the equatorially nesting waved al-batross (Phoebastria irrorata) has access to higherproductivity waters during brooding due to the closeproximity of the Humboldt Current, equatorial fronts,and localized upwelling [39].According to a model developed by Ricklefs [21], pela-
gic seabirds expend more energy per day during brood-ing than incubation or chick-rearing. This is due to thefact that brooding adults fast while providing the dailyneeds of the rapidly-growing chick, whereas chick-rearing adults provide half of the chick’s daily energy re-quirements and do not need to fast [40]. In the wander-ing albatross (Diomedea exulans), individuals respond byexpending more energy while foraging during broodingcompared to incubation [18], which allows them tomaximize the rate of energy delivery to chicks duringthis time-limited breeding stage [18, 41]. It has beensuggested that some albatrosses may couple the high en-ergetic demands of the brooding period with seasonalincreases in prey abundance [15], however, it is un-known how Hawaiian albatrosses locate sufficient preyresources to meet these high energetic demands whenforaging in a low-productivity environment. Other toppredators that make use of oligotrophic environmentsmay exhibit lower abundances in the least productivewaters or use low-productivity waters primarily forbreeding, rather than feeding, activities [42–44].Both Laysan and black-footed albatrosses are known
to extensively use an oceanic region known as theNorth Pacific Transition Zone (NPTZ) when makinglong-ranging movements [28, 29, 32]. The NPTZ isbounded by the eastward flowing currents of the sub-tropical and subarctic gyres [45], and exhibits a sharpmeridional transition in surface phytoplankton chloro-phyll-a concentration, a feature known as the TransitionZone Chlorophyll Front [TZCF; [46]. The dynamics of thefront act to aggregate phytoplankton and particulatematter, attracting mobile organisms; because zooplanktonand other actively swimming or buoyant organisms canmaintain their position in the front, the resulting prey ag-gregation serves to attract higher-trophic-level predators[46–49]. The latitudinal positional of the TZCF fluctuateson seasonal, interannual, and decadal time scales [50]; thisspatiotemporal variation alters the distribution of marinehabitats used by Hawaiian albatrosses and their proximityto breeding colonies. Expansion of oligotrophic habitat inthe subtropical gyre of the North Pacific [51], as well aschanges to the positioning of the North Pacific Current[52] due to climate change, could have negative effects onLaysan and black-footed albatross populations if preferredhabitats become more distant from the colony during crit-ical portions of the breeding season.Here we examine the foraging behavior and habitat
preference of sympatrically nesting Hawaiian albatrosses
Kappes et al. Movement Ecology (2015) 3:34 Page 2 of 24

throughout the breeding cycle in order to evaluate howreproductive constraints impact foraging distribution,habitat segregation, at-sea activity patterns, and habitatpreference in the context of their oligotrophic breedingenvironment. Based on previous studies, we expectedthat foraging movements would be most constrainedduring the brooding period for both species and leastconstrained during the incubation and chick-rearing pe-riods [28, 29, 32]. We also expected to see the greatestoverlap in foraging distributions during brooding whenadults take shorter trips to frequently provision youngchicks [29]. We therefore hypothesized that activity pat-terns of Hawaiian albatrosses during brooding would dif-fer from the incubation and chick-rearing periods inresponse to (1) the need to maximize energy delivery torapidly-growing chicks, (2) the use of a low-productivityforaging environment, and (3) the greater potential forinter- and intraspecific competition due to contractionof foraging ranges. We also hypothesized that greater in-terspecific differences in activity patterns would be ob-served during brooding; divergent foraging strategiescould reduce competitive interactions between speciesdespite high overlap in foraging distributions. Finally, wehypothesized that each species would display consistentenvironmental associations in selecting habitats through-out the breeding season, but that reproductive con-straints and seasonal variation in marine habitats wouldinfluence the composition of utilized habitats during thedifferent breeding stages.
MethodsStudy area and tracking activitiesBreeding Laysan and black-footed albatrosses were stud-ied at Tern Island (23.87° N, 166.28° W), French FrigateShoals, Northwest Hawaiian Islands, during the incuba-tion, brooding, and chick-rearing periods. The
incubation period for both species lasts approximately60 days, beginning in mid-late November with the layingof a single egg and ending with the onset of hatching inlate January. The brooding period typically lasts 2–3weeks, until chicks are left alone at the nest in mid-February. The chick-rearing period lasts approximately4–5 months; after a period of fasting, chicks fledge inde-pendently in June and July [33, 34].We used a combination of satellite tracking and light-
level based geolocation to determine at-sea locations ofadult Hawaiian albatrosses throughout the reproductiveperiod. Satellite tags were used for short-term deploy-ments during incubation and brooding, whereas geolo-cation tags were used to obtain foraging positions duringchick-rearing, and to supplement data from the incuba-tion period. While geolocation tag deployments alsospanned the brooding period, the single position derivedper day by light-level based geolocation did not have suf-ficient resolution to accurately capture movements dur-ing brooding when average trip durations were 2–3 days(Table 1; satellite tags are accurate to <10 km [53]; geo-location tags are accurate to ~200 km [54]). Tracking ac-tivities were conducted during five consecutive breedingseasons, from 2002–03 through 2006–07; satellite trackswere obtained during the 2002–03 to 2005–06 seasonsand geolocation data were obtained during the 2003–04to 2006–07 seasons. Sex of tracked individuals was de-termined from blood samples [55]; for six individuals forwhich we did not obtain blood samples, sex was deter-mined by comparison of culmen lengths [28].
Satellite trackingOne hundred and forty-seven adult albatrosses (76Laysan and 71 black-footed) were equipped with sat-ellite platform terminal transmitters (30 g Pico-100,
Table 1 Summary characteristics (Mean ± SD) of Laysan and black-footed albatross foraging trips. To reduce the influence of individualstracked for multiple foraging trips, a single trip per individual was randomly-selected for each reproductive stage to includein the calculation of mean values
Species Incubation Brooding Chick-Rearing
Laysan albatross Number of individuals tracked 58 38 26
Total number of foraging trips 72 40 153
Trip duration (days) 17.6 ± 7.45 a,* 2.62 ± 0.76b 14.5 ± 3.91c
Maximum distance from colony (km) 2433 ± 837a 420 ± 266b 2489 ± 676a,*
Azimuth to most distant point from colony (°) 350 ± 26.5a,* 35.4 ± 64.5b 358 ± 32.4a,*
Black-footed albatross Number of individuals tracked 51 35 23
Total number of foraging trips 60 37 83
Trip duration (days) 13.3 ± 5.07a,* 2.67 ± 0.87b 14.4 ± 5.14a
Maximum distance from colony (km) 2045 ± 1035a 313 ± 144b 2883 ± 998c,*
Azimuth to most distant point from colony (°) 22.8 ± 32.5* 47.4 ± 65.7 31.9 ± 35*
Different lowercase letters indicate significant differences (P < 0.05) among reproductive stages; asterisks indicate significant differences between species
Kappes et al. Movement Ecology (2015) 3:34 Page 3 of 24
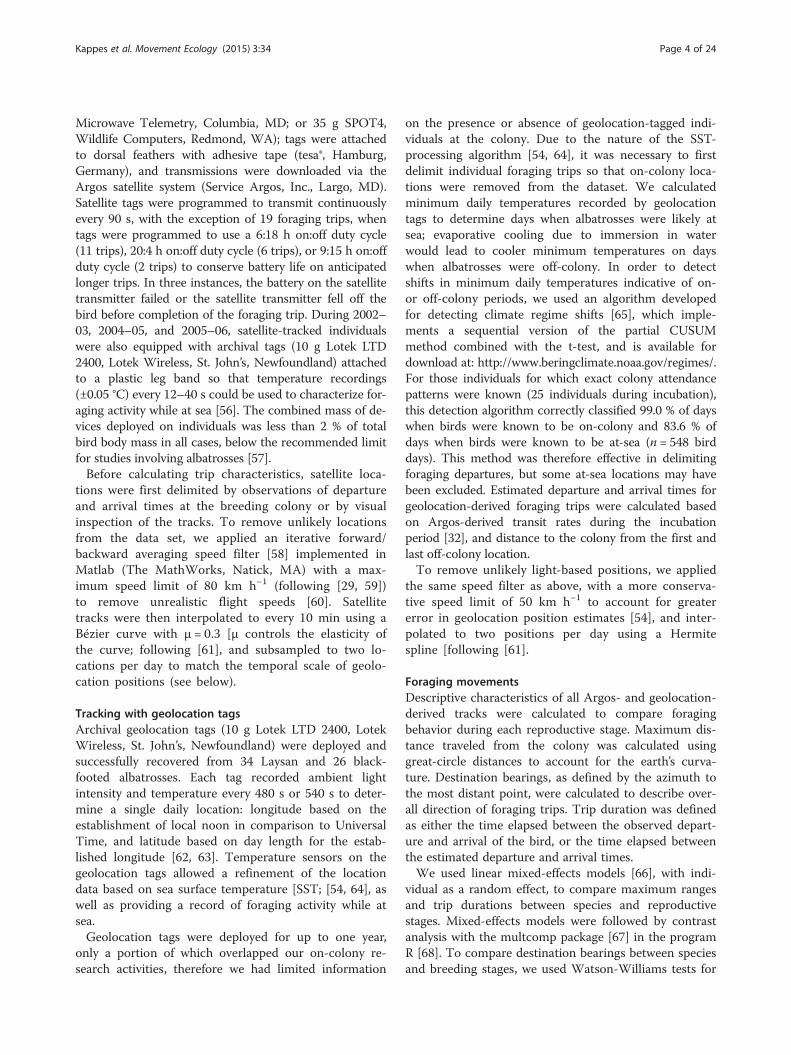
Microwave Telemetry, Columbia, MD; or 35 g SPOT4,Wildlife Computers, Redmond, WA); tags were attachedto dorsal feathers with adhesive tape (tesa®, Hamburg,Germany), and transmissions were downloaded via theArgos satellite system (Service Argos, Inc., Largo, MD).Satellite tags were programmed to transmit continuouslyevery 90 s, with the exception of 19 foraging trips, whentags were programmed to use a 6:18 h on:off duty cycle(11 trips), 20:4 h on:off duty cycle (6 trips), or 9:15 h on:offduty cycle (2 trips) to conserve battery life on anticipatedlonger trips. In three instances, the battery on the satellitetransmitter failed or the satellite transmitter fell off thebird before completion of the foraging trip. During 2002–03, 2004–05, and 2005–06, satellite-tracked individualswere also equipped with archival tags (10 g Lotek LTD2400, Lotek Wireless, St. John’s, Newfoundland) attachedto a plastic leg band so that temperature recordings(±0.05 °C) every 12–40 s could be used to characterize for-aging activity while at sea [56]. The combined mass of de-vices deployed on individuals was less than 2 % of totalbird body mass in all cases, below the recommended limitfor studies involving albatrosses [57].Before calculating trip characteristics, satellite loca-
tions were first delimited by observations of departureand arrival times at the breeding colony or by visualinspection of the tracks. To remove unlikely locationsfrom the data set, we applied an iterative forward/backward averaging speed filter [58] implemented inMatlab (The MathWorks, Natick, MA) with a max-imum speed limit of 80 km h−1 (following [29, 59])to remove unrealistic flight speeds [60]. Satellitetracks were then interpolated to every 10 min using aBézier curve with μ = 0.3 [μ controls the elasticity ofthe curve; following [61], and subsampled to two lo-cations per day to match the temporal scale of geolo-cation positions (see below).
Tracking with geolocation tagsArchival geolocation tags (10 g Lotek LTD 2400, LotekWireless, St. John’s, Newfoundland) were deployed andsuccessfully recovered from 34 Laysan and 26 black-footed albatrosses. Each tag recorded ambient lightintensity and temperature every 480 s or 540 s to deter-mine a single daily location: longitude based on theestablishment of local noon in comparison to UniversalTime, and latitude based on day length for the estab-lished longitude [62, 63]. Temperature sensors on thegeolocation tags allowed a refinement of the locationdata based on sea surface temperature [SST; [54, 64], aswell as providing a record of foraging activity while atsea.Geolocation tags were deployed for up to one year,
only a portion of which overlapped our on-colony re-search activities, therefore we had limited information
on the presence or absence of geolocation-tagged indi-viduals at the colony. Due to the nature of the SST-processing algorithm [54, 64], it was necessary to firstdelimit individual foraging trips so that on-colony loca-tions were removed from the dataset. We calculatedminimum daily temperatures recorded by geolocationtags to determine days when albatrosses were likely atsea; evaporative cooling due to immersion in waterwould lead to cooler minimum temperatures on dayswhen albatrosses were off-colony. In order to detectshifts in minimum daily temperatures indicative of on-or off-colony periods, we used an algorithm developedfor detecting climate regime shifts [65], which imple-ments a sequential version of the partial CUSUMmethod combined with the t-test, and is available fordownload at: http://www.beringclimate.noaa.gov/regimes/.For those individuals for which exact colony attendancepatterns were known (25 individuals during incubation),this detection algorithm correctly classified 99.0 % of dayswhen birds were known to be on-colony and 83.6 % ofdays when birds were known to be at-sea (n = 548 birddays). This method was therefore effective in delimitingforaging departures, but some at-sea locations may havebeen excluded. Estimated departure and arrival times forgeolocation-derived foraging trips were calculated basedon Argos-derived transit rates during the incubationperiod [32], and distance to the colony from the first andlast off-colony location.To remove unlikely light-based positions, we applied
the same speed filter as above, with a more conserva-tive speed limit of 50 km h−1 to account for greatererror in geolocation position estimates [54], and inter-polated to two positions per day using a Hermitespline [following [61].
Foraging movementsDescriptive characteristics of all Argos- and geolocation-derived tracks were calculated to compare foragingbehavior during each reproductive stage. Maximum dis-tance traveled from the colony was calculated usinggreat-circle distances to account for the earth’s curva-ture. Destination bearings, as defined by the azimuth tothe most distant point, were calculated to describe over-all direction of foraging trips. Trip duration was definedas either the time elapsed between the observed depart-ure and arrival of the bird, or the time elapsed betweenthe estimated departure and arrival times.We used linear mixed-effects models [66], with indi-
vidual as a random effect, to compare maximum rangesand trip durations between species and reproductivestages. Mixed-effects models were followed by contrastanalysis with the multcomp package [67] in the programR [68]. To compare destination bearings between speciesand breeding stages, we used Watson-Williams tests for
Kappes et al. Movement Ecology (2015) 3:34 Page 4 of 24

circular data in the CircStat toolbox in Matlab [69] afterensuring data followed the von Mises distribution(equivalent to normal distribution for circular data). Ac-counting for random effects has not been developed inthe circular statistics modeling framework, therefore werandomly selected a single trip for each individual dur-ing each reproductive stage for this analysis.
Foraging distributionTo determine patterns of interspecific habitat segrega-tion during each reproductive stage, we used kernel esti-mation [70] to determine utilization distributions (UD)for each species. Because individuals contributed varyingnumbers of foraging trips to the overall data set, a singletrip was randomly selected for each individual duringeach reproductive stage so that the influence of individ-ual behaviors on estimation of kernel densities was re-duced. Geographic coordinates of interpolated albatrosslocations were transformed using a Lambert CylindricalEqual Area projection [71], and UDs were computed ona 50-km grid using the R package adehabitat [72]. Toallow comparisons between species, the smoothing factor(h) was set to the mean of the h values calculated fromeach species, as determined using least-squares cross-validation [73]. We then employed a randomization ana-lysis to test the null hypotheses that there was no spatialsegregation in foraging distributions between speciesduring each reproductive stage [74]. For each com-parison, species was randomly assigned to tracksusing the same species ratio observed, and kernelanalysis applied. The area of overlap divided by thearea of the larger of the two UD polygons was usedas the test statistic following Breed et al. [74], for the25 % (core area), 50 % (focal region), and 95 % (for-aging range) UDs [29]. Each test was iterated 500times, and the P-value was calculated as the propor-tion of random overlaps smaller than the observedoverlap [74].
Activity patterns at seaWe determined the proportion of time albatrosses spentin flight and the frequency of landings on the sea surfaceduring daylight and nighttime hours to characterize for-aging activity patterns during each reproductive stageusing geolocation tags equipped with temperature sen-sors. Albatrosses are surface-feeders and, by necessity,must land on the sea surface in order to consume prey.Therefore, landing rates are indicative of the level offeeding effort. Flight costs measured for albatrosses havedemonstrated that the most energetically demanding ac-tivities albatrosses engage in at sea are take-offs andlandings [75]; landing rates were also highly correlatedwith field metabolic rates in a study of wandering alba-trosses [76].
For albatrosses equipped with temperature recorders,we implemented an algorithm (Iknos toolkit for Matlab;Y. Tremblay, unpublished) designed to identify landingsbased on rapid changes in temperature, and stable pe-riods associated with sitting on the sea surface [56]. Weused civil twilight (sun no more than 6° below thehorizon) to define daylight hours, based on temporally-matched tracking locations and NOAA’s solar calculator,as implemented in the maptools package in R [77] .To test whether percent time in flight and landing
rates differed between high-resolution temperature re-cords (12–40 s) and low-resolution records (480 s and540 s), we subsampled high resolution records to thelower resolution and compared these metrics. Whilepercent time in flight did not differ between high reso-lution and subsampled records (paired t-test: t140 = 1.11,P = 0.27), landing rates were significantly lower in thesubsampled group (paired t-test: t140 = 20.9, P < 0.0001).To compare all temperature records in subsequent ana-lyses (only low resolution records were available duringthe chick-rearing period), we used histogram matchingto rescale landing rates from low resolution records [78].Histogram matching is an image processing techniqueused to rescale lower resolution data so that the histo-gram of the data after transformation matches that ofthe reference data [79]. This allowed us to present land-ing rates comparable to values in the literature de-termined from high resolution temperature loggers;significance tests based on histogram-matched landingrates yielded the same conclusions as tests based onlanding rates from all the data subsampled to the lowestresolution available.Percent time in flight was arcsine transformed and
landing rate was log transformed prior to analysis tomeet normality assumptions. We used linear mixed-effects models [66] with individual as a random effect tocompare percent time in flight and landing rates be-tween species and reproductive stages, followed by con-trast analysis with the multcomp package in R [67].
Habitat preferenceWe followed the analytical framework of Aarts et al. [80]to model habitat preference of Laysan and black-footedalbatrosses during each stage of breeding. We adopted acase–control design such that each tracking location wastemporally matched with three randomly generated con-trol locations. Because breeding albatrosses are centralplace foragers, it is unrealistic to assume that all pointswithin the study area are equally accessible [80, 81].Therefore, we adopted a simple null model of usage thatassumes that the accessibility α [81] of a point in spaceis inversely related to the distance from the colony (dc)[82]. We assumed that locations were not accessible be-yond the maximum range observed for each breeding
Kappes et al. Movement Ecology (2015) 3:34 Page 5 of 24
stage for each species; control locations were thenquasi-randomly selected at a rate proportional to αwithin this range for each species-stage combination.Because this null model may over- or under-predicttrue accessibility, we also included dc as a candidatecovariate in our habitat preference models [83] assuggested by Aarts et al. [80].Laysan and black-footed albatrosses breeding at Tern Is-
land rarely made southward departures from the colony(Fig. 1); therefore we also modeled habitat preferenceusing a more restrictive null model of usage to reflect thenorthern bias of tracking locations (see Appendix A inAdditional file 1) and to ensure conclusions were not sen-sitive to the choice of null usage model. Final habitatmodels and response curves of selected covariates weregenerally similar irrespective of the null usage model (seeResults and Appendix A in Additional file 1), therefore wepresent only the results based on the simpler null usage
model, which assumed that locations were accessiblewithin the maximum range observed for each species-stage, regardless of the direction from the colony.This required fewer assumptions regarding accessibil-ity of habitats, and followed the implementation ofWakefield et al. [82].Habitat preference models were implemented using a
binomial distribution and logit link (the inverse of thelogistic function) to relate the response (tracking loca-tions, value of 1 (Fig. 1) and control locations, value of 0(Fig. 2)) to environmental covariates. Geolocation tracks(incubation and chick-rearing) were only included inhabitat analyses if they included at least five filtered off-colony locations, to ensure adequate coverage of sam-pled habitats along each track. We applied generalizedadditive mixed models (GAMMs) to allow for the possi-bility of a nonlinear response to environmental covari-ates [84], and to account for non-independence of
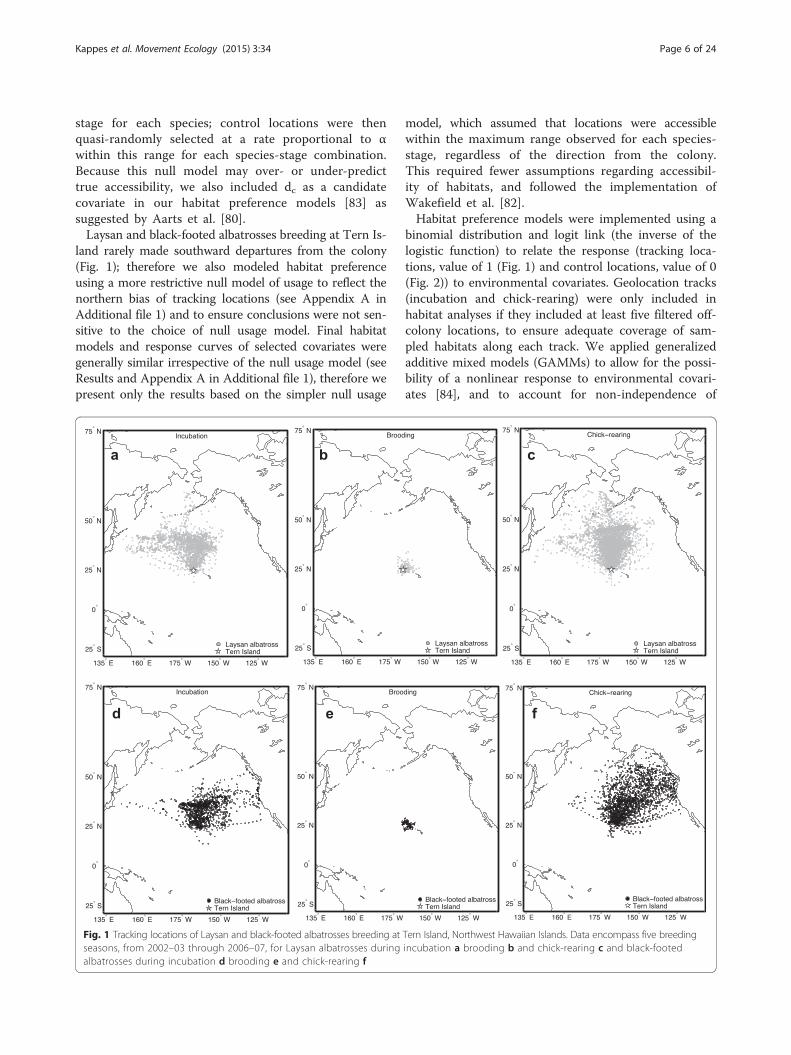
Fig. 1 Tracking locations of Laysan and black-footed albatrosses breeding at Tern Island, Northwest Hawaiian Islands. Data encompass five breedingseasons, from 2002–03 through 2006–07, for Laysan albatrosses during incubation a brooding b and chick-rearing c and black-footedalbatrosses during incubation d brooding e and chick-rearing f
Kappes et al. Movement Ecology (2015) 3:34 Page 6 of 24

points within trips and the variable number of trips con-tributed by each individual [85].
Environmental covariatesWe selected marine habitat variables based on theirpotential to characterize physical features that maystimulate or aggregate albatross prey resources. BecauseHawaiian albatrosses are surface-feeders foraging withinthe top meter of the water column, they rely on neu-stonic or vertically migrating prey, as well as on carrionand fisheries discards [33, 34, 86, 87]. Hawaiian alba-trosses consume a diverse array of prey items, withOmmastrephid squid and flying fish (Exocoetidae) eggscomprising the largest proportion of the Laysan andblack-footed albatross diet, respectively [86]. The diver-sity of prey types consumed by Hawaiian albatrossesreflects the variety of marine habitats encountered dur-ing their long-ranging movements; for instance, flyingfish eggs are likely unavailable to black-footed alba-trosses when foraging in the temperate waters of theCalifornia Current, where squid may be a larger compo-nent of their diet.Previous studies have demonstrated a relationship be-
tween catches of Ommastrephid squid and SST [88–90],productivity [91], and position relative to frontal featuresof the North Pacific Transition Zone (NPTZ) [90]. Areasof surface convergence, such as those found near frontsand eddies, can also aggregate algae or floating materialwhich many species of flying fish use to attach theirnon-buoyant eggs with sticky filaments [92, 93]. Adultflying fish, also prey of Hawaiian albatrosses [86], canbe found at the outer edges of rapidly rotating eddies[93, 94].The habitat relationships of these prey items informed
our selection of environmental parameters with which to
investigate albatross habitat use. We used SST and pri-mary productivity (PP) to characterize the regional ther-mal and phytoplankton production regimes; latitudinalgradients in SST and proximity to the Transition ZoneChlorophyll Front (TZCF) to describe large-scale frontalcharacteristics; wind stress curl to describe wind-drivenoceanic upwelling or downwelling; and sea surfaceheight anomaly (SSHa) and eddy kinetic energy (EKE) toinvestigate overall intensity of eddy activity [95–97]. Asalbatrosses use near-surface winds to engage in glidingflight [98], we also characterized wind speed and direc-tion for all locations used in the habitat analysis. BecauseHawaiian albatrosses periodically visit the continentalmargins of the western coast of North America and theAleutian Islands during breeding [28, 29, 32], and bathy-metric features can stimulate local production and ag-gregate prey [99, 100], we also used sea floor depth tocharacterize marine habitats; bathymetry data was ex-tracted from NOAA’s ETOPO2 data set (http://www.ngdc.noaa.gov/mgg/global/etopo2.html).Environmental data were obtained by querying the
NOAA OceanWatch Live Access Server using Matlaband ERDDAP (http://coastwatch.pfel.noaa.gov/erddap/).Where possible, we used satellite products with the fin-est temporal resolution available (daily or weekly); weused monthly composites when necessary to compensatefor data gaps due to cloud cover.We used a blended product of SST derived from both
microwave and infrared sensors carried on multiple plat-forms at a spatial resolution of 0.1 degrees and as a 5-daytemporal composite [101]. As SSTs in the central NorthPacific are distributed in broad latitudinal bands, latitu-dinal gradients in SST (dySST) were used to describefrontal structure [102], by computing the local derivativeof adjacent 0.1-degree pixels in the north–south direction.
Fig. 2 Randomly generated control locations selected at a rate proportional to accessibility. Maximum observed ranges of Laysan and black-footedalbatrosses during the incubation a brooding b and chick-rearing (c) periods were used to limit spatial extent of control locations
Kappes et al. Movement Ecology (2015) 3:34 Page 7 of 24

Monthly PP estimates [103] were derived at a spatialresolution of 0.1 degrees from monthly chlorophyll-avalues and photosynthetically available radiation ob-tained from the Sea-viewing Wide Field-of-view Sensor(SeaWiFS) on the Orbview-2 satellite, and SST valuesfrom the AVHRR Pathfinder Oceans Project.Monthly chlorophyll-a values obtained from SeaWiFS
were also used to calculate distance to the TZCF. Fol-lowing Polovina et al. [46] and Bograd et al. [50], theTZCF was defined as the 0.2 mg m−3 chlorophyll-acontour.Daily composites of wind velocity fields were gathered
by the SeaWinds scatterometer aboard NASA’s QuikS-CAT satellite at a resolution of 0.25 degrees and a refer-ence height of 10 m, and used to assign daily values ofwind speed and direction to each location.The NOAA CoastWatch West Coast Node also pro-
cesses wind vector fields to calculate wind stress curlfrom these data. We used wind stress curl as a metric ofsurface convergence/divergence [50], as a proxy for localaggregation of neustonic or buoyant prey (e.g., fish eggs,fish and squid larvae, zooplankton, fishing discards). Foreach location of interest, we calculated a mean windstress curl from the previous 30 days to get a representa-tion of past physical forcing in the area of interest.EKE was calculated from surface ocean currents de-
rived from four satellite altimeters (Jason-1, ENVISAT,ERS-1 and 2, and TOPEX/Poseidon) provided by theAVISO program at a resolution of 0.25 degrees. For eachlocation of interest, a 10 x 10-degree spatial mean wasremoved from each 7-day composite of zonal and merid-ional surface ocean currents to generate zonal and me-ridional velocity anomalies (u’ and v’). The EKE (per unitmass) was then calculated as
EKE ¼ 12
u02 þ v02� � ð1Þ
SSHa was derived from AVISO sea level data com-pared to the mean geoid as measured from 1993–1995.Oceanographic data were extracted so that composite
data matched closest in time to tag-derived locations(and matching control locations). The median value ofeach oceanographic variable was calculated for grid cellsfalling within the approximate error of Argos or geoloca-tion positions. To estimate error of Argos locations, weconducted trials on seven satellite tags affixed to per-manent structures at the University of California SantaCruz, Long Marine Lab, for a period of three weeks.Argos locations were then compared to GPS-derived lo-cations; mean error for all location qualities was 0.06°(6.7 km) from a total of 2,585 location fixes. To be con-servative, satellite tag-derived locations (and matchingcontrol locations) were extracted within a 0.15°(16.7 km) longitude by 0.15° (16.7 km) latitude grid
centered on each at-sea location. For geolocation-derived positions, data were extracted within a 1°(111 km) longitude by 2° (222 km) latitude grid centeredon each location [the approximate error of the geoloca-tion method; [54].
Model fitting and selectionWe modeled habitat preference for each species andbreeding stage considering the following candidate covari-ates: SST (°C), PP (mg C m-2.day−1), dySST (°C km−1),minimum distance to the TZCF (dTZCF; km), wind stresscurl (Pa m−1), SSHa (cm), EKE (cm2 s−2), wind speed(m s−1), wind direction (°), sea floor depth (m), anddc (km). EKE and PP were log-transformed to achievean even spread of covariate values, thus avoiding un-due leverage of a few high values [104]. To ensurethat there was not strong collinearity among parame-ters, we used generalized linear models with a bino-mial distribution and logit link to relate the responsevariable (presence/control) to all covariates, and cal-culated tolerance values (inverse of the variance infla-tion factor) for each species-stage; all tolerance valueswere greater than 0.1, the approximate guide sug-gested by Quinn and Keough [105].GAMMs were implemented within the gamm4 pack-
age in R [106]. All candidate covariates were fitted usingcubic regression splines; a cyclic spline was used tomodel wind direction. We first investigated the potentialeffects of transmitter duty-cycle and tag type (geoloca-tion versus satellite tracking), as well as year and sexeffects, by comparing intercept-only GAMMs for eachspecies and reproductive stage to models including eachof the above terms. In all cases, Akaike’s information cri-terion (AIC) values were not improved by the additionof these terms, therefore they were not subsequently in-cluded in models of habitat preference.To arrive at an inferential model for each species and
breeding stage, we used AIC as a guide, and relied oncluster-level cross-validation for final model selection[80]. This approach was taken due to the fact that modelselection based on AIC alone can lead to overparameter-ized models when data are spatially or temporally auto-correlated, as is expected with both tracking andoceanographic data [80]. Therefore, we randomly se-lected two-thirds of the individuals tracked during eachbreeding stage for each species to use in the first stageof model selection. We started with intercept-onlymodels and used forward model selection with AIC toarrive at a suite of candidate models for each species-stage. We then fit data from the remaining individuals tothe sequence of models obtained from forward selection.The model with the lowest AIC from the cross-validation step was retained as the inferential model. Toreduce the chance of over-fitting, we then replaced each
Kappes et al. Movement Ecology (2015) 3:34 Page 8 of 24

spline in turn by a linear term and selected a final infer-ential model for each species-stage based on AIC values.Candidate GAMMs were fit using maximum likelihoodto allow comparison of models with different fixed effectstructures [107]; final inferential models were fit usingrestricted maximum likelihood estimation [108]. Weused the proportion of the total deviance explained bythe model to assess goodness of fit [107], and the per-cent deviance contributed by each coefficient to assesshow much variability in the response could be explainedby each main effect [109].
ResultsForaging movementsBoth Laysan and black-footed albatrosses ranged signifi-cantly farther and were at sea for longer durations dur-ing incubation and chick-rearing, as compared to thebrooding period (P < 0.001 for all pair-wise tests; Table 1).Although the majority of foraging trips occurred in
pelagic waters of the North Pacific, Laysan and black-footed albatrosses regularly traveled to neritic environ-ments of the Aleutian islands and the western coast ofNorth America, respectively, especially during the chick-rearing period (Fig. 1). Black-footed albatrosses rangedfarther during chick-rearing, as compared to the incuba-tion period, while Laysan albatrosses had significantlylonger trip durations during incubation as compared tochick-rearing (Table 1). In both species there was agreater spread in the distribution of trip lengths and for-aging ranges during incubation and chick-rearing com-pared to brooding (Fig. 3a and b). Some overlap inforaging ranges and trip durations occurred during allthree stages, when individuals took shorter trips duringincubation and chick-rearing (Fig. 3a and b). Laysanalbatrosses changed destination bearings between repro-ductive stages, whereas black-footed albatrosses demon-strated consistency in direction of travel between stages(Table 1).
Fig. 3 Distribution of foraging ranges (a) and trip durations (b) of Laysan and black-footed albatrosses
Kappes et al. Movement Ecology (2015) 3:34 Page 9 of 24

Laysan albatrosses traveled for longer durations thanblack-footed albatrosses during the incubation period,however maximum distances did not differ between spe-cies during this stage (Table 1). Black-footed albatrossestraveled farther than Laysan albatrosses during chick-rearing, but species traveled similar distances duringbrooding. Azimuth to most distant point was signifi-cantly different between species during incubation andchick-rearing, with Laysan albatrosses demonstrating amore northerly distribution during incubation, andblack-footed albatrosses demonstrating a more easterlydistribution, especially during chick-rearing (Fig. 1;Table 1).
Foraging distributionBased on randomization tests of spatial overlap, Laysanand black-footed albatrosses demonstrated significantspatial segregation of focal (50 % UD) and core (25 %UD) foraging areas during incubation (focal: 64.7 %overlap, P = 0.014; core: 50.2 % overlap, P = 0.006) andchick-rearing (focal: 42.9 % overlap, P = 0.002; core:24.8 % overlap, P = 0.004), but not during brooding(focal: 74.2 % overlap, P = 0.32; core: 72.0 % overlap,P = 0.35; Fig. 4). Overall foraging ranges (95 % UD)demonstrated a different pattern; during incubation aswell as brooding, there was significant interspecificsegregation of foraging ranges (incubation: 54.3 %overlap, P = 0.002; brooding: 51.0 % overlap, P = 0.012),but no spatial segregation of foraging ranges during chick-rearing (68.6 % overlap, P = 0.14; Fig. 4).
Activity patterns at seaLaysan albatrosses spent a greater proportion of time inflight during brooding (85.2 %), as compared to the in-cubation (74.0 %) and chick-rearing periods (78.5 %;Table 2). This difference was reflected in both the per-cent time spent in flight during the day and at night(Table 2). Black-footed albatrosses did not vary in termsof the proportion of time in flight between reproductivestages (82.6 % overall); however, landing rates werehigher during chick-rearing (0.65 landings h−1) as com-pared to the incubation period (0.52 landings h−1;Table 2). This difference was accounted for by thegreater frequency of landings during the day duringchick-rearing (0.84 landings h−1) versus incubation (0.62landings h−1); there was no significant difference in land-ing rate at night between reproductive stages (0.46 land-ings h−1 overall). Laysan albatrosses did not demonstratedifferences in landing rate as a function of breedingstage (0.84 landings h−1 overall), either during the day(0.96 landings h−1 overall) or at night (0.72 landings h−1
overall).During incubation, black-footed albatrosses spent a
greater proportion of time in flight compared to Laysan
albatrosses (Table 2). Percent time in flight did not differbetween species during daylight hours; however, black-footed albatrosses spent more time in flight at night dur-ing incubation compared to Laysan albatrosses (Table 2).Laysan albatrosses landed on the sea surface more fre-quently on average than black-footed albatrosses duringincubation and chick-rearing. Laysan albatross landingrates during the day were more frequent than those ofblack-footed albatrosses during the incubation periodonly; landing rates at night were more frequent for
Fig. 4 Overlap of Laysan and black-footed albatross focal foragingareas (50 % UD) and foraging ranges (95 % UD). Contours for thea incubation, b brooding, and c chick-rearing periods are outlined indashed and solid lines for Laysan and black-footed albatrosses,respectively
Kappes et al. Movement Ecology (2015) 3:34 Page 10 of 24
Laysan albatrosses during all three breeding stages(Table 2).Both species demonstrated diel patterns in foraging
activity during all reproductive stages (Table 2). Laysanalbatrosses spent a higher proportion of time in flightduring the day than at night (incubation: t100 = 6.70,P < 0.0001; brooding: t74 = 3.51, P = 0.0008; chick-rearing:t50 = 5.10, P < 0.0001) and landed more frequently duringthe day (incubation: t100 = 3.08, P = 0.003; brooding: t74 =2.97, P = 0.004; chick-rearing: t50 = 3.83, P = 0.0004).Black-footed albatrosses demonstrated the same pattern;they spent more time in flight during the day (incubation:
t86 = 3.19, P = 0.002; brooding: t68 = 2.40, P = 0.02; chick-rearing: t44 = 4.43, P < 0.0001) and landed more frequentlyduring daylight than at night (incubation: t86 = 6.51,P < 0.0001; brooding: t68 = 4.90, P = 0.0008; chick-rearing: t44 = 6.06, P < 0.0001).
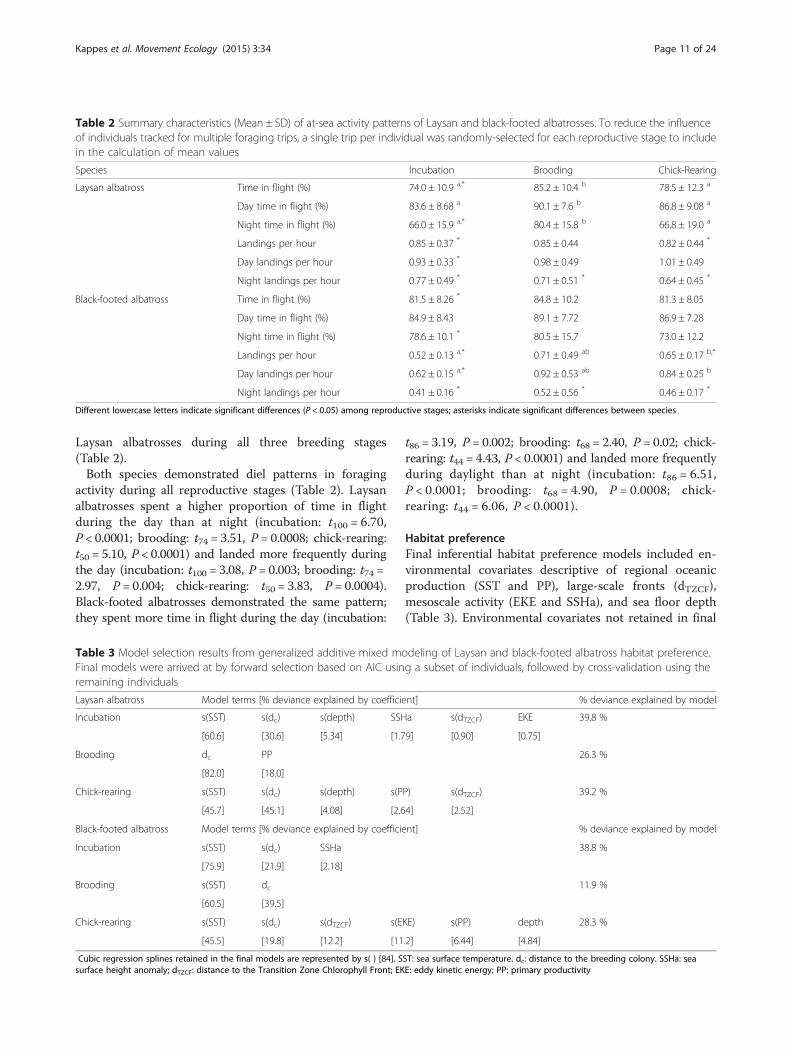
Habitat preferenceFinal inferential habitat preference models included en-vironmental covariates descriptive of regional oceanicproduction (SST and PP), large-scale fronts (dTZCF),mesoscale activity (EKE and SSHa), and sea floor depth(Table 3). Environmental covariates not retained in final
Table 2 Summary characteristics (Mean ± SD) of at-sea activity patterns of Laysan and black-footed albatrosses. To reduce the influenceof individuals tracked for multiple foraging trips, a single trip per individual was randomly-selected for each reproductive stage to includein the calculation of mean values
Species Incubation Brooding Chick-Rearing
Laysan albatross Time in flight (%) 74.0 ± 10.9 a,* 85.2 ± 10.4 b 78.5 ± 12.3 a
Day time in flight (%) 83.6 ± 8.68 a 90.1 ± 7.6 b 86.8 ± 9.08 a
Night time in flight (%) 66.0 ± 15.9 a,* 80.4 ± 15.8 b 66.8 ± 19.0 a
Landings per hour 0.85 ± 0.37 * 0.85 ± 0.44 0.82 ± 0.44 *
Day landings per hour 0.93 ± 0.33 * 0.98 ± 0.49 1.01 ± 0.49
Night landings per hour 0.77 ± 0.49 * 0.71 ± 0.51 * 0.64 ± 0.45 *
Black-footed albatross Time in flight (%) 81.5 ± 8.26 * 84.8 ± 10.2 81.3 ± 8.05
Day time in flight (%) 84.9 ± 8.43 89.1 ± 7.72 86.9 ± 7.28
Night time in flight (%) 78.6 ± 10.1 * 80.5 ± 15.7 73.0 ± 12.2
Landings per hour 0.52 ± 0.13 a,* 0.71 ± 0.49 ab 0.65 ± 0.17 b,*
Day landings per hour 0.62 ± 0.15 a,* 0.92 ± 0.53 ab 0.84 ± 0.25 b
Night landings per hour 0.41 ± 0.16 * 0.52 ± 0.56 * 0.46 ± 0.17 *
Different lowercase letters indicate significant differences (P < 0.05) among reproductive stages; asterisks indicate significant differences between species
Table 3 Model selection results from generalized additive mixed modeling of Laysan and black-footed albatross habitat preference.Final models were arrived at by forward selection based on AIC using a subset of individuals, followed by cross-validation using theremaining individuals
Laysan albatross Model terms [% deviance explained by coefficient] % deviance explained by model
Incubation s(SST) s(dc) s(depth) SSHa s(dTZCF) EKE 39.8 %
[60.6] [30.6] [5.34] [1.79] [0.90] [0.75]
Brooding dc PP 26.3 %
[82.0] [18.0]
Chick-rearing s(SST) s(dc) s(depth) s(PP) s(dTZCF) 39.2 %
[45.7] [45.1] [4.08] [2.64] [2.52]
Black-footed albatross Model terms [% deviance explained by coefficient] % deviance explained by model
Incubation s(SST) s(dc) SSHa 38.8 %
[75.9] [21.9] [2.18]
Brooding s(SST) dc 11.9 %
[60.5] [39.5]
Chick-rearing s(SST) s(dc) s(dTZCF) s(EKE) s(PP) depth 28.3 %
[45.5] [19.8] [12.2] [11.2] [6.44] [4.84]
Cubic regression splines retained in the final models are represented by s( ) [84]. SST: sea surface temperature. dc: distance to the breeding colony. SSHa: seasurface height anomaly; dTZCF: distance to the Transition Zone Chlorophyll Front; EKE: eddy kinetic energy; PP: primary productivity
Kappes et al. Movement Ecology (2015) 3:34 Page 11 of 24
models were: dySST, wind stress curl, and wind speed ordirection. SST was retained as a smooth term, and ex-plained the greatest proportion of explained deviance infinal habitat models selected for all reproductive stagesfor black-footed albatrosses, and during incubation andchick-rearing for Laysan albatrosses (46-76 %; Table 3).The range of accessible thermal habitats was consider-
ably wider during incubation and chick-rearing (~0-31 °C), as compared to brooding for both species (~15-26 °C; Fig. 5a and 6a). Laysan and black-footed albatrossesgenerally demonstrated a preference for cooler watertemperatures compared to availability (Fig. 5a and 6a),especially during incubation and chick-rearing. Duringthese two breeding stages, Laysan and black-footed alba-trosses demonstrated differing response curves betweenSST and habitat preference, after accounting for the ef-fects of other covariates in the final habitat models(Fig. 7a and c; Fig. 8a and c). Laysan albatross preferencewas highest at a broad range of cool water temperatures(~0-12 °C), decreasing steeply at temperatures greaterthan ~20 °C (Fig. 7a and c). Black-footed albatross habi-tat preference was highest at intermediate temperatures,peaking at ~14 °C during incubation and ~7 °C duringchick-rearing (Fig. 8a and c).All final habitat preference models included dc, which
was retained as a smooth term during incubation andchick-rearing, but as a linear term during brooding forboth species (Table 3). In all cases, dc had a negativeslope (Fig. 7 and 8), indicating that spatial use of for-aging locations decreased at a greater rate than 1/dc.Distance to the colony accounted for the greatest pro-portion of explained deviance in the final habitat modelfor Laysan albatrosses during brooding, and the secondgreatest proportion of explained deviance in all otherspecies-stages (20-82 %; Table 3). During incubation andchick-rearing, both Laysan and black-footed albatrossesdemonstrated a preference for habitats within ~2000 kmof the Tern Island colony (Fig. 7 and 8).For Laysan albatrosses during brooding, PP was the
only environmental covariate retained in the finalGAMM; Laysan albatrosses during this stage demon-strated a preference for more productive habitats(Fig. 7b), however, the slope of this relationship wasfairly shallow. Generally, a narrower range of primaryproduction was available to foraging albatrosses duringbrooding (~150-600 mg C m−2 day−1) as compared toincubation (~30-1000 mg C m−2 day−1) and chick-rearing; the most productive habitats were available dur-ing chick-rearing (~50-2000 mg C m−2 day−1; Fig. 5band 6b). During chick-rearing, PP was retained as asmooth term in the final habitat models for both species;preference was generally highest at intermediate levels(~350-1000 mg C m−2 day−1; Fig. 7c and Fig. 8c),although black-footed albatrosses preference also
increased at the highest productivity values (>1350 mg Cm−2 day−1; Fig. 8c).Laysan albatrosses during incubation and chick-rearing,
and black-footed albatrosses during chick-rearing, demon-strated a relationship between dTZCF and habitat prefer-ence (Table 3). Preference generally decreased afterdistances of ~2000-3000 km (Fig. 7a and c; Fig. 8c), indi-cating that this response may be related to the northerlybias in albatross tracking locations (Fig. 1) rather than atight association with the TZCF itself. The percent ex-plained deviance for this variable was generally low forLaysan albatrosses (<3 %), but explained 12.2 % of thedeviance in the final chick-rearing habitat model forblack-footed albatrosses (Table 3).EKE accounted for the next highest proportion of ex-
plained deviance in the black-footed albatross habitatmodel during chick-rearing (Table 3). Preference was forlower values of EKE (Fig. 8c), contrary to our expect-ation. EKE was also retained in the final model for Lay-san albatrosses during incubation, and demonstrated apositive slope (Fig. 7a), however, this term accounted fora very small proportion of explained deviance (0.75 %;Table 3). SSHa, another indicator of mesoscale activity,was retained in the final incubation models for both spe-cies, but accounted for a relatively small proportion ofexplained deviance (~2 %; Table 3); in both casespreference had a positive relationship with SSHa(Fig. 7a and 8a).Sea floor depth was retained as a smooth term in the
incubation and chick-rearing models for Laysan alba-trosses, and as a linear term in the chick-rearing modelfor black-footed albatrosses (Table 3). Black-footed alba-trosses demonstrated a general preference for shallowerwaters (Fig. 8c), whereas Laysan albatrosses demon-strated a u-shaped response, with a preference for boththe shallowest (<2000 m) and deepest habitats(>5000 m; Fig. 7a and c). Sea floor depth accounted for4-5 % of the explained deviance in final habitat modelsfor these species-stages (Table 3).
DiscussionForaging movementsTemporal changes in foraging behavior have been linkedto changing energetic demands of offspring in a varietyof central place foragers [23,24,110–112]. Consistentwith previous research, Laysan and black-footed alba-trosses spent more time at sea and ranged farther fromthe colony during incubation and chick-rearing thanduring brooding [26, 28, 29, 32]. Albatrosses have theability to make long-distance movements during thesebreeding stages due to the fasting capabilities of adults[incubation spans can last as long as 50 days; [113] andpost-guard chicks, which fast between intermittent feeds
Kappes et al. Movement Ecology (2015) 3:34 Page 12 of 24
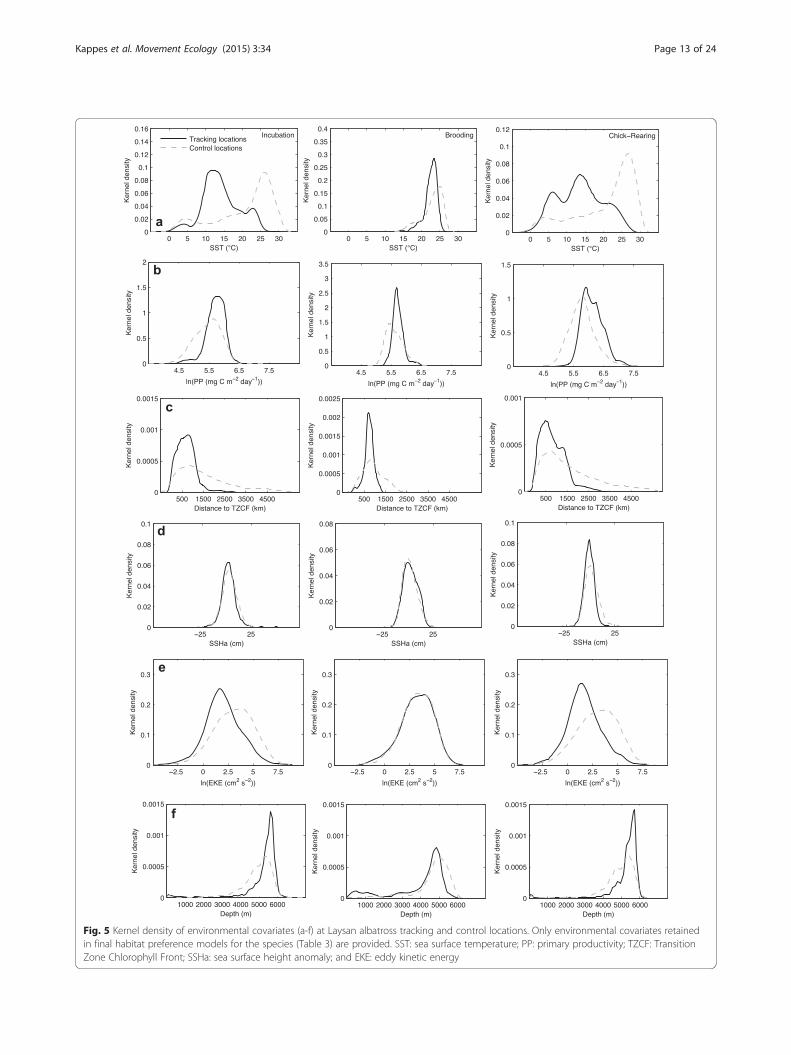
Fig. 5 Kernel density of environmental covariates (a-f) at Laysan albatross tracking and control locations. Only environmental covariates retainedin final habitat preference models for the species (Table 3) are provided. SST: sea surface temperature; PP: primary productivity; TZCF: TransitionZone Chlorophyll Front; SSHa: sea surface height anomaly; and EKE: eddy kinetic energy
Kappes et al. Movement Ecology (2015) 3:34 Page 13 of 24

Fig. 6 Kernel density of environmental covariates (a-f) at black-footed albatross tracking and control locations. Only environmental covariatesretained in final habitat preference models for the species (Table 3) are provided. SST: sea surface temperature; PP: primary productivity; TZCF:Transition Zone Chlorophyll Front; SSHa: sea surface height anomaly; and EKE: eddy kinetic energy
Kappes et al. Movement Ecology (2015) 3:34 Page 14 of 24

Fig. 7 (See legend on next page.)
Kappes et al. Movement Ecology (2015) 3:34 Page 15 of 24

[40]. During brooding, adults are limited to short tripswhen young chicks require frequent meals [21].When conducting long-ranging trips, Laysan alba-
trosses generally foraged at more northerly latitudescompared to black-footed albatrosses. Ommastrephidsquid, which comprise the largest proportion of the Lay-san albatross diet, also have a more northerly distribu-tion in the NPTZ compared to flying fishes [90], theeggs of which comprise the largest proportion of theblack-footed albatross diet [86]. During chick-rearing,black-footed albatrosses traveled farther north and eastthan during incubation, reaching greater distances thanLaysan albatrosses. The northward shift may be a re-sponse to seasonal changes in the distribution of preyassociated with the NPTZ [50]; the eastward shift islikely a response to prey aggregations associated withproductive coastal upwelling along the western coast ofNorth America during this time of year [114, 115]. Al-though flying fish eggs dominate the diet of black-footedalbatrosses during chick-rearing [86], we expect that thisreflects foraging events in subtropical waters, and thatsquid and other prey types would be consumed byblack-footed albatrosses foraging in the CaliforniaCurrent.
Interspecific habitat segregationWe found that Laysan and black-footed albatrosses dem-onstrated spatial segregation of core and focal foragingareas during the incubation and chick-rearing periods,which agrees with previous studies conducted duringboth the breeding [28, 29, 32] and non-breeding periods[116]; Shaffer et al., unpublished data]. However, habitatsegregation between sympatric species can vary depend-ing on reproductive stage, and the strength of these dif-ferences may be affected by prey availability, energeticconstraints, or changes in interspecific encounters[117–120]. During brooding, when reproductive con-straints restrict movements, overlap of core and focalforaging areas was greatest [see also [29]. Although our re-sults showed that overall foraging ranges (95 % UD) werespatially segregated during brooding, this was likely due toa few longer-distance trips made by Laysan albatrosses,reflected in the high variability of maximum distancesreached during brooding (Table 1).Greater dietary partitioning during brooding could
provide a means of reducing competitive interactionsdue to shared feeding areas. There is limited information,
however, on changes in diet throughout the reproductiveperiod in these species; in other albatross species, diet canchange considerably over the course of the breeding sea-son [121]. The most comprehensive dietary dataset forHawaiian albatrosses are mainly representative of thechick-rearing period and are not separated for each stage[86]. Other diet studies have focused on by-caught birdsin fisheries [87] or analysis of regurgitated pellets fromchicks during the rearing period only [122]. Comparisonof a limited number of chick diets from the broodingperiod suggests some dietary segregation during this stage;squid and fish were found more frequently in the diet ofLaysan albatross chicks, and flying fish eggs were foundmore frequently in the diet of black-footed albatrosschicks (M.A. Kappes, unpublished data).
Activity patterns at seaContrary to our expectation, neither species changed thefrequency of landings on the sea surface during thebrooding period to meet higher energy requirementsduring this stage. Although black-footed albatrosseslanded more frequently on average during brooding, dif-ferences were not statistically significant due to highvariability in landing rate during this stage (Table 2).Laysan albatrosses did, however, spend a greater propor-tion of time in flight during brooding as compared tothe incubation and chick-rearing periods. Weimerskirchet al. [123] suggests that periods of sustained movementin wandering albatrosses is an adaptation to locating dis-persed and unpredictable prey, a strategy which may berelevant to Hawaiian albatrosses foraging in a warm,oligotrophic environment during brooding.The brooding period is also when core foraging areas
of Laysan and black-footed albatrosses overlap the most,so species differences in timing of foraging activitiescould minimize competition for prey resources duringthis stage. It has been proposed that higher levels ofrhodopsin in the eyes of Laysan albatrosses make thembetter adapted to nocturnal feeding than black-footed al-batrosses [86]. Consistent with this idea, we found thatLaysan albatrosses landed more frequently at night thanblack-footed albatrosses during all breeding stages, butboth species actively foraged at night. Overall, there wasa bias towards foraging during daylight hours for bothspecies, which is supported by other studies [124, 125].During brooding, time in flight and daytime landingrates were similar between species, and although landing
(See figure on previous page.)Fig. 7 Effects of covariates in final GAMMs for Laysan albatrosses during incubation (a), brooding (b), and chick-rearing (c). The contribution ofeach retained covariate to the linear predictor is plotted on the scale of the link function (y-axes); the plots can therefore be interpreted aspopulation-level habitat preferences [80]. Dashed lines indicate approximate 95 % confidence intervals. GAMM: generalized additive mixed model;SST: sea surface temperature; SSHa: sea surface height anomaly; TZCF: Transition Zone Chlorophyll Front; EKE: eddy kinetic energy; and PP:primary productivity
Kappes et al. Movement Ecology (2015) 3:34 Page 16 of 24

Fig. 8 (See legend on next page.)
Kappes et al. Movement Ecology (2015) 3:34 Page 17 of 24

rates differed at night, this was the case during allbreeding stages. Therefore, we did not find evidencethat Laysan and black-footed albatrosses changedtheir behavior during brooding as a means of redu-cing competitive interactions when spatial overlap wasgreatest [126].Hawaiian albatrosses generally spend more time in
flight [74-91 %; current study, [124], particularly duringthe brooding period, than other albatross species [44-69 %; [127, 128]. This may be adaptive for foraging in anoligotrophic environment, where prey resources arelikely unpredictable [123]. Tropical seabirds that feed inlower productivity environments generally have a greaterflight proficiency to allow travel between dispersed preypatches [38]. Available research on energetics of Laysanalbatrosses does not suggest lower energy expenditurerates compared to other albatross species during the in-cubation period [129], however, a comparison to energyexpenditure rates during brooding could provide insightas to whether increased time in flight reduces energeticcosts when foraging in a low-productivity environment.
Habitat preferenceWe combined satellite tracking data with geolocationdata when modeling habitat preference, in order toobtain coverage of the entire breeding period. How-ever, this could lead to potential biases given the dif-ferent accuracies of each tag type (satellite tags areaccurate to <10 km [53]; geolocation tags are accurateto ~200 km [54]). To address this potential bias, weinvestigated the effects of tag type on habitat modelsby comparing intercept-only GAMMs for each speciesand reproductive stage to models including tag typeas a candidate variable. Because AIC values were notimproved by the addition of this term, differences intag accuracy should not have affected results of habi-tat preference modeling. We also did not find an ef-fect of gender on habitat preference, which agreeswith previous studies of these species [28, 29, 130].SST accounted for much of the variability in final habi-
tat models during incubation and chick-rearing, whenboth species preferentially selected cooler waters com-pared to availability. Similarly, when using a differenttechnique to model habitat use of Hawaiian albatrossesduring incubation, Kappes et al. [32] found that SST wasthe most important environmental variable related tofirst passage time [131], a measure of area-restricted
search [132]. Overall, black-footed albatrosses preferredslightly warmer marine habitats than Laysan albatrosses;this likely relates to differences in diet and spatial separ-ation of prey resources along the latitudinal SST gradientin the NPTZ [86, 90].We hypothesized that each species would use the same
environmental covariates to select habitats throughoutthe breeding season, but that reproductive constraintsand seasonal cycles in marine habitats would influencethe composition of utilized habitats. SST accounted forthe greatest proportion of variability in black-footed al-batross habitat models during all reproductive stagesand for Laysan albatross habitat models during incuba-tion and chick-rearing; however, SST was not retained inthe final habitat model for Laysan albatrosses duringbrooding. PP was the only environmental covariateretained in the brooding habitat model for Laysan alba-trosses, but the majority of variability in habitat prefer-ence was explained by dc. Both species demonstratedless distinct habitat preferences during brooding; prefer-ence increased only slightly with PP for Laysan alba-trosses, and black-footed albatrosses had a smaller peakin preference in relation to SST compared to incubationand chick-rearing. This reflects the narrower range ofenvironmental conditions available for selection duringbrooding, and helps explain why model goodness of fitwas lower during brooding than during other breedingstages (Table 3).Given the constraint of central place foraging during
all stages of breeding, we included dc as a candidate co-variate when modeling habitat preference. All final habi-tat models included dc, suggesting that accessibilitydecreased at a rate greater than 1/dc [80–82], and thatthe null usage model could be further refined. The inclu-sion of dc in final habitat models could also indicate apreference for resources closer to the colony that arenot linked to the covariates examined. Albatrosses usegliding flight on sea surface winds for locomotion [98],so an important consideration may be the effect of windon habitat accessibility [133–136]. Because Hawaiian al-batrosses tend to avoid facing headwinds during long-distance movements [137], accounting for differences inwind direction might improve the null usage model.Overall accessibility of habitats may be affected by pre-vailing winds, but the fact that wind variables were notretained in final habitat models suggests that Laysan andblack-footed albatrosses do not select foraging locations
(See figure on previous page.)Fig. 8 Effects of covariates in final GAMMs for black-footed albatrosses during incubation (a) brooding (b) and chick-rearing (c). The contributionof each retained covariate to the linear predictor is plotted on the scale of the link function (y-axes); the plots can therefore be interpreted aspopulation-level habitat preferences [80]. Dashed lines indicate approximate 95 % confidence intervals. GAMM: generalized additive mixed model;SST: sea surface temperature; SSHa: sea surface height anomaly; TZCF: Transition Zone Chlorophyll Front; EKE: eddy kinetic energy; and PP:primary productivity
Kappes et al. Movement Ecology (2015) 3:34 Page 18 of 24

based on wind conditions. Alternatively, wind variablesexamined may not sufficiently represent the complexmanner in which albatrosses use surface winds.Together, SST and dc accounted for most of the ex-
plained deviance in final habitat models for both species.For black-footed albatrosses during chick-rearing, dTZCFand EKE also accounted for considerable (>10 %) pro-portions of explained deviance. Habitat preference de-clined after distances of ~2000 km from the TZCF,indicating that this response may be related to thenortherly bias in tracking locations rather than a tightassociation with the TZCF itself. Although we expectedthat a higher degree of mesoscale activity would enhanceforaging opportunities, black-footed albatrosses pre-ferred habitats with lower EKE during chick-rearing.Their use of the pelagic northeast Pacific, a region ofrelatively low EKE [138], suggests that black-footed alba-trosses do not rely on prey associated with high eddy ac-tivity during the chick-rearing period; leatherback turtles(Dermochelys coriacea) in the North Pacific also demon-strate a negative relationship between habitat use andEKE [139]. However, low accuracy of geolocation datamay have limited our ability to detect responses tomesoscale activity.The environmental covariate with the greatest influ-
ence on habitat preference of Laysan and black-footedalbatrosses was SST. Sea floor depth, SSHa, PP, dTZCF,and EKE were also retained as covariates in final habitatmodels, however, these terms represented a smaller pro-portion of explained deviance. This suggests that afteraccounting for SST preference, the location of large-scale fronts (dTZCF), mesoscale activity (EKE and SSHa),and bathymetric domain do not have a strong influenceon habitat selection of Hawaiian albatrosses. Other en-vironmental covariates describing frontal characteristics(dySST) and wind-driven oceanic upwelling or down-welling (wind stress curl) were not retained in finalmodels, despite characterizing physical features or pro-cesses that could drive prey availability for Hawaiian
albatrosses [88–91,93]. Studies of other marine top preda-tors have also found the greatest behavioral responses toSST compared to other marine habitat variables (Simmonset al., 2007; Teo et al., 2007). Environmental covariates ex-amined might also be improved by incorporating time lags,as the response of prey resources may trail behind in-creases in productivity.
Breeding in an oligotrophic marine environmentLaysan and black-footed albatrosses differ from other al-batross species in that they breed in an oligotrophicmarine environment [140, 141]. They leave this environ-ment during incubation and chick-rearing to forage incooler, more northern waters, but are restricted to alow-productivity environment during brooding when en-ergy requirements are greatest [21]. For wanderingalbatrosses, the brooding period coincides with seasonalincreases in prey abundance in the Southern Ocean [15].Little is known about temporal variability of prey con-sumed by Laysan and black-footed albatrosses, but it hasbeen suggested that these species breed during winter tomatch peaks in prey abundance [142], or alternatively toavoid the period of maximum summer heat [113]. PPnear the Tern Island colony is lower during broodingcompared to the rest of the year (Fig. 9), so assuming PPis a good indicator of prey abundance, local prey re-sources may in fact be limited during the broodingperiod. Timing of breeding may instead be related to therelative proximity of preferred thermal habitats; the lati-tudinal position of the TZCF, and the cooler waters asso-ciated with it, are closest to the Tern Island colonyduring the brooding and early chick-rearing periods [50].Body mass of adult Laysan albatrosses declines
throughout the breeding season, from the start of the in-cubation period until the second half of the chick-rearing period [143]. This suggests a high cost of centralplace foraging from breeding sites in the HawaiianIslands; other albatross species do not demonstrateequivalent declines in adult mass during breeding
Fig. 9 Primary productivity (PP) near the Tern Island colony. Median monthly PP was calculated within the mean foraging range of Laysan andblack-footed albatrosses during brooding (370 km); brooding periods are indicated by solid lines at the bottom of the figure
Kappes et al. Movement Ecology (2015) 3:34 Page 19 of 24

[40, 144, 145]. The change to positive mass gain inmid-May may be related to seasonal increases in PPclose to the colony (Fig. 9) and the closer proximityof preferred habitats of the NPTZ at this time [50];the shorter commuting distance to preferred habitatscould help adults restore body condition.During chick-rearing, many Procellariform species al-
ternate between short foraging trips that maximize en-ergy delivery to young, with long trips that restore adultcondition [146, 147]; this is reflected in higher food de-livery rates after short trips compared to long trips[reviewed by [148]. Previous research has demonstratedthat Hawaiian albatrosses mix short and long trips dur-ing chick-rearing [28, 29], though we did not observestrong bimodality in foraging trip duration during thisstage (Fig. 3b). Contrary to expectation, Laysan alba-trosses fledge chicks in better condition when they per-form fewer short trips for every long trip during chick-rearing [149]. This suggests that shorter trips are lessprofitable, and that longer trips to preferred habitats ofthe NPTZ are required for successful chick-rearing. It isunclear, however, to what extent low food delivery ratesaffect chick survival. Along with food shortages, stormevents and nest desertion are common causes of chickmortality [150, 151].In addition to seasonal changes, the latitudinal pos-
ition of the TZCF varies interannually, particularly in re-sponse to El Niño-Southern Oscillation events [50].When the wintertime position of the TZCF is signifi-cantly north of its seasonal norm, Laysan and black-footed albatrosses experience dramatic breeding failures[152, 153]. Laysan albatrosses also demonstrate lower re-productive success and mass gains in years when theyrange farther and spend longer durations at sea [32].This suggests that changes in the proximity of preferredhabitats during breeding can lead to demographic effectsin these species. Changes in SST in the North Pacificdue to global climate change [154, 155] will likely haveconsiderable impacts on Hawaiian albatrosses, given theimportance of SST in foraging habitat selection. Inaddition, poleward shifts in westerly winds associatedwith climate change [156–158] may lead to changes inthe positioning of the North Pacific Current [52] and ac-cess to preferred habitats. In the Southern Ocean, thepoleward shift of the westerlies has positively affectedbreeding performance of wandering albatrosses, but acontinuing shift may make the location of breeding col-onies less optimal in the future [159]. A northward shiftin the positioning of the TZCF due to climate changecould have negative effects on Laysan and black-footedalbatross populations, if preferred habitats become moredistant from the colony during critical portions of thebreeding season. Comparisons among breeding locationswithin the Hawaiian islands would provide insight into
these interactions [160], particularly at Midway Atolland Laysan Island, where the greatest numbers of breed-ing pairs occur for both species [151].
ConclusionsFor central place foragers, the location of suitable breed-ing sites can have large effects on behavior and habitatuse. Because Hawaiian albatrosses breed in an oligo-trophic marine environment, they forage in lower-productivity waters than other albatross species duringthe energetically costly brooding period. They also spenda greater proportion of time in flight, a strategy that maybe adaptive for locating unpredictable food resources.Additional research on the foraging energetics of thesespecies could help resolve how Hawaiian albatrossesmeet energetic demands during brooding, when spatialoverlap between species is greatest and primary product-ivity near the colony is at an annual low. During incu-bation and chick-rearing, Laysan and black-footedalbatrosses make long distance movements north of thecolony, selecting cooler water temperatures and makinguse of the regionally productive NPTZ. A poleward shiftin the TZCF due to climate change could negativelyaffect Laysan and black-footed albatross populations,given breeding failures in years when the TZCF is shiftedsignificantly farther north. A comprehensive analysis ofHawaiian albatross foraging behavior and reproductivesuccess in relation to the position of the TZCF will benecessary to predict population-level effects of climatechange.
Availability of supporting dataThe tracking datasets supporting the results of this art-icle are available by request from the BirdLife TrackingOcean Wanderers database, [http://seabirdtracking.org].
Additional file
Additional file 1: Appendix A Laysan and black-footed albatrosshabitat preference modeling using an alternative null usage model.Habitat preference was modeled using a more restrictive null model ofusage to reflect the northern bias of tracking locations; for each species-stage, minimum convex polygons of tracking locations were used to limitthe southern extent of control locations, and maximum observed rangeswere used to limit the northern extent of control locations. (DOCX 25 kb)
Abbreviationsdc: Distance to the colony; dTZCF: Distance to the Transition Zone ChlorophyllFront; dySST: Latitudinal gradient in sea surface temperature; EKE: Eddykinetic energy; GAMM: Generalized additive mixed model; NPTZ: NorthPacific Transition Zone; PP: Primary productivity; SSHa: Sea surface heightanomaly; SST: Sea surface temperature; TZCF: Transition Zone ChlorophyllFront; UD: Utilization distribution.
Competing interestsThe authors declare that they have no competing interests.
Kappes et al. Movement Ecology (2015) 3:34 Page 20 of 24

Authors’ contributionsAll authors participated in the design of the study and contributed to thewriting of the manuscript. DC and SS conceived of and coordinated thestudy. MK and YT collected tracking data in the field. MK, DF, DP, and SBworked on acquisition and interpretation of ocean data and development ofhabitat models; MK performed statistical analyses. All authors read andapproved the final manuscript.
AcknowledgementsThe authors dedicate this manuscript to the memory of our colleague andfriend, David Foley. We thank Angela Anders, Jill Awkerman, Daniel Barton,Sarah Chisholm, Melinda Conners, Kirsten Lindquist, Frank Mayer, ScottSeganti, and many U.S. Fish and Wildlife Service volunteers for invaluableassistance in the field. We also thank the Hawaiian Islands National WildlifeRefuge, U.S. Fish and Wildlife Service, Department of the Interior, forpermission to conduct research on Tern Island and logistical support. LindsayYoung conducted the gender analysis. Alan Swithenbank and Steve Teoprovided the SST-correction algorithm for light-based geolocation data.Jason Matthiopoulos and Ewan Wakefield provided helpful suggestions fordefining accessibility and selecting control locations. SeaWiFS chlorophyll-aand photosynthetically available radiation were provided by NASA’s GoddardSpace Flight Center. QuikSCAT wind data were provided by NASA’s Jet Pro-pulsion Laboratory at the California Institute of Technology. Pathfinder SSTdata were obtained from NOAA’s National Oceanographic Data Center.AMSR-E SST data were obtained from Remote Sensing Systems Inc. GOESSST data were obtained from NOAA Satellites and Information. Sea surfaceheight anomaly data were obtained from AVISO/Centre National d’ÉtudesSpatiales, and ETOPO2 data from NOAA’s National Geophysical Data Center.This research was part of the Tagging of Pacific Pelagics (TOPP) program,funded in part by the National Ocean Partnership Program (N00014-02-1-1012), the Office of Naval Research (N00014-00-1-0880 & N00014-03-1-0651),the Gordon and Betty Moore, David and Lucille Packard, and Alfred P. SloanFoundations. M.A.K. was supported by a UCSC Regents Fellowship and Chan-cellor’s Dissertation-Year Fellowship, a Friends of Long Marine Lab ResearchAward, and a STEPS Institute Graduate Research Award. All protocols employedin this study were approved by the Institutional Animal Care and Use Committeesat UCSC. Henri Weimerskirch and Bruce Lyon provided thoughtful commentsand suggestions which helped improve the quality of this manuscript. M.A.K.dedicates this work to the memory of her father, Stanislav Antolos.
Author details1Department of Ecology and Evolutionary Biology, University of CaliforniaSanta Cruz, 100 Shaffer Road, Santa Cruz, California 95060, USA.2Environmental Research Division, Southwest Fisheries Science Center, NOAAFisheries, 1352 Lighthouse Avenue, Pacific Grove, California 93950, USA.3Joint Institute for Marine and Atmospheric Research, University of Hawai’i atManoa, 1000 Pope Road, Honolulu, Hawai’i 96822, USA. 4Present address:Department of Fisheries and Wildlife, Oregon State University, 104 Nash Hall,Corvallis, Oregon 97331, USA. 5Present address: Department of BiologicalSciences, San Jose State University, One Washington Square, San Jose,California 95192, USA. 6Present address: Institut pour la Recherche et leDéveloppement, UMR 212 IRD-IFREMER-UM2. Av Jean Monnet 34200, Sète,France.
Received: 1 December 2014 Accepted: 9 September 2015
References1. Emlen JM. The role of time and energy in food preference. Am Nat.
1966;100:611–7.2. MacArthur RH, Pianka ER. On optimal use of a patchy environment. Am Nat.
1966;100:603–9.3. Levins R. Evolution in changing environments: some theoretical
explorations. Princeton University Press: Princeton; 1968.4. Pyke GH. Optimal foraging theory: a critical review. Annu Rev Ecol Syst.
1984;15:523–75.5. Svärdson G. Competition and habitat selection in birds. Oikos. 1949;1:157–74.6. Charnov EL. Optimal foraging, the marginal value theorem. Theor Popul
Biol. 1976;9:129–36.7. Alerstam T, Högstedt G. Bird migration and reproduction in relation to
habitats for survival and breeding. Ornis Scand. 1982;13:25–37.
8. Kamil AC, Roitblat HL. The ecology of foraging behavior: implications foranimal learning and memory. Annu Rev Psychol. 1985;36:141–69.
9. Huey RB. Physiological consequences of habitat selection. Am Nat.1991;137:S91–S115.
10. Rosenzweig ML. Habitat selection and population interactions: the searchfor mechanism. Am Nat. 1991;137:S5–S28.
11. Morris DW. Toward an ecological synthesis: a case for habitat selection.Oecologia. 2003;136:1–13.
12. Orians GH, Pearson NE. On the theory of central place foraging. In: Horn DJ,Stairs GR, Mitchell RD, editors. Analysis of ecological systems. Columbus,Ohio: Ohio State University Press; 1979. p. 155–77.
13. Schoener TW. Generality of the size-distance relation in models of optimalfeeding. Am Nat. 1979;114:902–14.
14. Costa DP. The relationship between reproductive and foraging energeticsand the evolution of the Pinnipedia. Symp Zool Soc Lond. 1993;66:293–314.
15. Salamolard M, Weimerskirch H. Relationship between foraging effort andenergy requirement throughout the breeding season in the wanderingalbatross. Funct Ecol. 1993;7:643–52.
16. McCafferty DJ, Boyd IL, Walker TR, Taylor RI. Foraging responses of Antarctic furseals to changes in the marine environment. Mar Ecol Prog Ser. 1998;166:285–99.
17. Hochscheid S, Godley BJ, Broderick AC, Wilson RP. Reptilian diving: highlyvariable dive patterns in the green turtle Chelonia mydas. Mar Ecol Prog Ser.1999;185:101–12.
18. Shaffer SA, Costa DP, Weimerskirch H. Foraging effort in relation to theconstraints of reproduction in free-ranging albatrosses. Funct Ecol.2003;17:66–74.
19. Humphreys EM, Wanless S, Bryant DM. Stage-dependent foraging inbreeding black-legged kittiwakes Rissa tridactyla: distinguishing behaviouralresponses to intrinsic and extrinsic factors. J Avian Biol. 2006;37:436–46.
20. Boersma P, Rebstock G. Foraging distance affects reproductive success inMagellanic penguins. Mar Ecol Prog Ser. 2009;375:263–75.
21. Ricklefs RE. Some considerations on the reproductive energetics of pelagicseabirds. Stud Avian Biol. 1983;8:84–94.
22. Costa DP. Reproductive and foraging energetics of high latitude penguins,albatrosses and pinnipeds: implications for life history patterns. Am Zool.1991;31:111–30.
23. Costa DP, Gales NJ. Energetics of a benthic diver: seasonal foraging ecologyof the Australian sea lion, Neophoca cinerea. Ecol Monogr. 2003;73:27–43.
24. Beauplet G, Dubroca L, Guinet C, Cherel Y, Dabin W, Gagne C, et al.Foraging ecology of subantarctic fur seals Arctocephalus tropicalis breedingon Amsterdam Island: seasonal changes in relation to maternalcharacteristics and pup growth. Mar Ecol Prog Ser. 2004;273:211–25.
25. Shaffer SA. Annual energy budget and food requirements of breedingwandering albatrosses (Diomedea exulans). Polar Biol. 2004;27:253–6.
26. Weimerskirch H, Salamolard M, Sarrazin F, Jouventin P. Foraging strategy ofwandering albatrosses through the breeding season: a study using satellitetelemetry. Auk. 1993;110:325–42.
27. Guinet C, Koudil M, Bost C-A, Durbec JP, Georges JY, Mouchot MC, et al.Foraging behaviour of satellite-tracked king penguins in relation to sea-surface temperatures obtained by satellite telemetry at Crozet Archipelago,a study during three austral summers. Mar Ecol Prog Ser. 1997;150:11–20.
28. Fernández P, Anderson DJ, Sievert PR, Huyvaert KP. Foraging destinations ofthree low-latitude albatross (Phoebastria) species. J Zool. 2001;254:391–404.
29. Hyrenbach KD, Fernandez P, Anderson DJ. Oceanographic habitats of twosympatric North Pacific albatrosses during the breeding season. Mar EcolProg Ser. 2002;233:283–301.
30. Inchausti P, Guinet C, Koudil M, Durbec J-P, Barbraud C, Weimerskirch H, etal. Inter-annual variability in the breeding performance of seabirds inrelation to oceanographic anomalies that affect the Crozet and theKerguelen sectors of the Southern Ocean. J Avian Biol. 2003;34:170–6.
31. Pinaud D, Cherel Y, Weimerskirch H. Effect of environmental variability onhabitat selection, diet, provisioning behaviour and chick growth in yellow-nosed albatrosses. Mar Ecol Prog Ser. 2005;298:295–304.
32. Kappes MA, Shaffer SA, Tremblay Y, Foley DG, Palacios DM, Robinson PW, etal. Hawaiian albatrosses track interannual variability of marine habitats in theNorth Pacific. Prog Oceanogr. 2010;86:246–60.
33. Whittow GC. Black-footed albatross (Diomedea nigripes). In: Poole A,Gill F, editors. The Birds of North America. Volume 65. Philadelphia: The Academyof Natural Sciences; Washington, D.C.: The American Ornithologists' Union; 1993.
34. Whittow GC. Laysan albatross (Diomedea immutabilis). In: Poole A, Gill F,editors. The Birds of North America. Volume 66. Philadelphia: The
Kappes et al. Movement Ecology (2015) 3:34 Page 21 of 24

Academy of Natural Sciences; Washington, D.C.: The AmericanOrnithologists' Union; 1993.
35. Tickell WLN. Albatrosses. New Haven: Yale University Press; 2000.36. BirdLife International. Tracking ocean wanderers: the global distribution of
albatrosses and petrels. Cambridge, UK: BirdLife International; Results fromthe Global Procellariiform Tracking Workshop, 1–5 September, 2003,Gordon's Bay, South Africa; 2004.
37. Ashmole NP. Seabird ecology and the marine environment. In: Farner DS,King JR, editors. Avian biology, vol. 1. London: Academic Press; 1971.p. 223–86.
38. Ballance LT, Pitman RL, Reilly SB. Seabird community structure along aproductivity gradient: importance of competition and energetic constraint.Ecology. 1997;78:1502–18.
39. Awkerman JA, Fukuda A, Higuchi H, Anderson DJ. Foraging activity andsubmesoscale habitat use of waved albatrosses Phoebastria irrorata duringchick-brooding period. Mar Ecol Prog Ser. 2005;291:289–300.
40. Weimerskirch H, Lys P. Seasonal changes in the provisioning behaviour andmass of male and female wandering albatrosses in relation to the growthof their chick. Polar Biol. 2000;23:733–44.
41. Ydenberg RC, Welham CVJ, Schmid-Hempel R, Schmid-Hempel P,Beauchamp G. Time and energy constraints and the relationships betweencurrencies in foraging theory. Behav Ecol. 1994;5:28–34.
42. Schmelzer I. Seals and seascapes: covariation in Hawaiian monk sealsubpopulations and the oceanic landscape of the Hawaiian Archipelago. JBiogeogr. 2000;27:901–914.
43. Rasmussen K, Palacios DM, Calambokidis J, Saborío MT, Dalla Rosa L, SecchiER, et al. Southern Hemisphere humpback whales wintering off CentralAmerica: insights from water temperature into the longest mammalianmigration. Biol Lett. 2007;3:302–5.
44. Weng KC, Foley DG, Ganong JE, Perle C, Shillinger GL, Block BA. Migrationof an upper trophic level predator, the salmon shark Lamna ditropis,between distant ecoregions. Mar Ecol Prog Ser. 2008;372:253–64.
45. Roden GI. Subarctic-subtropical transition zone of the North Pacific: large-scale aspects and mesoscale structure. In: Wetherall JA, editor. Biology,oceanography, and fisheries of the North Pacific transition zone andsubarctic frontal zone. NOAA Technical Report 105. 1991. p. 1–38.
46. Polovina JJ, Howell E, Kobayashi DR, Seki MP. The transition zonechlorophyll front, a dynamic global feature defining migration and foragehabitat for marine resources. Prog Oceanogr. 2001;49:469–83.
47. Laurs RM, Fiedler PC, Montgomery DR. Albacore tuna catch distributionsrelative to environmental features observed from satellites. Deep-Sea Res I.1984;31:1085–99.
48. Olson DB, Hitchcock GL, Mariano AJ, Ashjian CJ, Peng G, Nero RW, et al. Lifeon the edge: marine life and fronts. Oceanography. 1994;7:52–9.
49. Polovina JJ, Kobayashi DR, Parker DM, Seki MP, Balazs GH. Turtles on theedge: movement of loggerhead turtles (Caretta caretta) along oceanicfronts, spanning longline fishing grounds in the central North Pacific, 1997–1998. Fish Oceanogr. 2000;9:71–82.
50. Bograd SJ, Foley DG, Schwing FB, Wilson C, Laurs RM, Polovina JJ, et al. Onthe seasonal and interannual migrations of the transition zone chlorophyllfront. Geophys Res Lett. 2004;31:L17204.
51. Polovina JJ, Howell E, Abecassis M. Ocean's least productive waters areexpanding. Geophys Res Lett. 2008;35:L03618.
52. Sydeman WJ, Thompson SA, Field JC, Peterson WT, Tanasichuk RW, FreelandHJ, et al. Does positioning of the North Pacific Current affect downstreamecosystem productivity? Geophys Res Lett. 2011;38:L12606.
53. Costa DP, Robinson PW, Arnould JPY, Harrison A-L, Simmons SE, Hassrick JL,et al. Accuracy of ARGOS locations of pinnipeds at-sea estimated usingFastloc GPS. PLoS One. 2010;5:e8677.
54. Shaffer SA, Tremblay Y, Awkerman JA, Henry RW, Teo SLH, Anderson DJ, etal. Comparison of light- and SST-based geolocation with satellite telemetryin free-ranging albatrosses. Mar Biol. 2005;147:833–43.
55. Fridolfsson A-K, Ellegren H. A simple and universal method for molecularsexing of non-ratite birds. J Avian Biol. 1999;30:116–21.
56. Wilson RP, Weimerskirch H, Lys P. A device for measuring seabird activity atsea. J Avian Biol. 1995;26:172–5.
57. Phillips RA, Xavier JC, Croxall JP. Effects of satellite transmitters onalbatrosses and petrels. Auk. 2003;120:1082–90.
58. McConnell BJ, Chambers C, Fedak MA. Foraging ecology of southernelephant seals in relation to the bathymetry and productivity of theSouthern Ocean. Antarct Sci. 1992;4:393–8.
59. Suryan RM, Sato F, Balogh GR, Hyrenbach KD, Sievert PR, Ozaki K. Foragingdestinations and marine habitat use of short-tailed albatrosses: A multi-scaleapproach using first-passage time analysis. Deep-Sea Res II. 2006;53:370–86.
60. Spear LB, Ainley DG. Flight speed of seabirds in relation to wind speed anddirection. Ibis. 1997;139:234–51.
61. Tremblay Y, Shaffer SA, Fowler SL, Kuhn CE, McDonald BI, Weise MJ, et al.Interpolation of animal tracking data in a fluid environment. J Exp Biol.2006;209:128–40.
62. Wilson RP, Ducamp JJ, Rees WG, Culik BM, Niekamp K. Estimation oflocation: global coverage using light intensity. In: Priede IG, Swift SM,editors. Wildlife telemetry: remote monitoring and tracking of animals. NewYork: Ellis Horwood, Inc.; 1992. p. 131–4.
63. Hill RD. Theory of geolocation by light levels. In: Le Boeuf BJ, Laws RM,editors. Elephant seals: population ecology, behavior, and physiology.Berkeley: University of California Press; 1994. p. 227–36.
64. Teo SLH, Boustany A, Blackwell S, Walli A, Weng KC, Block BA. Validation ofgeolocation estimates based on light level and sea surface temperaturefrom electronic tags. Mar Ecol Prog Ser. 2004;283:81–98.
65. Rodionov SN. A sequential algorithm for testing climate regime shifts.Geophys Res Lett. 2004;31:L09204.
66. Pinheiro J, Bates D, DebRoy S, Sarkar D. R Core team. nlme: Linear andnonlinear mixed effects models. 2009.
67. Hothorn T, Bretz F, Westfall P. Simultaneous inference in general parametricmodels. Biometr J. 2008;50:346–63.
68. R Development Core Team. R: A language and environment for statisticalcomputing. Vienna, Austria: R Foundation for Statistical Computing; 2010.
69. Berens P. CircStat: A MATLAB toolbox for circular statistics. J Stat Softw.2009;31:1–21.
70. Worton BJ. Kernel methods for estimating the utilization distribution inhome-range studies. Ecology. 1989;70:164–8.
71. Wood AG, Naef-Daenzer B, Prince PA, Croxall JP. Quantifying habitat use insatellite-tracked pelagic seabirds: application of kernel estimation toalbatross locations. J Avian Biol. 2000;31:278–86.
72. Calenge C. The package "adehabitat" for the R software: A tool for theanalysis of space and habitat use by animals. Ecol Model. 2006;197:516–9.
73. Silverman BW. Density estimation for statistics and data analysis. London:Chapman & Hall; 1986.
74. Breed GA, Bowen WD, McMillan JI, Leonard ML. Sexual segregation ofseasonal foraging habitats in a non-migratory marine mammal. Proc R SocLond B. 2006;273:2319–26.
75. Weimerskirch H, Guionnet T, Martin J, Shaffer SA, Costa DP. Fast and fuelefficient? Optimal use of wind by flying albatrosses. Proc R Soc Lond B.2000;267:1869–74.
76. Shaffer SA, Costa DP, Weimerskirch H. Behavioural factors affecting foragingeffort of breeding wandering albatrosses. J Anim Ecol. 2001;70:864–74.
77. Lewin-Koh NJ, Bivand R. maptools: Tools for reading and handling spatialobjects. 2010.
78. Richards JA, Jia X. Remote sensing digital image analysis. New York:Springer; 1999.
79. Qinke Y, Jupp D, Rui L, Wei L. Re-scaling lower resolution slope byhistogram matching. In: Zhou Q, Lees B, Tang G, editors. Advances in digitalterrain analysis. Berlin: Springer; 2008. p. 193–210.
80. Aarts G, MacKenzie M, McConnell B, Fedak M, Matthiopoulos J. Estimatingspace-use and habitat preference from wildlife telemetry data. Ecography.2008;31:140–60.
81. Matthiopoulos J. The use of space by animals as a function of accessibilityand preference. Ecol Model. 2003;159:239–68.
82. Wakefield ED, Phillips RA, Trathan PN, Arata J, Gales R, Huin N, et al. Habitatpreference, accessibility and competiton limit the global distribution ofbreeding black-browed albatrosses. Ecol Monogr. 2011;81:141–67.
83. Rosenberg DK, McKelvey KS. Estimation of habitat selection for central-placeforaging animals. J Wildl Manage. 1999;63:1028–38.
84. Wood SN. Generalized additive models: an introduction with R. Boca Raton,Florida: Chapman & Hall; 2006.
85. Pinheiro JC, Bates DM. Mixed-effects models in S and S-Plus. New York:Springer Verlag; 2000.
86. Harrison CS, Hida TS, Seki MP. Hawaiian seabird feeding ecology. WildlifeMonogr. 1983;85:1–71.
87. Gould P, Ostrom P, Walker W. Trophic relationships of albatrosses associatedwith squid and large-mesh drift-net fisheries in the North Pacific Ocean. CanJ Zool. 1997;75:549–62.
Kappes et al. Movement Ecology (2015) 3:34 Page 22 of 24

88. Gong Y, Kim S, An DH. Abundance of neon flying squid in relation tooceanographic conditions in the North Pacific. Int N Pac Fish Comm Bull.1993;53:191–204.
89. Yatsu A, Shimada H, Murata M. Distributions of epipelagic fishes, squids,marine mammals, seabirds and sea turtles in the Central North Pacific. Int NPac Fish Comm Bull. 1993;53:111–46.
90. Pearcy WG, Fisher JP, Anma G, Meguro T. Species associations of epipelagicnekton of the North Pacific Ocean, 1978–1993. Fish Oceanogr. 1996;5:1–20.
91. Ichii T, Mahapatra K, Sakai M, Inagake D, Okada Y. Differing body sizebetween the autumn and the winter-spring cohorts of neon flying squid(Ommastrephes bartramii) related to the oceanographic regime in the NorthPacific: a hypothesis. Fish Oceanogr. 2004;13:295–309.
92. Breder CM, Rosen DE. Modes of reproduction in fishes. New York: TheAmerican Museum of Natural History; 1966.
93. Bakun A. Fronts and eddies as key structures in the habitat of marine fishlarvae: opportunity, adaptive response and competitive advantage. Sci Mar.2006;70S2:105–22.
94. Johannes RE. Words of the Lagoon. Berkeley: University of CaliforniaPress; 1981.
95. Oschlies A, Garçon V. Eddy-induced enhancement of primary production ina model of the north Atlantic Ocean. Nature. 1998;394:266–9.
96. Stammer D. On eddy characteristics, eddy transports, and mean flowproperties. J Phys Oceanogr. 1998;28:727–39.
97. Waugh DW, Abraham ER, Bowen MM. Spatial variations of stirring in thesurface ocean: a case study of the Tasman Sea. J Phys Oceanogr.2006;36:526–42.
98. Pennycuick CJ. The flight of petrels and albatrosses (Procellariiformes),observed in South Georgia and its vicinity. Philos Trans R Soc Lond B.1982;300:75–106.
99. Wolanski E, Hamner WM. Topographically controlled fronts in the oceanand their biological influence. Science. 1988;241:177–81.
100. Springer AM, McRoy CP, Flint MV. The Bering Sea Green Belt: shelf-edgeprocesses and ecosystem production. Fish Oceanogr. 1996;5:205–23.
101. Powell BS, Arango HG, Moore AM, Di Lorenzo E, Milliff RF, Foley D. 4DVARdata assimilation in the Intra-Americas Sea with the Regional OceanModeling System (ROMS). Ocean Model. 2008;23:130–45.
102. Ullman DS, Cornillon PC, Shan Z. On the characteristics of subtropical frontsin the North Atlantic. J Geophys Res. 2007;112:C01010.
103. Behrenfeld MJ, Falkowski PG. Photosynthetic rates derived from satellite-based chlorophyll concentration. Limnol Oceanogr. 1997;42:1–20.
104. Sokal RR, Rohlf FJ. Biometry: the principles and practice of statistics inbiological research. New York: W.H. Freeman and Co.; 1995.
105. Quinn GP, Keough MJ. Experimental design and data analysis for biologists.Cambridge: Cambridge University Press; 2002.
106. Wood SN. gamm4: Generalized additive mixed models using mgcv andlme4. 2010.
107. Crawley MJ. Statistical computing: an introduction to data analysis usingS-Plus. West Sussex, England: John Wiley & Sons; 2002.
108. Zuur AF, Ieno EN, Walker NJ, Saveliev AA, Smith GM. Mixed effects modelsand extensions in ecology with R. New York: Springer; 2009.
109. Olivier F, Wotherspoon SJ. GIS-based application of resource selectionfunctions to the prediction of snow petrel distribution and abundance inEast Antarctica: Comparing models at multiple scales. Ecol Model.2005;189:105–29.
110. Barclay RMR. The effect of reproductive condition on the foraging behaviorof female hoary bats, Lasiurus cinereus. Behav Ecol Sociobiol. 1989;24:31–7.
111. Clarke J, Emmerson LM, Otahal P. Environmental conditions and life historyconstraints determine foraging range in breeding Adélie penguins. Mar EcolProg Ser. 2006;310:247–61.
112. Larimer SC, Fritzsche P, Song Z, Johnston J, Neumann K, Gattermann R, etal. Foraging behavior of golden hamsters (Mesocricetus auratus) in the wild.J Ethol. 2011;29:275–83.
113. Rice DW, Kenyon KW. Breeding cycles and behavior of Laysan and black-footed albatrosses. Auk. 1962;79:517–67.
114. Legaard KR, Thomas AC. Spatial patterns in seasonal and interannualvariability of chlorophyll and sea surface temperature in the CaliforniaCurrent. J Geophys Res. 2006;111:C06032.
115. Henson SA, Thomas AC. Interannual variability in timing of bloom initiationin the California Current System. J Geophys Res. 2007;112:C08007.
116. Fischer KN, Suryan RM, Roby DD, Balogh GR. Post-breeding seasondistribution of black-footed and Laysan albatrosses satellite-tagged in
Alaska: inter-specific differences in spatial overlap with North Pacificfisheries. Biol Conserv. 2009;142:751–60.
117. Glass GE, Slade NA. The effect of Sigmodon hispidus on spatial and temporalactivity of Microtus ochrogaster: evidence for competition. Ecology.1980;61:358–70.
118. Bocher P, Cherel Y, Hobson KA. Complete trophic segregation betweenSouth Georgian and common diving petrels during breeding at IlesKerguelen. Mar Ecol Prog Ser. 2000;208:249–64.
119. González-Solís J, Croxall JP, Afanasyev V. Offshore spatial segregation ingiant petrels Macronectes spp. differences between species, sexes andseasons. Aquat Conserv. 2008;17:S22–36.
120. Navarro J, Forero MG, González-Solís J, Igual JM, Bécares J, Hobson KA.Foraging segregation between two closely related shearwaters breeding insympatry. Biol Lett. 2009;5:545–8.
121. Xavier JC, Louzao M, Thorpe SE, Ward P, Hill C, Roberts D, et al. Seasonalchanges in the diet and feeding behaviour of a top predator indicate aflexible response to deteriorating oceanographic conditions. Mar Biol.2013;160:1597–606.
122. Pitman RL, Walker WA, Everett WT, Gallo-Reynoso JP. Population status,foods and foraging of Laysan albatrosses Phoebastria immutabilis nesting onGuadalupe Island, Mexico. Mar Ornithol. 2004;32:159–65.
123. Weimerskirch H, Gault A, Cherel Y. Prey distribution and patchiness: factorsin foraging success and efficiency of wandering albatrosses. Ecology.2005;86:2611–22.
124. Fernández P, Anderson DJ. Nocturnal and diurnal foraging activity ofHawaiian albatrosses detected with a new immersion monitor. Condor.2000;102:577–84.
125. Hyrenbach KD, Dotson RC. Assessing the susceptibility of female black-footed albatross (Phoebastria nigripes) to longline fisheries during their post-breeding dispersal: an integrated approach. Biol Conserv. 2003;112:391–404.
126. Phillips RA, Silk JRD, Phalan B, Catry P, Croxall JP. Seasonal sexualsegregation in two Thalassarche albatross species: competitive exclusion,reproductive role specialization or foraging niche divergence? Proc R SocLond B. 2004;271:1283–91.
127. Weimerskirch H, Guionnet T. Comparative activity pattern during foraging offour albatross species. Ibis. 2002;144:40–50.
128. Phalan B, Phillips RA, Silk JRD, Afanasyev V, Fukuda A, Fox J, et al. Foragingbehaviour of four albatross species by night and day. Mar Ecol Prog Ser.2007;340:271–86.
129. Pettit TN, Nagy KA, Ellis HI, Whittow GC. Incubation energetics of the Laysanalbatross. Oecologia. 1988;74:546–50.
130. Hyrenbach KD, Keiper C, Allen SG, Ainley DG, Anderson DJ. Use of marinesanctuaries by far-ranging predators: commuting flights to the CaliforniaCurrent System by breeding Hawaiian albatrosses. Fish Oceanogr.2006;15:95–103.
131. Fauchald P, Tveraa T. Using first-passage time in the analysis of area-restricted search and habitat selection. Ecology. 2003;84:282–8.
132. Kareiva P, Odell G. Swarms of predators exhibit "preytaxis" if individualpredators use area-restricted search. Am Nat. 1987;130:233–70.
133. Felicísimo ÁM, Muñoz J, González-Solis J. Ocean surface winds drivedynamics of transoceanic aerial movements. PLoS One. 2008;3:e2928.
134. Wakefield ED, Phillips RA, Matthiopoulos J, Fukuda A, Higuchi H, Marshall GJ,et al. Wind field and sex constrain the flight speeds of central-placeforaging albatrosses. Ecol Monogr. 2009;79:663–79.
135. Adams J, Flora S. Correlating seabird movements with ocean winds:linking satellite telemetry with ocean scatterometry. Mar Biol.2010;157:915–29.
136. Raymond B, Shaffer SA, Sokolov S, Woehler EJ, Costa DP, Einoder L, et al.Shearwater foraging in the Southern Ocean: the roles of prey availabilityand winds. PLoS One. 2010;5:e10960.
137. Suryan RM, Anderson DJ, Shaffer SA, Roby DD, Tremblay Y, Costa DP, et al.Wind, waves, and wing loading: morphological specialization may limitrange expansion of endangered albatrosses. PLoS One. 2008;3:e4016.
138. Pascual A, Faugère Y, Larnicol G, Le Traon P-Y. Improved description of theocean mesoscale variability by combining four satellite altimeters. GeophysRes Lett. 2006;33:L02611.
139. Benson SR, Eguchi T, Foley DG, Forney KA, Bailey H, Hitipeuw C, et al. Large-scale movements and high-use areas of western Pacific leatherback turtles,Dermochelys coriacea. Ecosphere. 2011;2:art84.
140. Longhurst AR. Ecological geography of the sea. San Diego, California:Academic Press; 1998.
Kappes et al. Movement Ecology (2015) 3:34 Page 23 of 24
141. Hardman-Mountford NJ, Hirata T, Richardson KA, Aiken J. An objectivemethodology for the classification of ecological pattern into biomes andprovinces for the pelagic ocean. Remote Sens Environ. 2008;112:3341–52.
142. Harrison CS. Seabirds of Hawaii. Ithaca, New York: Cornell UniversityPress; 1990.
143. Fisher HI. Body weights in Laysan albatrosses Diomedea immutabilis. Ibis.1967;109:373–82.
144. Prince PA, Ricketts C, Thomas G. Weight loss in incubating albatrosses andits implications for their energy and food requirements. Condor.1981;83:238–42.
145. Weimerskirch H. Regulation of foraging trips and incubation routine in maleand female wandering albatrosses. Oecologia. 1995;102:37–43.
146. Chaurand T, Weimerskirch H. The regular alternation of short and longforaging trips in the blue petrel Halobaena caerulea: a previouslyundescribed strategy of food provisioning in a pelagic seabird. J Anim Ecol.1994;63:275–82.
147. Weimerskirch H, Chastel O, Ackermann L, Chaurand T, Cuenot-Chaillet F,Hindermeyer X, et al. Alternate long and short foraging trips in pelagicseabird parents. Anim Behav. 1994;47:472–6.
148. Baduini CL, Hyrenbach KD. Biogeography of Procellariform foragingstrategies: does ocean productivity influence provisioning? Mar Ornithol.2003;31:101–12.
149. Sprague RS. Glucocorticoid physiology and behavior during life historytransitions in Laysan albatross (Phoebastria immutabilis). PhD Thesis,University of Montana; 2009.
150. Fisher HI. Mortality and survival in the Laysan albatross, Diomedeaimmutablis. Pac Sci. 1975;29:279–300.
151. Naughton MB, Romano MD, Zimmerman TS. A Conservation Action Plan forblack-footed albatross (Phoebastria nigripes) and Laysan albatross(P. immutabilis). 2007.
152. Dearborn DC, Anders AD, Flint EN. Trends in reproductive success ofHawaiian seabirds: is guild membership a good criterion for choosingindicator species? Biol Conserv. 2001;101:97–103.
153. Seki MP, Flint EN, Howell E, Ichii T, Polovina JJ, Yatsu A. Transition Zone. In:Alexander V, Perry IR, editors. PICES report on marine ecosystems of theNorth Pacific. North Saanich. British Columbia: North Pacific Marine ScienceOrganization; 2004. p. 191–8.
154. Levitus S, Antonov J, Boyer T. Warming of the world ocean, 1955–2003.Geophys Res Lett. 2005;32:L02604.
155. Climate Change IPCC. Fourth Assessment Report of the IntergovernmentalPanel on Climate Change. Cambridge: Cambridge University Press; 2007.p. 2007.
156. Yin JH. A consistent poleward shift of the storm tracks in simulations of 21stcentury climate. Geophys Res Lett. 2005;32:L18701.
157. Bengtsson L, Hodges KI, Roeckner E. Storm tracks and climate change.J Clim. 2006;19:3518–43.
158. Archer CL, Caldeira K. Historical trends in the jet streams. Geophys Res Lett.2008;35:L08803.
159. Weimerskirch H, Louzao M, de Grissac S, Delord K. Changes in wind patternalter albatross distribution and life-history traits. Science. 2012;335:211–4.
160. Young LC, Vanderlip C, Duffy DC, Afanasyev V, Shaffer SA. Bringing homethe trash: do colony-based differences in foraging distribution lead toincreased plastic ingestion in Laysan albatrosses? PLoS One. 2009;4:e7623.
Submit your next manuscript to BioMed Centraland take full advantage of:
• Convenient online submission
• Thorough peer review
• No space constraints or color figure charges
• Immediate publication on acceptance
• Inclusion in PubMed, CAS, Scopus and Google Scholar
• Research which is freely available for redistribution
Submit your manuscript at www.biomedcentral.com/submit
Kappes et al. Movement Ecology (2015) 3:34 Page 24 of 24