Report On the Comprehensive Military Value and Economic ...
82
Report On the Comprehensive Military Value and Economic Impact of Department of Defense Activities in Colorado Prepared by the Department of Military and Veterans Affairs April 2015
Transcript of Report On the Comprehensive Military Value and Economic ...

Report On the Comprehensive Military
Value and Economic Impact of Department of
Defense Activities in Colorado
Prepared by the Department of Military and Veterans Affairs
April 2015

2

3

4
Table of Contents
1. Summary of Key Data....................................................................................................................... 7
Summary of Colorado Strengths ........................................................................................................................ 8
Summary of Colorado Vulnerabilities ............................................................................................................. 12
Summary of Colorado Opportunities ............................................................................................................... 14
Overview of Installation Data .......................................................................................................................... 15
Installation Strengths ....................................................................................................................................... 18
Installation Vulnerabilities ............................................................................................................................... 22
Installation Opportunities ................................................................................................................................. 24
Economic Impact of the Military on Colorado ................................................................................................ 27
2. Summary of Prioritized Recommendations ................................................................................... 64
3. Recommended Strategic Message Themes and Audiences .......................................................... 67
4. Summary of Tasking and Background Information .................................................................... 71
5. Summary of the Analytical Methodologies and Tools .................................................................. 73
_______________________________________________________________
Table of Figures and Tables
Figure 1: Weights of Military Value Criteria…………………………………………………….16
Figure 2: Summary of Strengths and Vulnerabilities by Military Value Criteria………………..17
Figure 3: Distribution of DOD Jobs by County………………………………………………….32
Figure 4: Total DOD Economic Impact as a Percentage of Colorado Economy………………...50
Figure 5: Current Life Cycle Position of DOD Colorado Elements.……………………………..52
Figure 6: Colorado Economic Growth Model……………………………………………………58
Figure 7: Total Active Duty Military Personnel by Branch and Year……………………………62
Figure 8: Colorado Military Value and Economic Impact Approach and Methodology.………..73
Figure 9: Military Value and Economic Impact Data Collection and Analysis Model.………….75
Figure 10: Example Characterization Matrix for Data Collection……………………………….76
Figure 11: Economic Impacts Overview…………………………………………………………79
5
Table 1-1: Components of the Military Capabilities Assessment……………………………….18
Table 1-2: Components of the Future Total Force Requirements Assessment………………….19
Table 1-3: Components of the Cost of Operations Assessment…………………………………20
Table 1-4: Components of the Availability & Condition of Land Assessment………………….20
Table 1-5: Components of the Availability & Condition of Airspace Assessment……………...21
Table 1-6: Components of the Economic Contribution Assessment…………………………….22
Table 1-7: Components of the Surge Capability/Capacity Assessment.…………………………23
Table 1-8: Components of the Manpower Implications & Personnel Availability Assessment...24
Table 1: Fiscal Impacts on the State of Colorado from DOD Related Employment, Earnings
And Expenditures………………………………………………………………………..28
Table 2: Total DOD Related Employment in Colorado, 2014.……………………………..……30
Table 3: Total DOD Related Employment by Congressional District, 2014.…………………....31
Table 4: Total DOD Related Earnings by County, 2014.………………………………………..33
Table 5: DOD Related Labor Earnings by Congressional District, 2014.…………………….…34
Table 6: Employment on Military Installations, 2014.……………………………………….….35
Table 7: Expenditures on Military Installations, 2014.………………………………………….36
Table 8: Distribution of All DOD Contract and Assistance Awards Expenditures in Counties
with Military Installations..……………………………………………………………..37
Table 9: Combined El Paso, Arapahoe and Weld County Military Installation and DOD
Contracting Impacts.……………………………………………………………………39
Table 10: El Paso County Military Installation and DOD Contracting Impacts.....……………..41
Table 11: Arapahoe County Military Installation and DOD Contracting Impacts......…………..42
Table 12: Weld County Military Installation and DOD Contracting Impacts..………………….43
Table 13: Average Labor Income of DOD Related Activities in El Paso, Arapahoe and
Weld Counties.…………………………………………………………………………44
Table 14: DOD Contracts by County, 2014.…………………………………………………….45
Table 15: DOD Assistance Awards by County, 2014..………………………………………….45

6
Table 16: Fiscal Impacts on the State of Colorado from DOD Related Employment,
Earnings and Expenditures.…………………………………………………………...47
Table 17: Total Basic Jobs in Colorado by Industry…………………………………………….48
Table 18: Fundamental Location Forces – History of Colorado Installations…………………..54
Table 19: Economies of Agglomeration: Concepts and History.………………………………..61

7
1. Summary of Key Data
In the 2015 National Security Strategy and the 2014 Quadrennial Defense Review, the President
and the Secretary of Defense provide a strategic context for the Department’s national defense
objectives. DOD must begin transitioning from today’s wars to prepare for future challenges,
protect the broad range of US national security interests, advance DOD’s initiatives to rebalance
and reform, and support deficit reduction through a lower level of defense spending. This broad
strategic context has been decomposed into ten non-prioritized strategic mission areas for which
DOD must organize, train and equip. They represent the strategic objectives that govern all DOD
investments at a macro level, and are value benchmarks for the four military services’ personnel,
missions, and installations at the micro level. The degree to which Colorado military personnel,
missions and installations facilitate the success of these ten mission areas is one vital measure of the
State’s collective value to supporting national defense. The ten mission areas are:
Counter terrorism and irregular warfare
Deter and defeat aggression
Project power despite anti-access/area denial challenges
Counter weapons of mass destruction
Operate effectively in cyberspace and space
Maintain a safe, secure, and effective nuclear deterrent
Defend the homeland and provide support to civil authorities
Provide a stabilizing presence
Conduct stability and counterinsurgency operations
Conduct humanitarian, disaster relief, and other operations
This Report confirms that Colorado Active and Reserve Component forces, DOD civilians and
installations contribute significantly to all these mission areas. The Study also examined the degree
of that contribution by analyzing the extent to which the following nine Colorado attributes serve as
strengths, vulnerabilities or opportunities at the State and regional level:
Transportation infrastructure
Technological capacities
Primary, secondary and post-secondary education assets
Intellectual capabilities criteria to include military academic and technical organizations
Quality of life benchmarks for service members and their families
Training opportunities
Geography
Defense and aerospace industry
The proximity and colocation of other military installations, commands, missions and
capabilities
These nine attributes extend beyond strictly DOD areas of interest, providing a platform to describe
the complexion of economic benefits and relationships associated with the military personnel,

8
missions and installations resident in the State. A later portion of this Report explains these benefits
and relationships in detail. In this section, the intent is to use the nine attributes as a lens showing
the degree of Colorado’s strengths, vulnerabilities or opportunities in support of DOD strategic
objectives.
The Study used the following definitions for the terms strengths, vulnerabilities and opportunities:
Strength: A good or beneficial quality, asset, or attribute of Colorado military installations or
economic activity that is real and accruing an advantage to DOD or the State of Colorado.
Also, tangible assets or attributes or some combination of these that translate into power for
resisting negative forces (trends, plans, programs, policies, etc.)
Vulnerability: A difficult-to-defend asset, attribute, trend, or characterization of a military
installation or an economic activity which is or may be harmful to DOD or the State of
Colorado. Also, any asset, attribute, trend, or characterization of a military installation or
economic activity which is open to attack or criticism.
Opportunity: An identified set of circumstances or a suitable occasion that highlights or
reinforces a strength or mitigates a vulnerability. Successful strategies for taking advantage
of an opportunity should tie three elements together: the desired ends to be achieved, the
ways one might pursue the opportunity, and the means or resources needed.
Summary of Colorado Strengths
The State of Colorado offers an impressive number of strengths in support of all nine DOD
attributes. The Study’s conclusions on strengths are summarized below.
Providing a Robust Transportation Infrastructure
All Colorado military installations enjoy access to robust transportation networks and infrastructure,
supporting the movement of personnel for training, operations and which are responsive to current
mobilization requirements. The multitude of commercial and military airports serving the greater
metropolitan Denver region provides diverse hubs for departing and arriving personnel. The Front
Range roads and highways system allows year-round traffic for DOD mission-related vehicles, and
have historically proven responsive to surge requirements when extraordinarily large numbers of
people or equipment sets have needed to be quickly moved. While there may be minor locality
encroachment issues affecting existing or proposed transportation infrastructure, this Study did not
uncover any major transportation-related encroachment developments adversely impacting military
operations and training in Colorado.
Offering Innovative and Open Technological Capabilities
The State of Colorado fosters a tremendous variety of high technology capabilities that are
“engines” for enhancing the State’s military value to DOD. The broad diversity and locational
stability of Colorado’s technology-based industries provide DOD with a high level of stability
during the peaks and valleys of product and technology lifecycles. Innovation springs from an
9
environment where available funding meets a technology opportunity, and the State is a magnet for
attracting both. The local military and civilian population living on and around military
installations is well-educated, technically proficient, satisfied with a positive quality of life in their
work and recreational pursuits, and possesses the selective security classification clearances needed
for many DOD jobs. This characterization is equally true for DOD retirees who are establishing
second careers in major Colorado defense industries or, again, within DOD. There is a cross-flow
from DOD into industry and vice versa that nurtures strong bonds between those two major
employers and is a self-reinforcing relationship that concentrates talent, productive capacity, and
innovation. As explained in the economic impact discussion below, strength is reflected in the
pooling of talent and generation of spin-off industries or ventures through agglomeration.1
Advanced industries in areas such as information technology, electronics, bioscience, energy and
aerospace capabilities are propelling Colorado growth in leading technology enterprises that support
national defense objectives. For example, the Metro Denver Economic Development Corporation’s
January 2015 Cluster Profile on the aerospace industry affirmed that “the state’s wealth of talent,
research assets, and synergy between industry, commercialization, research, and workforce
development supports its position as a space industry leader.”
Demonstrating Depth in Primary, Secondary and post-Secondary Education Assets
The Study Team visiting Colorado military installations repeatedly heard highly approving
evaluations of the servicing primary, secondary and post-secondary education systems. DOD
benefits from a highly educated military workforce sourced in part from Colorado’s 89 colleges,
universities and training programs that accept the post 9/11 GI Bill. These educational institutions
offer service members and their families a broad range of higher learning and technical skills
opportunities where these benefits may be used. The 2015 Guide to Military Friendly Schools
rankings recognize eight of Colorado’s community colleges in the top tier. Colorado is a “choice”
state, meaning once a year parents of school-aged children can apply for admission to a school other
than in their neighborhood or traditional zone of attendance. At Schriever AFB alone, the Base
Education Office reported that service members and DOD civilians with school-aged children are
serviced by 90 public elementary schools, 27 middle schools and 19 high schools. This is typical of
the diversity available for other State military installation families. Colorado School Grades, a
coalition of 18 non-profit community organizations, used data from the Colorado Department of
Education to rate every public school in the State. In assessing 345 secondary or high schools in
Colorado, the coalition’s list of top ten schools placed every single one within the larger Denver
metropolitan region.
1 Economic agglomeration is a cumulative, self-reinforcing process that concentrates talent, productive capacity and
innovation creating spin-off industries and organizations that attract funding from the other firms in the same industry (DOD in this case) as well as non-DOD entities such as other federal agencies and public and private organizations from around the world. Agglomeration effects typically begin with the localization economies of scale which then attract organizations seeking the specialized workforce and economic infrastructure that develops to support the sector. As the agglomeration process reinforces itself and accumulates over time, it supports economic urbanization forces resulting in urban growth of industries, organizations and personnel that attract funding from the other firms in the same industry (DOD in this case) as well as non-DOD entities such as other federal agencies and public and private organizations.
10
Having Depth and Scope of Intellectual Capabilities, including Military, Academic and
Technical Organizations and Institutions
One of the singular representative benchmarks for demonstrating the depth and scope of Colorado
intellectual capabilities is the synergy that prevails among educational institutions, industry and
laboratories conducting cutting-edge research. According to the Colorado Department of Higher
Education, the State hosts over 470 institutions educating approximately 400,000 students. These
reflect several types of institutions including publicly supported (made up of research universities,
four-year state colleges, community colleges and local district colleges), private accredited (which
includes for-profit, non-profit, and seminary), area technical, and private occupational institutions.
Colorado’s aerospace industry sector – ranked third out of 50 states in total private-sector
employment – embraces widespread collaborations with out-of-state industry partners as well as in-
state and out-of-state universities and colleges. The US Air Force Academy alone boasts
sponsorship of 20 Research Centers that partner with a number of industries and research and
development arms of other universities, fostering a $65M enterprise in 2014. Another unique
resource that reflects depth and scope of intellectual capabilities is the deep wellspring of DOD
retirees with advanced degrees, technical experience, and desirable security clearances. Over a
lifetime, many of these individuals flow between DOD and industry and research and development
careers, contributing an unheralded but significant synergy that fuels military, academic and
technical institutions.
Demonstrating the Capacity to Meet or Exceed Quality of Life Benchmarks for Service
Members and their Families
Military service members and their families consistently rate their Colorado quality of life in a
positive manner. Whether the metric is the availability of standard family services and benefits like
access to discounted deals through installation Morale, Welfare and Recreation offices, the
availability of commissaries and base exchanges, or the off-base attractions afforded by the
metropolitan Denver economy and the great outdoors experience of the Front Range and beyond,
military service members rarely criticize their quality of life. The Study Team found through
surveys and conversations that Colorado service members also equate quality of life with an
affordable cost of living. Anecdotal evidence from interviews combined with empirical surveys
conducted by Sperling’s and CLRSearch confirm that Front Range Coloradans consistently rate
their cost of living better than the national average, and their quality of life also better than the
national average across indices such as access to amusement opportunities, cultural events, housing,
restaurants and education.2
2 Sperling’s and CLRSearch ratings on Colorado quality of life are publicly available on the internet.

11
Possessing the Depth and Scope of Resources to Meet Service and Joint Training
Opportunities
There is diversity and depth in the institutional or operational “presence” of DOD tenants on
military installations with critically important and well-funded national defense missions.
Significant military installation construction and refurbishment is funded by major command and
defense organization tenants. The space missile warning and defense enterprise hosted at Buckley
AFB, Peterson AFB, Schriever AFB, Cheyenne Mountain Air Force Station, and Greeley Air
National Guard Station creates a vast joint footprint for air and space training requirements. The
Study Team found no evidence that current joint training opportunities were at significant risk for
lack of current funding or for misalignments in required personnel stationed at installations. Tenant
organizations like the Missile Defense Agency at Schriever AFB and the Aerospace Data Facility at
Buckley AFB are funding significant infrastructure improvements in part to enhance the operational
training effectiveness of assigned personnel and mission sets. The Piñon Canyon Maneuver Site
consisting of 238,000 acres provides world-class training environments for Fort Carson units, out-
of-state US Army units, and units from joint organizations and allied partners. In all these examples,
the cooperative agreements between Front Range military installations for scheduled, shared access
to land, air and space training ranges and opportunities enhance Service and Joint training
requirements. Local communities possess the additional lodging, restaurant, transportation and other
capabilities needed when installation personnel and facilities are surging with training and exercise
activities that exceed organic capacity. Installations are sensitive to community concerns about
noise associated with certain training activities. Buckley AFB, the US Air Force Academy and Fort
Carson have modified airspace usage and ground training operations to mitigate a variety of
community noise complaints without significantly detracting from required joint training schedules.
Having Geography that Best Supports the National Security and National Military Strategies
and Defense Strategic Guidance
Operational training of land, air and space forces assigned to Colorado are largely unaffected by
climate and geography which often are interrelated. In the opening segment of this Report there is
an elaboration of missions assigned to the Armed Forces which are independent of geography. But
the reality is that Colorado military installations and their associated mission sets are successful in
part because geography promotes rather than prohibits vital training activities that ensure mission
readiness. The unique combination of the flat plains landscape that quickly rises to meet the Rocky
Mountain range allows a rich mix of geographical environments for land and air training. For
example, the Colorado Army National Guard hosts a unique High Altitude Army National Guard
Training Site near Vail, providing a training environment particularly useful for the Armed Forces
recent overseas engagements in the high altitude regions of Afghanistan. And the vast and varied
environment afforded by the Piñon Canyon Maneuver Site is similarly supportive of the mission
requirements established in national military strategy documents.

12
Providing Resources that Support and Sustain the Defense and Aerospace Industry
The strategic importance of aerospace missions within DOD, combined with the congruence of
well-funded space-oriented tenants at several Colorado military installations, ensure sustained DOD
expenditures and investments that will support and sustain Colorado’s defense and aerospace
industry. Colorado’s acculturated DOD contractor workforce provides better returns on investment,
higher levels of productivity, and promotes industry-level economies of scale that make existing
military installations attractive to DOD investment. The aggregation of space-oriented installation
facilities, and the reliable tenant-provided funding to modernize facilities, serves as a magnet for
defense and aerospace industries looking to participate in this strategically significant mission area
as well as enabler areas like research and development, communications and cyber. The current
balance of Active Duty, Reserve Component and civilian personnel assigned to Colorado military
installations, and the flexibility individuals demonstrate in transitioning from one career area to
another, promote a level of “human capital” resiliency that fosters the defense and aerospace
industry’s success. Within Colorado there are entities like the Colorado Space Grant Consortium,
the Colorado Space Coalition, the Colorado Springs Defense Mission Task Force, the Aurora
Chamber of Commerce Defense Council, and the Colorado Space Business Roundtable that foster
interaction in the community, sponsor research and education activities for the aerospace industry,
and advance legislation for industry growth. Little things matter, like the number and location of
commercial airports and joint-use military-civilian airfields that satisfy the transportation needs of
major military commands, businesses and visitors. Because of all these factors, Colorado employs
more than 7% of the nation’s aerospace workforce.
Optimizing the Proximity and Co-location of other Military Installations, Commands,
Missions, and Capabilities for Operating in a Joint Environment
The congruence of military installations in the metropolitan Denver area with integrated missile
warning and space-oriented mission responsibilities promotes an unrivaled degree of operational
jointness. In Colorado, the six major military installations that share some levels of responsibility
for these mission sets (excluding the US Air Force Academy) are within 90 miles of one another.
Movement of tasked personnel and the operational execution of missions are optimized by this
condition of proximity. Installations with short-notice or unusual mobilization challenges have
memos of agreement with nearby installations to obtain assistance.
Summary of Colorado Vulnerabilities
Despite the impressive number of strengths elaborated above, Colorado may be perceived as
suffering select vulnerabilities across some – but not all – of the nine attributes. An important and
compelling exposition on encroachment as a vulnerability can be found in the 2014 Colorado Front
Range Regional Encroachment Management Action Plan (REMAP) Report. The REMAP Report
distinguishes encroachment challenge areas as water, airspace restrictions, energy compatibility and
availability, natural factors/climate effects, urban growth, and spectrum encroachment. The Study

13
Team collected commentary and survey results from Colorado installation personnel that reflect
concerns with some of these challenge areas. The Team believes the REMAP Report is a
comprehensive examination that does not need to be repeated here but warrants continued attention,
particularly with the suite of “Proposed Management Actions” offered to mitigate Front Range
encroachment challenges. The Study Team’s conclusions on vulnerabilities are summarized below.
Providing a Robust Transportation Infrastructure
The Study Team found selected shortcomings or deficiencies in the transportation infrastructure that
connect some installations with two completely different locations: the bedroom communities
where the off-base workforce resides, and the training areas that installation units most frequently
utilize. In rare instances these shortcomings relate to encroachment concerns originating with
nearby landowners. More commonly the problems trace to State and federal highway projects
which have been identified and, in many cases, are ready to execute when funding becomes
available. A vulnerability that affects access to training areas is more severe and of greater
consequence to DOD than road improvements that facilitate quicker access to installation entry
gates. But the latter can become a quality of life issue, which makes it important in a different way.
Offering Innovative and Open Technological Capabilities
In a period of reduced DOD investments into technological research and development activities, the
conditions that attract and retain high-tech talent and supporting industry are undermined.
Colorado’s leadership in hosting an impressive array of industry, laboratories and institutions of
higher learning might be jeopardized by a persistent reduction in high-tech funding. Continued
reductions in defense spending will further erode research and development, impacting
technologically-based industry clusters that are located along Colorado’s Front Range.
Having Depth and Scope of Intellectual Capabilities, including Military, Academic and
Technical Organizations and Institutions
The Study Team’s assessment of vulnerability in this DOD strategic objective is aligned with the
assessment of vulnerability in Offering Innovative and Open Technological Capabilities elaborated
above. Potential budget cuts affecting the DOD industry within Colorado might include force
structure reductions that jeopardize the depth of the “pool” of highly skilled military, DOD civilian
and industry contractor personnel. Loss of high wage-earning jobs can introduce a variety of second
and third-order negative consequences for quality of life considerations which are currently magnets
for attracting top-tier talent to the State. A companion concern in this DOD strategic objective of
depth and scope is one raised in an April 2014 report issued by the Colorado Springs Regional
Business Alliance on The Pikes Peak Defense and Aerospace Sector economy where 48% of
defense non-aerospace and 65% of aerospace firms identified challenges matching job requirements
with qualified applicants. Budget cuts affecting the DOD industry in Colorado may exacerbate this
vulnerability in attracting a qualified skilled workforce.

14
Having Geography that Best Supports the National Security and National Military Strategies
and Defense Strategic Guidance
This Report has already affirmed the advantages that Colorado’s Front Range geography provides
land, air and space forces that train year-round to meet national security and military strategies. The
fact that Colorado is a land-locked state without access to coastal waters means it will likely never
be a major locale for maritime training or for exercising major sea-based employment concepts. The
2012 Defense Strategic Guidance touts development of warfighting capabilities that support a
“pivot” to the Asia-Pacific region, to address the security concerns the nation may face there. While
the “pivot” of national military interest to Asia variously affects force structure and mission training
requirements for all four Military Services, the operational concepts include significant maritime
and littoral concepts of employment. Colorado’s land-locked geography is a vulnerability in the
sense that the State will likely not be a recipient of DOD exercise or training funds targeting the
development of maritime and littoral forces and capabilities.
Additionally, selective community expressions of concern about Fort Carson’s Piñon Canyon
Maneuver Site require continued attention from DOD, regional and State leaders, to prevent any
loss of access to Army and joint training there. While the Piñon Canyon Maneuver Site is the
visible training area in this regard, all training areas within the State merit attention and observation
as the State’s population increases and federal decision makers seek to expand lands associated with
national forests and other desirable but often incompatible designations.
Providing Resources that Support and Sustain the Defense and Aerospace Industry
Earlier this Report highlighted the strength derived from the synergy of military personnel, DOD
civilians, and DOD retirees all of whom are in the “pool” of the available high-tech workforce. The
Report suggests that there’s a positive level of dynamic balancing among these three members of
the “pool.” But if resources that sustain Colorado’s defense and aerospace industry are threatened –
if the DOD contribution to Colorado’s employment revenue declines because of force structure
reductions – then that dynamic balancing of three “pool” constituencies could be upset. And that
might trigger a cascading migration of industry and jobs out of the State.
Summary of Colorado Opportunities
The Study identified a number of opportunities which Colorado may pursue to protect and build
upon the State’s military installations and defense industry. Some opportunities require resources;
some require attention and monitoring; some require active engagement via meeting attendance or
review and comment on draft work products; some might be advanced with legislative assistance.
Most of the opportunities cited below reappear as Recommendations in Section 2.
There are countless opportunities for Colorado to advocate a positive message about the
strengths by which it supports the nine DOD attributes cited above. Speeches, press
releases, proactive attendance at numerous community and regional boards and alliances,
15
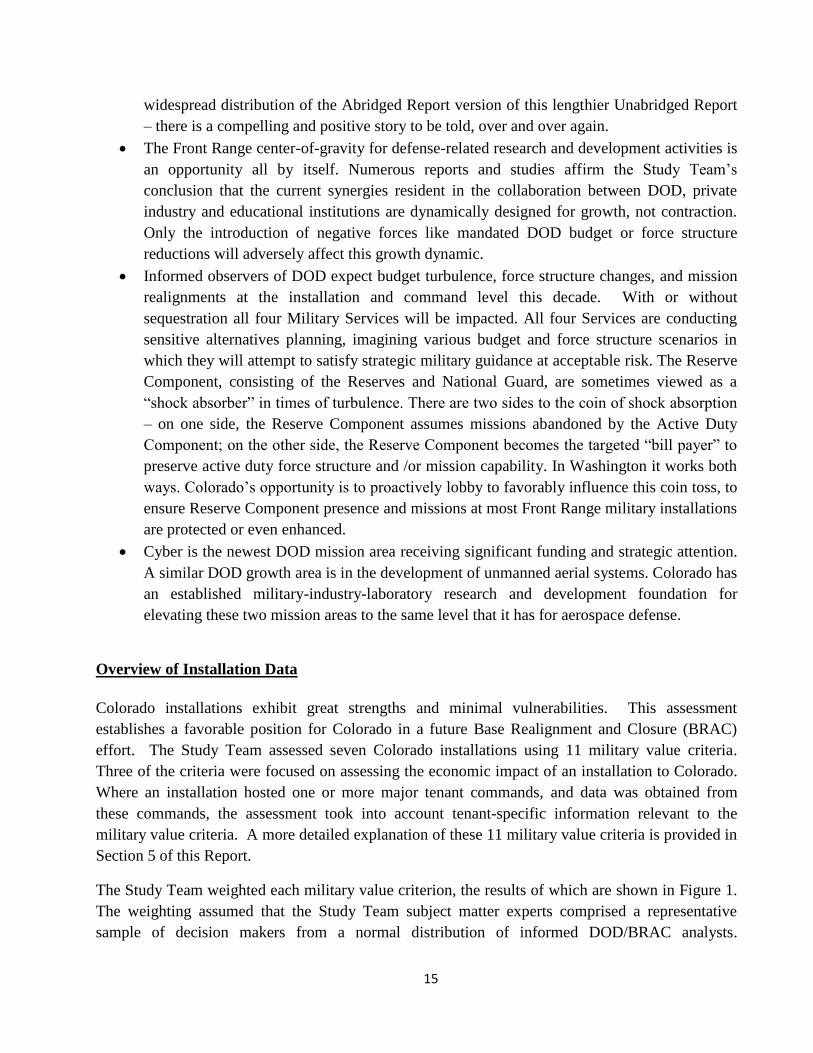
widespread distribution of the Abridged Report version of this lengthier Unabridged Report
– there is a compelling and positive story to be told, over and over again.
The Front Range center-of-gravity for defense-related research and development activities is
an opportunity all by itself. Numerous reports and studies affirm the Study Team’s
conclusion that the current synergies resident in the collaboration between DOD, private
industry and educational institutions are dynamically designed for growth, not contraction.
Only the introduction of negative forces like mandated DOD budget or force structure
reductions will adversely affect this growth dynamic.
Informed observers of DOD expect budget turbulence, force structure changes, and mission
realignments at the installation and command level this decade. With or without
sequestration all four Military Services will be impacted. All four Services are conducting
sensitive alternatives planning, imagining various budget and force structure scenarios in
which they will attempt to satisfy strategic military guidance at acceptable risk. The Reserve
Component, consisting of the Reserves and National Guard, are sometimes viewed as a
“shock absorber” in times of turbulence. There are two sides to the coin of shock absorption
– on one side, the Reserve Component assumes missions abandoned by the Active Duty
Component; on the other side, the Reserve Component becomes the targeted “bill payer” to
preserve active duty force structure and /or mission capability. In Washington it works both
ways. Colorado’s opportunity is to proactively lobby to favorably influence this coin toss, to
ensure Reserve Component presence and missions at most Front Range military installations
are protected or even enhanced.
Cyber is the newest DOD mission area receiving significant funding and strategic attention.
A similar DOD growth area is in the development of unmanned aerial systems. Colorado has
an established military-industry-laboratory research and development foundation for
elevating these two mission areas to the same level that it has for aerospace defense.
Overview of Installation Data
Colorado installations exhibit great strengths and minimal vulnerabilities. This assessment
establishes a favorable position for Colorado in a future Base Realignment and Closure (BRAC)
effort. The Study Team assessed seven Colorado installations using 11 military value criteria.
Three of the criteria were focused on assessing the economic impact of an installation to Colorado.
Where an installation hosted one or more major tenant commands, and data was obtained from
these commands, the assessment took into account tenant-specific information relevant to the
military value criteria. A more detailed explanation of these 11 military value criteria is provided in
Section 5 of this Report.
The Study Team weighted each military value criterion, the results of which are shown in Figure 1.
The weighting assumed that the Study Team subject matter experts comprised a representative
sample of decision makers from a normal distribution of informed DOD/BRAC analysts.

16
Consequently, their input is representative of the population of future BRAC decision makers. The
weights are universal and, thus, not specific to just Colorado.
Figure 1: Weights of Military Value Criteria
The horizontal bars in Figure 1 are arranged from top (most weight) to bottom (least weight) for
each military value criterion. The percentages recorded vertically down the middle of the bars
indicate a criterion’s contribution out of the total available weight (100%).
The Study Team scored each installation using the 11 military value criteria. By applying the
universal weights to the scores, each installation was characterized in terms of its strengths and
vulnerabilities.3 A large criterion weight (i.e., weight ≥ 9%) combined with a high installation
score (i.e., score ≥ 60%) indicates strength. Similarly, a large weight (i.e., weight ≥ 9%) and low
installation score (i.e., ≤ 40%) indicates vulnerability. Subject matter expertise added fidelity to the
segmenting and also allowed the team to synthesize some aggregate insights in terms of strengths,
vulnerabilities, and opportunities.4 The added fidelity was necessary since installations do not share
the exact same roles, missions and functions. For example, if an installation is not intended to be a
power projection platform, the significance of the military value criterion Surge Capability and
Capacity must be placed into context. The assessments are the basis for the aggregate installation-
level strengths, vulnerabilities and opportunities discussed below.
Areas where a weight-score combination was close to either of the stated thresholds (i.e., slightly
above or below) were deemed to be additional areas assessed as strengths or vulnerabilities, as the
case may be, and factored into the development of opportunities. Overall, Colorado military
installations collectively reflect many strengths and only minor vulnerabilities. Figure 2 illustrates
the results of the strengths and vulnerabilities analysis across the spectrum of the 11 military value
criteria. The five main military value strengths nested within the green circle -- Military
Capabilities, Cost of Operations, Availability and Condition of Airspace, Availability and Condition
3 Contact DMVA for the analytical work products that are the source for these characterizations.
4 Opportunities emanate from strengths and vulnerabilities.

17
of Land, and Total Future Force Requirements—indicate that Colorado military installations
provide DOD significant military value through these characterizations. The Study Team assessed
that only three of the six remaining military value criteria represented areas of vulnerability for
Colorado. The cluster and relative relationships of the remaining three military value criteria in the
upper left quadrant were statistically balanced, demonstrating neither noteworthy strength nor
unwelcome vulnerability dimensions for Colorado military installations.
Figure 2: Strengths and Vulnerabilities by Military Value Criteria
The following analysis summarizes the installation-level aggregation assessments.
18
Installation Strengths
Strengths are defined as good or beneficial qualities, existing assets, or attributes, or economic
activity that is real and accruing advantages to DOD or the State of Colorado. These include
tangible installation assets, attributes, or some combination of the two that translate into power for
resisting negative forces such as trends, plans, programs, and policies.
The most significant Colorado installation-level strengths are grounded in Military Capabilities,
Future Total Force Requirements, and Cost of Operations. Availability and Condition of Land and
Availability and Condition of Airspace are additional strong areas for Colorado.
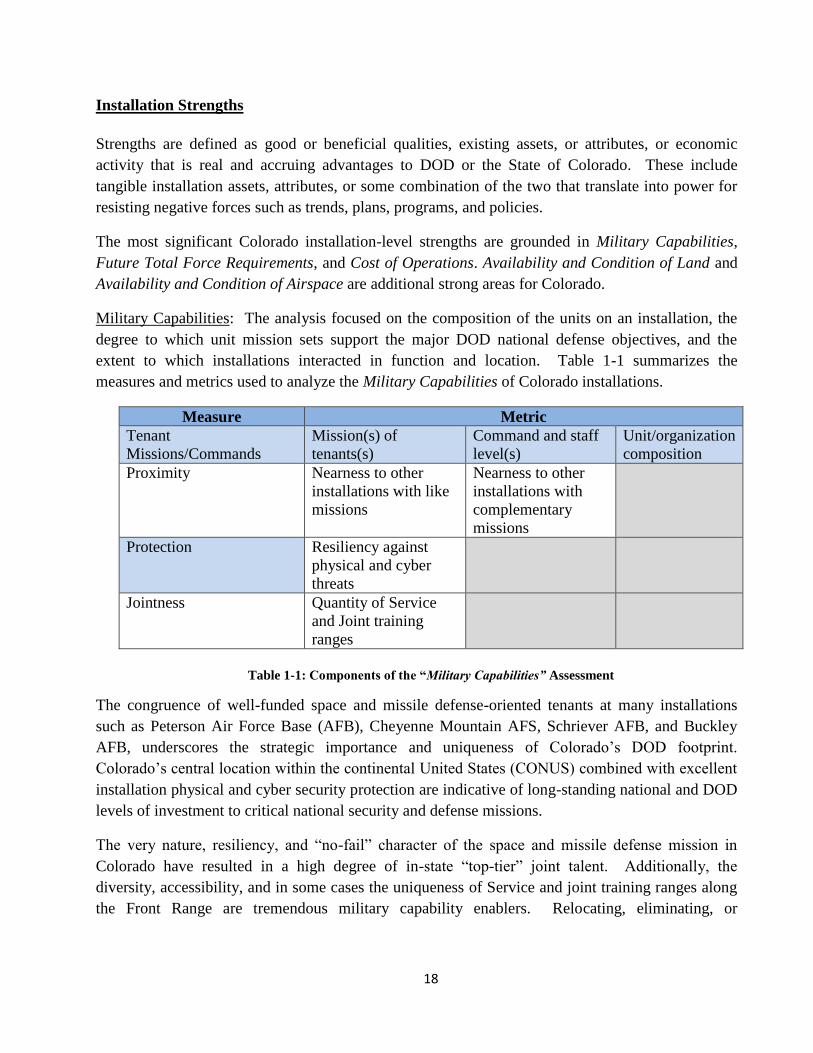
Military Capabilities: The analysis focused on the composition of the units on an installation, the
degree to which unit mission sets support the major DOD national defense objectives, and the
extent to which installations interacted in function and location. Table 1-1 summarizes the
measures and metrics used to analyze the Military Capabilities of Colorado installations.
Measure Metric
Tenant
Missions/Commands
Mission(s) of
tenants(s)
Command and staff
level(s)
Unit/organization
composition
Proximity Nearness to other
installations with like
missions
Nearness to other
installations with
complementary
missions
Protection Resiliency against
physical and cyber
threats
Jointness Quantity of Service
and Joint training
ranges
Table 1-1: Components of the “Military Capabilities” Assessment
The congruence of well-funded space and missile defense-oriented tenants at many installations
such as Peterson Air Force Base (AFB), Cheyenne Mountain AFS, Schriever AFB, and Buckley
AFB, underscores the strategic importance and uniqueness of Colorado’s DOD footprint.
Colorado’s central location within the continental United States (CONUS) combined with excellent
installation physical and cyber security protection are indicative of long-standing national and DOD
levels of investment to critical national security and defense missions.
The very nature, resiliency, and “no-fail” character of the space and missile defense mission in
Colorado have resulted in a high degree of in-state “top-tier” joint talent. Additionally, the
diversity, accessibility, and in some cases the uniqueness of Service and joint training ranges along
the Front Range are tremendous military capability enablers. Relocating, eliminating, or

19
transferring the associated people, missions and commands would require extraordinary effort,
present a costly bill, and demand a significant amount of time to achieve a new steady state.
Future Total Force Requirements: The analysis focused on characterizing who is performing the
missions on installations through a lens of future requirements. Table 1-2 summarizes the measures
and metrics used to analyze the Future Total Force Requirements of Colorado installations.
Measure Metric
Mission Assignation Active, Guard,
Reserve and Civilian
mix
Unit/Mission
Uniqueness
Proximity to
installations with like
missions
Total Force
Demographics
Extent of any
anticipated change in
force structure
Table 1-2: Components of the “Future Total Force Requirements” Assessment
Resiliency is the key strength emanating from Colorado’s robust mixture of Active, Guard, Reserve,
civilian, and civilian-contractor workforce. The total military workforce in Colorado provides Joint,
United States Air Force (USAF), United States Army (USA), and United States Navy (USN)
personnel to fulfill Active and Reserve Component roles, missions and functions. The local retiree
population is a tremendous source for non-DOD manpower to support, sustain and maintain
significant portions of the national and DOD space and missile defense mission.
The current balance of Active Duty, Reserve Component and civilian personnel serving at Colorado
installations, and the flexibility Colorado residents demonstrate in transitioning from one career area
to another, contribute to the positive synergies among the aggregated installations, commands,
missions and capabilities in the Front Range area.
Cost of Operations: The analysis focused on several personnel income-related quality of life
measures (Military Personnel) and the costs of utilities to installations (Operations and Maintenance
– O&M costs). These budget categories normally account for approximately 70% of the DOD
budget. The selected income and installation utilities-related measures therefore provide a DOD
cost-benefit perspective when compared to the same measures for the State of Colorado. Table 1-3
summarizes the measures and metrics used to analyze the Cost of Operations for Colorado
installations.

20
Measures Metrics
Area Comparable Utility Costs Level compared to Colorado average
Installation Housing Allowance Level compared to Colorado average
Average Weekly Wage Level compared to Colorado average
Area Relative Cost of Living Level compared to Colorado average
Table 1-3: Components of the “Cost of Operations” Assessment
Overall, the quality of life services supported by DOD installations and the local communities
around installations are excellent. They compare favorably with the Colorado averages, which are
good on a national basis. Installations enjoy advantageous utility costs compared to the national
average for large-scale industrial users. On and off-installation utilities are reliable. Off-installation
utilities are provided at affordable rates for DOD personnel residing in the local communities.
Availability and Condition of Land: The analysis focused on characterizing the impacts that natural
and man-made geography have on training and operations. Table 1-4 summarizes the measures and
metrics used to analyze the Availability and Condition of Land of Colorado installations.
Measures Metrics
Encroachment Internal and external
restrictions
Quantity of legal
actions
Hazardous
materials
Security/Access Force Protection Physical Security
Climate Training impact
Geography Training impact
Table 1-4: Components of the “Availability & Condition of Land” Assessment
Operations and training are largely unaffected by climate, geography or encroachment issues. The
Colorado climate along the Front Range normally permits training and operations year-around for
most installations. Installations such as Peterson AFB, Schriever AFB, and Cheyenne Mountain
AFS have tenant units that work almost exclusively inside fixed facilities. The United States Air
Force Academy is similarly unaffected. On occasion, travel on and off these and all other
installations is affected by adverse weather conditions. However, as with all DOD installations,
provisions exist for mission essential personnel and functions to continue critical functions and
operations. Other installations such as Fort Carson, Buckley AFB, and Greeley Air National Guard
Station have tenant units whose mission requires outside training and operations. The impact of
climate on these units’ training and operations is minimal since the units have the flexibility to
adjust plans and still maintain overall readiness.
Similarly, the natural geography occupied or otherwise under the control of installations is
sufficient to support tenant unit roles, missions and functions. Encroachment is not a significant
concern from either the perspective of the installations or the communities surrounding them. Fort
Carson, in particular, has a history of recurring issues with the local community surrounding the
Piñon Canyon Maneuver Site. However, the installation has consistently implemented mitigation

21
measures where possible and practical. Training in the Piñon Canyon Maneuver Site remains an
important and viable maneuver training area for Fort Carson. Although the potential exists for
future encroachment issues from the local communities, these would likely not be of a nature to
significantly impact readiness of Fort Carson’s tenant units.
Force Protection via security and access control are sufficient and commensurate with installation
tenant units’ roles, missions and functions. Current and anticipated force protection resources are
sufficient to mitigate current and potential future threats and vulnerabilities.
Availability and Condition of Airspace: The analysis focused on characterizing the impacts that
airspace restrictions or an absence of restrictions have on training and operations. Table 1-5
summarizes the measures and metrics used to analyze the Availability and Condition of Airspace of
Colorado installations.
Measures Metrics
Encroachment Internal and external
restrictions
Quantity of legal
actions
Hazardous
materials
Security/Access Force Protection Physical Security
Climate Training impact
Geography Training impact
Table 1-5: Components of the “Availability & Condition of Airspace” Assessment
Operations and training in the airspace around installations are largely unaffected by climate or
encroachment issues. The Colorado climate along the Front Range normally permits training and
operations year-around for the installations requiring local airspace. The US Air Force Academy
and Buckley AFB are the main users of nearby protected airspace and neither have current or
anticipated encroachment issues. Peterson AFB shares the city-owned, civilian-military Colorado
Springs Municipal Airport. This sharing arrangement is free of intra-installation and civil-military
issues. The airport’s location is an advantage in that it is central to five of Colorado’s seven DOD
installations, including the US Air Force Academy, Cheyenne Mountain AFS, and Schriever AFB.
The notoriety of Cheyenne Mountain AFS coupled with its geographic location bordering a State
Park and National Forest attracts a variety of inquisitive people. While some take advantage of the
lack of airspace restrictions around the facility, none significantly threaten the complex from the air.
The natural geography of the Western Slope provides an excellent aviation training environment.
The High-Altitude Army National Guard Aviation Training Site located in the town of Gypsum,
Colorado on Eagle County Airport offers a unique combination of training location and conditions
with a high altitude training experience for rotary wing aircraft.
Achieving force protection via security and access control from the air are sufficient and
commensurate with installation tenant units’ roles, missions and functions. Current and anticipated
force protection resources are sufficient to mitigate current and potential future threats and
vulnerabilities.

22
Installation Vulnerabilities
Vulnerabilities are defined as existing assets, attributes, trends, or characterizations of Colorado
military installations that are difficult to defend or are open to attack or criticism. These include
economic activity which is or may be harmful to DOD or the State of Colorado.
The most significant Colorado installation-level vulnerabilities, from most significant to least
significant, are grounded in Economic Contribution, Surge Capability/Capacity, and Manpower
Implications and Personnel Availability. The emphasis on these three vulnerabilities is relative and
should not be overstated. Overall, Colorado military installations enjoy a solid foundation and
outlook if faced with the reduction or elimination aspects stemming from a BRAC study.
Economic Contribution: DOD installations provide significant economic benefit to Colorado.
Although this perspective would likely be a factor in any future BRAC study, DOD would probably
weight the opposite perspective, considering the fact that the BRAC study would be driven by the
need for DOD to achieve cost savings. The economic vulnerability is a function of lost wages and
revenue in the areas surrounding military installations. Reductions in DOD budgets or force
structure or both would likely reduce an installation’s economic “engine” for on-base employment
and off-base industrial development. A detailed examination of this concept of Economic
Contribution is found below in the analysis on Economic Impact. Table 1-6 summarizes the
measures and metrics used to analyze the Economic Contribution of Colorado military installations.
Measures & Metrics
Direct Employment Rate
Average Compensation
Indirect Spin-offs and
Agglomeration
Sustainment Leadership
Construction Budget
(MILCON)
Construction Budget
(Non-MILCON)
Non-construction Services
Related Contracts
Table 1-6: Components of the “Economic Contribution” Assessment
Surge Capability/Capacity: The analysis focused on several enablers that are required for a
successful surge. These include provided services, installation surge facilities, and the ability of
local communities to accommodate overflow lodging and meal requirements.
23
Measures Metrics
Enabling Services Extent of organic
support services
Enabling Facilities Extent of organic
support infrastructure
Community Capacity Organic capacity of
the community to
augment shortfalls
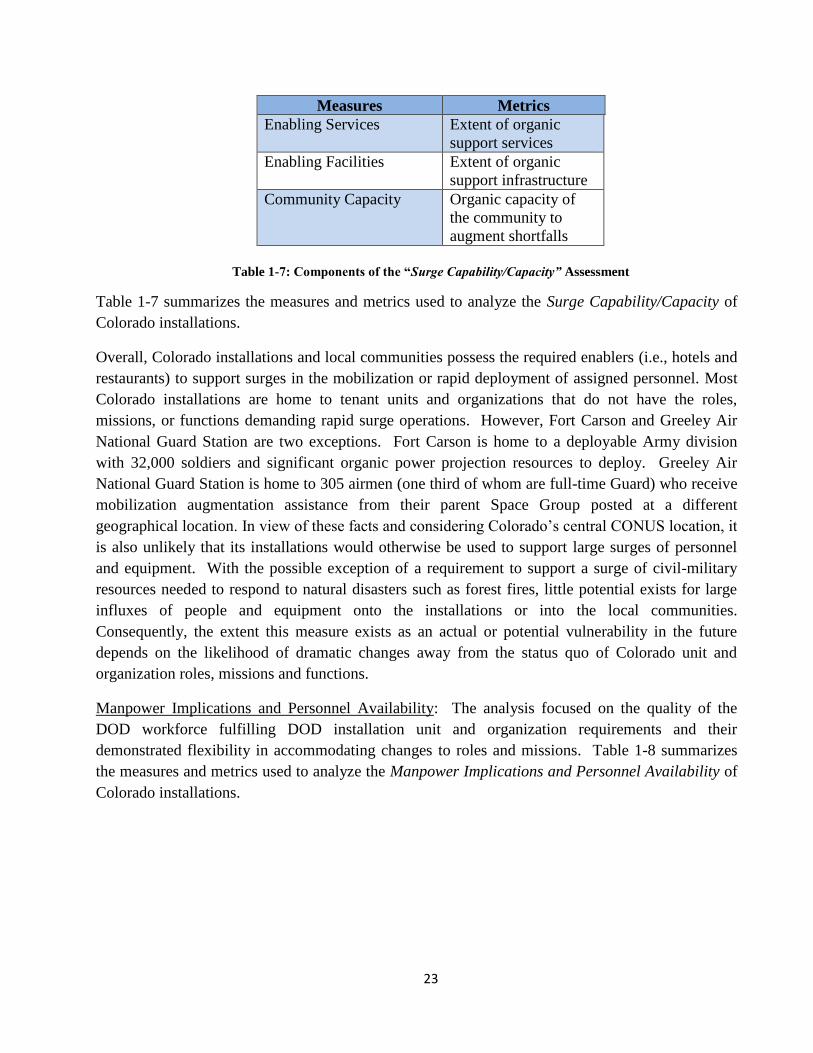
Table 1-7: Components of the “Surge Capability/Capacity” Assessment
Table 1-7 summarizes the measures and metrics used to analyze the Surge Capability/Capacity of
Colorado installations.
Overall, Colorado installations and local communities possess the required enablers (i.e., hotels and
restaurants) to support surges in the mobilization or rapid deployment of assigned personnel. Most
Colorado installations are home to tenant units and organizations that do not have the roles,
missions, or functions demanding rapid surge operations. However, Fort Carson and Greeley Air
National Guard Station are two exceptions. Fort Carson is home to a deployable Army division
with 32,000 soldiers and significant organic power projection resources to deploy. Greeley Air
National Guard Station is home to 305 airmen (one third of whom are full-time Guard) who receive
mobilization augmentation assistance from their parent Space Group posted at a different
geographical location. In view of these facts and considering Colorado’s central CONUS location, it
is also unlikely that its installations would otherwise be used to support large surges of personnel
and equipment. With the possible exception of a requirement to support a surge of civil-military
resources needed to respond to natural disasters such as forest fires, little potential exists for large
influxes of people and equipment onto the installations or into the local communities.
Consequently, the extent this measure exists as an actual or potential vulnerability in the future
depends on the likelihood of dramatic changes away from the status quo of Colorado unit and
organization roles, missions and functions.
Manpower Implications and Personnel Availability: The analysis focused on the quality of the
DOD workforce fulfilling DOD installation unit and organization requirements and their
demonstrated flexibility in accommodating changes to roles and missions. Table 1-8 summarizes
the measures and metrics used to analyze the Manpower Implications and Personnel Availability of
Colorado installations.

24
Measures Metrics
Total Force Demographics Labor force skill level Installation military
to civilian ratio
Quality & Agility of
Personnel
Education
opportunities for the
workforce
Extent that
organizations have
adapted to change in
the past
Table 1-8: Components of the “Manpower Implications & Personnel Availability” Assessment
Colorado’s DOD workforce historically adapts well to change, whether driven by geopolitical
events or changes in strategy, or precipitated by DOD restructuring. Today, the workforce has a
significant density of aerospace and missile defense roles, missions, and functions requiring
personnel with technical skills and advanced degrees. If DOD wanted to reduce, consolidate units
within the State, or relocate units out-of-state, Buckley AFB and Schriever AFB might be
vulnerable to losing organizations or become subject to force structure reductions and mission
realignments. Colorado could be adversely impacted if the affected, departing personnel were not
replaced. Peterson AFB would likely be less affected considering the fact that it is home to a
geographic Combatant Command headquarters, the AF Space Command headquarters, and has a
unique tenant command authority with NORAD. The US Air Force Academy and Fort Carson
would be less vulnerable since both lack similar densities of aerospace and missile defense roles,
missions, functions, and the attendant skilled personnel. Greeley Air National Guard Station has
technically trained personnel. However, it is unlikely that the 233rd
Space Warning Group – the sole
tenant on the installation – would be eliminated given its unique mission.
Installation Opportunities
As noted earlier, opportunities arise from strengths and vulnerabilities. Opportunities are identified
circumstance(s) or suitable occasion(s) that may serve to highlight and reinforce strengths or
mitigate vulnerabilities. Installation opportunities are by definition installation centric and unique.
That suggests that installation military commanders can play a significant role in taking advantage
of installation opportunities. While that may be true in some cases, other local and regional leaders
and groups can play effective roles in advocating initiatives that take advantage of installation
opportunities. Even State and DOD leaders have roles to play. Much of this is outlined in greater
detail in Section 3 below. The following list of installation opportunities represent the Study
Team’s collective assessment based on both the data-driven analysis and numerous conversations
and survey exchanges with installation personnel.
Continue to pursue installation-specific proposals for improvements to roads and highways
that service base entry and exit, or which facilitate the movement of personnel and
equipment to and from training ranges and facilities. The Study Team learned of several
specific road or interchange improvements desired or planned for the US Air Force
Academy (Route 156/Powers interchange), Schriever AFB (safety enhancements for Route

25
94), and Peterson AFB (access road improvements leading to the gates) to name three.
When advocates make the case that these and other transportation network improvements
will add to the installation’s military value to DOD, improve the quality of life of the
workforce, and enhance unit training effectiveness, they have the elements of a compelling
case in seeking funds or local zoning accommodations for these projects.
Take creative advantage of the large and economically vibrant DOD retiree community that
has settled in the Front Range area. They bring a sense of patriotism and a conviction in the
value of Colorado’s installations that makes them effective volunteers for a myriad of base-
related activities and patrons of MWR services provided on base. In many cases these DOD
retirees are in second careers, generating income that contributes to economic prosperity in
the communities surrounding military installations. The variety of numerous off-base
attractions like movie theaters and restaurants is making it more difficult to capture these
retirees in a commercial sense. But there are other installation venues that routinely attract
high usage – all ranks clubs, base exchanges and commissaries, golf courses – and
installations should become keenly sensitive to what retirees will patronize as well as where
they will perform volunteer service and craft programs that take advantage of that.
Expand formal associations with local technical training institutes and universities to
increase the options for higher education available for interested personnel, particularly in
cyber and unmanned aerial systems. There is a tremendous intersection of education,
industry, research and development and military enterprises in the metropolitan Denver area.
There are a number of local and regional business alliances and organizations designed to
cultivate this intersection. Installations might consider hosting meetings or conducting
mission orientation tours to keep local business and education leaders informed on DOD
trends as they are manifested at the installation level. Several Colorado installations reported
engagements with high schools to cultivate opportunities for expanding the technical
learning venues available to students. The Air Force recently announced a sabbatical
program where selected personnel can temporarily disengage from formal AF roles and
responsibilities to seek non-military experiences which, it is hoped, might serve as a sort of
professional development excursion. When these individuals return to active duty, the
expectation is that they will have matured or grown wiser during their time out of uniform.
Colorado AF installations might want to view this sabbatical program as a quality of life
enhancer and, if an assigned member is selected, exert special effort to assist the individual
with pursuing his or her plan of action.
Continue to pursue selective land acquisitions to promote mission flexibility and reduce the
threat of encroachment impacts on installation missions and personnel movements. Some
installations, like Cheyenne Mountain AFS, have no options for footprint expansion; others
have modest opportunities, like some of the proposals within the Blueprint 2050 Plan for
Peterson AFB. Land acquisitions are the most challenging installation-level actions because
of local community equities that have to be accommodated, and because of the complexity
in identifying a willing cohort of government “resource contributors” willing to pay the

26
costs involved. Even so, circumstances can change quickly sometimes and if there is a plan
for a land acquisition, there is a greater chance of executing that plan successfully if the
opportunity presents itself and funding is available.

27
Economic Impact of the Military on Colorado
The economic impact analysis is based on a complex set of inputs from a variety of sources. The
data represent the most recent complete set of inputs that can be found, generally for calendar years
2013 and 2014. The analysis addresses the economic activity that has taken place in Colorado that
can be attributed to the Department of Defense (DOD). The analytical model is focused on two
primary domains: 1) the activity that takes place on or in association with the seven assessed
military installations in Colorado, and; 2) the contracts between the DOD and both private
contractors and recipients of DOD assistance awards.
The model examines the direct, indirect and induced effects of having DOD activity located and
performed in Colorado. The impacts come primarily from:
The presence of a combination of active duty military and civilian workforces at the
military installations
The expenditures of those installations for construction and operations
A large network of recipients of DOD contract and assistance award expenditures for work
done in the State
National Guard and Reserve forces located in the State
Not included are impacts from Veterans Administration (VA) expenditures in Colorado, DOD
travel to the State originating from outside Colorado, and DOD education benefits paid to active
duty military and federal civilian workers from budgets outside the State.5
Economic Impact Analysis
The following series of tables present an outline of the analysis activities used to derive the total
economic impact of the military on Colorado. Tables 1 through 5 and Figure 3 essentially present
the findings at a statewide level.6
The tables that then follow are organized in a building block fashion, first showing the economic
impacts of the military installations and DOD contracts by county level. The five military
installations of Fort Carson, Peterson Air Force Base, Schriever Air Force Base, the United States
Air Force Academy and the Cheyenne Mountain Air Force Station are grouped into one analysis for
El Paso County. Buckley Air Force Base is shown in the Arapahoe County analysis, and the
Greeley Air National Guard Station is shown as the Weld County analysis.
Statewide Analysis
This section of the Report presents the final summation of the economic impact analyses based
upon IMPLAN and Summit Economic models. It excludes other economic analyses found later in
5 If travel and education expenses are paid by Colorado military installations of DOD Colorado contracts, then the
expenses are included. 6 The impacts are derived from IMPLAN and Summit Economics modeling. See methodology explanation in Section 5 of
this report.

28
the Report such as comparisons of DOD to other Colorado industries, economic diversity,
agglomeration effects, and the long-term DOD budget outlook.
Table 1 presents findings in terms of the employment, earnings, and tax revenues to the State of
Colorado that can be attributed to the presence of the DOD. Table 1 also presents an estimate of the
proportion of Colorado’s economy and of its State tax collections that are attributable to the DOD.
In summary it can be said that the DOD is responsible for 5% to 7.5% of the State’s total economy
in terms of employment, earnings and State tax revenues.
Total employment attributable to the DOD in Colorado is just under 170,000 or 5.2% of the total
State employment. Total State employment includes both full time and part time jobs, as do all jobs
attributable to the DOD. Labor income associated with that employment is more than $11.6
Total State Employment (Implan) 3,235,493
Total Employment from DoD Related Expenditures 169,153
Ratio - DOD to Total Labor 5.2%
Total State Labor Income (Implan) 155,381,233,191$
Total Labor Income from DoD Related Earnings (Implan) 11,683,241,677$
Ratio - DOD to Total Labor Income 7.5%
Total Actual State Sales Tax Collections, 2013 2,187,244,101$
Total State Sales, Use and Excise Tax Collections, 2013 3,358,295,290$
Total State Sales Tax Collections from DOD Related Expenditures, 2014 (Implan) 109,431,951$
Total State Sales, Use and Excise Tax Collections from DOD Related Expenditures 168,021,852$
Ratio - Estimated Sales Tax from DOD Related Expenditures to Total Sales Tax 5.0%
Total State Personal Income Tax Collections 5,492,975,311$
Total State Personal Income Tax Collections from DOD Related Expenditures, 2014 300,551,392$
Ratio - DOD to Total Income Tax 5.5%
Total State Corporate Income Tax Collections 652,180,000$
Total State Corporate Income Tax Collections from DOD Related Expenditures, 2014 48,261,320$
Ratio - DOD to Total Labor 7.4%
Total State License, Motor Vehicle, Regulatory & Business, and Other Tax Collections 608,220,356$
Total State "Other" Tax Collections from DOD Related Expenditures, 2014 45,008,306$
Ratio - DOD to Total Labor 7.4%
561,842,870$
Total State Revenues from All Sources, 2013 10,285,452,173$
Share of Total State Tax Revenues from DOD Related Activities 5.5%
Source: Summit Economics, LLC; Colorado Department of Revenue, 2013 Annual Report
Total Revenue to the State of Colorado from Taxes Derived Directly or Indirectly from
DOD Related Activities, 2014
Table 1 - Fiscal Impacts on the State of Colorado from DOD Related
Employment, Earnings and Expenditures

29
billion, 7.5% of total labor income, primarily due to relatively high wages and benefits within the
aerospace and defense private sector industries. Based on those earnings, and subsequent
expenditures of the earnings, approximately 5.5% of total Colorado tax revenue is due to the
presence of the DOD in the State. Of the 170,000 jobs, approximately 26,000 (15%) are outside
the three counties that contain the major military installations.
Tables 2 and 3 distinguish the employment by county and congressional district due to three
circumstances: the presence of military installations and DOD contracts in each of the three
counties with military installations; other counties with DOD contracts; and the presence of
National Guard and Reserves. The employment impacts include jobs created in one county due to
the military installation or DOD contracting in another, termed the trade flow effect. Almost all of
the jobs created in the counties without military installations can be attributed to the trade flow
effect, DOD contracts and assistance or National Guard and Reserves.
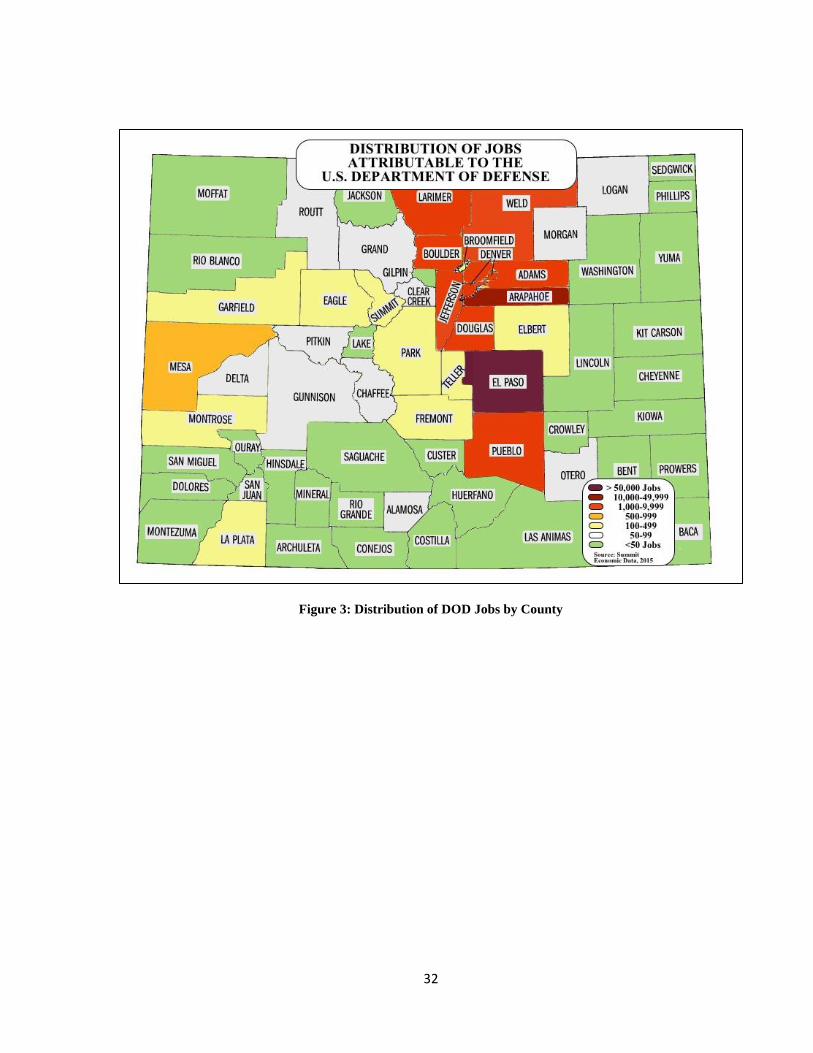
Table 4 breaks out earnings associated with the jobs by county, while Table 5 presents total
earnings by U.S. congressional district. Figure 3 graphically shows the density of employment
impacts by county. Note that all Congressional Districts have at least 3,500 full and part-time jobs
due to the DOD. In some districts like Second, Fifth and Sixth Districts, DOD can be seen as one of
the largest sectors, if not the largest sector in the District.
IMPLAN allows for an estimation of the dispersion of the economic impacts created by the military
installations and their expenditures. When jobs are created in one county, it can be expected that
some additional jobs will be created in nearby counties as the earnings of employees are spent, and
the firm (which in this case is a military installation) buys goods and services from vendors outside
the county in which it is based. This is an example of the trade flow effect. Tables 2 and 3 include
these trade flow effects. These employment impacts are shown graphically on the Figure 3 map.
As would be expected, the majority of the impacts occur along the Front Range; however, 20
counties have employment impacts in the triple digits, with 10 having more than 1,000 jobs created.

30
Adams 589 204 3 119 1,566 2,481 Alamosa 2 16 - - 40 58 Arapahoe 36,311 1,458 2 - - 37,772 Archuleta 0 3 - - 32 35 Baca 0 3 - - 10 13 Bent 2 5 - 4 16 27 Boulder 138 181 3 2,031 880 3,234 Broomfield 50 33 0 210 155 449 Chaffee 4 29 - - 44 78 Cheyenne 1 4 - - - 5 Clear Creek 10 26 - - 24 60 Conejos 1 5 - - 22 27 Costilla 0 2 - - 10 12 Crowley 0 1 - - - 1 Custer 1 7 - - 11 19 Delta 1 3 - - 79 83 Denver 1,403 1,119 3 1,128 2,373 6,025 Dolores 0 0 - - - 0 Douglas 573 1,376 - 57 795 2,801 Eagle 17 50 - 8 139 214 EL Paso 113 106,903 0 - - 107,016 Elbert 50 22 - 2 62 136 Fremont 7 79 - - 102 188 Garfield 16 15 - 1 150 182 Gilpin 1 2 - - 15 18 Grand 7 13 - - 37 57 Gunnison 2 12 - - 39 53 Hinsdale 0 0 - - - 0 Huerfano 0 6 - - 17 24 Jackson 1 1 - - - 1 Jefferson 363 327 - 591 1,488 2,769 Kiowa 1 1 - - - 2 Kit Carson 3 11 - - 20 34 Lake 2 2 - - 19 23 LaPlata 10 19 - 3 135 168 Larimer 71 55 1 219 827 1,173 Las Animas 1 15 - 11 - 27 Lincoln 3 5 - - 12 19 Logan 6 5 - - 50 61 Mesa 10 20 - 345 395 770 Mineral 0 1 - - - 1 Moffet 3 4 - - 35 42 Montezuma 0 2 - - - 2 Montrose 3 17 - - 107 126 Morgan 14 11 - - 74 98 Otero 1 9 - 1 49 60 Ouray 0 1 - - 12 13 Park 3 19 - 2 43 66 Philips 1 1 - - 11 13 Pitkin 12 32 - - 46 90 Prowers 1 6 - - 32 38 Pueblo 21 473 - 475 436 1,404 RioBlanco 1 2 - - 18 21 Rio Grande 1 8 - - 31 40 Routt 9 24 - - 61 95 Saguache 0 1 - - 17 18 SanJuan 0 0 - 20 - 20 SanMiguel 1 9 - - - 10 Sedgwick 1 0 - - - 1 Summit 9 20 - - 74 103 Teller 0 79 - 31 62 173 Washington 2 1 - - 12 16 Weld 114 80 627 - 375 1,196 Yuma 5 2 - - 26 33 Total 39,972 112,837 640 5,258 11,085 169,792
* National Guard and Reserve include both full time and part time positions. National Guard and Reserve for Arapahoe, El Paso
and Weld are included in their Military Installation figures.
Source: Summit Economics, using Implan Models and data from USASpending.gov and BEA.
Arapahoe
County Bases
El Paso County
Bases
Weld County
Bases
DOD Contracts
in Other
National
Guard/Reserve
Total Colorado
DOD Impact
Table 2 - Total DOD Related Employment in Colorado - 2014Direct, Indirect and Induced Employment from Military Installation Operations,
DOD Contracts & Assistance Awards and National Guard/Reserves in Each County

31
County CD1 CD2 CD3 CD4 CD5 CD6 CD7
Adams 174 2,308 Alamosa 58 Arapahoe 378 378 37,016 Archuleta 35 Baca 13 Bent 27 Boulder 3,169 65 Broomfield 256 193 Chaffee 78 Cheyenne 5 Clear Creek 60 Conejos 27 Costilla 12 Crowley 1 Custer 19 Delta 83 Denver 5,784 241 Dolores 0 Douglas 2,801 Eagle 214 EL Paso 107,016 Elbert 136 Fremont 188 Garfield 182 Gilpin 18 Grand 57 Gunnison 53 Hinsdale 0 Huerfano 24 Jackson 1 Jefferson 28 166 2,575 Kiowa 2 Kit Carson 34 Lake 23 LaPlata 168 Larimer 1,173 Las Animas 27 Lincoln 19 Logan 61 Mesa 770 Mineral 1 Moffet 42 Montezuma 2 Montrose 126 Morgan 98 Otero 60 Ouray 13 Park 66 Philips 13 Pitkin 90 Prowers 38 Pueblo 1,404 RioBlanco 21 Rio Grande 40 Routt 95 Saguache 18 SanJuan 20 SanMiguel 10 Sedgwick 1 Summit 103 Teller 173 Washington 16 Weld 1,196 Yuma 33
Total 5,812 5,379 3,578 4,997 107,519 37,190 5,317
Source: Summit Economics, LLC
Employment by Congressional District by County
Table 3 - Total DOD Related Employment by Congressional
District, 2014
32
Figure 3: Distribution of DOD Jobs by County

33
Table 4 - Total DOD Related Earnings, by County, 2014
Adams 28,793,210$ 10,882,630$ 151,949$ 10,112,524$ 11,901,600$ 61,841,913$ Alamosa 13,322$ 903,954$ -$ -$ 304,000$ 1,221,277$ Arapahoe 2,857,116,375$ 119,842,378$ 182,065$ -$ -$ 2,977,140,818$ Archuleta 9,790$ 83,935$ -$ -$ 243,200$ 336,926$ Baca 13,104$ 140,230$ -$ -$ 76,000$ 229,334$ Bent 4,498$ 115,972$ -$ 331,306$ 121,600$ 9,487,533$ Boulder 8,918,655$ 12,719,638$ 149,954$ 172,652,693$ 6,688,000$ 195,155,845$ Broomfield 2,945,559$ 2,516,285$ -$ 17,870,172$ 1,178,000$ 21,649,220$ Chaffee 84,763$ 699,369$ -$ -$ 334,400$ 1,055,747$ Cheyenne 21,978$ 149,883$ -$ 16,462$ -$ 504,397$ Clear Creek 338,053$ 657,537$ -$ -$ 182,400$ 860,813$ Conejos 20,876$ 102,796$ -$ -$ 167,200$ 274,866$ Costilla 4,870$ 53,091$ -$ -$ 76,000$ 133,961$ Crowley 1,212$ 39,869$ -$ -$ -$ 41,081$ Custer 16,562$ 294,259$ -$ -$ 83,600$ 394,420$ Delta 54,118$ 109,713$ -$ 11,118$ 600,400$ 775,349$ Denver 119,641,264$ 103,005,328$ 262,618$ 95,846,152$ 18,034,800$ 336,790,162$ Dolores 491$ 1,063$ -$ -$ -$ 1,554$ Douglas 38,904,222$ 114,795,515$ -$ 4,806,329$ 6,042,000$ 164,548,065$ Eagle 815,987$ 2,647,127$ -$ 693,235$ 1,056,400$ 5,212,748$ EL Paso 5,343,092$ 7,573,870,125$ 8,062$ -$ -$ 7,579,221,279$ Elbert 2,046,497$ 741,171$ -$ 195,895$ 471,200$ 3,454,763$ Fremont 279,119$ 2,998,927$ -$ -$ 775,200$ 4,053,246$ Garfield 630,045$ 770,073$ -$ 45,417$ 1,140,000$ 2,585,535$ Gilpin 35,188$ 93,282$ -$ -$ 114,000$ 242,470$ Grand 226,758$ 592,886$ -$ 38,933$ 281,200$ 1,139,777$ Gunnison 77,360$ 561,472$ -$ -$ 296,400$ 935,232$ Hinsdale 415$ 1,585$ -$ -$ -$ 2,000$ Huerfano 7,997$ 178,955$ -$ -$ 129,200$ 316,152$ Jackson 36,988$ 27,040$ -$ -$ -$ 64,028$ Jefferson 21,703,744$ 19,540,694$ -$ 50,276,663$ 11,308,800$ 102,829,901$ Kiowa 13,751$ 32,313$ -$ -$ -$ 46,064$ Kit Carson 115,020$ 475,801$ -$ -$ 152,000$ 742,822$ Lake 117,474$ 81,537$ -$ 3,243$ 144,400$ 346,655$ LaPlata 990,451$ 1,861,068$ -$ 268,482$ 1,026,000$ 4,146,001$ Larimer 3,337,578$ 2,906,621$ 22,915$ 18,582,974$ 6,285,200$ 31,135,289$ Las Animas 29,151$ 807,859$ -$ 922,759$ -$ 1,759,769$ Lincoln 87,195$ 274,133$ -$ -$ 91,200$ 452,528$ Logan 295,188$ 224,777$ -$ -$ 380,000$ 899,964$ Mesa 403,605$ 967,907$ -$ 29,357,313$ 3,002,000$ 33,730,825$ Mineral 1,838$ 22,377$ -$ -$ -$ 24,214$ Moffet 152,982$ 227,870$ -$ -$ 266,000$ 646,852$ Montezuma 12,422$ 80,332$ -$ -$ -$ 92,753$ Montrose 106,578$ 904,606$ -$ -$ 813,200$ 1,824,384$ Morgan 711,367$ 573,039$ 7,644$ 30,361$ 562,400$ 1,884,811$ Otero 33,949$ 408,402$ -$ 122,413$ 372,400$ 937,164$ Ouray 4,769$ 22,039$ -$ -$ 91,200$ 118,008$ Park 35,105$ 346,036$ -$ 141,061$ 326,800$ 849,002$ Philips 29,907$ 31,046$ -$ -$ 83,600$ 144,554$ Pitkin 307,851$ 1,147,858$ -$ -$ 349,600$ 1,805,309$ Prowers 27,386$ 204,871$ -$ 16,070$ 243,200$ 491,527$ Pueblo 1,172,322$ 25,229,347$ -$ 40,346,003$ 3,313,600$ 70,061,272$ RioBlanco 26,387$ 129,912$ -$ -$ 136,800$ 293,098$ Rio Grande 28,333$ 354,830$ -$ -$ 235,600$ 618,763$ Routt 453,362$ 1,297,014$ -$ 8,155$ 463,600$ 2,222,130$ Saguache 15,195$ 85,328$ -$ -$ 129,200$ 229,723$ SanJuan 714$ 2,441$ -$ -$ -$ 3,155$ SanMiguel 27,473$ 317,236$ -$ -$ -$ 344,709$ Sedgwick 19,504$ 14,427$ -$ -$ -$ 33,931$ Summit 414,701$ 810,601$ -$ 20,503$ 562,400$ 1,808,205$ Teller 16,068$ 3,598,566$ -$ 2,665,386$ 471,200$ 6,751,221$ Washington 46,893$ 40,272$ -$ -$ 91,200$ 178,365$ Weld 5,532,978$ 4,305,219$ 33,004,795$ -$ 2,850,000$ 45,692,991$ Yuma 149,482$ 78,499$ -$ -$ 197,600$ 425,581$ Total 3,102,823,087$ 8,017,000,964$ 33,790,002$ 445,381,624$ 84,246,000$ 11,683,242,049$ Outside Base Counties 245,706,713$ 443,130,839$ 785,207$ 445,381,624$ 81,396,000$ 1,135,004,382$
* National Guard and Reserve include both full time and part time positions.
Source: Summit Economics, using Implan Models and data from USASpending.gov and BEA.
Includes Direct, Indirect and Induced Earnings from Military Base Operations, DOD Contracts and
Assistance, and National Guard/Reserves
Arapahoe County
Bases
El Paso County
Bases
Weld County
Bases
DOD Contracts in
Other Counties
National
Guard/Reserve
Total Colorado
DOD Impact

34
Table 5 shows the total labor earnings by
Congressional District. Again, labor income includes
wages, benefits and proprietors’ income. In summary,
Colorado receives almost $11.7 billion in labor
income, with almost 10% spread to counties other
than the three that contain military installations.
Military Installation County-Level Analysis
Table 6 shows the key military installation inputs into the economic impact model. The inputs are
broken down into military and civilian personnel. It shows the number of those two categories of
personnel by installation. The civilian category is further decomposed into professional and non-
professional sub-categories. Contractors working on the military installations are not shown as the
impact of those contractors is separately estimated in later steps.
The magnitude of the military presence in Colorado can be quickly seen from the presence of
60,000 military and civilian personnel at the seven military installations analyzed.
Data used to build Table 6 was provided by each military installation within the State. The data
was subject to some adjustments to account for part-time personnel. Additional classification of
employment into specific North American Industry Classification System (NAICS) categories was
also required for the analysis phase.
CD 1 $324,346,854
CD 2 $274,720,540
CD 3 $130,521,667
CD 4 $263,869,999
CD 5 $7,591,930,495
CD 6 $2,921,926,935
CD 7 $175,925,558
Total 11,683,242,049$
Source: Summit Economics, LLC
Table 5 - DOD Related Labor
Earnings by Congressional
District, 2014

35
In addition to the employment impacts at the seven installations, each installation spends significant
funds to operate. For those familiar with impact analysis, these sorts of expenditures are normally
included in employment multipliers; however, for Federal operations they are not included. As a
consequence, certain expenditures must be separately estimated and their impacts analyzed.
Expenditures for operations and construction at military installations are obligated using several
different methods of funding. Many expenditures are performed by contract, while some are made
using purchase cards and direct billing. No central reporting source was found that reported
expenditures by these categories, so Table 7 presents an approximation of the split. The
approximation is based on interviews with several military base budget or base operation managers.
The economic impact of the contract expenditures are then analyzed separately from the impacts of
the direct expenditures not shown as DOD contract expenditures. For this analysis, half of all
operations and maintenance expenditures, and all construction and “other” spending, are assumed to
be contract based. That means that their impact is estimated in a later step to be shown in Table 8.
The remaining direct expenditures at the installations are added to the impacts resulting from the
military installation personnel.
Military
Installations Fort Carson
Peterson Air
Force Base
Schriever Air
Force Base
Cheyenne
Mountain
Air Force
Academy
Total El Paso
County
Buckley -
Arapahoe
County
Greeley ANG -
Weld County
Employment
Military 26,455 6,495 2,145 300 5,800 41,195 6,779 305
Civilian
Prof, excl contractors 2,529 3,218 495 135 1,448 7,825 1,613 12
Non Professional 843 1,073 165 - 858 2,939 538 -
Total 29,827 10,785 2,805 435 8,106 51,958 8,929 317
Military employment includes Active Duty, National Guard and Reserves. National Guard and Reserves estimated on a FTE basis.
Civilian employment separated into two categories: professional and non professional, based on interviews with budget staff. Overall average applied.
Contractor employment is estimated separately. Contractor employment estimated using DOD Contractor databases and Implan modeling.
Sources: Summit Economics, LLC and Reports/Briefings Provided by Each Installation
Table 6 - Employment on Military Installations, 2014

36
The non-contract operations and maintenance (O&M) expenditures shown in Table 7 were then
broken down into different industry classifications or NAICS codes. Each different NAICS code
has a different economic impact. The NAICS codes and the distribution between NAICS code
were selected to create a representative look at how those expenditures might look if precise
expenditure records were available. The non-contract expenditures at the five military installations
in El Paso County were combined. Generally, these expenditures were modeled as a combination of
utilities, printing, educational services, transportation, social assistance, food services, furniture and
other support activities.
Table 8 presents a summary of the DOD contract and assistance awards modeled in the analysis.
DOD contracts and assistance awards were obtained from the federal database USASpending.7 All
contracts and awards given in 2014 were downloaded from the site, and subject to sorting and
categorizing. The total number of contracts and awards given in the three military installation
counties exceeded 9,500, and the total awarded in all of Colorado exceeded 13,700.
Table 8 shows the dollar amounts awarded in each of the three military installation counties in the
most represented three-digit NAICS categories. [NOTE: The NAICS codes were then converted to
IMPLAN codes which are a key element to run the economic impact analysis.] In the case of El
Paso County, the top thirteen categories represent 90% of all contracts and awards. In the case of
Arapahoe County, the top seven categories represent 95% of all expenditures. The economic
impacts estimated are based on the amounts shown in Table 8, boosted to equal 100% of all
expenditures. The impacts of the contracts and awards in the remaining, non-military installation
counties is estimated in a later step but shown earlier in Tables 2-4.
7 www.USASpending.gov
Military
Installations Fort Carson
Peterson Air
Force Base
Schriever Air
Force Base
Cheyenne
Mountain
Air Force
Academy
Total El Paso
County
Buckley -
Arapahoe
County
Greeley ANG -
Weld CountyExpenditures
O&M 159,163,900$ 130,400,000$ 99,000,000$ 4,700,000$ 32,800,000$ 426,063,900 58,000,000$ 600,000$
% Non Contract 50% 50% 50% 50% 50% 50% 50% 50%
Military Construction 229,400,000$ 10,550,000$ 1,900,000$ 1,580,000$ 11,700,000$ 255,130,000$ 22,400,000$ 15,200,000$
% Non Contract 0% 0% 0% 0% 0% 0% 0% 0%
Other Expenditures 150,500,000$ 430,100,000$ 97,000,000$ 126,200,000$ 65,000,000$ 868,800,000$ 152,000,000$ -$
% Non Contract 0% 0% 0% 0% 0% 0% 0% 0%
All Non-Contract Expenditure impacts are estimated through direct Implan modeling. Contract expenditure impacts estimated separately based on
DOD Contractor impact models. In general, only O&M contained expenditures that were not contract based.
Source: Summit Economics, LLC
Table 7 - Expenditures at Military Installations, 2014

37
Outputs from the Economic Analysis
Once the data was collected, it was entered into economic impact models created using IMPLAN
software. IMPLAN is a nationally recognized modeling system, widely used for private and public
sector projects.8
Models were built for each county (El Paso, Arapahoe and Weld) that contained a military
installation. The modeling was done in stages, with the first analysis of the impacts of the military
and civilian personnel, followed by a second run of just the operation expenditures, followed by a
third run with just the DOD Contract and Assistance expenditures. Each run was then combined.
The combined impacts represented the first round of impacts within El Paso, Arapahoe and Weld
counties.
Because the analysis is concerned with the impact upon the entire State of Colorado, additional
modeling efforts were required. Another series of analysis were then performed to assess the trade
flow impacts of expenditures in the three counties upon other counties in Colorado. The trade flow
represents how economic activities in one county can impact the economies of other counties
through the purchases made by the military installation, its personnel, firms that support the
installation, and people who have jobs due to the presence of the installations when they spend their
earnings throughout the State. By combining the trade flow effects with the impacts in the three
military installation counties, a statewide total was created.
8 IMPLAN is a product of IMPLAN Group, LLC. It has become an industry standard.
El Paso County
Arapahoe
County
Weld
County
Utilities - Electric 24,354,008$ Nonsched Chartered Freight Air Trans * 2,430,661,757$ Justice, Public Order, Safety 8,713,525$
Heavy and Civil Eng Constr 33,777,998$ R&D in Phys, Eng, and Life Science 318,389,295$ Petroleum Refineries 1,519,700$
Construction of Buildings 380,362,334$ Other Aircraft Parts and Aux. Equip Mfg 195,339,093$ Furniture and Related Mfg 132,214$
Air Transportation 15,184,190$ Engineering Services 40,037,898$ Contracts Modeled 10,365,439$
Truck Transportation 14,464,905$ Educational Services 26,430,131$
Telecommunications 153,490,795$ Construction of Buildings 21,352,361$
Engineering Services 212,323,983$ Heavy and Civil Eng Construction 16,917,139$
Computer Facilities Management 305,193,320$ Contracts Modeled 3,049,127,675$
Other Computer Related Services 17,517,261$
R&D in the Phys, Eng, and Life Science 526,603,729$ * Nonscheduled chartered freight air transportion is the
Facilities Support Services 137,520,980$ NAICS code for satellite launching
Facilities Support Services 23,783,114$
Offices of Physicians (ex Mental Hlth) 16,062,202$
Contracts Modeled 1,860,638,821$
Total DOD Contracts 2,044,798,575$ Total DOD Contracts 3,190,081,763$ Total DOD Contracts 1,652,109$
Total DOD Assistance 30,607,582$ Total DOD Assistance 13,408,710$ Total DOD Assistance 8,713,525$
Total DOD 2,075,406,157$ Total DOD 3,203,490,473$ Total DOD 10,365,634$
% Tot Value Modeled 90% 95% 100%
Number of Contracts 2,924 6,612 102
Total Number of DOD Contracts and Assistance Awards in Colorado, 2014 13,714
Source: Summit Economics, LLC, based on USAspending.gov reports
Table 8 - Distribution of All DOD Contract and Assistance Awards Expenditures in Counties with
Military Installations, 2014

38
Table 9 shows the combined impact of all seven military installations in the three counties of El
Paso, Arapahoe and Weld. In just these three counties, total employment in Colorado is almost
144,000 higher as a result of DOD activities than it would be otherwise. The total labor income in
the three counties created by DOD activities is $10.5 billion. Impacts occurring within other
counties were included earlier in Tables 2-4.

39
On Base Military and Non Contract Civilian Personnel
This includes all Military and Civilian Employees. Excludes Contractors, O&M and MilCon
Employment Labor Income Value Added Output
Direct 61,204 5,562,506,454$ 10,541,770,759$ 11,571,386,807$
Indirect 3,491 168,042,402$ 279,836,245$ 439,773,319$
Induced 26,341 1,073,381,702$ 2,035,581,023$ 3,272,197,942$
91,036 6,803,930,558$ 12,857,188,027$ 15,283,358,068$
Military Base O&M. Excludes Contract O&M and MilCon.
Employment Labor Income Value Added Output
Direct 3,170 106,778,757$ 141,182,810$ 257,631,950$
Indirect 456 21,150,959$ 35,476,200$ 57,934,424$
Induced 579 23,503,108$ 44,551,555$ 71,477,412$
4,205 151,432,824$ 221,210,565$ 387,043,786$
Combined Military & Civilian Employees and Non Contract O&M.
Employment Labor Income Value Added Output
Direct 64,374 5,669,285,211$ 10,682,953,569$ 11,829,018,757$
Indirect 3,947 189,193,361$ 315,312,445$ 497,707,743$
Induced 26,920 1,096,884,810$ 2,080,132,578$ 3,343,675,354$
95,241 6,955,363,382$ 13,078,398,592$ 15,670,401,854$
DOD Contracts and Assistance
Employment Labor Income Value Added Output
Direct 22,897 2,195,643,433$ 2,569,992,694$ 5,548,519,684$
Indirect 13,667 763,245,874$ 1,091,314,474$ 1,671,977,299$
Induced 12,045 547,013,439$ 981,427,931$ 1,543,911,347$
48,610 3,505,902,746$ 4,642,735,099$ 8,764,408,329$
Combined Military & Civilian Employees, Non Contract O&M, and DOD Contracts and Assistance
Employment Labor Income Value Added Output
Direct 87,271 7,864,928,644$ 13,252,946,263$ 17,377,538,441$
Indirect 17,614 952,439,235$ 1,406,626,919$ 2,169,685,042$
Induced 38,965 1,643,898,249$ 3,061,560,509$ 4,887,586,701$
143,851 10,461,266,128$ 17,721,133,691$ 24,434,810,183$
Source: Summit Economics, LLC
Table 9 - Combined El Paso, Arapahoe and Weld County Military
Installation and DOD Contracting Impacts

40
Table 10 shows the economic impacts resulting just from the military and non-contractor civilians
at the five El Paso County military installations (Fort Carson, Peterson AFB, Schriever AFB,
Cheyenne Mountain AFS and the US Air Force Academy). In summary, it shows the direct
employment of 52,000 personnel creates an additional 26,000 indirect and induced jobs. The non-
contract O&M expenditures then create about 3,500 more jobs, and finally the DOD contracts and
expenditures create almost 25,000 more jobs, for a grand total of almost 107,000 total direct,
indirect and induced jobs. The direct employment figures for military and non-contractor civilians
come from the military installations. The non-contract O&M from contracts and assistance awards
are produced by IMPLAN, based on the dollar expenditures. Total labor income, which includes
wages, benefits and proprietors income, exceeds $7.5 billion. In just El Paso County, total
economic output is increased by more than $17.2 billion.

41
On Base Military and Non Contract Civilian Personnel
This includes all Military and Civilian Employees. Excludes Contractors, O&M and MilCon
Employment Labor Income Value Added Output
Direct 51,957 4,845,246,544$ 9,078,338,342$ 9,949,287,578$
Indirect 2,827 128,386,352$ 221,462,799$ 352,289,432$
Induced 23,636 934,610,413$ 1,801,009,652$ 2,900,979,860$
78,420 5,908,243,309$ 11,100,810,793$ 13,202,556,870$
Military Base O&M. Excludes Contract O&M and MilCon
Employment Labor Income Value Added Output
Direct 2,712 86,609,385$ 116,841,933$ 213,031,950$
Indirect 383 17,156,026$ 29,592,735$ 48,519,403$
Induced 492 19,465,806$ 37,502,034$ 60,414,275$
3,587 123,231,217$ 183,936,702$ 321,965,628$
Combined Military & Civilian Employees and Non Contract O&M
Employment Labor Income Value Added Output
Direct 54,669 4,931,855,929$ 9,195,180,275$ 10,162,319,528$
Indirect 3,210 145,542,378$ 251,055,534$ 400,808,835$
Induced 24,128 954,076,219$ 1,838,511,686$ 2,961,394,135$
82,007 6,031,474,526$ 11,284,747,495$ 13,524,522,498$
DOD Contracts and Assistance
Employment Labor Income Value Added Output
Direct 13,942 1,072,026,289$ 1,283,465,411$ 2,348,398,039$
Indirect 4,808 227,045,419$ 375,929,808$ 600,760,637$
Induced 6,156 243,323,891$ 468,658,628$ 755,094,759$
24,906 1,542,395,599$ 2,128,053,846$ 3,704,253,435$
Combined Military & Civilian Employees, Non Contract O&M, and DOD Contracts and Assistance
Empl Labor Income Value Added Output
Direct 68,611 6,003,882,218$ 10,478,645,686$ 12,510,717,567$
Indirect 8,018 372,587,797$ 626,985,342$ 1,001,569,472$
Induced 30,284 1,197,400,110$ 2,307,170,314$ 3,716,488,894$
106,913 7,573,870,125$ 13,412,801,341$ 17,228,775,933$
Source: Summit Economics, LLC
Table 10 - El Paso County Military
Installation and DOD Contracting Impacts

42
Table 11 shows the impacts of the military installation (Buckley Air Force Base) and DOD
contracts and assistance awards in Arapahoe County. In total, DOD expenditures are responsible
for more than 36,000 jobs and $2.8 billion in labor income in Arapahoe County alone.
On Base Military and Non Contract Civilian Personnel
This includes all Military and Civilian Employees. Excludes Contractors, O&M and MilCon
Employment Labor Income Value Added Output
Direct 8,930 703,422,279$ 1,421,535,281$ 1,577,933,873$
Indirect 661 39,563,353$ 58,225,768$ 87,230,493$
Induced 2,654 136,928,383$ 231,050,594$ 365,422,006$
12,245 879,914,015$ 1,710,811,643$ 2,030,586,372$
Military Base O&M. Excludes Contract O&M and MilCon.
Employment Labor Income Value Added Output
Direct 330 13,159,193$ 17,156,254$ 29,000,000$
Indirect 49 3,030,474$ 4,537,775$ 6,910,874$
Induced 58 2,981,336$ 5,030,768$ 7,738,648$
437 19,171,003$ 26,724,797$ 43,649,522$
Combined Military & Civilian Employees and Non Contract O&M.
Employment Labor Income Value Added Output
Direct 9,260 716,581,472$ 1,438,691,535$ 1,606,933,873$
Indirect 710 42,593,827$ 62,763,543$ 94,141,367$
Induced 2,712 139,909,719$ 236,081,362$ 373,160,654$
12,682 899,085,018$ 1,737,536,440$ 2,074,235,894$
DOD Contracts and Assistance
Employment Labor Income Value Added Output
Direct 8,917 1,119,705,801$ 1,281,531,056$ 3,189,387,389$
Indirect 8,839 535,275,837$ 714,067,260$ 1,068,818,691$
Induced 5,872 303,049,719$ 511,546,871$ 786,804,102$
23,629 1,958,031,357$ 2,507,145,188$ 5,045,010,182$
Combined Military & Civilian Employees, Non Contract O&M, and DOD Contracts and Assistance
Employment Labor Income Value Added Output
Direct 18,177 1,836,287,273$ 2,720,222,591$ 4,796,321,262$
Indirect 9,549 577,869,664$ 776,830,803$ 1,162,960,058$
Induced 8,584 442,959,438$ 747,628,233$ 1,159,964,756$
36,311 2,857,116,375$ 4,244,681,628$ 7,119,246,076$
Source: Summit Economics, LLC
Table 11 - Arapahoe County Military
Installation and DOD Contracting Impacts

43
Table 12 shows the impacts of the military installation (Greeley Air National Guard Station) and
DOD contracts and assistance awards in Weld County. In total, DOD expenditures are responsible
for more than 600 jobs and $30 million in labor income in Weld County alone.
On Base Military and Non Contract Civilian Personnel
This includes all Military and Civilian Employees. Excludes Contractors, O&M and MilCon
Employment Labor Income Value Added Output
Direct 317 13,837,631$ 41,897,136$ 44,165,356$
Indirect 3 92,697$ 147,678$ 253,394$
Induced 51 1,842,906$ 3,520,777$ 5,796,076$
371 15,773,234$ 45,565,591$ 50,214,826$
Military Base O&M. Excludes Contract O&M and MilCon.
Employment Labor Income Value Added Output
Direct 128 7,010,179$ 7,184,623$ 15,600,000$
Indirect 24 964,459$ 1,345,690$ 2,504,147$
Induced 29 1,055,966$ 2,018,753$ 3,324,489$
181 9,030,604$ 10,549,066$ 21,428,636$
Combined Military & Civilian Employees and Non Contract O&M.
Employment Labor Income Value Added Output
Direct 445 20,847,810$ 49,081,759$ 59,765,356$
Indirect 27 1,057,156$ 1,493,368$ 2,757,541$
Induced 80 2,898,872$ 5,539,530$ 9,120,565$
552 24,803,838$ 56,114,657$ 71,643,462$
DOD Contracts and Assistance
Employment Labor Income Value Added Output
Direct 38 3,911,343$ 4,996,227$ 10,734,256$
Indirect 20 924,618$ 1,317,406$ 2,397,971$
Induced 17 639,829$ 1,222,432$ 2,012,485$
75 5,475,790$ 7,536,065$ 15,144,712$
Combined Military & Civilian Employees, Non Contract O&M, and DOD Contracts and Assistance
Employment Labor Income Value Added Output
Direct 483 24,759,153$ 54,077,986$ 70,499,612$
Indirect 47 1,981,774$ 2,810,774$ 5,155,512$
Induced 97 3,538,701$ 6,761,962$ 11,133,050$
627 30,279,628$ 63,650,722$ 86,788,174$
Source: Summit Economics, LLC
Table 12 - Weld County Military
Installation and DOD Contracting Impacts

44
Table 13 - Average Labor Income of DOD Related Activities, El Paso, Arapahoe and Weld Counties
Job Type Employment Average Labor Income
Direct 87,271 $ 90,120
Indirect 17,614 $ 54,073
Induced 38,965 $ 42,189
Total 143,851 $ 72,723
Source: Summit Economics, LLC
The output of these models included both the direct jobs supported and the indirect and induced
jobs created as a result. Table 13 presents the average labor income of DOD related employment
for the three counties combined. In total, the employment impact of the military in the three
counties is approximately 144,000. Labor income, which includes all benefits and labor overheads,
totals over $10.4 billion. The average labor income for direct jobs is over $90,000, while the
indirect and induced job averages are somewhat lower. Indirect jobs are those that arise due to
providing support directly to the military installations and typically consist of a larger mix of non-
professional jobs, and subsequently have lower wages. Induced jobs typically include the general
retail and service jobs found in all economies, and have the lowest percentage of highly skilled and
highly paid workers.
The average direct labor income of $90,000, and $72,000 for all jobs, is not the same as an average
wage. Average wages will vary significantly between sectors. Most military installations had an
effective average wage in the $58,000 per year range, while aerospace professionals often have
wages well above $100,000 per year. Labor income does include a non-wage component of
proprietors’ income, and some non-wage benefits. In general, average wages are about 10% lower
than average labor income. Wages of indirect and induced workers will more closely reflect the
community at large.
The statewide economic impact occurs not just in the three counties with military installations, but
throughout the State. Contracts and assistance awards for DOD are identified based on the location
of the firm receiving the contract. While the vast majority of such firms are located throughout the
Metro Denver area and in El Paso County, significant numbers are located throughout the State.
There are almost 14,000 separate contracts and assistance awards let to firms and other entities
doing business in Colorado, with almost every county having some recipients of these funds. Table
14 shows the value of DOD contracts made in all counties of Colorado. These economic impacts of
the expenditures in all other counties other than El Paso, Arapahoe and Weld Counties were
separately modeled in IMPLAN, and added to the impacts from the three counties.

45
Total
ADAMS 343,980$
ALAMOSA 248,681$
ARAPAHOE 18,799,819$
BOULDER 23,006,672$
DENVER 9,171,071$
EL PASO 8,432,838$
JEFFERSON 3,378,606$
LARIMER 8,380,309$
PUEBLO 1,691,279$
WELD 390,600$
TOTAL 73,843,855$
Source: Summit Economics, LLC and USASpending.gov
Table 15 - DOD Assistance Awards by
County, 2014
Like contracts, DOD assistance awards also
have a direct impact on the State. These
assistance awards are awards to State and local
government as well as universities and non-
profit organizations. Table 15 shows the
assistance awards that were modeled along
with the DOD contracts.
ADAMS 12,067,389$ JEFFERSON 59,995,708$
ALAMOSA (3,274)$ LA PLATA 320,382$
ARAPAHOE 3,190,081,763$ LAKE 3,870$
BENT 395,351$ LARIMER 22,175,272$
BOULDER 206,028,400$ LAS ANIMAS 1,101,139$
BROOMFIELD 21,324,678$ MESA 35,032,412$
CHEYENNE 19,644$ MONTROSE (21,906)$
DELTA 13,267$ MORGAN 36,230$
DENVER 114,374,290$ OTERO 146,077$
DOUGLAS 5,735,446$ PARK 168,330$
EAGLE 827,245$ PROWERS 19,177$
EL PASO 2,044,798,575$ PUEBLO 48,145,339$
ELBERT 233,763$ ROUTT 9,731$
GARFIELD 54,197$ SUMMIT 24,467$
GRAND 46,459$ TELLER 3,180,635$
GUNNISON (12,720)$ WELD 1,652,109$
Grand Total 5,767,973,446$
Source: Summit Economics, LLC and USASpending.gov
Table 14 - DOD Contracts by County, 2014
Negative numbers represent contract termination adjustments, intra-year transfers
and other repayments or adjustments. Dollars shown represent obligated amounts.

46
Trade Flow Analysis
As military and civilian employees spend their paychecks, they travel throughout the State for
shopping, recreation, tourism, visiting family and friends, and a host of other reasons. As an
example, the ski industry of Colorado is made up primarily of skiers from counties other than the
county in which the ski resort is located. As military bases purchase goods and services, some of
these purchases are made from suppliers outside the home county. These expenditures and their
impacts are defined as the trade flow effects.
To assess the trade flow effects, additional IMPLAN modeling was performed to determine the
number of jobs created in all other counties as a result of economic activity in a military installation
county. For example, the impacts of the military installations in El Paso County, plus the DOD
contracts and assistance awards were run through a separate IMPLAN model that calculated the
employment and earnings impacts in the remaining 63 counties of Colorado. This was done for
the five installations in El Paso County, Buckley AFB in Arapahoe County, and Greeley ANGS in
Weld County.
The trade flow job creation totaled almost 15,000 jobs in the rest of Colorado, with a labor income
of just over $1 billion. The employment impact of this trade flow was shown in Table 2, along with
the impacts from all DOD impact streams.
National Guard/Reserves Analysis
As a final step, estimates were obtained of National Guard and Reserve employment by each county
in Colorado through the Bureau of Economic Analysis (BEA). The figures represent employment
by place of work, but do not distinguish between full time and part time employment. The
economic impacts of National Guard and Reserve personnel were also run through IMPLAN
models, based on estimated earnings of $7,600 per year per reservist. Actual earnings, in either
total or an average earnings figure, were not available. Summit Economics, using the National
Guard pay schedules, then estimated the $7,600 average based on an assumption that 90% of the
reservists earn $4,000 for the one weekend per month and two weeks per year requirement, while
10% are full time earning $40,000 per year.
Colorado Fiscal Impacts
Table 16 presents the DOD impacts upon the State of Colorado tax revenues. The fiscal impact
calculations are based upon DOD being responsible for 5.2% of the total employment and 7.5% of
the total labor earnings in Colorado which were previously cited in Table 1 of the same name.

47
The State of Colorado imposes a 2.9% sales tax on certain taxable retail expenditures. It is possible
to make a reasonable approximation of the sales tax collected by Colorado on the expenditures of
earnings by the jobs supported by DOD activities. With a labor income of more than $11.5 billion
(see Table 1) and approximately 90% going directly to wages, $10.3 billion is earned as wages.
Coincidentally, that is about the same as total State revenues from all sources. Assuming
approximately 36% of that total is spent on taxable goods and services, $3.7 billion is taxable by the
State. That equates to about 5.0% of the State taxable sales, and sales tax collections. Applying
the 5% ratio to all sales, use and excise tax collections, approximately $168 million is collected by
the State due to DOD activities.
State personal income taxes collected by DOD operations were also estimated. Based on the ratio
of total personal income as reported by the Bureau of Economic Analysis divided by total personal
income taxes paid, the effective average personal income tax rate in Colorado in 2013 was about
3.5% of total personal income. While the nominal State tax rate is 4.5%, some income such as
portions of pension and annuity income are non-taxable. Applying the 3.5% average effective
personal tax rate to the DOD related personal income suggests that about $300 million is collected
Total Actual State Sales Tax Collections, 2013 2,187,244,101$
Total State Sales, Use and Excise Tax Collections, 2013 3,358,295,290$
Total State Sales Tax Collections from DOD Related Expenditures, 2014 (IMPLAN) 109,431,951$
Total State Sales, Use and Excise Tax Collections from DOD Related Expenditures 168,021,852$
Ratio - Estimated Sales Tax from DOD Related Expenditures to Total Sales Tax 5.0%
Total State Personal Income Tax Collections 5,492,975,311$
Total State Personal Income Tax Collections from DOD Related Expenditures, 2014 300,551,392$
Ratio - DOD to Total Income Tax 5.5%
Total State Corporate Income Tax Collections 652,180,000$
Total State Corporate Income Tax Collections from DOD Related Expenditures, 2014 48,261,320$
Ratio - DOD to Total Labor 7.4%
Total State License, Motor Vehicle, Regulatory & Business, and Other Tax Collections 608,220,356$
Total State "Other" Tax Collections from DOD Related Expenditures, 2014 45,008,306$
Ratio - DOD to Total Labor 7.4%
561,842,870$
Total State Revenues from All Sources, 2013 10,285,452,173$
Share of Total State Tax Revenues from DOD Related Activities 5.5%
Source: Summit Economics, LLC; Colorado Department of Revenue, 2013 Annual Report
Table 16 - Fiscal Impacts on the State of Colorado from DOD Related
Employment, Earnings and Expenditures
Total Revenue to the State of Colorado from Taxes Derived Directly or Indirectly from DOD
Related Activities, 2014

48
Rank Ordered - Largest to Smallest Total % of Total
Retiree Households 298,789 22.9%
Tourism 159,938 12.3%
Prof. Tech & Business Srvcs 149,994 11.5%
Other Households Investment Income 138,853 10.6%
Government 107,605 8.2%
Agribusiness 100,450 7.7%
Other Households Transfer Payments 92,550 7.1%
Health & Education 87,011 6.7%
Manufacturing 72,837 5.6%
Trade and Transportation 31,643 2.4%
Mining 28,813 2.2%
Finance, Insurance and Real Estate 20,846 1.6%
Information, Comm. 9,908 0.8%
Construction 5,495 0.4%
Total Basic Jobs 1,304,733 100.0%
Total Jobs 2,975,447 228.1%
State Economic Multiplier 2.28
Department of Defense 100,445 7.7%
Industries that include significant DOD Direct Employment
State Demographer only estimates basic jobs by county. These were summed
and adjusted by Summit Economics to account for tradeflows between
counties where a basic country job becomes an indirect state level job
Source: State Demographer, Summit Economics
Table 17: Total Basic Jobs in Colorado by Industry
by Colorado due to DOD earnings. Because of the combination of having some military personnel
not being residents of Colorado and not paying any State Personal Income Tax, with the balance of
all other military and civilian jobs created not being pensioners (and therefore paying 4.5%), the
actual amounts subject to Colorado Personal Income Tax can only be approximated.
Other tax revenue sources for the State include corporate income taxes, and motor vehicle, license,
regulatory and business licenses. Applying the 7.5% earnings share of the DOD to total State tax
collections in these two categories adds another $100 million.
In total, DOD related activities contribute about 5.2% of the State’s total jobs and 5.5% of the
State’s total tax revenue.
Other Economic Analyses
The economic impact analysis presented above represents the most common analysis used
nationally to document jobs, income, value added, and output created by an economic sector such as
DOD funding of military installations and contracts executed in Colorado. There are other, more
subtle impacts that in the course of a region’s history can be just as important. These are discussed
below.
DOD Compared to Other Industry Sectors
Table 17 presents an analysis of
the makeup of the State of
Colorado’s economy, based upon
a county- by-county analysis
prepared by the State
Demographer’s Office. The
DOD jobs are added for
comparison (see Department of
Defense row at the bottom of the
table). The jobs shown in the
table are “basic” jobs. Basic jobs
are those jobs created directly
from dollars coming into the
State from the rest of the world.
All jobs in an economy result
from the basic jobs. In this
sense, basic jobs are similar to
the direct impact noted
previously in this report in that
the basic jobs create indirect and
induced jobs. This effect is
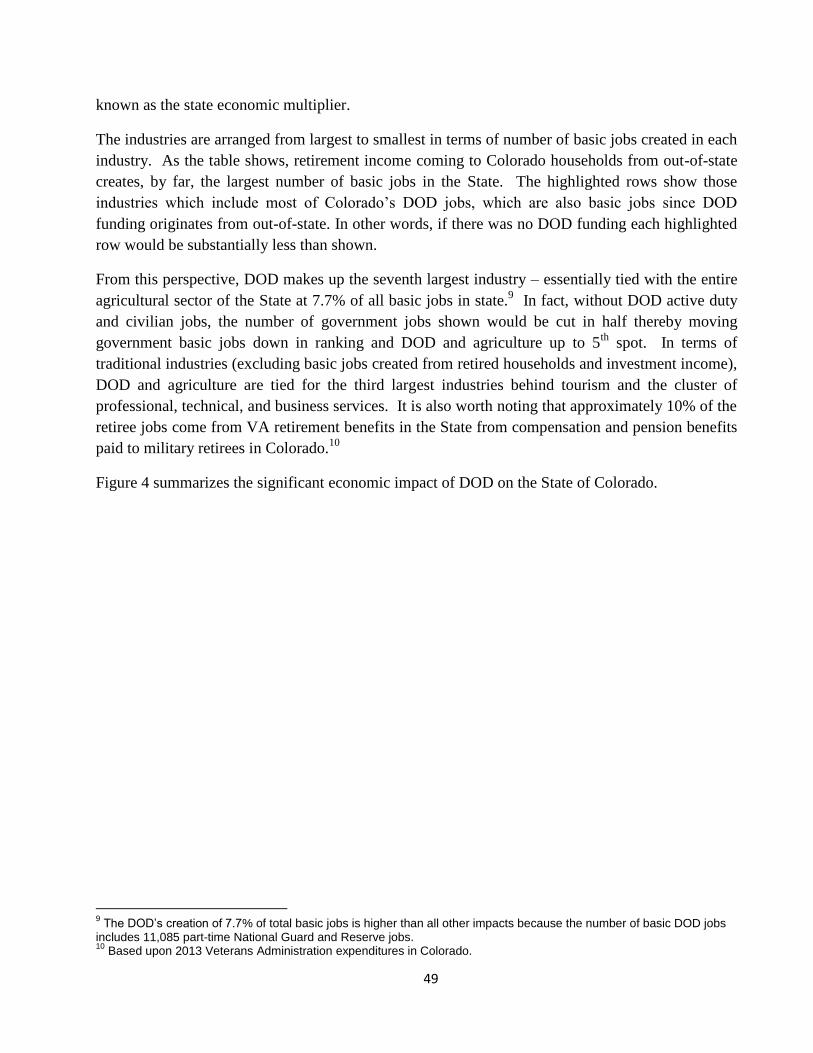
49
known as the state economic multiplier.
The industries are arranged from largest to smallest in terms of number of basic jobs created in each
industry. As the table shows, retirement income coming to Colorado households from out-of-state
creates, by far, the largest number of basic jobs in the State. The highlighted rows show those
industries which include most of Colorado’s DOD jobs, which are also basic jobs since DOD
funding originates from out-of-state. In other words, if there was no DOD funding each highlighted
row would be substantially less than shown.
From this perspective, DOD makes up the seventh largest industry – essentially tied with the entire
agricultural sector of the State at 7.7% of all basic jobs in state.9 In fact, without DOD active duty
and civilian jobs, the number of government jobs shown would be cut in half thereby moving
government basic jobs down in ranking and DOD and agriculture up to 5th
spot. In terms of
traditional industries (excluding basic jobs created from retired households and investment income),
DOD and agriculture are tied for the third largest industries behind tourism and the cluster of
professional, technical, and business services. It is also worth noting that approximately 10% of the
retiree jobs come from VA retirement benefits in the State from compensation and pension benefits
paid to military retirees in Colorado.10
Figure 4 summarizes the significant economic impact of DOD on the State of Colorado.
9 The DOD’s creation of 7.7% of total basic jobs is higher than all other impacts because the number of basic DOD jobs
includes 11,085 part-time National Guard and Reserve jobs. 10
Based upon 2013 Veterans Administration expenditures in Colorado.

50
Figure 4: Total DOD Economic Impact as a Percentage of Colorado Economy
The employment and labor percentages include direct, indirect and induced impacts relative to
totals in Colorado as derived through IMPLAN modeling. Labor income is higher due to higher
average wages and the inclusion of benefits such as base housing allowances.
State taxes and fees include State sales taxes, personal income taxes, corporate income taxes,
and other licenses, taxes and fees.
Output is the economic value of the project in the local economy as measured by gross receipts
in all industries; the value of production before expenses.
Value added is the equivalent of gross regional product (GRP) which is the state equivalent to
national gross domestic product (GDP). Value added includes employee compensation (total
payroll costs including benefits), proprietor’s income (payments received by self-employed
individuals as income), other income (payments for rents, royalties and dividends), and indirect
business taxes (excise taxes, property taxes, fees, and sales taxes paid by businesses).

51
Economic Diversity & Cycles
All economies are made up of some combination of economic sectors. Some economic sectors add
greater economic diversity, some add more stability, and some add greater opportunity than others.
The diversity of economic sectors is a valuable attribute because diverse sectors operate on different
business and economic life cycles compared to the majority of the regional economy.
DOD funding for military installations and contracts and assistance adds great diversity to
Colorado’s economy, since the peaks and valleys of DOD funding have very little to do with the
overall business cycle which includes periods of expansion and recession. The DOD cycle is driven
by geopolitical events and long-term defense strategies (e.g., the Cold War and the Global War on
Terror), mobilizations for intense wars (e.g., WWII), and the need for periodic surges to respond to
short-term incidents (e.g., domestic natural disasters and small-scale overseas contingencies).
Furthermore, the focus of DOD funding changes based upon technology. When DOD funding is
increasing during poor overall economic conditions, a degree of downside stability is created. For
example, in January 2009, as the “Great Recession” was hitting its zenith, a major news network
reported that the Colorado Springs metropolitan statistical area (MSA) had the largest number of
federal job openings outside of the Washington DC MSA. This fact represented a degree of
stability to Colorado at the time. The reverse has been the case since the onset of sequestration this
decade.
The other types of cycles influencing economies are product and technology lifecycles. These life
cycles have introduction, growth, maturity, and decline stages. A diversified economy is not reliant
on just one or two niche specialties since different sectors might both hit a maturity and/or decline
stage at the same time. Ideally, an economy has a portfolio of activities such as technologies,
programs, products, processes and projects at different stages of the lifecycle so that growing
sectors counter declining sectors. Well-run organizations with a long-term strategic perspective
adjust to different environments, including opportunities and threats. As a result they tend to have
different aspects of operations in different phases of the life cycle. The DOD, being one of the
largest militaries in the world charged with protecting the U.S. and its global interests, is very aware
of the need to change with evolving challenges in the international arena and thus is diverse from a
life cycle perspective.
Military history tends to point towards leadership, training, morale, and strategy as wartime critical
success factors. All of these efforts occur within the context of a technological state which further
defines how wars are fought. Often the tide of a war can change rapidly when one side introduces
leap-ahead technological innovation. Since WWII the U.S. has focused on defeating the enemy
with mass, or “overwhelming combat power at the decisive place and time”. The overwhelming
combat power may come from sheer numbers or from far superior technology. This principle has
remained constant since the end of WWII and the beginning of the Cold War, but the method of
delivery appears to be adopting a doctrine of greater flexibility via small, tactically focused efforts
that use the nation’s long-standing advantage of superior technology. Maintaining the technological

52
advantage is critical, not only for benefit of our national defense, but because it also provides a
steady source of research and development funding that permeates the entire national economy
greatly enhancing private sector research, development, and innovation. In this sense, the DOD is a
large national economic driver pushing new technologies as well as capital investment and labor
force training. With the advent of cyber threats and more countries having greater access to space
and satellites, technology and new skill sets remain of critical importance to our national defense.
One way to view DOD as an economic driver is to consider different military elements placed on a
life cycle curve as shown in the Figure 5 below. All of the elements have a presence in Colorado.
The stage of the life cycle is shown at the bottom of the Figure. Starting with the decline state, one
finds the traditional Army and Air Force in the decline stage being replaced by a growing emphasis
on rapid response, intelligence, surveillance, and reconnaissance (ISR) on dispersed threats, both
offensive and defensive cyber operational and tactical capabilities, missile defense, a new space
paradigm, and timely processing and delivery of big data from multiple sources. This is an
important consideration as over time each technology tends to move to the right becoming less
cutting edge, until eventually it moves into the maturity and then decline phase. As a result,
strategic planning must always be cognizant of the next new technology to introduce to the life
cycle.
Figure 5: Current Life Cycle Position of DOD Colorado Elements
Some of the life cycle shifts can be seen at Colorado facilities. Fort Carson and Peterson AFB
recently hosted a rapid deployment of rocket launchers from Oklahoma to Fort Carson after landing
at Peterson and then moving down range to attack targets within three hours. The Air National
Intro
Current Life Cycle Position of DOD Colorado ElementsElements include technologies and war fighting operational modalities
Growth Maturity Decline
Rela
tive A
ge a
nd
/or
Str
ate
gic
Sig
nific
ance
Summit Economics
Placement on life cycle is conceptual and intended for demonstration purposes onlyUnmanned Aerial Vehicles
Old Space ParadigmManned Aerial Combat
Conventional Force-on-Force Ground Combat
Medical Support
Special Ops
Rapid Response
Cyber Capabilities
Global Persistent Intel, Surveillance, Reconnaissance (ISR)
Missile Defense
New Space Paradigm

53
Guard (ANG) in Greeley practices rapid deployment to provide defenses for incoming missiles to
the U.S. and our allies around the world. This is increasingly important as smaller nations gain
nuclear weapon capability. Schriever AFB hosts space war games with allied leaders. This is
important as the old paradigm of U.S. space dominance enters the decline phase to be replaced with
space access by more countries, new generation satellites, and growing debris fields in historical
space orbits. Buckley AFB provides air sovereignty/air control for the Rocky Mountain and Great
Plains regions and hosts the Aerospace Data Facility (ADF). From this perspective, Colorado fares
well economically in terms of the life cycle as it has DOD operations dispersed throughout the
cycle. The State is especially well positioned in the space sector, including missile defense.
Locational Economics – Why Colorado? A Historical Perspective
Location economics addresses the reasons organizations and people locate where they do. By
understanding the reasons, one can gain a greater sense of the underlying attributes of a location and
the organizational functions being performed. The beginning of the modern DOD presence in
Colorado is traceable to the onset of WWII. Land was typically donated by local governments to
the war effort. Colorado offered two distinct features for military training – high altitude mountain
training and a central location relative to the east, west, and Gulf of Mexico coasts. The high
altitude training was important to both ground and air forces, especially for fighting in the European
Alps. The central U.S. location provided flexibility so that forces could be easily deployed to any
coast of the United States. Being removed from the coasts also provided a natural geographic
defensive position. This gave Colorado an absolute advantage which was not easily replicable by
any other region in the nation.
After WWII the massive military ramp-ups reversed as there was little locational advantage since
Colorado was still rather remote from a transportation perspective and had a relatively small
population base at 1.3 million people. However, with the creation of the Air Force as a new branch
of the military, Peterson Field was retained and in the 1950s Colorado Springs won out against
competing cities by offering the future Air Force Academy land and a reliable supply of water by
constructing a pipeline from the Continental Divide. The Korean and Vietnam Wars and expansion
of Camp Carson to Fort Carson through the acquisition of additional land for mechanized training
created a more permanent Army presence in Colorado. The construction of the NORAD facility in
Cheyenne Mountain as the nerve center for intercontinental ballistic missile threats again played on
Colorado’s central U.S. and naturally protective mountainous location in order to enhance
survivability and additional response time in the event of a nuclear attack from the Soviet Union.
These historical events from the early 1940s through the 1960s ended the first stage of DOD
development in Colorado. During the second stage, from 1970 to 2010, Colorado’s population
grew from 2.2 million people to 5 million thereby adding substantial urban elements such as more
broad-based education, housing, shopping, and recreation opportunities to enhance the overall
quality of life of military personnel and veterans who frequently returned to Colorado after being
stationed in the State. Further growth of DOD installations was related to the urbanization

54
phenomenon combined with land availability and localization economies of scale. The urbanization
and opportunities for economies of scale allowed the Colorado DOD installations to increase their
effectiveness and efficiencies through capacity additions, moving more DOD tenants onto existing
facilities and locating more installations in the area. This was evident with Peterson AFB in the
1970s, Schriever AFB in the 1980s, Greeley ANG Station in the 1990s, and is evident with Buckley
AFB today. With Buckley AFB, the central U.S. location and lower transportation costs have
returned as relevant due to the location of Denver International Airport (DIA) close to Buckley.
These events are summarized in the Table 18.
Economies of Agglomeration
The historical growth of DOD expenditures and the associated indirect impacts create spinoff
sectors and economies of agglomeration which can also have substantial impacts that are much
more difficult to measure. Economic agglomeration is a cumulative, self-reinforcing process that
concentrates talent, productive capacity and innovation creating spin-off industries and
organizations that attract funding from the other firms in the same industry (in this case, DOD) as
well as non-DOD entities such as other federal agencies and public and private organizations from
around the world. Agglomeration effects typically begin with the localization economies of scale
1940s 1950s 1960s 1970s 1980s 1990s 2000s 2010s
Absolute & Comparative
Advantage
Camp
Carson and
Peterson
Field - High
altitude
flying and
mountainee
ring.
Buckley
developed
in WWII as
air station
USAFA -
Central to
U.S. -- land,
air, and
water
availability
Cheyenne
Mountain
Station -
Distance
from nuclear
missile
attacks and
mountain
Buckley
becomes
home to
460th Space
Wing
Transportation Cost
Differentials
Localization Economies
(Increase in output of all
firms in a given industry
in a given location)
Ent AFB
closed and
ops moved
to Peterson
AFB under
Strategic Air
Command
(Due to
Cheyenne
Mountain
and USAFA)
Peterson
home to AF
Space Com.
Schriever -
Missile
Defense &
Satelite
operations
Greeley
ANG to
consolidate
in Colorado
with other
Missile
Defense
agencies
Workforce Cost & QualityEmerging AF
Veterans
Source: Summit Economics, LLC
TABLE 18: Fundamental Location Forces - History of Colorado Installations
Flexible Deployment to any CoastCentral Location for Air
Transport
Buckley had different "owners" during
early post-WWII era. Peterson became
an Air Force station when the AF
became an official branch of the
military, but most non-airfield
operations were in downtown Colorado
Springs at Ent AFB. Camp Carson went
from 36,000 troops during WWII to 600
post-war, but had value for mechanized
divisions due to land availability and
gradually grew during the Cold War.
Army VeteransFull fledged military retirement & veterans (many
well educated) complement defense contractor

55
which then attract organizations seeking the specialized workforce and economic infrastructure that
develops to support the sector. As the agglomeration process reinforces itself and accumulates over
time, it supports economic urbanization forces resulting in further workforce growth with higher
paying wages, more innovation, and more agglomeration.
The Colorado agglomeration economies centered on DOD were greatly enhanced by the number of
veterans who, after experiencing the overall quality of life in Colorado while stationed in the State,
chose to settle in the area after their military careers. They found extensive outdoor recreation
opportunities, urban amenities, and both on-post and off-post support for veterans and their
families. Historically, veterans often choose retirement communities to settle in when they are in
their 20s through early 50s. Thus a capable workforce began developing and became noticeable in
El Paso County as early as the 1960s. The Census Bureau estimates 10.4% of Colorado’s 2010
adult population are veterans (340,000 people) ranking the State 20th
among the 50 states where an
average of 8.9% of all adults are veterans. El Paso County has 87,000 veterans or 18.7% of its
population over the age of 18. This ranks El Paso County 14th
out of 3,180 counties nationwide.11
Veterans, including retired veterans, provide support to military installations as DOD civilians,
employees of DOD contractors, and Reserve Component members. The DOD civilians and
contractors are especially noticeable in the higher technology sectors such as aerospace and
information technology. Veterans are also notable in defense contracting with global allies where
they may train foreign military personnel or help implement new technologies. In its heyday of the
1980s and 1990s high technology manufacturing made extensive use of military spouses and
veterans in El Paso County. Today the same applies in sectors such as call centers, education, and
non-profits. Non-profit leadership and more commission-based services such as financial services
are especially are especially attractive to retired military as the retirees are often in a better position
to assume these positions with their supplemental income sources. Many of the firms in these
sectors serve regional, national, and international markets.
While active duty military are compensated more or less equally regardless of their duty station, the
availability of veterans provides a more flexible workforce which can lower contractor costs,
thereby making Colorado more competitive for DOD and other major contracts, both public and
private, which furthers economy diversification. The lower contractor cost may come from lower
wages and salaries, but often comes from a labor force acculturated to DOD, with more suitable
training, and with security clearances. This helps provide better returns and promotes economies of
scale, thereby making existing military installations more attractive for DOD-directed growth and
investment if suitable land and airspace are available.
The active duty military and veterans in Colorado significantly impact higher education in the State.
In 2013, the Veterans Administration spent 2.7% of its educational benefits and vocational rehab
11
Fort Carson and Peterson AFB have been anecdotally cited as the most frequently requested last tours of duty in their respective branches. The VA reports 391,000 veterans in Colorado in 2013 representing 1.8% of veterans nationally. This compares to 1.7% of the U.S. population residing in Colorado.

56
(EBVR) budget ($324 million) in Colorado even though the State only had 1.8% of the nation’s
veterans. Only three states (California, Virginia, and Texas) garnered more of the VA’s EBVR
budget relative to their respective veteran populations. The post- 9/11 GI Bill website lists 89
colleges, universities and training programs in Colorado where these benefits may be used. The
post-9/11 GI Bill program provides 36 months of tuition, a monthly living allowance that varies by
zip code, and a stipend for books and supplies of $1,000 annually. The 36-month benefit for a full
time student can exceed $100,000 which provides a source of revenue to colleges and universities
beyond traditional sources. The 2015 Guide to Military Friendly Schools includes eight of
Colorado’s community colleges. Pikes Peak Community College in Colorado Springs tops the list
with 24% of its students either active duty military or veterans. It is among the top 20 in the nation
in terms of number of veterans served.
Through the generous education benefits afforded active duty military and veterans, Colorado’s
workforce, which ranks 3rd
in the nation in terms of adults 25+ with at least a bachelor degree, is
further enhanced. Interviews with staff at three University of Colorado campuses, where thousands
of veterans and active duty military are pursuing post-secondary degrees, reveals very busy Offices
of Veterans Services on each campus supporting student veterans and veteran dependents. These
Veterans Services offices are attractive targets for donations from private companies and
foundations seeking to better support our veterans as they transition in their lives. JP Morgan
Chase, which has given $25 million to support veterans nationwide since 2011, recently made a
$65,000 donation to The University of Colorado, Colorado Springs campus (UCCS).12
One veteran services director pointed out that, with the exception of the VA hospitals, higher
education campuses are the primary place where veterans concentrate. Some of the other findings
related to post-secondary education include:
The active ROTC program on the Boulder CU campus helps finance the education of
hundreds of students -- providing $6.85 million in tuition annually to almost 400 students.
UCCS is ranked 44th among 140 public and private institutions by Military Times. Of the
11,120 students enrolled at UCCS in the Fall of 2014, 1,065 were attending on post-9/11 GI
Bill benefits, 468 veterans and active duty attended on vocational rehab and other tuition
assisted programs, and 97 were attending without using military benefits. This accounted
for 14% of the student body, a 6% increase from the Fall of 2013.
CU Denver has 700 full time students, primarily using the post-9/11 GI Bill, on the campus
in the Fall of 2014. CU Denver has teamed up with the Denver Metro Chamber of
Commerce to create CU Denver Boots to Suits, a program designed to help veterans shift
from their roles as service members to students and, from there, to business professionals
and leaders in the community.13
12
The Anschutz Family Foundation also has issued a $1 million challenge grant to UCCS for its veteran services. 13
UCCS has also created a Boots to Suits programs.

57
The magnitude of DOD and VA dollars flowing into Colorado universities enables the schools to
increase both the depth and breadth of their curricula. It can also assist in promoting faculty
research by providing a stronger resource base for attracting faculty who are leaders in their
respective fields. This is growing in importance as the role of university research in economic
development is apparent. Universities can serve as sources of innovation and entrepreneurship.
Sometimes this occurs through research and development and subsequent technology licensing.
Some specific examples where the agglomeration effects in colleges and universities create even
greater economic growth include:
The U.S. Air Force Academy has the highest level of research and development funding of
any undergraduate college or university in the nation. USAFA recently entered into an
agreement with the Colorado Springs Technology Incubator for licensing technology.
Webster University created the first space operations management Master of Science degree
in the world in 1983 due to demand in Colorado Springs. The program expanded into
Denver and last year Webster introduced an online format which is anticipating global
distribution.
UCCS created a Cyber Security Department within their engineering school. The cyber
security program, which has finished as high as 4th
in national competitions, now offers
undergraduate, masters, and doctorate degrees in cyber security and recently was selected by
the Army Reserves to be one of six schools to receive Reserve funding so that qualified
reservists can further their education in the realms of cyber security to better defend critical
infrastructure such as utilities.
The natural growth of specialized education and the resulting unique workforce, including
entrepreneurs, operates like a self-reinforcing system that stimulates growth in other economic
sectors, some of which are closely related to DOD and others of which have nothing to do with
national defense. Figure 6 demonstrates systematically how initial economic impacts from DOD
installations and contracts in Colorado can grow far beyond the direct, indirect, and induced impacts
from the DOD expenditures made in the State as measured in the traditional economic impact
analysis section of this Report (see the top of Figure 6 with the red boxes and large green arrows).
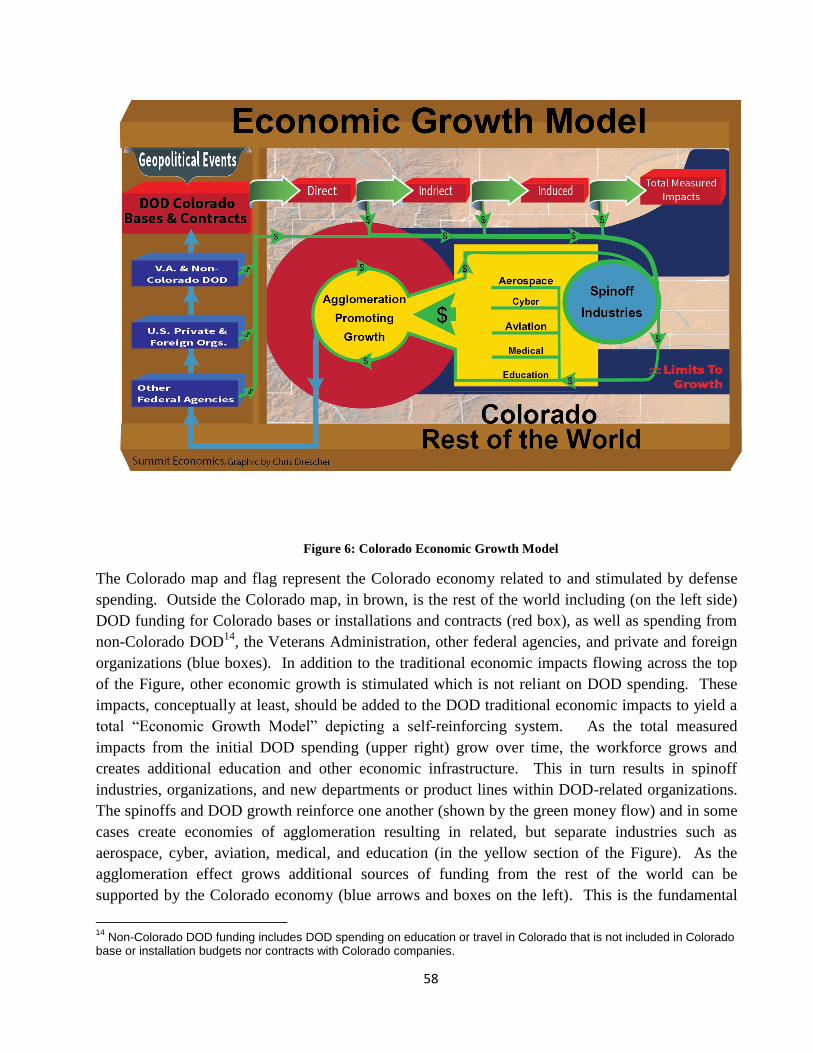
58
Figure 6: Colorado Economic Growth Model
The Colorado map and flag represent the Colorado economy related to and stimulated by defense
spending. Outside the Colorado map, in brown, is the rest of the world including (on the left side)
DOD funding for Colorado bases or installations and contracts (red box), as well as spending from
non-Colorado DOD14
, the Veterans Administration, other federal agencies, and private and foreign
organizations (blue boxes). In addition to the traditional economic impacts flowing across the top
of the Figure, other economic growth is stimulated which is not reliant on DOD spending. These
impacts, conceptually at least, should be added to the DOD traditional economic impacts to yield a
total “Economic Growth Model” depicting a self-reinforcing system. As the total measured
impacts from the initial DOD spending (upper right) grow over time, the workforce grows and
creates additional education and other economic infrastructure. This in turn results in spinoff
industries, organizations, and new departments or product lines within DOD-related organizations.
The spinoffs and DOD growth reinforce one another (shown by the green money flow) and in some
cases create economies of agglomeration resulting in related, but separate industries such as
aerospace, cyber, aviation, medical, and education (in the yellow section of the Figure). As the
agglomeration effect grows additional sources of funding from the rest of the world can be
supported by the Colorado economy (blue arrows and boxes on the left). This is the fundamental
14
Non-Colorado DOD funding includes DOD spending on education or travel in Colorado that is not included in Colorado base or installation budgets nor contracts with Colorado companies.

59
self-reinforcing dynamic of economies of agglomeration. Organizations and functions clustering
close to one another, even as competitors, can experience more efficient operations due to the
development of specialized suppliers, workers, and education systems to support the cluster.
There are also limits to growth of DOD and agglomeration economies as shown in red at the bottom
right of the Figure. In this case the most obvious limits are possible over-concentration of key
defense assets and capabilities in a single location, encroachment from non-DOD uses which limit
the expansion of DOD facilities, and existing DOD facilities running out of land for continued
growth. These limits create a degree of economic drag on growth tendencies.
In some cases the spinoff of technologies and processes result in entirely new industries. An
example was the post WWII acceleration of the Colorado ski industry spurred by the 10th
Mountain
Division. While the State and national ski industry would have developed regardless of the military,
the involvement of 10th
Mountain Division WWII veterans was certainly catalytic at the time when
they developed Aspen and Vail and other resorts across the country. Today, 18% of Colorado’s
tourism industry -- Colorado’s largest industry in terms of employment -- is based on skiing
resulting in a $3 billion economic impact representing between 0.5% and 1.0% of the State’s
economy.15
These spinoff and agglomeration progressions are occurring in many areas including retrofitting
aircraft from around the globe with more efficient engines and modern avionics to promoting
environmental sustainability. For instance, according to locally-provided information, Fort Carson
might have the highest concentration of LEED-certified buildings anywhere in the world. This
results from Fort Carson being an Army demonstration site for sustainability for over a decade.
During this period approximately $2 billion has been spent from the military construction budget –
most funding projects meeting the LEED standards. While one might question the economic return
of those investments to DOD, it has become apparent that the Colorado architects and contractors
who participated in the construction gained substantial LEED knowledge to the point where they
are able to design and build to the LEED standards at a cost similar to typical construction, thereby
becoming leading-edge innovators in the field.
The largest industry to grow as a result of DOD’s history in Colorado is the aerospace industry.
Today Colorado ranks second in private sector space employment with 66,000 workers, including
those working on DOD contracts, and a total value added of $8.7 billion - almost 3% of the State’s
total GDP.16
The nine counties within the Denver Metro area contribute to ranking Denver first of
the largest 50 cities in private aerospace employment concentration.17
Arapahoe County is the
center for DOD-funded aerospace manufacturing. Several of the larger aerospace companies are
15
It is unclear if the $3 billion is value added or total output. Depending upon which is the relevant number, ski tourism represents between 0.5% and 1% of the Colorado economy. 16
OEDIT website and Brookings Report Launch, Taking Colorado’s Space Economy to the Next Level. Based on 2011 data. DOD’s contribution is at least $2.4 billion of the $8.7 billion. 17
Aerospace – Metro Denver and Northern Colorado Cluster Profile, Metro Denver Economic Development Corporation January 29, 2015

60
developing next-generation launch vehicles, including United Launch Alliance (a partnership
between Boeing and Lockheed Martin) and a consortium led by Sierra Nevada Space Systems
Group.
While much of this industry is based on DOD contracts, the aerospace industry ranks 4th
in
receiving NASA contracts totaling $1.5 billion, and is actively competing for a place in emerging
space markets such as tourism, point-to-point sub-orbital flights, and horizontal take off and
landings.18
Spaceport Colorado, in close proximity to Denver International Airport and Buckley
AFB, has applied for an FAA license and is signing up international partners. Organizations like the
Space Foundation, located in Colorado Springs, conduct an annual international symposium at the
Broadmoor Hotel in Colorado Springs to promote the State as a global leader in space.
Another important connection with DOD is the information technology (IT) sector. Twenty-two
percent of respondents to a business climate survey in El Paso and Teller counties who indicated
they are substantially in the IT sector also indicated they are substantially in the defense sector.
While DOD contracts with these firms that show up in the DOD contract database are included in
the economic impact analysis, revenue sources from non-DOD federal agencies and private sector
firms outside Colorado create additional impacts. Some IT defense contractors are increasingly
looking to the healthcare, financial, and utility sectors for additional growth and business
diversification as DOD faces the effects of sequestration cutbacks.
Where might future spinoffs occur? Some possibilities include:
New generation GPS since the entire global system is operated from Schriever AFB.
Lockheed Martin is currently developing GPS III.
Cyber security since USAF Space Command, a tenant at Peterson AFB, oversees cyber for
the Air Force, and the National Reconnaissance Organization (NRO) is Buckley’s largest
tenant at the Aerospace Data Facility. Given the Army presence in Colorado Springs and
growth at UCCS, it is a natural progression to apply new cyber technologies to emerging
threats to critical infrastructure like local utilities.
New generations of artificial neural networks to process big data or massive amounts of
data for machine learning and predicting the location and propensity of many small but
significant threats from around the world.
Unmanned aerial vehicles (UAV) -- while Colorado did not win their bid to become a FAA
test site, it is likely the State will become a center for military drone training due to the
availability of a high altitude airspace environment.
Commercialization and globalization of high value U.S. declassified technology. There is a
high concentration of retired senior officers who bring global networks of high level
international allied leaders who are increasingly looking to develop their own military,
aviation, and space capabilities.
18
Spaceport Colorado Marketing Plan 5-14-13, Webster University, Space Systems Operations Management (SPSM)
graduate students Mark Perkins, Wesley Gunnar White and Anthony Winstead with guidance from: William Hoffman – the SPSM6000 Webster Graduate Program Study Director.

61
Growing demand for space-based earth monitoring systems for commercial, scientific,
social, and defense needs.
Potential for more advanced materials research, founded in the materials research efforts
launched with the growth of the space launch businesses in Colorado.
Potential for growth in astronomy research and applications. With space-based astronomy
taking the place of some remote mountain telescopes, world class astronomy no longer must
be centered in remote locations.
These are all possibilities. What we know is that many defense contractors who are facing cutbacks
under sequestration and who anticipate a period of DOD austerity are transferring their systems and
marketing efforts to more promising markets like healthcare and foreign governments, as well as
basic scientific, technical, engineering and mathematics (STEM) research and applications.
Table 19 summarizes how DOD agglomeration economies have played out over time in Colorado.
DOD Economic Outlook
Given that direct DOD expenditures in Colorado support 5.2% to 7.5% of overall state economic
activity (depending on which measure is used), it is valuable to consider the economic outlook for
DOD in Colorado. All branches of the military have experienced declining active duty personnel
numbers over the last 40 years except the Marine Corps. There have been distinct periods of force
reduction after the Korean and Vietnam Wars, as well as the “peace dividend” force reduction
following the political disintegration of the Soviet Union. Forecasts by DOD and the Congressional
Budget Office (CBO) show force reductions are expected through 2018, especially in the Army.
This is confirmed in the DOD Future Years Defense Plan (FYDP) base budget. If the forecasts
come true, the total force size will be the lowest in post-WWII history as shown in the following
Figure 7.
Table 19: Economies of Agglomeration: Concepts and History
1940s 1950s 1960s 1970s 1980s 1990s 2000s 2010s
Complementary Firms -- Shared Workforce
Large Scale Economies - Increasing ReturnsUrbanization Economies
USAFA R&D,
Technology
Licensing
Inherited and Substantial "Production"
NetworksSource: Summit Economics
Innovation, Tech Transfers, & Start-ups
Carson LEED w/ $200 M
MilCon/yr. DOD tech oriented
retirees and more recently
Post WWII Ski Industry Development Colorado Aerospace Industry
High Tech Manufacturing, Call Centers, Aviation, Aerospace,
Information Technology, Non-Profit, Financial Services
Fort Carson + Colorado Air Force Space Com and Missile Defense + Pinon Canon Maneuver Site + Buckley
GrowthInstallations, Education and Veteran Support

62
0
200
400
600
800
1,000
1,200
1,400
1,600
1,800
19
55
19
61
19
63
19
65
19
67
19
69
19
71
19
73
19
75
19
77
19
79
19
81
19
83
19
85
19
87
19
89
19
91
19
93
19
95
19
97
19
99
20
01
20
03
20
05
20
07
20
09
20
13
20
15
20
17
Total Active Duty Military Personnel by Branch & Year (in thousands)
Army Navy Marines Air Force
The impacts of the Budget Control Act of 2011 (sequestration) are more severe than the FYDP
forecast in two ways. First, the automatic sequestration enforcement procedures which began
implementation in 2013 will reduce DOD forecasted expenditures by approximately 15% relative to
the CBO forecast. Second, the law mandates cuts across-the-board without considering the need to
strategically invest or divest. The impacts of sequestration could even be more severe than the CBO
estimates if funds are reallocated away from DOD proper, which historically received 95.5% of the
national defense budget, to other national security agencies, a possibility given growing national
concerns over cyber security. The two biggest budget items DOD must contend with are forecasted
growth in:
Operations and support (67% of DOD budget) which is forecast to grow at rates 1.2%
higher than general inflation and is being driven by significant increases in military health
care, some costly legacy weapon systems maintenance expenses, and increasing
compensation of active duty and civilian employees.
The cost of modernizing and replacing weapons systems (31% of DOD budget) and
forecast to increase faster than inflation by 3% per annum.19
Long-term fiscal austerity and cost consciousness for DOD’s base budget appears inevitable. The
CBO’s forecasts are predicated upon current laws and policies and do not consider future changes in
the political environment in Washington D.C. The forecasts also assume continued economic
growth consistent with recent years. Given that Colorado receives about 3.2% of the DOD base
budget (excluding overseas contingency operations) and has 1.7% of the nation’s population, it is
19
Forecast info is from the Congressional Budget Office, Long-Term Implications of 2014 Future Years Defense Program, http://www.cbo.gov/sites/default/files/44683-FYDP.pdf
Estimated & Forecast
DOD historical, CBO Forecast, Summit Economics
DOD historical, CBO Forecast, Summit Economics
Figure 7: Total Active Duty Military Personnel by Branch and Year

63
clear that, relatively speaking, DOD’s future funding levels are more important economically to
Colorado than to many other states.
Fortunately the State has fared well in terms of DOD expenditures since WWII. Between the
military choosing Colorado for some significant strategic and operational commands, stations and
posts, and the State being very attractive in terms of the quality of life, opportunities exist to
continue to attract military operations to the State from higher cost and lower quality of life regions.
This is especially true where the current location has no particular strategic justification and/or
where there could be excellent synergies with the multitude of military operations located in
Colorado. But Colorado is vulnerable to losing military operations to locations that might be more
strategic and/or on the cutting edge of technology research and development. Emerging
technologies and approaches are reasonably well represented in the State with medical, missile
defense, rapid deployment, space, cyber, and (eventually) even unmanned aircraft.
In summary, DOD is the third largest industry in the State of Colorado, exclusive of jobs created
from retirement and investment income to households, and clearly the largest single customer and
source of funding for the Colorado economy. DOD is an advanced industry pushing 21st century
technologies and offering above average wages as well as substantial workforce training and
advancement. Colorado has significant strengths and as a result has attractive opportunities to act
on. DOD’s agglomerated economic impact on Colorado is noteworthy and warrants attention to the
recommendations that follow.

64
2. Summary of Prioritized Recommendations
Section 1 of this Report postulates a number of strengths, vulnerabilities and opportunities at the
State level and at the level of individual installations. In the first case, the analysis used nine
attributes that DOD has stated are important to assessing military value. In the second case, the
analysis used 11 military and economic value criteria that have been used by past BRAC
examinations, modified to highlight the relevance of assessing DOD’s economic contributions to a
state’s economy. The installation-oriented analysis is traceable to conversations, surveys and on-
site visits, and thus some recommendations may reflect a level of granularity more specific than is
the case with the first set of analyses. The most compelling recommendations are those that jointly
promote enhancements to military value and economic impact. Actions taken by Colorado to
improve the conditions borne out by the 11 military value criteria are not likely to undermine
economic growth and prosperity, and all the recommendations that appear below promote both
military value and economic impact.
The State should continue to review, refine and advocate for the military value that
Colorado’s military installations, units and associated mission sets provide to DOD. The Air
Force analogy to this recommendation is the persistent intelligence, surveillance and
reconnaissance (ISR) capability the Service provides 24/7 to selected warfighters. Persistent
ISR feeds into common operating pictures or views of the battlespace. That is what
Colorado needs – a persistent picture of the Washington arena that is widely available to the
stakeholders and advocates for the DOD across the State. The nation’s legislators are
currently ambivalent about supporting a BRAC in the near future. But all of the Military
Services, the Chairman of the Joint Chiefs of Staff and the Secretary of Defense are on
record advocating for a BRAC, sooner rather than later. The specter of sequestration
beginning in FY16 is a shadow hanging over most internal DOD planning and programming
deliberations. Colorado should be proactively monitoring the Washington political climate
on DOD budget reductions, force structure realignments, and strategy changes.
An array of entities exists within Colorado that advocate for the continued presence and
future growth of DOD missions within the State. Many of these organizations are associated
with chambers of commerce or other similarly oriented groups. An umbrella organization,
similar to the Colorado Space Coalition, which could bring these organizations together,
would create a synergy in messaging and intelligence (see previous recommendation) that
would unify various regions in the State and strengthen the shared goals of military
supporters. This umbrella organization should be supported within the auspices of an
existing regional group but open to all stakeholders who seek to promote and support
Colorado’s continued role in national security.
Pursue resolution of major challenges cited in Front Range Regional Encroachment
Management Plan. These challenges are often jeopardizing – or have the potential to
diminish – the military value of Colorado military installations to DOD. If a BRAC study
were commissioned and used some semblance of the 11 military value criteria employed by

65
this Study, encroachment would not be a major detractor in part because of the successful
attention that State and local officials have paid to it. But in a future BRAC Colorado needs
to do more than just defend its current suite of installations, units and missions. It needs to
position itself as a potential recipient of displaced units and missions, because of the many
attractive strengths the State demonstrates. Showing a BRAC study that the State is
aggressively addressing vulnerabilities in encroachment – no matter their extent – might be
the special factor that separates Colorado from other potential state hosts seeking orphaned
units and missions.
Continue to monitor, inform and shape HQ US Army deliberations over the future of the
Piñon Canyon Maneuver Site. The Study Team noted the HQ Department of the Army staff
visit to Fort Carson in February 2015 and the exchange of information and concerns from
both Colorado and senior Army leaders on the topic of impending force structure reductions.
The Piñon Canyon Maneuver Site is a “wild card” that can be played a number of ways in
this calculation – Colorado needs to ensure it is played to Colorado’s advantage, and that
means remaining proactively engaged.
Promote the State nationally in DOD, education and industry venues as a center of
excellence for developing cyber and UAS capabilities. These are two consistently reliable
and positively trending development areas in DOD and industry, and they both integrate
easily within the existing synergistic strengths the State possesses with aerospace and high
technology industry and with institutions of higher education. Colorado should work closely
with the FAA to obtain the broadest possible permissions to operate UAS for research and
development purposes, to present itself nationally as a state with the airspace and industrial
resources supportive of commercial and DOD UAS development. Cyber is both software
and hardware intensive, and Colorado already demonstrates advantages in computers and
software development which can be easily translated into positive messages for promoting
itself as the right “home” for DOD and non-DOD organizations and businesses looking to
settle and develop new cyber enterprises.
Another exciting commercial venture Colorado should continue to aggressively endorse is
the Front Range Airport's application to the Federal Aviation Administration for Spaceport
Colorado. The effort will increase Colorado’s competitiveness in the aerospace industry and
support new opportunities in the future growth of commercial space research and
transportation. Plans for Spaceport Colorado include the development of an aerospace and
technology park to support a broad range of activities and commercial opportunities,
including research and development, testing and evaluation, manufacturing, crew training,
scientific research, suborbital flight, point-to-point travel, and unmanned aircraft systems.
The Economic Impacts section of this Report offers compelling evidence that the
agglomeration effect of a multi-dimensional enterprise like Spaceport Colorado would foster
enhancements to Colorado’s military value to DOD as well as contribute to economic
growth and prosperity.

66
Monitor and, when allowed, provide information to the congressionally-mandated
Commission on the Future of the United States Army, required to report out to lawmakers
by 1 February 2016. When Congress directed a similar Commission examine the U.S. Air
Force earlier this decade the Commission’s findings either validated or advocated
challenging positions for re-structuring the balance of Guard, Reserve and Active Duty force
structure and missions. This is an important calculus for Colorado because of the
complexion of the balance in Fort Carson’s Army force structure. The recent HQ
Department of Army town hall or Listening Session in Fort Carson’s Centennial Hall shone
a spotlight on the local, regional and state-wide implications of potential Army force
structure reductions at the installation. The Commission on the Future of the United States
Army will consider the future of Fort Carson and other major Army installations – its public
hearings, data calls and final report deserve close attention.
Colorado should provide legislative support and funding to accelerate select military
installation transportation improvements and road construction. There are already mature
plans for a number of installations written and waiting on the shelf, ready for final
legislative endorsement and/or funding. This Study did not analyze nor prioritize
installation transportation plans, but the Team was briefed by a number of base officials and
can report that many plans are completed or are underway. The State might consider a
follow-on investigation and assessment of installation plans to determine where the needs
are greatest.

67
3. Recommended Strategic Message Themes and Audiences
Colorado leaders at local and county levels, at the State level, and within the delegations in the U.S.
Senate and House of Representatives represent key champions for a number of prioritized strategic
themes that emerged during this Study:
The military value of Colorado to the Department of Defense is reflected in world-class
military installations hosting vital mission responsibilities executed by a highly-skilled
military and civilian workforce of over 100,000, which draws from a superbly educated
population -- Colorado ranks third nationally in adults 25 and older with at least a bachelor
degree.
The military is a significant driver of Colorado’s economy, accounting for 7.5% of total
State labor earnings, making it the third largest industry in the State. As an industry,
Colorado military installations promote a synergistic dynamic which reinforces the value of
the State to supporting DOD mission requirements. The aerospace industry, for example,
employs 66,000 individuals and contributes $8.7 billion (3% of State GDP).
Colorado’s robust mix of private industry and higher education capabilities emphasizing
high technology development, coupled with the sophisticated military mission sets assigned
to State military installations, position Colorado as an incubator for commercial economic
growth and expanded 21st century mission support to DOD.
Colorado’s geography and altitude create an unrivaled environment for unique training of
special operations forces, rotary wing aviation, and UAS.
Colorado air and land joint training environments are flexibly postured to provide year-
round world-class training for land, air and space forces.
The communities and businesses surrounding Colorado’s military installations are
supportive of the mission sets assigned at those installations and visit Washington D.C.
frequently to reinforce their support by meeting with Pentagon and Congressional leaders.
The variety and unique character of Colorado’s natural attributes, the depth of higher
education opportunities, and the impressive fact that the State has the 6th
fastest growing
economy20
in the United States all foster an outstanding quality of life for DOD military and
civilian personnel, and for the growing number of veterans and military retirees who settle in
the State. Veterans comprise 10.4% of the Colorado population exceeding the national
average of 8.9%.
20
U.S. Bureau of Economic Analysis, [“Widespread But Slower Growth in 2013: Advance 2013 and Revised 1997—2012 Statistics of GDP by State,”] news release (June 11, 2014), http://www.bea.gov/newsreleases/regional/gdp_state/gsp_newsrelease.htm.

68
DOD’s investment of about 3.2% of its base budget in Colorado despite the State having
only 1.7% of the total U.S. population demonstrates the value and return on investment
offered to Colorado installations and communities.
The themes elaborated above can be championed in targeted messages delivered by key messengers
to specific audiences or constituencies. The following outline provides some recommended
alliances between audiences, messengers and messages:
Audience: Local organization (city and county governments, military affairs groups, civil/
business organizations, industry)
Messenger: State Leaders
Message:
Coordinate your installation support efforts to ensure that State and federal officials as well
as congressional offices hear a unified voice from the community.
Promote compatible industries and industrial development while understanding that some
potential developments could lead to encroachment issues adversely impacting military
operations at the installations.
Continue to show support for military personnel, defense civilians, families and veterans to
preserve and enhance the outstanding quality of life that is present today.
Continue to foster education opportunities that augment a highly-skilled workforce which
supports 21st century military missions and defense technologies.
Continue to recruit, enhance, and retain high-technology industries to work with military
installations and thereby continue to provide quality jobs in the community.
Identify and pursue mutually beneficial partnerships with local installations, DOD, and the
Military Services in areas such as shared services, research and technological development.
Audience: State of Colorado (legislators and senior executive branch officials)
Messenger: State and Civic Leaders
Message:
The State of Colorado’s world class military installations require first-rate transportation
infrastructure to provide access, allow execution of new missions, promote joint training,
and ensure mobilization capability – this requires State as well as federal assistance.

69
Assist local governments in protecting Colorado’s military installations from incompatible
development (encroachment) outside “the wire” that might impair or threaten military
operations and training and the longevity of these facilities.
Support existing and new high-technology industry and higher education in the State, since
both promote a vital and modern military presence in Colorado and create a synergistic
environment for military installations and industry partners to support one another.
The State through legislative and regulatory methods should continue to provide
accommodations to military personnel and families (e.g., mandatory education requirements
for secondary school graduation, licenses, professional certification) relocating from other
states so they are not disadvantaged when moving to Colorado in response to military-
directed permanent move orders.
With DOD contributing 5.2% of the State’s total employment and 5.5% of the State’s total
tax revenue, Colorado should continually assess the economic impact from military
installations and from surrounding space and defense industries to identify opportunities for
expansion and development.
Audience: Colorado Congressional Delegation (U.S. Senate and House of Representatives)
Messenger: State and Civic Leaders
Message:
In a very competitive funding environment, you need to ensure that funding for installation
infrastructure on and off base is a high priority within the DOD and Committees of
jurisdiction so that Colorado’s world-class military installations and training environments
are retained and potentially enhanced.
Promote DOD and Government policies and programs that enable and encourage innovative
partnerships between military installations and community stakeholders, which provide cost
savings, mutual economic and quality of life benefits, increasing the installation’s military
value to DOD. An example is the participation of Peterson AFB and Buckley AFB in the Air
Force Community Partnership Initiative, where these two bases have bolstered ties to their
local communities and industry partners with mutually beneficial arrangements.
Through your contacts and networks continue to foster the importance of growth in defense
and related industries, which are a major economic driver for the State contributing $11.7
billion in labor income in 2014. The synergy between the defense industries, installation
military missions, and education institutions is integral to fostering an enviable quality of
life in Colorado.
70
At public events and private meetings, express support for Colorado military installation
mission growth and expansion by highlighting the capacity, unique attributes, and highly-
skilled workforce resident within the State.
Utilize positions on Armed Services, Defense Appropriations, and other relevant committees
and subcommittees to actively engage at a number of levels with Pentagon and
Administration officials on the military value and economic impact of Colorado assets and
opportunities.
Audience: Department of Defense and related Executive Branch agencies
Messenger: Congressional, State, and Civic Leaders
Message:
The State of Colorado possesses military installations, associated commercial industry,
robust higher education opportunities, and a versatile, highly-skilled workforce that together
assures tremendous military value to DOD and provides the capacity to support new
missions and mission growth.
The sophisticated workforce, industry synergies, and pervasive military jointness in the
State’s installations and mission sets make Colorado an ideal partner for contributing to
successful completion of Department of Defense strategic objectives and a welcoming host
for military installations.
Colorado’s diversity of terrain, altitude, and training environments are critical assets for 21st
century military operations and training.
The Colorado congressional delegation will have abundant opportunities to convey the
military value of the State’s military installations as well as the contribution and economic
impact of the industries that support DOD, NASA, and related organizations. These
opportunities could include Congressional hearings where Administration officials are
testifying, Administration office visits, and meetings with Administration appointees.
Consistently telling the story of the military value of Colorado military installations,
institutions, defense and the aerospace industries needs to be an ongoing endeavor.

71
4. Summary of Tasking and Background Information
The nation’s defense enterprise is changing in response to declining budgets, new warfighting
technologies, and evolving strategic threats across the global commons. The realities of the current
era have led many states – like Colorado – to assess their military functions’ strengths,
vulnerabilities and opportunities to provide Department of Defense decision makers with relevant
information regarding military installations and their associated missions and assigned units.
The General Assembly of Colorado, pursuant to Senate Bill 14-157, tasked the Department of
Military and Veterans Affairs (DMVA) to develop a data-driven analysis on the value of military
activities in the State. A Study Team consisting of Whitney, Bradley & Brown, Inc. (WBB),
Summit Economics, and Madison Government Affairs (MGA), was competitively selected to
perform this analysis. DMVA and the Study Team developed a shared understanding of how to
proceed with the data-driven analysis based on Governor Hickenlooper’s formal press release on 15
October 2014:
“Colorado’s military and defense industry is an important and diversified anchor in our
statewide economy, employing tens of thousands across the state while driving innovation,
aerospace, engineering, technology and advanced manufacturing. Colorado has long been a
vital contributor to the nation’s defense and with the data from this study, we will be better
able to protect installations and build related industry as national budgets continue to shift.
The study will provide the state with data that will help to assess, protect and build upon
Colorado’s military installations and defense industry.”
The 1990s-era BRAC Commissions in particular, as well as the Department of Defense in general,
were focused on reducing the number of military bases as well as major installation and military
mission realignments. In the early 1990s the DOD force structure was being significantly reduced
and there were far more bases than needed to satisfy the requirements of a shrinking force structure.
The Department went 10 years without a BRAC with Congress reluctant to reauthorize another
round until 2005. Secretary of Defense Rumsfeld directed the BRAC 2005 round to focus on
transformation and joint-basing; the outcome of his guidance and final Congressionally-approved
BRAC recommendations left the Department with excess bases. In the decade following the 2005
BRAC, both the Army and the Air Force have repeatedly stated they manage about 20-25%
infrastructure in excess of needs. The differential between basing structure and force structure
requirements has widened in the last three years of sequestration-driven budget constraints and
reduced military operations overseas. Deputy Secretary of Defense Robert Work, in a November
2014 Pentagon press conference, confirmed that DOD is currently operating with 24% excess
capacity in bases and facilities and doing away with them could save $2 billion a year.
In the report that accompanied the FY 2015 Military Construction/Veterans Affairs Appropriations
Bill, Congress expressed concern that the DOD “does not consider the intellectual capabilities of a
region when evaluating the criteria for BRAC”. The Committee went on to recommend that the

72
DOD should “clearly establish an intellectual capabilities criteria consideration, especially when
considering academic and technical institutions, in addition to the already established BRAC final
selection criteria”. This Study accounted for Colorado’s “intellectual capabilities” by developing
and analyzing metrics associated with advanced education and technical skills training capabilities
within the region proximate to the seven major military installations under review.
In the 2015 budget, Congress refused to authorize another BRAC Commission for 2017. The
President’s Budget Request for FY16 requests authorization for another BRAC round, but none of
the recently selected House and Senate committee chairmen with legislative authority in this area
have publicly expressed support for another BRAC in 2017. In testimony before House and Senate
Armed Services Committees, a number of senior Air Force and Army civilian and military leaders
stated that sequestration-driven budget cuts might lead them to make limited base realignment
decisions for which they have current authority. Some observers characterize this possible action as
a “micro” BRAC. Whatever happens, the stakes are high for Colorado to preserve the economic
contribution that DOD makes to the State economy while simultaneously ensuring that her military
installations, units and mission sets provide the highest military value to DOD.

73
5. Summary of the Analytical Methodologies and Tools
The approach was grounded in independent, data-driven analysis. It implemented a methodology
that combined subject matter expert perspectives with a proven process for analyzing military value
to the Department of Defense and expertise in measuring economic impacts to the State of
Colorado. The methodology required five steps: (1) developing the analytical model for the State
of Colorado; (2) collecting data by conducting surveys and visiting Colorado military installations;
(3) analyzing the data to assess military value and economic impact; (4) identifying and assessing
Colorado strengths, vulnerabilities and opportunities, and; (5) developing and coordinating strategic
messages and the opportunities and approaches for conveying and communicating. Figure 8
illustrates the approach and methodology.
Analytical Model Development
Developing the analytical model began with an assessment of DOD military value criteria21
for their
relevancy, inclusion and completeness. A review of current national, DOD, and Service strategic
documents such as the National Security Strategy 2015, the Defense Strategic Guidance 2012, the
National Military Strategy 2011, the 2014 Quadrennial Defense Review, and the DOD 20-year
21
The starting point for developing the complete set of military value criteria was the set of DOD criteria listed in the DMVA Request for Proposal: military capabilities; availability and condition of land; facilities and airspace; the ability to accommodate contingency mobilization; surge capability/capacity; future total force requirements; cost of operations; manpower implications/personnel availability.
Figure 8: Colorado Military Value and Economic Impact Approach and Methodology

74
force structure plan was the foundation for assessing relevancy, inclusion, and completeness. The
Study Team modified the set of criteria to include criteria for measuring the economic impact of
DOD to the State of Colorado. The resulting set of criteria and their definitions are provided below.
Criteria identified in italics were tailored to ensure appropriate attention was given to post-2005
changes in BRAC evaluation context and to important economic impact-related dimensions of
assessing value.
Military capabilities -- The abilities provided by tenant and non-tenant units of an
installation associated with satisfying mission tasks cited in the Universal Joint Task List
and the taxonomy of capabilities listed in the Joint Staff’s list of Joint Capability Areas
Availability and condition of land -- The ability of the installation’s land, both inside and
outside “the wire”, to support installation missions
Availability and condition of airspace -- The ability of the proximate/accessible airspace to
support installation missions
Facilities/infrastructure – The value, contribution and impact that an installation's real
property and facilities have on tenant and non-tenant unit missions
Ability to accommodate contingency mobilization -- The ability to deliberately provide for
the movement of installation personnel, supplies, and equipment in support of contingency
deployments and rapid enhanced training
Surge capability/capacity – The ability for an installation to rapidly increase support to
satisfy assigned State and Federal missions
Future total force requirements – The ability of an installation’s Active, Guard, Reserve and
DOD civilian manpower to transform through training and support future DOD force
requirements
Cost of operations -- The annual operating cost of an installation supported by both State
and Federal funding
Manpower implications/personnel availability -- The versatility and agility of assigned
military and civilian personnel to adjust to changes in operations, State and Federal policy,
and operating budgets

75
Community Interaction -- The character of social, economic, quality of life, and cultural
mutual dependence between military installations and their assigned personnel with their
surrounding communities
Economic Contribution -- The economic impact generated by DOD activities, investments,
support contracts, construction, salaries, etc., associated with an installation
Each criterion was concisely defined through an integrated process team (IPT) effort. The
definitions ensured the Study Team proceeded from a common baseline of understanding. Next,
measures for each criterion were similarly developed and defined. An iterative IPT effort refined
the set of draft measures into the set of final measures. The set of final measures were then aligned
with respective criteria and, together, became the model against which data was collected and the
analysis was performed. Figure 9 illustrates the Military Value and Economic Impact Model.
Figure 9: Military Value and Economic Impact Data Collection and Analysis Model

76
Data Assessment Tools and Collection Effort
While the Colorado DMVA coordinated the schedule of visits to installations, the Study Team
developed data collection tools. Two integrated tools were developed: a written survey and an
installation characterization matrix. The written survey consisted of questions that were distributed
in advance to each installation. The survey provided the installations’ insights to the focus of the
data collection and the means to respond with detailed information and data following the site visits.
These were distributed and retrieved through DMVA. The second tool, the installation
characterization matrix, was an internal tool the Study Team used to document individual team
member assessments of the installations and tenant commands. The matrix aligned each criterion
and its respective measures with a range of characterization statements. The individual assessments
were subsequently consolidated into a single master assessment matrix. Figure 10 illustrates a
partial example of a criterion-measure-characterization alignment from the consolidated collection
matrix.22
Military Value and Economic Impact Analysis Methodologies and Tools
The military value and economic impact criteria were assessed during two virtual workshops using
Expert Choice - Comparion ™
collaborative software as the assessment tool. Members made
informed judgments based on the shared understanding the Study Team derived from the initial
review of National, DOD, and Service strategic documents and the installation visits. All Study
Team members and a DMVA representative participated in each workshop event. The first
22
The complete consolidated assessment matrix is available from DMVA on request.
Figure 10: Example Characterization Matrix for Data Collection
Frequency Scored
Installations
Frequency Scored
Installations
Frequency Scored
Installations
Frequency Scored
Installations
Frequency Scored
Installations
Tenant Missions /
Command; Jointness
Characterization of
installation tenants
(assigned units) and
their missions with
respect to single
service, joint service,
non-DoD, or
uniqueness.
Installation has Joint
operational tenants
assigned and conducts
joint functions
(5)
Cheyenne Mtn
Peterson
Schriever
Greeley
Buckley
Installation includes
some Other Service
Tenants; or Other
Gov't Agencies
(1)
Carson
Installation has
service specific
tenants and functions
(1)
USAFA
Tenant Missions /
Command; Jointness
Characterization of
installation tenants
(assigned units) and
their missions with
respect to single
service, joint service,
non-DoD, or
uniqueness. (Unique =
only Installation
providing aggregate
capabilities)
Installation includes
unique missions in
DoD and other US Govt
Agencies
(6)
USAFA
Cheyenne Mtn
Peterson
Schriever
Greeley
Buckley
Installation includes
unique missions in
DoD
(1)
Carson
Installation aggregate
capabilities are not
unique within DoD
Tenant Missions /
Command
Characterization of
installation tenants
(assigned units) and
their missions with
respect to single
service, joint service,
non-DoD, or
uniqueness.
Senior Command on
Installation is a 4-star
bil let
(1)
Peterson
Senior Command on
Installation is a 3-
star bil let
(2)
USAFA
Buckley
Senior Command on
Installation is a 2-star
bil let
(1)
Carson
Senior Command on
Installation is a 1-star
bil let
No Flag/General Office
bil lets
(3)
Cheyenne Mtn
Schriever
Greeley
Tenant Missions /
Commands
Characterization of
installation tenants
(assigned units) and
their missions with
Extensive / Substantive
non-DoD Missions
(1)
USAFA
Few non-DoD
Missions
(2)
Schriever
Buckley
No Non-DoD Missions (4)
Carson
Cheyenne Mtn
Peterson
Greeley
Proximity
Proximity to
Installations with l ike
or complementary
missions
(Complementary = the
synergy gained from
combining functions
which enhance mutual
capabilities)
Installation is >500
miles from another
installation performing
like missions
(3)
USAFA
Carson
Peterson
Installation is
between 151-300
miles from another
installation with l ike
missions
Installation is between
51-150 miles from
another installation
with l ike missions
(4)
Cheyene Mtn
Schriever
Greeley
Buckley
Installation is within
50 miles of another
installation
performing like
missions
Proximity
Proximity to
Installations with l ike
or complementary
missions
(Complementary = the
synergy gained from
combining functions
which enhance mutual
capabilities)
Installation is 20 or
fewer miles of another
installation performing
complementary
missions
(1)
Peterson
Installation is
between 21-50 miles
of another
installation with
complementary
missions
Installation is
between 51-150 miles
of another installation
with complementary
missions
(4)
Cheyenne Mtn
Schriever
Greeley
Buckley
Installation is between
151-300 miles of
another installation
with complementary
missions
Installation is >300
miles of another
installation
performing
complementary
missions
(2)
USAFA
Carson
Jointness
Number of Joint or
Service-specific training
ranges
Installation has 7 or
more Joint or Service-
specific training
ranges
(1)
Carson
Installation has 5-6
Joint or Service-
specific training
ranges
(1)
Buckley
Installation has 3-4
Joint or Service-
specific training
ranges
Installation has 1-2
Joint or Service-specific
training ranges
(1)
Peterson
Installation has no
Joint or Service-
specific training
ranges
(4)
USAFA
Cheyenne Mtn
Schriever
Greeley
Protection
Resiliency of
Installation in face of
physical and cyber
threats
Installation has
extensive physical and
cyber related
prevention and
mitigation capabilities;
Multiple networks;
Integrated and robust
defenses
(6)
Carson
Cheyenne Mtn
Peterson
Schriever
Greeley
Buckley
Installation has
moderate physical
and cyber related
prevention and
mitigation
capabilities; Some
redundant networks;
Defenses not
integrated
Installation has
l imited physical or
cyber related
prevention and
mitigation
capabilities; Limited
information assurance
Mil Value &
Economic Impact
Criteria
Measure
Characterization
Military Capabilities
The abilities provided
by tenant and non-
tenant units of an
installation with
respect to the
Universal Joint Task
List (UJTL) and Joint
Capability Areas (JCA).

77
workshop weighted the importance of the military value and economic impact criteria and their
respective measures. Weighting the criteria and measures required assigning the importance of
each to DOD using a numerical scale of 1 (little importance) to 9 (significant importance) and
resulted in a set of universal weights for DOD installations. The second workshop scored the value
of each installation to DOD with respect to the measures. Scoring the installations required the
participants to make informed judgments as to the extent of the value each Colorado installation has
with respect to each measure. Study Team members used a subjective scale with nine gradations
that ranged from “none” to “outstanding”. The software automatically applied the “importance”
weights of the measures and criteria from the first workshop to each member’s value score.
Additionally, each member documented their rationale for each score made using a comment/text
entry feature of Expert Choice - Comparion ™
and also identified areas of potential strength or
vulnerability.
Vulnerabilities Assessment Methodology
The areas identified during the post-workshop analysis of the Expert Choice - Comparion ™
output
as potential strengths and vulnerabilities for Colorado were consolidated into a candidate list. The
list was screened using DOD strategic objectives (such as preserving training areas suitable for
maneuver by ground and air forces in order to ensure readiness; preserving staging areas for use
during homeland defense missions; and preserving installations with a substantial impact on joint
warfighting, training, and readiness); economic impact to Colorado; and the depth of available
information and understanding of the related issues. The items that passed screening were put into a
refined list and then developed in greater detail. Specifically, each item was given a concise
description and assessed for likelihood and consequence(s). Each item was assessed and
documented in a succession of IPTs, and the conclusions documented as described in Section 1
above.
Determining Military Value
A military installation with resident forces and missions contributes military value to DOD to the
extent that the forces and missions support established national security objectives. Evaluating
military value is both an objective and subjective exercise. The military value of Colorado
installations to DOD was determined through post-workshop analysis of the Expert Choice -
Comparion ™
output. The output data was quantitatively and qualitatively analyzed to draw
conclusions and visually display results. The approach required several IPTs to synthesize the
information, draw conclusions, develop the strengths, vulnerabilities and opportunities, and form
the results. The methodology analyzed the military value and economic impact scores for the
measures and criteria, identified areas of emphasis and pattern, identified preliminary strengths and
vulnerabilities, identified preliminary opportunities, and developed statements to articulate meaning
for the State of Colorado.

78
Determining Economic Impact
The purpose of this portion of the study is to estimate the overall impact of the Department of
Defense on the Colorado economy, both in total and within political subdivisions such as counties
and U.S. congressional districts. The impacts, while all generated by DOD, fall into three general
categories:
Impact of military installations located in Colorado, including the personnel and non-
contract expenditures
Impact of all DOD contracts
Military National Guard and Reserve personnel residing in each Colorado county
In essence this study attempts to identify and measure all DOD funding flowing into the State.
Some DOD expenditures are not captured or are only partially included in the data collection
process. The DOD expenditures not captured are considered to be relatively minor and include:
DOD personnel traveling to Colorado for work if their travels are funded by their home
base outside of Colorado
DOD personnel pursuing higher education when tuition reimbursement does not come from
DOD installations located in Colorado
Also excluded from this study are detailed analyses of:
The economic impact of veterans residing in Colorado and the benefits they receive
The Department of Homeland security and national intelligence agencies unless their
personnel are included in DOD base head counts such as at Buckley AFB
All other Federal agencies which might be collaboratively funding research with DOD or
might be providing direct social assistance at a DOD facility such as the Department of
Health and Human Services channeling block grants through State and county governments
with the beneficiary of such funding being military personnel
The economic impact analysis presented is based on a standard regional impact analysis approach
that is commonly used among regional economists. This form of analysis measures impacts from
an event, company, industry, or project on a region’s total employment, household incomes, value
added (gross regional product), and total output (gross revenues). The impacts are highlighted in
Figure 11.

79
As noted in Figure 11, there are three types of impacts: direct, indirect and induced. The direct
impacts are derived from the first three categories listed above and represent in inflow of funding
into Colorado from the DOD. The inflow of funds is similar to funds flowing into an economy as a
result of products and services they export. Direct impacts create indirect impacts in the case of
military installations and other DOD contracts and induced impacts in all cases. The indirect
impacts derive from local companies and other organizations (located within the region of study)
providing products and services in support of the direct impact.23
The induced impacts result from
both direct and indirect workers and organizations spending money derived originally from the
direct impacts in the regional economy. For instance, military personnel working at an installation
and employees of a wholesale company providing goods to the installation, spend a portion of their
income within the region thereby creating more jobs, incomes, value added, and output. The
indirect and induced impacts are referred to as the multiplier effect indicating that a direct impact
gets multiplied and has a greater total impact within the region.
Regions are defined relative to study areas. In this case the region is defined as Colorado. What
makes this economic impact study relatively unique compared to most impact studies is that the
23
A nuance in this analysis is that induced impacts are often calculated by total expenditures creating the direct impact. To avoid possible double counting a review of all DOD contracts in Colorado were reviewed and DOD expenditures at military bases were discounted.
Figure 10: Economic Impacts Overview
80
Colorado Department of Military and Veteran Affairs desired estimates of impacts from DOD
expenditures on multiple political jurisdictions within the State – by county and U.S. congressional
district. This level of detail required further analysis known as trade flow analysis. Trade flow
analysis enables the impacts generated from a specific point to be shown as cascading throughout a
region from the point of origin such as a military installation. In this study the trade flow impacts
are estimated down to the county level.
To generate the economic and trade flow estimates the study utilized the econometric model known
as IMPLAN. The model is updated annually with data and model coefficients specific to Colorado
and the industrial mix within the State. Due to the complexity of the model and its application
internationally, test runs were used to calibrate the model to assure compatibility with older
Regional Input-Output Modeling System (RIMS)-based approaches. After IMPLAN was adjusted,
data was input into the model to generate impacts for the entire State as well as all counties within
the State. IMPLAN output was then checked against some high level impacts using proprietary
methods and RIMS multipliers from the Bureau of Economic Analysis. Based upon these
approaches final expert judgments were made to outline the final impacts.
Inputs for the direct impacts were derived from multiple sources including:
Site visits and interviews with officials at each military installation in Colorado
Economic Impact Assessments provided by the U.S. Air Force for some installations
Written answers to questions posed by the Study Team
Interviews with several military base budget managers
Two contract and assistance databases from DOD
Secondary data sources from the Bureau of Economic Analysis, U.S. Census Bureau, U.S.
Bureau of Labor Statistics, Colorado Department of Labor and Employment, and Colorado
State Demographer
Additional economic impacts are also considered. These include:
Colorado state government revenues resulting from total impacts
Economic diversification and economic life cycle effects resulting from the DOD presence
Spin off and economies of agglomeration which result as momentum is gained in one
economic sector such as DOD funding of installations which in turns grows into a larger
mass of clusters and economic activity. These are secondary, longer-term effects that would
likely not have developed were it not for the original economic event.
The diversification, life cycle and agglomeration effects were noticed during the research. Most of
the reporting on these effects is anecdotal in nature based upon interviews, other reports, and
historical datasets.

81
NOTES ________________________________________________________________________
_______________________________________________________________________________
_______________________________________________________________________________
_______________________________________________________________________________
_______________________________________________________________________________
_______________________________________________________________________________
_______________________________________________________________________________
_______________________________________________________________________________
_______________________________________________________________________________
_______________________________________________________________________________
_______________________________________________________________________________
_______________________________________________________________________________
_______________________________________________________________________________
_______________________________________________________________________________
_______________________________________________________________________________
_______________________________________________________________________________
_______________________________________________________________________________
_______________________________________________________________________________
_______________________________________________________________________________
_______________________________________________________________________________
_______________________________________________________________________________

82