![CHAPTER SEVENTEEN: IMMIGRATION LAW - lslap.bc.ca€¦ · 18-2 II. IMPORTANT LEGISLATIVE CHANGES The Immigration and Refugee Protection Act, RSC 2001, c 27 [IRPA] came into force on](https://static.fdocuments.net/doc/165x107/605d56dd64914871dc43b60e/chapter-seventeen-immigration-law-lslapbcca-18-2-ii-important-legislative.jpg)
Report on the American Workforce, 2001 - Bureau of Labor … · 2001-09-05 · population and...
205
Report on Report on Report on Report on Report on the American the American the American the American the American Workfor orkfor orkfor orkfor orkforce ce ce ce ce U.S. Department of Labor Elaine L. Chao, Secretary 2001
Transcript of Report on the American Workforce, 2001 - Bureau of Labor … · 2001-09-05 · population and...

Report onReport onReport onReport onReport onthe Americanthe Americanthe Americanthe Americanthe AmericanWWWWWorkfororkfororkfororkfororkforcececececeU.S. Department of LaborElaine L. Chao, Secretary
2001

iii
PrefacePrefacePrefacePrefacePreface
This is the Department of Labor’s fifth Report on the American Workforce. Previous editions appeared in 1994, 1995, 1997, and 1999. Each volume hasprovided a broad context for analyzing the issues faced by the Department ofLabor, as it delivers on its mandate to prepare the American workforce for new andbetter jobs and to ensure the adequacy and competitiveness of America’s work-places. In this volume, the Report traces the broad outlines of the economy in the20th century, its impact on the American worker, and the evolution of the statisticaltools needed by policymakers, workers, employers, and researchers, as they em-bark on a new century.
The Report’s outline and context is presented in the opening message fromSecretary of Labor Elaine L. Chao. An introductory essay outlines the economic,technological, social, and business developments of the just-completed century.The three chapters explore, in turn, demographic change and demographicstatistics, the evolution of compensation and compensation reporting, and eco-nomic structure and economic classification. A compendium of statistical tablescompletes the book. Katharine G. Abraham, Commissioner for the Bureau of LaborStatistics, established the strategic direction for this series of reports. DeborahKlein and Richard M. Devens provided overall direction for this year’s volume.
Information in this report is available to sensory-impaired individuals on request.Voice phone: (202) 691-5200. Federal Relay Service: 1-800-877-8339. This material isin the public domain and may be reproduced without further permission. Appropri-ate citation is requested.
iii
The introductory essay outlines the progress of the American worker over thecourse of the 20th century. This piece also suggests the degree to which our
understanding of the workforce, as result of refined statistics, improved substan-tially during the century. The introduction was written by Donald M. Fisk.
Chapter 1 describes the important changes in the composition of the Americanpopulation and workforce that are the result of immigration and internal migration,particularly the movement of African American workers out of the South. Thesechanges have driven the continuing development of methods for classifying demo-graphic data to track the economic status of a growing variety of groups in thepopulation. The authors of the chapter on minority measurement are N.Clyde Tucker;Geoffrey D. Paulin; Howard N Fullerton, Jr.; Thomas M. Beers III; Terry M.McMenamin; Abraham T. Mosisa; Sharon R. Cohany; and Howard V. Hayghe.
The second chapter chronicles the evolution of compensation practices over thecourse of the 20th century and the continuing efforts to capture these practices inuseful statistical data. The components of compensation continue to evolve. Vari-able pay benefits—such as profit sharing and stock options—are growing in im-portance; and other benefits, such as family care and health promotion programshave emerged. The authors of chapter 2 are Thomas Moehrle, Jordan Pfuntner,Richard Schumann, Albert Schwenk, Robert Van Giezen, Michael Horrigan, WilliamGoodman, and Michael Cimini.
Chapter 3 describes the structural evolution of the economy and the concomi-tant development of systems of industrial and occupational classification. Thoughnot often visible, economic classification schemes are critical in determining howwell statistics reflect the true workings of the economy. The chapter’s contributorswere Daniel Hecker, Jerome R. Pikulinski, and Norman C. Saunders. The authorswish to acknowledge the assistance of the History Staff of the Bureau of theCensus, U.S. Department of Commerce.
The Report was edited by Monica Gabor, Daniel Houlder, and Monica Carpioand was designed and composed by Margaret Jones, Phyllis Lott,Dorothy Williams, and Bonita Boles, under the direction of Monica Gabor.
AcknowledgmentsAcknowledgmentsAcknowledgmentsAcknowledgmentsAcknowledgments

vii
Message from the Secretary of LaborMessage from the Secretary of LaborMessage from the Secretary of LaborMessage from the Secretary of LaborMessage from the Secretary of Labor ......................................................... 1
Introduction .................................................................................................. 3
Business cycle timeline ................................................................................. 13
Chapter 1Counting minorities: A brief history andCounting minorities: A brief history andCounting minorities: A brief history andCounting minorities: A brief history andCounting minorities: A brief history and
a look at the futurea look at the futurea look at the futurea look at the futurea look at the future .............................................................................. 15A history of immigration and migration ................................................ 15Counting minorities .............................................................................. 17Publication of information on minority workers ................................... 21Current data on minority workers ......................................................... 23Counting minorities: new directions ..................................................... 28Conclusion ........................................................................................... 29
Social and economic timeline ........................................................................ 55
Chapter 2The evolution of compensation in a changing economyThe evolution of compensation in a changing economyThe evolution of compensation in a changing economyThe evolution of compensation in a changing economyThe evolution of compensation in a changing economy .......................... 57
Structural change and American labor ................................................. 57The influence of Social Security legislation ......................................... 58The right to bargain collectively .......................................................... 58Setting standards ................................................................................. 59Composition of pay .............................................................................. 65
Pre-World War I reform and economic volatility .................................. 65 World War I and prosperity .................................................................. 67 The Great Depression and the Federal role in the economy ................ 69
World War II and the transition to a peacetime economy ..................... 71 The Korean War to beyond the Great Society ..................................... 73
Inflation, recession, and high unemployment ...................................... 75An economy in transition ..................................................................... 77The 1990s and the New Economy ........................................................ 79Future trends in employee compensation ............................................ 82
Legislatative and regulatory timeline ............................................................ 93
Chapter 3Economic change and structures of classificationEconomic change and structures of classificationEconomic change and structures of classificationEconomic change and structures of classificationEconomic change and structures of classification .................................. 95Industry classification .............................................................................. 95
The Standard Industrial Classification System .................................... 97 The North American Industry Classification System ........................... 99Occupational classifications ..................................................................... 101
Purpose and value ................................................................................ 101
ContentsContentsContentsContentsContents
Page

viii
Chapter 3—ContinuedWhy classify occupations? .............................................................. 102The early census approach .............................................................. 105The revised census approach era ..................................................... 105A period of transition ....................................................................... 106Response of the classification system to new products,
technologies, and other changes ................................................. 107The Occupational Employment Survey ............................................ 109Patterns of change in the OES and SOC occupational
classification systems .................................................................. 110Future directions .................................................................................. 111
Technological timeline ................................................................................. 119
Appendix: Statistical tables .......................................................................... 121
Contents—ContinuedContents—ContinuedContents—ContinuedContents—ContinuedContents—Continued
Page
1
Message from the Secretary of LaborMessage from the Secretary of LaborMessage from the Secretary of LaborMessage from the Secretary of LaborMessage from the Secretary of Labor
The American workforce has gone through many changes in the last century, nonemore striking than the way we work. At the beginning of the previous century, wages
were low, and the Nation did not even measure unemployment. Today, BLS measuresalmost every aspect of the American labor force. The 20th century was, as Ben Wattenbergput it, “The First Measured Century.”
This volume looks at the information we now know through these new measure-ments, examining three of the major 20th century changes in the compilation of laborstatistics. The first chapter focuses on important changes to the composition of theAmerican population and workforce, as enormous waves of immigration during the lastcentury both augmented the labor force and challenged mechanisms of the labor market.Chapter 2 examines the evolution of compensation practices over the course of the 20thcentury, as workers’ compensation packages evolved from a simple pay envelope at theend of the week to a complex set of cash payments and benefits. The final chapter of thisreport describes some of the efforts to measure structural changes that affected theeconomy, as industries and occupations changed throughout the century.
Thanks in part to these new measuring tools, the 20th century has been one of themost productive and dynamic centuries ever. But the 21st century promises to be evenmore exciting and enterprising for the American workforce. With all of the changes tocome, America’s 21st century workforce needs to do more than simply adjust to the neweconomy. To succeed in the 21st century, our Nation must be prepared to embrace thechanges in our economy—in how we work, where we work, and how we balance ourprofessional and family lives.
I believe that the Department of Labor should lead the way in anticipating and reactingto changes, thus helping all workers to have as fulfilling and financially rewarding careersas they aspire to have. To this end, we have created a new Office of the 21st CenturyWorkforce. The office’s mission is to provide all American workers with the opportu-nity to equip themselves with the tools necessary to succeed in their careers and inwhatever field they choose in this new and dynamic global economy.
That does not mean we should change everything. We still need to protect workers’safety and health, retirement security, and equal access to jobs and promotions. But wealso need to be open to new and better ways to achieve those goals, taking into accounthow Americans actually work today.
I want us to focus as a Department on three issues that will determine our Nation’seconomic strength in this century, and shape the quality of life for America’s workingfamilies:
The skills gap. Our economy is making an unprecedented transition into high-skilled,information-based industries. This has created a disconnect between the jobs that arebeing created and the current skills of many workers.
Our demographic destiny. In just a few decades, we will have a growing class of retireesand a shrinking workforce. In addition, there will be an increasingly diverse group ofAmericans entering the workforce, bringing with them the need for truly new ways oforganizing and managing work.

2
ELAINE L. CHAOSecretary of Labor
The future of the American workplace. Anyone can tell you that this is not our parents’economy. The average 34-year-old has already worked for nine different companies inhis or her brief career. Around 10 million people work away from their corporate officeat least 3 days a month. As people sort out the new priorities of financial needs andfamily life, they all face the same new concerns: A career move that leaves behind healthcare coverage; abandoning pension benefits before they are vested; renegotiating witheach new employer the balance between work and home.
In this new century, BLS will continue to provide us the tools needed to face thesechallenges. With enlightened leadership, the private, public, and nonprofit sectors,working together, can develop innovative solutions to ever-more-complex labor marketproblems. Leadership will make us a nation open to the talents of all our people—including those who have been left out of the workforce until now. Ultimately, informedleadership will make our training programs effective “venture capital” for the 21st cen-tury workforce.

3
Introduction
The 20th century was a remarkable periodfor the American worker, as wages rose,
fringe benefits grew, and working conditionsimproved. Even though many statistics weresketchy at the beginning of the century, thepicture is clear: The American workforce wasmuch better off at the end of the century thanit was at the beginning. And the statistics usedto understand the condition of working Ameri-cans also improved over the course of the cen-tury, as we discuss in this Report on the Ameri-can Workforce.
Comparison of the American workforce atthe end of the 20th century, with that at thebeginning, shows numerous changes. Some ofthese are dramatic; others less so. Many ofthese changes are well known, but some arenot. In certain cases, statistical data are lack-ing to make quantitative comparisons betweenthe beginning and end of the century; but mostof the changes are discernible, nevertheless.
The size of the Nation’s workforce in-creased roughly six fold during the 20th cen-tury. The workforce registered 24 million in1900 with those aged 10 and above reporting againful occupation;1 in 1999 it was 139 mil-lion (aged 16 and older).2 But it is not just thesheer numbers that are striking. The compo-sition, compensation, workplace, and verynature of work also changed during the century.
Over the course of the 20th century, thecomposition of the labor force shifted fromindustries dominated by primary productionoccupations, such as farmers and foresters, tothose dominated by professional, technical,and service workers. At the turn of the cen-tury, about 38 percent of the labor force workedon farms. By the end of the century, thatfigure was less than 3 percent. Likewise, thepercent who worked in goods-producing indus-tries, such as mining, manufacturing, and con-struction, decreased from 31 to 19 percent ofthe workforce. Service industries were thegrowth sector during the 20th century, jump-ing from 31 percent3 of all workers in 1900 to78 percent4 in 1999.
The labor force composition shifted inother ways, too. Female participation in thelabor market grew dramatically in the 20thcentury. In 1900, only 19 percent5 of womenof working age participated in the labor force,whereas 60 percent6 of them did in 1999.Furthermore, there was a marked change infemale occupational employment. In 1900,only 1 percent of the lawyers and 6 percent ofthe Nation’s physicians were women.7 In1999, the figures were 29 percent for lawyersand 24 percent for physicians.8
Child labor was common at the turn of thecentury, and many families needed the incomeearned by their children to survive. The 1900census counted 1.75 million individuals aged10 to 15 who were gainful workers.9 At thattime, these children comprised 6 percent ofthe labor force. There were no national lawsthat governed child labor, and while some Statesenacted and enforced such laws, most did not.By 1999, Federal and State law regulated childlabor; and Federal law effectively prohibitedfull-time workers under the age of 16.
Statistics are sparse on minority participa-tion in the labor force at the turn of the cen-tury, even by the standards of the day. Usingthe terminology of the day, census data showthat the nonwhite workforce numbered a littleunder 3.8 million in 1900. This was about 14percent of the labor force.10 In 1999, theblack workforce numbered 16.5 million, orabout 12 percent, of the labor force.11 Therewere also American Indians, Japanese, andChinese in the labor force at the turn of thecentury, but their numbers were few comparedwith the Negro.12 By 1999, the other minor-ity groups had increased, but blacks remainedthe largest racial minority group, as we discussin chapter 1 of this report.
In 1900, per capita income (in 1999 dol-lars) was $4,200; it was about $33,700 in1999.13 The average hourly pay of manufac-turing production workers in 1999 was $13.90;in 1909, the first measured year, it was about$3.80 (in 1999 dollars).14 In addition to wages

4
and salaries, benefits comprised a major partof employee compensation at the end of the20th century. Statistics show that benefitsaveraged $5.58 per hour—or 27.5 percent oftotal compensation—in 1999.15 (Benefit dataare not available for the beginning of the cen-tury, but benefits were minimal—if availableat all—to workers in the industrial economy.)One compensation series shows that benefitsaccounted for a little more than 1 percent oftotal compensation in 1929, the first yearmeasured.16 Wages and salaries improved dur-ing the course of the century, although in realterms they seem to have leveled off during thelast quarter of the century. If total compensa-tion—wages, salaries and benefits—is exam-ined, the trend remains positive.
The average workweek dropped dramati-cally during the 20th century. In 1900, theaverage workweek in manufacturing was 53hours,17 and in 1999 it was about 42 hours.18
But the decline was not steady, as the work-week is very sensitive to business conditions.During the great depression, the average num-ber of hours per workweek for productionworkers in manufacturing dropped as low as34.6. During World War II, it rose to 45.2hours at one point. After the War, it stabilizedat about 40 hours per week. The normal rangefor the four decades after World War II was 39to 41 hours per week, but the factory work-week exceeded 41 hours for most of the 1992-1999 period.19
The number of hours at work varies byindustry sector, as well as in response to thestate of the economy. In 1999, the weeklyaverage for the total private sector was 34.5hours; and the average for the total goods-producing sector was 41.0 hours. The retailtrade sector average workweek was 29 hours,wholesale was 38.3, construction was 39.1, andmining was 43.8. Average retail trade hours,for example, have shown a fairly constant dropsince 1947, as industry added more part-timeworkers.20 Mining hours, on the other hand,rose over that period. Workweeks in some sec-tors, such as manufacturing and construction,are impacted by changes in the economy; andmany sectors, including retail trade and con-struction, are affected by seasonal changes.
Workplace safety improved dramaticallyduring the 20th century. Almost 1,500 work-ers21 were killed in coal mine accidents in 1900.However, in 1999, the figure22 was 35. And itwas not just coal mines that were unsafe. Therewere 2,550 railroad workers23 killed in 1900,
compared with 56 in 1999.24
These two industries were picked becauseof data availability, as fatality statistics arenot available for most industries at the turn ofthe century. Moreover, injury data are notavailable at the beginning of the century forany industry. Some national injury data werecollected in 1911, but detailed statistics werenot available until later in the century.Whether accidents are fatal or not, statisticsindicate that they are less common, and theworkplace is a much safer place, for the workerat the end of the century than at the begin-ning.
If an employee was injured on the job in1900, his only recourse for compensation wasto sue for damages. Such lawsuits were gener-ally unsuccessful. It is estimated that at thattime only 15 percent of workers injured onthe job were successful in obtaining any dam-ages under common law.25 By 1999, therewere a number of government programs thatassisted those injured on the job. Long-termdisability payments, Worker’s Compensation,and other provisions in statute or contractsprovided safety nets for the worker in 1999that did not exist in 1900.
Unemployment is estimated at 5 percent26
in 1900; in 1999 it averaged 4.2 percent.27
While these two figures are not much differ-ent, they reflect very different dynamics. Datafrom four States—California, Kansas, Maine,and Michigan—and the 1910 census suggestthat workers around the turn of the centuryfaced a high probability of being laid off orunemployed sometime during the year. Butthe length of time one was unemployed waslikely to be shorter than it was at the end ofthe century.28 In 1999, the median durationof unemployment was 6.4 weeks.29
There were 19 business cycles in the 20thcentury.30 As a result, the century experi-enced periods of very low unemployment andperiods of extremely high unemployment.Between 1900 and 1908, the unemploymentrate fell below 3 percent. Later in the century,rates above 8 percent were recorded duringrecessions, such as those in 1915, 1921, 1975,and 1982. The highest rates of unemploy-ment came during the Great Depression, whenthere were rates above 20 percent for severalyears. In 1933, there were more than 12 mil-lion workers unemployed; and the unemploy-ment rate averaged 24.9 percent. More re-cently, double-digit unemployment rates wererecorded during parts of 1982 and 1983, but

5
there was a fairly steady decline from 7.8 per-cent in mid-1992 to 4.1 percent at the end of1999.31
Forces of changeWhat forces underlie the changes of theworkforce in the 20th century? Technology,capital, demography, immigration, education,and government intervention are often men-tioned. In most cases, it is impossible to pointto a single force or action that led to changesin the workforce. Most changes reflect theconfluence of several factors or events.
Technology entered the workplace in amassive way in the 20th century. The list oftechnological improvements in the workplacein the last century is almost endless: Commu-nication devices, measuring devices, computercontrolled equipment, the x-ray, wind tunnel,arc welder, circuit breaker, transistor, geigercounter, laser, neon lamp, teletype, fiber op-tics, stainless steel, and the atomic clock. Thelist goes on and on. At the turn of the century,only 5 percent of the Nation’s factories usedelectricity to power their machines.32 How-ever, by the end of the century, electrical pow-ered machines were ever present; and heating,air conditioning, and air filtration were com-mon in the workplace. And technologicalimprovements often resulted in improvedsafety in the workplace, as technology replacedthe worker in some of the more dangeroustasks.
Additionally, technological improvementsthat entered the home in the 20th century ledto major changes in the workplace, as morehomemakers were able to shift some of theirtime from home production to paid jobs. Atthe same time, new industries were created toserve the home; and existing industries ex-panded. Electricity was in less than 10 per-cent of the Nation’s homes at the turn of thecentury, but it was almost universal by the endof the century.33 New machines introduced inthe home in the 20th century included therefrigerator, dishwasher, clothes washer, dryer,iron, vacuum cleaner, microwave oven, auto-matic toaster, electric razor, and electrichairdryer. In addition, there was prepackagedfood, frozen food, and a host of other conve-nience items. The list could extend for manypages. Expansion of the paid workforce wascertainly facilitated by these labor-saving goodsand devices that were introduced into the homein the 20th century.
Likewise, technological improvementshave worked their way throughout theeconomy. Medical advances have extendedthe life span of individuals and have led tofewer and less severe illnesses, allowing work-ers to work longer with less debilitating ill-nesses. Those injured on the job were morelikely to return to work sooner. There was ahost of new drugs and medical procedures; andnew contraceptives facilitated family planning,especially impacting women workers. Majorchanges in transportation, primarily the useof the automobile, led to massive shifts in thelocation of the workplace. Factories were re-settled to areas of cheap land and built on singlelevels. No longer were factories tied to thecity. The explosion of communications per-mitted further dispersal of the workplace. Theautomobile also led to dispersion of the homeand shopping. Computers were a major factorin the economic growth of the last decade ofthe 20th century, but the overall importanceof computers in the economy and workplacewill not be known for decades.34
To put the new technology to work oftenrequired massive amounts of capital. In 1996,for example, investment in information tech-nology per worker was $29,200 for telecom-munications; $7,600 for real estate; and$4,600 for railroads.35 While real capital in-put increased 3.8 percent per year between1948 and 1998 for the private sector, infor-mation equipment and software increased 11.4percent per year; and computers and relatedequipment software increased 27.8 percent peryear.36 In 1999, the economy consumed overone trillion dollars of fixed capital. Withoutcapital, technology would not have made itsway into the workplace.
Changes in the demographics of the popu-lation in the 20th century had a profound im-pact on the workplace. The population aged,became more diverse, and grew dramatically.In 1900, the life expectancy of a newborn was47.3 years;37 in 1999 it was 77.0.38 In 1900,80 percent of American children had a work-ing father and a stay-at-home mother, how-ever, by 1999, that figure was only 24 per-cent.39 The population at the beginning ofthe century was 76 million, but approached280 million by the end of the century. (Theofficial 1999 Census count is 273 million, butthe 2000 Census counted 281 million).40
Immigration was crucial to the develop-ment of the U.S. economy and the workplace

6
in the 20th century. In 1900, 448,572 indi-viduals passed through immigration control,and for the decade as a whole (1900-9) therewere 8.2 million.41 Those of work age hadcome to find employment and a stake in abetter job. Most were laborers or listed nooccupation on their entry documents.42 (Re-cent numbers are only slightly larger and, as aproportion to the overall population, a greatdeal smaller.) In 1998, there were 660,477legal immigrants; and for the decade as a whole(1990-99), there were close to 10 million.43
During the 1930s and 1940s, in contrast, im-migration dropped to less than 100,000 peryear, as a result of the strict quota systemestablished under the National Origin Act of1929. But the Immigration and Naturaliza-tion Act of 1965 removed racial quotas andopened the doors to a large number of non-European immigrants. Immigration laws hada major impact on the labor force, as discussedat length in chapter 1 of this report. Indeed,one observer suggests “that quotas restrictingthe less-skilled immigrant labor were the singlemost important piece of labor legislation inthe twentieth century.”44
However, it was not just immigration thatchanged the workplace in the 20th century.Education played an important role in the ad-vancement of the individual worker, theworkforce, and the economy; and during the20th century, there was a steady increase ineducational attainment. In 1900, less than 14percent of all Americans graduated from highschool.45 By 1999, that figure had increasedto 83 percent.46 In 1910, the first year forwhich estimates are available, less than 3 per-cent of the population had graduated from aschool of higher learning.47 By 1999, the fig-ure was 25 percent.48 Furthermore, increasededucation resulted in substantial monetary pay-off for the individual worker. Men with col-lege degrees earned 62 percent more and women65 percent more in hourly compensation thandid those with a high school degree, at the endof the century [1997].49 A substantial part ofthe growth of the economy is attributable toincreased education.50
There is no question about the increasingrole of government during the 20th century.51
But what impact did government interventionhave on the workplace and on the workforce?This question is not easily answered. Evenwhen there was workplace legislation, one can-not ascribe changes in the workplace to
changes in the law. As one observer notes,“government intervention often reinforcedexisting trends, [such as in the case of] thedecline of child labor, the narrowing of thewage structure, and the decrease in the hoursof work.”52 In addition to workplace legisla-tion, there was legislation directed at largersocietal issues that had a dramatic impact onthe workplace.
A number of pieces of legislation dealt withthe workforce and workplace in the 20th cen-tury as discussed in chapters 1 and 2. In addi-tion, there was general societal legislation thathad an impact on the workforce and the work-place, although the focus of the legislation waselsewhere. Social insurance legislation, such asSocial Security and Medicare, had a profoundaffect on the workforce and workplace, byproviding many workers a retirement stipendand health insurance for the first time. Otherlegislation that had a profound impact on theworkforce includes the 1990 Americans withDisabilities Act, the post-World War II GI Bill,and the Civil Rights Act. Studies show that theCivil Rights Act of 1964, specifically TitleVII, had an important affect on hiring of blackworkers.53 Other actions that impacted theworkforce indirectly include the funding andbuilding of the interstate highway system, fund-ing of research and development, and enforc-ing patent and copyright laws.
Counting the changesMuch of what we know about the improve-ments in the workforce came from the ad-vancements that were made in counting theworkforce in the 20th century. Importantdevelopments came in methodology and datagathering. In addition, there was a major ex-pansion of the data collection effort. Here,we briefly touch on some of these improve-ments and the underlying forces that set thestage for these developments. Details are dis-cussed in the chapters of this report.
Statistics are often lacking on the Ameri-can workforce at the beginning of the 20thcentury, as noted numerous times in this re-port. On the whole, data cited in this paperfor the first part of the century are drawnfrom decennial census data or estimates byeconomic historians. Workforce data, for thefirst part of the century, are restricted largelyto special studies that addressed subjects likechild labor, immigrant labor, and pensions.Rudimentary statistics were produced on wages

7
and hours in manufacturing in 1904, but theseseries were discontinued in 1908 for more in-vestigative reporting, as discussed in chapter 2of this report.54
Wage and hours surveys were resumed in1913, but resources permitted only 10 indus-try studies every other year.55 These studiesfocused on industries, or industry groups, suchas cotton, wool and silk. For each study, datawere collected and published on hourly wagerates, full-time weekly earnings, fluctuationsin employment during the year, volume ofemployment, and productivity. In 1916, theBureau of Labor Statistics (BLS) began to pub-lish monthly employment series for five in-dustries.56 This was the start of the establish-ment series on employment and payrolls.
Gaps in labor force statistics became ap-parent, with the mobilization for World War I.Federal statistics were “woefully incompleteand inadequate” according to Bernard Baruch,Chairman of the War Industries Board.57 War-time needs led to a massive expansion of sta-tistical data. Prices and wages were of immedi-ate concern, since wage rates needed to be ad-justed to keep pace with inflation. In 1918,wage and hour surveys were expanded to 780occupations in 28 industries, covering 2,365establishments in 43 States.58 There was alsoincreased interest in information on strikesand lockouts. With the termination of thewar, statistical budgets were trimmed, and thewage and hour program was reduced to its pre-war level.
The next surge of interest in labor statis-tics came in the latter part of the 1920s. By1927, there was monthly reporting of em-ployment on 54 manufacturing industries cov-ering 11,000 establishments; and in 1928-29,agriculture, mining, construction and trade wereadded to the reporting. Several studies ad-dressed the issue of how to collect unemploy-ment statistics, a continuing and unresolvedissue at that time.59
The Great Depression provided the nextgreat push to improved labor force statistics.Modern-day employment statistics, unemploy-ment statistics, occupational statistics, and thelike grew out of the Great Depression. Thecreation of the Central Statistical Board, in1933, led to a number of new statistical initia-tives. One created the InterdepartmentalCommittee on Industrial Classification, in1937, that resulted in the creation of the Stan-dard Industrial Classification (SIC) system. As
discussed in chapter 3 of this report, this wasthe first time that the United States had pro-duced a comprehensive industry classificationsystem. Until that point, industry data collec-tion was pretty much ad hoc, responding toimmediate needs and what could be collected,given the time and available funding. Theresult was different data definitions and over-lapping data collection. The SIC underwentfour major revisions before being replaced in1997 by the North American Industry Classi-fication System (NAICS).
The Great Depression spawned a numberof new laws, such as the Fair Labor Standards,which required new statistics on the labor force.Collection of unemployment statistics re-mained an unresolved issue in the 1930s. Af-ter many studies—and false starts—a house-hold survey was undertaken; and national un-employment estimates were produced, for thefirst time, in 1940. In 1938, as discussed inchapter 3, the Central Statistical Board andthe American Statistical Association movedto develop an occupational classification sys-tem that reflected the similarity of work, edu-cation requirements, skill levels, and socio-economic class. This new classification wasused in the 1940 census and the developmentof the Occupational Outlook Program. Withthe outbreak of World War II, the statisticalfocus changed from recession and depressionto wartime needs.60
There was need for greatly expanded laborforce statistics in World War II, as in WorldWar I. United States statistical data collectionand analyses shifted to focus on defense indus-tries and the wartime economy. Wages andprices were controlled, and many items wererationed. At the beginning of the war, em-ployment and wage data were collected on 90industries; at the end of the war, data werecollected on 180 industries. New defense-re-lated industries sprung up overnight.61 Therewas need for detailed, recurring data on priceand wage changes. Occupational wage studieswere expanded and refocused on the occupa-tional skills needed by private industry to meetmilitary needs. In order to set and controlwages, wage reports were broken down by areaand occupational group. Thousands of inter-plant wage inequity cases had to be heard andresolved, which required additional labor forceinformation. The Cost of Living Index be-came a contentious political issue during theSecond World War, because it was used to ad-

8
just and set wages. Basic issues, includingchanges in the quality of products and substitu-tion affects, were the same ones that continueto torment developers of these indexes today.In 1945, the name of the index was changed tothe Consumer Price Index.62 The World WarII era also saw the expansion of productivitystudies and monthly reporting of industrial in-juries.
Statistical data collection and reports werecut back following the conclusion of WWII; infact, BLS staff was cut by 40 percent.63 Datacollection activities that remained were redi-rected from wartime to post-war problems.At about the same time, the Council of Eco-nomic Advisers and the Joint Economic Com-mittee were created. Almost immediately, thesetwo organizations focused attention on gapsin workforce data, leading to further changesin data collection and analysis. Worker budgetestimates were revised and calculated for largecities, benefit studies were undertaken, and in-dustry productivity studies were re-instituted.In 1948, General Motors and the United AutoWorkers agreed to use the CPI to establish awage-escalator clause, which gave new empha-sis to the CPI, at a time when there was seriousthought in cutting back funding of the index.64
Occupational studies initially focused on vet-erans’ re-entry into the labor force; later, studiesreverted to their prewar focus of providingdata for counseling young people in their choiceof careers.
With the advent of the Korean War, therewere demands to update much of the statisticalprogram, especially the price and wage statis-tics which were needed to set price and wageguidelines. A revised CPI was instituted; andcollective bargaining agreements were tracked,summarized, and published. The Wage Stabili-zation Board used the wage data to establishguidelines.65
The Vietnam War did not require the mas-sive development of new data, as had the ear-lier wars of the 20th century. But the so-called“War on Poverty” introduced a whole new setof statistical requirements for information onthe poor, unemployed, and minorities. The1963 Vocational Education Act required theStates to develop information on future occu-pations. This led to the development of occu-pational statistics by industry.66 Many of therevisions and improvements in data did nottake place until the 1970s, when new income
support and training laws prompted more de-tailed reporting. The President’s ConcentratedEmployment Program led to a series of studieson employment in poverty areas, and BLSintroduced a quarterly series that tracked thesituation in poverty areas in the United States.The Comprehensive Employment and Train-ing Act of 1973 required information on un-employment and poverty by detailed geo-graphic area.67 This was also a period wheninflation was a major economic and politicalissue, and the Cost of Living Council was es-tablished to provide guidelines on wage andprice escalation that put renewed emphasis onprice, wage and productivity statistics.68
The rest of the 20th century saw continu-ing improvement of workforce statistical data.These changes were evolutionary. While thedecennial census collected data on occupations,it was not until 1977 that the first StandardOccupation Classification manual was pub-lished. As discussed in chapter 3, the manualgrew out of the Bureau of the Budget’s Officeof Federal Statistical Policy and Standards ini-tiative to develop a single occupational classi-fication system that would be used by all majorU.S. statistical organizations. It was at thistime that occupational statistics were updatedthrough a series of industry studies, and anindustry-occupation matrix was developed forthe first time. These statistics were necessaryingredients to the preparation of the industryand occupational projections. But this wasnot all. There were revisions in the industryand occupational classifications, as discussedin chapter 3, and additional minority and de-mographic data collected, as discussed in chap-ter 1. Wage data has also undergone majorexpansion to capture total compensation, asdiscussed in chapter 2. In 1980, the Employ-ment Cost Index included benefits for the firsttime; and indexes were calculated and presentedby occupational group and major industry.69
What comes next?Chapter 1 is a discussion of the changing de-mographics of the workplace in the 20th cen-tury. This is followed, in chapter 2, by a dis-cussion of workplace compensation, how itevolved, and how it was measured in the 20thcentury. Finally, chapter 3 addresses, in somedepth, the development of industry and oc-cupational classification, how it developed inthe 20th century, and where we stand today.
9
Calomiris, Charles W. and Christopher Hanes,“Historical Macroeconomics and Ameri-can Macroeconomic History,” WorkingPaper W4935 (Cambridge, MA, NationalBureau of Economic Research, November1994).
Caplow, Theodore, Louis Hicks, and Ben J.Wattenberg, The First Measured Century:An Illustrated Guide to Trends in America,1900-2000 (Washington, AEI Press, 2000).
Census Bureau, Statistical Abstract of the UnitedStates: 2000 (Washington, U.S. Govern-ment Printing Office, 2000).
Crichton, Judy, America 1900 (New York,Henry Holt and Company, 1998).
De Long, J. Bradford, “Cornucopia: The Paceof Economic Growth in the Twentieth Cen-tury,” Working Paper W7602 (Cambridge,MA, National Bureau of Economic Re-search, March 2000).
De Long, J. Bradford, “The Shape of Twenti-eth Century Economic History,” WorkingPaper W7569 (Cambridge, MA, NationalBureau of Economic Research, February2000).
Edwards, Richard, Contested Terrain: TheTransformation of the Workplace in theTwentieth Century (New York, Basic Books,Inc., 1979).
Employer Costs for Employee Compensation,1986-99, Bulletin 2526 (Bureau of LaborStatistics, March 2000).
Employment and Earnings, January 2000.Federal Reserve Bank of Dallas, 1993 Annual
Report: These Are the Good Old Days (Dal-las, TX, Federal Reserve Bank, 1993).
Frumkin, Norman, Tracking America’sEconomy (Armonk, NY, M. S. Sharpe,1998).
Goldberg, Joseph P. and William T. Moye, TheFirst Hundred Years of the Bureau of La-bor Statistics (Washington, U.S. Govern-ment Printing Office, September 1995).
Goldin, Claudia, “Labor Markets in the Twen-tieth Century,” Working Paper H0058(Cambridge, MA, National Bureau of Eco-nomic Research, June 1994).
Landefeld, J. Steven, “GDP: One of the GreatInventions of the 20th Century,” Surveyof Current Business, January 2000, pp. 6-9.
McGuckin, Robert H., “Multiple ClassificationSystems for Economic Data: Can a Thou-sand Flowers Bloom: and Should They?”
Paper presented at the 1991 InternationalConference on the Classification of Eco-nomic Activity, U.S. Bureau of the Census,Williamsburg, VA, Nov. 6-8, 1991, pp. 1-4.
Monthly Labor Review, November 2000.Moore, Stephen and Julian Simon, It’s Getting
Better All the Time: 100 Greatest Trends ofthe Last 100 Years (Washington, CATOInstitute, 2000).
“Multifactor Productivity Trends, 1998,”USDL 00-267 (Bureau of Labor Statistics,Sept. 21, 2000).
National Bureau of Economic Research, “Out-put, Employment, and Productivity in theUnited States After 1800,” Studies in In-come and Wealth, Volume Thirty (New York,Columbia University Press, 1966).
North, Douglas C. and John Joseph Wallis,“Long-Term Factors in American Eco-nomic Growth,” Paper presented at NBERConference on Research in Income andWealth, Williamsburg, VA, Mar. 22-24,1984.
Triplett, Jack E., “Economic Concepts forEconomic Classifications,” Survey of Cur-rent Business, November 1993, pp. 45-49.
Triplett, Jack E., “The Theory of Industrialand Occupational Classifications and Re-lated Phenonmena,” Paper presented at the1990 Annual Research Conference, U.S.Bureau of the Census, Mar. 18-21, 1990.
U.S. Bureau of the Census, Historical Statisticsof the United States, Colonial Times to 1957(Washington, U.S. Government PrintingOffice, 1960).
U.S. Bureau of the Census, Historical Statisticsof the United States, Colonial Times to 1970(Washington U.S. Government PrintingOffice, 1975).
U.S. Bureau of the Census, Statistical Abstractof the United States, 1999 (Washington,U.S. Government Printing Office, 1999).
U.S. Council of Economic Advisors, EconomicReport of the President, 2000 (Washing-ton, U.S. Government Printing Office,2000).
U.S. Department of Labor, Report on theAmerican Workforce, 1999 (Washington,U.S. Government Printing Office, 1999).
U.S. Department of Labor, “Two HundredYears of Work in America,” Reprint fromEmployment and Training Report of thePresident (Washington, U.S. Government
References

10
Printing Office, 1976).U.S. Office of Management and Budget, “Eco-
nomic Classification Policy Committee:Initiative to Create a Product Classifica-tion System, Phase 1: Exploratory Effort
to Classify Service Products,” Federal Reg-ister, Apr. 16, 1999.
World Almanac, 1997 (Mahwah, NJ, WorldAlmanac Books, 1996).

11
Endnotes
1 See U.S. Bureau of the Census, HistoricalStatistics of the United States, Colonial Timesto 1970, Part 1, Series D 11-25, p. 127.
2 See Employment and Earnings, January2000, p. 10.
3 See U.S. Bureau of the Census, HistoricalStatistics of the United States, Colonial Timesto 1970, Part 1, Series D 152-66, p. 138.
4 See Census Bureau, Statistical Abstract ofthe United States: 2000, tables 656 and 682,pp. 410 and 426.
5 See U.S. Bureau of the Census, HistoricalStatistics of the United States, Colonial Timesto 1970, Part 1, Series D 11-25, p. 128. Dataare for persons aged 10 years and older report-ing a gainful occupation.
6 See Employment and Earnings, January2000, table A-3, p. 12.
7 See Caplow, Hicks, and Wattenberg, 2000,pp. 44-45.
8 See Census Bureau, Statistical Abstract ofthe United States: 2000, table 669, p. 416.
9 See U.S. Bureau of the Census, HistoricalStatistics of the United States, Colonial Timesto 1970, p. 134.
10 U.S. Bureau of the Census, Historical Sta-tistics of the United States, Colonial Times to1970, Part 1, Series D 26-35, p. 72.
11 See Employment and Earnings, January2000, tables A-3 and A-4, pp. 12-13.
12 See U.S. Bureau of the Census, HistoricalStatistics of the United States, Colonial Timesto 1970, Part 1, Series D 59-70, p. 9.
13 See U.S. Council of Economic Advisors,2000, pp. 279.
14 See Caplow, Hicks, and Wattenberg, 2000,pp. 160-61.
15 See Employer Costs for Employer Com-pensation, 1986-99, text table 1, p. 2.
16 See U.S. Bureau of the Census, HistoricalStatistics of the United States, Colonial Timesto 1970, Part 1, Series D 905-12, pp. 174-75.
17 See U.S. Bureau of the Census, HistoricalStatistics of the United States, Colonial Timesto 1970, Part 1, Series D 765-78, p. 168.
18 Bureau of Labor Statistics, on the Internetat http://stats.bls.gov/ceshome.htmhttp://stats.bls.gov/ceshome.htmhttp://stats.bls.gov/ceshome.htmhttp://stats.bls.gov/ceshome.htmhttp://stats.bls.gov/ceshome.htm (visitedNov. 28, 2000).
19 Ibid.20 Ibid. (visited Jan. 23, 2001), and Monthly
Labor Review, November 2000, table 13, p.66.
21 See U.S. Bureau of the Census, HistoricalStatistics of the United States, Colonial Timesto 1970, Part 1, Series M 271-86, p. 607.
22 “National Census of Fatal OccupationalInjuries, 1999,” USDL 00-236 (Bureau of La-bor Statistics, Aug. 17, 2000), table 3, p. 8.
23 See U.S. Bureau of the Census, HistoricalStatistics of the United States, Colonial Timesto 1970, Part 2, Series Q 398-409, p. 740.
24 “National Census of Fatal OccupationalInjuries, 1999,” USDL 00-236 (Bureau of La-bor Statistics, Aug. 17, 2000), table 1, p. 6.
25 See U.S. Department of Labor, “TwoHundred Years of Work in America,” 1976.
26 See U.S. Bureau of the Census, HistoricalStatistics of the United States, Colonial Timesto 1970, Part 1, Series D 85-86, p. 135.
27 See Monthly Labor Review, November2000, table 1, p. 56.
28 See Goldin, 1994, pp. 34-36.29 See Monthly Labor Review, November
2000, table 7, p. 61.30 Cycles are counted peak to peak. (See
Business Cycle Timeline.)31 See U.S. Bureau of the Census, Historical
Statistics of the United States, Colonial Timesto 1970, Part 1, Series D 85-86, p. 135;Caplow, Hicks, and Wattenberg, pp. 44-45;and Bureau of Labor Statistics, on the Internetat http://stats.bls.gov/ceshome.htmhttp://stats.bls.gov/ceshome.htmhttp://stats.bls.gov/ceshome.htmhttp://stats.bls.gov/ceshome.htmhttp://stats.bls.gov/ceshome.htm (visitedNov. 28, 2000).
32 See U.S. Council of Economic Advisors,p. 279.
33 See U.S. Council of Economic Advisors,p. 278.
34 Ibid., pp. 100-01 and 281.35 Ibid., table 3-2, p. 113.36 “Multifactor Productivity Trends, 1998,”
USDL 00-267 (Bureau of Labor Statistics, Sept.21, 2000), table 7, p. 22.
37 See U.S. Bureau of the Census, HistoricalStatistics of the United States, Colonial Timesto 1970, Part 1, Series B 107-15, p. 55.
38 See Census Bureau, Statistical Abstract ofthe United States: 2000, table 116, p. 84.
39 See U.S. Council of Economic Advisors,pp. 278 and 280.
40 See U.S. Bureau of the Census, Historical

12
Statistics of the United States, Colonial Timesto 1970, Part 1, Series A 1-5, p. 8; CensusBureau, “Resident Population Estimates of theUnited States by Age and Sex,” on the Internetat http://wwwhttp://wwwhttp://wwwhttp://wwwhttp://www.census.gov/population/esti-.census.gov/population/esti-.census.gov/population/esti-.census.gov/population/esti-.census.gov/population/esti-mates/nation/intfile2-1.txtmates/nation/intfile2-1.txtmates/nation/intfile2-1.txtmates/nation/intfile2-1.txtmates/nation/intfile2-1.txt (visited July 17,2001); and Census Bureau, “Resident Popula-tion of the 50 States, the District of Columbia,and Puerto Rico: Census 2000,” on the Internetat http://wwwhttp://wwwhttp://wwwhttp://wwwhttp://www.census.gov/population/esti-.census.gov/population/esti-.census.gov/population/esti-.census.gov/population/esti-.census.gov/population/esti-mates/nation/intfile2-1.txtmates/nation/intfile2-1.txtmates/nation/intfile2-1.txtmates/nation/intfile2-1.txtmates/nation/intfile2-1.txt (visited July 17,2001).
41 See U.S. Bureau of the Census, HistoricalStatistics of the United States, Colonial Timesto 1970, Part 1, Series C 88-119, p. 105.
42 Ibid., Part 1, Series C 120-37, p. 110.43 See Census Bureau, Statistical Abstract of
the United States: 2000, table 6, p. 9, and U.S.Immigration and Naturalization Service, Sta-tistical Yearbook of the Immigration and Natu-ralization Service, 1998 (Washington, U.S.Government Printing Office, 2000). Data isfor fiscal year ending September 30.
44 See Goldin, p. 53.45 See U.S. Council of Economic Advisors,
p. 278.
46 See Census Bureau, Statistical Abstract ofthe United States: 2000, table 249, p. 157.
47 Ibid., table 1426, p. 877.48 Ibid., table 249, p. 157.49 See U.S. Department of Labor, Report
on the American Workforce, 1999, p. 56.50 See Goldin, p. 50.51 Ibid., pp. 5-6.52 Ibid., p. 6.53 Ibid., p. 46.54 See Goldberg and Moye, 1985, pp. 37-38.55 Ibid., pp. 93-94.56 Ibid., p. 97.57 Ibid., p. 101.58 Ibid., p. 107.59 Ibid., pp. 128-31.60 Ibid., p. 167.61 Ibid., p. 165.62 Ibid., p. 158.63 Ibid., p. 178.64 Ibid., p. 179.65 Ibid., p. 202.66 Ibid., p. 240.67 Ibid., p. 241.68 Ibid., p. 249.69 Ibid., pp. 248-49.

13
Business Cycle Turning Points, 1899-1999
Peaks Troughs
June 1899December 1900
September 1902August 1904
May 1907June 1908
January 1910January 1912
January 1913December 1914
August 1918March 1919
January 1920July 1921
May 1923July 1924
October 1926November 1927
August 1929March 1933
May 1937June 1938
February 1945October 1945
November 1948October 1949
July 1953May 1954
August 1957April 1958
April 1960February 1961
December 1969November 1970
November 1973March 1975
January 1980July 1980
July 1981November 1982
July 1990March 1991
Business cycle timeline
The chronology of the more or less regular recurrence of periods of economic expan-sion and contractionthat make up the U.S. business cycle is maintained by the National Bureau of Economic Research
(NBER), a private, nonprofit, nonpartisan research institution. NBER identifies turning points, that is,dates when economic activity turns in the opposite direction. For example, the most recent turning pointwas March 1991. Sometime during that month, the economy stopped contracting and started expanding.Thus, March 1991 was a business cycle trough. Similarly, July 1990 was a peak. Sometime during thatmonth, the economy stopped expanding and started contracting.
A recession is a period of declining output and employment. A recession begins just after the economyreaches a peak and ends as the economy reaches its trough. Between trough and peak, the economy is inan expansion. Expansion has generally been the normal state of the economy; recessions have been briefand relatively rare in the latter part of the century.

15
Since the inception of the Republic, a widevariety of race and ethnic groups has com-
prised the American population. Some, likethe ancestors of today’s African Americans,came unwillingly, others fled starvation or re-ligious or political persecution, while still oth-ers came simply for the chance to better theirlives economically. As the population’s diver-sity has increased, so has the need for data onminority groups. Such data not only help de-scribe this diversity, but also assist in under-standing how well—or poorly—various minor-ity groups are faring and give decisionmakerssome information on which to base policy pro-posals.
The purpose of this chapter is to describethe evolution of the collection of data on mi-norities, focusing on the decennial census andthe Current Population Survey (CPS), theNation’s labor force survey. The chapter be-gins with a brief history of immigration to thiscountry. It then goes on to describe earlyefforts to collect data on minorities throughthe decennial census. Next, it describes changesthat were made to the CPS to help monitorthe status of minorities in the labor force. Asection summarizing the current labor forcesituation of minority workers, including sub-sections on immigrants, expenditures, and Bu-reau of Labor Statistics (BLS) projections ofminority participation in the labor force, fol-lows. The chapter concludes with a discussionof current efforts to meet demands for better
data on minorities, particularly persons of mul-
tiracial backgrounds.
A History of Immigration andMigration
CCCCColonial eraolonial eraolonial eraolonial eraolonial era..... Initially, Britain’s North Ameri-can colonies were peopled by immigrants fromthe British Isles. These immigrants included
not only those who came to the New Worldfor economic gain, but also religious minori-ties, political dissidents, minor criminals, andindentured servants. Soon, , , , , however, the colo-nial economies began to grow rapidly, increas-ing their demand for labor. “By the beginningof the eighteenth century government offi-cials had decided that it was in the interest ofEngland to improve and thicken her colonieswith people not her own.” 1 Two strategieswere followed in order to fill the gap. First,the slave trade was developed through royalcharters. Second, Protestants from other Eu-ropean countries were actively sought as set-tlers, with funds often provided for their trans-portation.
IndependenceIndependenceIndependenceIndependenceIndependence..... After the Revolutionary War,immigrants continued to pour into the newcountry. Although the new nation had beenable to end the British practice of transportingpolitical and criminal prisoners, it was unableto put an end to the slave trade, despite thefact that many found it objectionable. Conse-quently, even though immigrants from Europeflowed to the United States in large numbers, it
Chapter 1
Counting Minorities: A Brief History anda Look at the Future
In This Chapter—
A history of immigration and migration ............................... 15Counting minorities ...................... 17Publication of information on minority workers ......................... 21Current data on minority workers ......................................... 23Counting minorities: new directions ...................................... 28Conclusion ...................................... 29
Page
16
has been estimated that more Africans thanEuropeans came to the United States each yearuntil 1840, and that cumulative European im-migration did not surpass that of Africans un-til 1880. 2 This may seem shocking, consider-ing that President Thomas Jefferson signed abill in 1807 that made it illegal to import anyperson of color into the United States as aslave.3 However, little effort was made toenforce this law over the next 50 years. Ship-builders from Baltimore even continued con-structing slave ships, and underwriters still in-sured those ships.4
Early on, problems assimilating some ofthe immigrants began to arise. Among theEuropean immigrants were a sizable number ofGermans and Irish who were Roman Catholics.Anti-Catholic sentiment began to emerge andwas adopted by such groups as the NativeAmerican movement (not to be confused withAmerican Indians) in 1837, followed by theKnow-Nothing party around 1850. These werethe first major political movements endorsingthe limitation of immigration of certaingroups,5 thus marking the beginning of an ex-clusionary movement that eventually culmi-nated in the highly restrictive National Ori-gins Act of 1924.
The Great Irish Migration.The Great Irish Migration.The Great Irish Migration.The Great Irish Migration.The Great Irish Migration. During the 19thand early 20th centuries, Ireland, one ofEurope’s smallest countries, accounted for moreimmigrants than any other European nation.Indeed, for most of the second half of thenineteenth century, “the rate of Irish emigra-tion was more than double that of any otherEuropean country, with as many as 13 perthousand emigrating on average each year.”6
Altogether, about 4.5 million Irish immigratedto the United States between 1820 and 1930according to American statistics,7 and the Irishrepresented at least a third of the foreign-bornpopulation of the country between 1850 and1870. (See table 1-1.)
The failure of the Irish potato crop in1845-46 helped provide the impetus for thismass migration. The Irish economy was largelyagrarian, dependent upon the export of cattleand grain to England. Thus, most of the prod-uct of the Irish farmers was sold, leaving thepotato as the staple food of the farmer and hisfamily. Consequently, when the potato cropfailed, famine ensued. The effects of this fam-ine were profound; more than 1 million peopledied from starvation and disease.8 Millions of
Irish fled their homeland and, by 1891, thepopulation of Ireland (4.7 million) was only57 percent of what it had been 50 years earlier.9
Asian immigration and the origins of exclu-Asian immigration and the origins of exclu-Asian immigration and the origins of exclu-Asian immigration and the origins of exclu-Asian immigration and the origins of exclu-sionary legislationsionary legislationsionary legislationsionary legislationsionary legislation..... While the Irish were cross-ing the Atlantic, Chinese laborers were cross-ing the Pacific. By the beginning of the CivilWar, contract laborers from China had becomeabundant on the West Coast. However, theywere soon perceived as competing with do-mestic labor; they typically worked long hoursfor considerably less pay than their domesticcounterparts. In addition, their language andculture were very different from that of thepredominant European-based culture. For atime, Chinese contract labor was concentratedlargely on the west coast. But that changedfollowing the completion of the Nation’s firsttranscontinental railroad in May 1869. Thenext month, the Nation’s first convention todiscuss the importation of Chinese labor washeld in Memphis, Tennessee, organized andattended by businessmen from nine southernStates and California.10
A year later, 75 Chinese laborers arrived inNorth Adams, Massachusetts, to break a strike,working for pay less than half that of the strik-ing workers.11 Reacting to a perceived threat(Chinese labor was likened to slavery, and Chi-nese laborers were depicted as stealing foodfrom honest white workers12 ), politicians be-gan to introduce legislation aimed at limitingChinese immigration or banning it altogether.
In 1879, the U.S. Congress passed the firstimmigration restriction law aimed at a par-ticular nationality. The Fifteen Passenger Billlimited the number of Chinese passengers onany ship entering the United States to 15. Butbecause it would have violated the 1868Burlingame-Seward treaty between the UnitedStates and China, which recognized the rightsof Chinese to emigrate, the bill was vetoed.13
In 1880, however, America and Chinasigned a new agreement, called the AngellTreaty, that allowed the United States to limitChinese immigration. Two years later, Presi-dent Chester A. Arthur signed the ChineseExclusion Act. This act barred Chinese immi-grant laborers for 10 years. It was renewed in1892, again in 1902 and, in 1904, was renewedfor an indefinite length of time.14 The pas-sage of this act paved the way for further re-strictive legislation affecting not only Asians,but Europeans as well.
17
European immigration in the late 19th andEuropean immigration in the late 19th andEuropean immigration in the late 19th andEuropean immigration in the late 19th andEuropean immigration in the late 19th andearly 20th centuriesearly 20th centuriesearly 20th centuriesearly 20th centuriesearly 20th centuries..... There was a pronouncedshift in the country of origin of European im-migrants beginning in the late 19th century.Originally, European immigrants tended tocome from northwestern Europe. (See table1-1.) In the late 1800s, this trend graduallybegan to change and, by the early 1900s, themajority of European immigrants were fromsouthern and eastern Europe. These new im-migrants came from areas with cultural andlinguistic traditions considerably different fromthose of the earlier European immigrants.Thus, the United States found itself confrontedby problems in assimilating these new immi-grants.
President Theodore Roosevelt helped setup a factfinding commission to resolve theproblem.15 In 1911, the Immigration Com-mission published a report that “lamented theprogressive shift in the sources of immigra-tion away from northwestern and toward south-ern and eastern Europe, perceiving it as a de-cline in immigrant quality.”16 In 1917, a lit-eracy act was passed (this had been attemptedearlier, without success) to restrict Europeanimmigration and, in 1921, the United Statespassed the Emergency Quota Act, which ap-plied immigration quotas based on nationalityor origin. The provisions of this act wererenewed and made more restrictive by the Na-tional Origins Act of 1924. The quota systemwas reaffirmed in the Immigration and Na-tionality Act of 1952. With few exceptions,these quotas remained relatively intact untilPresident Johnson signed the Immigration andNationality Act of 1965, which finally did awaywith the system of national origin, race, orancestry quotas for immigration to the UnitedStates.17 More recently, the Immigration Re-form and Control Act of 1986 permitted someundocumented aliens to obtain lawful perma-nent residence, and the Immigration Act of1990 increased the annual cap on immigra-tion.18
The impact of these legislative changescan be seen in the statistics. In 1960, about 5percent of the foreign-born population wereAsian and 9 percent were from Latin America,while almost 75 percent were from Europe.By 2000, a little more than 25 percent of theforeign-born population came from Asia and51 percent came from Latin America, com-pared with 15 percent from Europe. (See table1-1.)
Blacks leave the South.Blacks leave the South.Blacks leave the South.Blacks leave the South.Blacks leave the South. Not all migrationshave come from abroad. There have also beenlarge shifts in population within our borders.One that has had far-reaching effects on theNation was the mass movement of blacks outof the rural South. Between 1910 and 1920,the black population of the North rose by al-most 700,000, and by 1930 nearly 1 millionblacks had left the South.19 Some areas inSouth Chicago went from being predominantlywhite to predominantly black in a very shortperiod.20 Poverty, racial segregation, and JimCrow laws in the South, coupled with a boomin war industries and a decline in immigrantlabor from abroad, combined to bring aboutthis population shift.
Not only did blacks move out of the South,they also moved to urban centers. In 1940,for instance, 48 percent of the black popula-tion was classified as urban. By 1960, thisnumber had risen to 80 percent.21 Data fromthe Current Population Survey indicate that86 percent of blacks lived in metropolitan ar-eas in 1999, with 55 percent in central cit-ies.22 This shift of the black population fromthe relative isolation of the rural South to ur-ban centers in the North and elsewhere turnednational attention to problems and tensionsthat had previously existed mainly in the South.
Counting Minorities
The decennial censusThe decennial censusThe decennial censusThe decennial censusThe decennial census..... The counting of mi-norities began virtually at the inception of theRepublic. A constitutional requirement estab-lished the United States as the first country toprovide for “a regular periodic enumeration ofits inhabitants.”23 In order to determine eachState’s share of direct taxes and congressionalrepresentation, a nationwide census of thepopulation on a regular basis was establishedby the United States Constitution:
Representatives and direct Taxes shallbe apportioned among the several Stateswhich may be included within thisUnion, according to their respectiveNumbers, which shall be determined byadding to the whole Number of freePersons, including those bound to Ser-vice for a Term of Years, and excludingIndians not taxed, three fifths of allother Persons. The actual Enumerationshall be made within three Years after
18
the first Meeting of the Congress ofthe United States, and within every sub-sequent Term of ten Years, in suchManner as they shall by Law direct.(Article 1, Section 2) 24
Since 1790, when the first decennial cen-sus was undertaken, there have been numerousapproaches to counting various racial and eth-nic groups. (See box on p. 19.) Many of thechanges in the census questions coincide roughlywith immigration milestones. For instance, in1850, after the substantial Irish immigrationgot under way, a question was asked about thecountry of birth. The census of 1870 specifi-cally counted Chinese just as concerns overChinese contract labor were arising.
In 1910, a question was added about thenative language of individuals (“mothertongue,” in the terminology of the day). Thiswas an attempt to identify more clearly theethnic groups coming to the United States fromeastern and southern Europe. Many of theseimmigrants were coming from the greatmultiethnic empires of Austria-Hungary, Rus-sia, and Germany, and it was felt that the ques-tion on country of origin was simply inad-equate, if not altogether misleading, as a meansof classifying these new émigrés by origin.25
Beginning in 1960, Hispanics were identifiedby the census, and in each following decade,the number and variety of groups that werecounted increased.
In most censuses, the enumerators deter-mined the race of respondents. Beginning withthe 1970 census, however, the respondentsthemselves identified their race and ethnicitycategory. (The 1970 census was also the firstto be conducted primarily by mail; prior cen-suses had relied on personal visits by enu-merators.)
At various times, the census has attemptedto identify people of what is now termed mul-tiracial ancestry. For instance, in 1850 a cat-egory designated “mulatto” was included. In1870, this was expanded to include the catego-ries of “quadroon” and “octoroon.” In 1930,however, the interviewer’s instructions did notprovide for any mixed-race categories. In-stead, people were categorized into a limitednumber of race and ethnic classifications. Es-sentially, the rule was that any combination ofwhite and any other racial ancestry was re-ported as the race of the parent who was notwhite.26 Seventy years later, in 2000, the cen-sus once again gave respondents the opportu-
nity to be identified as having multiracial an-cestry by allowing them to check more thanone race category.
In the mid-19th century, questions wereadded to several censuses to measure a nonraceand nonethnic minority—persons with cer-tain kinds of disabilities. These were the blind,the deaf, the mute, the mentally ill, and theretarded. No further attempt was made toidentify persons with disabilities until 1970,when a question was added regarding work dis-abilities. This question was further refined overthe decades until, in 2000, the census attemptedto identify persons with physical or mentalconditions, or both, that impacted their lives.
The Current Population SurveyThe Current Population SurveyThe Current Population SurveyThe Current Population SurveyThe Current Population Survey..... The CurrentPopulation Survey (CPS) is an ongoing monthlysample survey, conducted for the Bureau ofLabor Statistics (BLS) by the U.S. Census Bu-reau, that collects information on the employ-ment status of persons. BLS uses this infor-mation to produce monthly estimates of em-ployment and unemployment.27 The surveyis also the primary intercensal source for de-mographic and other socio-economic infor-mation on the population. Over time, it hasbecome an important source of data on manyof the Nation’s minority groups.
The origins of the CPS date back to thelate 1930s, when initial efforts were made tomeasure unemployment. Much of the devel-opmental work during this period was done bythe Works Progress Administration (WPA).By the early 1940s, the effort had been shiftedto the Census Bureau. During the war years,the Census Bureau redesigned the sample and,in 1945, revised the questionnaire.28
These early questionnaires collected demo-graphic data on household members similar tothat which is collected today. For instance, aCPS questionnaire from June 1946 asked aboutthe respondent’s sex, age at last birthday, and“color.” Under “color,” three entries were al-lowed: White, Negro, and other. In 1952, thiscategory was renamed “race,” although the sameinformation was still collected.
In April 1973, a category labeled “ethni-city” was added, and the interviewer was in-structed to indicate a numeric code that corre-sponded to the ethnic origin that the respon-dent identified from a flashcard. While “race”was a term used to indicate a division of thepopulation into groups distinguished by physi-cal characteristics, “ethnicity” was a concept

19
1790 Free whites; and slaves
1800 Free whites (except Indians not taxed); and slaves
1810 Free whites (except Indians not taxed); and slaves
1820 Free whites (except Indians not taxed); foreigners not naturalized; free coloredpersons; and slaves
1830 Free whites; slaves; and free colored
1840 Free whites; slaves; free colored; deaf, dumb, and insane whites; and deaf, dumb,and insane colored
1850 White; black; mulatto; country of birth; deaf, dumb, and insane whites; and deaf,dumb, and insane coloreds
1860 White; black; mulatto; country of birth; number of slaves; deaf, dumb, and insanewhites; and deaf, dumb, and insane coloreds
1870 White; black; mulatto; quadroon; octoroon;1 Chinese; Indian; country of birth;foreign-born parentage; and deaf, dumb, and insane
1880 White; black; mulatto; quadroon; octoroon; Chinese; Indian; country of birth;and country of birth of parents
1890 White; black; mulatto; quadroon; octoroon; Chinese; Japanese; Indian; countryof birth; and country of birth of parents
1900 White; black; mulatto; Chinese; Japanese; Indian; country of birth; country ofbirth of parents; and year of immigration
1910 White; black; mulatto; Chinese; Japanese; Indian; other; country of birth;country of birth of parents; native language; and English fluency
1920 White; black; mulatto; Chinese; Japanese; Indian; other; country of birth;country of birth of parents; native language; native language of parents; andEnglish fluency
1930 White; black; Chinese; Japanese; Indian; Mexican; country of birth; country ofbirth of parents; native language; and English fluency2
1940 White; black; mulatto; Chinese; Japanese; Indian; Filipino; Hindu; Korean; coun-try of birth; citizenship of the foreign-born; and country of birth of parents
Year Information collected (using terminology of the time)
Selected information on personal characteristics collected by decennial census by year
1 According to the 1870 census instructions, “the word ‘black’ should be used to describe those personswho have three-fourths or more black blood (sic); ‘mulatto,’ those persons who have from three-eighths to five-eighths black blood (sic); ‘quadroon,’ those persons who have one-fourth black blood (sic); and ‘octoroon,’those persons who have one-eighth or any trace of black blood (sic).”
2 The 1930 census had specific instructions for reporting race. “A person of mixed white and Negro blood wasto be returned as Negro, no matter how small the percentage of Negro blood; someone part Indian and part Negroalso was to be listed as Negro unless the Indian blood predominated and the person was generally accepted asan Indian in the community. A person of mixed white and Indian blood was to be returned as an Indian, exceptwhere the Indian blood is very small or where he or she was regarded as white in the community.”

20
1950 White; Negro; American Indian; Japanese; Chinese; Filipino; Hawai-ian; part Hawaiian; Aleut, Eskimo, and so forth; country of birth; and country ofbirth of parents
1960 White; Negro or Black; Indian (American); Japanese; Chinese; Filipino; Hawai-ian; Korean; other; country of birth; parents’ place of birth; and Hispanic origin
1970 White; Asian Indian; Black or Negro; Hawaiian; Japanese; Guamanian; Chinese;Samoan; Filipino; Eskimo; Korean; Aleut; Vietnamese; Indian (American); other;Spanish/Hispanic origin or descent (Mexican, Puerto Rican, Cuban, Central orSouth American, other Spanish, none of these); country of birth; language spok-en at home; ancestry; and work disability.
1980 White; Black or Negro; Indian (American); Eskimo; Aleut; Chinese;Japanese; Filipino; Asian Indian; Hawaiian; Samoan; Korean; Guamanian; Viet-namese; other race; Spanish/Hispanic origin (Mexican, Puerto Rican, Cuban,Central or South American, other Spanish, none of these); country of birth;ancestry or ethnic origin; language spoken at home; English fluency; and disabil-ity.
1990 White; Black or Negro; Indian (American); Eskimo; Aleut; Chinese; Japanese;Filipino; Asian Indian; Hawaiian; Samoan; Korean; Guamanian; Vietnamese; otherAsian and Pacific Islander; other race; Spanish/Hispanic origin; country of birth;ancestry or ethnic origin; language spoken at home; English fluency; and disabil-ity.
2000 White; Black or Negro; Indian (American); Eskimo; Aleut; Chinese;Japanese; Filipino; Asian Indian; Hawaiian; Samoan; Korean; Guamanian; Viet-namese; other Asian and Pacific Islander; other race; multiracial; Spanish/His-panic origin; country of birth; ancestry or ethnic origin; language spoken athome; English fluency; and disability.
Year Information collected (using terminology of the time)
Selected information on personal characteristics collected by decennial census by year
that divided the population into groups accord-ing to shared cultural, linguistic, or nationalorigin characteristics. Thus, “ethnicity” was aconcept that could cut across racial groups. InSeptember 1974, the label was changed from“ethnicity” to “origin.” The primary purposeof this question was to identify persons of His-panic origin.
In January 1979, in response to OMB Di-rective 15,29 the race category “other” wasdisaggregated into three groups: American In-dians, Asians, and Pacific Islanders.
Determining an individual’s race has al-ways been somewhat problematic. Accordingto the American Anthropological Associa-tion, “The concept of race is a social andcultural construction, with no basis in humanbiology—race can simply not be tested orproven scientifically.”30
Until the late 1970s (as was the case withthe decennial census until 1970), the inter-viewer determined race. Following are theinstructions concerning the determination andcoding of race issued in 1961:31
The codes used for race: “W” forwhite, “Neg.” for Negro, and “OT” forOther. Record Mexicans, PuertoRicans, and other persons of Latin-American descent as white, unless theyare definitely of Negro or other non-white race.
Enter “Neg.” for Negroes and forpersons of mixed white and Negro par-entage. A person of mixed AmericanIndian, and Negro blood should be en-tered as “Negro,” unless you [the in-terviewer] know that the Indian blood

21
very definitely predominated and thathe is regarded in the community as anIndian. Enter “OT” for races otherthan white or Negro, such as Japanese,Chinese, American Indian, Korean,Hindu, Eskimo, etc.
For persons of mixed parentage:1) Mixture of white and nonwhite
races, report race of nonwhite parent2) Mixture of nonwhite races, re-
port according to the race of the father.You can usually determine race by
observation, but should inquire in thecase of servants, hired hands, or otherpersons unrelated to the household head.
While these instructions provided a sys-tematic way of categorizing individuals by race,the classifications were rather arbitrary anddependent on the enumerator’s preconcep-tions. And in the case of mixed parentage,that is, white and nonwhite or any combina-tion of nonwhites, the classification directionswere inconsistent.
Beginning in October 1978, the interviewerwas no longer permitted to determine the raceof household members by observation. In-stead, the interviewer was required to ask thehousehold respondent the race of each house-hold member, presenting the respondent witha flashcard that listed racial categories. Thepurpose of this change was to provide moreaccurate estimates of characteristics by race.According to interviewer instructions:32
It is important that you ask the ques-tion in all cases even though therespondent’s race may seem obvious.Studies have indicated that there is asignificant difference in the recordingof racial categories between the proce-dures of asking race as opposed to mark-ing it by observation. What may seemobvious to the observer is in some casesnot what the respondent considers him-self/herself. Misrecorded cases poten-tially have a serious impact on the qual-ity of the final CPS data. Also, somehouseholds are comprised of persons ofdifferent races. The assumption thatall household or family members are ofthe same race as the respondent is notvalid.
Like the determination of race, the deter-mination of “origin” was left up to the re-
spondent. He or she was shown a flashcard andasked to pick the appropriate origin or de-scent. The origin question was asked in addi-tion to the race question. According to theinterviewer’s manual:33
Origin or descent refers to the na-tional or cultural group from which aperson is descended and is determinedby the nationality or lineage of aperson’s ancestors. There is no set ruleas to how many generations are to betaken into account in determining ori-gin. A respondent may report originbased on the origin of a parent, grand-parent, or some far-removed ancestor.
During the last CPS revision, which beganin 1986 and terminated when the current, re-designed survey system and questionnaire wereplaced in service in 1994, questions having todo with the demographic characteristics ofhousehold members were reviewed and revisedwhere appropriate. The questions on race andorigin, however, remained virtually unchanged.34
Publication of Information onMinority Workers
Late 19th and early 20th centuryLate 19th and early 20th centuryLate 19th and early 20th centuryLate 19th and early 20th centuryLate 19th and early 20th century..... During thisperiod, data collection methods were crude andlimited in scope by today’s standards. As aresult, studies frequently looked at conditionsin limited geographic areas, and the data usedwere often of an anecdotal nature.
In May 1897, the Department of Labor(the name at the time of the Federal agencythat would eventually evolve into today’s Bu-reau of Labor Statistics) published a bulletinentitled “Conditions of the Negro in VariousCities,” by George G. Bradford. The studyfocused on the very high mortality rates ofblacks, as well as the characteristics of blackfamilies.
In 1898, the Department of Labor pub-lished W. E. B. Du Bois’ first study on AfricanAmericans, “The Negroes of Farm-ville, Vir-ginia.” In 1899, the Department publishedanother of Du Bois’ works, “The Negro in theBlack Belt,” which was based on his students’experiences. (Du Bois was a professor of soci-ology at the University of Atlanta.)
In 1901, three more black studies, two byWilliam Taylor Thom, and the third by DuBois, were published, and another two wereissued the next year (1902). For the next
22
decade and a half, little was published in theway of minority studies, as what was to be-come the Bureau of Labor Statistics underwentseveral reorganizations. Finally, in 1918 (bywhich time the Bureau of Labor Statistics hadbecome part of a new Department of Labor),publication of studies on blacks resumed. (Seebox below.)
In the February 1918 edition of the Bureau’sMonthly Review, a study by Abraham Epstein,entitled “The Negro Migrant in Pittsburgh,”appeared. The migration of blacks from theSouth had begun to put a strain on the commu-nities in the North. This study focused on theincrease of blacks within the city of Pitts-burgh, with the goal of producing informationthat would prove useful to other northern cit-ies experiencing significant increases in blackpopulation.
In 1920, the Monthly Labor Review (thename of the Monthly Review was changed toMonthly Labor Review in July 1918) publishedan article examining the effect of black laborin the stove industry. The article argued infavor of the “cordial acceptance” of the blackworker within this industry, while describingthe black laborer’s difficulties. The article fur-ther described black people as a part of Ameri-can society, as legitimate as any other citizensof the country and having the same commonneeds. (It would appear that the editorial policyfor the Monthly Labor Review in the earlypart of the 20th century gave authors a greatdeal more latitude in expressing opinions or
making recommendations regarding socialpolicy than does today’s politically- and policy-neutral Review.)
Blacks were not the only minority groupfor which information was presented in theMonthly Labor Review. A regular feature inthe early years of the Review was the publica-tion of national immigration figures. Thesefigures were normally published every 2months, and this continued until 1920. Inter-estingly, in June of 1918, there was a focus onJapanese migration for the previous year. A1920 article looked at the situation in severalwestern States that had seen an increase in thenumber of Mexican laborers. The Depart-ment of Labor had issued orders temporarilyadmitting Mexicans to alleviate labor short-ages within agriculture. As a result, there was awidespread belief among domestic agriculturallaborers that they were losing jobs to low-wageMexican labor. The study found that “in the25 towns and cities visited…the number ofMexicans displacing white men was negligible”and that “a dire and imperative need was metin making the exceptions and permitting Mexi-can labor to enter this country on easy termsto meet the abnormal demand for commonlabor.”35 Because immigration from Europeand elsewhere had practically ceased, the Mexi-can workers were found to provide an effec-tive alternative to that lost labor source.....
The Current Population Survey era.The Current Population Survey era.The Current Population Survey era.The Current Population Survey era.The Current Population Survey era. As notedabove, the CPS is an extremely rich source of
Division of Negro Economics
World War I had brought a great many blacks to the cities, particularly in the North,to fill labor needs. In 1921, a Monthly Labor Review article examined a division of theDepartment of Labor that devoted itself to the results of this migration, and the situa-tions it created. The Division of Negro Economics was responsible for looking into theproblems that resulted when large groups of black workers sought jobs in northern defenseplants.1 The Division’s director was Dr. George E. Haynes and, under his direction, 11State committees and about 225 local county and city committees, with a membershipnumbering more than 1,000, were appointed. The work of these committees was topromote a national campaign “to create good feeling between the races, and to have bothwhite and Negro citizens understand and cooperate with the purpose and plans of thedepartment.”2 The division published an indepth report on the industrial experiences ofblacks during and after World War I that included an investigation into race troubles inChicago. This division contributed to normalizing race relations during the early 20thcentury. It was the first of its kind to attempt such work, and was the forerunner of laterFederal programs to promote black equality.
1 See U.S. Department of Labor, 2000.2 See “Industrial Relations,” 1921, p.140.

23
demographic information for a wide varietyof topics, including the labor force. It is notfeasible, therefore, to present an exhaustiveaccount of all published data from the CPSdealing with minorities here. This section willattempt merely to highlight some milestonesin the publication of labor force data for mi-norities.
Labor force data by race from the CPSwere first published in 1950 (the data were for1949).36 The estimates, which reported the“color” of workers, were expressed in percent-ages, not numbers, because the population con-trols needed to produce estimates of levels byrace had not yet been developed. In January1953, population controls based on the 1950decennial census were introduced into the CPSestimation process and, later in the year (Sep-tember), the process was further improved sothat estimates by race could be produced. In1955, employment levels for whites and non-whites were first published.37 (It should be notedthat such data are available back to 1954.38 )
At first, data on race were published onlyfor whites and a catchall group called non-whites. For years, the nonwhite group wasused to represent blacks because the overwhelm-ing majority of nonwhites in the United Stateswere blacks (92 percent in 1960 and 89 per-cent in 1970.) By 1980, however, blacks as aproportion of the total nonwhite group hadshrunk to 84 percent. Thus, the nonwhitecategory had only limited value in analyzingchanges in labor force activity either amongblacks or among the other race groups, includ-ing Asians, Pacific Islanders, and AmericanIndians. These other groups tended to havesignificantly different labor force characteris-tics than did blacks. Thus, in 1983 BLS beganto publish data for blacks only. Black-onlydata also were computed for many series goingback to 1972. For historical continuity, how-ever, the Bureau continued to publish somebasic series for the group now called “blackand other.”39
Interestingly, while the official change tothe publication of black-only data came in1983, there are examples of data for blacksbeing published almost a decade earlier. In theApril 1974 issue of the BLS publication Em-ployment and Earnings, Negro-only data werereferred to for the first time in the “Con-cepts” section of the Technical Note.40 Thesame publication contained a table with quar-terly data for blacks only and for Hispanics.41
However, data for the combined “black and
other” group continued to appear in the De-partment of Labor’s monthly EmploymentSituation press release until the issuance ofJanuary 1982 data. That was when 1980 cen-sus population controls were incorporated intothe CPS estimation procedures and data forblacks only and for Hispanics first appeared asa regular part of the monthly press release.42
Monthly data for blacks only did not appear inEmployment and Earnings for another year,until the January 1983 estimates were pub-lished.43 Monthly data for the “black andother” group also continued to be published inEmployment and Earnings for about anotherdecade.
Current Data on Minority Workers
Over time, the scope and variety of data pub-lished by BLS for black and Hispanic workershave increased enormously. This section pre-sents an overview of these data and some ofthe major findings. It is intended to illustratethe range of information available, rather thanbeing a comprehensive analysis of the statusof minorities.
Labor force participation ratesLabor force participation ratesLabor force participation ratesLabor force participation ratesLabor force participation rates..... In 2000, therewas little difference among labor force partici-pation rates for blacks (65.8 percent), His-panics (68.6), and whites (67.4 percent). How-ever, there were sizable differences amongthese groups when the rates by gender werecompared. (See table 1-2.)
Labor force participation rates for blackmen (69.0 percent) continued to be lower thanthose for Hispanic or white men (80.6 percentand 75.4 percent, respectively). This samepattern of differences (Hispanic and white menas more likely than black men to be in thelabor force) was true for every age group aswell. Among women, labor force participa-tion rates were higher for black women (63.2percent) than for their Hispanic (56.9 per-cent) or white (59.8 percent) counterparts.For each age category except teenagers, His-panic women’s participation rates were lowerthan those of the other two groups.
The overall participation rate for blackshas grown from 60.2 percent in 1973 to nearly66 percent in recent years.44 (See table 1-3.)This growth has been solely due to the in-creased participation of black women in thelabor force: for black women, participationrates rose by nearly 14 percentage points, to63.2 percent, from 1973 to 2000, while rates
24
for black men fell by 4.4 percentage points.The pattern of change was similar amongwhites but, among Hispanics, men’s participa-tion rates did not decline as much as those ofblack or white men.
UnemploymentUnemploymentUnemploymentUnemploymentUnemployment..... From 1992 to 2000, joblessrates have declined dramatically for the majorrace and ethnic groups, with the decline forblacks being greater than those for the othertwo groups. For blacks, the rate dropped 6.6percentage points, while that for Hispanicsfell by 5.9 points, and that for whites declinedby 3.1 points. (See table 1-4.) The decrease inunemployment among blacks may partly re-flect gains for both men and women in theproportions with schooling beyond high school:
Percent of the labor force 25 years and older withmore than a high school diploma
1992 2000Black:
Men .......................... 39.9 49.2Women ..................... 44.6 54.2
Hispanic:Men .......................... 29.4 30.9Women ..................... 34.7 38.0
White:Men .......................... 52.7 57.8Women ..................... 52.6 60.0
Yet, despite the impbrovements in the un-employment rates for blacks and Hispanics,blacks continue to be a little more than twiceas likely as whites to be unemployed, whileHispanics are not quite 2 times as likely aswhites to be unemployed.
Education and occupationEducation and occupationEducation and occupationEducation and occupationEducation and occupation..... Education is animportant predictor of labor market outcomes.The more educated the worker, the more likelyhe or she is to be in the labor force, and the lesslikely to be unemployed. Moreover, whenthose with more education are employed, theyare much more likely to work in a high-payingmanagerial or professional occupation.
Although whites continue to have moreeducation than do either blacks or Hispanics,black women and men have made remarkableeducational progress in recent years. As thetext table above shows, close to 40 percent ofblack men and 45 percent of black women inthe labor force had at least some educationbeyond the high school level in 1992. By2000, these proportions had grown to about49 percent and 54 percent, respectively.
Because education level is an importantfactor in the occupational self-selection ofworkers, it is not surprising that the occupa-tional distributions of blacks, Hispanics, andwhites vary greatly. For instance, table 1-5shows that white men are far more likely to bemanagers or professionals (29.2 percent) thanare black or Hispanic men (18.5 percent and11.4 percent, respectively). Among women,24.8 percent of blacks and 17.8 percent ofHispanics are managers or professionals, com-pared with 33.4 percent of whites.
EarningsEarningsEarningsEarningsEarnings..... Education and occupation, of course,impact earnings. Among full-time wage andsalary workers, the median weekly earnings ofblacks ($468) and Hispanics ($396) were muchlower than those of whites ($591). For bothblacks and Hispanics, the earnings gap is morepronounced among men than among women—the median for black men was 75.2 percent ofthat of white men and that of Hispanic menwas 61.9 percent of that of their white coun-terparts. Among women, blacks earned 85.8percent of what white women earned, whileHispanics earned 72.8 percent. (See table 1-6.)
Since 1986, the earnings gap between blackand white men has actually closed slightly.However, the gap between the earnings of theother minority groups (black women and His-panics) and those of their white counterpartshas grown.
Among workers paid hourly rates, therewas very little difference among whites, blacks,and Hispanics in the proportions who workedfor a wage at or below the prevailing Federalminimum wage ($5.15 per hour) in 2000. Onlyabout 3.2 percent of Hispanic hourly paidworkers earned the minimum or less, as did 3.6percent of blacks and 3.8 percent of whites.
Labor force projections, 1998-2008.Labor force projections, 1998-2008.Labor force projections, 1998-2008.Labor force projections, 1998-2008.Labor force projections, 1998-2008.45 Withthe exception of profound social and culturalchanges such as those that led to the surge ofwomen into the labor force in the 1970s andearly 1980s, population growth is the mainengine behind labor force growth. The civiliannoninstitutional population will continue toincrease over the 1998-2008 period, at roughlythe same rate as during the previous 10 years.Numbers of Asians (and others) and Hispanicsare projected to continue to grow much fasterthan those of whites or blacks. One of themajor factors underlying the growth in theHispanic and Asian populations in recent yearshas been the massive migration to the United

25
States that started in the 1970s and continuestoday. And, while immigration is expected todecrease slightly between 1998 and 2008, pro-jected net immigration will remain a sizableproportion of population growth over the1998-2008 projection period.
All of the race and ethnic groups in thelabor force are projected to continue to growbetween 1998 and 2008, but somewhat moreslowly than over the preceding 10 years. Ofthe four race and ethnic groups shown in table1-7, the “Asian and other” labor force is pro-jected to increase the most rapidly, followedby Hispanics, and then blacks. As a result, by2008 the Hispanic labor force is projected toovertake the black labor force in size. (TheAsian labor force is less than half the size ofeither the black or the Hispanic labor force.)For all three groups, much of the change inlabor force size is due to population growth,which, for Hispanics and Asians, will resultfrom continued immigration.
Despite gains in the numbers in the laborforce, relatively little change is anticipated inlabor force participation rates overall duringthe 1998-2008 period (barring, of course,major secular or cyclical changes, or both.)
Indeed, as table 1-8 shows, the labor force par-ticipation rates for Hispanics and Asians areprojected to remain virtually unchanged be-tween 1998 and 2008. In contrast, the par-ticipation rate for blacks is expected to growby 0.7 percentage point, and that for whites,by 0.6 percentage point.
ImmigrantsImmigrantsImmigrantsImmigrantsImmigrants..... Foreign-born46 workers make upnearly 13 percent of the U.S. workforce. (Seechart 1-1.) The labor force participation ratesof the foreign-born, overall, are generally lowerthan those of their native-born counterparts,largely because foreign-born women are lesslikely to be in the labor force than are native-born women. (See table 1-9.)
The labor force participation rates of theforeign-born also vary by race and ethnicity.Among non-Hispanic whites, the foreign-borngenerally have lower participation rates thandid natives, while, among non-Hispanic blacksand Hispanics, the foreign-born are more likelyto be in the labor force than are their nativecounterparts. The participation rates of non-Hispanic foreign-born Asians are about thesame as those of their native-born counter-parts.
Foreign-born(12.6 percent)
Native-born(87.4 percent)
Chart 1-1. Native-born and foreign-born shares of U.S. laborforce, 2000 annual averages

26
Foreign-born workers are about as likelyto be unemployed as are the native-born. (Seetable 1-10.) Among the major race and eth-nic groups, the unemployment rate amongforeign-born non-Hispanic whites is about thesame as that of their native-born counter-parts. The jobless rates among foreign-bornAsians (non-Hispanic), blacks (non-His-panic), and Hispanics are lower than, or aboutthe same as, the rates for their native-borncounterparts.
Given the poorer educational backgroundsof many immigrants, it is not surprising thatforeign-born workers were more likely thanthe native-born to be in occupations typifiedby low earnings. (See table 1-11.) In 2000,about 19 percent of the foreign-born wereemployed in service occupations, and thesame proportion worked as operators, fabri-cators, and laborers. The proportion of na-tive-born workers employed in each of thesetwo categories was 13 percent. In contrast,the foreign-born were substantially less likelyto be employed in high-paying occupations,such as managerial and professional specialtyoccupations, than were the native-born (23percent versus 31 percent, respectively). Not
surprisingly, therefore, the median weeklyearnings of foreign-born full-time wage andsalary workers were $447, or 76 percent ofthe $591 that native-born workers earnedweekly in 2000. The median earnings of for-eign-born women were about 81 percent thoseof their native-born counterparts, while themedian for foreign-born men was 71 percentof that of their native-born counterparts. (Seetable 1-12.)
How minorities spend their moneyHow minorities spend their moneyHow minorities spend their moneyHow minorities spend their moneyHow minorities spend their money..... Expendi-ture amounts are dependent on income and, toa degree, on household size (Hispanic consumerunits have, on average, more members than doblack ones). Consequently, differences in ex-penditure patterns across demographic groupsmay be clearer if the expenditures are expressedin percentages of the total, rather than dollaramounts. (See box above for a description ofthe expenditure data source, the ConsumerExpenditure Survey.)
Comparisons by race and Hispanic originComparisons by race and Hispanic originComparisons by race and Hispanic originComparisons by race and Hispanic originComparisons by race and Hispanic origin.....There are some similarities between black andnonblack consumer units. For example, eachhas about the same family size, on average.
The Consumer Expenditure Survey
The data shown in this section are derived from the results of the Consumer Expen-diture (CE) Surveys of 1994 (Hispanic comparison only) and 1999. The data collectedare the most detailed source of consumer expenditures by demographic characteristic(age, income, and so forth) compiled by the Federal Government. The survey consists oftwo components: A quarterly Interview and a biweekly Diary. Participants in the Inter-view survey are asked to recall expenditures on a variety of items for the 3 months priorto the interview. Participants in the Diary survey are given a diary in which to fill out alltheir expenditures for a specified week. This diary is retrieved and replaced by a fresh onefor the second consecutive (and final) week of participation. The samples for eachsurvey are independently selected, so that no family is chosen to participate in bothsurveys.
Characteristics of the consumer unit are based on those reported for the referenceperson. 1 These include race and ethnicity. For race, the reference person may bereported to be white; black; American Indian, Aleut, or Eskimo; Asian or Pacific Islander;or of an other race. As for ethnicity, the reference person may be described as a memberof one of several European ethnicities (English, Irish, French, German, and so on); asAfrican-American; as one of several Hispanic ethnicities; or as a member of an “other”ethnic group. Hispanic ethnicities for which data are collected are: Mexican; Mexican-American; Chicano; Puerto Rican; Cuban; Central or South American; and other Spanish.
1 The reference person is the first member mentioned by the respondent when asked to “start with the nameof the person or one of the persons who owns or rents the home.” It is with respect to this person that therelationship of other consumer unit members is determined.

27
(Black consumer units have more children, butfewer persons over age 65.) They also havecomparable numbers of earners. However, thereare many differences. For example, reportedincome before taxes47 is much lower for blackfamilies ($30,427) than for nonblack families($45,688). Also, fewer than one-half of blackconsumer units reside in an “owned dwelling,”compared with more than two-thirds of non-black ones. Blacks are about 3 years younger,on average, than are nonblacks; have fewervehicles, on average; and are less likely to haveattended college. Given these differences, it isnot surprising to see differences in expendi-ture patterns for these groups. (See tables 1-13and 1-14.)
Blacks allocate a larger share of total ex-penditures (10 percent) to food at home thando nonblacks (8 percent). It is likely that thisdifference reflects the fact that food needs forblack and nonblack consumer units are similar,but that the income for blacks is lower, onaverage. However, each group spends aboutthe same share (between 5 and 6 percent) onfood away from home.
Data for housing are more challenging toanalyze. As noted, black consumer units aremuch more likely to be renters than are non-black consumer units. Also, many renters haveutilities included in their rents. Therefore,com-paring actual expenditure levels for shel-ter components is not appropriate. To adjustfor this, expenditures for owned dwellings;rented dwellings; and utilities, fuels, and publicservices can be summed together into “basichousing.” When the summed expenditures areexamined, it is found that black consumersallocate a larger share to housing (29 percent)than do nonblack consumers (25 percent).
Blacks also spend larger shares on appareland services. However, shares for transporta-tion are nearly identical for consumers of allraces (19 percent). Black consumers allocatesmaller shares for healthcare and entertain-ment.
Another measure of the status of differentgroups in the economy is their overall pur-chasing power—that is, the percentage of to-tal expenditures in the entire economy ac-counted for by each of the different groups.These percentages are called “aggregate ex-penditure shares.”
As seen in table 1-14, blacks accounted for12 percent of all consumer units in 1999, butfor only 9 percent of total annual expendi-tures. This difference, of course, is due largely
to the fact that black income is lower, on av-erage, than nonblack income. Thus, the gapbetween the proportion of the population andthe proportion of total consumption becomesanother means of measuring the relative well-being of the different groups. It is particularlyinteresting to note that this measure can indi-cate relative well-being in certain specific ar-eas of consumption. For instance, black con-sumers account for 10 percent of total food-at-home expenditures and 7 percent of home-owner expenses. In contrast, they account for16 percent of renter expenses, largely due totheir disproportionate status as renters. Over-all though, they account for less than 10 per-cent of total shelter spending.48
Like blacks compared with nonblacks, His-panics report less income, on average, than donon-Hispanics. (See table 1-15.) Hispanicconsumer units allocate a larger share of totalexpenditures to food at home (11 percent)than do other units (8 percent), but this couldbe a function of family size as well as income.They allocate a slightly higher share to shelterand utilities (27 percent) than do non-Hispan-ics (25 percent), and the same is true for ap-parel and services (6.3 percent compared with4.6 percent) and transportation (21 percentcompared with 19 percent). However, theyallocate smaller shares to healthcare and en-tertainment.
Aggregate expenditure shares are impor-tant for Hispanics for two reasons. First, theyshow how Hispanics fare compared with non-Hispanics currently (1999). (See table 1-16.)In 1999, Hispanics accounted for 8.4 percentof all consumer units. However, they accountedfor only 7.5 percent of all consumer expendi-tures. They accounted for 10 percent of allfood-at-home expenditures, and 8 percent ofshelter expenditures. Like blacks, they ac-count for a smaller share (6 percent) of owneddwelling expenditures and a much larger shareof spending for rented dwellings (14 percent).They account for 10 percent of expendituresfor apparel and services, perhaps because oftheir larger family sizes and larger number ofchildren, but for only 4.8 percent of expendi-tures for healthcare and 5.5 percent of thosefor entertainment.
Second, Hispanics have been a growing seg-ment of the population, and their share oftotal expenditures has grown too. (See table1-17.) Accounting for fewer than 8 millionconsumer units in 1994, they numbered morethan 9 million consumer units in 1999, an
28
increase of about 18 percent. In the sameperiod, their share of aggregate expendituresrose from 6.3 percent to 7.5 percent.
Counting Minorities: New Directions
Early results of Census 2000 clearly show thatthe U.S. population is very diverse racially andethnically. (See box on p. 29.) Additionally,legislation such as the Americans with Dis-abilities Act (ADA) has brought other kinds ofminority groups to public attention. Conse-quently, the Federal Government is endeavor-ing to improve its ability to collect data thatwill reflect the diversity of the population moreaccurately.
In 1977, the U.S. Office of Managementand Budget (OMB) issued standards for the re-porting of statistical information on race andethnicity by Federal agencies. Commonly re-ferred to as “Directive No. 15,” these stan-dards provided the first consistent method forreporting race and ethnicity in the FederalGovernment. The standards required the col-lection of Hispanic data separately from raceand, at a minimum, the collection of data onfour racial categories—White; Black; Ameri-can Indian, Eskimo, or Aleut; and Asian orPacific Islander.
Beginning in the late 1980s, the standardscame under criticism from those who believedthat the minimum categories set forth in Di-rective No. 15 did not reflect the increasingdiversity of our Nation’s population that hasresulted primarily from growth in immigra-tion and in interracial marriages. In responseto these criticisms, OMB announced in July1993 that it would undertake a comprehen-sive review of the categories for data on raceand ethnicity.
This review, conducted over a 4-year pe-riod, was done in collaboration with the Inter-agency Committee for the Review of the Ra-cial and Ethnic Standards, which OMB estab-lished in March 1994 to facilitate the partici-pation of Federal agencies in the review. TheCommittee, through its Research WorkingGroup, carried out a research program to evalu-ate various proposals for revising the stan-dards. This extensive research effort, includ-ing three national tests, examined alternativeapproaches for questions to collect data onrace and ethnicity. The Committee recom-mended changes in the standards based on theresearch results, as well as on the consider-ation of related public comments and testi-
mony.OMB adopted many of the changes to the
standards recommended by the Committee inits new standards released on October 30, 1997,including the following:
1. A two-question format for the collec-tion of data on race and ethnicity should beused in all cases involving self-identification,and the ethnicity question should precede therace question.
2. Individuals should be allowed to selectmore than one of the racial categories to iden-tify their racial background.
3. The terms Eskimo and Aleut should bereplaced by the term “Alaska Native.”
4. Central and South American Indiansshould now be classified as American Indi-ans.
5. The name of the “Black” categoryshould be changed to “Black or African Ameri-can.”
In addition, OMB decided that the “Asianor Pacific Islander” category should be splitinto two categories—“Asian” and “NativeHawaiian or Other Pacific Islander.” OMBalso changed the term used to refer to His-panics from “Hispanic” to “Hispanic orLatino.”
In order to comply with the new standardsin the Current Population Survey (CPS), BLSand the Census Bureau conducted research todetermine the race and ethnicity questions thatmeet the requirements of the standards andprovide the most reliable and valid data. Thisresearch included a supplement to the CPS ad-ministered in July 2000. The race and ethnicityquestions selected for use in the supplementwere the following:
A. Are you Hispanic, Latino, or Spanish?(1) Yes(2) NoIf the respondent answered yes, then the
interviewer asks for the name of the countryof origin.
B. Please select one or more of the follow-ing categories to describe your race.
(1) White(2) Black, African American, or Negro(3) American Indian or Alaska Native(4) Asian(5) Native Hawaiian or Other Pacific
Islander

29
If the respondent indicates that his or herrace is “other” (a category not shown to therespondent), he or she was asked for more-specific information.
Once the results of this test are analyzedand the new questions finalized, a new meth-odology for determining race and ethnicitywill be implemented in the CPS in 2003.
With regard to the measurement of per-sons with disabilities, BLS, along with the De-partment of Labor’s Presidential Task Forceon the Employment of Adults with Disabili-ties, is leading a multi-agency effort to designa short set of questions for use in a householdsurvey (the CPS) that would identify personswith disabilities. This effort was mandated in1998 by Executive Order 13078, which di-rected BLS to develop a statistically reliablemethod of determining the employment rateof adults with disabilities.
Work on the project began in 1999 with acareful examination of all the major disabilitysurvey instruments. The exhaustive review ofthese instruments revealed serious problemswith the question sets that were used. Conse-quently, BLS had to conduct further researchand testing of individual disability questionsfound in various surveys to try to construct aminimum set of questions needed to identifypeople with disabilities.
The set of questions identified in this phasewas then placed in a major, nationwide survey(the National Comorbidity Survey—or NCS)for testing in a live household survey environ-ment. Because the NCS focuses on disabilityissues, particularly mental illness, a rigorouscomparison of the results from the test ques-tions with those from the regular NCS ques-tions will reveal how well (or poorly) the testquestions identify persons with disabilities, andhow the questions might be improved.
Conclusion
The race and ethnic mix of the Nation’s popu-lation has diversified considerably since colo-nial times, as shown in table 1-18. The waysin which minorities have been counted, firstin the decennial censuses and then in the CPS,have evolved over time, reflecting, in part, aneed for data to describe this growing diver-sity. The waves of immigrants from differ-ent parts of the world obviously have spurredthe development of questions in the censusasking about country of origin. The migra-tion of blacks from the South focused na-tional attention on the problems of blacksand created a demand for more data.
It took time, of course, for this demandto be met. Statistical theory, survey meth-
Census 2000
The 2000 Decennial Census contained questions on race and ethnicity similar to theones being proposed for inclusion in the CPS. Respondents were thus able to reportaccording to the revised race and ethnic guidelines from OMB. The results were releasedin early 2001. The population’s race and ethnic profile at the time of the census (April2000) is shown below:
PercentTotal .................................................................. 100.0
One race ......................................................... 97.6White ....................................................... 75.1Black ........................................................ 12.3American Indian or Alaskan Native .... .9Asian ........................................................ 3.6Native Hawaiian or Pacific Islander ..... .1Other ........................................................ 5.5
Two or more races ........................................ 2.4
Hispanic origin1 ............................................. 12.5
1 Hispanics can be of any race.SOURCE: “Overview of Race and Hispanic Origin,” Census 2000 Brief (Census Bureau, March
2001).

30
odologies, and automated data processing tech-nologies needed to be developed and refined.
The classification methodology for race haschanged. At first, it was assumed that censusenumerators and CPS interviewers could distin-guish racial groups simply by observation andcommunity standards. As researchers began torealize that race was much more complex thana set of physical attributes, interviewers wereinstructed to ask respondents about their race.The situation has now evolved to the pointthat respondents can choose to identify them-selves with more than one racial group, thuscreating a new category—multiracial.
What does the future hold? Probably moreof the same. Barring a return to the exclusion-
ary immigration policies of the 1920s, theUnited States likely will continue to be a na-tion in which increasing racial and ethnic di-versity is the rule, not the exception. As inthe past, people of diverse backgrounds willcontinue to contribute to a common culture,while maintaining many elements of their owncultural identities that help link them to theirorigins. As researchers, policymakers, and thepublic try to understand this process and dealwith some of the problems that will inevitablyarise (if past history is any indication), therewill be continuing demands to develop and re-fine statistical measures that better illuminatethe changing race and ethnic characteristics ofAmerica’s population.

31
Tabl
e 1-
1.
Geo
gra
ph
ic a
rea
of b
irth
of t
he
fore
ign
-bo
rn p
op
ula
tion
in th
e U
nite
d S
tate
s, 1
850
to 2
000
1850
1860
1870
1880
1890
1900
1910
1920
1930
1960
119
701
1980
119
901
2000
2
Tota
l for
eign
bor
n(in
thou
sand
s)...
......
......
......
......
......
......
....
2,24
4.6
4,13
8.7
5,56
7.2
6,67
9.9
9,24
9.5
10,3
41.3
13,5
15.9
13,9
20.7
14,2
04.1
9,73
8.1
9,61
9.3
14,0
79.9
19,7
67.3
28,3
79.0
P
erce
nt
dis
trib
uti
on
Tota
l....
......
......
......
......
......
......
......
......
......
.10
0.0
100.
010
0.0
100.
010
0.0
100.
010
0.0
100.
010
0.0
100.
010
0.0
100.
010
0.0
100.
0
Eur
ope
......
......
......
......
......
......
......
......
.90
.592
.088
.886
.186
.885
.987
.485
.683
.074
.559
.736
.622
.015
.3
....
Nor
ther
n an
d W
este
rn...
......
......
....
90.1
91.2
87.0
82.3
78.8
69.7
54.1
44.8
41.2
34.2
27.3
16.9
10.4
–
......
......
Irel
and
......
......
......
......
......
.....
42.8
38.9
33.3
27.8
20.2
15.6
10.0
7.5
5.2
3.5
2.6
1.4
.9–
....
Sou
ther
n an
d E
aste
rn...
......
......
....
.4.8
1.7
3.7
7.9
16.2
33.3
40.7
41.7
40.1
32.1
19.5
11.6
–
Asi
a...
......
......
......
......
......
......
......
......
...1
.91.
21.
61.
21.
21.
41.
71.
95.
08.
618
.025
.225
.5
....
Chi
na...
......
......
......
......
......
......
......
(3 ).9
1.1
1.6
1.2
.8.4
.3.3
1.0
1.8
2.0
2.7
–
Latin
Am
eric
a...
......
......
......
......
......
.....
.9.9
1.0
1.3
1.2
1.3
2.1
4.2
5.6
9.3
18.8
31.1
42.5
51.0
....
Mex
ico
......
......
......
......
......
......
......
..6
.7.8
1.0
.81.
01.
63.
54.
55.
97.
915
.621
.7–
Oth
er...
......
......
......
......
......
......
......
......
......
8.5
6.2
9.0
10.9
10.8
11.6
9.1
8.5
9.5
11.1
13.0
14.3
10.3
8.1
1
Indi
cate
s sa
mpl
e da
ta.
2 A
nnua
l ave
rage
dat
a fr
om th
e C
urre
nt P
opul
atio
n S
urve
y.3
Indi
cate
s le
ss t
han
0.05
per
cent
.
NO
TE
: D
ash
indi
cate
s da
ta n
ot a
vaila
ble.
SO
UR
CE
: U.S
. Cen
sus
Bur
eau.
Year
Geo
grap
hic
Are
a

32
Tabl
e 1-
2. L
abo
r fo
rce
stat
us
of t
he
po
pu
latio
n b
y ag
e, s
ex, r
ace,
an
d H
isp
anic
ori
gin
, an
nual
ave
rag
es, 2
000
(Num
bers
in th
ousa
nds)
TO
TAL
Tota
l, 16
yea
rs a
nd o
lder
......
......
......
.
2
5,21
816
,603
65.8
22,3
93
1
5,36
868
.6 1
74,4
28
117
,574
67.4
1
6 to
19
year
s...
......
......
......
......
....
2,46
896
739
.2
2,34
1
1,0
8346
.3
12,
707
7
,075
55.7
2
0 to
24
year
s...
......
......
......
......
....
2,69
01,
932
71.8
2,
775
2
,155
77.7
6,3
12
2,8
0044
.4
25
to 5
4 ye
ars
......
......
......
......
......
.
14,9
3112
,155
81.4
13,6
67
1
0,92
880
.0
97,
730
82,
796
84.7
5
5 to
64
year
s...
......
......
......
......
....
2,35
11,
227
52.2
1,
819
983
54.1
2
0,32
4
1
2,19
260
.0
65
year
s an
d ol
der
......
......
......
......
.
2,
778
322
11.6
1,
791
218
12.2
2
8,94
7
3,7
4913
.0
M
en
Tota
l, 16
yea
rs a
nd o
lder
......
......
......
.
11,3
20
7,
816
69.0
11,0
64
8,9
1980
.6
84,
647
63,
861
75.4
1
6 to
19
year
s...
......
......
......
......
....
1,21
3
473
39.0
1,
205
613
50.9
6,4
96
3,6
7956
.6
20
to 2
4 ye
ars
......
......
......
......
......
.
1,
235
9
0673
.4
1,45
7
1,2
9989
.2
7
,420
6
,308
85.0
2
5 to
54
year
s...
......
......
......
......
....
6,75
3
5,
699
84.4
6,
817
6
,295
92.3
4
8,52
9
4
4,98
492
.7
55
to 6
4 ye
ars
......
......
......
......
......
.
1,0
15
580
57.1
826
573
69.4
9,8
11
6,6
9268
.2
65
year
s an
d ol
der
......
......
......
......
.1,
105
1
5714
.2
7
59
1
3818
.2
12,
390
2
,198
17.7
W
om
en
Tota
l, 16
yea
rs a
nd o
lder
......
......
......
.
13,8
98
8,
787
63.2
11,3
29
6,4
4956
.9
89,
781
53,
714
59.8
1
6 to
19
year
s...
......
......
......
......
....
1,25
5
494
39.4
1,
136
470
41.4
6,2
11
3,3
9654
.7
20
to 2
4 ye
ars
......
......
......
......
......
.
1,
455
1,02
670
.5
1,31
9
8
5664
.9
7
,300
5
,455
74.7
2
5 to
54
year
s...
......
......
......
......
....
8,17
8
6,
455
78.9
6,
849
4
,633
67.7
4
9,20
0
3
7,81
376
.9
55
to 6
4 ye
ars
......
......
......
......
......
.
1,
336
6
4748
.4
9
93
4
1041
.3
10,
513
5
,500
52.3
6
5 ye
ars
and
olde
r...
......
......
......
....
1,67
3
165
9.9
1,
032
8
07.
7
16,
557
1
,550
9.4
SO
UR
CE
: B
urea
u of
Lab
or S
tatis
tics,
Cur
rent
Pop
ulat
ion
Sur
vey.
Whi
teH
ispa
nic
orig
inB
lack
Labo
r fo
rce
asa
perc
ent
ofpo
pula
tion
Labo
r fo
rce
Pop
ulat
ion
Age
and
sex
Labo
r fo
rce
Labo
r fo
rce
asa
perc
ent
ofpo
pula
tion
Pop
ulat
ion
Labo
r fo
rce
asa
perc
ent
ofpo
pula
tion
Labo
r fo
rce
Pop
ulat
ion

33
Table 1-3. Labor force participation rates by sex, race, and Hispanic origin, annual averages, 1973-2000
Total Men Women Total Men Women Total Men Women
1973 ................ 60.2 73.4 49.3 60.2 81.5 41.0 60.8 79.4 44.11974 ................ 59.8 72.9 49.0 61.1 81.7 42.4 61.4 79.4 45.21975 ................ 58.8 70.9 48.8 60.8 80.7 43.2 61.5 78.7 45.91976 ................ 59.0 70.0 49.8 60.8 79.6 44.3 61.8 78.4 46.91977 ................ 59.8 70.6 50.8 61.6 80.9 44.3 62.5 78.5 48.01978 ................ 61.5 71.5 53.1 62.9 81.1 46.6 63.3 78.6 49.41979 ................ 61.4 71.3 53.1 63.6 81.3 47.4 63.9 78.6 50.51980 ................ 61.0 70.3 53.1 64.0 81.4 47.4 64.1 78.2 51.2
1981 ................ 60.8 70.0 53.5 64.1 80.6 48.3 64.3 77.9 51.91982 ................ 61.0 70.1 53.7 63.6 79.7 48.1 64.3 77.4 52.41983 ................ 61.5 70.6 54.2 63.8 80.3 47.7 64.3 77.1 52.71984 ................ 62.2 70.8 55.2 64.9 80.6 49.7 64.6 77.1 53.31985 ................ 62.9 70.8 56.5 64.6 80.4 49.3 65.0 77.0 54.11986 ................ 63.3 71.2 56.9 65.4 81.0 50.1 65.5 76.9 55.01987 ................ 63.8 71.1 58.0 66.4 81.0 52.0 65.8 76.8 55.71988 ................ 63.8 71.0 58.0 67.4 81.9 53.2 66.2 76.9 56.41989 ................ 64.2 71.0 58.7 67.6 82.0 53.5 66.7 77.1 57.21990 ................ 64.0 71.0 58.3 67.4 81.4 53.1 66.9 77.1 57.4
1991 ................ 63.3 70.4 57.5 66.5 80.3 52.3 66.6 76.5 57.41992 ................ 63.9 70.7 58.5 66.8 80.7 52.8 66.8 76.5 57.71993 ................ 63.2 69.6 57.9 66.2 80.2 52.1 66.8 76.2 58.01994 ................ 63.4 69.1 58.7 66.1 79.2 52.9 67.1 75.9 58.91995 ................ 63.7 69.0 59.5 65.8 79.1 52.6 67.1 75.7 59.01996 ................ 64.1 68.7 60.4 66.5 79.6 53.4 67.2 75.8 59.11997 ................ 64.7 68.3 61.7 67.9 80.1 55.1 67.5 75.9 59.51998 ................ 65.6 69.0 62.8 67.9 79.8 55.6 67.3 75.6 59.41999 ................ 65.8 68.7 63.5 67.7 79.8 55.9 67.3 75.6 59.62000 ................ 65.8 69.0 63.2 68.6 80.6 56.9 67.4 75.4 59.8
SOURCE: Bureau of Labor Statistics, Current Population Survey.
Black Hispanic origin WhiteYear
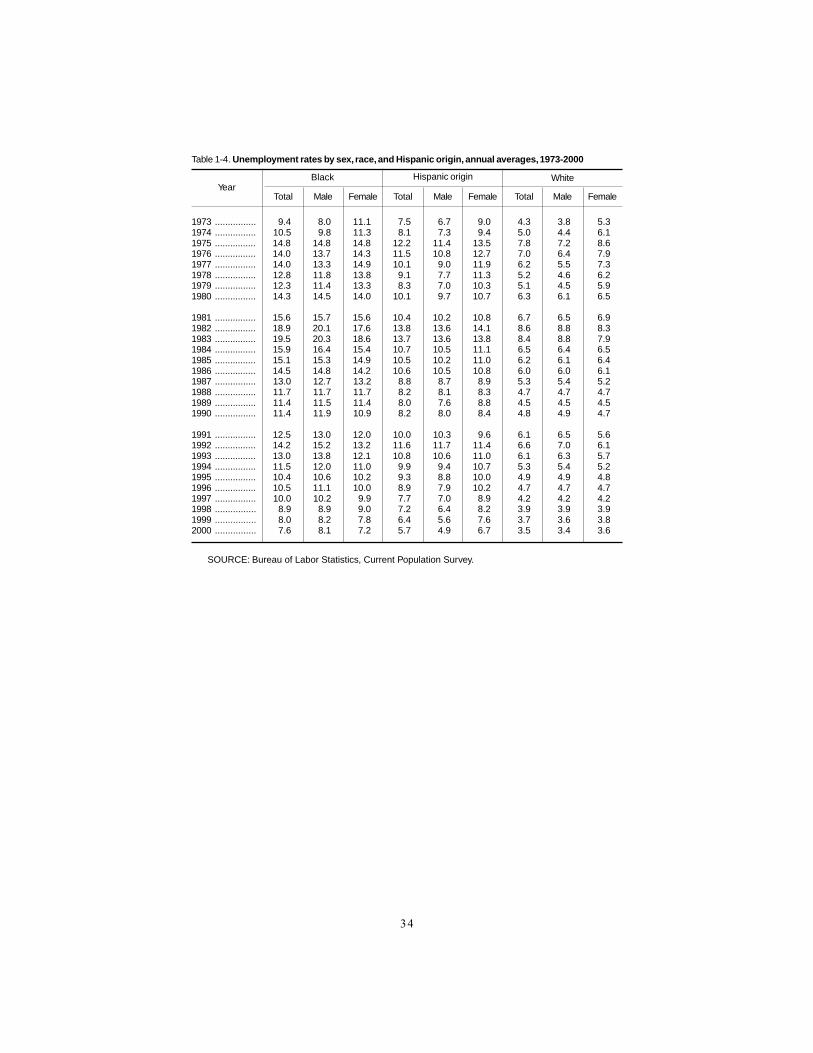
34
Table 1-4. Unemployment rates by sex, race, and Hispanic origin, annual averages, 1973-2000
Total Male Female Total Male Female Total Male Female
1973 ................ 9.4 8.0 11.1 7.5 6.7 9.0 4.3 3.8 5.31974 ................ 10.5 9.8 11.3 8.1 7.3 9.4 5.0 4.4 6.11975 ................ 14.8 14.8 14.8 12.2 11.4 13.5 7.8 7.2 8.61976 ................ 14.0 13.7 14.3 11.5 10.8 12.7 7.0 6.4 7.91977 ................ 14.0 13.3 14.9 10.1 9.0 11.9 6.2 5.5 7.31978 ................ 12.8 11.8 13.8 9.1 7.7 11.3 5.2 4.6 6.21979 ................ 12.3 11.4 13.3 8.3 7.0 10.3 5.1 4.5 5.91980 ................ 14.3 14.5 14.0 10.1 9.7 10.7 6.3 6.1 6.5
1981 ................ 15.6 15.7 15.6 10.4 10.2 10.8 6.7 6.5 6.91982 ................ 18.9 20.1 17.6 13.8 13.6 14.1 8.6 8.8 8.31983 ................ 19.5 20.3 18.6 13.7 13.6 13.8 8.4 8.8 7.91984 ................ 15.9 16.4 15.4 10.7 10.5 11.1 6.5 6.4 6.51985 ................ 15.1 15.3 14.9 10.5 10.2 11.0 6.2 6.1 6.41986 ................ 14.5 14.8 14.2 10.6 10.5 10.8 6.0 6.0 6.11987 ................ 13.0 12.7 13.2 8.8 8.7 8.9 5.3 5.4 5.21988 ................ 11.7 11.7 11.7 8.2 8.1 8.3 4.7 4.7 4.71989 ................ 11.4 11.5 11.4 8.0 7.6 8.8 4.5 4.5 4.51990 ................ 11.4 11.9 10.9 8.2 8.0 8.4 4.8 4.9 4.7
1991 ................ 12.5 13.0 12.0 10.0 10.3 9.6 6.1 6.5 5.61992 ................ 14.2 15.2 13.2 11.6 11.7 11.4 6.6 7.0 6.11993 ................ 13.0 13.8 12.1 10.8 10.6 11.0 6.1 6.3 5.71994 ................ 11.5 12.0 11.0 9.9 9.4 10.7 5.3 5.4 5.21995 ................ 10.4 10.6 10.2 9.3 8.8 10.0 4.9 4.9 4.81996 ................ 10.5 11.1 10.0 8.9 7.9 10.2 4.7 4.7 4.71997 ................ 10.0 10.2 9.9 7.7 7.0 8.9 4.2 4.2 4.21998 ................ 8.9 8.9 9.0 7.2 6.4 8.2 3.9 3.9 3.91999 ................ 8.0 8.2 7.8 6.4 5.6 7.6 3.7 3.6 3.82000 ................ 7.6 8.1 7.2 5.7 4.9 6.7 3.5 3.4 3.6
SOURCE: Bureau of Labor Statistics, Current Population Survey.
Black Hispanic origin WhiteYear
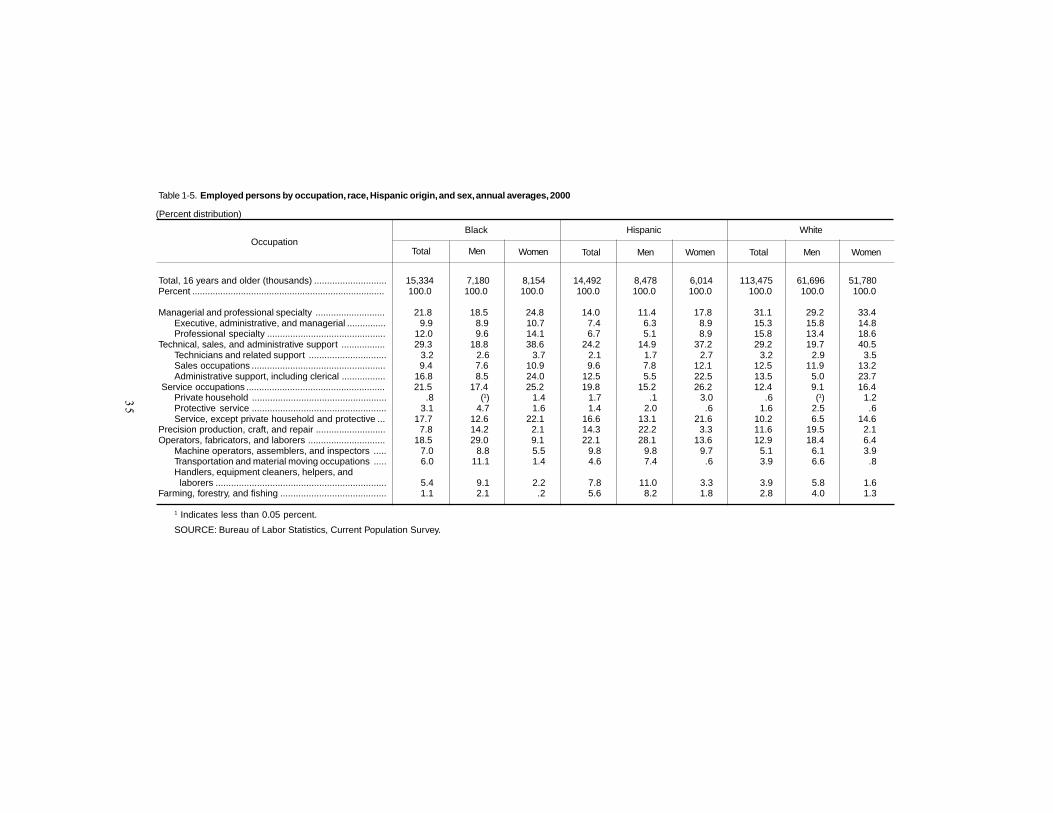
35
Table 1-5. Employed persons by occupation, race, Hispanic origin, and sex, annual averages, 2000
Total, 16 years and older (thousands) ............................ 15,334 7,180 8,154 14,492 8,478 6,014 113,475 61,696 51,780Percent ........................................................................... 100.0 100.0 100.0 100.0 100.0 100.0 100.0 100.0 100.0
Managerial and professional specialty ........................... 21.8 18.5 24.8 14.0 11.4 17.8 31.1 29.2 33.4Executive, administrative, and managerial ............... 9.9 8.9 10.7 7.4 6.3 8.9 15.3 15.8 14.8Professional specialty .............................................. 12.0 9.6 14.1 6.7 5.1 8.9 15.8 13.4 18.6
Technical, sales, and administrative support ................. 29.3 18.8 38.6 24.2 14.9 37.2 29.2 19.7 40.5Technicians and related support .............................. 3.2 2.6 3.7 2.1 1.7 2.7 3.2 2.9 3.5Sales occupations .................................................... 9.4 7.6 10.9 9.6 7.8 12.1 12.5 11.9 13.2Administrative support, including clerical ................. 16.8 8.5 24.0 12.5 5.5 22.5 13.5 5.0 23.7
Service occupations ...................................................... 21.5 17.4 25.2 19.8 15.2 26.2 12.4 9.1 16.4Private household .................................................... .8 (1) 1.4 1.7 .1 3.0 .6 (1) 1.2Protective service .................................................... 3.1 4.7 1.6 1.4 2.0 .6 1.6 2.5 .6Service, except private household and protective ... 17.7 12.6 22.1 16.6 13.1 21.6 10.2 6.5 14.6
Precision production, craft, and repair ........................... 7.8 14.2 2.1 14.3 22.2 3.3 11.6 19.5 2.1Operators, fabricators, and laborers .............................. 18.5 29.0 9.1 22.1 28.1 13.6 12.9 18.4 6.4
Machine operators, assemblers, and inspectors ..... 7.0 8.8 5.5 9.8 9.8 9.7 5.1 6.1 3.9Transportation and material moving occupations ..... 6.0 11.1 1.4 4.6 7.4 .6 3.9 6.6 .8Handlers, equipment cleaners, helpers, and laborers .................................................................. 5.4 9.1 2.2 7.8 11.0 3.3 3.9 5.8 1.6
Farming, forestry, and fishing ......................................... 1.1 2.1 .2 5.6 8.2 1.8 2.8 4.0 1.3
1 Indicates less than 0.05 percent.
SOURCE: Bureau of Labor Statistics, Current Population Survey.
Black Hispanic WhiteOccupation
(Percent distribution)
Total Men Women Total TotalMen Women WomenMen

36
Table 1-6. Median usual weekly earnings1 of full-time2 wage and salary workers,3 by sex, race, and Hispanic origin, annual averages, 1986-2000
1986 1987 1988 1989 1990 1991 1992 1993 1994 1995 1996 1997 1998 1999 2000
Black
Both sexes ............................... $291 $301 $314 $319 $329 $348 $357 $369 $371 $383 $387 $400 $426 $445 $468Men .................................... 318 326 347 348 361 375 380 392 400 411 412 432 468 488 503Women ............................... 263 275 288 301 308 323 335 348 346 355 362 375 400 409 429
Hispanic origin
Both sexes ............................... 277 284 290 298 304 312 322 331 324 329 339 351 370 385 396Men .................................... 299 306 307 315 318 323 339 346 343 350 356 371 390 406 414Women ............................... 241 251 260 269 278 292 302 313 305 305 316 318 337 348 364
White
Both sexes ............................... 370 383 394 409 424 442 458 475 484 494 506 519 545 573 591Men .................................... 433 450 465 482 494 506 514 524 547 566 580 595 615 638 669Women ............................... 294 307 318 334 353 373 387 401 408 415 428 444 468 483 500
EARNINGS RATIOS
Black to white ........................... 78.6 78.6 79.7 78.0 77.6 78.7 77.9 77.7 76.7 77.5 76.5 77.1 78.2 77.7 79.2Black men to white men ........... 73.4 72.4 74.6 72.2 73.1 74.1 73.9 74.8 73.1 72.6 71.0 72.6 76.1 76.5 75.2Black women to white women ... 89.5 89.6 90.6 90.1 87.3 86.6 86.6 86.8 84.8 85.5 84.6 84.5 85.5 84.7 85.8
Hispanic to white ...................... 74.9 74.2 73.6 72.9 71.7 70.6 70.3 69.7 66.9 66.6 67.0 67.6 67.9 67.2 67.0Hispanic men to white men ....... 69.1 68.0 66.0 65.4 64.4 63.8 66.0 66.0 62.7 61.8 61.4 62.4 63.4 63.6 61.9Hispanic women to white women .................................... 82.0 81.8 81.8 80.5 78.8 78.3 78.0 78.1 74.8 73.5 73.8 71.6 72.0 72.0 72.8
1 Earnings are expressed in nominal dollars.2 Full-time workers include persons who usually work 35 hours or more a week on their sole, or principal, job.3 Wage and salary workers exclude self-employed persons whether or not their businesses are incorporated.
SOURCE: Bureau of Labor Statistics, Current Population Survey.
CharacteristicYear

37
Table 1-7. Civilian labor force by age, sex, race, and Hispanic origin, 1988, 1998, and projected 2008
(Numbers in thousands)
Total, 16 years and older .............. 121,669 137,673 154,576 16,004 13.2 16,903 12.3
Age
16 to 24 years ........................ 22,536 21,894 25,210 -642 -2.8 3,316 15.125 to 54 years ........................ 84,041 98,718 104,133 14,677 17.5 5,415 5.555 years and older ................. 15,092 17,062 25,233 1,970 13.1 8,171 47.9
Sex
Men ........................................ 66,927 73,959 81,132 7,032 10.5 7,173 9.7Women ................................... 54,742 63,714 73,444 8,972 16.4 9,730 15.3
Race and Hispanic origin
Black ...................................... 13,205 15,982 19,101 2,777 21.0 3,119 19.5Hispanic origin ........................ 8,982 14,317 19,585 5,335 59.4 5,268 36.8Asian and other ...................... 3,708 6,278 8,809 2,570 69.3 2,531 40.3White ...................................... 104,756 115,415 126,665 10,659 10.2 11,250 9.7
SOURCE: Table 2 in Howard N Fullerton, “Labor force projections to 2008: steady growth andchanging composition,” Monthly Labor Review, November 1999, p. 20.
CharacteristicCivilian labor force Change, 1998-2008Change, 1988-98
1988 19982008,
projectedNumber Percent PercentNumber

38
Table 1-8. Civilian labor force participation rates by sex, age, race, and Hispanic origin, 1988, 1998, andprojected 2008
(Numbers in thousands)
Age and sex
Total, 16 years and older .......... 65.9 67.4 67.6 1.5 0.216 to 24 years .................... 68.4 65.9 66.2 -2.5 .325 to 54 years .................... 82.9 84.1 85.4 1.2 1.3
25 to 34 years ................. 83.3 84.6 85.9 1.3 1.335 to 44 years ................. 84.6 84.7 86.0 .1 1.345 to 54 years ................. 79.6 82.5 84.3 2.9 1.8
55 years and older… .......... 30.0 31.3 36.8 1.3 5.5
Men .......................................... 76.2 74.9 73.7 -1.3 -1.216 to 24 years .................... 72.4 68.4 68.0 -4.0 -.425 to 54 years .................... 93.6 91.8 91.3 -1.8 -.555 years and older ............. 39.9 39.1 43.5 -.8 4.4
Women ..................................... 56.6 59.8 61.9 3.2 2.116 to 24 years .................... 64.5 63.3 64.3 -1.2 1.025 to 54 years .................... 72.7 76.5 79.7 3.8 3.255 years and older ............. 22.3 25.0 31.2 2.7 6.2
Race and Hispanic origin
Black ........................................ 63.8 65.6 66.3 1.8 .7Men .................................... 71.0 69.0 68.3 -2.0 -.7Women ............................... 58.0 62.8 64.6 4.8 1.8
Hispanic origin .......................... 67.4 67.9 67.7 .5 -.2Men .................................... 81.9 79.8 77.9 -2.1 -1.9Women ............................... 53.2 55.6 57.9 2.4 2.3
Asian and other ........................ 65.0 67.0 66.9 2.0 -.1Men…………………………… 74.4 75.5 74.0 1.1 -1.5Women ............................... 56.5 59.2 60.5 2.7 1.3
White ........................................ 66.2 67.3 67.9 1.1 .6Men .................................... 76.9 75.6 74.5 -1.3 -1.1Women ............................... 56.4 59.4 61.5 3.0 2.1
SOURCE: Table 3 in Howard N Fullerton, “Labor force projections to 2008: steady growth andchanging composition,” Monthly Labor Review, November 1999, p. 24.
CharacteristicParticipation rates Percentage-point change
1988 1998 2008,projected
1988 to 1998 1998 to 2008

39
Table 1-9. Labor force participation rates of the foreign-born and native-born by selectedcharacteristics, annual averages, 2000
Age
Total, 16 years and older .......... 66.7 79.8 54.0 67.2 73.9 61.116 to 24 years .................... 60.2 70.6 47.8 66.6 68.4 64.925 to 34 years .................... 77.0 92.1 61.4 86.2 93.6 79.235 to 44 years .................... 82.1 94.0 69.7 85.3 92.4 78.445 to 54 years .................... 80.0 91.0 69.6 82.9 88.3 77.855 to 64 years .................... 59.1 73.6 47.3 59.2 66.5 52.465 years and older ............. 12.1 18.6 7.4 12.9 17.4 9.6
Education 1
Less than a high school diploma .................................. 59.0 78.0 41.4 37.4 46.7 29.2High school graduates, no college ............................. 66.5 81.4 54.1 64.4 74.3 55.9Some college, no degree .......... 72.5 81.7 63.9 72.2 79.2 65.9College graduates ..................... 76.9 85.3 67.4 79.9 84.3 75.2
Race and ethnicity 2
Non-Hispanic black ................... 75.0 80.6 69.4 64.9 67.6 62.8Hispanic origin .......................... 69.5 85.4 52.5 67.7 74.8 61.4Non-Hispanic Asian .................. 67.3 77.8 58.2 66.1 70.0 62.3Non-Hispanic white ................... 59.1 71.0 48.0 67.6 74.9 60.8
1 Data by educational attainment are for persons aged 25 years and older.2 Data for race and ethnicity groups will not sum to totals, because data for the “other races”
group are not presented.
SOURCE: Bureau of Labor Statistics, Current Population Survey.
Foreign-born Native-bornCharacteristic
Total Men Women WomenMenTotal
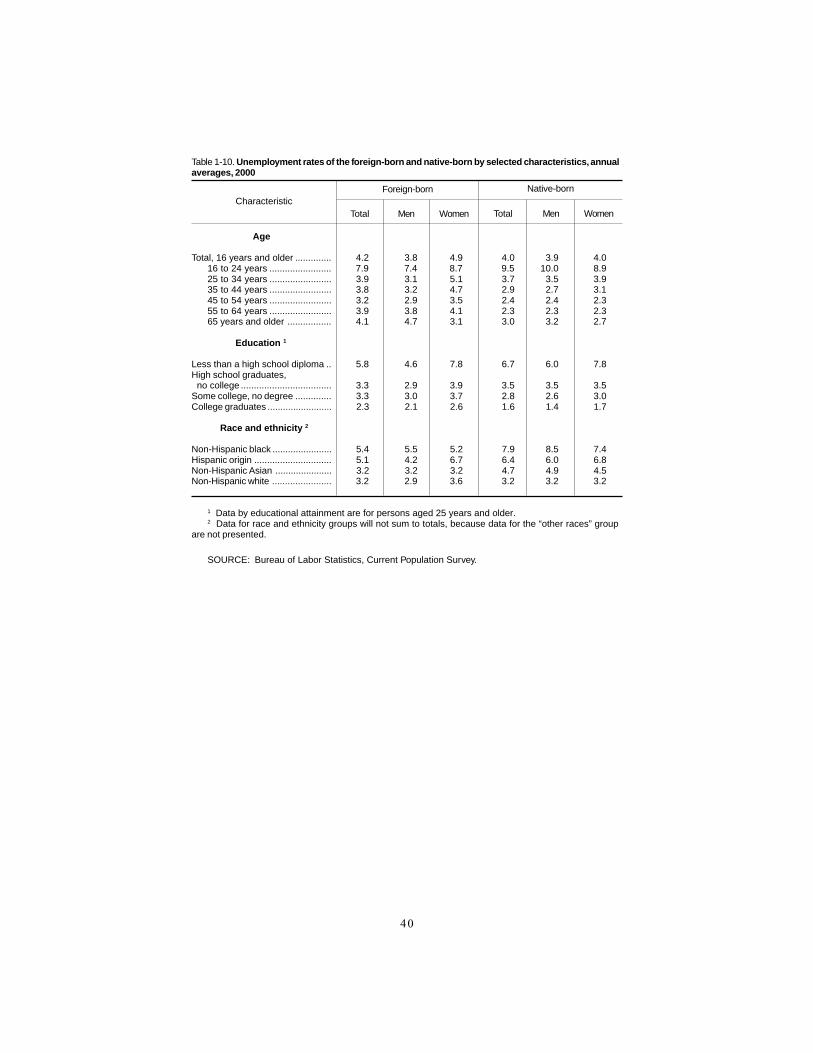
40
Table 1-10. Unemployment rates of the foreign-born and native-born by selected characteristics, annualaverages, 2000
Age
Total, 16 years and older .............. 4.2 3.8 4.9 4.0 3.9 4.016 to 24 years ........................ 7.9 7.4 8.7 9.5 10.0 8.925 to 34 years ........................ 3.9 3.1 5.1 3.7 3.5 3.935 to 44 years ........................ 3.8 3.2 4.7 2.9 2.7 3.145 to 54 years ........................ 3.2 2.9 3.5 2.4 2.4 2.355 to 64 years ........................ 3.9 3.8 4.1 2.3 2.3 2.365 years and older ................. 4.1 4.7 3.1 3.0 3.2 2.7
Education 1
Less than a high school diploma .. 5.8 4.6 7.8 6.7 6.0 7.8High school graduates, no college ................................... 3.3 2.9 3.9 3.5 3.5 3.5Some college, no degree .............. 3.3 3.0 3.7 2.8 2.6 3.0College graduates ......................... 2.3 2.1 2.6 1.6 1.4 1.7
Race and ethnicity 2
Non-Hispanic black ....................... 5.4 5.5 5.2 7.9 8.5 7.4Hispanic origin .............................. 5.1 4.2 6.7 6.4 6.0 6.8Non-Hispanic Asian ...................... 3.2 3.2 3.2 4.7 4.9 4.5Non-Hispanic white ....................... 3.2 2.9 3.6 3.2 3.2 3.2
1 Data by educational attainment are for persons aged 25 years and older.2 Data for race and ethnicity groups will not sum to totals, because data for the “other races” group
are not presented.
SOURCE: Bureau of Labor Statistics, Current Population Survey.
CharacteristicNative-bornForeign-born
Total Men Women WomenMenTotal
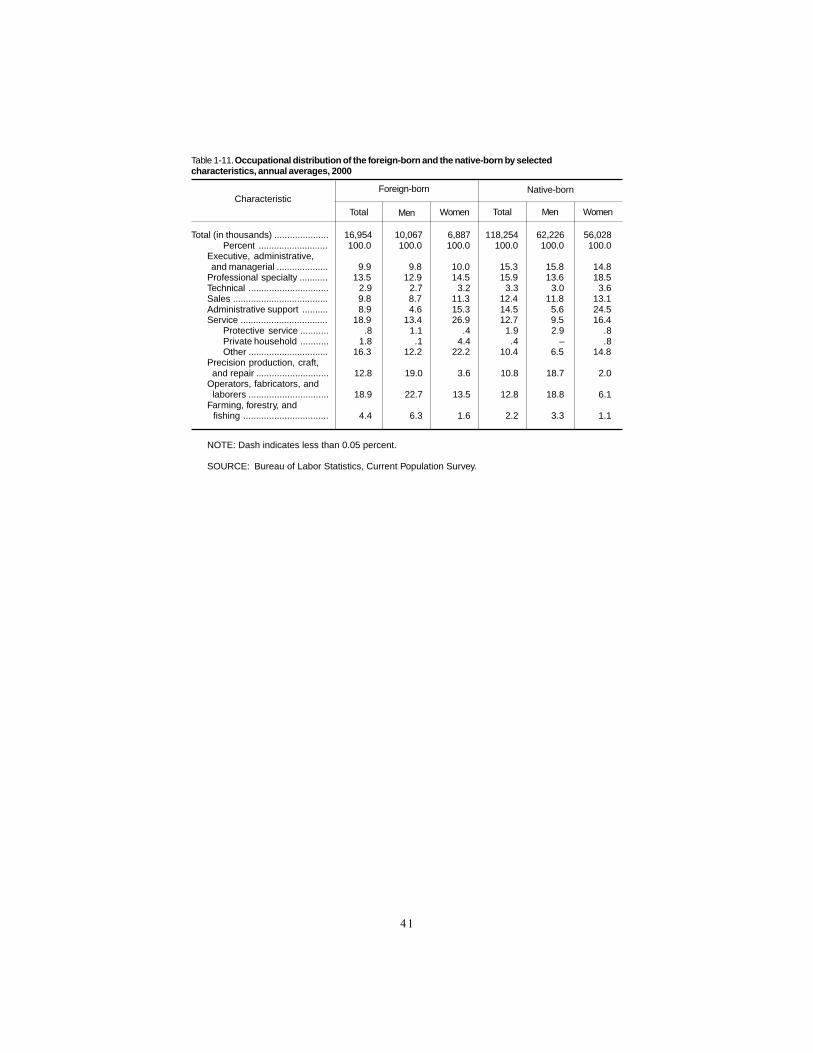
41
Table 1-11. Occupational distribution of the foreign-born and the native-born by selectedcharacteristics, annual averages, 2000
Total (in thousands) ..................... 16,954 10,067 6,887 118,254 62,226 56,028Percent ........................... 100.0 100.0 100.0 100.0 100.0 100.0
Executive, administrative, and managerial .................... 9.9 9.8 10.0 15.3 15.8 14.8Professional specialty ........... 13.5 12.9 14.5 15.9 13.6 18.5Technical ............................... 2.9 2.7 3.2 3.3 3.0 3.6Sales ..................................... 9.8 8.7 11.3 12.4 11.8 13.1Administrative support .......... 8.9 4.6 15.3 14.5 5.6 24.5Service .................................. 18.9 13.4 26.9 12.7 9.5 16.4
Protective service ........... .8 1.1 .4 1.9 2.9 .8Private household ........... 1.8 .1 4.4 .4 – .8Other ............................... 16.3 12.2 22.2 10.4 6.5 14.8
Precision production, craft, and repair ............................ 12.8 19.0 3.6 10.8 18.7 2.0Operators, fabricators, and laborers ............................... 18.9 22.7 13.5 12.8 18.8 6.1Farming, forestry, and fishing ................................. 4.4 6.3 1.6 2.2 3.3 1.1
NOTE: Dash indicates less than 0.05 percent.
SOURCE: Bureau of Labor Statistics, Current Population Survey.
Foreign-born Native-bornCharacteristic
Total Men Women MenTotal Women

42
Table 1-12. Median weekly earnings of foreign-born and native-born full-time1 wage and salary workers2
by selected characteristics, annual averages, 2000
Age
Total, 16 years and older ............. $447 $477 $407 $591 $676 $50016 to 24 years………….……… 314 320 300 369 387 34725 to 34 years………………… 433 443 418 574 624 50035 to 44 years ....................... 499 555 423 652 755 53445 to 54 years ....................... 516 586 445 690 804 57955 to 64 years ….…………… 483 533 415 635 757 51465 years and older ................ 381 408 344 457 580 385
Education 3
Less than a high school diploma ...................................... 322 355 286 389 464 313High school graduates, no college .................................. 420 468 377 514 607 426Some college, no degree ............. 524 584 478 604 710 506College graduates ........................ 852 964 724 902 1,032 764
1 Full-time workers include persons who usually work 35 hours or more a week on their sole, orprincipal, job.
2 Wage and salary workers exclude self-employed persons whether or not their businesses areincorporated.
3 Data by educational attainment are for people aged 25 years and older.
SOURCE: Bureau of Labor Statistics, Current Population Survey.
Foreign-born Native-bornCharacteristic
Total Men Women Men WomenTotal
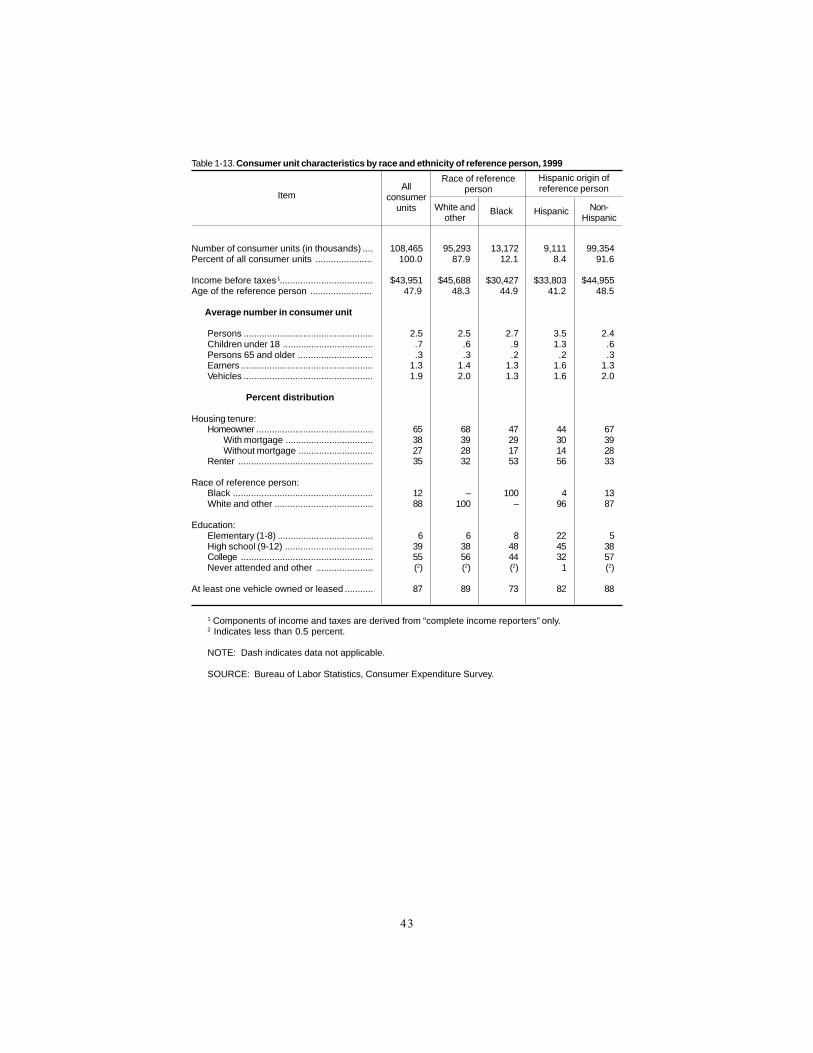
43
Table 1-13. Consumer unit characteristics by race and ethnicity of reference person, 1999
Number of consumer units (in thousands) .... 108,465 95,293 13,172 9,111 99,354Percent of all consumer units ...................... 100.0 87.9 12.1 8.4 91.6
Income before taxes .................................... $43,951 $45,688 $30,427 $33,803 $44,955Age of the reference person ........................ 47.9 48.3 44.9 41.2 48.5
Average number in consumer unit
Persons .................................................. 2.5 2.5 2.7 3.5 2.4Children under 18 ................................... .7 .6 .9 1.3 .6Persons 65 and older ............................. .3 .3 .2 .2 .3Earners ................................................... 1.3 1.4 1.3 1.6 1.3Vehicles .................................................. 1.9 2.0 1.3 1.6 2.0
Percent distribution
Housing tenure:Homeowner ............................................. 65 68 47 44 67
With mortgage .................................. 38 39 29 30 39Without mortgage ............................. 27 28 17 14 28
Renter .................................................... 35 32 53 56 33
Race of reference person:Black ...................................................... 12 – 100 4 13White and other ...................................... 88 100 – 96 87
Education:Elementary (1-8) ..................................... 6 6 8 22 5High school (9-12) .................................. 39 38 48 45 38College ................................................... 55 56 44 32 57Never attended and other ...................... (2) (2) (2) 1 (2)
At least one vehicle owned or leased ........... 87 89 73 82 88
1 Components of income and taxes are derived from “complete income reporters” only.2 Indicates less than 0.5 percent.
NOTE: Dash indicates data not applicable.
SOURCE: Bureau of Labor Statistics, Consumer Expenditure Survey.
Allconsumer
units
Race of referenceperson
Hispanic origin ofreference person
ItemWhite and
otherBlack Hispanic Non-
Hispanic
1

44
Table 1-14. Allocation of average annual expenditures per consumer unit, and aggregate expenditureshares by race of reference person, 1999
Number of consumer units (in thousands) ........... 95,293 13,172 95,293 13,172 Percent of all consumer units ........................ 87.9 12.1 87.9 12.1
Total expenditures ................................... $38,323 $27,340 $3.7 trillion $0.4 trillionPercent ............................................. 100.0 100.0 91.0 9.0
Food .................................................................... 13.4 15.1 89.9 10.0Food at home ................................................ 7.7 9.7 88.9 11.1Food away from home ................................... 5.7 5.4 91.4 8.5
Alcoholic beverages ............................................ .9 .6 93.7 6.0
Housing ............................................................... 32.3 35.5 90.2 9.8Shelter .......................................................... 18.8 20.1 90.5 9.5
Owned dwellings ...................................... 12.5 9.8 92.8 7.2Rented dwellings ..................................... 5.0 9.8 83.9 16.1Other lodging ........................................... 1.3 .5 96.4 3.7
Utilities, fuels, and public services ............... 6.2 8.8 87.7 12.3Household operations .................................... 1.8 1.7 91.7 8.3Housekeeping supplies ................................. 1.3 1.3 91.0 8.8Household furnishings and equipment ........... 4.1 3.6 92.0 8.0
Apparel and services ........................................... 4.5 6.9 86.9 13.1
Transportation ...................................................... 19.0 18.7 91.2 8.8Vehicle purchases (net outlay) ...................... 9.0 8.7 91.3 8.7Gasoline and motor oil .................................. 2.9 2.8 91.3 8.7Other vehicle expenses ................................ 6.1 6.1 90.9 9.1Public transportation ..................................... 1.1 1.1 91.2 8.9
Healthcare .......................................................... 5.4 4.0 93.2 6.8Health insurance ........................................... 2.5 2.1 92.5 7.4Medical services ........................................... 1.6 .9 94.8 5.2Drugs .......................................................... 1.0 .9 92.1 7.7Medical supplies ............................................ .3 .2 93.5 6.2
Entertainment ...................................................... 5.3 3.4 93.9 6.0Personal care products and services .................. 1.1 1.5 88.1 11.9Reading ............................................................... .4 .3 93.9 6.2Education .......................................................... 1.7 1.5 92.1 7.8Tobacco products and smoking supplies ............. .8 .8 91.7 8.4Miscellaneous ...................................................... 2.4 2.2 91.7 8.2Cash contributions .............................................. 3.3 2.0 94.4 5.6Personal insurance and pensions ....................... 9.4 7.7 92.6 7.4
SOURCE: Bureau of Labor Statistics, Consumer Expenditure Surveys.
Aggregate expenditureshares
Shares of totalexpenditures
White andother
ItemBlack White and
otherBlack

45
Table 1-15. Consumer unit characteristics by ethnicity of reference person, 1994 and 1999
Number of consumer units (in thousands) ........... 94,479 99,354 7,730 9,111Percent of all consumer units ............................. 92.4 91.6 7.6 8.4Income before taxes1 .......................................... $37,000 $44,955 $26,750 $33,803Age of the reference person ............................... 48.2 48.5 41.1 41.2
Average number in consumer unit
Persons ......................................................... 2.5 2.4 3.4 3.5Children under 18 .......................................... .7 .6 1.3 1.3Persons 65 and older .................................... .3 .3 .2 .2Earners .......................................................... 1.3 1.3 1.5 1.6Vehicles ......................................................... 2.0 2.0 1.6 1.6
Percent distribution
Housing tenure:Homeowner .................................................... 65 67 42 44
With mortgage ......................................... 37 39 28 30Without mortgage .................................... 27 28 14 14
Renter .......................................................... 35 33 58 56
Race of reference person:Black ............................................................. 12 13 3 4White and other ............................................. 88 87 97 96
Education:Elementary (1-8) ............................................ 7 5 25 22High school (9-12) ......................................... 43 38 45 45College .......................................................... 49 57 29 32Never attended and other ............................. 0 (2) 1 1
At least one vehicle owned or leased ........... 86 88 80 82
1 Components of income and taxes are derived from “complete reporters” only.2 Indicates less than 0.5 percent.
SOURCE: Bureau of Labor Statistics, Consumer Expenditure Surveys.
Non-Hispanic referenceperson
Hispanic referencepersonItem
1994 199919941999

46
Table1-16. Average annual and aggregate expenditure shares by ethnicity of reference person, 1999
Number of consumer units (in thousands) ........... 9,111 99,354 9,111 99,354Percent of population .............................. 8.4 91.6 – — –—
Total expenditures .................................. $33,044 $37,356 $0.3 trillion $3.7 trillionPercent ............................................. 100.0 100.0 7.6 92.4
Food .................................................................... 16.6 13.3 9.4 90.6Food at home ................................................ 10.8 7.6 10.5 89.5Food away from home ................................... 5.9 5.7 7.9 92.1
Alcoholic beverages ...................................... .8 .9 7.3 92.7
Housing ............................................................... 33.3 32.5 7.7 92.3Shelter ........................................................... 20.5 18.8 8.1 91.9
Owned dwellings ...................................... 9.6 12.4 5.9 94.1Rented dwellings ..................................... 10.4 5.1 14.2 85.8Other lodging ........................................... .5 1.3 3.1 96.9
Utilities, fuels, and public services ............... 6.4 6.4 7.5 92.5Household operations .................................... 1.4 1.8 5.9 94.1Housekeeping supplies ................................. 1.3 1.3 7.7 92.3Household furnishings and equipment ........... 3.6 4.1 6.7 93.3
Apparel and services ........................................... 6.3 4.6 10.2 89.8
Transportation ...................................................... 20.6 18.8 8.2 91.8Vehicle purchases (net outlay) ...................... 10.2 8.8 8.5 91.5Gasoline and motor oil .................................. 3.4 2.8 8.9 91.1Other vehicle expenses ................................ 6.0 6.1 7.4 92.6Public transportation ..................................... 1.0 1.1 7.3 92.7
Healthcare .......................................................... 3.4 5.4 4.8 95.2Health insurance ........................................... 1.6 2.6 4.9 95.1Medical services ........................................... .9 1.6 4.7 95.3Drugs .......................................................... .6 1.0 4.9 95.1Medical supplies ............................................ .2 .3 4.8 95.2
Entertainment ...................................................... 3.8 5.2 5.6 94.4Personal care products and services .................. 1.2 1.1 8.5 91.5Reading .......................................................... .2 .4 3.7 96.3Education .......................................................... 1.1 1.8 4.9 95.1Tobacco products and smoking supplies ............. .5 .8 4.8 95.2Miscellaneous ...................................................... 1.9 2.4 6.2 93.8Cash contributions .............................................. 2.1 3.3 4.8 95.2Personal insurance and pensions ....................... 8.2 9.4 6.6 93.4
SOURCE: Bureau of Labor Statistics, Consumer Expenditure Surveys.
Expenditure shares Aggregate shares
Hispanicreference
person
Non-Hispanicreference
person
Item Non-Hispanicreference
person
Hispanicreference
person

47
Table 1-17. Aggregate expenditure shares for Hispanics, 1994 and 1999
Number of consumer units (in thousands) ................................................ 7,730 9,111Percent of all consumer units .................................................................. 7.6 8.4
Average annual expenditures per consumer unit ..................................... $26,433 $33,044
Percent of all consumer expenditures
Total expenditures ........................................................................ 6.3 7.6Food ......................................................................................................... 7.7 9.4
Food at home ..................................................................................... 9.3 10.5Food away from home ........................................................................ 5.2 7.9
Alcoholic beverages ................................................................................. 5.7 7.3
Housing ............................................................................................... 6.7 7.7Shelter ............................................................................................... 7.1 8.1
Owned dwellings ........................................................................... 5.0 5.9Rented dwellings .......................................................................... 12.1 14.2Other lodging ................................................................................ 2.5 3.1
Utilities, fuels, and public services .................................................... 6.8 7.5Household operations ......................................................................... 5.5 5.9Housekeeping supplies ...................................................................... 6.9 7.7Household furnishings and equipment ................................................ 5.3 6.7
Apparel and services ................................................................................ 8.7 10.2
Transportation ........................................................................................... 6.1 8.2Vehicle purchases (net outlay) ........................................................... 6.0 8.5Gasoline and motor oil ....................................................................... 6.9 8.9Other vehicle expenses ..................................................................... 5.7 7.4Public transportation .......................................................................... 5.9 7.3
Healthcare ............................................................................................... 4.6 4.8Health insurance ................................................................................ 4.4 4.9Medical services ................................................................................ 5.3 4.7Drugs .................................................................................................. 3.9 4.9Medical supplies ................................................................................. 3.6 4.8
Entertainment ........................................................................................... 4.5 5.6Personal care products and services ....................................................... 8.6 8.5Reading .................................................................................................... 3.5 3.7Education ................................................................................................. 5.5 4.9Tobacco products and smoking supplies .................................................. 4.0 4.8Miscellaneous ........................................................................................... 5.8 6.2Cash contributions ................................................................................... 3.6 4.8Personal insurance and pensions ............................................................ 5.2 6.6
SOURCE: Bureau of Labor Statistics, Consumer Expenditure Surveys.
1994 1999Item
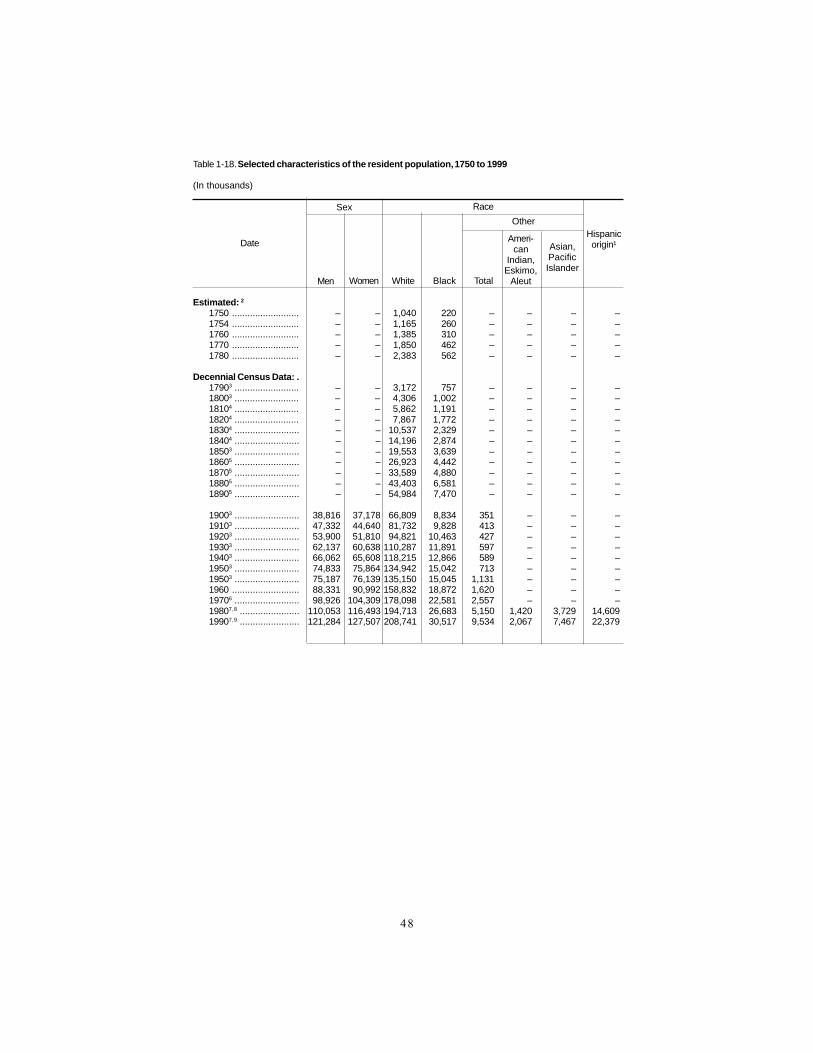
48
Table 1-18. Selected characteristics of the resident population, 1750 to 1999
(In thousands)
Estimated: 21750 .......................... – – 1,040 220 – – – –1754 .......................... – – 1,165 260 – – – –1760 .......................... – – 1,385 310 – – – –1770 .......................... – – 1,850 462 – – – –1780 .......................... – – 2,383 562 – – – –
Decennial Census Data: .17903 ......................... – – 3,172 757 – – – –18003 ......................... – – 4,306 1,002 – – – –18104 ......................... – – 5,862 1,191 – – – –18204 ......................... – – 7,867 1,772 – – – –18304 ......................... – – 10,537 2,329 – – – –18404 ......................... – – 14,196 2,874 – – – –18503 ......................... – – 19,553 3,639 – – – –18605 ......................... – – 26,923 4,442 – – – –18705 ......................... – – 33,589 4,880 – – – –18805 ......................... – – 43,403 6,581 – – – –18905 ......................... – – 54,984 7,470 – – – –
19003 ......................... 38,816 37,178 66,809 8,834 351 – – –19103 ......................... 47,332 44,640 81,732 9,828 413 – – –19203 ......................... 53,900 51,810 94,821 10,463 427 – – –19303 ......................... 62,137 60,638 110,287 11,891 597 – – –19403 ......................... 66,062 65,608 118,215 12,866 589 – – –19503 ......................... 74,833 75,864 134,942 15,042 713 – – –19503 ......................... 75,187 76,139 135,150 15,045 1,131 – – –1960 .......................... 88,331 90,992 158,832 18,872 1,620 – – –19706 ......................... 98,926 104,309 178,098 22,581 2,557 – – –19807, 8 ....................... 110,053 116,493 194,713 26,683 5,150 1,420 3,729 14,60919907, 9 ....................... 121,284 127,507 208,741 30,517 9,534 2,067 7,467 22,379
Date
Sex Race
Hispanicorigin¹Asian,
PacificIslander
Men
Other
Women White Black Total
Ameri-can
Indian,Eskimo,
Aleut

49
Current Population Survey data:
1991 (July 1)10 ........... 122,956 129,197 210,975 31,137 10,041 2,112 7,929 23,3911992 (July 1)10 ........... 124,424 130,606 212,874 31,683 10,473 2,149 8,324 24,2831993 (July 1)10 ........... 125,788 131,995 214,691 32,195 10,897 2,187 8,710 25,2221994 (July 1)10 ........... 127,049 133,278 216,379 32,672 11,276 2,222 9,054 26,1601995 (July 1)10 ........... 128,294 134,510 218,023 33,116 11,664 2,256 9,408 27,1071996 (July 1)10 ........... 129,504 135,724 219,636 33,537 12,055 2,290 9,765 28,0991997 (July 1)10 ........... 130,783 137,001 221,333 33,989 12,461 2,326 10,135 29,1821998 (July 1)10 ........... 132,030 138,218 222,980 34,427 12,840 2,361 10,479 30,2521999 (July 1)10 ........... 133,277 139,414 224,611 34,862 13,217 2,397 10,820 31,337
1 Persons of Hispanic origin may be of any race.2 Data are from Wright, Carroll D., The History and Growth of the United States Census (New York,
Johnson Reprint Corporation, 1966).3 Excludes Alaska and Hawaii.4 Source: Historical Statistics of the United States, Colonial Times to 1970, Bicentennial Edition, Part 2
(Census Bureau, 1975). 5 See Campbell J. Gibson and Emily Lennon, “Historical Census Statistics on the Foreign-born Popula-
tion of the United States: 1850-1990,” Population Division Working Paper No. 29 (Census Bureau, February1999).
6 The revised 1970 resident population count is 203,302,031, which incorporates changes due to errorsfound after tabulations were completed. The race and sex data shown here reflect the official 1970 censuscount.
7 The race data shown have been modified to be consistent with the guidelines in Federal StatisticalDirective No. 15 issued by the Office of Management and Budget. Figures are not comparable with the 1990census race categories.
8 Total population count has been revised since the 1980 census publications. Numbers by age, race,Hispanic origin, and sex have not been corrected.
9 The April 1, 1990, census count (248,765,170) includes count resolution corrections processedthrough August 1997 and does not include adjustments for census coverage errors except for adjustmentsestimated for the 1995 Census Test in Oakland, CA; Paterson, NJ; and six Louisiana parishes. Theseadjustments amounted to a total of 55,297 persons.
10 Estimated.
NOTE: Dash indicates data not available.
SOURCE: Statistical Abstract of the United States, 2000: The National Data Book (Census Bureau,2000).
Date
Sex Race
Hispanicorigin¹Asian,
PacificIslander
Ameri-can
Indian,Eskimo,
AleutMen
Other
Women White Black Total
Table 1-18. Selected characteristics of the resident population, 1750 to 1999 —Continued
(In thousands)

50
Baseler, Marilyn C., “Asylum for Mankind”America, 1607-1800 (Ithaca, NY, CornellUniversity Press, 1998).
Chan, Sucheng, Asian Americans: An Inter-pretive History (Boston, Twayne, 1991).
Epstein, Abraham, “The Negro Migrant inPittsburgh,” Monthly Labor Review, Febru-ary 1918, pp. 155-57.
Gibson, Campbell J. and Emily Lennon, “His-torical Census Statistics on the Foreign-born Population of the United States: 1850-1990,” Population Division Working Pa-per No. 29 (U.S. Census Bureau, February1999), http://wwwhttp://wwwhttp://wwwhttp://wwwhttp://www.census.gov/popula-.census.gov/popula-.census.gov/popula-.census.gov/popula-.census.gov/popula-tion/www/documentation/twps0029/tion/www/documentation/twps0029/tion/www/documentation/twps0029/tion/www/documentation/twps0029/tion/www/documentation/twps0029/twps0029.htmltwps0029.htmltwps0029.htmltwps0029.htmltwps0029.html (visited Nov. 22, 2000).
Goldberg, Joseph P. and William T. Moye, TheFirst Hundred Years of the Bureau of La-bor Statistics (Washington, U.S. Govern-ment Printing Office, 1985).
Grossman, Jonathan, “Black Studies in theDepartment of Labor, 1897-1907,”Monthly Labor Review, June 1974, pp. 17-27.
Gyory, Andrew, Closing the Gate (Chapel Hill,The University of North Carolina Press,1998).
Hatton, Timothy J. and Jeffrey G. Williamson,The Age of Mass Migration (New York,Oxford University Press, 1998).
“Industrial Relations and Labor Conditions:Negro Labor During and After the War,”Monthly Labor Review, April 1921, pp.137-42.
“Japanese Emigration,” Monthly Review, June1918, p. 231.
Japikse, Catherine, “Chronicle: The Irish Po-tato Famine,” EPA Journal, fall 1994, onthe Internet at http://wwwhttp://wwwhttp://wwwhttp://wwwhttp://www.epa.gov/.epa.gov/.epa.gov/.epa.gov/.epa.gov/epajrnal/fall94/19.txt.htmlepajrnal/fall94/19.txt.htmlepajrnal/fall94/19.txt.htmlepajrnal/fall94/19.txt.htmlepajrnal/fall94/19.txt.html
Jenks, Jeremiah W., W. Jett Lauck, and RufusD. Smith, The Immigration Problem (NewYork, Funk and Wagnalls Company, 1922).
“Labor Conditions: Results of Admission ofMexican Laborers, Under DepartmentalOrders, for Employment in AgriculturalPursuits,” Monthly Labor Review, Novem-ber 1920, pp. 221-23.
“Labor Organizations: Negro Labor in theStove Industry,” Monthly Labor Review,September 1920, pp. 183-84.
Library of Congress, “American Memory,” His-
torical Overview of U.S. Immigration Policy,1921-1964, http://wwwhttp://wwwhttp://wwwhttp://wwwhttp://www.cms.ccsd.k12.co.us/.cms.ccsd.k12.co.us/.cms.ccsd.k12.co.us/.cms.ccsd.k12.co.us/.cms.ccsd.k12.co.us/ss/SONY/Immbeta2/21-1964.htmss/SONY/Immbeta2/21-1964.htmss/SONY/Immbeta2/21-1964.htmss/SONY/Immbeta2/21-1964.htmss/SONY/Immbeta2/21-1964.htm (visitedNov. 27, 2000)
McKinnon, Jesse and Karen Humes, “TheBlack Population in the United States”(U.S. Census Bureau, September 2000),http://wwwhttp://wwwhttp://wwwhttp://wwwhttp://www.census.gov/pr.census.gov/pr.census.gov/pr.census.gov/pr.census.gov/prod/2000pubs/od/2000pubs/od/2000pubs/od/2000pubs/od/2000pubs/p20-530.pdfp20-530.pdfp20-530.pdfp20-530.pdfp20-530.pdf (visited Jan. 4, 2001).
Norwood, Janet L. and Deborah P. Klein, “De-veloping Statistics to Meet Society’sNeeds,” Monthly Labor Review, October1989, pp. 14-19.
Perlman, Joel, “‘Race or People:’ Federal RaceClassifications for Europeans in America,1898-1913,” Working Paper 320 (TheJerome Levy Economics Institute of BardCollege, 2001).
Ruggles, Stephen, Matthew Sobek, and others,“1960 Census: Instructions to Respon-dents,” Integrated Public Use MicrodataSeries: Version 2.0 (Minneapolis, Histori-cal Census Projects, University of Minne-sota, 1997), http://wwwhttp://wwwhttp://wwwhttp://wwwhttp://www.ipums.umn.edu/.ipums.umn.edu/.ipums.umn.edu/.ipums.umn.edu/.ipums.umn.edu/~pipums/voliii/inst1960.html~pipums/voliii/inst1960.html~pipums/voliii/inst1960.html~pipums/voliii/inst1960.html~pipums/voliii/inst1960.html (visitedJan. 3, 2001).
Rutkoff, Peter and Will Scott, Fly Away: The GreatMigration, http://wwwhttp://wwwhttp://wwwhttp://wwwhttp://www.nor.nor.nor.nor.northbysouth.org/thbysouth.org/thbysouth.org/thbysouth.org/thbysouth.org/1999/1999/1999/1999/1999/ (visited Nov. 27, 2000).
Schmidley, A. Dianne and Campbell Gibson,“Profile of the Foreign-Born Populationin the United States: 1997,” Current Popu-lation Reports, Series P23-195 (CensusBureau, 1999).
Schmidley, A. Dianne and J. Gregory Robinson,How Well Does the Current PopulationSurvey Measure the Foreign Born Popula-tion in the United States? (Census Bureau,April 1998), http://wwwhttp://wwwhttp://wwwhttp://wwwhttp://www.census.gov/.census.gov/.census.gov/.census.gov/.census.gov/p o p u l a t i o n / w w w / d o c u m e n t a t i o n /p o p u l a t i o n / w w w / d o c u m e n t a t i o n /p o p u l a t i o n / w w w / d o c u m e n t a t i o n /p o p u l a t i o n / w w w / d o c u m e n t a t i o n /p o p u l a t i o n / w w w / d o c u m e n t a t i o n /twps0022/twps0022.htmltwps0022/twps0022.htmltwps0022/twps0022.htmltwps0022/twps0022.htmltwps0022/twps0022.html (visited Nov.22, 2000).
Thomas, Hugh, The Slave Trade (New York,Simon and Schuster, 1997).
U.S. Census Bureau, “Section 1. Population,”1996 Statistical Abstract of the UnitedStates,. (Washington, U.S. Government Print-ing Office, 1997), http://wwwhttp://wwwhttp://wwwhttp://wwwhttp://www.census.gov/.census.gov/.census.gov/.census.gov/.census.gov/prod/2/gen/96statab/96statab.htmlprod/2/gen/96statab/96statab.htmlprod/2/gen/96statab/96statab.htmlprod/2/gen/96statab/96statab.htmlprod/2/gen/96statab/96statab.html (visitedNov. 22, 2000).
U.S. Department of Labor, “Start-up of theDepartment and World War I, 1913-1921,”
References

51
History of DOL, 1913-1988 (Washington,U.S. Government Printing Office, 1988),http://wwwhttp://wwwhttp://wwwhttp://wwwhttp://www.dol.gov/dol/asp/public/pr.dol.gov/dol/asp/public/pr.dol.gov/dol/asp/public/pr.dol.gov/dol/asp/public/pr.dol.gov/dol/asp/public/pro-o-o-o-o-grams/history/dolchp01.htmgrams/history/dolchp01.htmgrams/history/dolchp01.htmgrams/history/dolchp01.htmgrams/history/dolchp01.htm (visitedNov. 28, 2000).
Wright, Carroll D., The History and Growth ofthe United States Census (Washington,U.S. Government Printing Office, 1900).
Wynn, Neil A., “Black Americans in the Twen-
tieth Century,” in Iwan W. Morgan andNeil A. Wynn, eds., America’s Century (NewYork, Holmes and Meier Publishers, Inc.,1993), pp. 247-77.
Wynn Neil A., “The Forties: Wartime andPostwar America, 1940-1948,” In Iwan W.Morgan and Neil A. Wynn, eds., America’sCentury (New York, Holmes and MeierPublishers, Inc., 1993), pp. 110-32.

52
1 See Baseler, 1998, p. 34.2 See Hatton and Williamson, 1998, p.7.3 See Thomas, 1997, p. 552.4 See Thomas, p. 568.5 See Jenks, Lauck, and Smith, 1922, p.
368.6 See Hatton and Williamson, 1998, p. 75.7 Immigration and Naturalization Service,
“Immigrants, Fiscal Year 1998,” StatisticalYearbook of the Immigration and Naturaliza-tion Service, 1998 (Washington, U.S. Govern-ment Printing Office, 2001), table 2.
8 See Japiske, 1994.9 See Hatton and Williamson, 1998, p.75.10 See Gyory, 1998, p. 31.11 Gyory, p.40.12 Daniels, Roger, Asian America: Chinese
and Japanese in the United States since 1850(Seattle, University of Washington Press,1988), p. 52.
13 See Gyory, p. 216.14 See Chan, 2000.15 See Hatton and Williamson, 1998, p.124.16 See Hatton and Williamson, p. 149.17 See Schmidley and Gibson, 1999, p.9.18 See Schmidley and Gibson, 1999, p. 9.19 See Wynn, “Black Americans,” 1993, p.
251.20 See Rutkoff and Scott, 2000.21 See Wynn, “Black Americans,” 1993, p.
262.22 See McKinnon and Humes, 2000, p. 1.23 See Wright, 1900, p. 13.24 “All other persons” referred to slaves,
who were assigned a count equal to three-fifthsof free persons.
25 See Perlman, 2001.26 See Norwood and Klein, 1989, p. 16.27 The CPS is a monthly survey of house-
holds conducted for BLS by the Census Bureauthrough a scientifically selected sample de-signed to represent the civilian noninstitu-tional population. Respondents are interviewedto obtain information about the employmentstatus of each member of the household 16years of age and older. The inquiry relates toactivity or status during the calendar week,Sunday through Saturday, which includes the12th day of the month. This is known as the“reference week.” Actual field interviewing isconducted in the following week, referred to asthe “survey week.”
Each month about 50,000 occupied units
are eligible for interview. Some 3,200 of thesehouseholds are contacted but interviews arenot obtained because the occupants are not athome after repeated calls or are unavailable forother reasons. This represents a noninterviewrate for the survey that ranges between 6 and 7percent. In addition to the 50,000 occupiedunits, there are 9,000 sample units in an aver-age month, which are visited but found to bevacant or otherwise not eligible for enumera-tion. Part of the sample is changed each month.The rotation plan, as explained later, providesfor three-fourths of the sample to be commonfrom one month to the next, and one-half to becommon with the same month a year earlier.
28 For a brief history of the Current Popu-lation Survey, see “Design and Methodology,Current Population Survey,” Technical Paper63 (Census Bureau, March 2000), pp. 2-1through 2-5.
29 “AAA recommends ‘race’ be scrapped;suggests new government categories,” PressRelease/OMB 15 (American AnthropologicalAssociation, Sept. 8, 1997).
30 Ibid.31 See Enumerator’s Reference Manual, Cur-
rent Population Survey and Housing VacancySurvey (Census Bureau, January 1961), p. D-50.
32 See Interviewer’s Reference manual, Cur-rent Population Survey (Census Bureau, De-cember 1971 (rev. July 1985)), pp. D3-44–D3-45.
33 Ibid., p. D3-48.34 See Current Population Survey Inter-
viewing Manual (Census Bureau, January1999), pp. C3-23–C3-28.
35 See “Labor Conditions,” 1920, p. 225.36 Annual Report on the Labor Force: 1949,
Current Population Reports, Series P-50, No.19 (Census Bureau, Mar. 2, 1951), table 18,p. 23.
37 Annual Report on the Labor Force: 1955,Current Population Reports, Series P-50, No.67 (Census Bureau, March 1956), table 4, p. 20.
38 “Nonwhite” as a distinct racial categoryhas not been in use for a number of years.Hence, data by race that can be found in publi-cations like the Handbook of Labor Statistics(as published by the Bureau of Labor Statistics)or in Labor Force Statistics from the CurrentPopulation Survey, are only for whites. But,of course, the nonwhite estimates can be de-
Endnotes

53
rived by subtraction.39 See Gloria P. Green, Khoan tan Dinh,
John A. Priebe, and Ronald A. Tucker, “Revi-sions in the Current Population Survey Begin-ning in January 1983,” Employment and Earn-ings, February 1983, p. 14.
40 See Employment and Earnings, April1974, p. 137. “The term ‘Negro’ is used intables when the relevant data provided is forNegroes exclusively.”
41 See Employment and Earnings, April1974, table A-60, p. 63.
42 See “The Employment Situation: Janu-ary 1982,” USDL 82-40 (Bureau of Labor Sta-tistics, Feb. 5, 1982).
43 See Employment and Earnings, Febru-ary 1983, table 3, p. 20.
44 Prior to 1972, data were for “black andother,” or equivalently, “nonwhites.” Thischange made very little difference in terms oflabor force data at the time since more than90 percent of nonwhites were blacks.
45 See Howard N Fullerton, Jr., “Labor forceprojections to 2008: steady growth and chang-ing composition,” Monthly Labor Review,November 1999, pp. 19-32.
46 The foreign-born population, although
primarily composed of legally admitted immi-grants, includes refugees, temporary residentssuch as students and temporary workers, andundocumented immigrants. “Natives” are per-sons born in the United States, Puerto Rico, oran outlying area of the United States such asGuam or the U.S. Virgin Islands, and personswho were born in a foreign country but whohad at least one parent who was a U.S. citizen.All others are foreign-born.
47 Income data are described for completereporters only. In general, a consumer unitthat provides values for at least one of themajor sources of its income, such as wagesand salaries, self-employment, and Social Se-curity income is classified as a “complete in-come reporter.” However, even completeincome reporters may not provide a com-plete accounting of all sources of income.
48 Note that total shelter, as defined in tables14 and 15, omits utilities, but includes otherlodging (such as for vacation stays or room atschool). Because blacks are noticeably under-represented in other lodging (4 percent), thisdiminishes the overall shelter share. However,other lodging is a small component of shelterfor both black and nonblack consumers.

55
1901 President McKinley assassinated1902 United States passes the Chinese Exclusion Act1903 Movie, “The Great Train Robbery”1904 New York City subway opens1906 Upton Sinclair writes The Jungle1908 Ford introduces the Model-T1909 NAACP is founded
1911 Standard Oil Company broken upTriangle Shirtwaist Factory fire
1913 Personal income tax introduced in the United States1916 First self-service grocery store opens1917 Russian Revolution1919 Prohibition begins in the United States
1920 Women granted the right to vote in the United States1921 Extreme inflation in Germany1929 New York Stock Market crashes
1930 Sliced bread available1933 Prohibition ends in the United States1934 Cheeseburger created1935 CIO formed
John Maynard Keynes suggests New Economic Theory1939 Movie, “Gone with the Wind”
1940 Nylons on the market1944 Ballpoint pens go on sale1946 Dr. Spock publishes The Common Book of Baby and Child Care
1950 First modern credit card introduced1952 Car seat belts introduced1954 Surgeon General’s report says cigarettes cause cancer
Segregation ruled illegal in the United States1955 AFL and CIO merge
McDonald’s Corporation founded
1960 First televised Presidential debatesBirth control for women “The Pill” introduced
1962 Rachel Carson publishes Silent Spring1963 President Kennedy assassinated1966 Mass draft protests in the United States1967 First Super Bowl
1972 Watergate scandal begins1973 Abortion legalized in the United States1974 President Nixon resigns1975 Microsoft founded1979 Sony introduces the Walkman
1980 Ted Turner establishes CNN1984 Huge poison gas leak in Bhopal, India1985 New Coke hits the market with a thud1987 New York Stock Exchange suffers huge drop on “Black Monday”1989 Fall of the Berlin Wall
1997 Tallest buildings in the world built in Kuala Lumpur1999 The Euro becomes the New European currency
Social and Economic Timeline

57
Chapter 2
In This Chapter—
The Evolution of Compensation in aChanging Economy
Over the course of the 20th century,American workers have witnessed an evo-
lution in compensation. Through the century,the changes in the methods of pay have usu-ally been stimulated by some form of imbal-ance caused by a crisis or demographic shift.For the 20th century American worker, nogreater crisis was experienced than the GreatDepression, a watershed in how employers paidtheir workers. But growth in unionization andthe increase in the number of working women,among other shifts, have also contributed tochanges in pay practices.
Payment for labor services has evolved fromsimple piecework pay to sophisticated con-tractual compensation packages. At the turnof the 20th century in America, few workerswould have received anything more than wagesas compensation for their labor services. Butby the close of the century, a typical workerreceived more than 25 percent compensationin the form of benefits. These benefits, whichwere termed fringe benefits for most of thecentury, consisted of employer-paid items suchas health, life and unemployment insurance;retirement and savings; and holiday and vaca-tion leave. Today, benefit components mak-ing up the compensation package continue toevolve, with variable pay plans—such as profit-sharing and stock options—growing in impor-tance. Additionally, emerging benefits, such asfamily care, are becoming widely available.
Structural change and American laborFor the first third of the 20th century, com-pensation for industrial workers was composedmainly of wages that were based on a worker’sproduction performance, typically a piece ratepaid on each unit produced. (This chapter fo-cuses on compensation of industrial workers.Agricultural and domestic workers are excluded,as a substantial number received a significant
portion of their compensation in kind. In kindpay, such as room and meals, is not captured inmost compensation surveys.)
The setting of piece rates for unit produc-tion was rarely prescribed by any formal mana-gerial or industrial standards but was typicallyat the discretion of the individual shop fore-man. Since wage standards would not comeuntil later—through legislation and union ac-tivity—many workers were at the mercy of
PageStructural change and
American labor .................... 57The influence of
Social Security legislation ... 58The right to bargain
collectively ........................... 58Setting standards ...................... 59Composition of pay ................ 65Pre-World War I reform
and economic volatility ..... 65World War I and prosperity .... 67The Great Depression and
the Federal role in theeconomy ............................... 69
World War II and the transitionto a peacetime economy .... 71
The Korean War to beyond theGreat Society ....................... 73
Inflation, recession, and highunemployment .................... 75
An economy in transition ...... 77The 1990s and the New
Economy .............................. 79Future trends in employee
compensation ...................... 82

58
current business conditions in their individualindustries.
Also, at this time, a structural shift inemployment, driven by technological advancesand product demand, had little impact on theway workers were paid. That is not to say thatreal wages were stagnant; however. Weeklyearnings of workers in manufacturing moder-ately increased for most quinquenniums,with substantial increases coming during theWorld War I years, when labor markets wereconstrained.1 (See box on p. 5)
With no modern-day benefits, workers andtheir families bore the economic risks that wereassociated with sickness, unemployment, andold age. Household savings provided the mainsource of security, with charitable organiza-tions sometimes helping. At this time, laborunions were actually reluctant to take up thecause for economic insurance benefits, asunions were adverse to employers—or the gov-ernment—mingling in such worker affairs.American labor unions and their members es-poused freedom and independence, favoring apro-labor capitalistic approach.
Labor’s stance was traceable to the many inthe labor movement who had an agrarian heri-tage of self-sufficiency and independence thatprovided little ideological rationale for bar-gaining for security benefits. The sentimentof the time could be heard in the words ofSamuel Gompers, president of the AmericanFederation of Labor from 1886 to 1924, whoargued in 1917 that compulsory benefits,“…weakens independence of spirit, delegatesto outside authorities some of the powers andopportunities that rightfully belong to wageearners, and breaks down industrial freedom byexercising control over workers through a cen-tral bureaucracy.’’2 Labor’s attitude towardsself-sufficiency and independence would notweaken until some 15 years later under thedevastation of the Great Depression.
The influence of Social Security legislationThe burden of the Great Depression wouldprove too great for households and charitableorganizations to bear. At no time in modernAmerica’s history had such a large proportionof workers been without jobs; estimates of an-nual average unemployment reached a rateapproaching 25 percent. The depth of theDepression would ultimately provide the cata-lyst for change in labor’s attitude about self-sufficiency that would, in turn, give way to
changes in how American workers were paid.President Roosevelt’s New Deal legislation
provided sweeping change. In 1935, with somany with so little, the Federal Governmentpassed, with the approval of labor, the SocialSecurity Act (SSA). The passage of thislegislation provided a nationwide system ofsocial insurance that today still protects work-ers from loss of wages stemming from unem-ployment and old age. The 1935 SSA wasthe first thread of a public social security netthat would limit the economic hardshipof workers and their families.
When first enacted, the SSA provided cov-erage for fewer than fewer 60 percent of theworkforce; but following several amendments,coverage soon expanded to more than 90 per-cent. Aside from increasing the numbers cov-ered, amendments extended benefits to depen-dents and survivors and to the disabled in 1939and 1956, respectively. The Act was broad-ened in scope, in 1965, to provide medicalcoverage to the elderly retired.
Social Security was the first nationwide le-gally required benefit. Although some Statesbeforehand had enacted legislation requiringemployers to provide workers’ compensationbenefits, no State had a program that pro-tected workers’ incomes through economiccycles or old age. The passage of the SSA andthe hardships experienced during the GreatDepression would pave the way for a series ofchanges in the composition of pay; but thedrafting of this seminal act purposefully main-tained, at least in part, the spirit of self-suffi-ciency. From its inception, the economic pro-tections afforded under the SSA have beentreated as social insurance in which participa-tion was a right acquired by working, and thepremiums shared equally by employer andemployee through payroll taxes.
The right to bargain collectivelyIn the wake of the Great Depression, impor-tant pro-labor legislation was passed, but nonewas more fundamental than the NationalLabor Relations Act of 1935 (Wagner Act).The Wagner act guaranteed the twin rights ofworkers to join labor unions and to bargaincollectively. This act turned the tide forunion labor that had too often encounteredcourt defeats in cases of management and unionentanglements. The immediate impact of theWagner Act can be seen in the increase inunion membership. Unions swelled more than

59
two-fold between 1935 and 1940, rising from3.8 million to 9 million—a stark change ofevents from the declines experienced just afew years earlier. This quinquennium growthwould be matched by no other period in thehistory of American labor.
The rapid growth in strength of unions, nu-merically and financially, continued throughthe World War II years. After the war,unions—with their newfound strength—pressedhard for higher wages, and when not met,orchestrated widespread strikes that would, in the end, raise the public’s ire. Although theWagner Act had prohibited unfair labor prac-tices by management, there were no prohibi-tions on union’s behavior. Similar to the criesheard at the turn of the century for trust bust-ing, the public demanded that Congress enactlegislation that would restrict and control unionbehavior. As an amendment to the Wagner Act,in 1947, Congress passed the Labor Manage-ment Relations (Taft-Hartley) Act, which spe-cifically prohibited unfair union practices, suchas jurisdictional and sympathy strikes and feath-erbedding. The Taft-Hartley Act also placedrestrictions on union administration, contractcontents, and health and safety strikes. Afterthe passage of the Taft-Hartley Act reeled inunion power, however, two court cases cameon its heels that would expand unions’ bar-gaining scope to employer-provided benefits.
Economic constraints and accompanying in-flationary pressures of World War II forgedchanges in compensation practices of manyemployers. The War Labor Board, charged withmaintaining price stability, placed restrictionson cash-wage increases employers could offer.With a short supply of labor to produce a grow-ing demand for war products,3 employers be-gan offering nonwage benefits, which includedinsurance, pension plans, and holiday and va-cation leave, as a means to attract and retainworkers. The War Labor Board encouragedthese offerings, considering them as fringe ben-efits with little inflationary potential.
However, once these benefits made theirway into practice, workers began to regardthem as mainstay components of compensa-tion. The cry 30 years earlier by Gompers’that mandating benefits “weakens indepen-dence of spirit” had dissipated. In the post-waryears, unions would not only fight for wageincreases but also benefits. The courts wouldprove instrumental in this fight. In the 1948case of Inland Steel v. NLRB, the court inter-
preted the right to bargain for workingconditions, protected under the Wagner Act,to include the right to bargain for retirementbenefits. In the 1949 case of W. W. Cross andCo. v. NLRB, the court came to the sameconclusion for health insurance. These ben-efits would become mainstay compensationcomponents of union contracts and wouldslowly emerged as part of nonunion compen-sation as well. (The growth of employerprovided benefits is described later in thissection.)
Setting standardsOther important labor legislation was alsopassed in the wake of the Great Depression.The Davis-Bacon Act of 1931 and the Walsh-Healey Act of 1936, to name two, establishedwage standards for workers employed by con-tractors or subcontractors on public construc-tion or in the provision of materials and sup-plies to the Federal Government. (Before theselaws, formal wage standards of any kind hadbeen uncommon.)
The passage of the Fair Labor Standards Act(FLSA) of 1938, which remains today one ofthe most significant acts regarding labor stan-dards, set working-condition requirement formost workers engaged in or producing goodsfor interstate commerce. The FSLA set mini-mum wages, maximum hours, and overtimestand-ards that employers had to follow. Addi-tionally, this act set national rules for childlabor, at a critical time in history. (Child laborlegislation had been evolving for some time inState houses, but falling real wages during theGreat Depression precipitated a national re-striction on the use of child labor.)
The FSLA had a direct effect on compensa-tion, as it not only set minimum wage stan-dards, but also established provisions for over-time hours and pay that would become part ofwage benefits for all nonexempt workers. Inconjunction with the SSA, the FSLA wove anadditional thread into the national social secu-rity net by legislatively setting a living wageand decent hours for American workers.
In 1949, the FLSA was amended to directlyprohibit child labor; in 1958, the Welfare andPension Disclosure Act was passed, setting re-porting requirements for administrators ofhealth insurance, pensions, and supplementaryplans; and, in 1959, the Labor-ManagementReporting Act was passed, providing additionalprotection for the rights of union members.

60
During the 1960s and 1970s, laws protect-ing against discrimination and laws protectingthe health and safety of workers were passed.Still other labor-related legislation dealt withtaxation and standards for administering pen-sion plans. Throughout these years, familieswere undergoing significant economic changes.Women, particularly married women withchildren, were a growing presence in theworkforce. Between 1960 and 1995, the num-ber of married working mothers grew from 6.6million to 18 million. The number of singleworking mothers also took on its own pres-ence, growing from 0.6 million in 1980 to 2.1million in 1995.4
While these changes in families’ work choiceswere occurring, industries were shifting fromgoods-producing to service-producing, whichled to a disproportional growth in white-collaroccupations—occupations where unionizationwas not very common. As a result, changes inpay methods and working conditions wouldnot be ushered in by unions, as they were atmid-century. Instead, legislative initiatives pro-vided the framework for new workplace andcompensation practices.
The compositional change in familiesbrought a desire for flexibility: flexibility inleave for family care and flexibility in theassortment of benefits employers provided.
For the former, legislation helped with thepassage of the Pregnancy Discrimination Actin 1978 and the Family and Medical LeaveAct of 1993. For the latter, employers havebegun to offer flexible benefit plans, in anattempt to tailor benefits offered to employ-ees.
With a rising number of two-earner fami-lies, conflicts in benefits received by familiesbegan to emerge. Perhaps the most importantwas double health insurance coverage. In termsof hourly costs, health insurance is the mostexpensive voluntary benefit employers offer.Thus, it is economically prudent not to haveemployer expenditures dispersed on doublecoverage. This—among other motivations—brought about flexible benefit packages, or caf-eteria plans, that first emerged in the 1970s.Flexible benefit plans are arrangements inwhich employees are given an allotment ofbenefit costs to tailor individual benefit pack-ages, by selecting only those benefits that aremost valuable to specific needs. Althoughflexible benefit plans still are quite limited,they are growing in popularity. In 1986, only2 percent of workers employed in medium andlarge private establishments were eligible toparticipate in a flexible benefit plan; but, by1997, it had grown to 13 percent.

61
Measuring Real Earnings over theLong Term
The evolution of the average hourly earnings of production workers in manufacturing—adjusted to reflect changes in the purchasing power of the dollar—might tempt one toannounce that the real wage of factory workers quadrupled between 1909 and 1999.
There are, however, significant statistical issues that undermine confidence in that state-ment. First, the equivalence of the concepts of earnings, wages, and compensation haseroded tremendously, as this chapter documents in some detail. Second, there have beenchanges in the sheer technical quality of estimates of both earnings and prices, as this sectiondocuments briefly. Third, and most significantly, there exists great difficulty in making validcomparisons over long spans of time of the cost of living or its inverse—the purchasingpower of cash earnings.
The average hourly earnings of production workers in manufacturing is one of the longestrunning series in the Bureau of Labor Statistics (BLS) repertoire. Data on earnings of factoryworkers were first published regularly starting in the January 1916 edition of the MonthlyLabor Review. Additionally, similar data are available from BLS as far back as 1909 in lessregular form, and economic historians have constructed estimates for years prior to that.
Chart 2-1. Average hourly earnings of production workersin manufacturing, 1909-2000
1909 1914 1919 1920 1930 1940 1950 1960 1970 1980 1990 20000
2
4
6
8
10
12
14
16
Current dollars
1982 dollars
Dollars

62
Naturally, there have been numerous efforts to improve the quality of the payroll surveyestimates over the years. For example, BLS Bulletin 610, Revised Indexes of FactoryEmployment and Pay Rolls 1919 to 1933, was the Bureau’s first essay at benchmarkingsurvey estimates to adjust for any pronounced bias when compared with trends in censuses ofemployment.
In the late forties, BLS addressed some methodological problems, including making theestimates of average weekly earnings and average hourly earnings consistent with eachother, using the link relative technique to eliminate inconsistencies due to changing samples,and using aggregate hours—instead of employment—as the weight for aggregation of aver-age hourly earnings to higher levels of industry aggregation.
In the early 1960s, all industries became classified on the Standard Industrial Classification(SIC) basis, when nonmanufacturing was converted to the SIC system from the SocialSecurity Board classifications. In 1961, work began to design comprehensively a samplestratified by size of establishment, instead of sampling only establishments with employ-ment over a certain industry-specific number. And in 1966, the link and taper methodbecame routinely used for the monthly calculation of hours and earnings.
In 1970, for the first time, the Current Employment Statistics (CES) program beganpublishing seasonally adjusted estimates of average hourly earnings, using the BLS SeasonalFactor Method. Seasonal factoring, or adjustment, permits the more accurate interpretationof intra-year trends in economic time series by smoothing regular month-to-month fluctua-tions caused by weather, holidays, and other factors. In the 1980s, the CES program contin-ued to expand the survey sample and made additional changes in seasonal adjustment proce-dures and industry coding, as well as other technical changes. The number of establishmentssurveyed in the service sector doubled between 1979 and1989, although sampling as apercent of the service-producing universe remained unchanged.
Starting in 1995, changes in sampling techniques were developed to achieve a genuinelyrandom sample. Besides creating a new sampling design, the CES program made modifica-tions in the formulas for estimation. For hourly earnings, the link technique was kept, butweights were assigned to each sampled unit. (The use of weights replaced the use of size-basedstrata.) By the end of the decade, however, the new sample and new formulas were in useonly in the wholesale trade division; changes are to extend to the remaining divisions overthe next few years.
As a result of these and other program improvements, the degree to which CurrentEmployment Statistics estimates needed to be adjusted to benchmarks was reducedsubstantially. Bulletin 610, published in 1934, reported a cumulative bias of about 11 percentbetween 1923 and 1929. Today’s status is outlined in the monthly EmploymentSituation news release: “Over the past decade, the benchmark revision for total nonfarmemployment has averaged 0.3 percent, ranging from zero to 0.7 percent.”
Calculating real, inflation-adjusted, earnings requires a price index to deflate currentdollars to a constant level of buying power. The most commonly used index for this purposeis the Consumer Price Index (CPI). Like the measure of unadjusted, or nominal, earnings,the CPI has a long history of development and improvement.
Cost-of-living and retail price statistics are mentioned as early in the Bureau’s history as1891, and the first weighted retail price index was published in 1903. Since those early days,there is virtually no aspect of price index statistics that has not been improved. The numberof monthly prices collected has grown from about 5,000 for the 30 principal items of foodin the 1903 publication to about 70,000 that are grouped into 305 categories called entrylevel items. Additionally, the number of outlets sampled has grown from 800 for the earliestyears of the index to about 30,000 retail and service establishments; and about 27,000landlords and tenants provide data on housing units. Also, the number of localities for whichdata are collected has risen from 32 to 87.

63
Perhaps the most consistent element of the consumer price program’s scope has been itsframework of a family’s living costs. The definition of the index family for the CPI used inthe calculation of real wages, the Consumer Price Index for Urban Wage Earners and ClericalWorkers (CPI-W) has been fairly stable. In the earliest reports, the family was composed oftwo or more persons with a chief earner—either a wage earner or an earner working at arelatively low salary. The restriction to wage-earner families continues; but, in 1964, single-person families were introduced for the first time.
Another consistent characteristic of the Consumer Price Index program has beentechnical improvement. Starting in 1940, the Bureau of Labor Statistics conducted a full-scale revision of the Consumer Price Index, to take into account new population patterns,changes in the composition of consumer expenditures, and improvements in survey conceptsand methods. Five subsequent revisions have ensued, with the latest one introduced in 1998.It is important, however, to recognize that many improvements in the CPI have beenimplemented outside the formal revision process. Some of the most important of these inter-revision changes were the adoption, in 1967, of the quality adjustment concept in handlingautomobile model changeovers; the shift in 1985 (1983 for the CPI for All Urban Consum-ers, or CPI-U) to a flow-of-services model for pricing owner-occupied housing; and theimplementation of hedonic or regression-based quality adjustments, starting with apparelprices in 1991. Perhaps most significant of the more modern improvements has been theadoption of a new functional form, the geometric mean, to calculate the average of prices ofitems within most CPI product categories. One effect of using geometric means is that theformula now adjusts to some degree for changes in consumption that one might assume wouldresult from changes in the relative prices of items in the CPI market basket.
As a result of this and the other improvements, the CPI-W today is a better measure ofliving costs than previously, and is the best statistic to use to deflate one month’s or oneyear’s earnings’ estimates into dollars comparable with the dollars of adjacent (or at leastclose-by) months or years. But even with nearly perfect earnings’ estimates and price in-dexes, is it legitimate to make a comparison of the real earnings of 1909 with real earningsof 1999?
Simply doing the arithmetic results in real earnings of $2.03 constant 1982 dollars in 1909and $8.26 constant 1982 dollars in 1999. A more complex question is whether or not we canmeaningfully compare—over a span of nearly a century—the standard of living purchased byeven the most precisely measured nominal dollar deflated by even the most carefully con-structed price index. The main issue is the vastly different character of actual consumptionbetween widely separated points in time. For example, purchasing an Internet connection, atany price, would have been impossible, in 1909; and something like a buggy whip has gonefrom a common tradesman’s tool to an item of esoteric taste.
To combine the changing definition of the average consumption bundle, with changingnotions of an adequate budget, with a changing level and composition of compensationmeans that there has been a increase in the measured real cost of a moderate standard ofliving. One avenue to explore toward an explanation is the possibility of using labor hours asthe metric, rather than real dollars.
Doing that arithmetic shows that a fair level of living for a typical cotton mill workercould be earned in 1909, with about 3,750 hours of labor; and that a median family budgetfor 1998 could be obtained in exchange for about 2,625 hours of work. Thus, if one canassume that the ‘‘fair” level of living in 1909 is no better than the median family budget of1998, then one could conclude that workers in 1998 were better off. While this may showsome improvement across the 90-year span, most of the old questions about comparabilityremain; and, in fact, new ones are raised. For one thing, the nature of work has changed, andincreasing incomes have led to an increased taste for leisure time.
In the end, it is generally true that price indexes and measures of purchasing powerare accurate only over short time horizons within which tastes, technologies, and eco-nomic structures are relatively homogeneous. Comparisons over longer periods, the inter-est they generate notwithstanding, will always be subject to noncomparability and misin-terpretation, because the assumptions that underlie these comparisons—constancy of tastesand technology are violated.

64
2000 Current $ dollars1
1908-09 Cotton mill worker2 (5 person) 713 12,4023
1919 DC federal worker2 (5 person) Health and decency 2,142 21,3211947 BLS family budget4 (5 person) Modest but adequate 3,329 25,7061947 BLS family budget4 (4 person) Modest but adequate 2,904 22,4251951 BLS family budget5 “ Modest but adequate 3,750 24,8371959 BLS family budget5 “ Modest but adequate 5,180 30,6531966 BLS family budget5 “ Moderate/Intermediate 7,329 38,9521973 BLS family budget6 “ 9,761 37,8571979 BLS family budget7 “ 15,353 36,4161979 Revised Watts budget7 “ 16,129 38,2561981 BLS family budget8 “ 18,240 34,5541984 Revised budget9 “ 20,531 34,0271989 Revised budget10 “ 27,143 37,6941994 Revised budget10 “ 31,817 36,9701998 Revised budget10 “ 36,528 38,590
1 Adjusted using the Consumer Price Index for All Urban Consumers (CPI-U), 1982-84 =100.2 Adjusted using Consumer Price Index for All Urban Consumers for 1913 and budget data for 1908-09.
3 Bureau of Labor Statistics, How American Buying Habits Change (1959).4 Bureau of Labor Statistics, Workers’ Budgets in the United States: City Families and Single
Persons, Bulletin 927 (1947); 4-person budget for median city (St. Louis); 5-person budgetcalculated using equivalence scale.
5 U.S. Department of Labor, Bureau of Labor Statistics, City Worker’s Family Budget for a ModerateLiving Standard, Bulletin 1570-1 (1966).
6 Brackett, Jean, “Urban family budgets updated to autumn 1973,” Monthly Labor Review, August1974.
7 Expert Committee on Family Budget Revisions “New American Family Budget Standards,” IRPworking paper (1980).
8 “Family Budgets,” Monthly Labor Review, July 1981.9 Rogers, J. “Estimating Family Budget Standards,” unpublished BLS manuscript, 1987.
10 Calculations using 1989, 1994, and 1998 Consumer Expenditure Survey data and share of totalbudget spent on family consumption items.
Source: Johnson, David S., John M. Rogers, and Lucilla Tan, “A century of family budgets in theUnited States,” Monthly Labor Review, May 2001.
$
IntermediateIntermediate
Median (PFS)Intermediate
Median (PFS) Median (PFS) Median (PFS) Median (PFS)
$Fair
Budget amount Year Type of family budget Level of living

65
Composition of payIn early 2000, the average hourly cost of com-pensation for employers was $21.16, of which82 percent consisted of wage payments thatincluded paid leave and supplemental pay.5 Theremaining 18 percent comprised hourly costsfor non-wage supplements, such as health andlife insurance, retirement and savings, and otherlegally required benefits. As presented earlier,few workers at the turn of the 20th centuryreceived any form of nonwage benefits; and,in fact, these nonwage supplements to com-pensation were coined fringe benefits for mostof the century. The word fringe connoted thatthese components of pay were of little sub-stance to the overall pay structure of workers.With nonwage benefits now accounting fornearly one-fifth of average compensation,they are anything but fringe.
Measuring changes in components of payacross the 20th century is made difficult bythe lack of a comprehensive and consistentseries of compensation data. Compensationstudies undertaken through most of the cen-tury have measured components of paythrough the years targeted specific workers,such as mill and manufacturing workers, orworker categories, such as union or white-collar workers. Each of these compensationstudies had specific purposes, frequently re-sponding to labor issues of the day.
However, the National Income and ProductAccounts (NIPA) of the Bureau of EconomicAnalysis provided a consistent source of com-pensation data for the economy as a whole forthe better part of the century. The NIPA pro-vides aggregate estimates of both wages andsalaries, as well as supplements to wages andsalaries. These supplements, in large part, aremeasures of non-wage benefits, including em-ployer contributions for legally required ben-efits—such as Social Security and unemploy-ment insurance—and voluntary benefits, suchas health and life insurance, private pensionplans, and profit-sharing plans. Supplementsincreased sharply through most of the decadesof the 20th century, increasing from 1.4 per-cent in 1929 (the earliest year in which thesedata are available) to 17.5 percent by the closeof the century.6
The remaining sections of this chapterdiscuss the major economic, political, and de-mographic influences on compensation duringthe 20th century. These sections track the
growth of new forms and types of compen-sation. Additionally, these sections track thechanges in the Bureau of Labor Statisticscompensation studies and the reasons for thesechanges. The final section explores futuretrends in employee compensation and thedata collection challenges these trends mightpose.
Pre-World War I reform and economicvolatilityAt the turn of the 20th century, the UnitedStates was about to enter a new era. Most areasof the country had become populated, the fron-tier had disappeared, and the country was aboutto become a world power. The United Stateshad survived civil and foreign wars, sufferedthrough recessions and panics, and had seenthe formation of a business economy thatwould eventually produce the highest standardof living on Earth.
A significant feature of the early 1900s wasgrowth in the average size of establishments.7
This size increase was made possible by, amongother factors, the heightened availability ofelectricity and growth in the size of marketsfor goods. Larger establishment size tendedto provide economies of scale and reducecompetition.
Another notable feature of the early 1900swas volatility in business conditions. Therewere recessions or depressions in 1902-04,1907-08, and 1910-12, due, in part, to theabsence of a mechanism to limit the effect ofruns on banks or to control the money supply.8
The Federal Government played a pivotalrole during this period, helping to usher in aperiod of reform. The watch words of the daywere elimination of corporate abuse, trustbust-ing, tariff reduction, banking reform, protec-tion of natural resources, creating new sourcesof government revenues, and improving work-ers’ living and working conditions. Several newlaws were enacted: The Hepburn Act of 1906provided the Interstate Commerce Commis-sion authority to regulate railroads; a pure-food law in 1906 forbade the use of “deleteri-ous drug, chemical or preservative”; the 16thAmendment to the Constitution (1913) au-thorized the Federal income tax; and theClayton Antitrust Act of 1914 limited the useof injunctions in labor disputes and providedthat picketing and certain other union activi-ties were not to be considered unlawful.

66
Although some improvements had beenmade, working conditions were harsh at thebeginning of the 20th century. During theseearly years of the century, pay was low, work-weeks were long, business conditions were vola-tile, competition for jobs (due, in part, to im-migration) was intense, and employees wereunquestionably subject to the doctrine of em-ployment-at-will.9 Also, there was little com-pensation beyond the paycheck. For example,retirement income depended almost exclusivelyon what one saved during one’s working life, 10
and there was no government or employer aidif workers suffered job-related injuries or losttheir jobs. The first major social insurance pro-gram in the United States—workers’ compen-sation, which compensates workers for injuryon the job through exclusive State insurancefunds—was adopted first in Washington andOhio in 1911.11
Job insecurity, low pay, and poor workingconditions led to labor unrest, as indicated bythe growth in union membership and by sev-eral major strikes. Trade union membership inthe United States12 rose in the following man-ner in the early 20th century:
Year Total membership (thousands)
1900 791 1905 1,918 1909 2,116 1915 2,560
In 1902, miners conducted a 5-month strikeagainst anthracite coal mine operators. Othernoteworthy strikes during this period occurredin the textile, iron, railroad, clothing, and min-ing industries.
Increased Role of the Bureau of Labor (pre-Increased Role of the Bureau of Labor (pre-Increased Role of the Bureau of Labor (pre-Increased Role of the Bureau of Labor (pre-Increased Role of the Bureau of Labor (pre-decessor of the Bureau of Labor Statistics). decessor of the Bureau of Labor Statistics). decessor of the Bureau of Labor Statistics). decessor of the Bureau of Labor Statistics). decessor of the Bureau of Labor Statistics). Insuch an atmosphere, there was increased de-mand for ‘‘regular and adequate statistical datarelating to wages.’’ Around 1890, the Com-missioner of the Federal Bureau of Labor (laterthe Commissioner of the Bureau of LaborStatistics) began to supervise the collection ofaverage rates of pay by occupation, industry,and region and for selected occupations, bycity and State. These data were presented inan annual report or in the Labor Bureau’s
bimonthly bulletin.During the winter of 1900-01, the Bureau
expanded its data-collecting program, launch-ing a study of occupational wages by industry,collecting the average hourly earnings in ma-jor occupations in the leading manufacturingand mechanical (such as construction) indus-tries. Published in 1905, as the Commissioner’sNineteenth Annual Report, the volume pro-vided data for 1890 to 1903, covering 519important and distinctive occupations in 3,475establishments in 67 manufacturing and me-chanical industries. These data included actualand relative wages and hours by occupation,relative wages by industry, and relative wagesand hours for all industries covered. The re-port described in detail how data were collectedand tabulated. It expressed confidence in thequality of the data, because “…all the fieldwork for this report was carefully done by ex-perienced agents of the Bureau.13
After 1907, there was a 4-year lull in theLabor Bureau’s wage survey program, due topressure of other work, such as a special studyof wages and working conditions of womenand children. A 1912 wage study of cottongoods manufacturing and finishing industriesadded job descriptions to help ensure that iden-tical occupations were surveyed over time.Also in 1912, the Labor Bureau began studiesof union wage scales and hours of work in con-struction, newspaper printing, and several otherindustries, with data carried back to 1907.
In 1911-12, the Labor Bureau published afour-volume study of the “condition of em-ployment” in the iron and steel industry, atthe request of the U.S. Senate. Agents of theBureau of Labor visited more than 100 plantsthroughout the United States, to survey thewages and working conditions in the industry.In 1911, the Labor Bureau published averagehourly earnings for productive occupations,such as laborers, melters, hammermen, heat-ers, cinder men, and steel pourers. In 1912,the Labor Bureau reported on the trend ofwages from 1900-10 for all classes of laborersworking in blast furnaces, Bessemer con-verters, open-hearth furnaces, blooming mills,bar mills, and rod mills; the data provided thepercent of workers in various wage rate rangesat each of these six type of facilities. Thereport also included hourly rates for commonlaborers.
Meanwhile, because of the ‘‘marked growth

67
in the application of insurance,’’ the TwentyThird Annual Report of the Commissioner ofLabor (1908) was devoted to a benefit study,“Workmen’s Insurance and Benefit Funds inthe United States.” This study reported oncurrent workmen’s insurance, which protectedworkers against sickness, accident, death, oldage, and other adversity. It involved three gen-eral types of insurance funds: Those main-tained by or as adjuncts to labor organizations;those found in a common place of employ-ment (usually limited to the employees of aparticular establishment); and those maintainedby industrial benefit societies, without regardto common employment or affiliation withany particular labor organization. The studyanalyzed local labor organization benefit funds,railroad relief funds, establishment benefitfunds, hospital funds, miscellaneous funds, in-dustrial benefit societies, and State and savingsbanks’ insurance:
The investigation discloses thatnearly all of these funds attempt to ac-complish no more than to relieve im-mediate necessities. The two principalclasses of benefits are for death and fortemporary disability. The benefit paidon the death of a member usually is nomore than enough to pay funeral ex-penses, although some few societiesprovide a much more substantial sum.
The temporary disability benefits aregenerally designed to cover partially theloss of earnings occasioned by an ill-ness of ordinary length or by an acci-dent. In no case is it the purpose to paya benefit greater than the wages lost.Generally a benefit is not paid for anillness of less than one week; but forloss occasioned by accident, especiallyif occurring while on duty, benefit isusually paid from the date of injury.Temporary benefits…are limited to adefinite period, varying from a fewweeks to several months.14
World War I and prosperityThe first major attempt at government con-trol of the economy occurred during WorldWar I, as the Nation quickly shifted more than20 percent of national production to wartimeneeds.15 During these hostilities, the War In-dustries Board determined industrial priorities,fixed prices, and converted plants to meet Fed-
eral Government needs. Many governmentfunctions that would be taken for granted ahalf-century later had their origins at thistime.16
The War Labor Board, established to settleindustrial disputes, became the model for anational system of labor-management relationsin the 1930s. For the emergency period duringthe War, union representatives on that boardwon the right of workers to join unions andnot be discharged for union activity.17 TheU.S. Housing Corporation built housing for de-fense personnel, beginning the Federal involve-ment in the Nation’s housing market. The U.S.Railroad Commission took control of theNation’s railroads. The Food Administrationand Fuel Administration coordinated food andfuel distributions, respectively.18
Trade union membership almost doubledfrom 1915 to 1920—years of war and postwareconomic boom. During this time, the FederalGovernment, for the first time, treated thelabor movement as a legitimate representa-tive group.19 From a high point of 5 millionmembers in 1920, however, there was an al-most continual decline in union membershipuntil the bottom was reached in 1933.20 Aftermajor strikes in 1921-23 (including an unsuc-cessful attempt to organize the steel industry),trade unions were unable to exercise direct pres-sure on employers for almost a decade, untilthe passage of the Wagner Act in 1935, whichpromoted unionization and collective bargain-ing.21
As had been the case earlier, the compensa-tion studies conducted by the Bureau of LaborStatistics during World War I were authorizedby Congress, to address specific needs. TheWar Industries Board had been created to in-crease production, mobilize the labor force,maintain peaceful labor-management relations,and stabilize prices and wages. At this time,the Bureau worked closely with the War Board’sCentral Bureau of Planning and Statistics.22 Inaddition, wartime demands from various otheragencies for information on wages and hours,strikes and lockouts, and labor placed addi-tional requirements on the Bureau.
Not until the war was nearly over in late1918, however, was funding allocated for theBureau to undertake wage surveys for use inthe solution of labor problems in a number ofindustries and to provide a record of industrialconditions at the height of the war effort.23

68
Continuing to use procedures begun in 1913,agents specialized in certain industries and be-came “…more familiar with the nature of thework in the various occupations.”24 TheBureau’s regular, pre-war program had includedonly 10 industries surveyed at 2-yearintervals. In May 1920, results of wages andhours surveys during 1918 and 1919 were pub-lished for fully 780 occupations in 28 indus-tries.25
In what today might be called a vision state-ment, the work of the BLS was outlined in1927: “Primarily the Bureau of Labor Statis-tics is a fact-finding agency. Its duty as setforth in the act creating it is to ‘collect infor-mation upon the subject of labor * * * andthe means of promoting the material, social,intellectual, and moral prosperity’ of the wageearners of this country. The function of thebureau is thus somewhat broader than is what iscommonly understood by the word statistics.Its field of work not only covers purely statis-tical data, but also includes other subjects ofvital human welfare, such as accident preven-tion, housing, labor legislation, and social in-surance in all its phases.”26
The 1920s were not always favorable forthis vision, as public attitudes and policies en-couraged business interests.27 The Bureau foundlittle opportunity to expand or improve itswork during this period,28 although it did ex-pand coverage of industry wage studies into20th century manufacturing industries and ex-panded into newly emerging compensationpractices, such as bonus systems and pay forovertime, Sunday, and holidays.29 Althoughsurveys were confined to manual jobs andlargely selected jobs in the manufacturing sec-tor, these surveys provided a reasonably con-sistent body of data on both the structure andtrend of wages for industrial workers.30
During this retrenchment period, the Bureauwas able to continue one of its oldest pro-grams, union scales of wages and hours oflabor, which dated back to the late nineteenthcentury. Data were collected for occupationsin five industries—bakeries, building trades,marble and stone trades, metal trades, and print-ing—for localities throughout the country. Asan example, wages and hours from 1913 to1925 in Chicago for several trades are summa-rized in table 1.31
The Bureau also undertook various studiesof workmen’s compensation, legal aid, and
social insurance programs, often in reactionto changes in the law. For example, followingthe passage of amendments to the Federal re-tirement system in 1926, the Bureau conducteda survey of 46 State and municipal pensionplans, publishing the results by 1929, alongwith information on public retirement systemsin Canada and Europe.32 The cost of benefits,however, was still a very small part of aworker’s compensation package, accountingfor less than three percent of the employer’scost for employee compensation.33
An early example of one of the Bureau’sstudies of retirement systems was data pub-lished on a retirement plan for employees ofthe State of New Jersey. This retirement sys-tem for these employees was created in March1921, with contributions starting in January1922 and pensions first being paid in July 1922.Membership was optional for current employ-ees but mandatory for all new employees. Con-tributions from the State and employees were“sufficient to secure upon retirement at age60 an annuity amounting to 1/140 of theirfinal average compensation for each year ofservice rendered.” For example, an employeeretiring after 35 years of service would be en-titled to an annuity valued at one-quarter (35X 1/140) of the final average compensation.Retirement was optional at age 60 and com-pulsory at 70.
In 1926, the Bureau conducted a compre-hensive study of workers’ compensation. Atthat time, all but five States had enacted work-ers’ compensation laws to protect workers fromlosses resulting from injuries on the job. Nearlyall these States had passed their initial legisla-tion by 1919 and had subsequently expandedthe scope of the acts, increased the amount ofbenefits, and reduced the amount of time be-fore receiving benefits.34 Benefits in theseStates35 covered fatal—as well as nonfatal—injuries and medical and surgical benefits. Inmost States, compensation benefits were basedon a percentage of average wages, ranging fromone-half of average wages in 16 States to two-thirds of average earnings in 12 States. Maxi-mum payments ranged from $3,000 to $7,800for death and from $3,000 to $10,000 forpermanent total disability.36
The Bureau also conducted another surveyin 1926,37 following up on an earlier survey ofthe existence of “industrial establishments of-fering insurance to their employees under the

69
group plan.”37 “After 1916, the amounts ofgroup insurance being written increased veryrapidly … In the earlier study only 32 of thecompanies had inaugurated a group insuranceplan, while in the present study 186 compa-nies with 672,468 employees were found tohave such a plan in effect.”38 “The earliergroup life insurance policies provided for pay-ment of a lump sum in case of death, theamount of the insurance usually ranging from$200 to $1,000 and frequently increasing witheach year of service.” In 1922-3, group acci-dent and sickness policies were first written asadded features of many group life-insurancepolicies and the “…contributory featuresbecame even more marked. In many estab-lishments the employer arranged for combi-nation group life, sickness and accident insur-ance, part of the premium to be paid for by theworker, while in other cases the employer paidfor the life insurance and the employee paidfor the sickness and accident insurance.”39 Theusual minimum life insurance benefit was $500,with many plans varying by an employee’sannual salary and length of service.410 Sicknessand accident insurance provided benefitsfor non-occupational injuries, usually “for periods of 13 weeks, 26 weeks, or occasion-ally 52 weeks,” with benefits being paid ac-cording to salary class.41
The Great Depression and the Federal rolein the economyThe Great Depression, a long and severeperiod of economic decline, affected theUnited States and the entire industrialized world.The American stock market declined by nearly90 percent from 1929 to 1932, ruining indi-vidual investors and financial institutions.Many banks and other businesses were forcedinto insolvency. The resultant sharp declinesin consumer demand and capital investmentled to greatly reduced levels of spending,production, and gross national product(GNP).
From an estimated annual rate of 3.3percent during 1923-29, the unemploymentrate rose to a peak of about 25 percent in1933. The economy reached its trough in1933; but although unemployment had reachedits peak, economic recovery was slow, hesi-tant, and far from complete. As shown below,the unemployment rate was still nearly 15percent in 1940: 43
Year Unemployment rate1923-29 3.31930 8.91931 15.91932 23.61933 24.91934 21.71935 20.11936 17.01937 14.31938 19.01939 17.21940 14.61941 9.91942 4.7
In March 1933, Franklin D. Roosevelt wasinaugurated President and initiated a series ofaggressive measures, collectively known as theNew Deal, in an attempt to revive theeconomy from the Depression. New Deal legis-lation brought unprecedented Federal Govern-ment involvement to the economy.
The Great Depression also resulted in theunprecedented involvement of the FederalGovernment in labor-management relations.The passage of the National Labor RelationsAct (Wagner Act) of 1935 guaranteed therights of workers to join labor unions and tobargain collectively with their employers. Theimpact of unionization on the wages and ben-efits of blue-collar workers in important manu-facturing industries also spilled over into non-union workerplaces and industries. Union mem-bership rates, which had been about 1 in 8workers in the early 1930s, doubled to morethan 1 in 4 workers in 1940:
Year Union membership rate44
1930 2.31935 13.81940 27.6
Industrial workers in the mass-productionindustries–steel, automobiles, rubber, and elec-trical equipment–were organized during thistime. In 1935, eight industrial unions formedthe Committee for Industrial Organizationwithin the American Federation of Labor(AFL), which was dominated by the craftunions. Three years later the CIO split com-pletely from the AFL and became a separateentity, the Congress of Industrial Organiza-tions (CIO).

70
In addition to becoming involved in labor-management relations, the Federal Govern-ment became involved in establishing wagestandards at this time. For example, the pas-sage of the Davis-Bacon Act of 1931 createdthe establishment of wage standards for workeremployed by contractors or subcontractorsemployed on construction projects financedby the Federal Government. A second piece oflegislation, the Walsh-Healey Act of 1936,established a prevailing wage for workers em-ployed by firms providing materials and sup-plies to the Federal Government. Finally, theFair Labor Standards Act of 1938 established aminimum wage ($.25 per hour)46 for mostworkers involved in producing goods for inter-state commerce.
The Great Depression also brought a differ-ent approach to viewing economic security.Americans became aware that individuals werenot always able to provide for their own secu-rity in a modern industrial society. Before1934, workers’ compensation was typicallythe only help available to workers.47 Workershad no protection against loss of income forany cause other than industrial accident, ex-cept their own savings, organized charity, andlocal relief agencies.48 Surprisingly, there waslittle support for social insurance programsother than workers’ compensation before1930. In 1931, for instance, a national AFLconvention refused to endorse unemploymentinsurance legislation.49
The roots of the New Deal had been plantedduring early debates about compulsory Stateinsurance and workers’ compensation.50 But itwasn’t until the devastating economic disasterof the 1930s that most Americans becameconvinced of the necessity of a permanentnational plan for coping with severe losses inincome.51 Subsequently, Congress passed theSocial Security Act of 1935, which providedtwo social insurance programs–a Federal sys-tem of old-age benefits for retired workers anda Federal-State system of unemployment in-surance. The Social Security Act also estab-lished a series of Federal grants to the Statesfor additional old-age assistance, aid to theblind, and aid to dependent children.52
In addition to providing compensation forlost income, the passage of the Social SecurityAct and the Wagner Act in 1935 signaled thebeginning of the concept of compensation asmore than just traditional straight-time pay
for time worked. Unions began to deviate sig-nificantly beyond the traditional scope of col-lective bargaining–wages, hours, and workingconditions–and began to negotiate compensa-tion packages that would give workers moreand better welfare plans than were provided bylegally required plans.53 Consequently, supple-ments to wage and salaries, including legallyrequired benefits and private health and wel-fare plans, although still accounting for lessthan that 4 percent of compensation costs in1939, had more than doubled in value in theprevious 10 years.
Between 1932 and the end of the decade,the Bureau’s wage survey activity was prima-rily geared to the information needs of thenew Federal agencies created by the New Deal;and the Bureau expanded, with a doubling ofstaff and budget between 1934 and 1941.55 Inplace of the periodic study of major industries,the Bureau studies of minimum wage and maxi-mum hour provisions were needed for indus-tries to meet the ‘‘codes of fair competition’’required by the National Industrial RecoveryAct (NIRA) of 1933. Major comprehensivestudies, including information on working con-ditions—as well as wages—covered a diverseset of industries and occupations.56 Several stud-ies were also undertaken in cooperation withthe Works Progress Administration (WPA),as well as surveys done in connection with theWalsh-Healey Act that covered work per-formed by Federal government contractors.57
Because of the need for data for minimumwage determinations under the Fair LaborStanards Act of 1938, which initially providedfor a minimum wage by industry, the Bureauconducted about 45 industry wage surveys dur-ing 1938 and 1939.58 Most of these studiesprovided data on the distribution of workers inlow-wage industries by straight-time hourlyearnings, without occupational detail.59
One example of the studies conducted byBLS for the NIRA was the survey in March1935 of the manufacture of cigarettes and to-bacco products industry.60 This survey cov-ered approximately 38,000 workers in 48plants. A summary of the article concerningthe survey found, “Most of the plants usedboth piece- and time-rate methods of wagepayments. A noteworthy improvement inweekly hours and payment of higher rates forovertime was found in 1935, as compared withthe situation existing prior to the National
71
Industrial Recovery Act.”61 Paid holidays andvacations were generally limited to salariedworkers, and pay for lost time due to sicknesswas rarely provided by a formal plan. Insur-ance benefits were limited. “A number of thecompanies, especially the large ones, hadwelfare programs covering one or more of suchmeasures as medical care, group insurance ofvarious kinds, thrift clubs, and lunch rooms.Approximately half of the employees were,by such programs, provided access to medicalservices beyond first-aid attention.”62
Another example is a survey conducted withthe WPA of the building construction industryin the fall of 1936 for information on pre-vailing wage rates. Information was gatheredfrom over 6,000 contractors involved in morethan 13,000 projects in 105 cities across thecountry.63 Average earnings for the 186,145workers were $.918 per hour. Earnings for elec-tricians, bricklayers, and structural ironwork-ers averaged more than $1.30 per hour. Labor-ers earned $.516 per hour. Earnings for unionworkers were significantly higher in compa-rable trades than for their nonunion counter-parts. For example, union electricians earnednearly 60 percent more per hour than theirnonunion counterparts.64
One of the rapidly growing benefits duringthe 1930s was paid vacations to employees.In 1937, a BLS survey of 90,000 firms foundthat approximately 95 percent of the 700,000salaried workers received annual vacations withpay, compared with 36.7 percent of the 9.5million wage earners.65
For salaried workers, most paid vacationplans were initiated between 1920 and 1930.Vacations were practically all for either a 1- or2-week period, with 2 weeks reported for 57percent and 1-week plans for 37 percent ofsalaried workers.66 The usual length of serviceto be eligible for a vacation was 1 year, re-ported for 80 percent of the plans. For gradu-ated plans, the 1-week minimum and 2-weekmaximum vacation was almost universal.67
For wage earners, survey results indicatedapproximately 70 percent of plants with apaid vacation plan for wage earners said theyinitiated it during the 1930-37 period; andabout 40 percent gave vacations for thefirst time in 1937.68 Wage earners were typi-cally eligible for a vacation after 1 year ofservice, although 40 percent required 2 years’;and 20 percent required 5 years’ or moreservice.69
World War II and the transition to a peace-time economyFollowing the bombing of Pearl Harbor in De-cember 1941 and the ensuing entry of theUnited States into World War II, the FederalGovernment mobilized its resources and thecountry’s industrial might. On January 6, 1942,President Roosevelt announced ambitious war-time production goals. In response, all thecountry’s economic sectors came under newor increased Government controls.
The Federal Government created a numberof agencies, such as the War Production Board(1942), the Office of War Mobilization (1943),and the Office of Price Administration (1942),to increase total production, reallocate pro-duction to military uses, and control wages andprices. Increases in military output were ob-tained, in part, by diverting resources fromcurrent uses, particularly for the production ofconsumer goods. Manufacture of consumeritems—such as automobiles, refrigerators, andhousing materials—was forbidden.
Controlling output proved easier than con-trolling wages. Inflationary pressures were cre-ated by the shortages of both goods and laborthat developed during World War II; subse-quently, the Consumer Price Index (CPI) in-creased by more than 35 percent at this time.Several attempts were made to create an ef-fective organization to control wages and limitwork stoppages. In 1941, President Rooseveltcreated, by executive order, the NationalDefense Mediation Board. The Board hadjurisdiction over cases referred to it by theSecretary of Labor and was given authority tosettle disputes by conciliation, voluntary arbi-tration, and public recommendations. How-ever, the Board ceased to be useful when theCIO members withdrew in November 1941.
The National War Labor Board was createdby President Roosevelt, by executive order onJanuary 12, 1942. The Board was establishedto determine procedures for settling disputesthat might affect war production. The Boardhad the options of offering mediation, volun-tary arbitration, and compulsory arbitrationto try to resolve controversies but had no powerto enforce its decisions. It was also authorizedto approve all wage increases, where the totalannual remuneration was below $5,000. TheBoard quickly adopted the so-called Little Steelformula for wartime wage changes, i.e., basedon a 15-percent rise in living costs from

72
January 1, 1941, to May 1, 1942. In September1942, the President was given the authority tostabilize wages and salaries, based on September15, 1942 levels.
As a result of wage restrictions, employ-erswho needed to attract labor resorted to pro-viding a growing range of fringe benefits, suchas pensions, medical insurance, and paid holi-days and vacations. These benefits were con-sidered non-inflationary, as they were not paidin cash and, thus, did not violate the wage ceil-ing. Additionally, payments for overtime af-forded extra income to workers, without vio-lating the limits on hourly wage payments.During the late 1940s, fringe benefits becamemore common as part of settlements reachedin collective bargaining.
On June 25, 1943, Congress passed the WarLabor Disputes (Smith-Connally) Act that au-thorized the President to take over plantsneeded for the war effort or in which war pro-duction had ceased because of a labor dispute.These sanctions were effective against man-agement but were not as effective against la-bor. Although strikes were prohibited duringthe War, they did occur.
1940 .......1941 .......1942 .......1943 .......1944 .......1945 .......1946 .......1947 .......1948 .......1949 .......
Despite efforts of the National War LaborBoard, the shortage of labor during WorldWar II caused sharp increases in wages. Aver-age hourly earnings of production and non-supervisory workers in manufacturing more thedoubled between 1940 and 1949, with the larg-est increases during the war years, 1940-44.Hours worked also rose during the War, withaverage weekly hours for production andnonsupervisory workers rising from 38.1 in1940 to a high of 45.2 in 1944. After the War,hours worked declined to 39.1 in 1949, slightly
above the average for 1940.After World War II, the Federal Govern-
ment continued to directly affect the welfareand economic conditions of the Americanworkforce. In 1946, Congress passed the Em-ployment Act, which committed the Federalgovernment to take all practical measures topromote maximum employment, production,and purchasing power. In 1949, Congressamended the Fair Labor Standards Act of 1938to directly prohibit child labor for the firsttime. Additionally, two Supreme Court cases(Inland Steel v. United Steelworkers of Americaand W.W. Cross & Co. v. N.L.R.B.) issued afterthe war, in effect, required employers to bar-gain over retirement and health insurance plans.
Meanwhile, the transition to a peacetimeeconomy was complicated by a number of prob-lems, including providing economic opportu-nity for both returning servicemen and thecurrent workforce. One priority was to assistreturning servicemen in getting housing andeducation; thus, the GI Bill, for example, guar-anteed loans for housing and education assis-tance. Another priority was to maintain in-dustrial peace while transitioning from a war-time economy to a peacetime economy. Thiswas difficult; labor unrest ensued, because ofpent up frustration and job losses.
During the immediate postwar period, con-sumer goods, which were not available duringthe War, became in great demand. People hadworked steadily during the war, often at over-time rates, and had money to spend. Demandfor consumer items such as automobiles washigh, so manufacturers had trouble filling or-ders. At the same time, union members, whosewages had been restrained during the war, de-manded increases in the immediate postwarperiod. The result was a wave of strikes pre-cisely when the public was anxious to see moreconsumer goods in stores and showrooms.
Congress reacted to the wave of strikes in1946-47 by passing, the Labor-ManagementRelations (Taft-Hartley) Act in 1947. Thisact was seen by its sponsors as a way to redressthe balance between labor and managementthat had been altered by the Wagner Act.Among its major provisions, the Taft-HartleyAct authorized Presidential injunctions againststrikes, if the national interest was involved;banned secondary boycotts and the closedshop; and allowed States to pass right-to-worklaws.
2,508 6,700 8,7174,288 23,000 10,2012,968 4,180 10,3803,752 13,500 10,2134,956 8,720 14,1464,750 38,000 14,3224,985 16,000 14,3953,695 34,600 14,7873,419 34,100 14,3193,606 50,500 14,282
Work Days of Union Year stoppages idleness members (thousands) (thousands)
Number of

73
The coming of World War II changed thestatistical needs of government, and BLS re-sponded by changing the focus of its pro-grams.7070707070 A cut in funding in 1947 also forcedthe Bureau to reexamine its wage program.
Prior to the War, the primary use of indus-try wage surveys was to monitor low-wage in-dustries. Data from these surveys were used todetermine minimum and prevailing wages re-quired by such laws as the National IndustrialRecovery Act of 1933, the Walsh-Healy Actof 1936, and the Fair Labor Standards Act of1938. After the beginning of World War II,the needs of Federal Government statisticalusers had shifted to the settlement of labordisputes and stabilization of pay rates. Thetypes of industries surveyed shifted from low-wage consumer goods industries to heavy manu-facturing industries vital to the War effort.Among the industries surveyed during this pe-riod were shipbuilding; aircraft; rubber; non-electrical machinery; and the mining, smelt-ing, and refining of nonferrous metals. TheNational War Labor Board became the mostimportant user of wage surveys. The Bureauprovided data on wage rates and straight-timeearnings by occupation, industry, and area, aswell as a general wage rate index, to measurethe effectiveness of the wage stabilization pro-gram. The Board used these data for decisionson claims for wage increases on inequitygrounds and for the settlement of disputes.
Because of the importance of organized la-bor in the national economy, the Bureau, in1948, first published its monthly Current WageDevelopments (CWD) reports, and its wagechronology series.71 The CWD reported on thewage adjustments that occurred in collectivebargaining situations. Besides identifying thecompany, union, and location of the bargain-ing unit, the report listed the amount of theadjustment; the effective date of the adjust-ment; the number of workers covered by theadjustment; and other related terms, such asinformation on vacations, paid holidays, andcompany payments to health and welfare funds.Wage chronologies were a series of reports onthe negotiated changes in wages and benefitsfor individual, key bargaining situations, suchas General Motors, United States Steel, TheBoeing Company, and the bituminous coal mineoperators. Although a wage chronology forany one bargaining situation was published onlyperiodically, it would summarize the bargain-
ing history between the company and theunion, detailing the wage and benefit changescoming from the parties’ various rounds ofnegotiations.
The Korean War to beyond the GreatSocietyThe 1950s and 1960s saw the Korean War,the Cold War, the race for space between theUnited States and the Soviet Union, the Viet-nam War, the New Frontier, and the GreatSociety. Television became a mainstay of fam-ily entertainment, there was a movement tothe suburbs, college education and home own-ership became common, and the civil rights’and women’s rights’ movements became pow-erful forces in society.
The decades of the 1950s and 1960s weregenerally periods of relative economic pros-perity, with growth in employment and realwages, although three recessions occurred(1954, 1958, and 1961). This period saw manyshifts in the economy, as the service sectorgrew relative to manufacturing; and employ-ment shifted among occupations, as a result ofthe shifts among industries. The percentage ofthe total number of employed persons whoworked in white-collar and service occupationsincreased during the period, while the percent-age employed in manual occupations and asfarm workers declined.
Another shift was that women became amore important factor in the workforce thanduring the postwar years. Women representedabout 29 percent of individuals in the laborforce in 1950 but had grown to more than 36percent by 1969.
Married women, in particular, remained inthe labor force in record numbers. By 1969,almost 40 percent were in the labor force, upfrom less than 25 percent 20 years earlier.While these rates were lower than for singlewomen, the difference in labor force participa-tion rates for married and single woman nar-rowed during this period.
Unemployment was relatively stable duringthe 1950s and 1960s, usually between 3 and4.5 percent. The rate did exceed 5 percentduring the recession years 1954, 1958, and1961 and during the years of recovery im-mediately following the downturns. Con-versely, unemployment was particularly lowbetween 1951-53 and 1966-69. These periodscoincided with undeclared wars in Korea and

74
Vietnam and saw large increases in defensespending and significant segments of the civil-ian labor force drawn into military service.
During this time, Federal legislation contin-ued to shape the American workplace: theSocial Security Act was amended to includeMedicare in 1965 and the FLSA was amendedin 1961 and 1966 to extended coverage tomillions of additional workers. In addition, theWelfare and Pension Plans Disclosure Act of1958, the Labor-Management Reporting andDisclosure (Landrum-Griffin) Act of 1959, theManpower Development and Training Act of1962, the Equal Employment Act of 1963,the Civil Rights Act of 1964, and the AgeDiscrimination Act of 1968 were passed byCongress. (See box on labor-related legislation.)
More than 20 years of internecine laborstrife ended in 1955, with the merger of theAmerican Federation of Labor and the Con-gress of Industrial Organizations to becomethe AFL-CIO. Unions in this merged organi-zation agreed to honor the existing agreementof other member unions and to refrain fromstealing members from one another. The neworganization claimed about 15 million mem-bers.
In the 1950s and 1960s, the Bureau ofLabor Statistics continued to gear its compen-sation surveys to the informational needs ofthe Federal Government, including the admin-istration of prevailing wage and minimum wagelaws. There also developed during this timeperiod, an interest in comparing Federal andnon-Federal compensation. This administra-tive need for data would shape many of theBureau’s compensation programs throughoutthe remainder of the 20th century. In con-junction with the need for data to administerFederal pay programs, the Bureau began toexpand its compensation studies to includefringe or supplementary benefits. These newsurveys would lay the groundwork for theBureau’s future benefit studies.72
The Bureau continued to publish its wagechronologies and Current Wage Developments.As an outgrowth of the wage development pro-gram, beginning in 1954, BLS published quar-terly and annual summaries of newly negoti-ated wage rate changes—medians and means,for the first year and over the life, of con-tracts for production workers in manufactur-ing and non-supervisory workers in serviceindustries.
By the mid-1960s, the Bureau developed
procedures for costing supplementary benefits.This enabled the publication of data for thetotal change in compensation for units of10,000 workers or more; and, in 1966, thepublication of such data on settlements cover-ing 5,000 or more workers. In 1968, theBureau developed its effective series—wagechanges in effect from settlements, cost-of-living adjustments, and deferred wage increases.
In the early 1950s, the Bureau also beganpublishing salary trends for selected groups ofgovernment employees. The first report wasfor white-collar workers for 1939-50, followedby city public school teachers for 1925-49 andfiremen and policemen for 1924-50. Thesestudies would provide BLS with the experienceand foundation for conducting future, morecomprehensive white-collar pay studies.
Also in the early 1950s, the Wage Stabiliza-tion Board (WSB) once again sought to con-trol wage increases during the Korean War.WSB budgetary support allowed BLS to con-duct a large number of labor market commu-nity wage studies for use in the Board’s deci-sions, with occupational coverage extended tojobs particular to major industries in each areasurveyed. Coupled with other BLS data, thesestudies provided the basis for a series of analy-ses of inter-area differences in wage levels,occupational wage differentials, fringe benefits,union density, and wage structure.
By the end of the 1950s, in response todemands for a cross-industry survey, BLS be-gan to expand the community wage surveys to80 metropolitan statistical areas that had beenselected to represent all such labor markets.This program expansion would allow theBureau to make estimates of the level and dis-tribution of wages for a large number of white-collar and manual jobs in all metropolitanareas. It also provided the basis for nationalestimates of scheduled hours of work, holidayand vacation provisions, the incidence ofprivate pension and insurance plans, and col-lective bargaining coverage. One reason forthis expansion was the Federal Government’sneed for national data on white-collar salariesin private industry to implement a compara-tive pay policy for Federal white-collar andpostal employees.
In response to the enactment of the ServiceContract Act (SCA) in 1965, area wage sur-veys were expanded in 1967 to include areasrequested by the Employment Standards Ad-ministration (ESA) for their administration of

75
the act. (The SCA requires employers to payprevailing wages and benefits to employeesperforming work on Federal service contracts.)
BLS also continued to produce occupationalwage studies on an industry basis but shiftedthe emphasis away from industry-wide surveysto surveys of major areas of industrial concen-tration. These annual studies covered wagesand related benefits in 25 manufacturing andnon-manufacturing industries.
During the 1950s, BLS conducted severalwage surveys for ESA for use in the agency’sappraisal of minimum wage action under theFair Labor Standards Act, and for a basis ofdecisions on minimum wage policy. The stud-ies continued into the 1960s, with minimumwage coverage being extended to several newindustries, including retail trade and service in-dustries.
The major changes in the composition ofcompensation that began in the 1940s forcedBLS to collect and analyze supplementary wagebenefits to make Bureau compensation datamore meaningful. After limited studies in theearly and mid-1950s, BLS began a program tomeasure these benefits. In 1951, for the firsttime, BLS captured the costs of supplemen-tary wage benefits in a wage study in the basiciron and steel industry. Data included directbenefits, such as pay for overtime and work onholidays and late shift, pay for holidays notworked and vacation, sick leave, severance pay,and non-production bonuses; and indirect ben-efits, including legally required ones and vol-untary insurance and retirement pension plans.Survey results were for production workers onlyand were expressed in terms of cents-per-man-hour.
In 1953, BLS conducted a feasibility studyof collecting employer expenditures on selectedsupplementary employee remuneration in themanufacturing industries. The Bureau collecteddata on seven items—paid vacations; paid holi-days; paid sick leave; premium pay for over-time; pension plans; insurance, health, andwelfare plans; and legally required payments.Three basic measures of employee expendi-tures were used—percent of payroll, cents perhour, and cents per hour worked.
In 1955, BLS began regularly publishing twonew reports—the “Digest of Selected PensionPlans” and the “Digest of Selected Healthand Insurance Plans.” Some of the planfeatures discussed in the pension plan digestincluded benefit formulas, normal retirement
requirements, early retirement requirement andreductions, and disability benefits. Some of theplan features in the health digest included lifeinsurance, accidental death, and dismember-ment benefits, sick leave, hospital benefits,maternity benefits, surgical and medicalbenefits, and major medical benefits.
In 1959, BLS published the Employer Ex-penditure for Selected Supplementary Remu-neration Practices for Production Workers inManufacturing Industries, 1959. This publi-cation ushered in a full scale, continuous pro-gram of compensation studies. Expendituresfor production workers in manufacturing werepublished for a select list of items—includingsome new or growing practices, such as supple-mentary unemployment benefits and civic andpersonal leave—and were measured as cents-per-hour paid for and per plant man-hour, aswell as one new measure—straight-time pay-roll. In 1960, a similar study was conducted inthe mining industry; in 1961, finance, insur-ance, and real estate were surveyed; and in1962, there was a study in manufacturing.
In 1963, another expansion of the programcame, when a special study was conducted atthe behest of the Federal government onsupplementary remuneration in private indus-try for Federal white-collar and postal em-ployees’ pay comparability purposes. The sur-vey marked a broadening of industry coverageto include manufacturing; transportation andutilities; trade; finance, real estate, and insur-ance; and a limited number of service indus-tries. Employee coverage was limited to cleri-cal, professional, administrative, and techni-cal employees.
Sparked by Federal pay comparability ques-tions, BLS conducted an initial survey of com-pensation expenditures for the entire privatenonfarm economy in 1966. This was the firstof surveys designed to study the entire privatenonfarm sector, selecting manufacturing andnon-manufacturing industries in alternate years.Surveys for the entire private nonfarm ec-onomy were produced in 1968, 1970, 1972,1974, and 1977. This program was droppedafter 1977, when the Bureau began collectingbenefit cost data in the Employment CostIndex.
Inflation, recession, and high unemploymentFor many, the 1970s was a decade of pessi-mism. It opened with of a recession in 1970and the painful ending of the Vietnam War.

76
Memories of the Great Depression made policymakers unwilling to use restrictive monetaryand fiscal policy to contain inflation, becauseit was felt that the associated increase in un-employment would be unacceptable.73 Instead,wage and price controls were introduced inAugust 1971.74 An oil embargo, in 1973,brought on by the Organization of the Petro-leum Exporting Countries (OPEC), led to rapidinflation and a recession; and there was an-other round of disruptions to the oil supplyin 1979.
Both the civilian unemployment rate andthe rate of change in consumer prices deterio-rated in the second half of the decade. Be-tween 1970-74, the average annual unemploy-ment rate was 5.4 percent, while the averageannual change in the Consumer Price Index(CPI) was 6.6 percent. From 1974-79, thefigures edged up to 7.9 percent for unemploy-ment and 8.1 percent for the CPI.
This decade was also marked by a number oflarge, highly publicized labor disputes. For ex-ample, in 1970, almost 210,000 postal em-ployees walked off their jobs—the first masswork stoppage in the history of the U.S. PostalService. In the same year, four railroad unionsconducted a 1-day nationwide railroad strike.In 1971, two longshore strikes closed allmajor ports on the East, Gulf, and West Coasts;West Coast longshore workers resumed theirstrike after an emergency dispute injunctiontemporarily halted the walkout. In 1975,80,000 employees of Pennsylvania conductedthe first legal strike by State workers. In 1977-78, miners conducted one of the longest strikes
in the coal industry. The decade ended with a10-day nationwide strike by 219,400 over-the-road and local truckers in April 1979.
Through the tumult, there was a continuedchange in the relative importance of benefitcosts as a percent of compensation, rising fromabout a fifth of total compensation in 1970 tomore than a quarter in 1986. Every measuredbenefit—the relatively small “supplementalpay’’excepted—increased as a share of thecompensation package.
During the 1970s, there were some impor-tant legislative and legal changes affecting com-pensation and workplace issues. Among themost important were the Employee Retire-ment Income Security Act of 1974 (ERISA)and the Revenue Act of 1978. ERISA regu-lated private pensions and imposed financialand accounting controls where pensions ex-isted. ERISA also established the Pension Ben-efit Guaranty Corporation, to ensure that work-ers would be paid their vested pension benefits,if their pension plans were terminated. TheRevenue Act encouraged flexible benefit plans,and created the 401(k) defined contributionretirement savings plan. It also allowed em-ployees to make elective pre-tax contributionsto a variety of savings vehicles, such as saving,profit sharing, and employee stock ownershipplans. In retrospect, these laws were extremelyimportant, as they contributed to the changein the share of compensation accounted for bypensions and other retirement benefits.
Other important legislation that affectedactive and retired workers without necessarilyaffecting compensation directly included theOccupational Safety and Health Act of 1970,which authorized the Secretary of Labor toestablish occupational safety and health stand-ards in the workplace; the ComprehensiveEmployment Training Act of 1973, whichconsolidated and decentralized Federal em-ployment programs and provided funds toState and local governments who sponsoredemployment services; and the 1974 amend-ment to the Social Security Act, which pro-vides automatic cost-of-living adjustments,based on the Bureau’s Consumer Price Index.
Implementation of wage and price controlsshowed a need for a comprehensive measureof labor cost changes that was not affected byfactors such as changes in overtime hours orshifts in employment among industries andoccupations.75 As a result, the EmploymentCost Index (ECI) was born. The ECI was de-signed to:
NOTE: Data for 1966-77 were obtained from theEmployers Expenditures for Employee Compensa-tion survey and related to the average for the entireyear. Data for the other years are from the EmployerCosts for Employee Compensation survey andrelate to March. While the data from the two surveysare not entirely comparable, they are similar.
80.4 79.8 74.8 73.0 19.6 20.2 25.2 27.0 5.9 6.2 6.9 8.0 3.8 3.1 3.1 2.3 2.0 2.6 4.0 5.5
5.2 5.0 4.3 3.8 2.6 3.3 4.3 6.4
0.1 - - 0.1
100.0 100.0
Compensation 1966 1970 1977 1986component
Total compensationWages and salariesTotal benefitsPaid leveSupplement payInsuranceRetirement and
savingLegally requiredOther benefits
100.0 100.0
77
· Be a timely and comprehensive measurecovering all elements of employee compensa-tion (wages, salaries, and benefit costs) and allemployees in the U.S. civilian economy.
· Be a fixed-weight index free from the influ-ence of employment shifts among occupations,industries, and establishments with differentwage and compensation levels.
· Include internally consistent subseries (forexample, occupational and industry groups)that describe the forces contributing to aggre-gate wage and compensation change.
The ECI, first published for the period Sep-tember-December 1975, initially covered wageand salary changes for the private nonfarmeconomy. Changes for broad occupational andindustrial groups, as well as changes by unionstatus, geographic region, and area size werealso presented. Although only a few new ECIseries were added in the latter half of the 1970s,work was done to make possible publication ofindexes for benefit costs and total compensa-tion and to include State and local governmentworkers.
In 1973, the General Accounting Office(GAO) had issued a report on the Bureau’swhite-collar pay survey—the Professional, Ad-ministrative, Technical, and Clerical survey(PATC)—emphasizing the need to expand thecoverage of the survey. In the mid-1970s, theBureau took action on GAO recommendationsto improve the PATC survey, by expandingoccupational coverage from 72 occupationalwork levels in 1975 to 100 in 1982. Duringthe 1970s, BLS also developed a comprehen-sive training program, instituted a new qualitymeasurement program, and conducted addi-tional research to review and improve occupa-tional definitions used in the survey.
In the late 1970s, at the request of the U.S.Civil Service Commission (now the Office ofPersonnel Management), the Bureau begangathering data on employee benefit plan pro-visions. The program, first called the Level ofBenefits survey (LOB) and then the EmployeeBenefits Survey (EBS), was designed to pro-vide information necessary for the Federal paycomparability process established by the Fed-eral Reform Act of 1962 and later by the Fed-eral Pay Comparability Act of 1970. Combin-ing the LOB data with white-collar pay datawas designed to help the Office of PersonalManagement compare compensation of
Federal and private sector employees.In 1979, a test survey was conducted in con-
junction with the Bureau’s collection of white-collar salary data that had the same industryand size-of-establishment restrictions. The testcollected data for full-time workers on planprovisions and participation for six paid leaveitems, including sick, holiday, and vacation pay;health, life, and disability insurance; and pen-sion plans.
During the 1970s, the Bureau continued toenhance its Industry Wage (IWS), Area Wage(AWS), and Service Contract Act (SCA) sur-veys—the latter to help ESA administer theSCA. The Bureau produced about 50 manufac-turing and 20 nonmanufacturing industry wagesurveys on a regularly recurring basic, and, in1972, improved its AWS surveys by publishingindexes that used matched establishments. TheSCA surveys, essentially the same as AWS sur-veys—except they were funded by the Em-ployment Standards Administration (ESA) tofulfill its responsibilities under the Service Con-tract Act—were expanded from 65 in 1974 to150 in 1977.
During the mid- to late-1970s, the Bureaualso conducted surveys of industries and occu-pations that were exempt from FLSA mini-mum wage and overtime coverage. The ESAused survey results as part of a process to de-termine whether or not to continue these ex-emptions.
Reflecting a need for programmatic im-provements in its major collective bargainingsettlements program, the Bureau made a num-ber of changes in the data elements it collectedand published for that program series. BLSbegan publishing a separate series for the con-struction industry, covering settlements for1,000 workers or more. This new series pro-vided two types of data on wage-benefitchanges. One showed the annual rates of sched-uled increases over the life of the agreement;the other showed the first-year increase. An-other enhancement in the program came in1974, with publication of quarterly effectivewage adjustments. Additionally, in 1979, a bi-annual series showing changes in the cost ofbargaining settlements covering 5,000 work-ers or more in State and local governmentswas introduced.
An economy in transitionThe 1980s began on an uncertain note, withworries about the country’s ability to compete

78
in world markets and fears that high inflationrates would never end.76 From 1980-82, theunemployment rate jumped from 7.1 to 9.7percent but then dropped from year to year,to 5.3 percent in 1989. The 1982-83 reces-sion, however, did seem to curb inflation, asthe Consumer Price Index dropped from anannual change of 13.3 percent in 1979 to 3.8percent in 1982. By 1984, the economy hadrebounded, and there ensued a long period ofsustained growth. Millions of new jobs werecreated, and there was a resurgence of Ameri-can confidence.
During this decade, a number of forcesworked to limit the influence of labor unions.Foreign competition grew in industries whereunionism historically has been strong—espe-cially the automobile and steel industries.77
Additionally, employment growth had occurredin sectors—such as in services—where unionshad typically not been dominant. As a resultof these and other factors, trade union mem-bership in the United States declined sharplyas a share of employment:
Year Total membership Union (thousands) density 1980 22,377 24.7 1985 16,996 18.0 1990 16,740 16.1
The trend toward benefits accounting fora higher proportion of compensation costscontinued, though at a slower pace than ear-lier. The slowdown in the growth of benefitsas a proportion of compensation can be at-tributed primarily to health insurance and em-ployers retirement costs. Over-the-year in-creases in health costs peaked at 23.5 percentin March 1983, dropped to 3.5 percent in June1985, then rose to about 13 percent in 1989.Employers introduced a number of cost con-tainment arrangements, including shifting moreof health insurance cost to their employees.
The decline in the relative importance ofretirement costs reflects the shift from de-fined benefit to defined contribution plans anda rising stock market that enabled employersto meet their defined benefit obligations withsmaller outlays than before.
The Bureau’s compensation program wasinfluenced by these changes occurring in com-pensations plans, particularly the growing depth
and breath of, and public interest in, data re-lating to benefit plans. Additionally, budgetcuts in the late 1970s and early 1980s led totough decisions regarding which BLS programshad to be scaled back or eliminated. The crite-rion increasingly used by Congress during thistime when deciding what surveys to fund waswhether the survey was of broad national in-terest.
BLS already had extensive experience in sur-veying and publishing wage data; but, by 1975,the Bureau realized that it also needed to cap-ture and publish benefit information, particu-larly benefit costs, to produce total compen-sation cost measures. This initiative presentedthe Bureau with the challenges of identifying,measuring, and publishing benefit cost dataevery quarter, while continuing to publishtimely, high-quality wage data.
To realize its objectives, BLS enhanced theECI program. In 1980, rates of change in ben-efits costs were published for the first time forthe private nonfarm economy and for a se-lected number of subseries. In 1981, wage andbenefit indexes for State and local governmentswere added, as well as indexes for the combinedprivate nonfarm and State and local govern-ment workforces.
In the mid-1980s, for example, Congressprovided the Bureau additional funds to ex-pand the ECI sample of establishments, in or-der to increase the number of series published,particularly in the service sector. As a result ofthis initiative, a new series was published forhealth services, including hospitals, that re-flected the growing national interest in infor-mation about health care costs and their po-tential inflationary effects. At the same time,however, major cuts were made in the IWS andAWS programs, with the surviving surveystargeting major metropolitan areas and indus-tries of special interest, such as temporary helpsupply companies.
Partly as a result of the ECI sample expan-sion, it was determined in 1987 that it waspossible to begin publishing estimates ofcompensation cost levels—the employer costper hour worked for employee compensationand its components—from data collectedfor the ECI.78 This new data source, calledEmployer Costs for Employee Comp-ensation (ECEC), replaced the EmployerExpenditures for Employee Compensa-tion that was abolished after its 1977 survey.

79
The 1990s and the New EconomyDuring the 1990s, the resurgence in Americanconfidence begun in the 1980s continued.Except for a mild recession in 1990-91, theeconomy expanded continuously through the1990s. By the end of the decade, there werelarge budget surpluses. Over this decade, em-ployment in the private sector grew by morethan 20 million, to about 110 million. Thelargest employment gains occurred in retailtrade (especially eating and drinking places)and the service industry (especially businessand health services).
The unemployment rate declined steadilyafter 1992; but, surprisingly, there was no re-surgence of inflation, as had occurred in otherperiods of sustained growth. The unemploy-ment was at a 30-year low in 1999. Despitethis growing tightness in the labor market, theinflation rate, too, declined, from 6.1 percentin 1990 to 1.6 percent in 1998. The CPI in-creased 3.4 percent in 2000, the highest since1990, but still low given the unemploymentrate.
One of the explanations given for the lowrate of price increases was moderation in wagegains. Production workers’ average hourly earn-ings increased 3.5 percent in 1990 and only2.1 percent in 1992. Wage increases were inthe 2.6- to 2.9-percent range during 1993-95and in the 3.8- to 4.2-percent range during1996-2000. Despite the relatively low rate ofwage increases during the 1990s, real averageearnings rose slightly, because prices increasedeven less.
During the first half of the decade, benefitcosts rose faster than wages and salaries, but inthe second half that relationship was reversed.This pattern largely reflected what was hap-pening to employer costs for health insurance.The net effect of these changes was to returnthe structure of compensation in 2000 to aboutwhat it was in 1990. Dominant features ofcompensation in the 1990s were pay for per-formance and other forms of flexibility in whatworkers were paid.79 At this time, pay reflectedstock options, profit sharing, choices amongbenefits, and individual awards.
The decade saw several changes in theBureau’s core compensation programs to meeta broad set of administrative and program-matic needs, to capture changes in compensa-tion practices, and to adjust to resource con-straints. Most importantly, during this time,
the Bureau began planning and implementingthe development of a comprehensive, inte-grated compensation program, the NationalCompensation Survey.
A major change in the Bureau’s wage surveyprogram came with passage by Congress of theFederal Employees Pay Comparability Act of1990 (FEPCA), which changed the pay-com-parability process by creating a combinationof national and local pay adjustments80
The FEPCA provided that Federal white-collar worker pay include a national adjust-ment (based on the ECI) and a locality adjust-ment. The latter required creation of a local-ity-based system to replace the single GeneralSchedule that largely disregarded locality paydifferences found in the private sector. ThePresident’s Pay Agent81 was given primaryresponsibility for administering FEPCA, andFEPCA named the Bureau of Labor Statisticsas the agency to conduct surveys for use indetermining locality pay levels.
In the early 1990s, the Bureau combined itsexisting occupational wage surveys by area andindustry—AWS, PATC, IWS, and SCA—intoa single survey, the Occupational Compensa-tion Survey (OCS), to fulfill its part in imple-menting FEPCA.82 Given the tight budgetaryenvironment and various needs of users ofthese existing surveys, it was decided to pursuethree goals: Provide data required by FEPCA,continue to provide as much of the traditionaldata as possible, and streamline and cut backon the overall cost of collecting occupationalwage data. The end result was development ofa single survey that retained as many of thefeatures of existing programs as possible.
After several years of collecting locality paydata in OCS, it became clear that, to gain maxi-mum efficiencies, BLS would have to furthercoordinate the collection and processing ofcompensation data—that is, combine the OCSand ECI, ECEC, and EBS surveys. What werethe driving forces that led the Bureau to adoptthis umbrella approach to compensation? Ineffect, changing Federal pay requirements al-ready had resulted in the integration of theAWS and PATC estimates for white-collar oc-cupations and work levels. Also, health re-form initiatives in 1993 pointed to the needfor further integration of the Bureau’s com-pensation program. While BLS produced sub-stantial data on employers’ health care costsand employees’ health care costs, these data
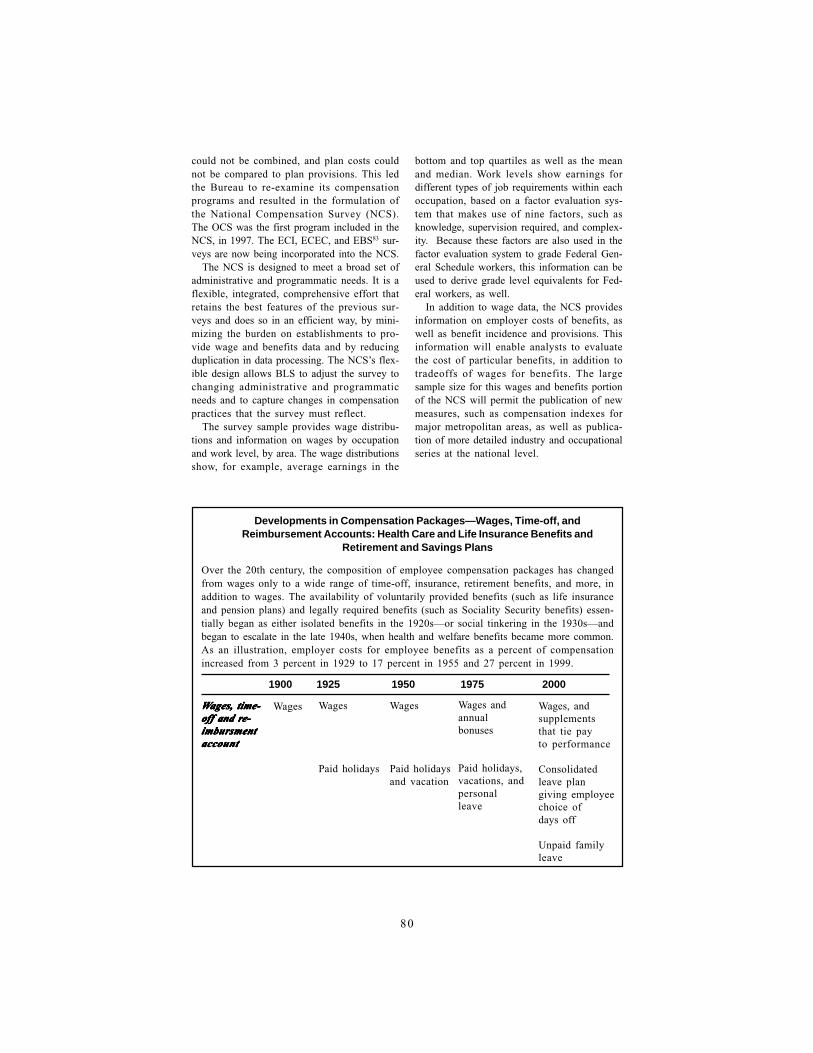
80
could not be combined, and plan costs couldnot be compared to plan provisions. This ledthe Bureau to re-examine its compensationprograms and resulted in the formulation ofthe National Compensation Survey (NCS).The OCS was the first program included in theNCS, in 1997. The ECI, ECEC, and EBS83 sur-veys are now being incorporated into the NCS.
The NCS is designed to meet a broad set ofadministrative and programmatic needs. It is aflexible, integrated, comprehensive effort thatretains the best features of the previous sur-veys and does so in an efficient way, by mini-mizing the burden on establishments to pro-vide wage and benefits data and by reducingduplication in data processing. The NCS’s flex-ible design allows BLS to adjust the survey tochanging administrative and programmaticneeds and to capture changes in compensationpractices that the survey must reflect.
The survey sample provides wage distribu-tions and information on wages by occupationand work level, by area. The wage distributionsshow, for example, average earnings in the
bottom and top quartiles as well as the meanand median. Work levels show earnings fordifferent types of job requirements within eachoccupation, based on a factor evaluation sys-tem that makes use of nine factors, such asknowledge, supervision required, and complex-ity. Because these factors are also used in thefactor evaluation system to grade Federal Gen-eral Schedule workers, this information can beused to derive grade level equivalents for Fed-eral workers, as well.
In addition to wage data, the NCS providesinformation on employer costs of benefits, aswell as benefit incidence and provisions. Thisinformation will enable analysts to evaluatethe cost of particular benefits, in addition totradeoffs of wages for benefits. The largesample size for this wages and benefits portionof the NCS will permit the publication of newmeasures, such as compensation indexes formajor metropolitan areas, as well as publica-tion of more detailed industry and occupationalseries at the national level.
Over the 20th century, the composition of employee compensation packages has changedfrom wages only to a wide range of time-off, insurance, retirement benefits, and more, inaddition to wages. The availability of voluntarily provided benefits (such as life insuranceand pension plans) and legally required benefits (such as Sociality Security benefits) essen-tially began as either isolated benefits in the 1920s—or social tinkering in the 1930s—andbegan to escalate in the late 1940s, when health and welfare benefits became more common.As an illustration, employer costs for employee benefits as a percent of compensationincreased from 3 percent in 1929 to 17 percent in 1955 and 27 percent in 1999.
Developments in Compensation Packages—Wages, Time-off, andReimbursement Accounts: Health Care and Life Insurance Benefits and
Retirement and Savings Plans
Wages, andsupplementsthat tie payto performance
Consolidatedleave plangiving employeechoice ofdays off
Unpaid familyleave
1900 1925 1950 1975 2000
WWWWWages, time-ages, time-ages, time-ages, time-ages, time-off and re-off and re-off and re-off and re-off and re-imbursmentimbursmentimbursmentimbursmentimbursmentaccountaccountaccountaccountaccount
Wages Wages
Paid holidays
Wages
Paid holidaysand vacation
Wages andannualbonuses
Paid holidays,vacations, andpersonalleave

81
Developments in Compensation Packages—Wages, Time-off, andReimbursement Accounts: Health Care and Life Insurance Benefits and
Retirement and Savings Plans—Continued
Reimbursementaccount forchild careexpenses
Choice ofmedicalplans includingHealthMaintenanceOrganizations(HMOs)
Choice ofdental,vision, andprescripationdrug plans
Medicare andretiree healthinsurance
1900 1925 1950 1975 2000
Health careHealth careHealth careHealth careHealth careand lifeand lifeand lifeand lifeand lifeinsuranceinsuranceinsuranceinsuranceinsurancebenefitsbenefitsbenefitsbenefitsbenefits
Basicmedical planplus majormedicalthroughcommercialinsurer
Dental plan
Medicare
Lifeinsurancevarying withearnings;paid sick
Basicmedical planthrough BlueCross-BlueShield
Fixed amountlife insuranceand weeklydisabilitybenefit
Social Securitybenefitsavailable atage 65
Companydoctor
Benevolentassociationdeath anddisabilitybenefits
Retirement andRetirement andRetirement andRetirement andRetirement andsavings planssavings planssavings planssavings planssavings plans
SocialSecuritybenefitsavailable atage 65, withreducedbenefits atage 62
Definedbenefitpension
SocialSecurity fullbenefitsavailable atage 67, withreducedbenefits atage 62, forworkers bornin 1960 orlater
Combinationof pensionsand 401(K)savings plans
Choice of lifeinsuranceamounts;paid sickleave
82
Future trends in employee compensation“Truth in our ideas means their power to work.”
— William James
How will employee compensation programsevolve during the 21st century? Predictingdevelopments in this field is difficult for manyof the same reasons that making economicpredictions is difficult. We live in a vibranteconomy that routinely outpaces our abilityto understand it fully and in a world whereoutside factors often change a system beforewe can model it precisely.
Like the economy as a whole, the compen-sation field is affected by forces working inopposite directions. Employers seek to curblabor costs to remain competitive in supply-ing goods and services, but at the same timemay need to upgrade compensation programsto attract and retain skilled workers. Addi-tionally, an aging population, by placing in-creased demands on employer health care andretirement plans, may prompt employers toadopt cost containment measures. At the sametime, however, a small supply of young work-ers may prompt employers to enhance com-pensation packages to compete for qualifiedstaff.
These opposing forces will challenge effortsto maintain correct and relevant statistics oncompensation in this new century. The volun-tary nature of most data collection relies onthe cooperation of employers and especiallyhuman resource professionals. As these indi-viduals face the difficult task of developingcompetitive compensation packages while lim-iting costs, their ability to comply with re-quests for detailed data may be strained.
Three major trends characterized employeecompensation in the last years of the 20thcentury, and these trends will probably shapeemployee compensation in the early years ofthe new century. As with the last century, how-ever, it is unlikely that the ways employeesare compensated will evolve along a straightpath. Companies and governments will trymany alternative programs; some will workand become the paradigms of the 21st cen-tury; others will not and will be discarded orwill be adopted in only a few workplaces.
Aligning pay to organizational goalsAligning pay to organizational goalsAligning pay to organizational goalsAligning pay to organizational goalsAligning pay to organizational goals. . . . . The firstof these three major compensation trends isaligning pay to organizational goals. As ourNation’s economy becomes increasingly tied
to world economic conditions, competitivepressures will prompt employers to seek waysto efficiently use their workforces. Employeecompensation, in this environment, will in-creasingly be viewed as a tool for promotingincreased productivity and innovation amongworkers. Compensation programs are, thus,likely to be geared to employee performanceor desired characteristics such as skills or knowl-edge. Examples of these compensation pro-grams include variable pay schemes that tiepay to individual or group performance andsalary plans that reflect the possession or ac-quisition of knowledge or skills deemed criticalto the success of the organization. Compensa-tion in the 21st century is also likely to evolvein ways that tie employee pay and benefits tocorporate performance. Examples includestock options and profit-sharing plans.
TTTTTailoring compensation to employee needsailoring compensation to employee needsailoring compensation to employee needsailoring compensation to employee needsailoring compensation to employee needs.....The second major trend is tailoring compen-sation to employee needs. This is a way ofefficiently delivering compensation to employ-ees by giving them a choice in what they wantor need, rather than providing a universal pro-gram that meets the needs of the averageemployee. Examples include choices amonghealth care and within retirement savings plans,flexible work schedules and telecommuting ar-rangements, and reimbursement accounts. Im-plicit in this flexibility is the increase of em-ployee responsibility in making prudentchoices. On the other hand, this flexibilitymay be constrained, particularly if significantnumbers of employees make poor choices.Social-policy concerns about the consequencesof unwise choices, however, are less likely tostymie—than to shape—the evolution of thisflexibility.
Reconfiguring employee benefit plansReconfiguring employee benefit plansReconfiguring employee benefit plansReconfiguring employee benefit plansReconfiguring employee benefit plans. . . . . Thethird major trend is reconfiguring employeebenefit plans to provide for a defined level ofemployer contributions, rather than a definedlevel of ultimate benefit. This has been thetrend in retirement plans over the 1980s and1990s and may spread to other types of em-ployee benefits plans. Examples include de-fined contribution employee health insuranceplans, defined contribution retiree health in-surance plans, and employer-funded reimburse-ment accounts. These arrangements give em-ployers greater control over costs than in thepast and greater ability to predict costs. Onthe other hand, employees are required to

83
absorb more risks associated with insuringagainst future events than formerly. Coupledwith the trend to charge employees with moreresponsibility for retirement savings and otherbenefits, the move towards defined contribu-tion insurance arrangements may spur counter-measures to insulate employees from theserisks. For example, a defined contributionhealth insurance plan might be required to in-clude a core set of benefits that guards em-ployees against catastrophic expenses.
In the 1990s these three major com-pensation trends were seen as helping to meetthe needs of a mobile workforce. With theexpected labor shortages of the early years ofthe new century, however, these trends arelikely to be tempered in ways thought to in-crease employee incentives for remaining withthe organization. Employer drives to increaseefficiency and curb costs may have to bebalanced with one of the traditional goals ofcompensation programs–to acquire and main-tain an adequate supply of skilled labor.
Capturing and reporting data that adequatelyilluminate these major trends will be a chal-lenge for the Bureau of Labor Statistics andothers. The movement toward compensationthat is based more on individualperformance—
and, thus, less standard—will require more datacollection and innovative means of reportingresults. No longer can pay be captured andreported as an hourly rate; all manner of paysuch as individual bonuses, group bonuses,gainsharing, and stock options might need tobe included in the new concept of pay.
The trend toward greater employee choicein compensation has already posed data col-lection and tabulation challenges; expansionof such choices will only compound the chal-lenges. For example, where once employersoffered only one health insurance plan, theoften present choice of several plans meansmore data must be collected. And employeechoice to substitute one benefit for anothermakes it more difficult to identify how muchof a benefit cost is paid by the employerversus the employee. Additionally, flexibilityin work hours (called flextime or flexitime)and work location (telecommuting or some-times flexplace) make the traditional conceptof compensation per hour less meaningful thanbefore. Just as the 20th century saw an evolu-tion in compensation statistics to addresschanges in the law and the growth of benefits,it is likely that statistics at the close of the 21stcentury will little resemble data available today.
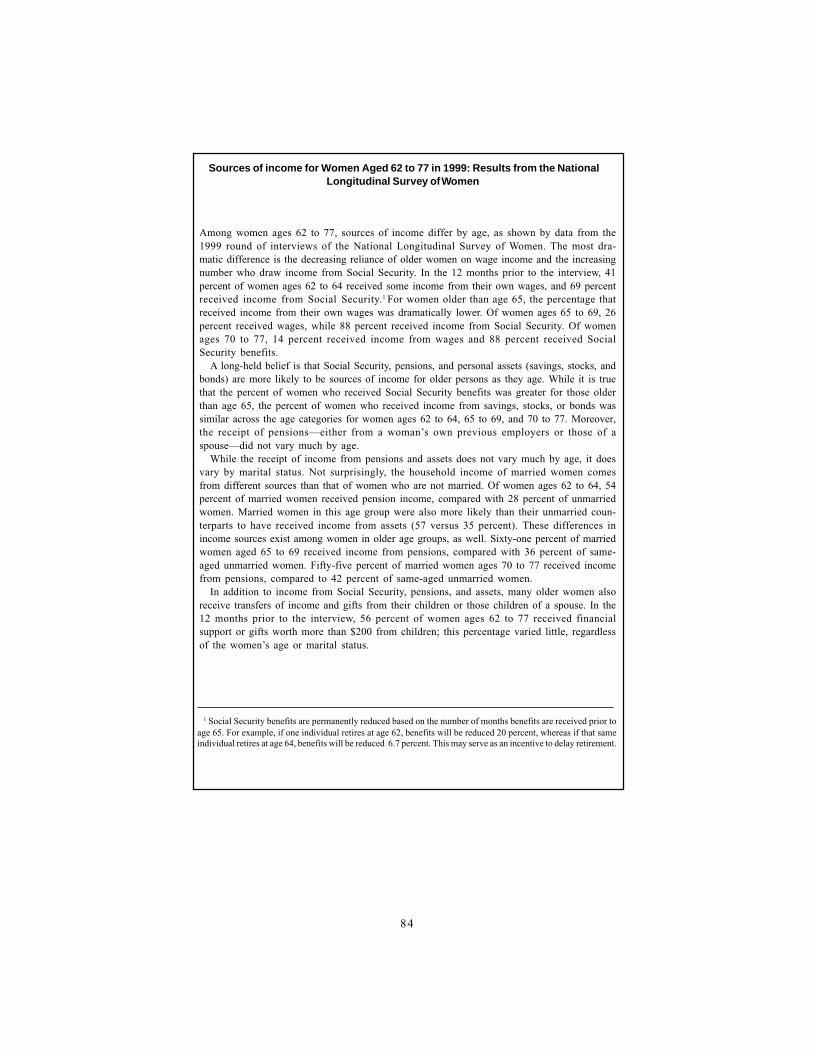
84
Sources of income for Women Aged 62 to 77 in 1999: Results from the NationalLongitudinal Survey of Women
Among women ages 62 to 77, sources of income differ by age, as shown by data from the1999 round of interviews of the National Longitudinal Survey of Women. The most dra-matic difference is the decreasing reliance of older women on wage income and the increasingnumber who draw income from Social Security. In the 12 months prior to the interview, 41percent of women ages 62 to 64 received some income from their own wages, and 69 percentreceived income from Social Security.1 For women older than age 65, the percentage thatreceived income from their own wages was dramatically lower. Of women ages 65 to 69, 26percent received wages, while 88 percent received income from Social Security. Of womenages 70 to 77, 14 percent received income from wages and 88 percent received SocialSecurity benefits.
A long-held belief is that Social Security, pensions, and personal assets (savings, stocks, andbonds) are more likely to be sources of income for older persons as they age. While it is truethat the percent of women who received Social Security benefits was greater for those olderthan age 65, the percent of women who received income from savings, stocks, or bonds wassimilar across the age categories for women ages 62 to 64, 65 to 69, and 70 to 77. Moreover,the receipt of pensions—either from a woman’s own previous employers or those of aspouse—did not vary much by age.
While the receipt of income from pensions and assets does not vary much by age, it doesvary by marital status. Not surprisingly, the household income of married women comesfrom different sources than that of women who are not married. Of women ages 62 to 64, 54percent of married women received pension income, compared with 28 percent of unmarriedwomen. Married women in this age group were also more likely than their unmarried coun-terparts to have received income from assets (57 versus 35 percent). These differences inincome sources exist among women in older age groups, as well. Sixty-one percent of marriedwomen aged 65 to 69 received income from pensions, compared with 36 percent of same-aged unmarried women. Fifty-five percent of married women ages 70 to 77 received incomefrom pensions, compared to 42 percent of same-aged unmarried women.
In addition to income from Social Security, pensions, and assets, many older women alsoreceive transfers of income and gifts from their children or those children of a spouse. In the12 months prior to the interview, 56 percent of women ages 62 to 77 received financialsupport or gifts worth more than $200 from children; this percentage varied little, regardlessof the women’s age or marital status.
1 Social Security benefits are permanently reduced based on the number of months benefits are received prior toage 65. For example, if one individual retires at age 62, benefits will be reduced 20 percent, whereas if that sameindividual retires at age 64, benefits will be reduced 6.7 percent. This may serve as an incentive to delay retirement.

85
Percent of older women ages 62 to 77 in 1999 who received income from variousPercent of older women ages 62 to 77 in 1999 who received income from variousPercent of older women ages 62 to 77 in 1999 who received income from variousPercent of older women ages 62 to 77 in 1999 who received income from variousPercent of older women ages 62 to 77 in 1999 who received income from varioussources in the 12 months prior to interview, by age and marital statussources in the 12 months prior to interview, by age and marital statussources in the 12 months prior to interview, by age and marital statussources in the 12 months prior to interview, by age and marital statussources in the 12 months prior to interview, by age and marital status
Age and sources of income
Total, age 62 to 77Own wages, salaries, tips and commissions 23.1 22.2 24.3
Spouse wages 24.5 24.5 —Social Security 84.1 87.6 79.8Pensions 48.2 56.5 38.1Savings, stocks, bonds, trusts, estates 47.4 52.5 41.2Government assistance 15.1 12.6 18.1Intrafamily transfers 56.0 57.0 54.7
Ages 62 to 64Own wages, salaries, tips and commissions, 40.6 36.3 47.6Spouse wages 33.8 33.8 —Social Security 69.1 76.7 56.3Pensions 44.0 53.4 28.0Savings, stocks, bonds, trusts, estates 49.0 57.0 35.2Government assistance 18.8 16.9 22.1Intrafamily transfers 57.0 57.6 55.9
Ages 65 to 69Own wages, salaries, tips and commissions 26.3 23.8 30.1Spouse wages 27.2 27.2 —Social Security 87.6 91.6 81.8Pensions 51.1 60.6 36.1Savings, stocks, bonds, trusts, estates 46.3 52.0 37.2Government assistance 14.6 11.5 19.5Intrafamily transfers 57.2 57.0 57.5
Ages 70 to 74Own wages, salaries, tips and commissions+B62 15.6 15.0 16.2Spouse wages 19.2 19.2 —Social Security 86.9 89.7 84.3Pensions 48.2 55.4 41.3Savings, stocks, bonds, trusts, estates 46.8 50.5 43.2Government Assistance 14.5 12.0 16.9Intrafamily Transfers 53.3 56.1 50.6
Ages 75 to 77Own wages, salaries, tips and commissions 11.2 9.6 12.5Spouse wages 12.4 12.4 —Social Security 89.9 91.0 88.9Pensions 47.4 53.5 42.8Savings, stocks, bonds, trusts, estates 49.0 50.4 47.9Government assistance 12.7 9.1 15.3Intrafamily transfers 58.5 57.9 58.9
Individuals living with a partner, as if married, are not included.
Marital status
Total Married Non-married

86
Table 2-1. Union scales of wages and hours of specified occupations, Chicago, 1913-25
Bricklayer .................................. 44 $.750 44 $1.250 44 $1,500Painter ....................................... 44 .650 44 1.250 44 1,500Plumber ..................................... 44 .750 44 1.250 44 1,205Stonecutter ................................ 44 .625 44 1.250 44 1,375Typesetter1 ................................ 48 .500 48 .988 44 1,191
1In the newspaper industry.
1913Hours
per week
1913Earningsper hour
1920Hours
per week
1920Earningsper hour
1925Hours
per week
1925Earningsper year
Table 2-2. Composition of compensation costs in selected years, private industry workers
Compensation component 1977 1986 1990
Total compensation ........................................ 100.0 100.0 100.0Wages and salaries ....................................... 74.8 73.0 72.4Total benefits ................................................. 25.2 27.0 27.6
Paid leave ............................................... 6.9 7.0 6.9Supplemental pay .................................... 3.1 2.3 2.5Insurance ................................................ 4.0 5.5 6.1Retirement and savings ........................... 4.3 3.8 3.0Legally required benefits ......................... 6.9 8.4 9.0Other benefits ......................................... - .1 -
NOTE: Data for 1977 were obtained from the Employers Expenditures for Employee Compensationsurvey and related to the average for the entire year. Data for the other years are from the EmployerCosts for Employee Compensation Survey and relate to March. While the data from the two surveysare not entirely comparable, they are similar.
Occupation

87
Table 2-3. Percent changes in the Employment Cost Index for compensation and its components,December 1989-99
1989-94 ....................................................... 20.7 17.4 29.61994-99 ....................................................... 7.1 18.8 12.9
DecemberCompensation
costsWages and
salariesBenefitcosts
Table 2-4. Composition of compensation costs in selected years, private industry workers
Compensation component 1990 1995 2000
Total compensation .......................... 100.0 100.0 100.0
Wages and salaries ...................................... 72.4 71.6 73.0Total benefits ................................................ 27.6 28.4 27.0
Paid leave .............................................. 6.9 6.4 6.4Supplemental pay ................................... 2.5 2.8 3.0Insurance ............................................... 6.1 6.7 6.0Retirement and savings .......................... 3.0 3.0 3.0Legally required benefits ........................ 9.0 9.3 8.4Other benefits ........................................ - .2 .2
88
Bauman, Alvin, “Measuring employee com-pensation in U.S. industry,’’ Monthly La-bor eview, October 1970, pp.17-24
Block, Joseph W., “Regional wage differen-tials:1907-46,” Monthly Labor Review,
April 1948, pp. 371-77.Buckley, John and Elizabeth Dietz, “The Oc-
cupational Compensation Survey: A Ret-rospective,” Compensation and Work ingConditions, fall 1997, pp. 0-44.
Carter, Susan B. and Richard Sutch, “Mythof the Industrial Scrap Heap: A RevisionistView of Turn-of-the-Century American
Retirement,” Historical Paper 73 (Cam-bridge, MA, National Bureau of EconomicResearch, 1995).
De Long, J. Bradford, America’s Only Peace-time Inflation: The 1970’s (Berkeley, CA,University of California and National Bu-reau of Economic Research, 1995).
Douty, H. M., “A century of wage statistics:the BLS contribution,” Monthly Labor Re-view, November 1984, pp. 16-28.
Dow Jones and Company, on the Internet ath t t p : / / w w wh t t p : / / w w wh t t p : / / w w wh t t p : / / w w wh t t p : / / w w w. d o w j o n e s . c o m / c o r p /. d o w j o n e s . c o m / c o r p /. d o w j o n e s . c o m / c o r p /. d o w j o n e s . c o m / c o r p /. d o w j o n e s . c o m / c o r p /index.htmlindex.htmlindex.htmlindex.htmlindex.html (visited October 31, 2000).
Duncan, Joseph W. and William C. Shelton,Revolution in United States GovernmentStatistics, 1926-76 (Washington, U.S. Gov-ernment Printing office, 1978).
Dunlop, John T. and Walter Galenson, eds.,Labor in the Twentieth Century (New York,Academic Press, 1978).
Drudi, Dino, “A Century-Long Quest forMeaningful and Accurate Occupational In-jury and Illness Statistics, Compensationand Working Conditions, winter 1997, pp.1927.
Encyclopedia Britannica, on the Internet at(visited November 6, 2000).
Fishback, Price V. and Shawn Everett Kantor,“The Adoption of Workers’ Compensa-tion in the United States, 1900-1930,”Working Paper 5840 (Cambridge, MA,National Bureau of Economic Research,1996).
Fishback, Price V. and Shawn Everette Kantor,“A Prelude to the Welfare State: Compul-sory State Insurance and Workers’ Com-pensation in Minnesota, Ohio, and Wash-ington, 1911-1919,” NBER Working Pa-per Series on Historical Factors in Long-run Growth, Historical Paper No. 64 (Cam-bridge, MA, National Bureau of EconomicResearch, 1994), pp. 2-23.
References
Floyd, Norris and Bockelmann, Christine, TheNew York Times Century of Business (NewYork, McGraw-Hill, 1999).
Frazer, Edward K., “Earnings of Negroes inthe Iron and Steel Industry,” Monthly La-bor Review, March 1937, pp. 564-79.
Goldberg, Joseph P. and William T. Moye, TheFirst Hundred Years of the Bureau of La-bor Statistics (Washington, U.S. Govern-ment Printing Office, September 1985).
Hicks, J. R., The Theory of Wages, 2nd ed.(London, MacMillian and Co. Ltd., 1963).
Historical Statistics of the United States Colo-nial Times to 1957 (Census Bureau, 1960).
Historical Statistics of the UnitedStates,Colonial Times to 1970 (Census Bu-reau, 1975).
Important Events in American Labor History(U.S. Department of Labor, 1978).
Industrial Accident Statistics, Bulletin 157 (Bu-reau of Labor Statistics, March 1915).
Jones, Frances, “Personnel Policies and Work-ing Conditions in the Manufacture of Ciga-rettes and Tobacco,” Monthly Labor Re-view, February 1937, pp. 319-40.
Jones, Frances and Dorothy Smith, “Extentof vacations with pay in industry, 1937,”Monthly Labor Review, August 1938, pp.269-74.
Jones, Frances and Dorothy Smith, “Charac-teristics of paid-vacation plans,” MonthlyLabor Review, December 1938, pp. 1225-38.
Levitan, Sar A. and Frank Gallo, “Work andfamily: the impact of legislation,” MonthlyLabor Review, March 1990, pp. 34-40.
Meisenheimer II, Joseph R. and William J.Wiatrowski, “Flexible benefits plans: em-ployees who have a choice,” Monthly La-bor Review, December 1989, pp. 17-23.
Milkovich, George T. and Jennifer Stevens,“Back to the Future: A Century of Com-pensation,” Working Paper 99-08 (Ithaca,NY, Cornell University Center for Ad-vanced Human Resources Studies, July1999), pp. 1-21.
Nathan, Felicia, “Analyzing employers’ costfor wages, salaries, and benefits,” MonthlyLabor Review, October 1987, pp. 3-11.
Norwood, Janet L., “Measuring the cost andincidence of employee benefits,” MonthlyLabor Review, August 1988, pp. 3-8.
Ober, Henry, “Occupational Wage Differen-tials, 1907-47,” Monthly Labor Review,August 1948, pp. 127-34.....

89
Peterson, John M. and Ralph Gray, EconomicDevelopment of the United States(Homewood, IL, Richard D. Irwin, Inc.,1969).
Poth, Robert, American Economic History(Hinsdale, IL, Dryden Press, 1982).
Primack, Martin L. and James F. Willis, Eco-nomic History of the United StatesCummings Publishing Company, 1980).
Reich, Robert B., The Work of Nations (NewYork, Vintage Books, 1992).
Robertson, Ross M., History of the AmericanEconomy (New York, Harcourt BraceJovanovich, Inc., 1973).
Norman J. Samuels, “Developing a general wageindex,” Monthly Labor Review, March1971, pp. 3-8.
Schwenk, Albert, “Trends in the DifferencesBetween Union and Nonunion Workers inPay Using the Employment Cost Index,”Compensation and Working Conditions,September 1996, pp. 27-33.
Social Security Administration, “HistoricalDevelopment,” on the Internet atwwwwwwwwwwwwwww.ssa.gov/histor.ssa.gov/histor.ssa.gov/histor.ssa.gov/histor.ssa.gov/history y y y y (visited October30,2000).
Statistical Abstract of the United States: 1999(Census Bureau, 2000).
U.S. Bureau of Labor, Nineteenth AnnualReport of the Commissioner of Labor:Wages and Hours of Labor (Washington,
U.S. Government Printing Office, 1905).U.S. Bureau of Labor, Report on Conditions of
Employment in the Iron and Steel Industryin the United States, in 4 Volumes (Wash-ington, U.S. Government Printing Office,1913).
U.S. Bureau of Labor, Twenty-third AnnualReport of the Commissioner of Labor:Workmen’s Insurance and Benefit Fundsin the United States Washington, U.S
Government Printing Office, 1909).Weinstein, Harriet and Elizabeth Dietz, “To-
wards a Working Definition of Compensa-tion,” Compensation and Working Condi-tions, June 1996, pp. 3-9.
Wiatrowski, William J., “Counting the Inci-dence of Employee Benefits,” Compensa-tion and Working Conditions, June 1996,pp. 10-18.
Wiatrowski, William J., “Family-related ben-efits in the workplace,” Monthly LaborReview, March 1990, pp. 28-33.
Wiatrowski, William J., “Tracking Changes inBenefit Costs,” Compensation and Work-ing Conditions, spring 1999, pp. 32-37.
Woodbury, Stephen A., “Substitution BetweenWage and Nonwage Benefits,” The Ameri-can Economic Review, March 1983, pp.166-82.
Wright, Chester W., Economic History of theUnited States (New York, McGraw-HillBook Company, 1941).

90
1 See John T. Dunlop and Walter Galenson,eds., Labor in the Twentieth Century (New York,Academic Press, 1978), table 1.26.
2 “Some aspects of health insurance,” MonthlyLabor Review, May 1917, pp. 746-51.
3 Unemployment had fallen 9.9 percent in1941 to 1.2 percent in 1944. See HistoricalStatistics of the United States, Colonial Timesto 1957, Series D46-47 (Bureau of the Census,1960). See also Dunlop and Galenson, table 1.25.4 See Statistical Abstract of the United States,1998 (Washington, U.S. Department of Com-merce, 1998), table 654.
5 Hourly costs of compensation were obtainedfrom “Employer Costs for Employee Com-pensation,” USDL 00-186 (Bureau of LaborStatistics, June 29, 2000), available on theInternet at f tp:/ /146.142.4.23/pub/news.f tp:/ /146.142.4.23/pub/news.f tp:/ /146.142.4.23/pub/news.f tp:/ /146.142.4.23/pub/news.f tp:/ /146.142.4.23/pub/news.news.release/History/ecec.292000.newsnews.release/History/ecec.292000.newsnews.release/History/ecec.292000.newsnews.release/History/ecec.292000.newsnews.release/History/ecec.292000.news (vis-ited June 14, 2001).
6 The NIPA measure of supplements to wagesand salaries does not correspond exactly tothe Bureau of Labor Statistics definition ofbenefits. For instance, the BLS Employer Costsfor Employee Compensation series defines abroader scope of payments as benefits, includ-ing supplemental pay for overtime and shiftdifferentials and paid leave for such items asholiday, sick, and vacation leave. These samepayments are included among NIPA’s wage andsalary estimates.
7 Martin L. Primack and James F. Willis, AnEconomic History of the United States (MenloPark, CA, Benjamin/Cummings PublishingCompany, 1980), pp. 298-300. (An estab-lishment is a single physical plant location.)
8 See Primack and Willis, p. 282.9 See George T. Milkovich and Jennifer
Stevens, “Back to the Future: A Century ofCompensation,” Working Paper 99-08 (Ithaca,NY, Cornell University Center for AdvancedHuman Resource Studies, July 1999), p.6.
10 There is some disagreement with the viewthat, during the early 20th century, malesworked until they died (that is, they had noopportunity for voluntary leisure after yearsof remunerative labor). A study showed thatmore than a fifth of males employed at latemiddle age left employment before their death.
See Susan B. Carter and Richard Sutch, “Mythof the Industrial Scrap Heap: A RevisionistView of Turn-of-the-Century American Re-tirement,” Historical Paper 73 (Cambridge,MA, National Bureau of Economic Research,1995), p. 1.
11 See Price V. Fishback and Shawn EverettKantor, “A Prelude to the Welfare State: Com-pulsory State Insurance and Workers’ Com-pensation in Minnesota, Ohio, and Washing-ton, 1911-1919,” NBER Working Paper Se-ries on Historical Factors in Long-run Growth,Historical Paper 64 (Cambridge, MA, NationalBureau of Economic Research, 1994), pp. 2-23.
12 See Dunlop and Galenson, p. 30.13 U.S. Bureau of Labor, Nineteenth Annual
Report of the Commissioner of Labor: Wagesand Hours of Labor (Washington, U.S. Gov-ernment Printing Office, 1905), p. 18.
14 U.S. Bureau of Labor, Twenty-third AnnualReport of the Commissioner of Labor:Workmen’s Insurance and Benefit Funds inthe United States (Washington, U.S. Govern-ment Printing Office, 1909), pp. 17-19.
15 See John M. Peterson and Ralph Gray, Eco-nomic Development of the United States(Homewood, IL, Richard D. Irwin, Inc., 1969),p. 357.
16 See Robert B. Reich, The Work of Nations(New York, Vintage Books, 1992), p. 39.
17 See Peterson and Gray, p. 358.18 See Reich, p. 40.19 See Dunlop and Galenson, p. 32.20 See Dunlop and Galenson, p. 29.21 See Dunlop and Galenson, p. 47.22 Joseph P. Goldberg and William T. Moye,
The First Hundred Years of the Bureau of La-bor Statistics, Bulletin 2235 (Bureau of LaborStatistics, September 1985), p. 71.
23 H.M. Douty, “A century of wage statistics:the BLS contribution,” Monthly Labor Review,November 1984, p. 20.
24 See Goldberg and Moye, p. 71.25 See Goldberg and Moye, p. 107.26 “The Work of the United States Bureau of
Labor Statistics,” Monthly Labor Review, De-cember 1927, p. 1.
27 See Goldberg and Moye, p. 114.
Endnotes
91
28 See Goldberg and Moye, p. 120.29 See Goldberg and Moye, p. 124.30 See Douty, p. 20.31 “Changes in Union Scale of Wages and Hours
of Labor, 1913 to 1925,” Monthly Labor Re-view, September 1925, pp. 54-76.
32 See Goldberg and Moye, p. 133.33 Employee Benefits (Washington, U.S. De-
partment of Commerce, 1997), p. 41.34 “Workmen’s Compensation Legislation as
of July 1, 1926,” Monthly Labor Review, March1927, p. 55.
35 Fatal injuries were not covered in Okla-homa where a constitutional barrier of com-pensation for death was held to exist.
36 See “Workmen’s Compensation,” p. 55.37 “Group Insurance Experience of Various
Establishments,” Monthly Labor Review, June1927, pp. 76-86.
38 A group insurance plan is a contract typi-cally made with an employer and an insurancecompany to cover a group of employees. Pre-miums are typically based on the group’s claimexperience. Group insurance plans were firstdeveloped for life insurance and disability in-surance.
39 See “Group Insurance,” p. 76.40 See “Group Insurance,” pp. 78-79.41 Ibid., pp. 80-81.42 Ibid., p. 82.43 See Dunlop and Galenson, p. 27.44 See Peterson and Gray, p. 401.45 See Dunlop and Galenson, p. 31.46 See Dunlop and Galenson, p. 79.47 Workers’ compensation laws were enacted
in all but four States—Florida, South Carolina,Arkansas, and Mississippi. See Price V. Fishbackand Shawn E. Kantor, “The Adoption of Work-ers’ Compensation in the United States, 1900-1930,” Working Paper 5840 (Cambridge, MA,National Bureau of Economic Research, No-vember 1996), p. 49.
48 Ross M. Robertson, History of the Ameri-can Economy (New York, Harcourt BraceJovanovich, Inc., 1973), p. 676.
49 See Robertson, p. 677.50 See Fishback and Kantor, “A Prelude to the
Welfare State,” p. 32.51 See Robertson, p. 677.52 See “Historical Development,” Social Se-
curity Online (Washington, U.S. Social Secu-rity Administration) on the Internet atwww.ssa.gov/history/brief.hwww.ssa.gov/history/brief.hwww.ssa.gov/history/brief.hwww.ssa.gov/history/brief.hwww.ssa.gov/history/brief.h.....tmltmltmltmltml (visited June24, 2001).
53 Alvin Bauman, “Measuring employee com-pensation in U.S. industry,” Monthly Labor
Review, October 1970, p. 19.54 See Bauman, p. 19.55 See Goldberg and Moye, p. 170.56 See Goldberg and Moye, p. 160.57 See Douty, p. 20.58 See Goldberg and Moye, p. 160.59 See Douty, p. 20.60 Frances Jones, “Personnel Policies and
Working Conditions in the Manufacture ofCigarettes and Tobacco,” Monthly Labor Re-view, February 1937, pp. 319-40.
61 See Jones, p. 319.62 See Jones, p. 320.63 Edward P. Sanford, “Wage rates and hours
of labor in the building trades,” Monthly LaborReview, August 1937, pp. 281-93.
64 See Sanford, p. 284.65 Frances Jones and Dorothy Smith, “Extent
of vacations with pay in industry, 1937,”Monthly Labor Review, August 1938, pp. 269-74.
66 Frances Jones and Dorothy Smith, “Char-acteristics of paid-vacation plans,” MonthlyLabor Review, December 1938, pp. 1225-38.
67 See Jones and Smith, “Characteristics ofpaid-vacation plans,” p. 1235.
68 See Jones and Smith, “Characteristics ofpaid-vacation plans,” p. 1274.
69 See Jones and Smith, “Characteristics ofpaid-vacation plans,” p. 1225.
70 See Douty, pp. 16-28; and Bauman, pp. 17-24.
71 Section 211 of the Taft-Hartley Act au-thorizes the Bureau to collect various collec-tive bargaining data, including union contractdata. The CWD is the predecessor to the Com-pensation and Working Conditions publication,which still exists today.
72 See Douty, pp. 22-23; Bauman, pp. 17-24;and Allan P. Blostin, “An Overview of theEBS and the NCS,” Compensation and Work-ing Conditions, spring 1999, pp. 2-3.
73 See J. Bradford De Long, “America’s OnlyPeacetime Inflation: the 1970’s” (Cambridge,MA, National Bureau of Economic Researchand University of California at Berkeley,1995).
74 There were other parts to the economicpackage, including a 90-day freeze on wageand price increases and elimination of gold-dollar convertibility.
75 Norman J. Samuels, “Developing a generalwage index,” Monthly Labor Review, March1971, pp. 3-8.
76 Floyd Norris, Christine Bockelmann, andPaul A. Vocker, The New York Times Century

92
of Business (New York, McGraw-Hill, 1999),p. 253.
77 See, for example, Albert E. Schwenk,“Trends in the Differences Between Unionand Nonunion Workers in Pay Using the Em-ployment Cost Index,” Compensation andWorking Conditions, September 1996, pp. 27-33.
78 Felicia Nathan, “Analyzing employers’costs for wages, salaries, and benefits,” MonthlyLabor Review, October 1987, pp. 3-11.
79 See Milkovich and Stevens, p. 6.80 See Public Law 101-509, Nov. 5, 1990.81 The President’s Pay Agent consists of the
Secretary of Labor, the Director of the Officeof Management and Budget, and the Directorof the Office of Personnel Management.
82 A more detailed description of OCS is pro-vided in John Buckley and Elizabeth Dietz,“The Occupational Compensation Survey: ARetrospective,” Compensation and WorkingConditions, Fall 1997, pp. 40-46.
83 Beginning in 1990, EBS, ECI, and ECECdata were collected from the same set of estab-lishments using consistent definitions.
84 Social Security benefits are permanentlyreduced based on the number of months thatbenefits are received prior to age 65. For ex-ample, if one individual retires at age 62, ben-efits will be reduced 20 percent, whereas if thatsame individual retires at age 64, benefits willbe reduced 6-2/3 percent. This may serve as anincentive to delay retirement.
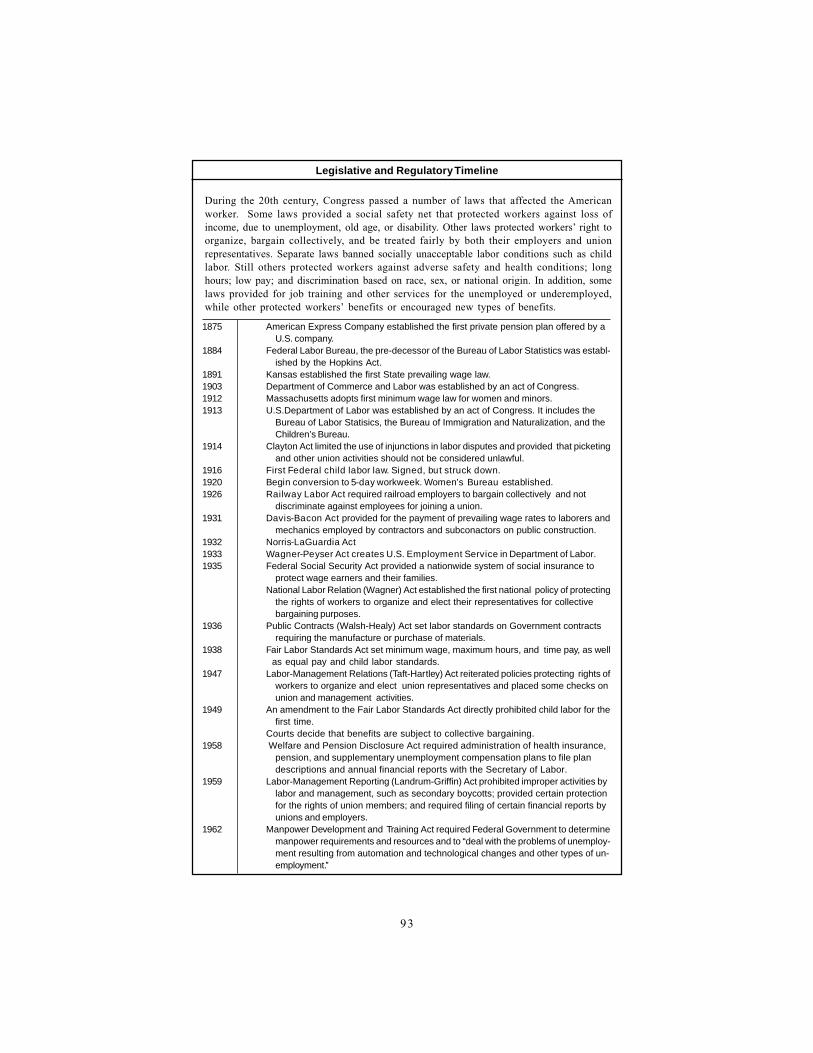
93
1875 American Express Company established the first private pension plan offered by aU.S. company.
1884 Federal Labor Bureau, the pre-decessor of the Bureau of Labor Statistics was establ-ished by the Hopkins Act.
1891 Kansas established the first State prevailing wage law.1903 Department of Commerce and Labor was established by an act of Congress.1912 Massachusetts adopts first minimum wage law for women and minors.1913 U.S.Department of Labor was established by an act of Congress. It includes the
Bureau of Labor Statisics, the Bureau of Immigration and Naturalization, and theChildren’s Bureau.
1914 Clayton Act limited the use of injunctions in labor disputes and provided that picketingand other union activities should not be considered unlawful.
1916 First Federal child labor law. Signed, but struck down.1920 Begin conversion to 5-day workweek. Women’s Bureau established.1926 Railway Labor Act required railroad employers to bargain collectively and not
discriminate against employees for joining a union.1931 Davis-Bacon Act provided for the payment of prevailing wage rates to laborers and
mechanics employed by contractors and subconactors on public construction.1932 Norris-LaGuardia Act1933 Wagner-Peyser Act creates U.S. Employment Service in Department of Labor.1935 Federal Social Security Act provided a nationwide system of social insurance to
protect wage earners and their families.National Labor Relation (Wagner) Act established the first national policy of protecting
the rights of workers to organize and elect their representatives for collectivebargaining purposes.
1936 Public Contracts (Walsh-Healy) Act set labor standards on Government contractsrequiring the manufacture or purchase of materials.
1938 Fair Labor Standards Act set minimum wage, maximum hours, and time pay, as wellas equal pay and child labor standards.
1947 Labor-Management Relations (Taft-Hartley) Act reiterated policies protecting rights ofworkers to organize and elect union representatives and placed some checks onunion and management activities.
1949 An amendment to the Fair Labor Standards Act directly prohibited child labor for thefirst time.
Courts decide that benefits are subject to collective bargaining.1958 Welfare and Pension Disclosure Act required administration of health insurance,
pension, and supplementary unemployment compensation plans to file plandescriptions and annual financial reports with the Secretary of Labor.
1959 Labor-Management Reporting (Landrum-Griffin) Act prohibited improper activities bylabor and management, such as secondary boycotts; provided certain protectionfor the rights of union members; and required filing of certain financial reports byunions and employers.
1962 Manpower Development and Training Act required Federal Government to determinemanpower requirements and resources and to “deal with the problems of unemploy-ment resulting from automation and technological changes and other types of un-employment.’’
Legislative and Regulatory Timeline
During the 20th century, Congress passed a number of laws that affected the Americanworker. Some laws provided a social safety net that protected workers against loss ofincome, due to unemployment, old age, or disability. Other laws protected workers’ right toorganize, bargain collectively, and be treated fairly by both their employers and unionrepresentatives. Separate laws banned socially unacceptable labor conditions such as childlabor. Still others protected workers against adverse safety and health conditions; longhours; low pay; and discrimination based on race, sex, or national origin. In addition, somelaws provided for job training and other services for the unemployed or underemployed,while other protected workers’ benefits or encouraged new types of benefits.

94
1963 Equal Pay Act prohibited wage differentials based on sex for workers covered by theFair Labor Standards Act.
1964 Title VII of the Civil Rights Act established U.S. Equal Employment OpportunityCommission to enforce Federal statutes prohibiting employment discrimination.
1965 Medicare established under Social Security.McNamara-O’Hara Service Contract Act provided wage standards for employees
performing work on Federal service contract.1968 Age Discrimination in Employment Act made it illegal to discharge, refuse to hire, or
otherwise discriminate against persons ages 40 to 65.1969 Federal Coal Mine Health and Safety Act protected the health and safety of the
Nation’s coal miners.1970 Occupational Safety and Health Act (OSHA) placed certain duties on employers and
employees to assure safe and healthful working conditions.1974 Employer Retirement Income Security Act (ERISA) imposed standards on employer-
provided benefit plans. Act was designed to protect the security of pensionpromises made by private sector firms.
1978 Pregnancy Discrimination Act required employee benefit programs to treat pregnancyin the same way as illnesses.
Revenue Act of 1978 permitted employers to create 401(k) plans.1982 Job Training Partnership Act (JPTA) prepared youths and adults facing serious barriers
to employment by providing job training and other services that would result inincreased earnings, increased education and occupational skills, and decreasedwelfare dependency.
1985 Consolidated Omnibus Budget Reconciliation Act (COBRA) required employers thatprovide health care benefits to continue such benefits to formerly-covered individualsfor a period of time after employer coverage ends.
1986 Strengthening of Age Discrimination in Employment Act.Tax Reform Act included provisions designed to simplify employer pension plan
administration.1989 Worker Adjustment and Retraining Notification Act provided protection to workers,
their families and communities, by requiring employers to provide notification 60calendar days in advance of plant closings and mass layoffs.
1990 Americans with Disabilities Act (ADA) established a clear and comprehensive prohib-tion of discrimination on the basis of disability.
1993 Family and Medical Leave Act mandated employers to provide unpaid time off forworker and family medical purposes.
1998 Workforce Investment Act1999 Ticket to Work and Work Incentives Act
Legislative and Regulatory Timeline—Continued

95
The 20th century encompassed enormouschange in the structure of the U.S.
economy. Two World Wars and the Koreanand Viet Nam conflicts, combined with theGreat Depression, OPEC oil embargoes, majorstructural changes in the global economy, andrevolutionary computer technologies, all il-lustrate the importance of understanding howsuch shocks have affected our economy andwill continue to affect it in the coming de-cades.
At the same time, the 20th century wit-nessed the evolution of the Federal statisticalsystem. Methodological innovations, such assampling theory, national income accounting,and the incorporation of computer technol-ogy, all improved the quality and timeliness ofspecific statistics.1 In addition, the develop-ment of standardized classification systemsprovided more consistency across data sys-tems. Classification systems create an orderthat demonstrates relationships and facilitatesanalysis.
In the statistical world, the availability of auniversal classification system facilitates com-parisons of findings across data collection ef-forts. At an even more basic level, classifica-tion systems are necessary to translate micro-data into tables and charts that can be under-stood by data users.
Clearly, statisticians and economists needto work from a common base of classification,both for industries and for occupations. In adynamic economy, any classification systemmust, of necessity, be a work in progress, con-tinually balancing the need for a current andaccurate description of the economy with theneed for consistent time series data.
The purpose of this chapter is to presentthe evolution of classification systems in usein this country over the past 100 years forboth industry and occupational data collectionefforts. It would make for a better story if wecould point to specific technological develop-ments, such as the invention of the telephone
or the semiconductor as the impetuses forchange.2 The fact is, however, that our econ-omy has evolved as much in response to so-cial, political, and economic factors, such aswars and depressions, as it has to specific tech-nological innovations. That evolution hasbeen taking place steadily over all of the past100 years, and would require a lengthy volumeindeed to spell out all the factors of changethat have been involved. Our hope here is togive an outline of the factors leading to sev-eral key developments in U.S. economic tax-onomy and, finally, to look to the future withsome ideas of how our current classificationsystems will serve us in the coming decades.
Industry ClassificationIndustry-based data collection began in 1810with the institution of the Census of Manufac-
Chapter 3
Economic Change and Structuresof Classification
In This Chapter—
Industry Classification ..................... 95 The Standard Industrial Classification system ................... 97 The North American Industry Classification System ................... 99Occupational Classifications ........... 101 Purpose and value ........................... 101 Why classify occupations? ............ 102 The early census approach ............ 105 The revised census approach era ... 105 A period of transition .................... 106 Response of the classification system to new products, tech- nologies, and other changes ........ 107 The Occupational Employment Survey ............................................ 109 Patterns of change in the OES and SOC occupational classification systems .................. 110Future Directions .............................. 111
Page

96
tures.3 Agriculture, mining, and fisheries cen-suses followed in 1840, and the Census of Gov-ernments began in 1850. Data were collectedby a number of agencies, among them the U.S.Treasury Department and the U.S. Depart-ment of State.
The censuses carried out in 1810, 1820,and 1840 provided little more than the grossoutlines of manufacturing development. Thereasons are many, and include the fact that theFederal marshals who supervised the field op-erations also had other duties, and often wereunable to devote the necessary time and atten-tion to the censuses given into their charge.The marshals’ assistants, the actual censusenumerators, often were given only verysketchy direction or none at all, and may havehad difficulty eliciting answers to the morecomplex economic questions embodied in thebusiness censuses.
The marshals had the responsibility forcompiling and classifying the data gathered intheir jurisdiction. This decentralization intro-duced some irregularities in the reported infor-mation because the marshals were not trainedstatisticians, and they often used divergentprocedures in carrying out their census duties.To add to the difficulties, many of the entre-preneurs of the day believed that the govern-ment should play a minimal role in economicaffairs, and were suspicious and uncooperativewhen asked to provide information about theirbusiness to Federal agents. In many other cases,the enumerators were faced with businesses thatmaintained little or no ongoing record of theiroperations, and whose owners or managers werethus unable to answer the detailed queries withany more than the sketchiest estimates.
Industry classifications were very rough andready during the first three manufacturing cen-sus efforts. The classification, such as it was,reflected a primarily demand- or market-ori-ented approach, which lumped more or lesssubstitutable products into loose industry group-ings. As a result of the inaccuracies of thesefirst censuses, Congress established the CensusBoard, precursor to today’s Census Bureau, onMarch 3, 1849. The Census Board oversawthe collection of data from establishments(once again by Federal marshals’ deputies) andcarried out the compilation in Washington witha cadre of trained clerks supervised by statisti-cians. Data items were classified by industrybased on the product that the respondent saidwas produced at the establishment in largestquantity, essentially leaving the question of
classification up to the respondents themselves.Early critics of the Census Board’s indus-
try-based data collection programs noted that,because of the lack of focus on industry classi-fication, not enough information was collectedto adequately estimate total production of spe-cific commodities across the economy. In 1925,analyst Laurence F. Schmeckebier describedproblems in classifying information on the fla-voring extract industry.4 Results of the 1921Census of Manufactures showed the output ofthis industry to be $33,060,000, but this figureincluded output of other, secondary productsby the industry that were not identified bycommodity. Moreover, another $14,372,692worth of flavoring extracts were produced assecondary products of other industries, al-though those industries were not themselvesidentified. It thus was impossible to determinethe value of production of the commodity fla-voring extracts from published reports on the1921 Census of Manufactures. Indeed, prob-lems surrounding how data were collected andwhat data were collected were so pressing thatthe issue of how industries were defined wasnot examined critically during the first 100years or more of data collection.
Mobilization for World War I forced a num-ber of Federal statistical agencies to the real-ization that they needed to collect data on anindustry basis. Quite a few disjointed and in-consistent methods of defining industries sprangup, and the business establishments that wereasked to respond to these data requests becamealarmed at the lack of coordination and whatthey saw as poorly designed data collectionefforts. The response burden quickly grew tothe point that, in 1918, the War IndustriesBoard established the Central Bureau of Plan-ning and Statistics.5 The Bureau undertookto:
(1) improve statistical operations by de-veloping uniform standards and definitions,
(2) catalog government statistics, and(3) advise agencies on statistical methods.
In 1919, the functions of this agency weretransferred to the fledgling Bureau of Effi-ciency, which concerned itself with the coor-dination of statistical programs. It issued areport in 1922, recommending the centraliza-tion of nonadministrative statistical work in aFederal Bureau of Statistics, at which point theBureau was disbanded, presumably to makeroom for this newly recommended central sta-

97
tistical office. The Bureau of Statistics was,however, never approved, and the issues ofstatistical and classification oversight were ef-fectively shelved for the remainder of the1920s.
As a result of the Great Depression andalso because of political developments in Eu-rope, interest once again grew in the mid-1930sfor greater coordination of Federal statisticalprograms. On July 27, 1933, PresidentFranklin D. Roosevelt signed an ExecutiveOrder, prepared by a committee of the Ameri-can Statistical Association and the Social Sci-ence Research Council, authorizing the for-mation of the Central Statistical Board (CSB).CSB had as its primary responsibility “to for-mulate standards for and to effect coordina-tion of the statistical services of the FederalGovernment incident to the purpose of theNational Industrial Recovery Act.” While fourearlier attempts to coordinate Federal statis-tics programs had failed, CSB (through its suc-cessor agencies) was destined to survive rightup to the present day. Most germane to thepresent discussion was the formation by theCSB in 1937 of an Interdepartmental Com-mittee on Industrial Classification “to developa plan of classification of various types ofstatistical data by industries and to promotethe general adoption of such classification asthe standard classification of the Federal Gov-ernment.”
Standardization of the industry classifica-tion plan was an important objective becausevarious agencies were once again collectingindustrial data, each using its own classifica-tion scheme. Such a situation made the com-parison of industrial data prepared by differentagencies difficult and often misleading. Workbegan on this standardized industrial classifica-tion in June 1938, and was guided by the fol-lowing general principles:
1) The classification should conform tothe existing structure of American industry.
2) The reporting units to be classified areestablishments rather than legal entities orcompanies.
3) Each establishment is to be classifiedaccording to its major activity.
4) To be recognized as an industry, eachgroup of establishments must have significancefrom the standpoint of the number of estab-lishments, number of wage earners, volume ofbusiness, employment and payroll fluctuations,and other important economic features.
The Standard Industrial ClassificationsystemThe result of all this work was compiled as theStandard Industrial Classification Manual(SIC) and was issued in duplicated form as twovolumes: Volume 1, Manufacturing Industries(released primarily in 1939) and Volume 2,Nonmanufacturing Industries (released prima-rily in 1940).6 The results were reviewed inlight of the experiences of the agencies mak-ing use of the new classification system, andthe first printed edition of the SIC was pub-lished for manufacturing industries in 1941 andfor nonmanufacturing industries in 1942.Major revisions to the SIC were published in1957, 1967, 1972, and 1987. These revisionswere a result of cooperation among statisticalagencies and the business sector, with overallcoordination provided by the CSB, then by theBureau of the Budget, and, finally, by the U.S.Office of Management and Budget.
Unfortunately, the SIC shared a major prob-lem with all earlier industrial classification sys-tems in that it lacked a theoretical foundationbased on economic concepts.7 While therewas an underlying idea that an establishmentshould be classified by type of economic activ-ity, this idea was not defined with sufficientrigor. With no single guiding economic prin-ciple of classification or aggregation laid downat the outset, the SIC evolved into a number ofdifferent classification schemes. In most cases,the product or activity dominated the classifi-cation decision but, in some cases, end use, rawmaterials, or market structure was the decidingfactor. None of these schemes was incorrect,but they were not consistent. Moreover, asold industry definitions were modified or newindustries were added, the logic seemed to makeperfect sense for each change. Unfortunately,the result was that, over time, the SIC becamea less and less homogeneous grouping of indus-tries. Some examples may help clarify theinconsistencies that had crept in over the years.
Supply-based vs. demand-based. Two pos-sible approaches to defining industries werefrom the supply side and from the demandside. In the supply-side approach, establish-ments were grouped into industries based onsimilarities in the production process. That is,establishments with similar or identical pro-duction functions were grouped together as anindustry concept. In this approach “the pro-duction function should be understood as anabstract description of the engineering prin-

98
ciples for a production process, or as a descrip-tion of the production technology, not just asa list of inputs. In principle, it is engineeringinformation about the production process thatdetermines if establishments are sufficientlysimilar to justify grouping them by a supply-side concept.” An example of this type ofindustry classification is provided by the twodifferent chain-producing industries: SIC 3496,chain made from purchased wire, and SIC 3462,chain made from forged steel. Even thoughthe end products of these two industries weregood substitutes for each other, the produc-tion processes differed significantly; thus, thedecision was taken to follow a supply-side ap-proach to industry definition in this case.
A demand-side, or commodity-oriented,classification concept groups together com-modities or services that have similarities inuse, that belong together, that are used to-gether for some purpose, or that define mar-ket groupings. Consider the apparel indus-tries. Apparel industries are split between men’sand boys’ apparel and women’s and girls’ ap-parel. Clearly, the production technology isvirtually indistinguishable between the twogroupings, yet the markets are different interms of marketing approach and pricing.
Embodiment of the true economic structure.A frequently encountered statement in the earlyeconomic classification literature is that theclassification system should “reflect the struc-ture of the economy.” If a well-defined eco-nomic concept of “structure of the economy”does not exist, however, the potential for dif-ficulties arises over time. In one view, thestructure of the economy encompasses whatindustries exist, where they are located, whatinputs they use, what outputs they produce,and what markets they serve. Yet, one mustquestion whether the SIC really did accom-plish this purpose. In the 1987 SIC, 57 per-cent of the four-digit SIC codes are goods-producing industries, while 43 percent relateto the entire nongoods-producing sector. In1987, however, only 45 percent of real grossdomestic product was accounted for by thegoods-producing sector, while 55 percent arosein service-producing industries. Nonagricul-tural employment in 1987 was split 24 per-cent to 76 percent between goods-producingindustries on the one hand, and service-pro-ducing and government industries on the other.On the basis of these estimates, many econo-mists and statisticians were increasingly con-
cerned that the SIC did not reflect the truestructure of the economy.
Another definition of “structure of theeconomy” refers to the organization of pro-duction units for marketing goods or services,including the degree of vertical integration.For example, two separate meat processingindustries are recognized in the 1987 SIC, meatpacking plants (SIC 2011) and sausages andother prepared meat products (SIC 2013). Thetwo produce the same output—meat prod-ucts—but meat packing plants slaughter theanimals they use in their production processwhile the other industry produces meat prod-ucts from purchased carcasses and other meats.Here, the degree of vertical integration wasthe deciding factor in splitting these two setsof establishments. At the same time, how-ever, poultry slaughtering and processing (SIC2015) includes both types of processing estab-lishments, regardless of whether they actuallyslaughter the poultry themselves.
Another “structure of the economy” issueconcerns the extent to which some industriescombine activities. The hotels and motelsindustry (SIC 7011), for example, encompassesmany distinct economic activities, includingrestaurants, bars, room rental, and gift shops,many of which also are enumerated in otherfour-digit SIC categories. By including the valueof production of all these distinct activities inone industry, the statistics relating to the otherfour-digit SIC codes are distorted to a degreethat may not be immediately apparent.
Finally, many economists and statisticiansnoted that the SIC was unable to recognizenew or emerging industries in a timely manner.The point of all of these examples is not tojudge which of them were “right” or “wrong”but to point out the growing number of incon-sistent treatments that had crept into the SICscheme of classification, inconsistencies thatwere due almost entirely to a lack of a unifiedeconomic concept of the industry and of theproper way to categorize establishments byindustry.
The enactment of the North AmericanFree Trade Agreement (NAFTA) formalized afree-trade area among the United States, Canada,and Mexico. In 1993, when the agreement wassigned by all three countries, the U. S. industryclassification system was governed by the 1987SIC. Canada’s classification system dated from1980, and Mexico had no industry classifica-tion system in place (its first was published in1994). To meet the monitoring requirements

99
built into NAFTA, a coordinated industry clas-sification needed to be developed to suit allthree economies. This turned out to be theultimate argument for replacing the StandardIndustrial Classification.
The North American Industry Classifi-cation SystemAn International Conference on the Classifi-cation of Economic Activities was held inWilliamsburg, VA, in 1991. As a result of thatconference, the U.S. Office of Managementand Budget established the Economic Classifi-cation Policy Committee (ECPC) in 1992,chaired by the Bureau of Economic Analysisand with representatives from BLS and theCensus Bureau. The charter of the ECPC wasto undertake a “fresh slate” study of alternateeconomic concepts by which to categorize in-dustries and to recommend changes to or re-placement of the SIC system of industry clas-sification.
Working papers of the ECPC during thosefirst years provided a detailed analysis of con-ceptual problems with the existing SIC sys-tem, along with a set of alternative strategiesregarding the development of a system thatwould replace the SIC. These “straw man”proposals formed the basis for extensive com-ment and debate, not only among governmentstatisticians and economists, but also amongthe users of SIC-based statistics from academiaand the business community. As a result, theECPC developed a set of final proposals for asystem that would replace the SIC, and thatthey hoped would adequately address the prob-lems and inconsistencies that had been devel-oping over the 50-year lifespan of the SIC.
The result of ECPC’s work was publishedin 1997—the North American Industry Clas-sification System (NAICS), constructed withina single conceptual framework.8 Economicunits that have similar production processesare classified in the same industry, and the linesdrawn between industries demarcate, to theextent practicable, differences in productionprocesses. Special attention was given to de-veloping these production-oriented classifica-tions for:
(1) new and emerging industries,(2) service industries in general, and(3) industries engaged in the production
of advanced technologies.
NAICS went on to provide enhanced in-dustry comparability among the economies of
the United States, Canada, and Mexico, and itprovided increased compatibility with the two-digit level of the International Standard Indus-trial Classification of the United Nations.
NAICS divides the economy into 20 sec-tors. (See box entitled “A comparison of theNAICS and the SIC structures.”) Industrieswithin these sectors are grouped according tothe production criterion. Although the goods/services distinction is no longer explicitly re-flected in the structure of the new classifica-tion system, 5 sectors are largely goods-pro-ducing, and the remaining 15 are entirely ser-vice-producing industries.
What exactly has NAICS accomplished?ECPC has summarized what makes NAICS abetter economic classification system in termsof relevancy, consistency, comparability, andflexibility.9
Relevancy. NAICS provides 1,170 detailedindustry classifications for the U.S. economy,a 15-percent increase in total classifications,compared with those available under the SIC.The new system replaces or revises approxi-mately 60 percent of the previously availableSIC industries, and provides 358 new industriesnot identified at all under the SIC. The result-ing expanded and revised industry classifica-tions better mirror businesses and methods ofbusiness operation in our modern economy.(Some of the new industries identified underNAICS are shown in the box entitled “NewNAICS industries.”)
Consistency. NAICS changes key classifica-tion concepts and definitions, a developmentthat may have substantial impacts on how busi-nesses are classified and the number and kindof businesses in particular classification group-ings. Each business is now classified into adetailed industry based on the production pro-cesses it uses.
Use of this production-based classificationprinciple has an impact on the boundary be-tween retail and wholesale trade sectors. Re-tailers typically sell merchandise in small quan-tities using public-oriented methods such asmass media advertising, placement of stores inhigh-traffic locations, and design of attractivedisplays. Wholesalers sell goods in large quan-tities using business-oriented methods such asdeveloping specialized catalogs, nurturing cus-tomer contacts, and locating warehouses oroffices judiciously. This definitional approach
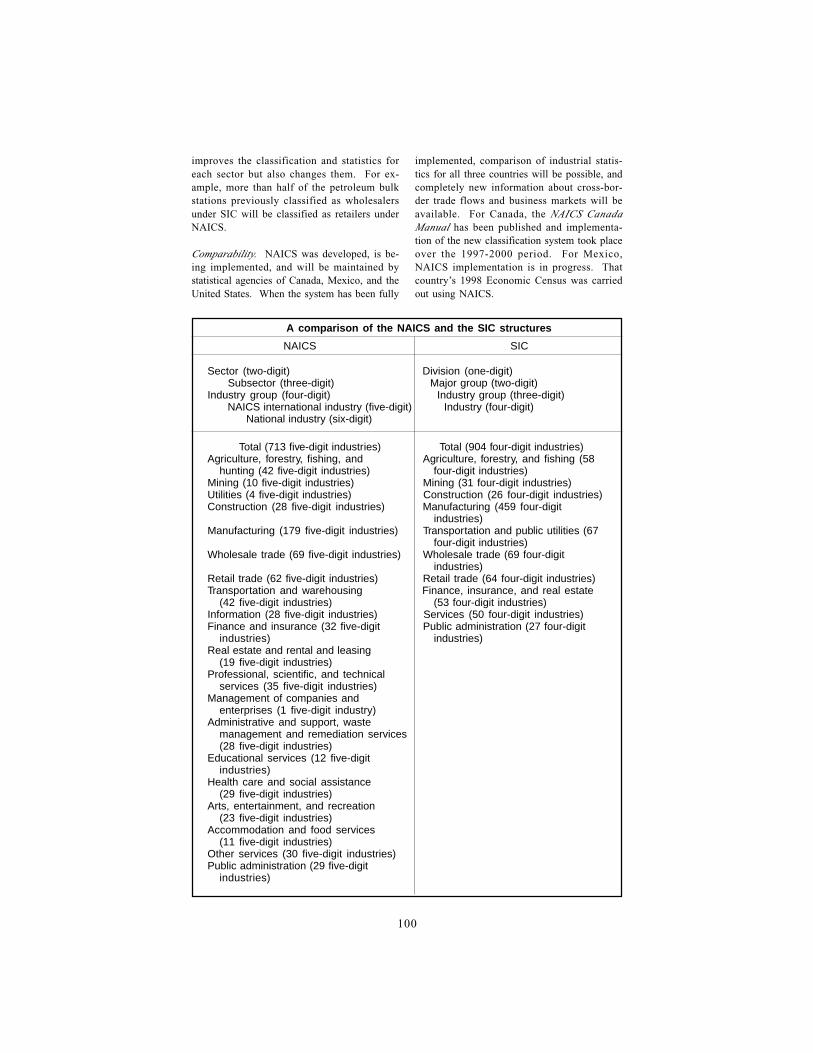
100
improves the classification and statistics foreach sector but also changes them. For ex-ample, more than half of the petroleum bulkstations previously classified as wholesalersunder SIC will be classified as retailers underNAICS.
Comparability. NAICS was developed, is be-ing implemented, and will be maintained bystatistical agencies of Canada, Mexico, and theUnited States. When the system has been fully
implemented, comparison of industrial statis-tics for all three countries will be possible, andcompletely new information about cross-bor-der trade flows and business markets will beavailable. For Canada, the NAICS CanadaManual has been published and implementa-tion of the new classification system took placeover the 1997-2000 period. For Mexico,NAICS implementation is in progress. Thatcountry’s 1998 Economic Census was carriedout using NAICS.
A comparison of the NAICS and the SIC structures
Sector (two-digit) Division (one-digit) Subsector (three-digit) Major group (two-digit)
Industry group (four-digit) Industry group (three-digit) NAICS international industry (five-digit) Industry (four-digit)
National industry (six-digit)
Total (713 five-digit industries) Total (904 four-digit industries)Agriculture, forestry, fishing, and Agriculture, forestry, and fishing (58
hunting (42 five-digit industries) four-digit industries)Mining (10 five-digit industries) Mining (31 four-digit industries)Utilities (4 five-digit industries) Construction (26 four-digit industries)Construction (28 five-digit industries) Manufacturing (459 four-digit
industries)Manufacturing (179 five-digit industries) Transportation and public utilities (67
four-digit industries)Wholesale trade (69 five-digit industries) Wholesale trade (69 four-digit
industries)Retail trade (62 five-digit industries) Retail trade (64 four-digit industries)Transportation and warehousing Finance, insurance, and real estate
(42 five-digit industries) (53 four-digit industries)Information (28 five-digit industries) Services (50 four-digit industries)Finance and insurance (32 five-digit Public administration (27 four-digit
industries) industries)Real estate and rental and leasing
(19 five-digit industries)Professional, scientific, and technical
services (35 five-digit industries)Management of companies and
enterprises (1 five-digit industry)Administrative and support, waste
management and remediation services(28 five-digit industries)
Educational services (12 five-digitindustries)
Health care and social assistance(29 five-digit industries)
Arts, entertainment, and recreation(23 five-digit industries)
Accommodation and food services(11 five-digit industries)
Other services (30 five-digit industries)Public administration (29 five-digit
industries)
NAICS SIC

101
Flexibility. The intention is that NAICS clas-sifications will be updated on a regular basis tokeep pace with changes in the U.S. economy.All three North American countries will re-view NAICS every 5 years and make necessaryrevisions.
The NAICS implementation schedulewithin the U.S. statistical community is spreadout over a 7-year period. (See exhibit 1.) Thefirst major program affected by NAICS wasthe 1997 Economic Census. For a sample ofthe data that have been made available in theEconomic Census, see Annex A.
Despite its great advances in industry clas-sification, the existing NAICS is still a work inprogress. Due to severe time constraints, theECPC decided to leave the wholesale and retailtrade sectors and the construction sectors es-sentially unchanged from the 1987 SIC. Asecond edition of NAICS, scheduled for releasein 2002, will address the revisions in thesethree sectors, as well as revisions of the other1997 industries as required.
Finally, for all those researchers who de-pend on the availability of consistent timeseries data, it may well be a decade before anadequate set of data has been generated underNAICS. For the 422 industries that are sub-stantially unchanged between the SIC andNAICS classification schemes, there is no prob-lem—analysts will simply continue to gatherdata as they are released. For the 748 indus-tries that are either new or substantially re-vised from the SIC, the problem becomes a bitstickier. For a time, it will be necessary tobridge backward to a consistent SIC basis (in-sofar as that can be carried out) but, ultimately,the analyst will find it necessary to bridge ear-lier SIC-based data forward to the NAICS. Bothbridge processes will require some carefullythought-out approaches and well-documentedassumptions, especially in light of the fact thatonly one period of data overlap is planned formost industry-based data collection efforts.
Occupational Classifications“Occupations” are jobs or positions that em-ploy the knowledge and skills of people. Posi-tions and jobs are the structures of work thatemployers offer to workers. When a positionor job is filled by a person, it becomes thatperson’s occupation. When a person is per-forming in a position or job, the person isreferred to as a worker. An occupation is de-fined by the interaction of the work organized
in a position or job, the work content, and theeducation and skills that a person brings toperforming that work content. Occupationalinformation looks beyond titles to the workcontent, education, and skills that are requiredby the structure of work in our economy. Theproducts of occupational analysis are the struc-ture of positions and jobs in the economy, theskill base of the employed workforce, and theeconomic contribution of the employedworkforce as measured by wage data. The de-velopment of these products in the form ofdata series creates a dynamic picture of thechange occurring in the character of work inthe economy. Occupational data may be ana-lyzed either within industry classification struc-tures or solely within their own occupationalclassification structure. These concepts cre-ate a framework for a “job economy.”
Purpose and valueAn occupational classification is the logicalstructure used by statisticians, economists, andpersons in other disciplines to describe andquantify the variety of ways in which aworkforce is remuneratively employed. Theactual variables that define and influence theoccupational structure of the Americanworkforce are even more complex and dy-namic. The availability of a classification struc-ture, even with inherent limitations, permitsthe collection of statistics that measure thesevariables and represent others by inference.The level of wages earned by the employedworkforce is one of the most evident of suchmeasures. In turn, these wages represent theeconomic contributions and productivity ofvarious workforce segments defined in the clas-sification structure. The products and servicesof the employed workforce and the marketcontext in which they are delivered are indica-tions of the more complex variables that shapethe workforce. For example, energy produc-tion is one of society’s continuing needs.Throughout a complex chain of consumer de-mands and production requirements, the num-ber of persons employed in this pursuit andtheir corresponding wages are determined.
In its dynamic aspects, the actual workforcestructure is derived from the final demand fora commercial and consumer “market basket”of products and services. The demand for prod-ucts and services reflects a variety of compet-ing requirements for the Nation’s standard ofliving and the means to produce and maintainit. How individual occupations are structured

102
is largely a matter of technology, a combina-tion of human and machine technologies.Products and services themselves reflect ad-vances in science, engineering acumen, andconsumer knowledge. For example, in retaildistribution, workers selling the same goodsmay be employed by a traditional retail outlet,a discount or warehouse store, or an Internetmarketer.
Some may be inclined to view an occupa-tional classification system as a window intothe activities of the employed workforce.However, there is another, more importantperspective that this discussion presents. Astreated here, an occupational classificationstructure is more like a prism or a crystal.Depending upon our perspective—which maybe political, social, economic, technological,or cultural—the same occupational classifica-tion structure can suggest a variety of differ-ent parameters that have shaped it and definedits contributions to our current standard ofliving and way of life. Although it is difficultto know all these parameters directly, they
may be known by inference. For example, theform and functions of products such as auto-mobiles change as a result of science and tech-nology. How and where these automobiles areproduced is determined by technology and eco-nomic choice. The form and quality of theseproducts often are the result of cultural prefer-ences and education. The workforce changessubtly in response to all of these forces.
Why classify occupations?An occupation is a group of jobs in which work-ers perform similar tasks, duties, or activitiesat similar skill levels. A job is a group of similarpositions and a position is a slot in an organi-zation occupied by a single individual.10 Occu-pations may be clustered into groups based onsome common element, such as similarity ofwork, workplace, or worker characteristics. Anoccupational classification system helps definethe occupational structure in the workplaceand provides a framework for descriptive oc-cupational statistics, such as employment lev-els, job openings, earnings, and education.
New NAICS industriesNew NAICS industriesNew NAICS industriesNew NAICS industriesNew NAICS industries
Semiconductor machinery manufacturingFiber optic cable manufacturingSoftware reproducingConvenience storesGasoline stations with convenience stores
Warehouse clubs and superstoresFood (health) supplement storesPet and pet supply storesPet care servicesCable networks
Satellite telecommunicationsPagingCellular and other wireless telecommunicationsTelecommunications resellersCredit card issuing
Temporary help servicesTelemarketing bureausHazardous waste collectionHMO medical centersContinuing care retirement communities
CasinosCasino hotelsBed-and-breakfast innsLimited-service restaurantsAutomotive oil change and lubrication shopsDiet and weight reducing centers

103
There are four primary groups of users ofthis information:
(1) workers and potential workers needinginformation about likely jobs,
(2) employers needing labor market infor-mation for personnel, marketing, or planningpurposes,
(3) counselors in the academic and voca-tional sectors, and
(4) researchers, including economists andsociologists, and related policymakers, for ana-lyzing labor market trends, social policies, andother issues.11
The users of occupational information alsomay be grouped as micro-users and macro-us-ers. Micro-users require information to assistin structuring jobs, defining job requirements,recruiting workers, developing career plans,seeking training opportunities, and aiding oth-ers in finding jobs and related training. Macro-users require occupational information toevaluate the structure and performance of theeconomy, develop models for studying labormarket dynamics, identify current and poten-tial areas of worker dislocations, promote tar-geted economic development efforts, and planand implement education and training pro-grams.
Occupations may be viewed from a surveyperspective. The Census of Population andthe Bureau’s Current Population Survey askopen-ended questions about household mem-bers’ occupations, with responses referred toas occupational titles. Census analysts grouprelated titles, and these groups constitute cen-sus occupations. Closed-end surveys, typicallyof employers, provide occupational definitionsthat specify the range of job activities included,and data collected represent all workers whoseposition descriptions match these definitions.
While positions have independent exist-ence, jobs and occupations are, in some essen-tial way, arbitrary and artificial.12 Most occu-pations do not have natural boundaries. Posi-tions and jobs can be viewed as existing on acontinuum, along which classifiers set bound-aries.13 The breadth of occupations depends,to a great extent, on the level of detail desiredand the total number of occupations in a sys-tem. For example, mechanics, automotivemechanics, automobile body repairers, or au-tomotive glass installers each could be anindividual occupation. In a system with moredetailed occupations, higher levels of aggrega-tion might become minor or major occupa-tion groups, rather than occupations. There is
tremendous potential for occupational detail.The 2000 census, for example, lists about31,000 individual job titles, and the 1991 Dic-tionary of Occupational titles lists more than12,000 jobs.
Education or skill level also may be consid-ered in determining boundaries—for example,to ensure that there are distinctions among“professional,” technician, and aide occupa-tions in the same field or among craftworkers,(semiskilled) operatives, and helpers.14 Use ofthis criterion, in particular, encourages homog-enous groupings, so that meaningful inferencescan be made about characteristics of individualcases. Obviously, the greater the level of occu-pational detail, the more homogeneity pos-sible. However, limited sample size or inad-equate responses to open-ended questions maylimit the amount of occupational detail. Forexample, distinctions among short order, in-stitutional and cafeteria, and restaurant cooks,or between light or delivery services and heavyand tractor-trailer truck drivers have been pe-rennial problems in household surveys. Em-ployer-based surveys are better at collectingthis information and permit the gathering ofmore detail. The appropriate level of detailalso may be determined by the range of jobtasks. Many health technologist, technician,and therapist jobs are very specialized, withworkers performing a limited range of tasks,generally specified by licensing boards. Incontrast, sales jobs tend to be general, withmost having common tasks.15 This suggeststhat sales occupations be specified in relativelyless detail than health occupations.
The collection of data describing occupa-tions, the process of organizing it, and theanalysis of occupational data require a con-ceptual toolkit. Definitions of terms are alogical starting point. While the 31,000 jobtitles in the 2000 census index have impor-tance in general socioeconomic terms, theirusefulness in economic analysis is limited bythe fact that household data are reported bytitle, without definition and verification of jobcontent. Even if every title were supported bya unique definition of job content that wasverified, the large number of jobs makes orga-nization and analysis of this information im-possible. In order to arrive at a structure fororganizing and analyzing occupations, a tax-onomy built upon similarities is needed. Thestructure of the taxonomy should be flexibleenough to admit new occupations as they de-velop. Similarities within and between groups

104
in the taxonomy are required. Work contentand skill requirements are basic similaritiesamong jobs. Formal education, licensing, andcertifications are other similarities that maybe considered.
For purposes of illustrating the conceptualtools used in occupational analysis, considerhow the job “bus driver” presents complexi-ties that are not evident at first glance. Busdrivers differ and share similarities based uponthe points they connect and the distances theydrive. Likewise, they may operate commer-cial vehicles of various sizes. Bus drivers con-vey different groups of passengers with vary-ing needs for assistance, such as those relatedto infirmities and disabilities, luggage, specialfare rates, and safety requirements. There maybe different legal and licensing requirementsfor operation of certain classes of vehicles orgroups of passengers. A taxonomy for “busdrivers” must take these similarities and dif-ferences into account. In the Standard Occu-pational Classification (SOC) system (p. 106),bus drivers who drive large commercial buseson a scheduled basis over regular routes, oncharters, or as private carriage are classified as“bus drivers, transit and intercity.” Those whotransport students or special clients such asthe elderly or disabled are classified as “busdrivers, school.” Consider now the complex-ity of following this same process in develop-ing a taxonomy for 31,000 jobs that can bereduced to a manageable and meaningful num-ber of detailed occupations about which surveydata can be collected and analyzed.
There have been two basic systems used toclassify occupations. One, classifying occupa-tions by the industry in which they are con-centrated, was used by the Decennial Census ofPopulation through 1930. The other, classi-fying by some combination of several factors—nature of the work performed, skill level, edu-cation requirements, and socioeconomic class,with only minor regard for industry in whichoccupations are concentrated—has been usedin all later systems.
No single classification system can createoccupational groupings to suit all purposes.For example, systems based solely on workperformed do a poor job of grouping occupa-tions by required level of education.16 Thegreater the level of occupational detail, theeasier it is to rearrange occupations to meetalternative analytical purposes.
The distinction made between the charac-teristics of workers and those of occupations
is useful for purposes of discussing supply anddemand dynamics that may determine the con-tent of occupations. These two sets of char-acteristics overlap and interact in the defini-tion of particular occupations and in the de-termination of the wages that the incumbentsare able to earn. When worker characteristicsare defined in job terms, the result is a defini-tion of employer demand requirements. Con-versely, when worker characteristics are de-fined in terms of education, training, and skills;the resulting definition represents the supplyof workers. These distinctions come into prac-tical play when surveyed work content is clas-sified. For example, work performed is de-fined by employers, while education and skillrepresent assets that workers bring to bear inperforming the defined work. Sometimes, prob-lems may arise when classifying occupationsbecause worker characteristics such as educa-tion, licenses, and certifications may be as-signed undue importance in defining the skillrequirements for the performance of certainwork. Given jobs may be performed within awide range of educational accomplishments andskills. Any imposing of a particular educa-tional or performance level in defining an oc-cupational category might artificially disasso-ciate occupational categories that have thesame performance requirements. Accepting awider range of educational and skill qualifica-tions in job definitions will result in a widerrange of associated wage rates. These wagerates might be the best reflection of the inter-action between the characteristics of occupa-tions and the characteristics of workers.
New occupations can be added or rapidlygrowing ones split, while declining occupationscan be combined or deleted to reflect the chang-ing distribution of employment or the effectof new technologies and business practices.Some “new” occupations are, in fact, simplyspin-offs of long-existing occupations. Newjob tasks generally are first assumed by work-ers experienced in related tasks in existing oc-cupations. These tasks may remain comfort-ably classified within existing occupations ormay eventually be spun off.
To determine which jobs are appropriatefor spin-offs, occupational classification spe-cialists look for groups of jobs 1) with tasksand activities that are sufficiently distinct fromthose of other jobs, and 2) that show potentialfor growth. They rely on anecdotal evidence;labor market research, such as that conductedby Occupational Analysis Field Centers;17 large
105
numbers of responses on census questionnaires;or employer responses to questions about oc-cupations not listed on survey forms. Earlyidentification of new jobs that require formaltraining is important so that data for careerguidance and education planning can be col-lected. Yet, this can be difficult. Many groupsof jobs identified as “new and emerging” in thepast never grew much or received further at-tention.18 In contrast, computer jobs, whichmight have been identified as occupations dur-ing the 1950’s, were not, but it was not thenobvious that computers had enough applica-tions to support much employment growth.19
The current occupational employment in-formation obtained from employers has noimmediate, direct use in the study of labormarket mobility dynamics. Data needed formobility studies are collected through surveysthat follow individuals over time, such as theCurrent Population Survey. While it is theo-retically possible to discuss the elasticities ofworker job choices within and among indus-tries, the data needed to test related hypoth-eses currently are unavailable or imprecise.Similarly, the elasticities of employer demandfor workers existing between a given occupa-tional category and closely related categoriescannot be gleaned from available data at thistime, and no known plans exist for collectingsuitable data in the near future.
Some economists have identified what theyconsider economic criteria for the structuringof occupational classification based on elastic-ity criteria. These are standardization of oc-cupational classifications, adaptability tochange over time, ability to reflect techno-logical change, responsiveness to changing edu-cational policy, and the range of substitutionpossibilities available to employers. If all thesecriteria were met, the available occupationalinformation would provide a consistent frame-work within which to study employer selec-tion decisions and worker job choices. Thecurrent SOC system is a move in the directionof providing a needed standardized frameworkwithin which worker mobility may be studied.
The early census approachThe 1900 census specified 475 occupations(but published data on 303), developed fromabout 17,000 titles; the 2000 census allowedfor 503 occupations, developed from about31,000 titles. From 1870 to 1930, censusoccupations were organized within an indus-trial framework. Occupations were placed in
the industry of greatest employment, even ifmuch of their employment was in other indus-tries. (Several of the industries, however, maybe more accurately described as service groups.)The 1900 census specified five major catego-ries:
(1) Agricultural pursuits(2) Professional service(3) Domestic and personal service (includ-
ing health, food service, and protective service)(4) Trade (including banking, insurance,
and real estate) and transportation (includingcommunication)
(5) Manufacturing and mechanical pursuits(including construction, fishing, and mining)
The 1910 census was expanded to allowfor nine major occupational categories.20
There also were numerous subgroups, consist-ing mostly of managers, foremen, operatives,or laborers specified by detailed industry, butfew occupational subgroups. This system gen-erally grouped occupations producing similargoods and services and located on the samepromotion ladders—for example, helpers andapprentices, journey-level workers, supervi-sors, and managers.
The revised census approachIn 1938, the American Statistical Associationand the Central Statistical Board appointed ajoint committee on Occupational Classifica-tion to devise a standard classification. (TheBoard also formed a committee on IndustrialClassification, as discussed in the previous sec-tion.). This classification was based on somecombination of similarity of work, educationrequirements, skill level, and socioeconomicclass, with only minor regard for industry inwhich occupations were concentrated. It wasfirst used in the 1939 Dictionary of Occupa-tional Titles (DOT), published by the U.S.Employment Service (USES) to present jobdescriptions and other nonstatistical informa-tion about occupations. It also was used, withsome modification, to organize data on occu-pations collected in the 1940 census. Therevised census scheme consisted of 11 majorgroups:
(1) Professional and semiprofessional(2) Farmers and farm managers(3) Proprietors, mangers, and officials,
except farm(4) Clerical, sales, and kindred workers(5) Craftsmen, foremen, and kindred

106
(6) Operatives and kindred workers(7) Domestic service workers(8) Protective service workers(9) Service workers, except domestic and
protective(10) Farm laborers and foremen(11) Laborers, except farm
Occupations with similar work functionswere placed in the same group and groups werearranged in a hierarchical system that corre-sponded, more or less, with skill and traininglevel and socioeconomic status.21 The newsystem grouped all managers together, and didthe same for craftworkers, operatives, and la-borers. Sales workers, who had been groupedwith wholesale and retail dealers and managersand other workers in the trade group, werenow combined with clerical workers.22 Thedomestic and personal service group was split,and the professional service group became pro-fessional and semiprofessional workers.23
These major groups were more homogeneousthan the industry groups.
The 1940 census system had another ad-vantage. It permitted tabulation of wage andsalary employment data by industry and occu-pation,24 and calculation of occupational staff-ing patterns—each occupation as a percent oftotal employment in every industry. This madepossible construction of the BLS Industry-Oc-cupation matrix, a key tool in developing oc-cupational employment projections.25 How-ever, the system, like its predecessor, lackedoccupational subgroups; within groups, occu-pations were simply listed alphabetically.26
A period of transitionSince the 1960s, policymakers, academicians,government administrators, and researchershave independently recognized the changingcharacter of the American economy. Somemight term it a mature economy; others mightcharacterize it as “post-industrial”; many seeit as part of a global network; and others see itas a high-technology economy, characterizedby knowledge industries. All of these observ-ers are reporting on or projecting the chang-ing character of the “work structure” of theeconomy. The results of this recognition havecontributed to major paradigm shifts in theway in which America’s industries will beviewed. The change from the Standard Indus-trial Classification system entailed a change infundamental concepts, defining industries in
terms of processes rather than products. Thechange from the census system of classifyingoccupations to the SOC system involved amovement from a mixed system of classifica-tion to a system based entirely on work per-formed and related skills. The SOC systemfurther incorporates structural features thatfree occupational classification from its pre-viously industry-rooted structure.
In 1965, the then Bureau of the Budgetasked 28 agencies about the desirability of es-tablishing a standard classification system foroccupations, corresponding to the SIC for in-dustries. It was prompted by a desire to pro-vide more comparability among occupationalstatistics prepared by Federal agencies and otherorganizations. Based on responses to this let-ter, the Bureau appointed an Interagency Oc-cupational Classification Committee to pro-vide recommendations on a new classificationsystem. The committee first met in 1966, andpreliminary work was incorporated into the1970 census. For example, professional, tech-nical, and kindred workers (professional andsemiprofessional in the 1940 census was re-named in 1950) were organized into a numberof minor groups, replacing the 1960 censusalphabetical listing. These minor groups in-cluded computer specialists (three computeroccupations were created in 1970); teachers,except college; writers, artists, and entertain-ers; and three health occupation groups. AStandard Occupational Classification Manualwas published in 1977, and was revised in1980(in time for the 1980 census) and again in2000 (for the 2000 census).
The SOC system classifies occupations onthe basis of work performed and on requiredskills, education, training, and credentials, asdid the 1940 census system.27 The 2000 SOChas 23 major groups, which generally corre-spond to or are disaggregations of 1940-70census major groups.28 It provides much morehierarchical structure, with 96 minor occupa-tion groups and more occupations—821. Thecensus professional and technical group wassplit into eight major groups, correspondingto minor groups in the 1970 census, with somecombining and reconfiguration, reflecting thegrowing number of professional and technicaloccupations. Service workers were allocatedamong five major groups, and craftworkers (in-cluding construction), extraction workers, me-chanics and repairers, and precision produc-tion workers, operatives, and laborers were al-located among four major groups.
107
The 2000 SOC structure is shown in ex-hibit 2. The SOC also provides an aggregation(intermediate level) of these 23 groups into11 groups. A comparison of the 23-group andthe 11-group categories makes clear how theSOC evolved from the census structure. Theintermediate grouping is shown in exhibit 3.
Response of the classification systemto new products, technologies, andother changesThis section discusses classification systemresponses to three 20th century products ortechnologies—motor vehicles, airplanes, andcomputers—and three changes in the methodsand organization of production—the growthof science and engineering, the advent of massproduction, and the rise of bureaucratic orga-nizations. The character of work has changedat an accelerating rate during the past 100years. The organization of work in terms ofjobs or positions reflects ongoing changes inthe structure and nature of capital stocks,progress in the development of technologies,changes in the structure of product and factormarkets, and rising levels of education andtraining. The increasing rate of change in thestructure of work in the American economyrequires a corresponding increase in the abilityof employers to create jobs and positions thatutilize the full economic talents of workersand in opportunities for workers to obtain theeducation and training needed for these jobsand positions.
The development of motor vehicles radi-cally changed transportation. It also gave riseto many new occupations and caused the de-cline of others. In 1900, there were only 8,000registered motor vehicles. The first mass-pro-duced car was introduced in 1901, and the firstpractical vehicles were produced by 1903.Automobile industries developed rapidly there-after and, by 1910, there were nearly half amillion automobile and 10,000 truck registra-tions. By 1920, there were 8 million automo-bile and 1.1 million truck registrations. As aresult, six motor vehicle-related occupationswere added in the 1910 census: two repair-related—garage owners and managers and ga-rage laborers; two automobile factory-related—semiskilled operatives and laborers; retail au-tomobile dealers; and motor vehicle drivers,called chauffeurs. However, attempts to dis-tinguish chauffeurs and other motor vehicledrivers from drivers of vehicles using draftanimals—draymen, teamsters, and express-
men; and carriage drivers and hacks—in datacollection were not very successful.29 A sev-enth occupation—automobile mechanics—appeared in the1910 Index to Occupations,but no data were published for it until 1930.30
Retail dealers, gasoline stations; and laborersand helpers, auto stores and filling stationsalso appeared in the classification system in1930, and attendants, filling station and park-ing lot, were included in 1940.
As the use of motor vehicles spread, em-ployment related to horse-drawn vehicles de-clined sharply. In the 1930 census, liverystable managers and foremen of livery compa-nies were downgraded to titles within the cat-egory of transportation managers and trans-portation foremen. Draymen and teamsterswere combined with carriage drivers in 1930,but the combined occupation (name shortenedto Teamsters in 1940) remained an occupa-tion until 1980, when it was downgraded to asingle title within the category of miscella-neous material moving equipment operators.Also in 1940, hostlers and stable hands weredowngraded to titles in laborers (not elsewhereclassified) and operatives in wagon and car-riage factories and, in harness and saddle fac-tories, to titles within operatives (not else-where classified). In the 1950 census, bus,taxi, and truck drivers were separately enu-merated and so, in the 1970 census, were auto-mobile body repairers. The 2000 SOC speci-fied two types of bus drivers and truck drivers,and separated a new specialty—automobileglass installers and repairers—from other bodyrepairers, reflecting the shift of much autoglass work to specialized glass shops.
Aviation industries, although highly vis-ible, developed much more slowly than did au-tomobile industries, and this was reflected inmuch slower change within the classificationsystem. While the first heavier-than-air flighttook place in 1903, scheduled air transporta-tion did not begin until 1926. Aircraft tech-nology and production and air transportationdeveloped during the 1930’s and World War II,but air passenger and freight traffic were notsignificant economic activities until the 1950’s.
The occupation of aviators appeared inthe 1910 census (as “aeronauts”), classifiedunder showmen, which also included titles suchas athletes, balloonists, and performers; in1920, aviators became a separate occupation.Aircraft mechanics appeared as a title underother mechanics in 1920 and as an occupationin its own right in 1930. Three air transporta-

108
tion industry occupations—proprietors, man-agers, and officials; foremen and overseers;and laborers—also were added to the job classi-fication in 1930, even though the industrywas small. Aircraft manufacturing operativesappeared as a title in 1920 and as an occupa-tion in 1940. Aeronautical engineers, whichalso appeared as a title in the 1920 censusunder mechanical engineers, became an occu-pation in 1950.31 Airline stewardesses appearedas a title in 1940 under registered nurses, re-flecting the requirement that they be nurses,presumably to deal with passengers’ discom-forts from unpressur-ized cabins and air-sick-ness. The nursing requirement was soon re-moved and, in 1950, the title was shifted tothe housekeepers and stewards category; in1970, airline stewardesses became an occupa-tion. Air traffic controllers also appeared in1940—as airport control operators, a titlewithin radio and wireless operators—and be-came an occupation in 1970.
Electronic computers, an outgrowth ofmechanical and punchcard-based calculators andcomputers, have given rise to a number ofoccupations. The first commercial electroniccomputer was delivered to the Bureau of theCensus in 1951.32 Programming languagessoon were introduced, and increased capacitiesand speed led to the widespread adoption ofcomputers, with continued expansion, includ-ing the development of networks, during the1990’s.
Calculating machine operators and tabu-lating machine operators first appear as titlesin the 1920 census within other clerks and, in1940, within office machine operators. Sys-tems engineers (in SIC 357, office machinemanufacturing), first appeared as a title in the1950 census—not within engineers, but in thecategory, all other professional and technicalworkers—and, according to the 1949 Dictio-nary of Occupational Titles, devised proce-dures for use of punchcard-based systems.Computer programmers, computer systemsanalysts, and computer specialists (not else-where classified) first appeared as titles in the1960 census (under professional, technical, andkindred workers, not elsewhere classified) andby 1970, all three were designated as occupa-tions. Computer operators and data process-ing machine repairmen also were added in 1970.The 2000 SOC lists 12 computer specialists,including computer engineers, computer sup-port specialists, database administrators, net-work and computer systems administrators,
and network systems and data communicationsanalysts, placed in a computer and mathemati-cal science occupations major group.33
All engineers appeared in the 1870 censusas one occupation. The 1900 census classi-fied a number of engineering branches intothree categories: civil; chemical, metallurgi-cal, and mining; and mechanical, electrical,and all other. As employment grew, branchesspecified in 1900 were separated; in 1940, in-dustrial engineers were added and, in 1950, aero-nautical engineers. The 1970 census sepa-rated petroleum engineers from mining and, in1980, nuclear engineers were separated fromelectrical engineers. The 2000 SOC lists 19types of engineers, including biomedical andenvironmental, and classifies engineers in amajor occupation group, along with architectsand surveyors.34
The 1900 census had only one scientificoccupation, chemists, assayers, and metallur-gists. However, it listed astronomer, bacteri-ologist, botanist, entomologist, geologist,mathematician, and paleontologist titles un-der other professional pursuits.35 Titles wereadded in following censuses, and these werecombined in 1950 into six occupations—agri-cultural scientists, biological scientists, geolo-gists and geophysicists, mathematicians, physi-cists, and miscellaneous natural scientists. (Datawere not published for these groups until 1960.)The 1970 census added atmospheric and spacescientists and marine scientists. The 2000 SOClisted 21 natural scientist occupations, includ-ing biochemists and microbiologists, classifiedinto both life scientist and physical scientistminor groups. As science and engineering be-came more institutionalized, the role of in-ventors declined. Inventor, a separate occu-pation since 1900, was downgraded to a titlewithin professional workers (not elsewhere clas-sified) in 1940.
Statisticians became a title (under otherprofessional pursuits) in the 1900 census,36 asdid psychologists in 1920 and economists in1930; these three, along with miscellaneoussocial scientists, became occupations in 1950.(Data were not published until 1960.) The 1970census added political scientists, sociologists,and urban and regional planners, and the 2000SOC included market research analysts and sur-vey researchers.
By 1900, mass production, using powermachinery and characterized by minute divi-sion of labor, was replacing handcraft, and semi-skilled operatives were replacing craftworkers.

109
In response, the 1910 census greatly expandedthe number of manufacturing industries forwhich it showed semiskilled operatives (notelsewhere classified). In addition, it down-graded a number of craft occupations, such asbroom and brush makers, glovemakers, leathertanners, and tool and cutlery makers, to titleswithin semiskilled operatives (not elsewhereclassified). Later censuses downgraded otheroccupations, including blacksmiths, coopers,glass blowers, and potters. Some new manu-facturing occupations, such as computer-con-trolled machine-tool operators, fiberglass lami-nators and fabricators, and team assemblerswere added. However, reflecting the relativedecline of manufacturing employment, theshare of of production occupations among alloccupations decreased from more than 2 outof 5 in the 1900 census to about 1 in 6 in the2000 SOC.
The growth of bureaucratic organizationsand specialized administrative activities gaverise to new business and financial operationsoccupations and their classification as a majoroccupation group in the 2000 SOC. Accoun-tants and auditors is the only occupation inthis group that existed in the 1900 census clas-sification, although there were insurance ex-aminers and adjusters, purchasing agents andbuyers, loan agents, and various governmentinspector titles at that time. Purchasing agentsand buyers and inspectors, government wereadded in 1940 and personnel and labor-rela-tions workers and insurance adjusters, examin-ers, and investigators, in 1950. In the 1980census, a management-related occupations mi-nor group, which eventually became the busi-ness and financial operations major group inthe 2000 SOC, was created. It also includedmanagement analysts, underwriters, and otherfinancial officers. The 2000 SOC lists 30 oc-cupations in this group, including 4 personneland labor relations occupations, cost estima-tors, financial analysts, and meeting and con-vention planners.37
The Occupational Employment SurveyOccupational information has always been acomponent of population data. However, itscurrent economic importance can be tracedback to the regional loss of jobs in the 1950sin both the automobile and textile industries.Competition in the auto industry led to theclosing, consolidation, or relocation of sev-eral Detroit-area automobile manufacturers andto periods of extended unemployment for the
workers affected. Similarly, the textile indus-try in the New England States experienced re-locations of major mills to the south. Duringthis period and in response to these situations,the Manpower Development and Training Actof 1962 was enacted, and responsibility for itsimplementation and administration initiallywas given to the U.S. Department of Labor’sBureau of Apprenticeship and Training. Thisact was the progenitor of a series of workforcetraining acts that have culminated in the cur-rent Workforce Investment Act of 1998, ad-ministered by the Labor Department’s Em-ployment and Training Administration. Allof these acts have in common the fact thatlabor market information at the detailed occu-pational level is necessary for their properadministration. This information serves toidentify areas of demand for workers and re-quirements for their training. These develop-ments explain the early and continuing effortsof the Bureau of Labor Statistics (BLS) to pro-vide occupational information and statisticsto an increasing range and number of users.
Starting in 1959, BLS began collecting in-formation through employer surveys of 18scientific, engineering, and technical occupa-tions.38 This experience helped guide a seriesof pilot studies during the 1960s to test thefeasibility of collecting occupational informa-tion for a larger number of occupations. In1968, a comprehensive survey of the metal-working industries was conducted to collectdata on 54 clerical and blue-collar occupations.The printing and publishing industry was sur-veyed in 1970 using a list of 97 occupations.Various tests of mailed structured and unstruc-tured data collection techniques were madeduring this period, and it was determined thatmailed structured techniques including lists ofdefined occupations were necessary to developuseful and comparable data.
In 1971, the first Occupational Employ-ment Statistics (OES) survey was completedthrough the cooperation of BLS and 15 par-ticipating States, with support from the U.S.Department of Labor’s Manpower Adminis-tration (the predecessor of the current Em-ployment and Training Administration). Dur-ing the 1973-76 period, an expanded survey,with data collected by 29 States, was com-pleted. For purposes of completing the na-tional data framework, information for theremaining States was collected by the BLSWashington office. The first national esti-mates for occupational employment were

110
completed in 1977. The number of occupa-tions included in the survey was 2000 in 1970and 800 in 1980, reflecting the experiencegained by program personnel in collectinguseable occupational information.
Throughout the historical developmentperiod of the OES survey, the Standard Occu-pational Classification (SOC) system origi-nated, evolved, and matured into its currentform as a skills-based occupational classifica-tion system. During the 1970s, the U.S. Of-fice of Management and Budget attempted tohave an SOC system incorporated into the1980census. The 1980 SOC had 664 detailed occu-pations, compared with the 750 then found inthe extant OES classification system. Thetwo systems both were in use (along with sev-eral others) until 2001, when the SOC becamethe governmentwide standard.
Beginning with the 1999 survey, the OESsurvey questionnaire was converted to reflectthe SOC coding system. About 400 of the SOC-based occupations matched to old OES occu-pations on a one-to-one or many-to-one ba-sis, at least conceptually. The goal of match-ing the SOC occupations to the old OES occu-pations was to maximize the number of pub-lishable estimates.
The 1998 OES survey occupational titlesand definitions were based on the old OES cod-ing structure and definitions. For the 1999survey, however, the SOC was the source ofthe OES occupational titles and definitions.Even for the approximately 400 occupationswhose definitions basically matched on a one-to-one or many-to-one basis between the twosurveys, there were slight and subtle differ-ences in the occupational titles and definitionsthat may have affected reporting by the re-spondents.
Patterns of change in the OES andSOC occupational classificationsystemsAn ever-present issue in the process of devel-oping and using an occupational classificationsystem to collect employment data is the in-herent conflict between collection of data toform a valid and reliable data series and use ofa structure that permits and identifies changesin the occupational composition of the em-ployed workforce. A related issue involvesvalidity and reliability of data obtained fromsupply-side respondents in household surveysversus that obtained from demand-side respon-dents who are employers. Three problems
associated with this issue are the volume, vari-ety, and comparability of responses that iden-tify occupations by as many as 31,000 titles,and possibly even more variations on these.
The range of methodologies for addressingthese issues starts, on one hand, with the use ofunstructured responses, such as those that thecensus elicits and that are subsequently placedwithin a classification structure. At the otherextreme are closed classification structures thatplace choices into a limited number of fixedcategories. All structured classification sys-tems include a category of “residuals.” Theuse of a classification that includes “all oth-ers” is a way of providing flexibility and realiz-ing economies in collecting data that wouldotherwise be ignored or forced into an inap-propriate classification. The occupational clas-sification systems of the OES are structuredsystems that include categories of residuals atvarious levels of detail.
The patterns of change in census occupa-tional categories are known to reflect chang-ing socioeconomic conditions in which theNation’s policymakers and administratorsmight be interested. The earliest choices ofoccupations to be surveyed in the OES pro-gram were those identified on an industry ba-sis—for example, occupations found in metal-working, printing, and electrometallurgical in-dustries. The early OES surveys were consid-ered to be pretests for the evaluation of surveytools that included structured and unstructuredalternatives.
In the first attempts to implement a com-prehensive occupational survey, BLS staff usedthe Dictionary of Occupational Titles and othersources to develop lists and definitions of oc-cupations for each industry. These were re-viewed by State agencies, the U.S. ManpowerAdministration (precursor of the U.S. Employ-ment and Training Administration), tradeunions, employer associations, and a cross-section of 535 manufacturing firms. Com-ments and suggestions from these various re-viewing sources were incorporated in the joblist and definitions. To make the survey toolsmanageable and to avoid placing unnecessaryburdens on employers, occupational lists weretailored to the identified staffing patterns ofparticular industries. This practice continuestoday.
The major changes in occupational classi-fications from the OES system to the SOCsystem were intended to achieve the follow-ing:

111
(1) Increased emphasis on the business andfinancial operations that constitute the sup-port for management occupations,
(2) A greater delineation and explicationof the professions, including:
• Computer and mathematical occupa-tions
• Architecture and engineering occupa-tions
• Life, physical, and social science occu-pations
• Community and social services occu-pations
• Legal occupations• Education, training, and library occu-
pations,
(3) A more detailed specification of ser-vice occupations, including:
• Arts, design, entertainment, sports, andmedia occupations
• Healthcare support occupations• Protective service occupations• Food preparation and serving related
occupations• Building and grounds cleaning and main-
tenance occupations• Personal care and service occupations,
and
(4) Increased coverage of installation, main-tenance, and repair occupations.
The former OES classification system wasat its most extensive in 1970, including asmany as 2,000 occupations. In 1980, theOES classification system was based on ap-proximately 800 occupations. While a di-rect cross-walk from the former OES occu-pations to the SOC detailed occupations isnot possible because of the many splits andconsolidations of old occupations into newoccupations, it is noteworthy that a core ofapproximately 800 occupations make up theskill-based foundation of the current SOC clas-sification system.
As was the practice in census classifica-tions and in the OES classification, the SOCsystem retains the use of residual categories atall levels below the major level. This featurepermits the coding of new and emerging occu-pations to be done during the initial data col-lection. Over time, it also permits the collec-tion of sufficient data on these emerging occu-
pations to justify their explicit, detailed iden-tification at the detailed occupation level ofthe SOC system.
Future DirectionsOne may rightly ask what has been accom-plished and where are we going. The answer isthat a new framework has been laid for contin-ued development of information, policy, andprograms that will ensure continued industrialdevelopment and full utilization of the Nation’sworkforce. It may be difficult to see at thistime how such a process-based system for in-dustry information will contribute. But, con-sider that we are in the midst of an economywith an increasingly important service sectorthat needs to be nurtured and further devel-oped. Look at the unexplored impacts of re-cent technology changes and consider our gain-ing an increased ability to define new produc-tion and employment opportunities. Take intoaccount the fact that a dynamically changingeconomy must be able to offer its citizens edu-cation or programs to develop skills needed toenjoy new jobs. Existing workers should havemobility opportunities based on recognitionthat skills are not tied to a particular industryor job title. These new strengths depend upondeveloping and using the kinds of informationand analyses that can put workers, educators,employers, and various workforce program ad-ministrators abreast or ahead of changing con-ditions. This will not happen overnight. Thesenew systems are now being put into use. Theyare the right answer for guiding the Nation’seconomy into Millennium 2000.
While it is too early to point to realizedbenefits, some gains from the new frameworkfor occupational analysis can be anticipated.First and foremost, more informed policy at-tention will be directed to changing job condi-tions, availability, and impacts, in our economy.Intra- and interindustry skill requirements willbe better defined; and future education andtraining programs will contribute to enhancedworker mobility and increased employer will-ingness to hire outside of traditional industrypatterns of requirements. Changes at the in-dustry level will be better accommodated bythe increased mobility opportunities of work-ers. Over the long-term, the role of work indefining socioeconomic status will be dimin-ished in favor of increasing the economic im-portance of an individual’s education andplanned acquisition of skills.

112
Exhibit 1. NAICS implementation schedule for major statistical programs
Program Data reference year Publication date
Advance employment, receipts, and payroll 1997 1999Comparative Statistics Report 1997 January 2000Bridge Between NAICS and SIC 1997 March 2000
Annual Survey of Manufactures 1998 June 2000Current Industrial Reports 1998 2000Manufactures Shipments, Inventories, and Unfilled Orders 2001 2001
Annual Trade Survey (wholesale) 1998–99 March 2001Wholesale Trade Monthly 2001 2001Annual Retail Trade Survey 1998––99 April 2001Retail Trade Monthly 2001 2001Transportation Annual Survey 1998––99 February 2001Service Annual Survey 1998––99 February 2001
County Business Patterns 1998 March 2000Quarterly Financial Report Fourth-quarter 2000 March 2001Annual Capital Expenditures Survey 1999 February 2001Manufacturing and Trade Inventory and Sales 2001 2001Research and Development Survey 1997––98 April 2001
Foreign Direct Investment Benchmark Survey 1997 1999U.S. Direct Investment Abroad Benchmark Survey 1999 2001Annual Foreign Direct Investment Survey 1998 2000Annual U.S. Direct Investment Abroad Survey 2000 2002Quarterly Foreign Direct Investment Survey 2001 2001Quarterly U.S. Direct Investment Abroad Survey 2002 2002Benchmark Input-Output Accounts 1997 2002Corporate Profits 1998 2001State Personal Income 2000 2001Gross Product Originating by Industry 2001 2002Real Inventories, Sales, and Inventory-Sales Ratios, Manufacturing and Trade 2001 2002Gross State Product by Industry 2001 2003
Employment and Wages Report (annual) 2000 2001Current Employment Statistics survey (monthly) 2002 2003Occupational Employment Statistics (annual) 2002 2003Producer Price Index/1997 Net Output Indexes (monthly) 1997 2004
BUREAU OF LABOR STATISTICS PROGRAMS
BUREAU OF ECONOMIC ANALYSIS PROGRAMS
Other programs
Services surveys
Manufacturing surveys
1997 Economic Census
CENSUS BUREAU PROGRAMS

113
SOC code Major group
11-0000 Management occupations13-0000 Business and financial operations occupations15-0000 Computer and mathematical occupations17-0000 Architecture and engineering occupations19-0000 Life, physical, and social science occupations21-0000 Community and social services occupations23-0000 Legal occupations25-0000 Education, training, and library occupations27-0000 Arts, design, entertainment, sports, and media occupations29-0000 Healthcare practitioner and technical occupations31-0000 Healthcare support occupations33-0000 Protective service occupations35-0000 Food preparation and service related occupations37-0000 Building and grounds cleaning and maintenance occupations39-0000 Personal care and service occupations41-0000 Sales and related occupations43-0000 Office and administrative support occupations45-0000 Farming, fishing, and forestry occupations47-0000 Construction and extraction occupations49-0000 Installation, maintenance, and repair occupations51-0000 Production occupations53-0000 Transportation and material moving occupations55-0000 Military-specific occupations
Exhibit 2. Structure of Standard Occupational Classification (SOC) 2000
Exhibit 3. Intermediate-level Standard OccupationalClassification (SOC) grouping
SOC code Intermediate grouping
11-13-000 Management, business, and financial15-29-000 Professional and related31-39-000 Service41-0000 Sales and related43-0000 Office and administrative support45-0000 Farming, fishing, and forestry47-0000 Construction and extraction49-0000 nstallation, maintenance, and repair51-0000 Production53-0000 Transportation and material moving55-0000 Military
114
References & Biblilography
Capelli, Peter, “Conceptual Issues in Devel-oping a System for Classifying Occupa-tions,” Standard Occupational Classifica-tion Revision Policy Committee, Seminaron Research Findings, Apr. 11, 1995.
Capelli, Peter, “Systems for Classifying Occu-pations Based on Supply and Demand,”Standard Occupational Classification Re-vision Policy Committee, Seminar on Re-search Findings, Apr. 11, 1995.
Council of Economic Advisors, EconomicReport of the President 2001, January2001.
Cunningham, J.W., Drewes, D.W., and Powell,T.E., “Framework for a Revised StandardOccupational Classification,” Standard Oc-cupational Classification Revision PolicyCommittee, Seminar on Research Findings,Apr. 11, 1995.
Duncan, Joseph W. and Shelton, William C.,Revolution in United States GovernmentStatistics 1926-1976, U.S. Department ofCommerce, October 1978.
Economic Classification Policy Committee,Issues Paper No. 1: “Conceptual Issues,”February 1993.
Economic Classification Policy Committee,Issues Paper No. 2: “Aggregation Struc-tures and Hierarchies,” February 1993.
Economic Classification Policy Committee,Issues Paper No. 3: “Collectibility Issues,”May 1993.
Economic Classification Policy Committee,Issues Paper No. 4: “Criteria for Deter-mining Industries,” October 1993.
Economic Classification Policy Committee,Issues Paper No. 5: “The Impact of Clas-sification Revisions on Time Series,” July1993.
Economic Classification Policy Committee,Issues Paper No. 6: “Services Classifica-tions,” February 1993.
Economic Classification Policy Committee,New Data for a New Economy, Washing-ton, DC, 1997.
Goldberg, Joseph P. and Moye, William T.,The First Hundred Years of the Bureau ofLabor Statistics, U.S. Department of La-
bor, September 1985.Gordon, Robert J., “Does the ‘New Economy’
Measure Up To the Great Inventions ofthe Past?” National Bureau of EconomicResearch, Working Paper 7833, August2000.
Morris, Richard B., ed., U. S. Department ofLabor Bicentennial History of the Ameri-can Worker, May 1976.
Murphy, John B., “Introducing the NorthAmerican Industry Classification System,”Monthly Labor Review, July 1998.
Pearce, Esther, History of the Standard Indus-trial Classification, unpublished memoran-dum of the Office of Statistical Standards,Bureau of the Budget, Executive Office ofthe President, July 10, 1957.
Saunders, Norman C., “The North AmericanIndustry Classification System: Change onthe Horizon,” Occupational Outlook Quar-terly, Bureau of Labor Statistics, Washing-ton, DC, fall 1999.
Schmeckebier, Laurence F., The Statistical Workof the National Government, The Institutefor Government Research, Johns HopkinsPress, Baltimore, MD, 1925.
Scoville, James G., The Job Content of the U.S.Economy, 1940-70, , , , , McGraw Hill BookCompany, 1969.
U. S. Census Bureau, History of the 1997 Eco-nomic Census, Washington, DC, July 2000.
U.S. Census Bureau, The Economic Census’97—Two Moments of Truth: 1954 and1997, Washington, DC 1998.
U. S. Department of Commerce, Bureau of theCensus, Comparative Occupational Statis-tics for the United States, 1870 to 1940,Washington, DC, 1943
U. S. Department of Commerce, Bureau of theCensus, Classified Index of Occupations,,,,,Washington, DC, various years
U. S. Department of Commerce, Bureau of theCensus, Special Reports, Occupations atthe Twelfth Census,,,,, Washington, DC, 1904
U.S. President’s Commission on Federal Sta-tistics, Federal Statistics, Report of thePresident’s Commission, Washington, DC,1971.

115
1 Joseph W. Duncan and William C. Shel-ton, Revolution in United States GovernmentStatistics 1926-1976 (Washington, U.S. De-partment of Commerce, October 1978).
2 For a fascinating discussion of the mostcritical technological developments of the pastcentury, see Robert J. Gordon, “Does the ‘NewEconomy’ Measure Up To the Great Inven-tions of the Past?” Working Paper 7833 (Cam-bridge, MA, National Bureau of EconomicResearch, August 2000).
3 An interesting history of the economiccensus program from its inception in 1810 isincluded in History of the 1997 Economic Cen-sus (U.S. Census Bureau, July, 2000).
4 Lawrence F. Schmeckebier, The Statisti-cal Work of the National Government (Balti-more, Institute for Government Research,Johns Hopkins Press, 1925).
5 For good surveys of the history of theFederal statistical system, see Duncan andShelton, Revolution in United States Govern-ment Statistics 1926-1976; Joseph P. Goldberg,and William T. Moye, The First Hundred Yearsof the Bureau of Labor Statistics (Washington,U.S. Department of Labor, September 1985);and Richard B. Morris, ed., U.S. Departmentof Labor Bicentennial Histroy of the AmericanWorker (Washington, U.S. Department of La-bor, May 1976).
6 Esther Pearce, “History of the StandardIndustrial Classification,” unpublished memo-randum (Washington, Office of Statistical Stan-dards, Bureau of the Budget, Executive Officeof the President, July 10 1957).
7 For a full background discussion of manyof the drawbacks of the SIC, refer to the seriesof Issues Papers published by the EconomicClassification Policy Committee: “No. 1: Con-ceptual Issues,” February 1993; “No. 2: Ag-gregation Structures and Hierarchies,” Febru-ary 1993; “No. 3: Collectibility Issues,” May1993; “No. 4: Criteria for Determining Indus-tries,” October 1993; “No. 5: The Impact ofClassification Revisions on Time Series,” July1993; and “No. 6: Services Classifications,”February 1993.
8 North American Industry ClassificationSystem (Washington, U.S. Office of Manage-ment and Budget, 1997).
9 New Data for a New Economy ( Washing-ton, Economic Classification Policy Commit-tee, 1997).
10 See Standard Occupational Classifica-tion Manual, 2000 (Washington, U.S. Officeof Management and Budget, 2000); and J.W.Cunningham, Donald W. Drewes, and ThomasPowell, “Framework For A Revised StandardOccupational Classification,” Paper presentedbefore the Standard Occupational Classifica-tion Revision Policy Committee, Seminar onResearch Findings, Apr. 11, 1995, pp. 69 and91. Tasks generally are specified in employerposition descriptions and as part of job titlesin the Dictionary of Occupational Titles andthe O*NET.
11 Peter Capelli, “Conceptual Issues in De-veloping a System for Classifying Occupations,”Paper presented before the Standard Occupa-tional Classification Revision Policy Commit-tee, Seminar of Research Findings, Apr. 11,1995, pp.13-14
12 Capelli, “Conceptual Issues,” p. 8.13 Capelli, “Conceptual Issues,” p. 10.14 Or other differences. For example, psy-
chiatrists, clinical psychologists, mental healthsocial workers, and substance abuse and behav-ior disorder counselors all have some commonjob tasks, but each is generally classified withoccupations that have similar education back-grounds and licensing. Location or populationserved may also be factors, for example, todistinguish between elementary, secondary,college and university, and adult educationteachers.
15 James G. Scoville, The Job Content ofthe U.S. Economy 1940-70 (New York,McGraw Hill Book Company, 1969), pp. 18-19.
16 In 1996, the BLS occupational projec-tions program grouped occupations by 13 lev-els of education and training categories, rang-ing from professional or doctoral degree toshort-term on-the-job training.
17 Operated by the State employment ser-vices. See Dictionary of Occupational Titles,4th ed. (Washington, U.S. Department of La-bor, Employment and Training Administra-tion, 1977), pp. ix and xiv.
18 See, for example, Paulette Meleen andothers, Identifying and Planning for New andEmerging Occupations: A Suggested GuideBelmont, MA, Contract Research Corpora-tion, 1976.)
19 During the early years of computers,responsibility for education and training re-
Endnotes

116
sided almost exclusively with computer manu-facturers, who provided it to the staffs of theircustomers. Educational institutions lackedboth expensive computer equipment and thepeople qualified to teach other to use it.
20 Trade and transportation industries weresplit; extraction of minerals and public ser-vice, not elsewhere classified (including pro-tective service occupations) became separateindustry groups; and clerical occupations, ex-cept those related to transportation, were placedin a separate group.
21 While there is little direct reference tosocial status in most census publications, a re-port by Dr. Alba M. Edwards, ComparativeOccupations Statistics for the United States,1870 to 1940, pp. 176-77, provides a muchmore socioeconomic approach. Edwards of-fers a modified classification to provide a closerapproximation to socioeconomic class:
Professional personsProprietors, managers, and officials (in-
cluding farmers)Clerks and kindred (including sales) workersSkilled workers and foremenSemiskilled workersUnskilled workers, including laborers and
servant classesThe service worker categories are elimi-
nated, with household workers included withunskilled workers, police and firemen withskilled workers, and most others with semi-skilled workers. The goal was a classificationmore useful for analyzing social and economicproblems.
22 Clerical and sales were separated in 1950and transportation equipment operatives wereseparated from operatives, except transporta-tion, in 1970.
23 This may be the most heterogeneousgroup in terms of work function, but the com-mon element in this group is “performs advi-sory, administrative, or research work which isbased upon the established principles of a pro-fession or science… and requires …trainingequivalent to that represented by graduationfor a college or university…or extensive prac-
tical experience.” See Classified Index of Oc-cupations (Bureau of the Census, 1940), p. 2.This group was renamed professional, techni-cal, and kindred in 1950.
24 See Population, the Labor Force (sampleStatistics) Occupational Characteristics, Table19, Occupation of Employed Persons by In-dustry and Sex for the United States, March1940. It showed 116 occupations for men and52 for women, by 132 industries.
25 See BLS Handbook of Methods, Bulletin2490 (Bureau of Labor Statistics, April 1997),pp. 125-26.
26 The only exceptions were engineers, andmechanics and repairmen.
27 Standard Occupational ClassificationManual 2000, p. xii.
28 The 1980 SOC had 22.29 See Edwards, Comparative Occupations
Statistics, p. 109, fn. 130.30 In 1920, titles such as auto mechanic
and auto repairer were placed in an other me-chanic category.
31 Automotive engineers, which also ap-peared as a title in 1920 under mechanicalengineers, never became a separate occupa-tion.
32 C. Joseph Pusateri, A History of Ameri-can Business (Arlington Heights, IL, HarlanDavidson, Inc., 1984), p. 280.
33 One of the twelve, computer (hardware)engineers, is classified under engineers and an-other, computer and information systemsmanagers, under management occupations.
34 Engineering managers are under manage-ment occupations.
35 No Classified Index is available for 1900;these titles are listed in the 1910 Index, whichis based on the occupations returned at the1900 census, supplemented with about 400other occupations added in the 1910 census.
36 Ibid.37 There also was a vast increase in the
number of office and administrative support(clerical) occupations between 1900 and 2000.
38 With support from the National ScienceFoundation.
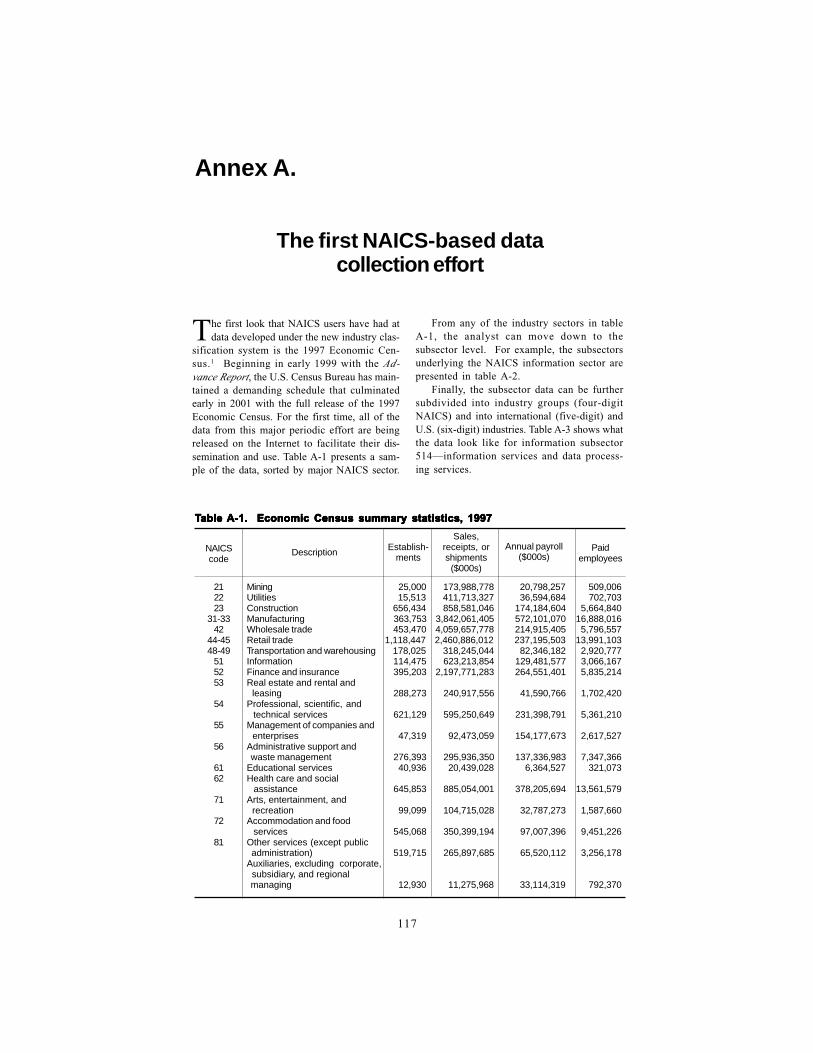
117
The first look that NAICS users have had atdata developed under the new industry clas-
sification system is the 1997 Economic Cen-sus.1 Beginning in early 1999 with the Ad-vance Report, the U.S. Census Bureau has main-tained a demanding schedule that culminatedearly in 2001 with the full release of the 1997Economic Census. For the first time, all of thedata from this major periodic effort are beingreleased on the Internet to facilitate their dis-semination and use. Table A-1 presents a sam-ple of the data, sorted by major NAICS sector.
Annex A.
The first NAICS-based datacollection effort
From any of the industry sectors in tableA-1, the analyst can move down to thesubsector level. For example, the subsectorsunderlying the NAICS information sector arepresented in table A-2.
Finally, the subsector data can be furthersubdivided into industry groups (four-digitNAICS) and into international (five-digit) andU.S. (six-digit) industries. Table A-3 shows whatthe data look like for information subsector514—information services and data process-ing services.
TTTTTable able able able able A-1. Economic Census summary statistics, 1997A-1. Economic Census summary statistics, 1997A-1. Economic Census summary statistics, 1997A-1. Economic Census summary statistics, 1997A-1. Economic Census summary statistics, 1997
21 Mining 25,000 173,988,778 20,798,257 509,00622 Utilities 15,513 411,713,327 36,594,684 702,70323 Construction 656,434 858,581,046 174,184,604 5,664,840
31-33 Manufacturing 363,753 3,842,061,405 572,101,070 16,888,01642 Wholesale trade 453,470 4,059,657,778 214,915,405 5,796,557
44-45 Retail trade 1,118,447 2,460,886,012 237,195,503 13,991,10348-49 Transportation and warehousing 178,025 318,245,044 82,346,182 2,920,777
51 Information 114,475 623,213,854 129,481,577 3,066,16752 Finance and insurance 395,203 2,197,771,283 264,551,401 5,835,21453 Real estate and rental and
leasing 288,273 240,917,556 41,590,766 1,702,42054 Professional, scientific, and
technical services 621,129 595,250,649 231,398,791 5,361,21055 Management of companies and
enterprises 47,319 92,473,059 154,177,673 2,617,52756 Administrative support and
waste management 276,393 295,936,350 137,336,983 7,347,36661 Educational services 40,936 20,439,028 6,364,527 321,07362 Health care and social
assistance 645,853 885,054,001 378,205,694 13,561,57971 Arts, entertainment, and
recreation 99,099 104,715,028 32,787,273 1,587,66072 Accommodation and food
services 545,068 350,399,194 97,007,396 9,451,22681 Other services (except public
administration) 519,715 265,897,685 65,520,112 3,256,178Auxiliaries, excluding corporate, subsidiary, and regional managing 12,930 11,275,968 33,114,319 792,370
NAICScode
Description Establish-ments
Sales,receipts, orshipments
($000s)
Annual payroll($000s)
Paidemployees

118
All of these data are accompanied by massesof documentation and definitions, SIC-baseddata for 1992 and 1997, and detailed bridgetables allowing the data user to go backwardsand forwards from NAICS to SIC and vice versa.To fully appreciate the breadth and depth ofthe data associated with the 1997 EconomicCensus, and to begin to appreciate the manyramifications of the NAICS industry sectoringscheme, the reader should plan on spending
significant amounts of time at the Census Bu-reau Web site pages dedicated both to NAICS( h t t p : / / w w wh t t p : / / w w wh t t p : / / w w wh t t p : / / w w wh t t p : / / w w w. c e n s u s . g o v / e p c d / w w w /. c e n s u s . g o v / e p c d / w w w /. c e n s u s . g o v / e p c d / w w w /. c e n s u s . g o v / e p c d / w w w /. c e n s u s . g o v / e p c d / w w w /naics.htmlnaics.htmlnaics.htmlnaics.htmlnaics.html) and to the 1997 Economic Cen-sus (http://wwwhttp://wwwhttp://wwwhttp://wwwhttp://www.census.gov/epcd/www/.census.gov/epcd/www/.census.gov/epcd/www/.census.gov/epcd/www/.census.gov/epcd/www/econ97.htmlecon97.htmlecon97.htmlecon97.htmlecon97.html).
1 The Economic Census ’97—Two Momentsof Truth: 1954 and 1997 (Census Bureau,1998).
Description Establish-ments
Sales,receipts, orshipments
($000s)
Annual payroll($000s)
Paidemployees
TTTTTable able able able able A-2. Economic Census, information subsector statistics, 1997A-2. Economic Census, information subsector statistics, 1997A-2. Economic Census, information subsector statistics, 1997A-2. Economic Census, information subsector statistics, 1997A-2. Economic Census, information subsector statistics, 1997
51 Information 114,475 623,213,854 129,481,577 3,066,167511 Publishing industries 33,896 179,035,423 43,358,072 1,006,214512 Motion picture and sound
recording industries 22,204 55,925,533 9,392,048 275,98151 Broadcasting and
Telecommunications 43,480 346,315,686 63,479,623 1,434,455514 Information services and
data processing services 14,895 41,937,212 13,251,834 349,517
NAICScode
TTTTTable able able able able A-3. Economic Census, information services industry statistics, 1997A-3. Economic Census, information services industry statistics, 1997A-3. Economic Census, information services industry statistics, 1997A-3. Economic Census, information services industry statistics, 1997A-3. Economic Census, information services industry statistics, 1997
514 Information services and data processing services 14,895 41,937,212 13,251,834 349,517
5141 Information services 7,307 11,100,567 3,477,977 87,26751411 News syndicates 527 1,402,374 465,466 9,48351412 Libraries and archives 2,298 860,933 373,164 22,04451419 Other information services 4,482 8,837,260 2,639,347 55,740514191 Online information services 4,165 8,042,568 2,355,992 49,935514199 All other information services 317 794,692 283,355 5,8055142 Data processing services 7,588 30,836,645 9,773,857 262,250
DescriptionEstablish-
ments
Sales,receipts, orshipments
($000s)
Annual payroll($000s)
Paidemployees
NAICScode

119
1900 Kodak introduces $1 Brownie cameras
1901 First trans-Atlantic radio signal1903 First flight at Kitty Hawk1907 First electric washing machine
1913 Henry Ford creates assembly line1914 Panama Canal officially opened
1920 First commercial radio broadcastaired
1923 Talking movies invented1926 Robert Goddard fires his first
liquid-fuel rocket1927 Lindbergh flies solo across the
AtlanticTelevision (TV) invented
1928 Penicillin discovered
1931 Empire State Building completed1932 Air conditioning invented1939 Helicopter invented
Prototype digital computer
1945 Atomic bombFirst computer built
1947 Microwave oven inventedChuck Yeager breaks the sound
barrier
1950 First organ transplant1951 Color TV introduced
First commercial computer (UNIVAC I)1952 Polio vaccine created1953 DNA discovered1956 TV remote control invented
Velcro introduced
1957 Soviet satelli te, Sputnik, launches Space Age
1958 NASA founded
1960 Lasers invented1961 Soviets launch first man in space1965 Minicomputer1967 First heart transplant1969 Astronaut walks on the Moon
ARPANET, the precursor of the Internet, created
1970 Computer floppy disks introduced Optical fiber
1971 Videocassette recorder (VCR)introduced
1972 Pocket calculators introduced1974 Bar Code (UPC)1976 Supercomputer1978 First test-tube baby born1979 Nuclear accident at Three
Mile Island
1981 Personal computer (PC)introduced by IBM
1982 Artificial heart1985 First approval for selling
genetically altered organism
1990 Hubble Telescope launched intospace
1993 Use of the Internet grows exponentially
1994 Channel Tunnel (Chunnel) opens, connecting Britain and France
1997 Pathfinder sends back images of Mars Scientists clone sheep, Dolly
1999 Fear of Y2K (Year 2000) Bug
Technological Timeline
121
APPENDIXAPPENDIXAPPENDIXAPPENDIXAPPENDIX
Statistical Tables
The tables in this appendix to the Report on the American Workforce are organized alongthematic lines, rather than by the program office responsible for collecting them. This
extends the ideas suggested In Background Paper No. 22, National Commission on Employmentand Unemployment Statistics, “Improving the Presentation of Employment and Unemploy-ment Statistics.” Unless noted otherwise, data are from the Bureau of Labor Statistics, U.S.Department of Labor. Technical descriptions of their sources, methods, and limitations arefound in BLS Handbook of Methods, Bulletin 2490 (1997).
Section
1. General conditions in the labor market .................................................................... 122
2. Employment and the labor force ............................................................................... 125
3. Wages and productivity ............................................................................................... 142
4. Earnings, prices, and expenditures ............................................................................. 159
5. Benefits and working conditions ................................................................................ 179
6. Unemployment ............................................................................................................ 190
7. International comparisons ......................................................................................... 195
Page
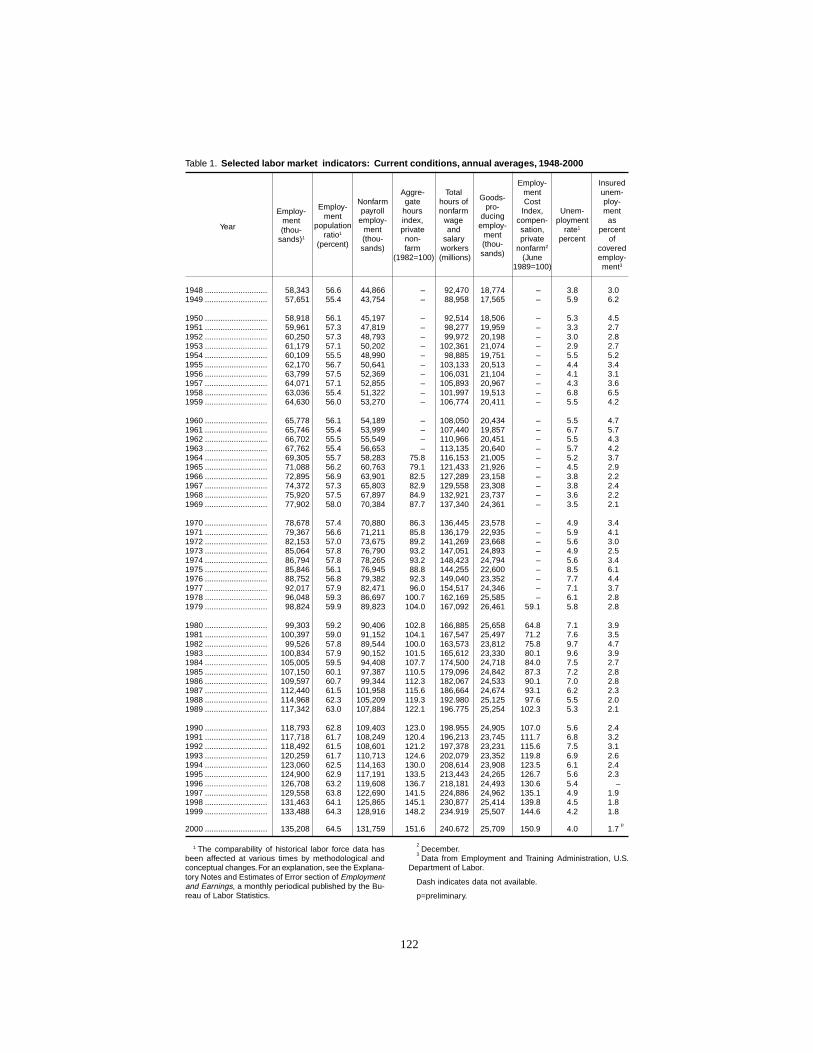
122
Table 1. Selected labor market indicators: Current conditions, annual averages, 1948-2000
Employ- InsuredAggre- Total ment unem-
Nonfarm gate hours of Cost ploy-Employ- payroll hours nonfarm Index, Unem- ment
ment employ- index, wage compen- ployment aspopulation ment private and sation, rate1 percent
ratio1(thou- non- salary private percent of
(percent) sands) farm workers nonfarm2 covered(1982=100) (millions) (June employ-
1989=100) ment3
1948 ............................ 58,343 56.6 44,866 – 92,470 18,774 – 3.8 3.01949 ............................ 57,651 55.4 43,754 – 88,958 17,565 – 5.9 6.2
1950 ............................ 58,918 56.1 45,197 – 92,514 18,506 – 5.3 4.51951 ............................ 59,961 57.3 47,819 – 98,277 19,959 – 3.3 2.71952 ............................ 60,250 57.3 48,793 – 99,972 20,198 – 3.0 2.81953 ............................ 61,179 57.1 50,202 – 102,361 21,074 – 2.9 2.71954 ............................ 60,109 55.5 48,990 – 98,885 19,751 – 5.5 5.21955 ............................ 62,170 56.7 50,641 – 103,133 20,513 – 4.4 3.41956 ............................ 63,799 57.5 52,369 – 106,031 21,104 – 4.1 3.11957 ............................ 64,071 57.1 52,855 – 105,893 20,967 – 4.3 3.61958 ............................ 63,036 55.4 51,322 – 101,997 19,513 – 6.8 6.51959 ............................ 64,630 56.0 53,270 – 106,774 20,411 – 5.5 4.2
1960 ............................ 65,778 56.1 54,189 – 108,050 20,434 – 5.5 4.71961 ............................ 65,746 55.4 53,999 – 107,440 19,857 – 6.7 5.71962 ............................ 66,702 55.5 55,549 – 110,966 20,451 – 5.5 4.31963 ............................ 67,762 55.4 56,653 – 113,135 20,640 – 5.7 4.21964 ............................ 69,305 55.7 58,283 75.8 116,153 21,005 – 5.2 3.71965 ............................ 71,088 56.2 60,763 79.1 121,433 21,926 – 4.5 2.91966 ............................ 72,895 56.9 63,901 82.5 127,289 23,158 – 3.8 2.21967 ............................ 74,372 57.3 65,803 82.9 129,558 23,308 – 3.8 2.41968 ............................ 75,920 57.5 67,897 84.9 132,921 23,737 – 3.6 2.21969 ............................ 77,902 58.0 70,384 87.7 137,340 24,361 – 3.5 2.1
1970 ............................ 78,678 57.4 70,880 86.3 136,445 23,578 – 4.9 3.41971 ............................ 79,367 56.6 71,211 85.8 136,179 22,935 – 5.9 4.11972 ............................ 82,153 57.0 73,675 89.2 141,269 23,668 – 5.6 3.01973 ............................ 85,064 57.8 76,790 93.2 147,051 24,893 – 4.9 2.51974 ............................ 86,794 57.8 78,265 93.2 148,423 24,794 – 5.6 3.41975 ............................ 85,846 56.1 76,945 88.8 144,255 22,600 – 8.5 6.11976 ............................ 88,752 56.8 79,382 92.3 149,040 23,352 – 7.7 4.41977 ............................ 92,017 57.9 82,471 96.0 154,517 24,346 – 7.1 3.71978 ............................ 96,048 59.3 86,697 100.7 162,169 25,585 – 6.1 2.81979 ............................ 98,824 59.9 89,823 104.0 167,092 26,461 59.1 5.8 2.8
1980 ............................ 99,303 59.2 90,406 102.8 166,885 25,658 64.8 7.1 3.91981 ............................ 100,397 59.0 91,152 104.1 167,547 25,497 71.2 7.6 3.51982 ............................ 99,526 57.8 89,544 100.0 163,573 23,812 75.8 9.7 4.71983 ............................ 100,834 57.9 90,152 101.5 165,612 23,330 80.1 9.6 3.91984 ............................ 105,005 59.5 94,408 107.7 174,500 24,718 84.0 7.5 2.71985 ............................ 107,150 60.1 97,387 110.5 179,096 24,842 87.3 7.2 2.81986 ............................ 109,597 60.7 99,344 112.3 182,067 24,533 90.1 7.0 2.81987 ............................ 112,440 61.5 101,958 115.6 186,664 24,674 93.1 6.2 2.31988 ............................ 114,968 62.3 105,209 119.3 192.980 25,125 97.6 5.5 2.01989 ............................ 117,342 63.0 107,884 122.1 196.775 25,254 102.3 5.3 2.1
1990 ............................ 118,793 62.8 109,403 123.0 198.955 24,905 107.0 5.6 2.41991 ............................ 117,718 61.7 108,249 120.4 196,213 23,745 111.7 6.8 3.21992 ............................ 118,492 61.5 108,601 121.2 197,378 23,231 115.6 7.5 3.11993 ............................ 120,259 61.7 110,713 124.6 202,079 23,352 119.8 6.9 2.61994 ............................ 123,060 62.5 114,163 130.0 208,614 23,908 123.5 6.1 2.41995 ............................ 124,900 62.9 117,191 133.5 213,443 24,265 126.7 5.6 2.31996 ............................ 126,708 63.2 119,608 136.7 218,181 24,493 130.6 5.4 –1997 ............................ 129,558 63.8 122,690 141.5 224,886 24,962 135.1 4.9 1.91998 ............................ 131,463 64.1 125,865 145.1 230,877 25,414 139.8 4.5 1.81999 ............................ 133,488 64.3 128,916 148.2 234.919 25,507 144.6 4.2 1.8
2000 ............................ 135,208 64.5 131,759 151.6 240.672 25,709 150.9 4.0 1.7 p
Employ-ment(thou-
sands)1
Goods-pro-
ducingemploy-
ment(thou-sands)
Year
1 The comparability of historical labor force data hasbeen affected at various times by methodological andconceptual changes. For an explanation, see the Explana-tory Notes and Estimates of Error section of Employmentand Earnings, a monthly periodical published by the Bu-reau of Labor Statistics.
2December.
3Data from Employment and Training Administration, U.S.
Department of Labor.
Dash indicates data not available.
p=preliminary.

123
Table 2. Selected labor market indicators: Cyclically sensitive conditions, annual averages, 1948-2000
ProducerManufacturing Unemployed
1
Price Indexfor crude non- Job losers onfood materials, Average Average temporary layoff
less energy workweek overtime hours as percent of(1982=100) civilian labor force
1948 ................. – 40.0 – 1,300 – –1949 ................. – 39.1 – 1,756 – –
1950 ................. – 40.5 – 1,450 – –1951 ................. – 40.6 – 1,177 – –1952 ................. – 40.7 – 1,135 – –1953 ................. – 40.5 – 1,142 – –1954 ................. – 39.6 – 1,605 – –1955 ................. – 40.7 – 1,335 – 9051956 ................. – 40.4 2.8 1,412 – 1,0131957 ................. – 39.8 2.3 1,408 – 1,1801958 ................. – 39.2 2.0 1,753 – 1,6951959 ................. – 40.3 2.7 1,585 – 1,078
1960 ................. – 39.7 2.5 1,719 – 1,3001961 ................. – 39.8 2.4 1,806 – 1,4291962 ................. – 40.4 2.8 1,663 – 1,0771963 ................. – 40.5 2.8 1,751 – 1,0601964 ................. – 40.7 3.1 1,697 – 9721965 ................. – 41.2 3.6 1,628 – 8681966 ................. – 41.4 3.9 1,573 – 7271967 ................. – 40.6 3.4 1,634 0.5 9791968 ................. – 40.7 3.6 1,594 .4 7941969 ................. – 40.6 3.6 1,629 .4 838
1970 ................. – 39.8 3.0 2,139 .8 1,1261971 ................. – 39.9 2.9 2,245 .9 1,2451972 ................. – 40.5 3.5 2,242 .7 1,0791973 ................. 70.8 40.7 3.8 2,224 .5 1,0671974 ................. 83.3 40.0 3.3 2,604 .8 1,3391975 ................. 69.3 39.5 2.6 2,940 1.8 1,9251976 ................. 80.2 40.1 3.1 2,844 1.1 1,5501977 ................. 79.8 40.3 3.5 2,919 .9 1,4721978 ................. 87.8 40.4 3.6 2,865 .7 1,3911979 ................. 106.2 40.2 3.3 2,950 .8 1,518
1980 ................. 113.1 39.7 2.8 3,295 1.4 2,0931981 ................. 111.7 39.8 2.8 3,449 1.3 2,2511982 ................. 100.0 38.9 2.3 3,883 1.9 3,0501983 ................. 105.3 40.1 3.0 3,570 1.6 2,6841984 ................. 111.7 40.7 3.4 3,350 1.0 2,2911985 ................. 104.9 40.5 3.3 3,498 1.0 2,2731986 ................. 103.1 40.7 3.4 3,448 .9 2,3051987 ................. 115.7 41.0 3.7 3,246 .8 2,2011988 ................. 133.0 41.1 3.9 3,084 .7 2,1991989 ................. 137.9 41.0 3.8 3,174 .7 2,143
1990 ................. 136.3 40.8 3.6 3,265 .8 2,4091991 ................. 128.2 40.7 3.6 3,480 1.0 3,0591992 ................. 128.4 41.0 3.8 3,376 1.0 3,0941993 ................. 140.2 41.4 4.1 3,262 .9 3,0331994 ................. 156.2 42.0 4.7 2,728 .7 2,3111995 ................. 173.6 41.6 4.4 2,700 .8 2,3461996 ................. 155.8 41.6 4.5 2,633 .8 2,2631997 ................. 156.5 42.0 4.8 2,538 .7 2,1671998 ................. 142.1 41.7 4.6 2,622 .6 1,9971999 ................. 135.2 41.7 4.6 2,568 .6 1,861
2000 ................. 145.2 41.6 4.6 2,543 .6 1,835
Year
1 The comparability of historical labor force data has beenaffected at various times by methodological and conceptualchanges. For an explanation, see the Explanatory Notes andEstimates of Error section of Employment and Earnings,
Less than 5weeks
(in thousands)
Nonagriculturalworkers on part-time schedulesfor economic
reasons,slack workor businessconditions
1
(in thousands)
a monthly periodical published by the Bureau of LaborStatistics.
Dash indicates data not available.

124
Table 3. Selected labor market indicators: Processes requiring additional time to complete the cycle,annual averages, 1948-2000
Consumer Price Index Unit labor costs Duration of unemployment (weeks)1
Year (CPI-U) for services business sector(1982-84=100) (1992=100) Mean Median
1948 .............................................. 15.6 22.2 8.6 –1949 .............................................. 16.4 22.0 10.0 –
1950 .............................................. 16.9 21.8 12.1 –1951 .............................................. 17.8 23.2 9.7 –1952 .............................................. 18.6 23.9 8.4 –1953 .............................................. 19.4 24.5 8.0 –1954 .............................................. 20.0 24.8 11.8 –1955 .............................................. 20.4 24.4 13.0 –1956 .............................................. 20.9 26.0 11.3 –1957 .............................................. 21.8 26.9 10.5 –1958 .............................................. 22.6 27.3 13.9 –1959 .............................................. 23.3 27.4 14.4 –
1960 .............................................. 24.1 28.0 12.8 –1961 .............................................. 24.5 28.1 15.6 –1962 .............................................. 25.0 28.1 14.7 –1963 .............................................. 25.5 28.0 14.0 –1964 .............................................. 26.0 28.2 13.3 –1965 .............................................. 26.6 28.2 11.8 –1966 .............................................. 27.6 28.9 10.4 –1967 .............................................. 28.8 29.9 8.7 2.31968 .............................................. 30.3 31.3 8.4 4.51969 .............................................. 32.4 33.3 7.8 4.4
1970 .............................................. 35.0 35.1 8.6 4.91971 .............................................. 37.0 35.8 11.3 6.31972 .............................................. 38.4 36.8 12.0 6.21973 .............................................. 40.1 38.8 10.0 5.21974 .............................................. 43.8 43.2 9.8 5.21975 .............................................. 48.0 46.1 14.2 8.41976 .............................................. 52.0 48.4 15.8 8.21977 .............................................. 56.0 51.4 14.3 7.01978 .............................................. 60.8 55.3 11.9 5.91979 .............................................. 67.5 60.7 10.8 5.4
1980 .............................................. 77.9 67.4 11.9 6.51981 .............................................. 88.1 72.4 13.7 6.91982 .............................................. 96.0 78.2 15.6 8.71983 .............................................. 99.4 78.6 20.0 10.11984 .............................................. 104.6 79.8 18.2 7.91985 .............................................. 109.9 82.1 15.6 6.81986 .............................................. 115.4 83.9 15.0 6.91987 .............................................. 120.2 86.7 14.5 6.51988 .............................................. 125.7 89.8 13.5 5.91989 .............................................. 131.9 91.3 11.9 4.8
1990 .............................................. 139.2 95.3 12.0 5.31991 .............................................. 146.3 98.7 13.7 6.81992 .............................................. 152.0 100.0 17.7 8.71993 .............................................. 157.9 101.9 18.0 8.31994 .............................................. 163.1 102.6 18.8 9.21995 .............................................. 168.7 104.1 16.6 8.31996 .............................................. 174.1 104.5 16.7 8.31997 .............................................. 179.4 105.3 15.8 8.01998 .............................................. 184.2 108.0 14.5 6.71999 .............................................. 188.8 109.9 13.4 6.4
2000 .............................................. 195.3 110.7 12.6 5.9
1 The comparability of historical labor force data has beenaffected at various times by methodological and conceptualchanges. For an explanation, see the Explanatory Notes andEstimates of Error section of Employment and Earnings,
monthly periodical published by the Bureau of LaborStatistics.
Dash indicates data not available.

125
Table 4. Civilian labor force for selected demographic groups, annual averages, 1948-2000
Total, 16 Men, 20 Women, Bothyears years 20 years sexes,and and and 16 to 19over over over years
1948 ................. 60,621 40,687 15,500 4,435 – – – –1949 ................. 61,286 41,022 15,978 4,288 – – – –
1950 ................. 62,208 41,316 16,678 4,216 – – – –1951 ................. 62,017 40,655 17,259 4,103 – – – –1952 ................. 62,138 40,558 17,517 4,064 – – – –19531 ................ 63,015 41,315 17,674 4,027 – – – –1954 ................. 63,643 41,669 17,997 3,976 56,816 6,825 –1955 ................. 65,023 42,106 18,825 4,092 58,085 6,942 – –1956 ................. 66,552 42,658 19,599 4,296 59,428 7,125 – –1957 ................. 66,929 42,780 19,873 4,275 59,754 7,174 – –1958 ................. 67,639 43,092 20,285 4,260 60,293 7,346 – –1959 ................. 68,369 43,289 20,587 4,492 60,952 7,416 – –
19601 ................ 69,628 43,603 21,185 4,841 61,915 7,716 – –1961 ................. 70,459 43,860 21,664 4,936 62,656 7,804 – –19621 ................ 70,614 43,831 21,868 4,916 62,750 7,864 – –1963 ................. 71,833 44,222 22,473 5,139 63,830 8,003 – –1964 ................. 73,091 44,604 23,098 5,388 64,921 8,170 – –1965 ................. 74,455 44,857 23,686 5,910 66,137 8,321 – –1966 ................. 75,770 44,788 24,431 6,558 67,276 8,499 – –1967 ................. 77,347 45,354 25,475 6,521 68,699 8,649 – –1968 ................. 78,737 45,852 26,266 6,619 69,976 8,759 – –1969 ................. 80,734 46,351 27,413 6,970 71,778 8,955 – –
1970 ................. 82,771 47,220 28,301 7,249 73,556 9,218 – –1971 ................. 84,382 48,009 28,904 7,470 74,963 9,418 – –19721 ................ 87,034 49,079 29,901 8,054 77,275 9,761 8,707 –19731 ................ 89,429 49,932 30,991 8,507 79,151 10,280 8,976 –1974 ................. 91,949 50,879 32,201 8,871 81,281 10,668 9,167 –1975 ................. 93,775 51,494 33,410 8,870 82,831 10,942 9,263 –1976 ................. 96,158 52,288 34,814 9,056 84,767 11,391 9,561 –1977 ................. 99,009 53,348 36,310 9,351 87,141 11,867 9,932 –19781 ................ 102,251 54,471 38,128 9,652 89,634 12,617 10,432 –1979 ................. 104,962 55,615 39,708 9,638 91,923 13,038 10,678 –
1980 ................. 106,940 56,455 41,106 9,378 93,600 13,340 10,865 6,1461981 ................. 108,670 57,197 42,485 8,988 95,052 13,618 11,086 6,4921982 ................. 110,204 57,980 43,699 8,526 96,143 14,061 11,331 6,7341983 ................. 111,550 58,744 44,636 8,171 97,021 14,529 11,647 7,0331984 ................. 113,544 59,701 45,900 7,943 98,492 15,052 12,033 7,4511985 ................. 115,461 60,277 47,283 7,901 99,926 15,535 12,364 7,69819861 ................ 117,834 61,320 48,589 7,926 101,801 16,034 12,654 8,0761987 ................. 119,865 62,095 49,783 7,988 103,290 16,576 12,993 8,5411988 ................. 121,669 62,768 50,870 8,031 104,756 16,913 13,205 8,9821989 ................. 123,869 63,704 52,212 7,954 106,355 17,514 13,497 9,323
19901 ................ 125,840 64,916 53,131 7,792 107,447 18,393 13,740 10,7201991 ................. 126,346 65,374 53,708 7,265 107,743 18,604 13,797 10,9201992 ................. 128,105 66,213 54,796 7,096 108,837 19,268 14,162 11,3381993 ................. 129,200 66,642 55,388 7,170 109,700 19,500 14,225 11,61019941 ................ 131,056 66,921 56,655 7,481 111,082 19,974 14,502 11,9751995 ................. 132,304 67,324 57,215 7,765 111,950 20,354 14,817 12,2671996 ................. 133,943 68,044 58,094 7,806 113,108 20,835 15,134 12,77419971 ................ 136,297 69,166 59,198 7,932 114,693 21,604 15,529 13,79619981 ................ 137,673 69,715 59,702 8,256 115,415 22,259 15,982 14,31719991 ................ 139,368 70,194 60,840 8,333 116,509 22,859 16,365 14,665
20001 ................ 140,863 70,930 61,565 8,369 117,574 23,289 16,603 15,368
Year White
(In thousands)
Blackand
otherBlack Hispanic
origin
1 The comparability of historical labor force data has beenaffected at various times by methodological and conceptualchanges. For an explanation, see the Explanatory Notes andEstimates of Error section of Employment and Earnings,a monthly periodical published by the Bureau of LaborStatistics.
NOTE: Detail for the above race and Hispanic-origin groupswill not sum to totals because data for the "other races" groupare not presented and Hispanics are included in both thewhite and black population groups. Dash indicates data arenot available.

126
Total, 16 Men, 20 Women, Bothyears years 20 years sexes,and and and 16 to 19over over over years
1948 ................. 58.8 88.6 31.8 52.5 – – – –1949 ................. 58.9 88.5 32.3 52.2 – – – –
1950 ................. 59.2 88.4 33.3 51.8 – – – –1951 ................. 59.2 88.2 34.0 52.2 – – –1952 ................. 59.0 88.3 34.1 51.3 – – – –19531 ................ 58.9 88.0 33.9 50.21954 ................. 58.8 87.8 34.2 48.3 58.2 64.0 – –1955 ................. 59.3 87.6 35.4 48.9 58.7 64.21956 ................. 60.0 87.6 36.4 50.9 59.4 64.9 – –1957 ................. 59.6 86.9 36.5 49.6 59.1 64.4 – –1958 ................. 59.5 86.6 36.9 47.4 58.9 64.8 – –1959 ................. 59.3 86.3 37.1 46.7 58.7 64.3 – –
19601 ................ 59.4 86.0 37.6 47.5 58.8 64.5 – –1961 ................. 59.3 85.7 38.0 46.9 58.8 64.1 –19621 ................ 58.8 84.8 37.8 46.1 58.3 63.2 – –1963 ................. 58.7 84.4 38.3 45.2 58.2 63.0 – –1964 ................. 58.7 84.2 38.9 44.5 58.2 63.1 – –1965 ................. 58.9 83.9 39.4 45.7 58.4 62.9 – –1966 ................. 59.2 83.6 40.1 48.2 58.7 63.0 – –1967 ................. 59.6 83.4 41.1 48.4 59.2 62.8 – –1968 ................. 59.6 83.1 41.6 48.3 59.3 62.2 – –1969 ................. 60.1 82.8 42.7 49.4 59.9 62.1 – –
1970 ................. 60.4 82.6 43.3 49.9 60.2 61.8 – –1971 ................. 60.2 82.1 43.3 49.7 60.1 60.9 – –19721 ................ 60.4 81.6 43.7 51.9 60.4 60.2 59.9 –19731 ................ 60.8 81.3 44.4 53.7 60.8 60.5 60.2 –1974 ................. 61.3 81.0 45.3 54.8 61.4 60.3 59.8 –1975 ................. 61.2 80.3 46.0 54.0 61.5 59.6 58.8 –1976 ................. 61.6 79.8 47.0 54.5 61.8 59.8 59.0 –1977 ................. 62.3 79.7 48.1 56.0 62.5 60.4 59.8 –19781 ................ 63.2 79.8 49.6 57.8 63.3 62.2 61.5 –1979 ................. 63.7 79.8 50.6 57.9 63.9 62.2 61.4 –
1980 ................. 63.8 79.4 51.3 56.7 64.1 61.7 61.0 64.01981 ................. 63.9 79.0 52.1 55.4 64.3 61.3 60.8 64.11982 ................. 64.0 78.7 52.7 54.1 64.3 61.6 61.0 63.61983 ................. 64.0 78.5 53.1 53.5 64.3 62.1 61.5 63.81984 ................. 64.4 78.3 53.7 53.9 64.6 62.6 62.2 64.91985 ................. 64.8 78.1 54.7 54.5 65.0 63.3 62.9 64.619861 ................ 65.3 78.1 55.5 54.7 65.5 63.7 63.3 65.41987 ................. 65.6 78.0 56.2 54.7 65.8 64.3 63.8 66.41988 ................. 65.9 77.9 56.8 55.3 66.2 64.0 63.8 67.41989 ................. 66.5 78.1 57.7 55.9 66.7 64.7 64.2 67.6
19901 ................ 66.5 78.2 58.0 53.7 66.9 64.4 64.0 67.41991 ................. 66.2 77.7 57.9 51.6 66.6 63.8 63.3 66.51992 ................. 66.4 77.7 58.5 51.3 66.8 64.6 63.9 66.81993 ................. 66.3 77.3 58.5 51.5 66.8 63.8 63.2 66.219941 ................ 66.6 76.8 59.3 52.7 67.1 63.9 63.4 66.11995 ................. 66.6 76.7 59.4 53.5 67.1 64.3 63.7 65.81996 ................. 66.8 76.8 59.9 52.3 67.2 64.6 64.1 66.519971 ................ 67.1 77.0 60.5 51.6 67.5 65.2 64.7 67.919981 ................ 67.1 76.8 60.4 52.8 67.3 66.0 65.6 67.919991 ................ 67.1 76.7 60.7 52.0 67.3 65.9 65.8 67.7
20001 ................ 67.2 76.6 60.9 52.2 67.4 66.0 65.8 68.6
BlackYearBlackand
otherWhite Hispanic
origin
Table 5. Civilian labor force participation rates for selected demographic groups, annual averages,1948-2000
(Percent)
1 The comparability of historical labor force data has beenaffected at various times by methodological and conceptualchanges. For an explanation, see the Explanatory Notes andEstimates of Error section of Employment and Earnings,
a monthly periodical published by the Bureau of LaborStatistics.
Dash indicates data not available.

127
(Percent)
With children under 18With no
Total children With children under 6Year women under 6 to 17
18 Total years 3 to 5 UnderTotal years 3 years
1980 ....................................... 51.1 48.1 56.6 64.3 46.8 54.5 41.91981 ....................................... 52.0 48.7 58.1 65.5 48.9 56.1 44.31982 ....................................... 52.1 48.6 58.5 65.8 49.9 56.5 45.61983 ....................................... 52.3 48.7 58.9 66.3 50.5 57.7 46.01984 ....................................... 53.2 49.3 60.5 68.1 52.1 58.8 47.61985 ....................................... 54.5 50.4 62.1 69.9 53.5 59.5 49.51986 ....................................... 54.7 50.5 62.8 70.4 54.4 59.9 50.81987 ....................................... 55.4 50.5 64.7 72.0 56.7 62.4 52.91988 ....................................... 56.0 51.2 65.1 73.3 56.1 61.5 52.41989 ....................................... 56.7 51.9 65.7 74.2 56.7 63.1 52.4
1990 ....................................... 57.2 52.3 66.7 74.7 58.2 65.3 53.61991 ....................................... 57.0 52.0 66.6 74.4 58.4 64.4 54.51992 ....................................... 57.4 52.3 67.2 75.9 58.0 63.3 54.51993 ....................................... 57.2 52.1 66.9 75.4 57.9 63.7 53.919941 ..................................... 58.4 53.1 68.4 76.0 60.3 64.9 57.11995 ....................................... 58.7 52.9 69.7 76.4 62.3 67.1 58.71996 ....................................... 58.8 53.0 70.2 77.2 62.3 66.9 59.019971 ..................................... 59.8 53.6 72.1 78.1 65.0 69.3 61.819981 ..................................... 60.2 54.1 72.3 78.4 65.2 69.3 62.219991 ..................................... 60.2 54.3 72.1 78.5 64.4 69.5 60.7
20001 ..................................... 60.7 54.8 72.9 79.0 65.3 71.5 61.0
Table 6. Labor force participation rates of women by presence and age of children,March 1980-2000
1 The comparability of historical labor force data has beenaffected at various times by methodological and conceptualchanges. For an explanation, see the Explanatory Notes andEstimates of Error section of Employment and Earnings,
a monthly periodical published by the Bureau of LaborStatistics.
NOTE: Data refer to single, married, spouse present,and widowed, divorced, and separated women.

128
Table 7. Percent distribution of the labor force of women by presence and age of children,March 1980-2000(Percent)
With children under 18With no
Total children With children under 6Year women under 6 to 17
18 Total years 3 to 5 UnderTotal years 3 years
1980 ....................................... 100.0 60.4 39.6 25.0 14.6 6.6 7.91981 ....................................... 100.0 60.3 39.7 24.8 14.9 6.7 8.21982 ....................................... 100.0 60.2 39.8 24.2 15.6 6.9 8.81983 ....................................... 100.0 60.4 39.6 23.7 15.9 7.0 8.91984. ...................................... 100.0 60.3 39.7 23.4 16.3 7.3 8.91985 ....................................... 100.0 60.6 39.4 23.2 16.1 7.1 9.01986 ....................................... 100.0 60.1 39.9 23.3 16.5 7.3 9.31987 ....................................... 100.0 59.6 40.4 23.5 17.0 7.4 9.61988 ....................................... 100.0 60.1 39.9 23.5 16.4 7.2 9.21989 ....................................... 100.0 60.3 39.7 23.2 16.6 7.4 9.2
1990 ....................................... 100.0 60.5 39.5 22.8 16.7 7.4 9.31991 ....................................... 100.0 60.4 39.6 22.5 17.1 7.5 9.61992 ....................................... 100.0 60.2 39.8 23.0 16.7 7.4 9.31993 ....................................... 100.0 59.9 40.1 23.4 16.7 7.4 9.319941 ..................................... 100.0 59.4 40.6 23.2 17.3 7.7 9.61995 ....................................... 100.0 59.2 40.8 23.6 17.2 7.8 9.31996 ....................................... 100.0 59.6 40.4 23.6 16.8 7.6 9.219971 ..................................... 100.0 59.3 40.7 23.8 16.9 7.6 9.319981 ..................................... 100.0 59.9 40.1 23.5 16.6 7.4 9.219991 ..................................... 100.0 60.7 39.3 23.4 15.9 7.2 8.7
20001 ..................................... 100.0 60.9 39.1 23.5 15.6 7.0 8.6
1 The comparability of historical labor force data has beenaffected at various times by methodological and conceptualchanges. For an explanation, see the Explanatory Notes andEstimates of Error section of Employment and Earnings,
a monthly periodical published by the Bureau of LaborStatistics.
NOTE: Data refer to single, married, spouse present,and widowed, divorced, and separated women.
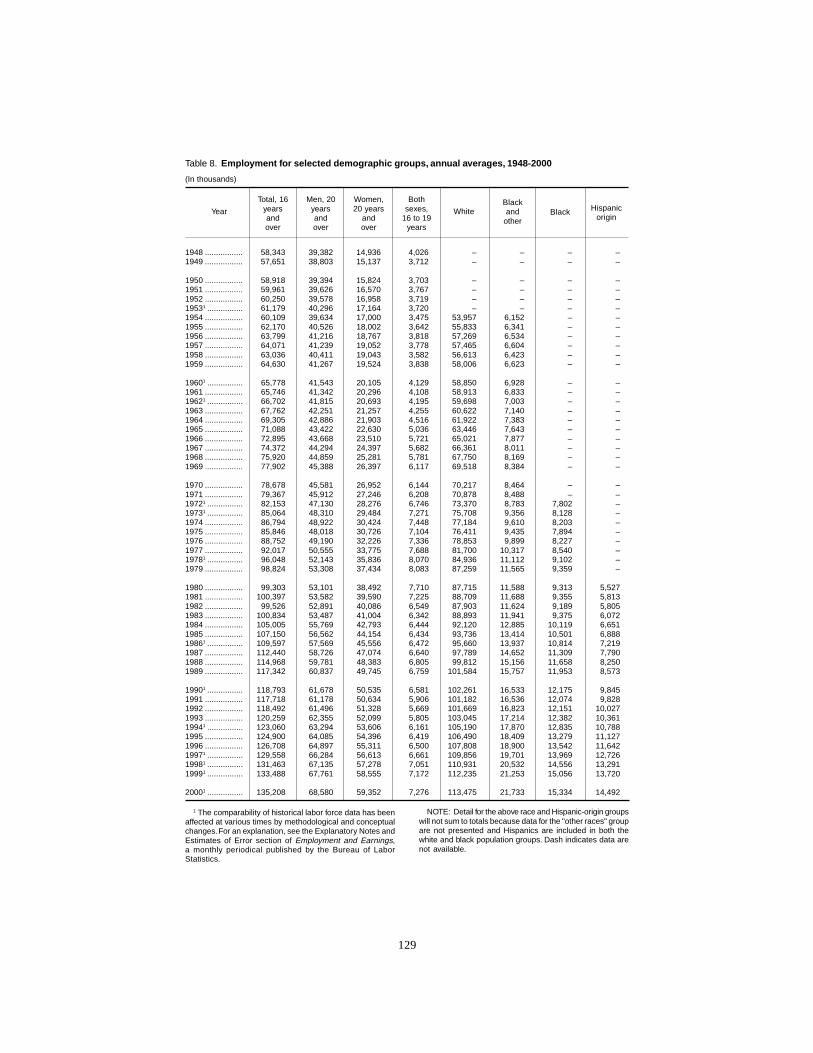
129
Total, 16 Men, 20 Women, Bothyears years 20 years sexes,and and and 16 to 19over over over years
1948 ................. 58,343 39,382 14,936 4,026 – – – –1949 ................. 57,651 38,803 15,137 3,712 – – – –
1950 ................. 58,918 39,394 15,824 3,703 – – – –1951 ................. 59,961 39,626 16,570 3,767 – – – –1952 ................. 60,250 39,578 16,958 3,719 – – – –19531 ................ 61,179 40,296 17,164 3,720 – – – –1954 ................. 60,109 39,634 17,000 3,475 53,957 6,152 – –1955 ................. 62,170 40,526 18,002 3,642 55,833 6,341 – –1956 ................. 63,799 41,216 18,767 3,818 57,269 6,534 – –1957 ................. 64,071 41,239 19,052 3,778 57,465 6,604 – –1958 ................. 63,036 40,411 19,043 3,582 56,613 6,423 – –1959 ................. 64,630 41,267 19,524 3,838 58,006 6,623 – –
19601 ................ 65,778 41,543 20,105 4,129 58,850 6,928 – –1961 ................. 65,746 41,342 20,296 4,108 58,913 6,833 – –19621 ................ 66,702 41,815 20,693 4,195 59,698 7,003 – –1963 ................. 67,762 42,251 21,257 4,255 60,622 7,140 – –1964 ................. 69,305 42,886 21,903 4,516 61,922 7,383 – –1965 ................. 71,088 43,422 22,630 5,036 63,446 7,643 – –1966 ................. 72,895 43,668 23,510 5,721 65,021 7,877 – –1967 ................. 74,372 44,294 24,397 5,682 66,361 8,011 – –1968 ................. 75,920 44,859 25,281 5,781 67,750 8,169 – –1969 ................. 77,902 45,388 26,397 6,117 69,518 8,384 – –
1970 ................. 78,678 45,581 26,952 6,144 70,217 8,464 – –1971 ................. 79,367 45,912 27,246 6,208 70,878 8,488 – –19721 ................ 82,153 47,130 28,276 6,746 73,370 8,783 7,802 –19731 ................ 85,064 48,310 29,484 7,271 75,708 9,356 8,128 –1974 ................. 86,794 48,922 30,424 7,448 77,184 9,610 8,203 –1975 ................. 85,846 48,018 30,726 7,104 76,411 9,435 7,894 –1976 ................. 88,752 49,190 32,226 7,336 78,853 9,899 8,227 –1977 ................. 92,017 50,555 33,775 7,688 81,700 10,317 8,540 –19781 ................ 96,048 52,143 35,836 8,070 84,936 11,112 9,102 –1979 ................. 98,824 53,308 37,434 8,083 87,259 11,565 9,359 –
1980 ................. 99,303 53,101 38,492 7,710 87,715 11,588 9,313 5,5271981 ................. 100,397 53,582 39,590 7,225 88,709 11,688 9,355 5,8131982 ................. 99,526 52,891 40,086 6,549 87,903 11,624 9,189 5,8051983 ................. 100,834 53,487 41,004 6,342 88,893 11,941 9,375 6,0721984 ................. 105,005 55,769 42,793 6,444 92,120 12,885 10,119 6,6511985 ................. 107,150 56,562 44,154 6,434 93,736 13,414 10,501 6,88819861 ................ 109,597 57,569 45,556 6,472 95,660 13,937 10,814 7,2191987 ................. 112,440 58,726 47,074 6,640 97,789 14,652 11,309 7,7901988 ................. 114,968 59,781 48,383 6,805 99,812 15,156 11,658 8,2501989 ................. 117,342 60,837 49,745 6,759 101,584 15,757 11,953 8,573
19901 ................ 118,793 61,678 50,535 6,581 102,261 16,533 12,175 9,8451991 ................. 117,718 61,178 50,634 5,906 101,182 16,536 12,074 9,8281992 ................. 118,492 61,496 51,328 5,669 101,669 16,823 12,151 10,0271993 ................. 120,259 62,355 52,099 5,805 103,045 17,214 12,382 10,36119941 ................ 123,060 63,294 53,606 6,161 105,190 17,870 12,835 10,7881995 ................. 124,900 64,085 54,396 6,419 106,490 18,409 13,279 11,1271996 ................. 126,708 64,897 55,311 6,500 107,808 18,900 13,542 11,64219971 ................ 129,558 66,284 56,613 6,661 109,856 19,701 13,969 12,72619981 ................ 131,463 67,135 57,278 7,051 110,931 20,532 14,556 13,29119991 ................ 133,488 67,761 58,555 7,172 112,235 21,253 15,056 13,720
20001 ................ 135,208 68,580 59,352 7,276 113,475 21,733 15,334 14,492
YearBlackand
otherBlackWhite Hispanic
origin
Table 8. Employment for selected demographic groups, annual averages, 1948-2000
(In thousands)
1 The comparability of historical labor force data has beenaffected at various times by methodological and conceptualchanges. For an explanation, see the Explanatory Notes andEstimates of Error section of Employment and Earnings,a monthly periodical published by the Bureau of LaborStatistics.
NOTE: Detail for the above race and Hispanic-origin groupswill not sum to totals because data for the "other races" groupare not presented and Hispanics are included in both thewhite and black population groups. Dash indicates data arenot available.
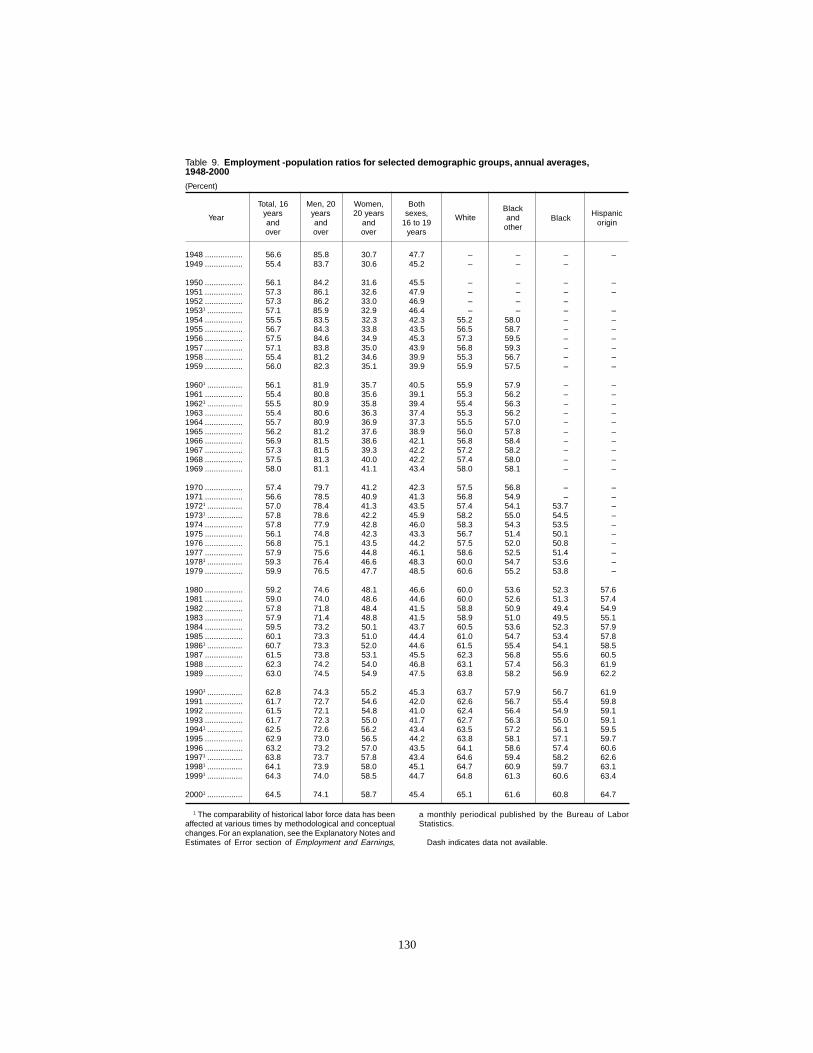
130
Total, 16 Men, 20 Women, Bothyears years 20 years sexes,and and and 16 to 19over over over years
Blackand
otherBlackWhite
1948 ................. 56.6 85.8 30.7 47.7 – – – –1949 ................. 55.4 83.7 30.6 45.2 – – –
1950 ................. 56.1 84.2 31.6 45.5 – – – –1951 ................. 57.3 86.1 32.6 47.9 – – – –1952 ................. 57.3 86.2 33.0 46.9 – – –19531 ................ 57.1 85.9 32.9 46.4 – – – –1954 ................. 55.5 83.5 32.3 42.3 55.2 58.0 – –1955 ................. 56.7 84.3 33.8 43.5 56.5 58.7 – –1956 ................. 57.5 84.6 34.9 45.3 57.3 59.5 – –1957 ................. 57.1 83.8 35.0 43.9 56.8 59.3 – –1958 ................. 55.4 81.2 34.6 39.9 55.3 56.7 – –1959 ................. 56.0 82.3 35.1 39.9 55.9 57.5 – –
19601 ................ 56.1 81.9 35.7 40.5 55.9 57.9 – –1961 ................. 55.4 80.8 35.6 39.1 55.3 56.2 – –19621 ................ 55.5 80.9 35.8 39.4 55.4 56.3 – –1963 ................. 55.4 80.6 36.3 37.4 55.3 56.2 – –1964 ................. 55.7 80.9 36.9 37.3 55.5 57.0 – –1965 ................. 56.2 81.2 37.6 38.9 56.0 57.8 – –1966 ................. 56.9 81.5 38.6 42.1 56.8 58.4 – –1967 ................. 57.3 81.5 39.3 42.2 57.2 58.2 – –1968 ................. 57.5 81.3 40.0 42.2 57.4 58.0 – –1969 ................. 58.0 81.1 41.1 43.4 58.0 58.1 – –
1970 ................. 57.4 79.7 41.2 42.3 57.5 56.8 – –1971 ................. 56.6 78.5 40.9 41.3 56.8 54.9 – –19721 ................ 57.0 78.4 41.3 43.5 57.4 54.1 53.7 –19731 ................ 57.8 78.6 42.2 45.9 58.2 55.0 54.5 –1974 ................. 57.8 77.9 42.8 46.0 58.3 54.3 53.5 –1975 ................. 56.1 74.8 42.3 43.3 56.7 51.4 50.1 –1976 ................. 56.8 75.1 43.5 44.2 57.5 52.0 50.8 –1977 ................. 57.9 75.6 44.8 46.1 58.6 52.5 51.4 –19781 ................ 59.3 76.4 46.6 48.3 60.0 54.7 53.6 –1979 ................. 59.9 76.5 47.7 48.5 60.6 55.2 53.8 –
1980 ................. 59.2 74.6 48.1 46.6 60.0 53.6 52.3 57.61981 ................. 59.0 74.0 48.6 44.6 60.0 52.6 51.3 57.41982 ................. 57.8 71.8 48.4 41.5 58.8 50.9 49.4 54.91983 ................. 57.9 71.4 48.8 41.5 58.9 51.0 49.5 55.11984 ................. 59.5 73.2 50.1 43.7 60.5 53.6 52.3 57.91985 ................. 60.1 73.3 51.0 44.4 61.0 54.7 53.4 57.819861 ................ 60.7 73.3 52.0 44.6 61.5 55.4 54.1 58.51987 ................. 61.5 73.8 53.1 45.5 62.3 56.8 55.6 60.51988 ................. 62.3 74.2 54.0 46.8 63.1 57.4 56.3 61.91989 ................. 63.0 74.5 54.9 47.5 63.8 58.2 56.9 62.2
19901 ................ 62.8 74.3 55.2 45.3 63.7 57.9 56.7 61.91991 ................. 61.7 72.7 54.6 42.0 62.6 56.7 55.4 59.81992 ................. 61.5 72.1 54.8 41.0 62.4 56.4 54.9 59.11993 ................. 61.7 72.3 55.0 41.7 62.7 56.3 55.0 59.119941 ................ 62.5 72.6 56.2 43.4 63.5 57.2 56.1 59.51995 ................. 62.9 73.0 56.5 44.2 63.8 58.1 57.1 59.71996 ................. 63.2 73.2 57.0 43.5 64.1 58.6 57.4 60.619971 ................ 63.8 73.7 57.8 43.4 64.6 59.4 58.2 62.619981 ................ 64.1 73.9 58.0 45.1 64.7 60.9 59.7 63.119991 ................ 64.3 74.0 58.5 44.7 64.8 61.3 60.6 63.4
20001 ................ 64.5 74.1 58.7 45.4 65.1 61.6 60.8 64.7
Year Hispanicorigin
Table 9. Employment -population ratios for selected demographic groups, annual averages,1948-2000
(Percent)
1 The comparability of historical labor force data has beenaffected at various times by methodological and conceptualchanges. For an explanation, see the Explanatory Notes andEstimates of Error section of Employment and Earnings,
a monthly periodical published by the Bureau of LaborStatistics.
Dash indicates data not available.

131
Table 10. Employed persons by major occupation, annual averages, 1987-2000(In thousands)
Occupation 1987 1988 1989 19901 1991 1992 1993
Total ......................................................... 112,440 114,968 117,342 118,793 117,718 118,492 120,259Managerial and professional specialty .......... 27,742 29,190 30,398 30,602 30,934 31,085 32,231
Executive, administrative, andmanagerial ................................................ 13,316 14,216 14,848 14,802 14,904 14,722 15,338
Professional specialty ................................ 14,426 14,974 15,550 15,800 16,030 16,363 16,893Technical, sales, and administrativesupport .......................................................... 35,082 35,532 36,127 36,913 36,318 37,048 37,058Technicians and related support ................ 3,346 3,521 3,645 3,866 3,814 4,277 4,039Sales ........................................................... 13,480 13,747 14,065 14,285 14,052 14,014 14,342Administrative support, includingclerical ....................................................... 18,256 18,264 18,416 18,762 18,452 18,757 18,677
Service occupations ....................................... 15,054 15,332 15,556 16,012 16,254 16,377 16,821Private household ....................................... 934 909 872 792 799 891 928Protective service ....................................... 1,907 1,944 1,960 2,000 2,083 2,114 2,165Service, except private householdand protective ........................................... 12,213 12,479 12,724 13,220 13,372 13,373 13,727
Precision production, craft, and repair ........... 13,568 13,664 13,818 13,745 13,250 13,225 13,429Mechanics and repairers ............................ 4,445 4,454 4,550 4,470 4,445 4,466 4,442Construction trades .................................... 5,011 5,098 5,142 5,199 4,852 4,827 5,048Other precision production, craft,and repair .................................................. 4,112 4,112 4,126 4,076 3,953 3,931 3,939
Operators, fabricators, and laborers .............. 17,486 17,814 18,022 18,071 17,456 17,247 17,341Machine operators, assemblers,and inspectors .......................................... 7,994 8,117 8,248 8,200 7,820 7,658 7,553
Transportation and materialmoving occupations .................................. 4,712 4,831 4,886 4,886 4,913 4,908 5,036
Handlers, equipment cleaners,helpers, and laborers ................................ 4,779 4,866 4,888 4,985 4,723 4,682 4,753
Farming, forestry, and fishing ......................... 3,507 3,437 3,421 3,450 3,506 3,510 3,379
19941 1995 1996 19971 19981 19991 20001
Total ......................................................... 123,060 124,900 126,708 129,558 131,463 133,488 135,208Managerial and professional specialty .......... 33,847 35,318 36,497 37,686 38,937 40,467 40,887
Executive, administrative, andmanagerial ................................................ 16,312 17,186 17,746 18,440 19,054 19,584 19,774
Professional specialty ................................ 17,536 18,132 18,752 19,245 19,883 20,883 21,113Technical, sales, and administrativesupport .......................................................... 37,306 37,417 37,683 38,309 38,521 38,921 39,442Technicians and related support ................ 3,869 3,909 3,926 4,214 4,261 4,355 4,385Sales ........................................................... 14,817 15,119 15,404 15,734 15,850 16,118 16,340Administrative support, includingclerical ....................................................... 18,620 18,389 18,353 18,361 18,410 18,448 18,717
Service occupations ....................................... 16,912 16,930 17,177 17,537 17,836 17,915 18,278Private household ....................................... 817 821 804 795 847 831 792Protective service ....................................... 2,249 2,237 2,187 2,300 2,417 2,440 2,399Service, except private householdand protective ........................................... 13,847 13,872 14,186 14,442 14,572 14,644 15,087
Precision production, craft, and repair ........... 13,489 13,524 13,587 14,124 14,411 14,593 14,882Mechanics and repairers ............................ 4,419 4,423 4,521 4,675 4,786 4,868 4,875Construction trades .................................... 5,008 5,098 5,108 5,378 5,594 5,801 6,120Other precision production, craft,and repair .................................................. 4,062 4,004 3,959 4,071 4,031 3,923 3,887
Operators, fabricators, and laborers .............. 17,876 18,068 18,197 18,399 18,256 18,167 18,319Machine operators, assemblers,and inspectors .......................................... 7,754 7,907 7,874 7,962 7,791 7,386 7,319
Transportation and materialmoving occupations .................................. 5,136 5,171 5,302 5,389 5,363 5,516 5,557
Handlers, equipment cleaners,helpers, and laborers ................................ 4,986 4,990 5,021 5,048 5,102 5,265 5,443
Farming, forestry, and fishing ......................... 3,629 3,642 3,566 3,503 3,502 3,426 3,399
1 The comparability of historical labor force data has beenaffected at various times by methodological and conceptualchanges. For an explanation, see the Explanatory Notes and
Estimates of Error section of Employment and Earnings,a monthly periodical published by the Bureau of LaborStatistics.

132
Total Full Part Economicemployed time time part time¹
TOTAL
1970 ........................................................................... 78,678 66,753 11,925 2,4461971 ........................................................................... 79,367 66,973 12,393 2,68819722 ......................................................................... 82,153 69,214 12,939 2,64819732 ......................................................................... 85,064 71,803 13,262 2,5541974 ........................................................................... 86,794 73,093 13,701 2,9881975 ........................................................................... 85,846 71,586 14,260 3,8041976 ........................................................................... 88,752 73,964 14,788 3,6071977 ........................................................................... 92,017 76,625 15,391 3,60819782 ......................................................................... 96,048 80,193 15,855 3,5161979 ........................................................................... 98,824 82,654 16,171 3,577
1980 ........................................................................... 99,303 82,562 16,740 4,3211981 ........................................................................... 100,397 83,243 17,154 4,7681982 ........................................................................... 99,526 81,421 18,106 6,1701983 ........................................................................... 100,834 82,322 18,511 6,2661984 ........................................................................... 105,005 86,544 18,462 5,7441985 ........................................................................... 107,150 88,534 18,615 5,59019862 ......................................................................... 109,597 90,529 19,069 5,5881987 ........................................................................... 112,440 92,957 19,483 5,4011988 ........................................................................... 114,968 95,214 19,754 5,2061989 ........................................................................... 117,342 97,369 19,973 4,894
19902 ......................................................................... 118,793 98,666 20,128 5,2041991 ........................................................................... 117,718 97,190 20,528 6,1611992 ........................................................................... 118,492 97,664 20,828 6,5201993 ........................................................................... 120,259 99,114 21,145 6,48119942 ......................................................................... 123,060 99,772 23,288 4,6251995 ........................................................................... 124,900 101,679 23,220 4,4731996 ........................................................................... 126,708 103,537 23,170 4,31519972 ......................................................................... 129,558 106,334 23,224 4,06819982 ......................................................................... 131,463 108,202 23,261 3,66519992 ......................................................................... 133,488 110,302 23,186 3,357
20002 ......................................................................... 135,208 112,291 22,917 3,190
MenMenMenMenMen
1970 ........................................................................... 48,990 44,825 4,166 1,2981971 ........................................................................... 49,390 45,023 4,367 1,39519722 ......................................................................... 50,896 46,373 4,523 1,34719732 ......................................................................... 52,349 47,843 4,507 1,2791974 ........................................................................... 53,024 48,378 4,646 1,5191975 ........................................................................... 51,857 46,988 4,870 1,9731976 ........................................................................... 53,138 48,150 4,988 1,8251977 ........................................................................... 54,728 49,551 5,178 1,74919782 ......................................................................... 56,479 51,281 5,198 1,6381979 ........................................................................... 57,607 52,427 5,180 1,645
1980 ........................................................................... 57,186 51,717 5,471 2,1071981 ........................................................................... 57,397 51,906 5,492 2,2851982 ........................................................................... 56,271 50,334 5,937 3,0301983 ........................................................................... 56,787 50,643 6,145 2,9661984 ........................................................................... 59,091 53,070 6,020 2,6511985 ........................................................................... 59,891 53,862 6,028 2,57219862 ......................................................................... 60,892 54,685 6,207 2,5901987 ........................................................................... 62,107 55,746 6,360 2,5131988 ........................................................................... 63,273 56,816 6,457 2,4741989 ........................................................................... 64,315 57,885 6,430 2,287
19902 ......................................................................... 65,104 58,501 6,604 2,5191991 ........................................................................... 64,223 57,407 6,815 3,1041992 ........................................................................... 64,440 57,363 7,077 3,2301993 ........................................................................... 65,349 58,123 7,226 3,12419942 ......................................................................... 66,450 58,832 7,617 2,2991995 ........................................................................... 67,377 59,936 7,441 2,2101996 ........................................................................... 68,207 60,762 7,445 2,10619972 ......................................................................... 69,685 62,258 7,427 1,98819982 ......................................................................... 70,693 63,189 7,504 1,79619992 ......................................................................... 71,446 63,930 7,516 1,634
20002 ......................................................................... 72,293 64,938 7,355 1,571
See footnotes at end of table.
Year
Table 11. Employed persons by usual full- or part-time status and sex, annual averages, 1970-2000
(In thousands)

133
Total Full Part Economicemployed time time part time¹
Women
1970 ........................................................................... 29,688 21,929 7,758 1,1481971 ........................................................................... 29,976 21,950 8,026 1,29319722 ......................................................................... 31,257 22,842 8,416 1,30019732 ......................................................................... 32,715 23,960 8,756 1,2741974 ........................................................................... 33,769 24,714 9,055 1,4681975 ........................................................................... 33,989 24,598 9,391 1,8321976 ........................................................................... 35,615 25,814 9,799 1,7821977 ........................................................................... 37,289 27,076 10,213 1,85919782 ......................................................................... 39,569 28,912 10,658 1,8791979 ........................................................................... 41,217 30,227 10,990 1,932
1980 ........................................................................... 42,117 30,845 11,270 2,2151981 ........................................................................... 43,000 31,337 11,664 2,4841982 ........................................................................... 43,256 31,086 12,170 3,1401983 ........................................................................... 44,047 31,679 12,367 3,3001984 ........................................................................... 45,915 33,473 12,441 3,0911985 ........................................................................... 47,259 34,672 12,587 3,01819862 ......................................................................... 48,706 35,845 12,862 2,9991987 ........................................................................... 50,334 37,210 13,124 2,8891988 ........................................................................... 51,696 38,398 13,298 2,7331989 ........................................................................... 53,027 39,484 13,544 2,607
19902 ......................................................................... 53,689 40,165 13,524 2,6851991 ........................................................................... 53,496 39,783 13,713 3,0571992 ........................................................................... 54,052 40,301 13,751 3,2901993 ........................................................................... 54,910 40,991 13,919 3,35719942 ......................................................................... 56,610 40,940 15,670 2,3251995 ........................................................................... 57,523 41,743 15,779 2,2631996 ........................................................................... 58,501 42,776 15,725 2,21019972 ......................................................................... 59,873 44,076 15,797 2,08019982 ......................................................................... 60,771 45,014 15,757 1,86919992 ......................................................................... 62,042 46,372 15,670 1,723
20002 ......................................................................... 62,915 47,353 15,562 1,619
Year
Table 11. Employed persons by usual full- and part-time status and sex, annual averages,1970-2000—Continued
(In thousands)
¹ Includes some persons who usually work full time.2 The comparability of historical labor force data has been
affected at various times by methodological and conceptualchanges. For an explanation, see the Explanatory Notes and
Estimates of Error section of Employment and Earnings, amonthly periodical published by the Bureau of Labor Statis-tics.

134
Construc- Manu- Retail tion facturing trade
1947 ............ 43,857 38,382 955 2,009 15,545 4,166 2,478 6,477 1,728 5,025 5,4741948 ............ 44,866 39,216 994 2,198 15,582 4,189 2,612 6,659 1,800 5,181 5,6501949 ............ 43,754 37,897 930 2,194 14,441 4,001 2,610 6,654 1,828 5,239 5,856
1950 ............ 45,197 39,170 901 2,364 15,241 4,034 2,643 6,743 1,888 5,356 6,0261951 ............ 47,819 41,430 929 2,637 16,393 4,226 2,735 7,007 1,956 5,547 6,3891952 ............ 48,793 42,185 898 2,668 16,632 4,248 2,821 7,184 2,035 5,699 6,6091953 ............ 50,202 43,556 866 2,659 17,549 4,290 2,862 7,385 2,111 5,835 6,6451954 ............ 48,990 42,238 791 2,646 16,314 4,084 2,875 7,360 2,200 5,969 6,7511955 ............ 50,641 43,727 792 2,839 16,882 4,141 2,934 7,601 2,298 6,240 6,9141956 ............ 52,369 45,091 822 3,039 17,243 4,244 3,027 7,831 2,389 6,497 7,2781957 ............ 52,855 45,239 828 2,962 17,176 4,241 3,037 7,848 2,438 6,708 7,6161958 ............ 51,322 43,483 751 2,817 15,945 3,976 2,989 7,761 2,481 6,765 7,8391959 ............ 53,270 45,186 732 3,004 16,675 4,011 3,092 8,035 2,549 7,087 8,083
1960 ............ 54,189 45,836 712 2,926 16,796 4,004 3,153 8,238 2,628 7,378 8,3531961 ............ 53,999 45,404 672 2,859 16,326 3,903 3,142 8,195 2,688 7,619 8,5941962 ............ 55,549 46,660 650 2,948 16,853 3,906 3,207 8,359 2,754 7,982 8,8901963 ............ 56,653 47,429 635 3,010 16,995 3,903 3,258 8,520 2,830 8,277 9,2251964 ............ 58,283 48,686 634 3,097 17,274 3,951 3,347 8,812 2,911 8,660 9,5961965 ............ 60,763 50,689 632 3,232 18,062 4,036 3,477 9,239 2,977 9,036 10,0741966 ............ 63,901 53,116 627 3,317 19,214 4,158 3,608 9,637 3,058 9,498 10,7841967 ............ 65,803 54,413 613 3,248 19,447 4,268 3,700 9,906 3,185 10,045 11,3911968 ............ 67,897 56,058 606 3,350 19,781 4,318 3,791 10,308 3,337 10,567 11,8391969 ............ 70,384 58,189 619 3,575 20,167 4,442 3,919 10,785 3,512 11,169 12,195
1970 ............ 70,880 58,325 623 3,588 19,367 4,515 4,006 11,034 3,645 11,548 12,5541971 ............ 71,211 58,331 609 3,704 18,623 4,476 4,014 11,338 3,772 11,797 12,8811972 ............ 73,675 60,341 628 3,889 19,151 4,541 4,127 11,822 3,908 12,276 13,3341973 ............ 76,790 63,058 642 4,097 20,154 4,656 4,291 12,315 4,046 12,857 13,7321974 ............ 78,265 64,095 697 4,020 20,077 4,725 4,447 12,539 4,148 13,441 14,1701975 ............ 76,945 62,259 752 3,525 18,323 4,542 4,430 12,630 4,165 13,892 14,6861976 ............ 79,382 64,511 779 3,576 18,997 4,582 4,562 13,193 4,271 14,551 14,8711977 ............ 82,471 67,344 813 3,851 19,682 4,713 4,723 13,792 4,467 15,302 15,1271978 ............ 86,697 71,026 851 4,229 20,505 4,923 4,985 14,556 4,724 16,252 15,6721979 ............ 89,823 73,876 958 4,463 21,040 5,136 5,221 14,972 4,975 17,112 15,947
1980 ............ 90,406 74,166 1,027 4,346 20,285 5,146 5,292 15,018 5,160 17,890 16,241
1981 ............ 91,152 75,121 1,139 4,188 20,170 5,165 5,375 15,171 5,298 18,615 16,0311982 ............ 89,544 73,707 1,128 3,904 18,780 5,081 5,295 15,158 5,340 19,021 15,8371983 ............ 90,152 74,282 952 3,946 18,432 4,952 5,283 15,587 5,466 19,664 15,8691984 ............ 94,408 78,384 966 4,380 19,372 5,156 5,568 16,512 5,684 20,746 16,0241985 ............ 97,387 80,992 927 4,668 19,248 5,233 5,727 17,315 5,948 21,927 16,3941986 ............ 99,344 82,651 777 4,810 18,947 5,247 5,761 17,880 6,273 22,957 16,6931987 ............ 101,958 84,948 717 4,958 18,999 5,362 5,848 18,422 6,533 24,110 17,0101988 ............ 105,209 87,823 713 5,098 19,314 5,512 6,030 19,023 6,630 25,504 17,3861989 ............ 107,884 90,105 692 5,171 19,391 5,614 6,187 19,475 6,668 26,907 17,779
1990 ............ 109,403 91,098 709 5,120 19,076 5,777 6,173 19,601 6,709 27,934 18,3041991 ............ 108,249 89,847 689 4,650 18,406 5,755 6,081 19,284 6,646 28,336 18,4021992 ............ 108,601 89,956 635 4,492 18,104 5,718 5,997 19,356 6,602 29,052 18,6451993 ............ 110,713 91,872 610 4,668 18,075 5,811 5,981 19,773 6,757 30,197 18,8411994 ............ 114,163 95,036 601 4,986 18,321 5,984 6,162 20,507 6,896 31,579 19,1281995 ............ 117,191 97,885 581 5,160 18,524 6,132 6,378 21,187 6,806 33,117 19,3051996 ............ 119,608 100,189 580 5,418 18,495 6,253 6,482 21,597 6,911 34,454 19,4191997 ............ 122,690 103,133 596 5,691 18,675 6,408 6,648 21,966 7,109 36,040 19,5571998 ............ 125,865 106,042 590 6,020 18,805 6,611 6,800 22,295 7,389 37,533 19,8231999 ............ 128,916 108,709 539 6,415 18,552 6,834 6,911 22,848 7,555 39,055 20,206
2000 ............ 131,759 111,079 543 6,698 18,469 7,019 7,024 23,307 7,560 40,460 20,681
Trans-porta-tionand
publicutilities
Govern-ment
Services
Finance,insur-anceand,real
estate
MiningYear Totalprivate
Whole-saletrade
Total
Table 12. Employees on nonfarm payrolls by major industry division, annual averages, 1947-2000
(In thousands)
NOTE: Current estimates are projected from March 2000 benchmark levels.

135
Table 13. Employees on nonfarm payrolls by industry, annual averages, 1992-2000(In thousands)
Industry 1992 1993 1994 1995 1996 1997 1998 1999 2000
Total nonfarm .................. 108,601 110,713 114,163 117,191 119,608 122,690 125,865 128,916 131,759
Total private ........................ 89,956 91,872 95,036 97,885 100,189 103,133 106,042 108,709 111,079
Goods-producing ....................... 23,231 23,352 23,908 24,265 24,493 24,962 25,414 25,507 25,709
Mining .............................. 635 610 601 581 508 596 590 539 543Metal mining ....................... 53 50 49 51 54 54 49 44 41Coal mining ........................ 127 109 112 104 98 96 92 85 77Oil and gas extraction ........ 353 350 337 320 322 339 339 297 311Nonmetallic minerals,except fuels ...................... 102 102 104 105 106 108 110 113 114
Construction ........................... 4,492 4,668 4,986 5,160 5,418 5,691 6,020 6,415 6,698General buildingcontractors ........................ 1,077 1,120 1,188 1,207 1,257 1,310 1,377 1,458 1,528
Heavy construction,except building ................. 711 713 740 752 777 799 840 874 901
Special trade contractors ... 2,704 2,836 3,058 3,201 3,384 3,582 3,804 4,084 4,269
Manufacturing ........................ 18,104 18,075 18,321 18,524 18,495 18,675 18,805 18,552 18,469
Durable goods .................... 10,277 10,221 10,448 10,683 10,789 11,010 11,205 11,111 11,138Lumber and wood
products ........................ 680 709 754 769 778 796 814 834 832Furniture and fixtures ..... 478 487 505 510 504 512 533 548 558Stone, clay, and glassproducts ........................ 513 517 532 540 544 552 562 566 579
Primary metal industries 695 683 698 712 711 711 715 699 698Blast furnaces andbasic steel products .. 250 240 239 242 240 235 233 227 225
Fabricated metalproducts ........................ 1,329 1,339 1,388 1,437 1,449 1,479 1,509 1,521 1,537
Industrial machinery andequipment ..................... 1,929 1,931 1,990 2,067 2,115 2,168 2,206 2,136 2,120
Computer and officeequipment ..................... 391 363 354 352 362 376 382 368 361Electronic and otherelectrical equipment . 1,528 1,526 1,571 1,625 1,661 1,689 1,707 1,672 1,719
Electronic componentsand accessories ........... 527 528 544 581 617 650 660 641 682
Transportation equipment 1,830 1,756 1,761 1,790 1,785 1,845 1,893 1,888 1,849Motor vehicles andequipment .................. 813 837 909 971 967 986 995 1,018 1,013
Aircraft and parts ........ 612 542 482 451 458 501 525 496 465Instruments and relatedproducts ........................ 929 896 861 843 855 866 873 855 852
Miscellaneous manufac-turing industries ............ 368 378 389 390 388 392 395 391 394
Nondurable goods .............. 7,827 7,854 7,873 7,841 7,706 7,665 7,600 7,441 7,331Food and kindredproducts ........................ 1,663 1,680 1,678 1,692 1,692 1,685 1,683 1,682 1,684
Tobacco products ........... 48 44 43 42 41 41 41 37 34Textile mill products ........ 674 675 676 663 627 616 598 559 528Apparel and othertextile products ............. 1,007 989 974 936 868 824 766 690 633
Paper and alliedproducts ........................ 690 692 692 693 684 683 677 668 657
Printing and publishing .. 1,507 1,517 1,537 1,546 1,540 1,552 1,565 1,552 1,547Chemicals and alliedproducts ........................ 1,084 1,081 1,057 1,038 1,034 1,036 1,043 1,035 1,038
Petroleum and coalproducts ........................ 158 152 149 145 142 141 139 132 127
Rubber and miscella-neous plastics products 878 909 953 980 983 996 1,005 1,009 1,011
Leather and leatherproducts ........................ 120 117 113 106 96 91 84 77 71
See note at end of table.

136
Service-producing ................... 85,370 87,361 90,256 92,925 95,115 97,727 100,451 103,409 106,050
Transportation and publicutilities .................................. 5,718 5,811 5,984 6,132 6,253 6,408 6,611 6,834 7,019
Transportation ........................ 3,495 3,598 3,761 3,904 4,019 4,123 4,273 4,411 4,529Railroad transportation ...... 254 248 241 238 231 227 231 235 236Local and interurbanpassenger transit .............. 361 379 404 419 437 452 469 478 476
Trucking and warehousing . 1,385 1,444 1,526 1,587 1,637 1,677 1,744 1,810 1,856Water transportation .......... 173 168 172 175 174 179 181 186 196Transportation by air .......... 964 988 1,023 1,068 1,107 1,134 1,181 1,227 1,281Pipelines, except naturalgas .................................... 19 18 17 15 15 14 14 13 14
Transportation services ..... 338 352 378 401 418 441 454 463 471Communications andpublic utilities ....................... 2,223 2,214 2,223 2,229 2,234 2,285 2,338 2,423 2,490Communications ................ 1,269 1,269 1,295 1,318 1,351 1,419 1,477 1,560 1,639Electric, gas, and sanitaryservices ............................. 954 944 928 911 884 866 861 863 851
Wholesale trade ....................... 5,997 5,981 6,162 6,378 6,482 6,648 6,800 6,911 7,024Durable goods ...................... 3,446 3,433 3,559 3,715 3,805 3,927 4,043 4,117 4,193Nondurable goods ................ 2,552 2,549 2,604 2,663 2,677 2,721 2,757 2,793 2,831
Retail trade ............................... 19,356 19,773 20,507 21,187 21,597 21,966 22,295 22,848 23,307Building materials and gardensupplies ................................ 758 779 833 868 894 929 948 988 1,016
General merchandisestores .................................... 2,451 2,488 2,583 2,681 2,702 2,701 2,730 2,798 2,837Department stores ............... 2,080 2,140 2,246 2,346 2,367 2,380 2,415 2,459 2,491
Food stores ............................ 3,180 3,224 3,291 3,366 3,436 3,478 3,484 3,497 3,521Automotive dealers andservice stations .................... 1,966 2,014 2,116 2,190 2,267 2,311 2,332 2,368 2,412New and used car dealers ... 875 908 963 996 1,031 1,046 1,047 1,080 1,114
Apparel and accessorystores .................................... 1,131 1,144 1,144 1,125 1,098 1,109 1,141 1,171 1,193
Furniture and homefurnishings stores ................ 800 828 889 946 975 999 1,025 1,087 1,134Eating and drinking places 6,609 6,821 7,078 7,354 7,517 7,646 7,768 7,961 8,114Miscellaneous retailestablishments ................. 2,461 2,476 2,573 2,658 2,709 2,794 2,868 2,978 3,080
Finance, insurance, andreal estate ............................. 6,602 6,757 6,896 6,806 6,911 7,109 7,389 7,555 7,560Finance ............................... 3,160 3,238 3,299 3,231 3,303 3,424 3,588 3,688 3,710
Depository institutions ... 2,096 2,089 2,066 2,025 2,019 2,027 2,046 2,056 2,029Commercial banks ...... 1,490 1,497 1,484 1,466 1,458 1,463 1,472 1,468 1,430Savings institutions .... 346 324 305 276 266 260 256 254 253
Nondepository institutions 406 455 491 463 522 577 658 709 681Mortgage bankers andbrokers ....................... 180 225 249 205 233 263 326 353 309
Security and commoditbrokers ........................... 440 472 516 525 553 596 647 689 748
Holding and otherinvestment offices ........ 219 223 227 217 210 223 238 234 251
Insurance ............................ 2,152 2,197 2,236 2,225 2,226 2,264 2,335 2,368 2,346Insurance carriers ........... 1,496 1,529 1,552 1,529 1,517 1,539 1,591 1,610 1,589Insurance agents,brokers, and service ..... 657 668 684 696 709 725 744 758 757
Real estate ......................... 1,290 1,322 1,361 1,351 1,382 1,421 1,465 1,500 1,504
Services ................................. 29,052 30,197 31,579 33,117 34,454 36,040 37,533 39,055 40,460Agricultural services .......... 490 519 564 582 627 678 708 766 801Hotels and other lodgingplaces ................................ 1,576 1,596 1,631 1,668 1,715 1,746 1,789 1,848 1,912
Personal services ............... 1,116 1,137 1,140 1,163 1,180 1,186 1,201 1,226 1,251Business services .............. 5,315 5,735 6,281 6,812 7,293 7,988 8,618 9,300 9,858
Services to buildings ...... 805 823 857 882 907 930 950 983 994Personnel supply services 1,629 1,906 2,272 2,476 2,654 2,985 3,278 3,616 3,887
Help supply services .. 1,411 1,669 2,017 2,189 2,352 2,656 2,926 3,248 3,487Computer and dataprocessing services ..... 836 893 959 1,090 1,228 1,409 1,615 1,875 2,095
See note at end of table.
Table 13. Employees on nonfarm payrolls by industry, annual averages, 1992-2000—Continued(In thousands)
Industry 1992 1993 1994 1995 1996 1997 1998 1999 2000
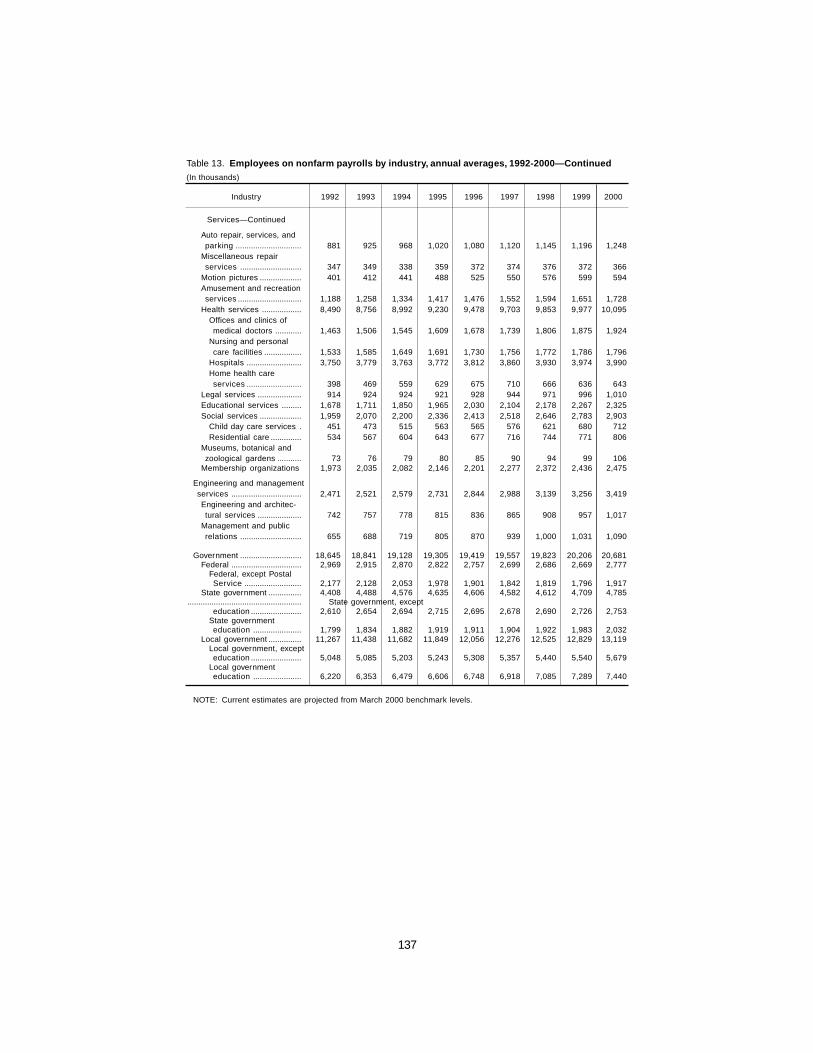
137
Services—Continued
Auto repair, services, andparking .............................. 881 925 968 1,020 1,080 1,120 1,145 1,196 1,248
Miscellaneous repairservices ............................ 347 349 338 359 372 374 376 372 366
Motion pictures ................... 401 412 441 488 525 550 576 599 594Amusement and recreationservices ............................. 1,188 1,258 1,334 1,417 1,476 1,552 1,594 1,651 1,728
Health services .................. 8,490 8,756 8,992 9,230 9,478 9,703 9,853 9,977 10,095Offices and clinics ofmedical doctors ............ 1,463 1,506 1,545 1,609 1,678 1,739 1,806 1,875 1,924
Nursing and personalcare facilities ................. 1,533 1,585 1,649 1,691 1,730 1,756 1,772 1,786 1,796
Hospitals ......................... 3,750 3,779 3,763 3,772 3,812 3,860 3,930 3,974 3,990Home health careservices ......................... 398 469 559 629 675 710 666 636 643
Legal services .................... 914 924 924 921 928 944 971 996 1,010Educational services ......... 1,678 1,711 1,850 1,965 2,030 2,104 2,178 2,267 2,325Social services ................... 1,959 2,070 2,200 2,336 2,413 2,518 2,646 2,783 2,903
Child day care services . 451 473 515 563 565 576 621 680 712Residential care .............. 534 567 604 643 677 716 744 771 806
Museums, botanical andzoological gardens ........... 73 76 79 80 85 90 94 99 106
Membership organizations 1,973 2,035 2,082 2,146 2,201 2,277 2,372 2,436 2,475
Engineering and managementservices ................................ 2,471 2,521 2,579 2,731 2,844 2,988 3,139 3,256 3,419Engineering and architec-tural services .................... 742 757 778 815 836 865 908 957 1,017
Management and publicrelations ............................ 655 688 719 805 870 939 1,000 1,031 1,090
Government ............................ 18,645 18,841 19,128 19,305 19,419 19,557 19,823 20,206 20,681Federal ................................ 2,969 2,915 2,870 2,822 2,757 2,699 2,686 2,669 2,777
Federal, except PostalService .......................... 2,177 2,128 2,053 1,978 1,901 1,842 1,819 1,796 1,917
State government ............... 4,408 4,488 4,576 4,635 4,606 4,582 4,612 4,709 4,785.................................................... State government, except
education ....................... 2,610 2,654 2,694 2,715 2,695 2,678 2,690 2,726 2,753State governmenteducation ...................... 1,799 1,834 1,882 1,919 1,911 1,904 1,922 1,983 2,032
Local government ............... 11,267 11,438 11,682 11,849 12,056 12,276 12,525 12,829 13,119Local government, excepteducation ....................... 5,048 5,085 5,203 5,243 5,308 5,357 5,440 5,540 5,679
Local governmenteducation ...................... 6,220 6,353 6,479 6,606 6,748 6,918 7,085 7,289 7,440
NOTE: Current estimates are projected from March 2000 benchmark levels.
Table 13. Employees on nonfarm payrolls by industry, annual averages, 1992-2000—Continued(In thousands)
Industry 1992 1993 1994 1995 1996 1997 1998 1999 2000
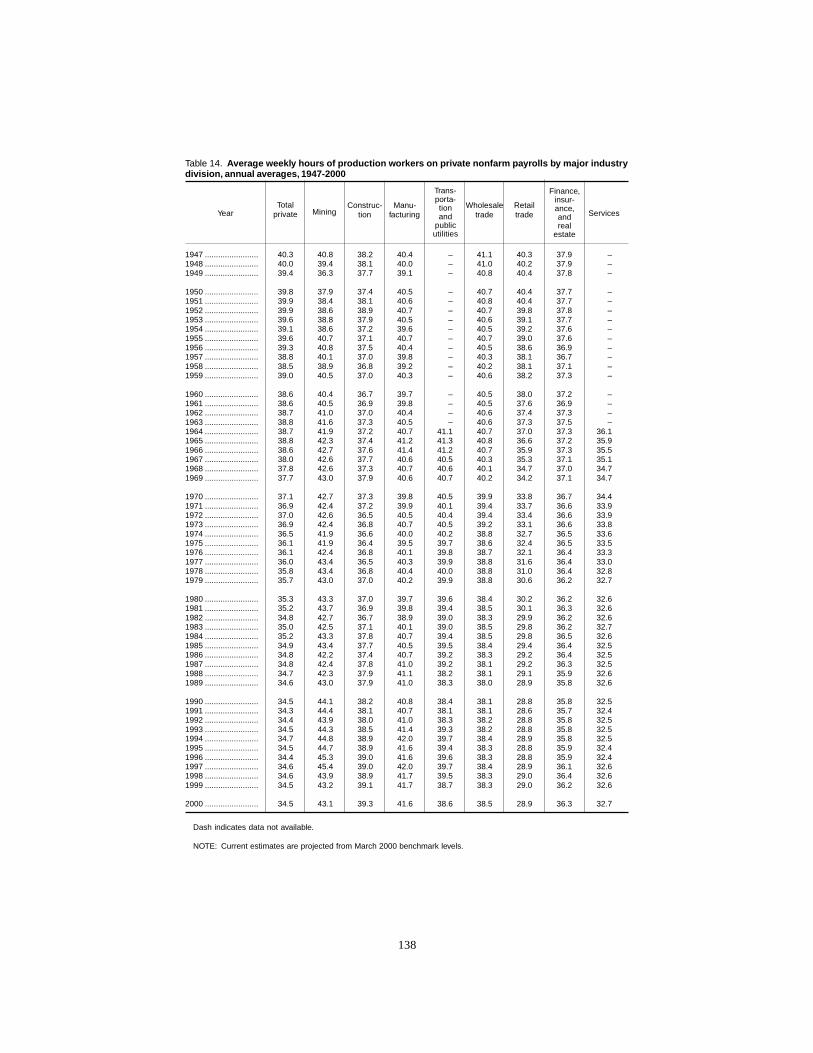
138
Table 14. Average weekly hours of production workers on private nonfarm payrolls by major industrydivision, annual averages, 1947-2000
Construc- Manu- Wholesale Retailtion facturing trade trade
1947 ........................ 40.3 40.8 38.2 40.4 – 41.1 40.3 37.9 –1948 ........................ 40.0 39.4 38.1 40.0 – 41.0 40.2 37.9 –1949 ........................ 39.4 36.3 37.7 39.1 – 40.8 40.4 37.8 –
1950 ........................ 39.8 37.9 37.4 40.5 – 40.7 40.4 37.7 –1951 ........................ 39.9 38.4 38.1 40.6 – 40.8 40.4 37.7 –1952 ........................ 39.9 38.6 38.9 40.7 – 40.7 39.8 37.8 –1953 ........................ 39.6 38.8 37.9 40.5 – 40.6 39.1 37.7 –1954 ........................ 39.1 38.6 37.2 39.6 – 40.5 39.2 37.6 –1955 ........................ 39.6 40.7 37.1 40.7 – 40.7 39.0 37.6 –1956 ........................ 39.3 40.8 37.5 40.4 – 40.5 38.6 36.9 –1957 ........................ 38.8 40.1 37.0 39.8 – 40.3 38.1 36.7 –1958 ........................ 38.5 38.9 36.8 39.2 – 40.2 38.1 37.1 –1959 ........................ 39.0 40.5 37.0 40.3 – 40.6 38.2 37.3 –
1960 ........................ 38.6 40.4 36.7 39.7 – 40.5 38.0 37.2 –1961 ........................ 38.6 40.5 36.9 39.8 – 40.5 37.6 36.9 –1962 ........................ 38.7 41.0 37.0 40.4 – 40.6 37.4 37.3 –1963 ........................ 38.8 41.6 37.3 40.5 – 40.6 37.3 37.5 –1964 ........................ 38.7 41.9 37.2 40.7 41.1 40.7 37.0 37.3 36.11965 ........................ 38.8 42.3 37.4 41.2 41.3 40.8 36.6 37.2 35.91966 ........................ 38.6 42.7 37.6 41.4 41.2 40.7 35.9 37.3 35.51967 ........................ 38.0 42.6 37.7 40.6 40.5 40.3 35.3 37.1 35.11968 ........................ 37.8 42.6 37.3 40.7 40.6 40.1 34.7 37.0 34.71969 ........................ 37.7 43.0 37.9 40.6 40.7 40.2 34.2 37.1 34.7
1970 ........................ 37.1 42.7 37.3 39.8 40.5 39.9 33.8 36.7 34.41971 ........................ 36.9 42.4 37.2 39.9 40.1 39.4 33.7 36.6 33.91972 ........................ 37.0 42.6 36.5 40.5 40.4 39.4 33.4 36.6 33.91973 ........................ 36.9 42.4 36.8 40.7 40.5 39.2 33.1 36.6 33.81974 ........................ 36.5 41.9 36.6 40.0 40.2 38.8 32.7 36.5 33.61975 ........................ 36.1 41.9 36.4 39.5 39.7 38.6 32.4 36.5 33.51976 ........................ 36.1 42.4 36.8 40.1 39.8 38.7 32.1 36.4 33.31977 ........................ 36.0 43.4 36.5 40.3 39.9 38.8 31.6 36.4 33.01978 ........................ 35.8 43.4 36.8 40.4 40.0 38.8 31.0 36.4 32.81979 ........................ 35.7 43.0 37.0 40.2 39.9 38.8 30.6 36.2 32.7
1980 ........................ 35.3 43.3 37.0 39.7 39.6 38.4 30.2 36.2 32.61981 ........................ 35.2 43.7 36.9 39.8 39.4 38.5 30.1 36.3 32.61982 ........................ 34.8 42.7 36.7 38.9 39.0 38.3 29.9 36.2 32.61983 ........................ 35.0 42.5 37.1 40.1 39.0 38.5 29.8 36.2 32.71984 ........................ 35.2 43.3 37.8 40.7 39.4 38.5 29.8 36.5 32.61985 ........................ 34.9 43.4 37.7 40.5 39.5 38.4 29.4 36.4 32.51986 ........................ 34.8 42.2 37.4 40.7 39.2 38.3 29.2 36.4 32.51987 ........................ 34.8 42.4 37.8 41.0 39.2 38.1 29.2 36.3 32.51988 ........................ 34.7 42.3 37.9 41.1 38.2 38.1 29.1 35.9 32.61989 ........................ 34.6 43.0 37.9 41.0 38.3 38.0 28.9 35.8 32.6
1990 ........................ 34.5 44.1 38.2 40.8 38.4 38.1 28.8 35.8 32.51991 ........................ 34.3 44.4 38.1 40.7 38.1 38.1 28.6 35.7 32.41992 ........................ 34.4 43.9 38.0 41.0 38.3 38.2 28.8 35.8 32.51993 ........................ 34.5 44.3 38.5 41.4 39.3 38.2 28.8 35.8 32.51994 ........................ 34.7 44.8 38.9 42.0 39.7 38.4 28.9 35.8 32.51995 ........................ 34.5 44.7 38.9 41.6 39.4 38.3 28.8 35.9 32.41996 ........................ 34.4 45.3 39.0 41.6 39.6 38.3 28.8 35.9 32.41997 ........................ 34.6 45.4 39.0 42.0 39.7 38.4 28.9 36.1 32.61998 ........................ 34.6 43.9 38.9 41.7 39.5 38.3 29.0 36.4 32.61999 ........................ 34.5 43.2 39.1 41.7 38.7 38.3 29.0 36.2 32.6
2000 ........................ 34.5 43.1 39.3 41.6 38.6 38.5 28.9 36.3 32.7
Dash indicates data not available.
NOTE: Current estimates are projected from March 2000 benchmark levels.
Finance,insur-ance,andreal
estate
Services
Trans-porta-tionand
publicutilities
Year MiningTotal
private

139
1947 ........................ – 101.4 62.0 105.8 – 56.8 – – –1948 ........................ – 101.9 67.6 104.2 – 59.5 – – –1949 ........................ – 86.8 66.7 93.0 – 59.0 – – –
1950 ........................ – 88.3 71.3 102.2 – 59.7 – – –1951 ........................ – 91.9 81.0 109.6 – 61.7 – – –1952 ........................ – 88.2 83.3 109.6 – 63.3 – – –1953 ........................ – 84.8 80.5 114.8 – 63.7 – – –1954 ........................ – 75.5 78.2 102.4 – 63.1 – – –1955 ........................ – 78.9 83.4 109.0 – 64.4 – – –1956 ........................ – 81.5 90.2 109.5 – 65.9 – – –1957 ........................ – 79.6 86.6 105.9 – 65.4 – – –1958 ........................ – 67.9 80.8 94.8 – 63.6 – – –1959 ........................ – 68.1 86.7 102.3 – 66.4 – –
1960 ........................ – 65.7 83.2 100.7 – 67.3 – – –1961 ........................ – 61.5 81.4 97.0 – 66.8 – – –1962 ........................ – 59.8 83.9 101.6 – 68.1 – – –1963 ........................ – 59.1 86.8 102.4 – 68.8 – – –1964 ........................ 75.8 59.4 89.1 104.9 87.7 70.6 73.2 60.4 51.91965 ........................ 79.1 59.6 93.4 111.5 89.9 73.3 75.9 61.4 54.01966 ........................ 82.5 59.3 96.3 119.2 91.7 75.7 77.6 62.8 56.41967 ........................ 82.9 57.0 93.8 117.1 92.1 76.5 78.3 64.8 58.91968 ........................ 84.9 56.0 95.6 119.2 93.4 77.7 80.1 67.8 61.31969 ........................ 87.7 57.9 103.6 121.0 96.3 80.6 82.6 71.6 64.2
1970 ........................ 86.3 57.6 101.3 112.8 96.9 81.7 83.4 73.0 65.31971 ........................ 85.8 54.9 103.6 108.8 95.1 80.4 85.3 74.3 65.61972 ........................ 89.2 57.8 107.9 114.8 97.3 82.5 88.2 76.5 68.01973 ........................ 93.2 58.8 113.7 121.7 99.9 85.6 90.9 78.9 71.31974 ........................ 93.2 63.4 109.5 118.1 100.4 87.6 91.0 79.8 73.91975 ........................ 88.8 68.3 92.7 103.8 94.6 86.4 90.6 79.9 76.01976 ........................ 92.3 71.5 94.0 110.3 95.5 89.1 93.9 81.5 78.81977 ........................ 96.0 76.5 100.2 115.0 97.9 92.5 96.5 85.4 82.01978 ........................ 100.7 79.0 112.2 120.1 101.3 97.7 100.0 90.3 86.31979 ........................ 104.0 88.2 119.9 122.1 104.9 102.0 101.5 94.4 90.2
1980 ........................ 102.8 94.1 115.1 113.8 104.1 101.9 100.1 97.8 94.31981 ........................ 104.1 104.8 109.3 112.5 103.3 103.3 100.6 105.5 98.21982 ........................ 100.0 100.0 100.0 100.0 100.0 100.0 100.0 100.0 100.01983 ........................ 101.5 81.5 102.2 101.4 97.3 99.9 102.7 101.6 103.61984 ........................ 107.7 84.9 116.8 109.0 102.8 105.3 108.2 106.4 108.21985 ........................ 110.5 81.4 125.3 106.9 104.6 108.4 111.7 110.9 114.01986 ........................ 112.3 65.7 128.2 105.7 104.0 108.5 114.3 116.7 119.21987 ........................ 115.6 61.8 132.7 107.0 106.5 109.4 117.9 120.1 124.91988 ........................ 119.3 61.7 136.9 109.3 108.2 113.3 121.0 119.2 132.21989 ........................ 122.1 60.5 138.9 109.3 111.1 116.1 122.9 119.5 139.3
1990 ........................ 123.0 63.9 138.0 106.4 114.5 115.7 123.0 120.2 144.21991 ........................ 120.4 62.0 122.8 102.1 113.4 113.7 119.5 118.3 145.31992 ........................ 121.2 56.2 118.4 101.7 113.6 112.8 120.6 118.1 149.31993 ........................ 124.6 54.3 125.4 103.1 118.2 112.8 123.4 121.2 155.41994 ........................ 130.0 54.6 136.4 107.0 121.8 116.9 128.6 124.0 163.11995 ........................ 133.5 54.1 140.9 107.5 123.9 121.1 132.2 122.9 120.71996 ........................ 136.7 55.6 148.7 107.2 127.5 122.9 134.6 125.0 177.41997 ........................ 141.5 58.3 156.2 109.4 130.5 126.1 137.7 129.6 186.61998 ........................ 145.1 56.0 164.7 109.0 132.3 127.9 140.0 136.3 194.21999 ........................ 148.2 50.1 176.1 107.2 134.3 129.6 143.5 138.4 201.5
2000 ........................ 151.6 51.3 184.8 105.9 137.9 132.0 146.1 138.5 209.6
Dash indicates data not available.
NOTE: Current estimates are projected from March 2000 benchmark levels.
Trans-porta-tionand
publicutilities
Finance,insur-ance,andreal
estate
ServicesMiningYear Totalprivate
Table 15. Indexes of aggregate weekly hours of production workers on private nonfarm payrolls bymajor industry division, annual averages, 1947-2000
(1982=100)
Construc-tion
Retailtrade
Wholesaletrade
Manu-facturing

140
Years of completed schooling
0-4 5-8 9-11 12 13-15 16 17+
1948 ....................................... 4.8 29.5 18.8 36.3 6.8 2.5 1.31949 ....................................... 4.5 25.4 20.5 35.5 9.2 3.2 1.6
1950 ....................................... 4.5 25.4 20.3 35.7 9.2 3.2 1.61951 ....................................... 4.6 25.8 20.1 36.4 8.4 3.2 1.61952 ....................................... 4.6 26.2 19.8 37.0 7.6 3.2 1.61953 ....................................... 4.3 25.5 19.9 37.9 7.7 3.2 1.61954 ....................................... 4.1 24.7 19.8 38.8 7.8 3.3 1.61955 ....................................... 3.7 24.1 19.8 39.6 7.8 3.3 1.61956 ....................................... 3.4 23.4 19.9 40.4 7.9 3.4 1.61957 ....................................... 3.1 22.5 19.8 41.3 8.0 3.5 1.71958 ....................................... 3.0 22.3 20.6 40.2 8.8 3.4 1.61959 ....................................... 2.9 22.5 21.7 38.7 9.5 3.2 1.5
1960 ....................................... 2.7 21.7 22.2 38.0 10.6 3.3 1.51961 ....................................... 2.5 20.5 20.8 40.3 10.5 4.1 1.21962 ....................................... 2.3 18.9 19.4 43.0 10.6 4.8 1.01963 ....................................... 2.2 18.5 19.4 44.2 10.1 4.4 1.21964 ....................................... 2.1 18.2 19.4 45.2 9.7 4.0 1.41965 ....................................... 2.0 17.4 19.2 45.9 9.7 4.2 1.61966 ....................................... 1.6 16.7 19.1 47.4 10.3 3.5 1.51967 ....................................... 1.3 15.2 18.9 48.0 12.0 3.5 1.11968 ....................................... 1.4 13.5 18.6 50.1 11.7 3.3 1.31969 ....................................... 1.1 12.4 17.7 50.6 12.3 4.1 1.7
1970 ....................................... 1.1 11.7 17.2 50.3 13.2 4.4 2.11971 ....................................... 1.2 10.5 16.9 51.3 13.6 4.8 1.61972 ....................................... 1.1 9.5 16.0 52.5 14.2 4.8 1.81973 ....................................... 1.0 8.9 15.5 50.8 15.9 5.6 2.21974 ....................................... .8 8.3 14.9 50.8 16.1 6.3 2.81975 ....................................... .8 7.7 15.1 50.3 16.4 6.9 2.81976 ....................................... .9 7.3 14.9 50.4 16.8 7.1 2.71977 ....................................... .8 6.9 14.4 50.1 17.6 7.3 2.81978 ....................................... .8 6.0 13.2 50.4 18.5 7.7 3.41979 ....................................... .7 5.7 12.4 50.2 18.8 8.6 3.6
1980 ....................................... .6 5.2 11.9 50.0 19.7 8.9 3.61981 ....................................... .7 4.9 11.3 49.8 19.7 9.3 4.41982 ....................................... .6 4.4 10.4 48.7 20.6 10.4 4.91983 ....................................... .6 3.9 9.9 48.5 21.0 11.0 5.21984 ....................................... .6 3.7 9.7 47.3 22.0 11.7 5.11985 ....................................... .5 3.4 9.1 47.0 22.6 12.2 5.21986 ....................................... .4 3.3 8.9 46.8 22.7 12.3 5.51987 ....................................... .7 3.0 9.3 46.0 23.0 12.5 5.51988 ....................................... .7 2.8 9.0 45.6 22.8 13.2 5.91989 ....................................... .6 2.7 8.5 45.0 23.3 13.5 6.3
1990 ....................................... .6 2.7 8.4 44.4 23.4 14.1 6.319911 ...................................... .5 2.2 6.6 41.1 29.5 15.2 4.91992 ....................................... .5 2.1 6.2 39.8 30.4 15.7 5.21993
2...................................... .5 2.2 6.6 37.4 32.2 15.8 5.2
1994 ....................................... .5 2.2 6.6 36.5 32.4 16.2 5.61995 ....................................... .5 2.2 6.8 36.1 31.8 16.9 5.71996 ....................................... .4 2.1 6.5 36.7 31.2 17.4 5.71997 ....................................... .5 2.1 6.3 35.8 31.5 17.6 6.21998 ....................................... .5 2.0 6.6 35.3 31.7 17.8 6.01999 ....................................... .5 2.1 6.4 34.5 32.2 18.2 6.2
Year
Table 16. Percent distribution of all hours worked by women in the private business sector by yearsof completed schooling, 1948-99
1March 1992 Current Population Survey used in mea-
suring 1991 data revised questions on educational at-tainment. Data prior to 1991 are not strictly comparable.
2May not be strictly comparable before 1993 data due
to comprehensive revisions in the CPS questionnaire.
NOTE: Rows may not sum to 100.0 due to rounding.

141
Years of completed schooling
0-4 5-8 9-11 12 13-15 16 17+
1948 ..................................... 8.3 35.6 20.5 23.1 6.5 3.6 2.41949 ..................................... 9.3 36.0 19.5 21.4 7.1 4.0 2.7
1950 ..................................... 9.1 35.9 19.5 21.5 7.2 4.1 2.71951 ..................................... 8.8 35.1 19.1 22.4 7.4 4.3 2.91952 ..................................... 8.5 34.4 18.8 23.3 7.6 4.4 3.01953 ..................................... 8.1 33.4 19.0 24.0 7.7 4.7 3.21954 ..................................... 7.6 32.4 19.1 24.7 7.7 4.9 3.41955 ..................................... 7.1 31.3 19.4 25.7 7.8 5.1 3.61956 ..................................... 6.7 30.3 19.6 26.5 7.9 5.3 3.71957 ..................................... 6.2 29.3 19.8 27.3 7.9 5.5 3.91958 ..................................... 5.9 28.9 20.2 26.8 8.6 5.5 4.01959 ..................................... 5.5 28.4 20.7 26.4 9.3 5.5 4.0
1960 ..................................... 5.2 27.8 21.1 26.1 10.1 5.6 4.11961 ..................................... 4.8 25.8 20.4 28.2 10.2 6.5 4.21962 ..................................... 4.5 23.8 19.6 30.2 10.2 7.3 4.31963 ..................................... 4.1 22.9 19.6 31.5 10.2 7.2 4.51964 ..................................... 3.7 22.0 19.6 32.8 10.2 7.0 4.71965 ..................................... 3.8 21.1 19.3 33.8 10.1 7.5 4.51966 ..................................... 3.4 20.4 19.5 34.4 10.2 7.8 4.41967 ..................................... 2.9 18.6 18.8 35.3 11.9 7.6 5.11968 ..................................... 2.7 17.9 18.7 35.8 12.2 7.7 5.01969 ..................................... 2.5 17.0 17.7 36.4 12.8 8.2 5.4
1970 ..................................... 2.4 15.7 16.9 37.2 13.5 8.6 5.71971 ..................................... 2.3 14.8 17.2 37.2 13.8 8.8 5.81972 ..................................... 2.3 12.9 16.3 38.8 14.6 9.1 6.01973 ..................................... 2.1 12.4 15.7 38.6 15.2 9.5 6.51974 ..................................... 1.7 10.7 14.9 38.7 16.0 10.9 7.21975 ..................................... 1.8 10.8 14.9 38.9 15.9 10.7 7.01976 ..................................... 1.7 10.1 15.0 38.5 16.4 10.9 7.31977 ..................................... 1.7 9.7 14.5 38.4 17.4 10.9 7.51978 ..................................... 1.5 8.9 13.6 39.0 18.1 11.1 7.81979 ..................................... 1.4 8.5 13.7 39.0 17.8 11.5 8.1
1980 ..................................... 1.4 7.8 13.1 39.5 17.8 12.1 8.31981 ..................................... 1.3 7.3 12.5 39.6 17.6 12.5 9.21982 ..................................... 1.3 6.5 11.7 38.6 18.0 13.8 10.21983 ..................................... 1.0 6.4 10.9 39.2 18.4 13.9 10.11984 ..................................... 1.1 6.2 11.0 39.2 18.7 14.1 9.81985 ..................................... 1.1 5.8 10.5 39.4 19.4 14.5 9.51986 ..................................... 1.0 5.6 10.7 39.0 39.0 14.5 9.91987 ..................................... 1.1 5.2 10.7 39.2 18.8 14.8 10.11988 ..................................... 1.2 5.1 10.2 38.8 19.5 14.7 10.61989 ..................................... 1.3 4.9 10.0 38.8 20.0 15.2 10.1
1990 ..................................... 1.2 4.5 9.7 39.2 20.2 15.1 10.01991
1.................................... 1.0 3.9 8.2 37.1 24.4 17.0 8.4
1992 ..................................... 1.0 3.7 7.8 36.2 25.0 17.2 9.11993
2.................................... 1.0 3.8 7.7 35.2 26.0 17.4 8.9
1994 ..................................... 1.0 3.7 7.6 34.7 26.1 18.0 8.91995 ..................................... 1.0 3.7 8.0 34.5 26.3 17.6 8.91996 ..................................... 1.0 3.7 8.1 34.3 26.0 18.0 8.81997 ..................................... 1.0 3.4 7.8 34.8 26.0 18.2 8.91989 ..................................... 0.8 3.3 7.8 34.5 25.9 19.0 8.71999 ..................................... 0.9 3.4 7.4 33.9 26.2 18.9 9.3
Year
Table 17. Percent distribution of all hours worked by men in the private business sector by years ofcompleted schooling, 1948-99
1March 1992 Current Population Survey used in measur-
ing 1991 data contained revised questions on educationalattainment. Data prior to 1991 are not strictly comparable.
2May not be strictly comparable before 1993 data due to
comprehensive revisions in the CPS questionnaire.
NOTE: Rows may not sum to 100.0 due to rounding.

142
Table 18. Employment Cost Index for wages and salaries, annual averages,1 1976-00
Year Civilianworkers
Stateandlocal
govern-ment
workers
Private industry workers
Allprivateindustryworkers
Whitecollar
workers
Bluecollar
workers
Goods-producingworkers
Service-producingworkers
Manufac-turing
workers
Nonmanu-facturingworkers
1976 ........................................... – – 47.9 46.8 49.5 49.0 47.1 48.3 47.7 1977 ........................................... – – 51.3 49.8 53.3 52.8 50.1 52.1 50.8 1978 ........................................... – – 55.2 53.5 57.5 57.0 53.9 56.2 54.7 1979 ........................................... – – 59.6 57.5 62.4 61.6 58.1 60.9 59.0
1980 ........................................... – – 65.1 62.7 68.4 67.5 63.4 66.8 64.2 1981 ........................................... – – 71.0 68.5 74.6 73.5 69.2 72.8 70.2 1982 ........................................... 75.1 71.0 76.0 73.6 79.4 78.6 74.2 77.7 75.2 1983 ........................................... 79.1 75.0 80.0 77.9 83.0 82.0 78.5 81.2 79.4 1984 ........................................... 82.8 79.3 83.5 81.7 86.0 85.2 82.5 84.7 83.1 1985 ........................................... 86.5 83.8 87.2 85.7 89.2 88.6 86.3 88.3 86.7 1986 ........................................... 89.9 88.3 90.2 89.2 91.7 91.5 89.4 91.3 89.7 1987 ........................................... 92.9 92.4 93.1 92.4 94.0 93.9 92.5 93.9 92.8 1988 ........................................... 96.6 96.7 96.5 96.1 97.1 97.2 96.1 97.1 96.3 1989 ........................................... 100.8 101.6 100.6 100.7 100.4 100.5 100.7 100.5 100.7
1990 ........................................... 105.3 107.2 104.8 105.3 104.1 104.6 105.0 104.9 104.8 1991 ........................................... 109.4 111.9 108.8 109.5 107.6 108.4 109.0 108.9 108.7 1992 ........................................... 112.6 115.1 111.9 112.7 110.7 111.8 112.0 112.6 111.6 1993 ........................................... 115.8 118.4 115.2 116.1 113.7 114.9 115.3 116.0 114.8 1994 ........................................... 119.2 121.8 118.5 119.7 116.9 118.4 118.6 119.5 118.1 1995 ........................................... 122.6 125.7 121.9 123.1 120.3 121.7 122.0 123.2 121.3 1996 ........................................... 126.6 129.2 126.0 127.4 123.9 125.5 126.2 127.0 125.4 1997 ........................................... 130.9 132.7 130.4 132.1 127.7 129.2 130.9 130.7 130.1 1998 ........................................... 135.9 136.7 135.7 137.9 131.8 133.7 136.5 135.3 135.5 1999 ........................................... 140.5 141.1 140.2 142.7 136.1 138.0 141.3 139.6 140.2 2000 ........................................... 146.1 146.1 146.0 148.8 141.1 143.4 147.1 144.9 146.0
Dash indicates data not available.
1 The annual average is the average for four quarters of a year.
Table 19. Employer compensation costs per employee hours worked, all private industry, 1986-00
Measure Totalcompen-
sation
Wagesand
salaries
Totalbenefits
Paidleave
Supple-mental
payInsurance
Retire-ment andsavings
Legallyrequiredbenefits
Otherbenefits
Cost per hour worked
1986 ...................................... $13.25 $9.67 $3.58 $0.93 $0.30 $0.73 $0.50 $1.11 $0.021987 ...................................... 13.42 9.83 3.60 .93 .32 .72 .48 1.13 .021988 ...................................... 13.79 10.02 3.77 .97 .33 .78 .45 1.22 .021989 ...................................... 14.28 10.38 3.90 1.00 .34 .85 .42 1.27 .021990 ...................................... 14.96 10.84 4.13 1.03 .37 .92 .45 1.35 1( )1991 ...................................... 15.40 11.14 4.27 1.05 .36 1.01 .44 1.40 1( )1992 ...................................... 16.14 11.58 4.55 1.09 .39 1.12 .46 1.47 .021993 ...................................... 16.70 11.90 4.80 1.11 .42 1.19 .48 1.55 .041994 ...................................... 17.08 12.14 4.94 1.11 .44 1.23 .52 1.60 .041995 ...................................... 17.10 12.25 4.85 1.09 .47 1.15 .52 1.59 .031996 ...................................... 17.49 12.58 4.91 1.12 .49 1.14 .55 1.59 .031997 ...................................... 17.97 13.04 4.94 1.14 .51 1.09 .55 1.62 .031998 ...................................... 18.50 13.47 5.02 1.16 .56 1.10 .55 1.63 .031999 ...................................... 19.00 13.87 5.13 1.20 .55 1.13 .57 1.65 .032000 ...................................... 19.85 14.49 5.36 1.28 .60 1.19 .59 1.67 .03
Percent of totalcompensation
1986 ...................................... 100.0 73.0 27.0 7.0 2.3 5.5 3.8 8.4 .11987 ...................................... 100.0 73.2 26.8 6.9 2.4 5.4 3.6 8.4 .11988 ...................................... 100.0 72.7 27.3 7.0 2.4 5.6 3.3 8.8 .21989 ...................................... 100.0 72.7 27.3 7.0 2.4 6.0 2.9 8.9 .11990 ...................................... 100.0 72.4 27.6 6.9 2.5 6.1 3.0 9.0 1( )1991 ...................................... 100.0 72.3 27.7 6.8 2.3 6.5 2.9 9.1 1( )1992 ...................................... 100.0 71.8 28.2 6.8 2.4 6.9 2.9 9.1 .11993 ...................................... 100.0 71.3 28.7 6.6 2.5 7.2 2.9 9.3 .21994 ...................................... 100.0 71.1 28.9 6.5 2.6 7.2 3.0 9.4 .21995 ...................................... 100.0 71.6 28.4 6.4 2.8 6.7 3.0 9.3 .21996 ...................................... 100.0 71.9 28.1 6.4 2.8 6.5 3.1 9.1 .21997 ...................................... 100.0 72.5 27.5 6.3 2.9 6.1 3.0 9.0 .11998 ...................................... 100.0 72.8 27.1 6.3 3.0 5.9 3.0 8.8 .21999 ...................................... 100.0 73.0 27.0 6.3 2.9 5.9 3.0 8.7 .22000 ...................................... 100.0 73.0 27.0 6.4 3.0 6.0 3.0 8.4 .2
1 Cost per hour worked is $0.01 or less.
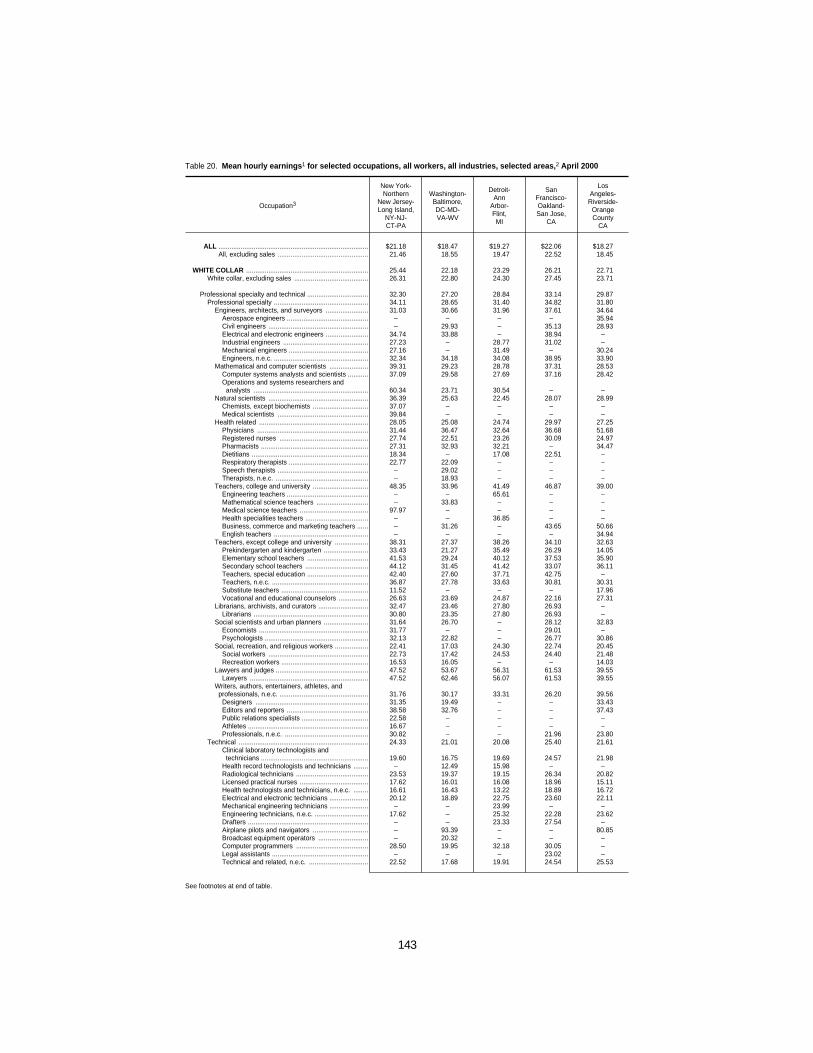
143
Table 20. Mean hourly earnings1 for selected occupations, all workers, all industries, selected areas,2 April 2000
Occupation3
New York-Northern
New Jersey-Long Island,
NY-NJ-CT-PA
Washington-Baltimore,DC-MD-VA-WV
Detroit-Ann
Arbor-Flint,MI
SanFrancisco-Oakland-San Jose,
CA
LosAngeles-Riverside-
OrangeCounty
CA
ALL ................................................................................. $21.18 $18.47 $19.27 $22.06 $18.27All, excluding sales ................................................. 21.46 18.55 19.47 22.52 18.45
WHITE COLLAR .................................................................. 25.44 22.18 23.29 26.21 22.71White collar, excluding sales ........................................ 26.31 22.80 24.30 27.45 23.71
Professional specialty and technical ................................. 32.30 27.20 28.84 33.14 29.87Professional specialty ................................................... 34.11 28.65 31.40 34.82 31.80
Engineers, architects, and surveyors ....................... 31.03 30.66 31.96 37.61 34.64Aerospace engineers ............................................ – – – – 35.94Civil engineers ...................................................... – 29.93 – 35.13 28.93Electrical and electronic engineers ....................... 34.74 33.88 – 38.94 –Industrial engineers .............................................. 27.23 – 28.77 31.02 –Mechanical engineers ........................................... 27.16 – 31.49 – 30.24Engineers, n.e.c. ................................................... 32.34 34.18 34.08 38.95 33.90
Mathematical and computer scientists ..................... 39.31 29.23 28.78 37.31 28.53Computer systems analysts and scientists ........... 37.09 29.58 27.69 37.16 28.42Operations and systems researchers and
analysts .............................................................. 60.34 23.71 30.54 – –Natural scientists ...................................................... 36.39 25.63 22.45 28.07 28.99
Chemists, except biochemists .............................. 37.07 – – – –Medical scientists ................................................. 39.84 – – – –
Health related ........................................................... 28.05 25.08 24.74 29.97 27.25Physicians ............................................................ 31.44 36.47 32.64 36.68 51.68Registered nurses ................................................ 27.74 22.51 23.26 30.09 24.97Pharmacists .......................................................... 27.31 32.93 32.21 – 34.47Dietitians ............................................................... 18.34 – 17.08 22.51 –Respiratory therapists ........................................... 22.77 22.09 – – –Speech therapists ................................................. – 29.02 – – –Therapists, n.e.c. .................................................. – 18.93 – – –
Teachers, college and university .............................. 48.35 33.96 41.49 46.87 39.00Engineering teachers ............................................ – – 65.61 – –Mathematical science teachers ............................ – 33.83 – – –Medical science teachers ..................................... 97.97 – – – –Health specialities teachers .................................. – – 36.85 – –Business, commerce and marketing teachers ...... – 31.26 – 43.65 50.66English teachers ................................................... – – – – 34.94
Teachers, except college and university .................. 38.31 27.37 38.26 34.10 32.63Prekindergarten and kindergarten ........................ 33.43 21.27 35.49 26.29 14.05Elementary school teachers ................................. 41.53 29.24 40.12 37.53 35.90Secondary school teachers .................................. 44.12 31.45 41.42 33.07 36.11Teachers, special education ................................. 42.40 27.60 37.71 42.75 –Teachers, n.e.c. .................................................... 36.87 27.78 33.63 30.81 30.31Substitute teachers ............................................... 11.52 – – – 17.96Vocational and educational counselors ................ 26.63 23.69 24.87 22.16 27.31
Librarians, archivists, and curators ........................... 32.47 23.46 27.80 26.93 –Librarians .............................................................. 30.80 23.35 27.80 26.93 –
Social scientists and urban planners ........................ 31.64 26.70 – 28.12 32.83Economists ........................................................... 31.77 – – 29.01 –Psychologists ........................................................ 32.13 22.82 – 26.77 30.86
Social, recreation, and religious workers .................. 22.41 17.03 24.30 22.74 20.45Social workers ...................................................... 22.73 17.42 24.53 24.40 21.48Recreation workers ............................................... 16.53 16.05 – – 14.03
Lawyers and judges .................................................. 47.52 53.67 56.31 61.53 39.55Lawyers ................................................................ 47.52 62.46 56.07 61.53 39.55
Writers, authors, entertainers, athletes, andprofessionals, n.e.c. ................................................ 31.76 30.17 33.31 26.20 39.56Designers ............................................................. 31.35 19.49 – – 33.43Editors and reporters ............................................ 38.58 32.76 – – 37.43Public relations specialists .................................... 22.58 – – – –Athletes ................................................................. 16.67 – – – –Professionals, n.e.c. ............................................. 30.82 – – 21.96 23.80
Technical ...................................................................... 24.33 21.01 20.08 25.40 21.61Clinical laboratory technologists and
technicians .......................................................... 19.60 16.75 19.69 24.57 21.98Health record technologists and technicians ........ – 12.49 15.98 – –Radiological technicians ....................................... 23.53 19.37 19.15 26.34 20.82Licensed practical nurses ..................................... 17.62 16.01 16.08 18.96 15.11Health technologists and technicians, n.e.c. ........ 16.61 16.43 13.22 18.89 16.72Electrical and electronic technicians ..................... 20.12 18.89 22.75 23.60 22.11Mechanical engineering technicians ..................... – – 23.99 – –Engineering technicians, n.e.c. ............................. 17.62 – 25.32 22.28 23.62Drafters ................................................................. – – 23.33 27.54 –Airplane pilots and navigators .............................. – 93.39 – – 80.85Broadcast equipment operators ........................... – 20.32 – – –Computer programmers ....................................... 28.50 19.95 32.18 30.05 –Legal assistants .................................................... – – – 23.02 –Technical and related, n.e.c. ................................ 22.52 17.68 19.91 24.54 25.53
See footnotes at end of table.

144
Table 20. Mean hourly earnings1 for selected occupations, all workers, all industries, selected areas,2 April2000–Continued
Occupation3
New York-Northern
New Jersey-Long Island,
NY-NJ-CT-PA
Washington-Baltimore,DC-MD-VA-WV
Detroit-Ann
Arbor-Flint,MI
SanFrancisco-Oakland-San Jose,
CA
LosAngeles-Riverside-
OrangeCounty
CA
WHITE COLLAR–Continued
Executive, administrative, and managerial ....................... $34.67 $29.16 $31.88 $36.55 $31.52Executives, administrators, and managers ............... 39.93 32.35 35.13 43.67 35.81
Administrators and officials, public administration ..................................................... 37.51 25.63 33.38 33.12 –
Financial managers .............................................. 43.11 48.11 33.67 38.93 37.15Personnel and labor relations managers .............. 37.05 30.19 – – 36.74Managers, marketing, advertising and public
relations .............................................................. 47.29 43.78 42.96 45.45 36.09Administrators, education and related fields ......... 42.58 32.46 41.09 36.77 39.19Managers, medicine and health ........................... 38.38 26.74 26.75 34.48 32.04Managers, food servicing and lodging
establishments .................................................... – – – – 19.05Managers, service organizations, n.e.c. ............... 38.70 28.45 – 22.15 29.90Managers and administrators, n.e.c. .................... 38.26 33.36 38.08 49.70 37.83
Management related ................................................. 26.57 22.97 27.21 26.92 24.05Accountants and auditors ..................................... 26.29 21.02 25.12 28.00 24.24Other financial officers .......................................... 27.67 29.50 30.45 31.39 21.35Management analysts .......................................... 32.23 – 27.74 29.58 28.14Personnel, training, and labor relations
specialists ........................................................... 25.90 20.49 24.69 25.63 22.44Purchasing agents and buyers, n.e.c. .................. 23.54 28.92 29.47 25.99 21.98Construction inspectors ........................................ 24.85 – – – –Inspectors and compliance officers, except
construction ........................................................ 21.35 – – 27.59 25.39Management related, n.e.c. .................................. 27.70 24.52 27.66 24.65 23.51
Sales ................................................................................. 16.06 17.39 16.25 15.24 15.73Supervisors, sales ................................................ 24.55 19.66 25.08 17.03 29.20Sales, other business services ............................. 33.16 26.39 17.24 – 15.78Sales representatives, mining, manufacturing,
and wholesale ..................................................... 27.11 – 26.99 – 22.86Sales workers, motor vehicles and boats ............. – – – – 23.28Sales workers, apparel ......................................... 9.58 12.91 – 8.83 8.88Sales workers, furniture & home furnishings ........ – – 12.80 9.37 8.31Sales workers, radio, tv, hi-fi, & appliances .......... 17.70 – – – –Sales workers, hardware and building supplies ... – 12.50 – – –Sales workers, other commodities ........................ 9.28 9.37 11.00 13.65 13.50Cashiers ............................................................... 9.26 11.08 8.36 10.68 10.76Sales support, n.e.c. ............................................. 14.70 – – 14.56 11.15
Administrative support, including clerical .......................... 15.53 13.50 13.68 15.91 13.98Supervisors, general office ................................... 21.29 18.92 19.07 22.90 19.67Supervisors, financial records processing ............ 20.96 – – – –Supervisors, distribution, scheduling, and
adjusting clerks ................................................... 19.48 – – – 22.82Computer operators .............................................. 15.52 – 17.67 21.39 –Secretaries ........................................................... 17.22 15.25 15.54 18.97 16.74Stenographers ...................................................... 18.96 – – 21.52 –Typists .................................................................. 14.00 14.13 11.79 14.92 14.01Interviewers .......................................................... 12.85 – – – 10.86Hotel clerks ........................................................... 11.44 8.24 – – –Transportation ticket and reservation agents ....... 16.32 15.15 – 14.65 13.87Receptionists ........................................................ 12.64 9.91 10.43 11.76 11.04Information clerks, n.e.c. ...................................... – 18.05 10.33 15.74 11.27Order clerks .......................................................... 19.27 14.89 13.58 17.25 11.87Personnel clerks, except payroll and
timekeeping ........................................................ 14.30 14.24 16.15 18.89 14.41Library clerks ........................................................ 12.46 9.66 9.79 15.83 12.87File clerks ............................................................. 12.43 – – 10.52 –Records clerks, n.e.c. ........................................... 14.42 13.19 11.80 12.67 13.72Bookkeepers, accounting and auditing clerks ...... 15.87 12.31 13.06 16.54 14.21Payroll and timekeeping clerks ............................. 17.13 – – – 16.15Billing clerks .......................................................... 12.92 12.90 11.67 15.74 –Duplicating machine operators ............................. – – – – 12.83Telephone operators ............................................ 14.53 9.13 12.44 – 11.29Mail clerks, except postal service ......................... 13.07 8.75 – – 10.48Messengers .......................................................... 9.36 – – – –Dispatchers ........................................................... 18.47 14.26 – 19.70 18.67Production coordinators ........................................ – – 21.27 17.23 16.61Traffic, shipping and receiving clerks ................... 12.88 – 12.71 16.11 10.15Stock and inventory clerks .................................... 12.78 15.04 13.47 14.46 14.04Meter readers ....................................................... – – – – 17.83Material recording, scheduling, and distribution
clerks, n.e.c. ....................................................... 13.69 10.06 14.73 15.04 –Insurance adjusters, examiners, and
investigators ....................................................... 18.93 – 13.37 – –
See footnotes at end of table.

145
Table 20. Mean hourly earnings1 for selected occupations, all workers, all industries, selected areas,2 April2000–Continued
Occupation3
New York-Northern
New Jersey-Long Island,
NY-NJ-CT-PA
Washington-Baltimore,DC-MD-VA-WV
Detroit-Ann
Arbor-Flint,MI
SanFrancisco-Oakland-San Jose,
CA
LosAngeles-Riverside-
OrangeCounty
CA
WHITE COLLAR–Continued
Administrative support, including clerical–ContinuedInvestigators and adjusters, except insurance ..... $16.60 $13.52 $12.36 $18.49 $16.67Eligibility clerks, social welfare ............................. 15.71 14.26 – 19.25 13.85Bill and account collectors .................................... – – 13.35 – 12.86General office clerks ............................................. 14.18 12.91 13.05 14.71 12.82Bank tellers ........................................................... 10.79 – 10.52 10.04 8.99Data entry keyers ................................................. 12.11 9.71 9.43 10.83 13.15Teachers’ aides .................................................... 14.73 10.94 11.09 11.73 12.45Administrative support, n.e.c. ............................... 15.91 12.06 13.45 17.23 13.81
BLUE COLLAR .................................................................... 15.48 14.89 17.12 16.55 13.60
Precision production, craft, and repair .............................. 21.75 17.96 21.80 21.80 19.63Supervisors, mechanics and repairers ................. 25.26 – 23.88 26.43 26.55Automobile mechanics ......................................... 24.31 16.02 19.76 32.02 18.05Bus, truck, and stationary engine mechanics ....... – – – 20.75 –Heavy equipment mechanics ............................... – – 22.19 – –Industrial machinery repairers .............................. 18.60 16.30 21.08 – 20.06Machinery maintenance ....................................... – – – – 13.54Electronic repairers, communications and
industrial equipment ........................................... – – – 17.69 22.03Millwrights ............................................................. – – 24.32 – –Mechanics and repairers, n.e.c. ........................... 20.74 19.01 21.07 21.70 17.06Supervisors, electricians and power
transmission installers ........................................ 28.74 – – – –Supervisors, construction trades, n.e.c. ............... – – 24.90 – –Carpenters ............................................................ 23.90 14.85 – – 20.01Electricians ........................................................... 23.12 21.14 25.25 30.18 24.78Electrician apprentices ......................................... – 11.75 – – –Painters, construction and maintenance .............. 24.40 – 23.68 – 13.48Plumbers, pipefitters and steamfitters .................. – – 26.59 – –Construction trades, n.e.c. .................................... – – 17.04 22.16 19.44Drillers, oil well ...................................................... – – – – 18.42Supervisors, production ........................................ 23.98 21.65 20.05 23.99 25.32Tool and die makers ............................................. – – 24.61 – 19.42Machinists ............................................................. – – 21.67 – 18.34Precision grinders, filers, and tool sharpeners ..... – – 24.40 – –Electrical and electronic equipment assemblers .. 13.18 15.46 – 11.97 10.44Butchers and meat cutters .................................... – – 14.31 – 10.06Inspectors, testers, and graders ........................... – – 21.64 12.37 16.62Water and sewer treatment plant operators ......... – – – – 22.10Stationary engineers ............................................. 22.62 18.62 – 26.62 –
Machine operators, assemblers, and inspectors .............. 11.26 14.10 15.97 13.02 10.45Punching and stamping press operators .............. 10.61 – 16.06 – –Grinding, abrading, buffing, and polishing
machine operators .............................................. 10.93 – 15.02 – –Fabricating machine operators, n.e.c. .................. 11.74 – 21.74 – 11.80Molding and casting machine operators ............... – – 9.49 – 7.50Printing press operators ....................................... – 17.77 – – 14.09Textile sewing machine operators ........................ 7.70 – 14.35 – 7.83Laundering and dry cleaning machine
operators ............................................................ 10.15 8.67 9.26 – –Packaging and filling machine operators .............. 11.22 – – – –Mixing and blending machine operators ............... 13.88 – – – 9.96Photographic process machine operators ............ 11.98 – – – 10.59Miscellaneous machine operators, n.e.c. ............. 12.67 11.16 13.45 12.92 11.61Welders and cutters .............................................. – – 18.66 – 16.30Assemblers ........................................................... 8.80 17.67 17.35 12.31 10.06Production inspectors, checkers and examiners .. 10.62 – 15.80 – 10.80
Transportation and material moving ................................. 16.21 14.52 15.87 16.44 13.24Truck drivers ......................................................... 15.83 14.04 14.22 17.04 12.66Driver-sales workers ............................................. – 9.79 – – –Bus drivers ............................................................ 15.41 13.72 14.12 – 10.88Taxicab drivers and chauffeurs ............................ 12.79 – – – –Motor transportation, n.e.c. ................................... 15.80 – – – –Crane and tower operators ................................... – – 20.04 – –Industrial truck and tractor equipment operators .. 15.63 16.39 15.86 17.38 12.76Miscellaneous material moving equipment
operators, n.e.c. .................................................. – – – 20.20 –
Handlers, equipment cleaners, helpers, and laborers ........................................................................... 12.84 11.64 10.99 11.92 10.05
Groundskeepers and gardeners, except farm ...... 12.51 10.19 13.99 16.17 11.21
See footnotes at end of table.

146
Table 20. Mean hourly earnings1 for selected occupations, all workers, all industries, selected areas,2 April2000–Continued
Occupation3
New York-Northern
New Jersey-Long Island,
NY-NJ-CT-PA
Washington-Baltimore,DC-MD-VA-WV
Detroit-Ann
Arbor-Flint,MI
SanFrancisco-Oakland-San Jose,
CA
LosAngeles-Riverside-
OrangeCounty
CA
BLUE COLLAR–Continued
Handlers, equipment cleaners, helpers, and laborers–Continued
Supervisors, handlers, equipment cleaners, and laborers, n.e.c. ............................................. $18.86 – – – –
Helpers, mechanics and repairers ........................ – – – – $10.31Helpers, construction trades ................................. 15.45 – – – –Construction laborers ........................................... – – – – 9.69Production helpers ................................................ 9.62 – – – 8.74Stock handlers and baggers ................................. 12.05 $10.22 $9.68 $10.46 10.68Machine feeders and offbearers ........................... – – – – 10.12Freight, stock, and material handlers, n.e.c. ......... 12.24 13.29 11.06 15.89 9.66Garage and service station related ....................... – – – 9.33 –Vehicle washers and equipment cleaners ............ – 10.63 – – 7.30Hand packers and packagers ............................... 11.03 11.52 10.53 8.31 8.87Laborers, except construction, n.e.c. .................... 11.64 10.13 13.17 14.89 10.67
SERVICE .............................................................................. 14.02 10.85 10.91 13.61 11.59
Protective service ..................................................... 20.97 17.22 14.93 18.92 16.80Supervisors, police and detectives ....................... 33.52 – – – –Firefighting ............................................................ – 18.11 16.49 22.55 –Police and detectives, public service .................... 25.38 20.29 20.12 29.44 27.01Sheriffs, bailiffs, and other law enforcement
officers ................................................................ 21.72 17.58 – 24.25 22.91Correctional institution officers ............................. 21.90 16.48 17.17 – –Crossing guards ................................................... – – 7.49 – –Guards and police, except public service ............. 11.66 9.23 8.78 10.18 8.07Protective service, n.e.c. ...................................... 15.09 17.85 – – –
Food service ............................................................. 8.94 7.68 7.86 9.48 8.05Waiters, waitresses, and bartenders ...................... 6.59 4.69 5.55 8.87 6.29Bartenders ............................................................ 9.33 – – – 8.00Waiters and waitresses ........................................ 6.36 4.00 4.14 8.63 5.92Waiters’/waitresses’ assistants ............................. 5.54 6.87 – 9.27 6.27
Other food service .................................................. 9.77 9.55 8.51 9.71 8.74Supervisors, food preparation and service ........... 15.36 15.15 – – 16.05Cooks ................................................................... 12.12 9.54 10.01 15.47 9.50Food counter, fountain, and related ...................... 9.62 7.64 6.27 – 6.83Kitchen workers, food preparation ........................ 11.25 8.49 8.17 9.30 8.28Food preparation, n.e.c. ....................................... 7.86 8.03 7.40 8.04 7.30
Health service ........................................................... 10.33 9.67 10.02 12.49 9.63Health aides, except nursing ................................ 12.05 10.37 11.21 15.26 12.58Nursing aides, orderlies and attendants ............... 10.05 9.44 9.73 11.56 8.88
Cleaning and building service ................................... 12.64 9.28 11.91 11.81 8.52Supervisors, cleaning and building service
workers ............................................................... 19.64 13.85 13.91 – 12.79Maids and housemen ........................................... 13.36 8.71 7.99 10.23 7.76Janitors and cleaners ........................................... 12.03 9.01 12.18 12.08 8.21
Personal service ....................................................... 13.90 10.59 8.95 14.91 10.64Attendants, amusement and recreation facilities .. 10.33 6.73 – 9.26 7.44Public transportation attendants ........................... 28.18 22.79 – – 25.98Baggage porters and bellhops .............................. – – – 7.45 –Early childhood teachers’ assistants .................... 11.48 12.91 6.64 – 9.92Child care workers, n.e.c. ..................................... 9.68 8.80 10.27 14.42 10.29Service, n.e.c. ....................................................... 10.82 9.41 8.37 12.17 8.26
n.e.c. = not elsewhere classified.
1 Earnings are the straight-time hourly wages or salaries paid toemployees. They include incentive pay, cost-of-living adjustments,hazard pay, deferred income payments, and deadhead pay. Excludedare shift differentials, premium pay for overtime, vacations and holidays,nonproduction bonuses, uniform and tool allowances, room and board,third party payments, on-call pay, and tips. The mean is computed bytotaling the pay of all workers weighted by hours and dividing by the
number of workers.2 The average payroll month for the selected areas was April 2000. 3 A classification system including about 480 individual occupations
is used to cover all workers in the civilian economy. Individualoccupations are classified into 1 of 9 major occupational groups.
NOTE: Dashes indicate that no data were reported or that data did notmeet publication criteria. Overall occupational groups may include datafor categories not shown separately.

147
Table 21. Mean hourly earnings1 by occupational group and level,2 all workers, selected areas,3 April 2000
Occupational group4 and level
New York-Northern
New Jersey-Long Island,
NY-NJ-CT-PA
Washington-Baltimore,DC-MD-VA-WV
Detroit-Ann
Arbor-Flint,MI
SanFrancisco-Oakland-San Jose,
CA
LosAngeles-Riverside-
OrangeCounty
CA
Computer systems analysts and scientists ............................... $37.09 $29.58 $27.69 $37.16 $28.42Level 7 .......................................................................... – 24.92 – 27.82 –Level 8 .......................................................................... – – – 30.71 –Level 9 .......................................................................... 30.77 27.72 26.48 35.13 25.39Level 10 ........................................................................ 30.88 27.33 – 34.04 –Level 11 ........................................................................ 34.51 33.34 28.82 39.48 33.47Level 12 ........................................................................ 41.33 40.17 – 43.09 –Level 13 ........................................................................ 45.86 – – 46.27 –Level 14 ........................................................................ 57.53 – – – –
Registered nurses .................................................................... 27.74 22.51 23.26 30.09 24.97Level 7 .......................................................................... 28.24 20.49 23.05 29.96 –Level 8 .......................................................................... 27.31 22.27 22.59 28.06 23.24Level 9 .......................................................................... 26.33 22.80 22.79 30.09 25.37Level 10 ........................................................................ 34.49 – – 34.66 –Level 11 ........................................................................ 30.23 29.44 29.03 – –
Accountants and auditors ......................................................... 26.29 21.02 25.12 28.00 24.24Level 5 .......................................................................... 18.19 13.64 – – –Level 7 .......................................................................... 20.81 21.16 – – 19.17Level 8 .......................................................................... 24.78 20.21 23.08 18.31 –Level 9 .......................................................................... 26.60 25.63 28.61 29.26 26.82Level 10 ........................................................................ 29.96 – – – –Level 11 ........................................................................ 31.71 – – – –
Cashiers ................................................................................... 9.26 11.08 8.36 10.68 10.76Level 1 .......................................................................... – – 7.47 – –Level 2 .......................................................................... – 7.05 8.91 – –Level 3 .......................................................................... 10.33 9.81 9.43 10.98 10.41Level 4 .......................................................................... 10.67 – – – 11.41
Secretaries ............................................................................... 17.22 15.25 15.54 18.97 16.74Level 2 .......................................................................... – 13.92 – – –Level 3 .......................................................................... 13.95 12.79 12.46 – 12.74Level 4 .......................................................................... 15.54 13.96 15.01 17.05 13.98Level 5 .......................................................................... 17.53 14.45 16.47 19.16 16.66Level 6 .......................................................................... 19.03 17.82 – 21.12 16.47Level 7 .......................................................................... 20.50 17.62 19.91 20.99 19.49
Truck drivers ............................................................................. 15.83 14.04 14.22 17.04 12.66Level 2 .......................................................................... – – – 17.45 –Level 3 .......................................................................... 16.15 8.99 – – 8.53Level 4 .......................................................................... 14.98 15.45 – 18.57 16.22Level 5 .......................................................................... – 15.20 – – –
Guards and police, except public service ................................. 11.66 9.23 8.78 10.18 8.07Level 3 .......................................................................... 9.44 8.10 – – –Level 4 .......................................................................... 13.70 – – – –
Janitors and cleaners ............................................................... 12.03 9.01 12.18 12.08 8.21Level 1 .......................................................................... 11.08 7.82 10.45 8.81 7.62Level 2 .......................................................................... 9.82 8.77 13.24 10.47 9.09Level 3 .......................................................................... 14.15 11.80 14.45 15.93 11.53Level 4 .......................................................................... 13.57 – 13.83 11.29 –
1 Earnings are the straight-time hourly wages or salaries paid toemployees. They include incentive pay, cost-of-living adjustments,hazard pay, deferred income payments, and deadhead pay. Excludedare shift differentials, premium pay for overtime, vacations and holidays,nonproduction bonuses, uniform and tool allowances, room and board,third party payments, on-call pay, and tips. The mean is computed bytotaling the pay of all workers weighted by hours and dividing by thenumber of workers.
2 Each occupation for which wage data are collected in anestablishment is evaluated based on 10 factors, including knowledge,
complexity, work environment, and others. Points are assigned basedon the occupation’s ranking within each factor. The points are summedto determine the overall level of the occupation.
3 The average payroll month for the selected areas was April 2000. 4 A classification system including about 480 individual occupations
is used to cover all workers in the civilian economy. Individualoccupations are classified into 1 of 9 major occupational groups. NOTE: Dashes indicate that no data were reported or that data did notmeet publication criteria. Overall occupational groups may include datafor categories not shown separately.

148
Table 22. Hourly wage percentiles for establishment jobs,1 all workers:2 selected occupations, all industries, selected areas, April 2000
Occupation3
New York-Northern New Jersey-Long Island,NY-NJ-CT-PA Washington-Baltimore, DC-MD-VA-WV Detroit-Ann Arbor-Flint, MI
10 25 Median50 75 90 10 25 Median
50 75 90 10 25 Median50
Computer systems analysts and scientists ....... $25.25 $29.64 $35.18 $43.51 $52.94 $18.99 $22.74 $28.80 $34.88 $40.90 $21.02 $25.97 $27.15Registered nurses ............................................ 21.50 23.40 26.59 32.38 35.17 18.00 20.28 22.08 23.77 26.57 19.74 21.52 22.58Accountants and auditors ................................. 19.81 20.60 24.72 31.25 36.05 13.44 16.35 19.82 23.35 28.30 20.20 21.74 24.27Cashiers ........................................................... 6.48 7.25 7.53 9.79 15.84 5.89 7.50 10.72 15.74 15.89 6.68 7.00 8.00Secretaries ....................................................... 12.84 14.16 17.00 19.84 22.30 11.29 12.78 14.17 17.44 20.07 10.87 12.31 14.27Truck drivers ..................................................... 9.52 14.29 16.11 17.18 21.42 10.06 12.87 14.34 16.09 17.99 8.17 12.69 14.23Guards and police, except public service ......... 6.25 9.02 10.07 15.02 16.42 7.75 7.75 8.42 11.45 12.00 7.00 7.00 8.61Janitors and cleaners ....................................... 7.26 7.75 11.81 15.92 17.44 5.85 6.67 8.42 10.64 13.75 7.62 8.57 11.23
See footnotes at end of table.
Table 22. Hourly wage percentiles for establishment jobs,1 all workers:2 selected occupations, all industries, selected areas, April 2000— Continued
Occupation3
Detroit-AnnArbor-Flint, MI San Francisco-Oakland-San Jose, CA Los Angeles-Riverside-Orange County CA
75 90 10 25 Median50 75 90 10 25 Median
50 75 90
Computer systems analysts and scientists ....... $31.00 $33.57 $26.05 $29.08 $36.79 $43.44 $48.05 $22.64 $24.17 $26.66 $32.38 $36.82Registered nurses ............................................ 23.94 29.47 23.08 28.62 30.87 32.91 36.39 20.15 22.40 24.64 27.48 28.67Accountants and auditors ................................. 25.09 38.27 17.58 26.41 29.57 31.76 34.42 17.68 19.01 24.04 28.72 32.21Cashiers ........................................................... 8.63 12.23 7.20 8.00 9.50 11.83 16.88 6.70 7.11 11.09 12.60 16.70Secretaries ....................................................... 17.36 22.12 13.94 15.77 18.43 21.68 24.35 12.00 14.19 16.43 19.17 21.25Truck drivers ..................................................... 16.30 21.48 9.89 15.41 18.71 20.49 22.05 7.17 7.89 11.24 17.02 19.03Guards and police, except public service ......... 8.75 11.58 8.50 8.50 8.50 10.55 15.14 6.12 7.35 7.75 8.11 9.84Janitors and cleaners ....................................... 14.91 21.26 7.64 8.08 11.88 14.75 18.03 6.00 6.25 6.42 9.93 13.74
1 Percentiles are calculated from average hourly wages for sampledestablishment jobs within each occupation. The percentiles describe thedistribution of an occupation’s employment by the average wage rates for itsjobs.For example, at the 10th percentile hourly wage for an occupation,one-tenth of the occupation’s employment are found in sampled establishmentjobs whose average wages are the same or less, and nine-tenths are in jobsaveraging the same or more. The calculations of the 25th, 50th, 75th, and 90thpercentiles follow the same logic. Hourly wages are the straight-time wages orsalaries paid to employees. They include incentive pay, cost-of-living
adjustments, and hazard pay. Excluded are premium pay for overtime,vacations, holidays, nonproduction bonuses, and tips.
2 All workers include full-time and part-time workers. 3 A classification system including about 480 individual occupations is used
to cover all workers in the civilian economy. Individual occupations are classifiedinto 1 of 9 major occupational groups. NOTE: Dashes indicate that no data were reported or that data did not meetpublication criteria. Overall occupational groups may include data for categoriesnot shown separately.

149
Construc- Manu- Wholesale Retailtion facturing trade trade
1947 ............................ $1.13 $1.46 $1.54 $1.21 – $1.21 $0.83 $1.14 –1948 ............................ 1.22 1.66 1.71 1.32 – 1.30 .90 1.20 –1949 ............................ 1.27 1.71 1.79 1.37 – 1.35 .95 1.26 –
1950 ............................ 1.33 1.77 1.86 1.43 – 1.35 .98 1.26 –1951 ............................ 1.45 1.93 2.02 1.56 – 1.52 1.06 1.45 –1952 ............................ 1.52 2.01 2.13 1.64 – 1.61 1.09 1.51 –1953 ............................ 1.61 2.14 2.28 1.74 – 1.69 1.16 1.58 –1954 ............................ 1.65 2.14 2.38 1.78 – 1.76 1.20 1.65 –1955 ............................ 1.71 2.20 2.45 1.85 – 1.83 1.25 1.70 –1956 ............................ 1.80 2.33 2.57 1.95 – 1.93 1.30 1.78 –1957 ............................ 1.89 2.45 2.71 2.04 – 2.02 1.37 1.84 –1958 ............................ 1.95 2.47 2.82 2.10 – 2.09 1.42 1.89 –1959 ............................ 2.02 2.56 2.93 2.19 – 2.18 1.47 1.95 –
1960 ............................ 2.09 2.60 3.07 2.26 – 2.24 1.52 2.02 –1961 ............................ 2.14 2.64 3.20 2.32 – 2.31 1.56 2.09 –1962 ............................ 2.22 2.70 3.31 2.39 – 2.37 1.63 2.17 –1963 ............................ 2.28 2.75 3.41 2.45 – 2.45 1.68 2.25 –1964 ............................ 2.36 2.81 3.55 2.53 $2.89 2.52 1.75 2.30 $1.941965 ............................ 2.46 2.92 3.70 2.61 3.03 2.60 1.82 2.39 2.051966 ............................ 2.56 3.05 3.89 2.71 3.11 2.73 1.91 2.47 2.171967 ............................ 2.68 3.19 4.11 2.82 3.23 2.87 2.01 2.58 2.291968 ............................ 2.85 3.35 4.41 3.01 3.42 3.04 2.16 2.75 2.421969 ............................ 3.04 3.60 4.79 3.19 3.63 3.23 2.30 2.93 2.61
1970 ............................ 3.23 3.85 5.24 3.35 3.85 3.43 2.44 3.07 2.811971 ............................ 3.45 4.06 5.69 3.57 4.21 3.64 2.60 3.22 3.041972 ............................ 3.70 4.44 6.06 3.82 4.65 3.85 2.75 3.36 3.271973 ............................ 3.94 4.75 6.41 4.09 5.02 4.07 2.91 3.53 3.471974 ............................ 4.24 5.23 6.81 4.42 5.41 4.38 3.14 3.77 3.751975 ............................ 4.53 5.95 7.31 4.83 5.88 4.72 3.36 4.06 4.021976 ............................ 4.86 6.46 7.71 5.22 6.45 5.02 3.57 4.27 4.311977 ............................ 5.25 6.94 8.10 5.68 6.99 5.39 3.85 4.54 4.651978 ............................ 5.69 7.67 8.66 6.17 7.57 5.88 4.20 4.89 4.991979 ............................ 6.16 8.49 9.27 6.70 8.16 6.39 4.53 5.27 5.36
1980 ............................ 6.66 9.17 9.94 7.27 8.87 6.95 4.88 5.79 5.851981 ............................ 7.25 10.04 10.82 7.99 9.70 7.55 5.25 6.31 6.411982 ............................ 7.68 10.77 11.63 8.49 10.32 8.08 5.48 6.78 6.921983 ............................ 8.02 11.28 11.94 8.83 10.79 8.54 5.74 7.29 7.311984 ............................ 8.32 11.63 12.13 9.19 11.12 8.88 5.85 7.63 7.591985 ............................ 8.57 11.98 12.32 9.54 11.40 9.15 5.94 7.94 7.901986 ............................ 8.76 12.46 12.48 9.73 11.70 9.34 6.03 8.36 8.181987 ............................ 8.98 12.54 12.71 9.91 12.03 9.59 6.12 8.73 8.491988 ............................ 9.28 12.80 13.08 10.19 12.24 9.98 6.31 9.06 8.881989 ............................ 9.66 13.26 13.54 10.48 12.57 10.39 6.53 9.53 9.38
1990 ............................ 10.01 13.68 13.77 10.83 12.92 10.79 6.75 9.97 9.831991 ............................ 10.32 14.19 14.00 11.18 13.20 11.15 6.94 10.39 10.231992 ............................ 10.57 14.54 14.15 11.46 13.43 11.39 7.12 10.82 10.541993 ............................ 10.83 14.60 14.38 11.74 13.55 11.74 7.29 11.35 10.781994 ............................ 11.12 14.88 14.73 12.07 13.78 12.06 7.49 11.83 11.041995 ............................ 11.43 15.30 15.09 12.37 14.13 12.43 7.69 12.32 11.391996 ............................ 11.82 15.62 15.47 12.77 14.45 12.87 7.99 12.80 11.791997 ............................ 12.28 16.15 16.04 13.17 14.92 13.45 8.33 13.34 12.281998 ............................ 12.78 16.91 16.61 13.49 15.31 14.07 8.74 14.07 12.841999 ............................ 13.24 17.05 17.19 13.90 15.69 14.59 9.09 14.62 13.37
2000 ............................ 13.75 17.24 17.88 14.38 16.22 15.20 9.46 15.07 13.91
Dash indicates data not available.
NOTE: Current estimates are projected from March 2000 benchmark levels.
Finance,insur-anceandreal
estate
ServicesMiningYear
Trans-porta-tionand
publicutilities
Totalprivate
Table 23. Average hourly earnings of production workers on private nonfarm payrolls by majorindustry division, annual averages, 1947-2000
(In current dollars)

150
Table 24. Productivity and related data, business and nonfarm business sectors, 1947-2000
(Index, 1992=100)
Output per Hours Compensa- RealUnit labor
Implicit
Year
hour of all Output1 of all sation compensationcost
pricepersons persons2 per hour3 per hour4 deflator 5
Busi-Non-
Busi-Nor-
Busi-Non-
Busi-Non-
Busi-Non-
Busi-Non-
Busi-Non-
nessfarm
nessfarm
nessfarm
nessfarm
ness farm
nessfarm
nessfarm
sectorbusi-
sectorbusi-
sectorbusi-
sectorbusi-
sectorbusi-
sectorbusi-
sectorbusi-
ness ness ness ness ness ness nesssector sector sector sector sector sector sector
1947 ............... 31.8 36.7 20.7 20.3 65.0 55.3 6.8 7.3 39.6 42.5 21.4 19.9 20.5 19.21948 ............... 33.3 37.7 21.8 21.2 65.5 56.2 7.4 7.9 39.8 42.7 22.2 21.0 21.7 20.51949 ............... 34.0 39.0 21.6 21.0 63.3 53.9 7.5 8.2 40.9 44.6 22.0 21.0 21.5 20.7
1950 ............... 36.9 41.7 23.7 23.1 64.1 55.6 8.0 8.7 43.3 46.7 21.8 20.8 21.8 20.91951 ............... 38.0 42.7 25.2 24.9 66.1 58.2 8.8 9.4 44.0 47.1 23.2 22.1 23.5 22.31952 ............... 39.2 43.6 26.0 25.6 66.2 58.8 9.4 10.0 45.9 48.8 23.9 22.8 23.7 22.71953 ............... 40.7 44.6 27.2 26.9 67.0 60.2 10.0 10.5 48.5 51.2 24.5 23.6 23.9 23.21954 ............... 41.6 45.5 26.9 26.4 64.6 58.1 10.3 10.9 49.8 52.5 24.8 23.9 24.1 23.41955 ............... 43.3 47.4 29.0 28.6 67.0 60.4 10.6 11.3 51.3 54.7 24.4 23.8 24.4 23.81956 ............... 43.4 47.0 29.5 29.1 68.0 61.9 11.3 12.0 53.9 57.1 26.0 25.5 25.2 24.71957 ............... 44.7 48.2 30.0 29.7 67.0 61.6 12.0 12.7 55.6 58.5 26.9 26.3 26.0 25.41958 ............... 46.0 49.3 29.4 29.1 63.9 58.9 12.6 13.2 56.5 59.2 27.3 26.7 26.5 25.91959 ............... 47.9 51.3 31.9 31.6 66.6 61.6 13.1 13.7 58.4 61.1 27.4 26.7 26.7 26.2
1960 ............... 48.8 51.9 32.5 32.1 66.6 61.9 13.7 14.3 59.9 62.8 28.0 27.5 27.0 26.51961 ............... 50.6 53.7 33.1 32.8 65.5 61.1 14.2 14.8 61.8 64.4 28.1 27.6 27.2 26.71962 ............... 52.9 56.1 35.2 35.0 66.6 62.4 14.9 15.4 63.9 66.3 28.1 27.5 27.4 26.91963 ............... 55.0 58.1 36.8 36.6 67.0 63.1 15.4 16.0 65.4 67.7 28.0 27.5 27.6 27.11964 ............... 57.5 60.6 39.2 39.1 68.1 64.6 16.2 16.7 67.9 69.9 28.2 27.6 27.9 27.51965 ............... 59.6 62.4 41.9 41.9 70.4 67.1 16.8 17.2 69.3 71.1 28.2 27.6 28.4 27.81966 ............... 62.0 64.6 44.8 44.9 72.3 69.5 17.9 18.2 71.9 73.1 28.9 28.2 29.1 28.51967 ............... 63.4 65.8 45.6 45.7 72.0 69.4 19.0 19.3 73.7 75.1 29.9 29.4 29.9 29.41968 ............... 65.4 67.8 47.9 48.1 73.4 70.9 20.4 20.7 76.2 77.4 31.3 30.6 31.0 30.51969 ............... 65.7 67.9 49.4 49.5 75.2 73.0 21.9 22.2 77.4 78.4 33.3 32.6 32.4 31.9
1970 ............... 67.0 68.9 49.4 49.5 73.7 71.8 23.5 23.7 78.8 79.5 35.1 34.4 33.9 33.31971 ............... 69.9 71.8 51.3 51.4 73.3 71.5 25.0 25.3 80.3 81.1 35.8 35.2 35.3 34.71972 ............... 72.2 74.2 54.7 54.9 75.7 74.0 26.6 26.9 82.7 83.5 36.8 36.2 36.5 35.81973 ............... 74.5 76.6 58.5 58.9 78.5 76.9 28.9 29.1 84.5 85.1 38.8 38.0 38.4 37.01974 ............... 73.2 75.3 57.6 58.0 78.6 77.0 31.7 32.0 83.4 84.2 43.2 42.4 42.1 40.81975 ............... 75.8 77.4 57.0 57.0 75.2 73.7 34.9 35.2 84.3 84.9 46.1 45.5 46.1 45.11976 ............... 78.5 80.3 60.9 61.1 77.6 76.1 38.0 38.2 86.8 87.2 48.4 47.6 48.5 47.61977 ............... 79.8 81.5 64.3 64.6 80.6 79.2 41.0 41.3 87.9 88.5 51.4 50.7 51.4 50.61978 ............... 80.7 82.6 68.3 68.8 84.7 83.3 44.6 45.0 89.4 90.2 55.3 54.5 55.1 54.11979 ............... 80.7 82.2 70.6 70.9 87.5 86.3 48.9 49.3 89.7 90.3 60.7 59.9 59.8 58.7
1980 ............... 80.4 82.0 69.8 70.2 86.8 85.6 54.2 54.6 89.4 90.0 67.4 66.5 65.2 64.31981 ............... 82.0 83.0 71.7 71.6 87.4 86.2 59.4 59.9 89.5 90.2 72.4 72.1 71.2 70.51982 ............... 81.7 82.5 69.6 69.4 85.2 84.1 63.8 64.3 90.9 91.6 78.2 77.9 75.3 74.81983 ............... 84.6 86.3 73.3 73.8 86.6 85.6 66.5 67.1 91.0 91.7 78.6 77.8 77.8 77.21984 ............... 87.0 88.1 79.7 80.0 91.6 90.7 69.5 70.0 91.3 92.0 79.8 79.4 80.0 79.41985 ............... 88.7 89.3 83.1 83.0 93.6 93.0 72.9 73.2 92.7 93.1 82.1 82.0 82.2 81.91986 ............... 91.4 92.0 86.1 86.2 94.2 93.8 76.7 77.0 95.8 96.3 83.9 83.7 83.5 83.21987 ............... 91.9 92.3 89.2 89.3 97.0 96.7 79.7 80.0 96.3 96.6 86.7 86.6 85.6 85.41988 ............... 93.0 93.5 92.9 93.3 100.0 99.8 83.5 83.6 97.3 97.5 89.8 89.4 88.3 87.91989 ............... 93.9 94.2 96.2 96.5 102.4 102.4 85.8 85.8 95.9 95.9 91.3 91.1 91.5 91.2
1990 ............... 95.2 95.3 97.6 97.8 102.6 102.7 90.7 90.5 96.5 96.3 95.3 95.0 94.8 94.51991 ............... 96.3 96.4 96.5 96.6 100.2 100.2 95.0 95.0 97.5 97.5 98.7 98.5 98.1 98.01992 ............... 100.0 100.0 100.0 100.0 100.0 100.0 100.0 100.0 100.0 100.0 100.0 100.0 100.0 100.01993 ............... 100.5 100.5 103.1 103.3 102.6 102.9 102.5 102.2 99.9 99.6 101.9 101.7 102.2 102.21994 ............... 101.9 101.8 108.1 108.2 106.2 106.2 104.5 104.3 99.7 99.5 102.6 102.5 104.0 104.11995 ............... 102.6 102.8 111.5 111.8 108.7 108.8 106.7 106.6 99.3 99.2 104.1 103.7 106.0 106.11996 ............... 105.4 105.4 116.4 116.7 110.4 110.7 110.1 109.8 99.8 99.5 104.5 104.2 107.7 107.61997 ............... 107.8 107.5 122.5 122.7 113.6 114.1 113.5 113.1 100.7 100.3 105.3 105.2 109.7 109.81998 ............... 110.8 110.4 128.6 129.0 116.1 116.8 119.6 119.0 104.6 104.0 108.0 107.7 110.6 110.81999 ............... 113.8 113.2 134.8 135.1 118.4 119.3 125.1 124.2 107.1 106.4 109.9 109.7 111.8 112.3
2000 ............... 118.6 118.1 142.4 142.8 120.0 120.9 131.4 130.5 108.9 108.1 110.7 110.5 113.8 114.3
1 Output is an annual-weighted index of real gross domes-tic product of the sector.
2 Hours at work of all persons engaged in the sector,including hours of proprietors and unpaid family workers.Estimates based primarily on establishment data.
3 Wages and salaries of employees plus employers’ con-tributions for social insurance and private benefit plans. Also
includes an estimate of wages, salaries, and supplementalpayments for the self-employed.
4 Hourly compensation divided by an index of consumerprices.
5 Current dollar gross domestic product divided by the in-dex of real gross domestic product.

151
Table 25. Changes in productivity and related data, business and nonfarm business sectors, 1948-2000
(Percent change from previous year)
Output per Hours Compensa- RealUnit labor
Implicit
Year
hour of all Output1 of all sation compensationcost
pricepersons persons2 per hour3 per hour4 deflator5
Busi-Non-
Busi-Nor-
Busi-Non-
Busi-Non-
Busi-Non-
Busi-Non-
Busi-Non-
nessfarm
nessfarm
nessfarm
nessfarm
ness farm
nessfarm
nessfarm
sectorbusi-
sectorbusi-
sectorbusi-
sectorbusi-
sectorbusi-
sectorbusi-
sectorbusi-
ness ness ness ness ness ness nesssector sector sector sector sector sector sector
1948 ............... 4.6 2.7 5.4 4.4 0.8 1.7 8.5 8.6 0.4 0.5 3.7 5.8 6.2 6.81949 ............... 2.3 3.4 -1.1 -0.8 -3.3 -4.0 1.5 3.1 2.8 4.4 -0.8 -0.3 -0.9 0.9
1950 ............... 8.5 6.9 9.8 10.2 1.2 3.1 7.3 6.2 6.0 4.8 -1.1 -0.7 1.1 1.11951 ............... 3.0 2.5 6.3 7.4 3.2 4.8 9.6 8.6 1.6 0.7 6.4 6.0 7.7 6.61952 ............... 3.1 2.1 3.2 3.1 0.1 1.0 6.3 5.6 4.3 3.6 3.1 3.5 1.1 1.81953 ............... 3.7 2.3 4.9 4.8 1.1 2.4 6.5 5.7 5.7 4.9 2.7 3.3 0.8 2.01954 ............... 2.2 2.0 -1.3 -1.6 -3.5 -3.5 3.3 3.3 2.6 2.6 1.1 1.3 0.6 1.01955 ............... 4.1 4.2 7.9 8.3 3.7 4.0 2.6 3.8 3.0 4.1 -1.4 -0.4 1.3 1.81956 ............... 0.1 -0.8 1.6 1.7 1.5 2.5 6.6 6.1 5.1 4.5 6.5 6.9 3.2 3.51957 ............... 3.2 2.5 1.7 2.0 -1.5 -0.6 6.5 5.8 3.1 2.4 3.3 3.1 3.2 3.21958 ............... 2.9 2.3 -1.9 -2.1 -4.6 -4.3 4.6 4.1 1.7 1.2 1.6 1.8 1.9 1.61959 ............... 4.0 4.0 8.3 8.8 4.1 4.6 4.2 4.0 3.5 3.3 0.1 0.0 0.7 1.2
1960 ............... 1.9 1.3 1.9 1.7 0.0 0.4 4.3 4.5 2.6 2.7 2.4 3.1 1.1 1.21961 ............... 3.7 3.4 2.0 2.0 -1.7 -1.3 4.1 3.6 3.1 2.5 0.4 0.2 0.8 0.81962 ............... 4.6 4.5 6.4 6.8 1.7 2.2 4.5 4.0 3.4 3.0 -0.1 -0.5 1.0 1.01963 ............... 3.9 3.5 4.6 4.6 0.6 1.1 3.7 3.5 2.3 2.2 -0.2 0.0 0.6 0.71964 ............... 4.6 4.2 6.4 6.7 1.7 2.4 5.1 4.6 3.8 3.2 0.5 0.3 1.1 1.21965 ............... 3.6 3.1 7.0 7.1 3.3 3.8 3.8 3.3 2.1 1.7 0.2 0.2 1.6 1.41966 ............... 4.1 3.5 6.8 7.2 2.6 3.6 6.7 5.8 3.7 2.9 2.5 2.2 2.5 2.31967 ............... 2.2 1.7 1.9 1.7 -0.3 -0.1 5.7 5.9 2.6 2.7 3.5 4.1 2.7 3.21968 ............... 3.1 3.1 5.0 5.3 1.8 2.1 7.7 7.4 3.4 3.1 4.4 4.2 3.9 3.81969 ............... 0.5 0.1 3.0 3.0 2.5 2.9 7.0 6.8 1.5 1.3 6.5 6.7 4.5 4.4
1970 ............... 2.0 1.5 0.0 -0.1 -2.0 -1.6 7.7 7.2 1.9 1.4 5.6 5.6 4.4 4.51971 ............... 4.4 4.2 3.9 3.8 -0.4 -0.3 6.4 6.5 1.9 2.0 1.9 2.2 4.3 4.41972 ............... 3.3 3.4 6.6 6.9 3.3 3.4 6.2 6.4 2.9 3.0 2.8 2.9 3.3 2.91973 ............... 3.2 3.1 7.0 7.3 3.7 4.0 8.5 8.2 2.2 1.9 5.2 4.9 5.2 3.61974 ............... -1.7 -1.6 -1.5 -1.5 0.1 0.1 9.7 9.8 -1.2 -1.1 11.6 11.6 9.6 10.21975 ............... 3.5 2.7 -1.0 -1.7 -4.3 -4.3 10.3 10.1 1.0 0.9 6.5 7.2 9.6 10.61976 ............... 3.6 3.7 6.8 7.2 3.1 3.4 8.8 8.6 2.9 2.7 5.1 4.7 5.2 5.41977 ............... 1.6 1.5 5.6 5.6 3.9 4.0 7.9 8.0 1.3 1.4 6.1 6.4 6.1 6.41978 ............... 1.1 1.3 6.2 6.5 5.0 5.1 8.8 8.9 1.8 1.9 7.6 7.6 7.2 6.81979 ............... 0.0 -0.4 3.3 3.2 3.4 3.6 9.7 9.5 0.3 0.1 9.8 10.0 8.5 8.5
1980 ............... -0.3 -0.3 -1.1 -1.1 -0.9 -0.8 10.8 10.8 -0.3 -0.3 11.1 11.1 9.1 9.71981 ............... 1.9 1.2 2.7 2.0 0.7 0.8 9.5 9.7 0.1 0.3 7.4 8.3 9.2 9.51982 ............... -0.4 -0.6 -2.9 -3.1 -2.6 -2.5 7.5 7.5 1.6 1.5 8.0 8.1 5.7 6.21983 ............... 3.6 4.5 5.4 6.4 1.6 1.8 4.2 4.3 0.1 0.1 0.6 -0.2 3.4 3.21984 ............... 2.8 2.2 8.8 8.3 5.8 6.0 4.4 4.3 0.4 0.3 1.5 2.1 2.9 2.81985 ............... 2.0 1.3 4.2 3.9 2.2 2.5 4.9 4.7 1.5 1.2 2.9 3.3 2.7 3.21986 ............... 3.0 3.0 3.7 3.8 0.7 0.8 5.2 5.2 3.4 3.4 2.1 2.1 1.6 1.71987 ............... 0.5 0.4 3.5 3.5 3.0 3.2 3.9 3.8 0.5 0.4 3.4 3.4 2.5 2.51988 ............... 1.2 1.3 4.3 4.5 3.0 3.2 4.8 4.5 1.1 0.9 3.5 3.2 3.1 3.01989 ............... 1.0 0.8 3.5 3.4 2.5 2.6 2.8 2.7 -1.5 -1.6 1.8 1.9 3.7 3.7
1990 ............... 1.3 1.1 1.5 1.4 0.2 0.3 5.7 5.5 0.6 0.4 4.3 4.3 3.5 3.61991 ............... 1.1 1.2 -1.2 -1.3 -2.3 -2.4 4.7 4.9 1.0 1.2 3.6 3.6 3.5 3.71992 ............... 3.9 3.7 3.7 3.5 -0.2 -0.2 5.3 5.3 2.6 2.6 1.4 1.6 2.0 2.11993 ............... 0.5 0.5 3.1 3.3 2.6 2.9 2.5 2.2 -0.1 -0.4 1.9 1.7 2.2 2.21994 ............... 1.3 1.3 4.9 4.7 3.5 3.3 2.0 2.1 -0.2 -0.1 0.7 0.8 1.8 1.91995 ............... 0.7 0.9 3.1 3.4 2.4 2.4 2.1 2.1 -0.4 -0.4 1.4 1.2 2.0 2.01996 ............... 2.8 2.5 4.4 4.3 1.6 1.7 3.2 3.0 0.4 0.3 0.4 0.5 1.6 1.41997 ............... 2.3 2.0 5.2 5.1 2.9 3.1 3.1 3.0 0.9 0.8 0.8 0.9 1.8 2.11998 ............... 2.8 2.7 5.0 5.1 2.2 2.4 5.3 5.2 3.9 3.8 2.5 2.5 0.8 0.91999 ............... 2.8 2.6 4.8 4.8 2.0 2.2 4.6 4.4 2.4 2.3 1.8 1.8 1.1 1.3
2000 ............... 4.2 4.3 5.6 5.7 1.3 1.3 5.0 5.1 1.6 1.6 0.8 0.7 1.8 1.8
1Output is an annual-weighted index of real gross domes-tic product of the sector.
2Hours at work of all persons engaged in the sector, in-cluding hours of proprietors and unpaid family workers. Es-timates based primarily on establishment data.
3Wages and salaries of employees plus employers’ con-tributions for social insurance and private benefit plans. Alsoincludes an estimate of wages, salaries, and supplementalpayments for the self-employed.
4Hourly compensation divided by an index of consumerprices.
5Current dollar gross domestic product divided by the in-dex of real gross domestic product.
NOTE: Percent changes are based on original data andtherefore may differ slightly from percent changes based onindexes.

152
Productivity Inputs
Output per Output CombinedCapital per
hour per Multifactor Labor Capital units of laborhour of
of all unit of productivity2 input4 services5 and capitalall
persons capital inputs6persons
1948 ................. 31.1 107.8 51.5 18.6 51.1 17.3 36.2 28.81949 ................. 32.2 104.8 52.1 18.6 49.4 17.7 35.6 30.7
1950 ................. 35.0 111.0 55.9 20.5 50.3 18.4 36.6 31.5
1955 ................. 40.9 114.7 61.9 24.9 53.7 21.7 40.3 35.6
1960 ................. 45.6 111.1 65.3 27.5 54.0 24.8 42.2 41.1
1965 ................. 55.9 122.4 76.4 35.6 58.0 29.1 46.7 45.71966 ................. 58.2 123.7 78.7 38.1 59.5 30.8 48.3 47.01967 ................. 59.5 119.0 78.8 38.8 59.4 32.6 49.2 50.01968 ................. 61.4 119.8 80.9 40.7 60.3 34.0 50.4 51.21969 ................. 61.7 117.5 80.4 42.0 62.1 35.7 52.2 52.5
1970 ................. 63.0 112.3 80.3 42.0 61.0 37.4 52.3 56.11971 ................. 65.8 112.0 82.8 43.6 60.5 38.9 52.7 58.81972 ................. 68.0 114.6 85.3 46.5 62.6 40.6 54.6 59.31973 ................. 70.2 116.1 87.6 49.8 64.8 42.9 56.9 60.41974 ................. 69.0 108.4 84.4 49.0 65.2 45.2 58.1 63.6
1975 ................. 71.5 103.4 85.2 48.5 62.4 46.9 57.0 69.11976 ................. 74.1 107.1 88.4 51.9 64.2 48.4 58.7 69.11977 ................. 75.2 108.9 89.8 54.8 66.8 50.3 61.0 69.11978 ................. 76.1 110.9 91.0 58.2 70.2 52.5 64.0 68.61979 ................. 76.0 109.1 90.6 60.2 72.4 55.1 66.4 69.6
1980 ................. 75.8 102.7 88.6 59.4 71.9 57.9 67.1 73.81981 ................. 77.3 100.5 88.8 61.0 73.0 60.8 68.8 76.91982 ................. 77.2 93.6 86.1 59.3 71.7 63.3 68.9 82.41983 ................. 79.9 95.7 88.5 62.5 73.4 65.3 70.6 83.41984 ................. 82.2 99.7 91.4 68.1 77.7 68.3 74.5 82.4
1985 ................. 83.9 99.2 92.4 71.0 79.6 71.5 76.9 84.61986 ................. 86.5 98.8 93.8 73.6 80.5 74.6 78.5 87.61987 ................. 87.0 98.9 94.1 76.3 83.1 77.1 81.1 88.01988 ................. 88.1 100.2 94.7 79.6 86.3 79.4 84.0 87.91989 ................. 89.0 100.8 95.3 82.4 88.9 81.8 86.5 88.3
1990 ................. 90.2 99.5 95.4 83.6 89.4 84.0 87.6 90.61991 ................. 91.3 96.3 94.5 82.6 88.3 85.8 87.5 94.81992 ................. 94.8 97.8 96.6 85.7 89.3 87.6 88.7 96.91993 ................. 95.4 98.6 97.1 88.5 91.8 89.8 91.1 96.71994 ................. 96.6 100.3 98.1 92.8 95.6 92.5 94.6 96.3
1995 ................. 97.3 99.7 98.4 95.8 98.0 96.0 97.3 97.61996 ................. 100.0 100.0 100.0 100.0 100.0 100.0 100.0 100.01997 ................. 102.2 100.3 101.2 105.2 103.5 104.9 104.0 101.91998 ................. 105.1 99.6 102.6 110.6 106.1 111.0 107.7 105.51999 ................. 107.9 98.1 103.5 115.8 108.9 118.1 111.9 110.0
Output3Year
Table 26. Private business sector: Productivity and related measures, 1948-991
(Indexes 1996=100)
1 The private business sector includes all of gross domes-tic product except the output of general government, gov-ernment enterprises, non-profit institutions, the rental valueof owner-occupied real estate and the output of paid em-ployees of private households.
2 Output per unit of combined labor and capital inputs.3 Gross domestic product originating in the sector, super-
lative chained index.4 Index of the hours at work of all persons including em-
ployees, proprietors, and unpaid family workers classifiedby education, work experience and gender. This superlativechain index is computed by combining changes in the hoursof each education, experience and gender group weighted
by each group's share of labor compensation.5 A measure of the flow of capital services used in the
sector.6 Labor input combined with capital input, using labor’s
and capital’s shares of costs as weights to form a superla-tive chain index.
Source: Output data are from the Bureau of EconomicAnalysis (BEA), U.S. Department of Commerce, and modi-fied by the Bureau of Labor Statistics (BLS), U.S. Depart-ment of Labor. Compensation and hours data are from theBLS. Capital measures are based on data supplied by BEAand the U.S. Department of Agriculture.

153
Table 27. Productivity and related data: Nonfinancial corporate sector, 1958-2000
(Index, 1992=100, and percent change from preceding year)
Output perEmployee
Compensa- RealUnit labor
Implicit
Year
hour of all Output1hours2
sation compensationcost
pricepersons per hour3 per hour4 deflator5
Change Change Change Change Change Change Change
Indexfrom from from from from from fromprevi- Index previ- Index previ- Index previ- Index previ- Index previ- Index previ-ous ous ous ous ous ous ousyear year year year year year year
1958 ............... 51.8 - 25.5 - 49.3 - 14.4 - 64.7 - 27.8 - 28.4 -1959 ............... 54.4 5.0 28.4 11.3 52.3 6.0 14.9 3.7 66.7 3.0 27.5 -1.1 28.6 0.8
1960 ............... 55.4 1.8 29.4 3.3 53.0 1.4 15.6 4.2 68.3 2.4 28.1 2.3 28.8 0.71961 ............... 57.3 3.4 30.0 2.2 52.4 -1.2 16.1 3.5 70.0 2.5 28.1 0.1 28.9 0.41962 ............... 59.7 4.1 32.5 8.3 54.5 4.0 16.7 3.8 71.9 2.8 28.0 -0.3 29.1 0.81963 ............... 61.7 3.5 34.4 5.9 55.8 2.3 17.2 3.0 73.1 1.7 27.9 -0.4 29.3 0.51964 ............... 64.1 3.8 36.9 7.0 57.5 3.1 18.0 4.2 75.2 2.9 28.0 0.3 29.6 0.91965 ............... 65.8 2.6 39.9 8.3 60.7 5.5 18.5 3.0 76.3 1.4 28.1 0.4 30.0 1.51966 ............... 66.7 1.4 42.7 7.0 64.0 5.5 19.5 5.3 78.1 2.4 29.2 3.9 30.7 2.41967 ............... 67.7 1.5 43.8 2.6 64.7 1.1 20.6 5.5 80.0 2.4 30.4 4.0 31.5 2.61968 ............... 70.0 3.5 46.6 6.4 66.5 2.8 22.1 7.6 82.6 3.3 31.6 4.0 32.7 3.81969 ............... 70.0 0.1 48.4 4.0 69.2 3.9 23.6 6.8 83.6 1.2 33.7 6.7 34.1 4.4
1970 ............... 70.4 0.5 48.0 -1.0 68.2 -1.5 25.3 7.0 84.6 1.2 35.9 6.5 35.6 4.41971 ............... 73.3 4.2 49.9 4.0 68.0 -0.2 26.9 6.3 86.2 1.8 36.7 2.0 37.0 3.81972 ............... 75.3 2.7 53.8 7.9 71.5 5.1 28.4 5.8 88.3 2.5 37.8 3.0 38.1 3.01973 ............... 76.1 1.1 57.0 5.9 74.9 4.8 30.7 8.0 89.8 1.7 40.4 6.9 40.3 5.91974 ............... 74.4 -2.1 56.0 -1.7 75.2 0.4 33.6 9.6 88.6 -1.3 45.2 12.0 44.4 10.01975 ............... 77.2 3.8 55.1 -1.6 71.3 -5.1 37.0 9.9 89.3 0.7 47.9 5.9 48.8 9.91976 ............... 79.7 3.2 59.5 7.9 74.6 4.6 40.0 8.3 91.4 2.4 50.2 4.9 51.0 4.61977 ............... 81.6 2.4 63.8 7.3 78.2 4.8 43.1 7.8 92.5 1.2 52.9 5.3 53.8 5.41978 ............... 82.1 0.6 68.1 6.7 82.9 6.0 46.8 8.5 93.8 1.5 57.0 7.8 57.4 6.81979 ............... 81.5 -0.7 70.2 3.1 86.1 3.9 51.1 9.3 93.7 -0.1 62.7 10.1 62.0 8.0
1980 ............... 81.1 -0.5 69.2 -1.4 85.3 -0.9 56.4 10.4 93.1 -0.7 69.6 10.9 68.4 10.31981 ............... 82.6 1.9 71.5 3.3 86.5 1.4 61.6 9.2 92.9 -0.2 74.6 7.2 75.3 10.11982 ............... 83.4 0.9 70.0 -2.1 83.9 -3.0 66.0 7.2 94.1 1.3 79.2 6.2 79.6 5.71983 ............... 85.9 3.1 73.3 4.8 85.3 1.6 68.4 3.6 93.5 -0.6 79.6 0.5 81.1 1.81984 ............... 88.2 2.6 80.2 9.5 91.0 6.7 71.2 4.1 93.6 0.1 80.7 1.5 83.2 2.71985 ............... 89.9 2.0 83.8 4.5 93.2 2.5 74.4 4.5 94.6 1.1 82.7 2.5 84.5 1.51986 ............... 91.7 1.9 85.9 2.4 93.7 0.5 78.0 4.8 97.5 3.0 85.1 2.8 85.5 1.21987 ............... 94.7 3.3 90.7 5.6 95.8 2.2 81.7 4.7 98.7 1.2 86.2 1.3 87.0 1.81988 ............... 95.9 1.3 95.8 5.6 99.9 4.2 84.2 3.1 98.1 -0.6 87.7 1.8 89.4 2.71989 ............... 94.7 -1.2 97.4 1.7 102.8 2.9 86.3 2.6 96.5 -1.7 91.1 3.8 92.5 3.5
1990 ............... 95.4 0.7 98.3 0.9 103.0 0.2 90.8 5.2 96.7 0.2 95.2 4.5 95.8 3.61991 ............... 97.7 2.3 97.5 -0.8 99.8 -3.1 95.3 4.9 97.8 1.2 97.5 2.5 98.3 2.61992 ............... 100.0 2.4 100.0 2.6 100.0 0.2 100.0 5.0 100.0 2.3 100.0 2.5 100.0 1.81993 ............... 100.7 0.7 103.0 3.0 102.3 2.3 102.0 2.0 99.5 -0.5 101.3 1.3 102.1 2.11994 ............... 103.1 2.4 109.6 6.4 106.3 3.9 104.2 2.1 99.4 -0.1 101.0 -0.3 103.7 1.61995 ............... 104.2 1.0 114.2 4.2 109.6 3.1 106.2 1.9 98.8 -0.6 101.9 0.8 105.1 1.41996 ............... 107.5 3.2 119.9 5.0 111.5 1.8 109.0 2.6 98.7 -0.1 101.4 -0.5 105.5 0.41997 ............... 108.4 0.9 127.0 5.9 117.1 5.0 110.3 1.3 97.8 -0.9 101.8 0.4 106.2 0.71998 ............... 112.3 3.5 134.9 6.3 120.2 2.6 115.9 5.0 101.3 3.6 103.2 1.4 106.6 0.31999 ............... 116.2 3.5 142.9 5.9 123.0 2.3 121.1 4.5 103.7 2.3 104.2 1.0 107.4 0.8
2000 ............... 121.1 4.2 151.6 6.1 125.2 1.8 126.8 4.8 105.1 1.4 104.8 0.6 108.8 1.2
1 Output is an annual-weighted index of real gross domes-tic product originating in the sector.
2 Hours at work of all employees engaged in the sector.Estimates based primarily on establishment data.
3 Wages and salaries of employees plus employers’ con-tributions for social insurance and private benefit plans.
4 Hourly compensation divided by an index of consumerprices.
5Current dollar gross domestic product divided by the in-dex of real gross domestic product.
NOTE: Percent changes are based on original data andtherefore may differ slightly from percent changes based onindexes.
Dash indicates data not available.

154
Table 28. Productivity and related data: Manufacturing sector, 1949-2000
(Index, 1992=100, and percent change from preceding year)
Output perHours of all
Compensa- RealUnit labor
Implicit
Year
hour of all Output1persons2
sation compensationcost
pricepersons per hour3 per hour4 deflator5
Change Change Change Change Change Change Change
Indexfrom from from from from from fromprevi- Index previ- Index previ- Index previ- Index previ- Index previ- Index previ-ous ous ous ous ous ous ousyear year year year year year year
1949 ............... 33.5 - 26.5 - 79.1 - 8.3 - 45.1 - 24.6 - 24.0 -
1950 ............... 34.0 1.5 29.1 9.7 85.5 8.1 8.7 5.1 46.8 3.7 25.5 3.5 24.5 2.31951 ............... 33.8 -0.7 31.1 7.0 92.1 7.7 9.5 10.1 47.7 2.0 28.3 10.8 26.8 9.21952 ............... 35.2 4.2 32.9 5.6 93.3 1.3 10.2 6.6 49.9 4.6 28.9 2.3 26.7 -0.41953 ............... 36.4 3.2 35.7 8.5 98.1 5.1 10.7 5.5 52.2 4.7 29.5 2.2 26.6 -0.31954 ............... 37.3 2.6 33.4 -6.3 89.6 -8.6 11.2 4.6 54.2 3.8 30.1 1.9 27.0 1.41955 ............... 38.8 4.0 36.7 9.7 94.6 5.5 11.7 3.9 56.5 4.3 30.1 -0.1 27.2 0.81956 ............... 38.6 -0.4 37.1 1.0 96.0 1.5 12.4 6.4 59.3 4.9 32.1 6.9 28.1 3.51957 ............... 39.4 2.0 37.2 0.4 94.5 -1.6 13.2 6.0 60.8 2.6 33.4 3.9 29.2 3.61958 ............... 40.0 1.6 34.7 -6.8 86.6 -8.3 13.8 4.6 61.8 1.7 34.4 3.0 29.9 2.51959 ............... 40.9 2.2 37.8 9.1 92.5 6.7 14.3 3.7 63.7 3.0 34.9 1.5 30.3 1.3
1960 ............... 41.8 2.1 38.5 1.7 92.1 -0.4 14.9 4.2 65.2 2.4 35.6 2.0 30.2 -0.21961 ............... 42.8 2.5 38.4 -0.2 89.7 -2.6 15.3 2.9 66.5 1.9 35.7 0.5 30.3 0.21962 ............... 44.2 3.2 41.3 7.5 93.4 4.1 15.9 3.8 68.3 2.8 36.0 0.6 30.3 0.11963 ............... 45.7 3.5 43.1 4.5 94.4 1.0 16.4 3.0 69.4 1.7 35.8 -0.4 30.3 0.01964 ............... 47.4 3.8 45.7 6.0 96.4 2.1 17.0 4.2 71.4 2.8 36.0 0.4 30.3 0.21965 ............... 48.5 2.4 49.5 8.3 102.0 5.8 17.4 2.1 71.8 0.5 35.9 -0.2 30.7 1.11966 ............... 49.1 1.1 53.3 7.7 108.6 6.5 18.2 4.5 73.0 1.6 37.1 3.4 31.5 2.81967 ............... 50.9 3.7 54.9 3.1 108.0 -0.6 19.2 5.5 74.6 2.3 37.7 1.7 32.0 1.51968 ............... 52.7 3.5 57.7 5.1 109.6 1.5 20.7 7.7 77.1 3.3 39.2 4.0 32.7 2.21969 ............... 53.5 1.7 59.4 2.9 110.9 1.2 22.2 7.3 78.5 1.7 41.4 5.5 33.8 3.3
1970 ............... 54.2 1.1 56.5 -4.8 104.4 -5.9 23.7 7.1 79.4 1.3 43.8 5.8 35.0 3.41971 ............... 57.8 6.8 58.2 2.9 100.5 -3.7 25.2 6.1 80.7 1.6 43.5 -0.7 36.2 3.61972 ............... 60.3 4.2 63.3 8.9 105.1 4.5 26.5 5.2 82.3 1.9 43.9 0.9 37.4 3.41973 ............... 61.4 1.9 67.8 7.1 110.4 5.1 28.5 7.7 83.4 1.4 46.4 5.6 40.3 7.71974 ............... 61.2 -0.3 66.1 -2.5 107.9 -2.2 31.6 11.0 83.4 0.0 51.7 11.4 47.3 17.31975 ............... 64.3 5.0 62.5 -5.5 97.2 -9.9 35.5 12.1 85.6 2.7 55.2 6.7 53.0 11.91976 ............... 67.0 4.2 68.2 9.2 101.9 4.8 38.4 8.4 87.7 2.5 57.4 4.1 55.3 4.31977 ............... 69.7 4.0 73.9 8.4 106.1 4.2 41.8 8.7 89.6 2.1 60.0 4.5 58.7 6.21978 ............... 70.4 1.0 77.8 5.2 110.6 4.2 45.2 8.1 90.6 1.1 64.2 7.0 62.7 6.81979 ............... 69.8 -0.8 78.7 1.1 112.7 2.0 49.6 9.8 90.9 0.4 71.1 10.7 69.8 11.5
1980 ............... 70.1 0.4 75.3 -4.2 107.5 -4.6 55.6 12.0 91.6 0.8 79.3 11.6 79.9 14.41981 ............... 70.7 0.9 75.6 0.4 107.0 -0.5 61.1 9.9 92.1 0.5 86.3 8.9 87.1 9.11982 ............... 74.2 5.0 72.7 -3.9 97.9 -8.4 67.0 9.7 95.4 3.6 90.2 4.5 89.6 2.81983 ............... 76.7 3.3 75.9 4.4 98.9 1.0 68.8 2.8 94.1 -1.3 89.7 -0.6 90.0 0.41984 ............... 79.5 3.6 83.7 10.3 105.3 6.5 71.2 3.5 93.6 -0.5 89.6 -0.1 91.5 1.61985 ............... 82.3 3.6 86.0 2.8 104.6 -0.7 75.1 5.5 95.5 2.0 91.3 1.8 91.0 -0.61986 ............... 85.9 4.4 88.5 2.8 103.0 -1.5 78.5 4.5 98.1 2.7 91.3 0.1 87.5 -3.91987 ............... 88.3 2.8 91.6 3.6 103.8 0.8 80.7 2.9 97.5 -0.5 91.4 0.1 89.2 2.01988 ............... 90.2 2.2 96.1 4.9 106.6 2.7 84.0 4.1 97.9 0.4 93.1 1.9 91.8 2.91989 ............... 90.3 0.1 96.6 0.5 107.1 0.5 86.6 3.2 96.8 -1.1 96.0 3.1 95.6 4.1
1990 ............... 92.9 2.9 97.3 0.7 104.8 -2.1 90.8 4.8 96.6 -0.2 97.8 1.9 99.0 3.61991 ............... 95.0 2.3 95.4 -2.0 100.4 -4.2 95.6 5.3 98.1 1.5 100.6 2.9 99.6 0.61992 ............... 100.0 5.3 100.0 4.8 100.0 -0.4 100.0 4.6 100.0 1.9 100.0 -0.6 100.0 0.41993 ............... 101.9 1.9 103.3 3.3 101.4 1.4 102.7 2.7 100.2 0.2 100.8 0.8 100.9 0.91994 ............... 105.0 3.0 108.7 5.3 103.6 2.2 105.6 2.8 100.8 0.6 100.7 -0.2 102.0 1.11995 ............... 109.0 3.8 113.4 4.3 104.0 0.4 107.9 2.1 100.4 -0.4 99.0 -1.7 103.9 1.81996 ............... 112.8 3.5 117.0 3.1 103.7 -0.3 109.3 1.3 99.0 -1.4 96.9 -2.1 104.9 1.01997 ............... 117.6 4.3 124.1 6.1 105.5 1.7 111.4 1.9 98.8 -0.2 94.7 -2.3 104.1 -0.71998 ............... 124.0 5.4 130.4 5.1 105.2 -0.3 117.3 5.3 102.6 3.8 94.6 -0.1 100.5 -3.51999 ............... 129.6 4.5 135.2 3.7 104.3 -0.8 122.0 4.0 104.5 1.9 94.1 -0.5 101.1 0.6
2000 ............... 138.5 6.9 142.9 5.7 103.2 -1.1 128.4 5.2 106.4 1.8 92.7 -1.6 - -
1Output is an annual-weighted index of real gross sectoralproduct.
2Hours at work of all persons engaged in the sector, in-cluding hours of proprietors. Estimates based primarily onestablishment data.
3Wages and salaries of employees plus employers’ con-tributions for social insurance and private benefit plans. Alsoincludes an estimate of wages, salaries, and supplementalpayments for the self-employed.
4Hourly compensation divided by an index of consumerprices.
5Current dollar sectoral product divided by the index ofreal sectoral product.
NOTE: Percent changes are based on original data andtherefore may differ slightly from percent changes based onindexes.
Dash indicates data not available.
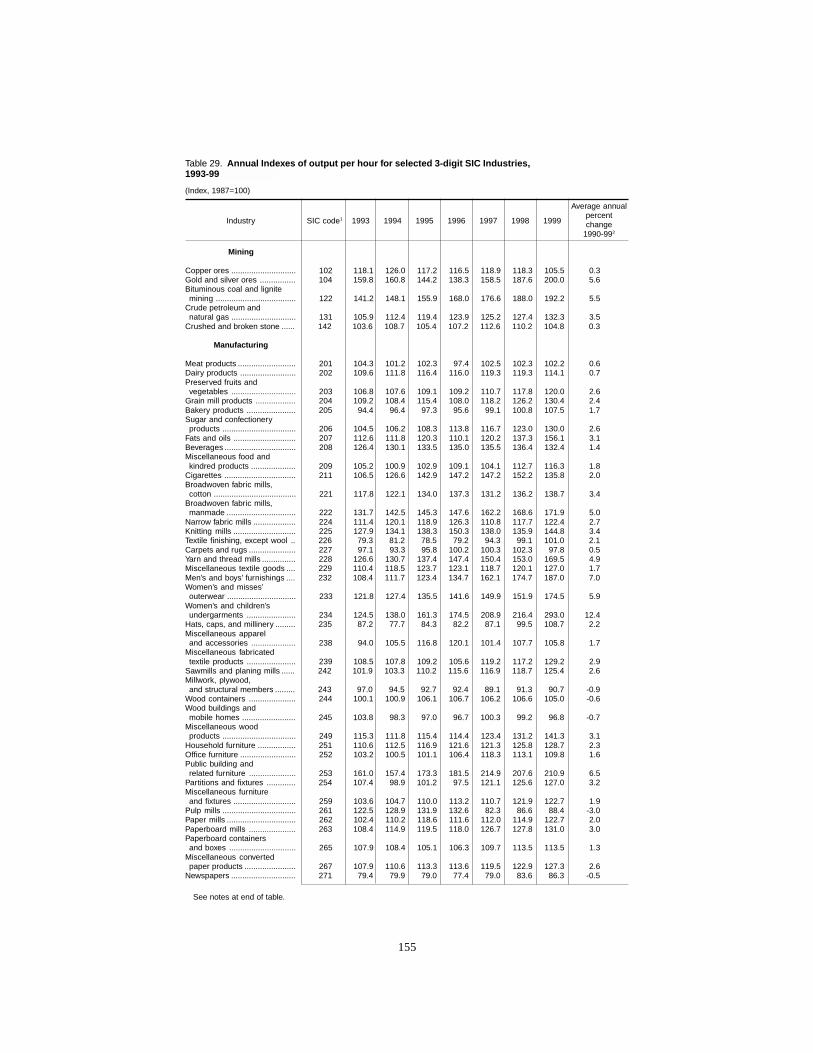
Table 29. Annual Indexes of output per hour for selected 3-digit SIC Industries,1993-99—Continued
(Index, 1987=100)
Industry SIC code1 1993 1994 1995 1996 1997 1998 1999
155
See notes at end of table.
Mining
Copper ores ............................. 102 118.1 126.0 117.2 116.5 118.9 118.3 105.5 0.3Gold and silver ores ................ 104 159.8 160.8 144.2 138.3 158.5 187.6 200.0 5.6Bituminous coal and lignitemining .................................... 122 141.2 148.1 155.9 168.0 176.6 188.0 192.2 5.5
Crude petroleum andnatural gas ............................. 131 105.9 112.4 119.4 123.9 125.2 127.4 132.3 3.5
Crushed and broken stone ...... 142 103.6 108.7 105.4 107.2 112.6 110.2 104.8 0.3
Manufacturing
Meat products .......................... 201 104.3 101.2 102.3 97.4 102.5 102.3 102.2 0.6Dairy products ......................... 202 109.6 111.8 116.4 116.0 119.3 119.3 114.1 0.7Preserved fruits andvegetables ............................. 203 106.8 107.6 109.1 109.2 110.7 117.8 120.0 2.6
Grain mill products .................. 204 109.2 108.4 115.4 108.0 118.2 126.2 130.4 2.4Bakery products ...................... 205 94.4 96.4 97.3 95.6 99.1 100.8 107.5 1.7Sugar and confectioneryproducts ................................. 206 104.5 106.2 108.3 113.8 116.7 123.0 130.0 2.6
Fats and oils ............................ 207 112.6 111.8 120.3 110.1 120.2 137.3 156.1 3.1Beverages ................................ 208 126.4 130.1 133.5 135.0 135.5 136.4 132.4 1.4Miscellaneous food andkindred products .................... 209 105.2 100.9 102.9 109.1 104.1 112.7 116.3 1.8
Cigarettes ................................ 211 106.5 126.6 142.9 147.2 147.2 152.2 135.8 2.0Broadwoven fabric mills,cotton ..................................... 221 117.8 122.1 134.0 137.3 131.2 136.2 138.7 3.4
Broadwoven fabric mills,manmade ............................... 222 131.7 142.5 145.3 147.6 162.2 168.6 171.9 5.0
Narrow fabric mills ................... 224 111.4 120.1 118.9 126.3 110.8 117.7 122.4 2.7Knitting mills ............................ 225 127.9 134.1 138.3 150.3 138.0 135.9 144.8 3.4Textile finishing, except wool .. 226 79.3 81.2 78.5 79.2 94.3 99.1 101.0 2.1Carpets and rugs ..................... 227 97.1 93.3 95.8 100.2 100.3 102.3 97.8 0.5Yarn and thread mills ............... 228 126.6 130.7 137.4 147.4 150.4 153.0 169.5 4.9Miscellaneous textile goods .... 229 110.4 118.5 123.7 123.1 118.7 120.1 127.0 1.7Men’s and boys’ furnishings .... 232 108.4 111.7 123.4 134.7 162.1 174.7 187.0 7.0Women’s and misses’outerwear ............................... 233 121.8 127.4 135.5 141.6 149.9 151.9 174.5 5.9
Women’s and children’sundergarments ...................... 234 124.5 138.0 161.3 174.5 208.9 216.4 293.0 12.4
Hats, caps, and millinery ......... 235 87.2 77.7 84.3 82.2 87.1 99.5 108.7 2.2Miscellaneous appareland accessories .................... 238 94.0 105.5 116.8 120.1 101.4 107.7 105.8 1.7
Miscellaneous fabricatedtextile products ...................... 239 108.5 107.8 109.2 105.6 119.2 117.2 129.2 2.9
Sawmills and planing mills ...... 242 101.9 103.3 110.2 115.6 116.9 118.7 125.4 2.6Millwork, plywood,and structural members ......... 243 97.0 94.5 92.7 92.4 89.1 91.3 90.7 -0.9
Wood containers ..................... 244 100.1 100.9 106.1 106.7 106.2 106.6 105.0 -0.6Wood buildings andmobile homes ........................ 245 103.8 98.3 97.0 96.7 100.3 99.2 96.8 -0.7
Miscellaneous woodproducts ................................. 249 115.3 111.8 115.4 114.4 123.4 131.2 141.3 3.1
Household furniture ................. 251 110.6 112.5 116.9 121.6 121.3 125.8 128.7 2.3Office furniture ......................... 252 103.2 100.5 101.1 106.4 118.3 113.1 109.8 1.6Public building andrelated furniture ..................... 253 161.0 157.4 173.3 181.5 214.9 207.6 210.9 6.5
Partitions and fixtures ............. 254 107.4 98.9 101.2 97.5 121.1 125.6 127.0 3.2Miscellaneous furnitureand fixtures ............................ 259 103.6 104.7 110.0 113.2 110.7 121.9 122.7 1.9
Pulp mills ................................. 261 122.5 128.9 131.9 132.6 82.3 86.6 88.4 -3.0Paper mills ............................... 262 102.4 110.2 118.6 111.6 112.0 114.9 122.7 2.0Paperboard mills ..................... 263 108.4 114.9 119.5 118.0 126.7 127.8 131.0 3.0Paperboard containersand boxes .............................. 265 107.9 108.4 105.1 106.3 109.7 113.5 113.5 1.3
Miscellaneous convertedpaper products ....................... 267 107.9 110.6 113.3 113.6 119.5 122.9 127.3 2.6
Newspapers ............................. 271 79.4 79.9 79.0 77.4 79.0 83.6 86.3 -0.5
Average annualpercentchange
1990-992

Table 29. Annual Indexes of output per hour for selected 3-digit SIC Industries,1993-99—Continued
(Index, 1987=100)
Industry SIC code1 1993 1994 1995 1996 1997 1998 1999
156
See notes at end of table.
Average annualpercentchange
1990-992
Manufacturing—Continued
Periodicals ............................... 272 89.5 81.9 87.8 89.1 100.1 115.0 115.1 2.3Books ....................................... 273 103.5 103.0 101.6 99.3 102.6 101.0 105.4 1.0Miscellaneous publishing ........ 274 104.5 97.5 94.8 93.6 114.5 119.5 128.3 3.7Commercial printing ................ 275 106.9 106.5 107.2 108.3 108.8 109.9 115.2 1.3Manifold business forms ......... 276 91.1 82.0 76.9 75.2 77.9 76.7 73.6 -2.6Greeting cards ......................... 277 91.4 89.0 92.5 90.8 92.2 104.2 103.9 0.4Blankbooks and bookbinding .. 278 98.7 105.4 108.7 114.5 114.2 116.4 123.3 2.4Printing trade services ............ 279 115.3 111.0 116.7 126.2 123.3 126.7 120.5 2.2Industrial inorganic chemicals 281 105.6 102.3 109.3 110.1 116.8 145.8 170.7 5.3Plastics materials andsynthetics ............................... 282 112.0 125.3 128.3 125.3 135.4 142.2 145.7 4.2
Drugs ....................................... 283 99.7 104.6 108.7 112.5 112.4 104.3 104.8 0.1Soaps, cleaners, and toiletgoods ..................................... 284 108.7 111.2 118.6 120.9 126.4 122.7 116.8 1.3
Paints and allied products ....... 285 108.8 116.7 118.0 125.6 126.4 126.8 125.6 1.9Industrial organic chemicals ... 286 92.2 99.9 98.6 99.0 111.2 105.7 111.3 1.0Agricultural chemicals ............. 287 103.8 105.0 108.5 110.0 119.8 117.5 106.9 0.2Miscellaneous chemicalproducts ................................. 289 107.1 105.7 107.8 110.1 120.3 120.6 128.1 3.1
Petroleum refining ................... 291 120.1 123.8 132.3 142.0 149.2 155.7 169.5 5.0Asphalt paving and roofingmaterials ................................ 295 108.0 104.9 111.2 113.1 123.1 124.7 115.7 1.9
Miscellaneous petroleumand coal products .................. 299 104.2 96.3 87.4 87.1 96.5 98.5 90.7 -0.5
Tires and inner tubes .............. 301 116.5 124.1 131.1 138.8 149.1 144.2 145.5 3.9Hose and belting and gasketsand packing ........................... 305 99.7 102.7 104.6 107.4 113.5 112.7 114.0 1.9
Fabricated rubber products,n.e.c ....................................... 306 123.1 119.1 121.5 121.0 125.3 132.3 140.8 2.9
Miscellaneous plasticsproducts, n.e.c ....................... 308 116.7 120.8 121.0 124.7 129.9 133.8 141.2 3.3
Footwear, except rubber .......... 314 105.2 113.0 117.1 126.1 121.4 110.9 131.6 3.0Flat glass ................................. 321 97.7 97.6 99.6 101.5 107.6 114.0 127.7 4.7Glass and glassware,pressed or blown ................... 322 108.7 112.9 115.7 121.4 128.3 135.2 143.6 3.6
Products of purchasedglass ...................................... 323 106.2 105.9 106.1 122.0 125.1 122.0 134.0 4.2
Cement, hydraulic ................... 324 119.9 125.6 124.3 128.7 133.1 134.1 139.6 2.4Structural clay products .......... 325 106.8 114.0 112.6 119.6 111.9 114.8 124.0 1.4Pottery and related products ... 326 100.3 108.4 109.3 119.3 123.2 127.1 120.8 2.3Concrete, gypsum, andplaster products ..................... 327 104.6 101.5 104.5 107.3 107.6 112.8 114.4 1.3
Miscellaneous nonmetallicmineral products .................... 329 104.5 106.3 107.8 110.4 114.6 114.7 114.6 2.1
Blast furnace and basicsteel products ........................ 331 133.6 142.4 142.6 147.5 155.0 151.0 148.9 3.5
Iron and steel foundries ........... 332 112.1 113.0 112.7 116.2 120.8 121.1 126.2 1.9Primary nonferrous metals ...... 333 107.9 105.3 111.0 110.8 112.0 125.8 131.2 2.8Nonferrous rolling anddrawing .................................. 335 98.3 101.2 99.2 104.0 111.3 115.2 122.7 3.2
Nonferrous foundries(castings) ............................... 336 108.5 112.1 117.8 122.3 127.0 131.5 130.8 2.6
Miscellaneous primary metalproducts ................................. 339 111.3 134.5 152.2 149.6 136.2 140.0 150.4 3.2
Metal cans and shippingcontainers .............................. 341 132.3 140.9 144.2 155.2 160.3 163.8 160.3 3.5
Cutlery, handtools, andhardware ................................ 342 104.0 109.2 111.3 118.2 114.6 115.7 123.9 2.7
Plumbing and heating,except electric ....................... 343 102.0 109.1 109.2 118.6 127.3 130.3 126.9 2.4
Fabricated structural metalproducts ................................. 344 104.8 107.7 105.8 106.5 111.9 112.7 112.7 1.5
Metal forgings and stampings . 346 108.7 108.5 109.3 113.6 120.2 125.9 130.3 3.5Metal services, n.e.c ............... 347 120.6 123.0 127.7 128.4 124.4 127.3 127.9 2.3Ordnance and accessories,n.e.c ....................................... 348 84.6 83.6 87.6 87.5 93.7 96.6 92.2 1.3

Table 29. Annual Indexes of output per hour for selected 3-digit SIC Industries,1993-99—Continued
(Index, 1987=100)
Industry SIC code1 1993 1994 1995 1996 1997 1998 1999
157
Average annualpercentchange
1990-992
See notes at end of table.
Manufacturing—Continued
Miscellaneous fabricatedmetal products ....................... 349 102.0 103.2 106.6 108.3 107.7 111.5 110.3 1.4
Engines and turbines .............. 351 109.2 122.3 122.7 136.6 136.9 145.9 151.2 4.0Farm and garden machinery ... 352 118.6 125.0 134.7 137.2 141.2 148.5 125.5 0.8Construction and relatedmachinery .............................. 353 108.2 117.7 122.1 123.3 132.5 137.5 137.2 2.8
Metalworking machinery ......... 354 107.4 109.9 114.8 114.9 119.2 119.8 123.5 2.3Special industry machinery .... 355 113.6 121.2 132.3 134.0 131.7 125.1 139.3 2.9General industrialmachinery .............................. 356 104.8 106.7 109.0 109.4 110.0 111.2 111.4 1.0
Computer and officeequipment .............................. 357 258.6 328.6 469.4 681.3 960.2 1350.6 1840.2 33.3
Refrigeration and servicemachinery .............................. 358 108.6 110.7 112.7 114.7 115.0 121.4 123.2 1.9
Industrial machinery, n.e.c ...... 359 118.5 127.4 138.8 141.4 129.3 127.5 134.3 2.5Electric distributionequipment .............................. 361 122.2 131.8 143.0 143.9 142.8 147.5 146.6 3.6
Electrical industrialapparatus ............................... 362 132.9 134.9 150.8 154.3 164.2 162.3 162.9 4.7
Household appliances ............. 363 123.4 131.4 127.3 127.4 142.9 150.3 150.2 4.0Electric lighting and wiringequipment .............................. 364 107.8 113.4 113.7 116.9 121.8 129.2 132.4 3.2
Communications equipment ... 366 163.0 186.4 200.6 229.5 275.3 276.0 327.1 11.4Electronic componentsand accessories .................... 367 217.9 274.1 401.5 514.9 613.4 768.0 1070.0 26.0
Miscellaneous electricalequipment & supplies ............ 369 108.2 110.5 114.1 123.1 128.3 135.3 140.7 5.0
Motor vehicles andequipment .............................. 371 106.2 108.8 106.7 107.2 116.3 125.2 136.5 3.2
Aircraft and parts ..................... 372 115.2 109.6 107.9 113.0 114.7 140.1 139.6 3.9Ship and boat building andrepairing ................................. 373 106.2 103.8 98.0 99.2 105.3 102.0 112.6 0.9
Railroad equipment ................. 374 151.0 152.5 150.0 148.3 184.2 189.1 205.1 4.2Motorcycles, bicycles,and parts ................................ 375 130.9 125.1 120.3 125.5 120.4 127.7 121.4 2.9
Guided missiles, spacevehicles, parts ....................... 376 122.1 118.9 121.0 129.4 136.5 142.4 158.2 3.5
Search and navigationequipment .............................. 381 129.1 132.1 149.5 142.2 149.5 149.1 139.7 2.4
Measuring and controllingdevices ................................... 382 124.0 133.8 146.4 150.5 142.4 143.5 152.9 4.1
Medical instruments andsupplies ................................. 384 127.3 126.7 131.5 139.8 147.4 158.6 160.2 3.6
Ophthalmic goods ................... 385 157.8 160.6 167.2 188.2 196.3 199.1 229.5 7.4Photographic equipment &supplies ................................. 386 126.9 132.7 129.5 128.7 121.5 124.8 147.2 3.5
Jewelry, silverware, andplated ware ............................ 391 96.7 99.5 100.2 102.6 114.2 113.1 133.9 3.4
Musical instruments ................ 393 95.6 88.7 86.9 78.8 82.9 81.4 86.4 -1.3Toys and sporting goods ......... 394 114.2 109.7 113.6 119.9 125.7 131.6 124.0 1.5Pens, pencils, office, andart supplies ............................ 395 111.6 129.9 135.2 144.1 127.5 132.5 129.3 1.0
Costume jewelry andnotions ................................... 396 115.8 129.0 143.7 142.2 118.0 131.2 150.2 4.0
Miscellaneous manufactures .. 399 107.7 106.1 108.1 112.8 109.4 108.5 111.2 0.5
Transportation
Railroad transportation ............ 4011 145.4 150.3 156.2 167.0 169.8 173.3 182.3 4.9Trucking, except local 3 ............ 4213 126.6 129.5 125.4 130.9 132.4 129.9 131.6 1.9U.S. postal service 4 ................ 431 107.1 106.6 106.5 104.7 108.3 109.7 110.3 0.7Air transportation 3 ................... 4512,13,22 100.2 105.7 108.6 111.1 111.6 110.7 108.3 1.7
(pts.)

Table 29. Annual Indexes of output per hour for selected 3-digit SIC Industries,1993-99—Continued
(Index, 1987=100)
Industry SIC code1 1993 1994 1995 1996 1997 1998 1999
158
Utitlities
Telephone communications .... 481 135.5 142.2 148.1 159.5 160.9 170.3 189.1 5.9Radio and televisionbroadcasting .......................... 483 106.7 110.1 109.6 105.8 101.1 100.7 101.8 -0.3
Cable and other pay TVservices ................................. 484 85.3 83.4 84.5 81.9 84.7 83.5 81.5 -1.4
Electric utilities ........................ 491,3 (pt.) 120.6 126.8 135.0 146.5 150.5 160.1 162.7 4.4Gas utilities .............................. 492,3 (pt.) 121.8 125.6 137.1 145.9 158.6 144.4 145.0 3.6
Trade
Lumber and other buildingmaterials dealers ................... 521 111.4 118.9 117.8 121.6 121.8 134.2 142.3 3.5
Paint, glass, andwallpaper stores .................... 523 114.2 127.8 130.9 133.5 134.8 163.5 163.2 4.8
Hardware stores ...................... 525 113.9 121.2 115.5 119.5 119.0 137.8 149.3 2.9Retail nurseries, lawn andgarden supply stores ............. 526 107.1 117.0 117.4 136.4 127.5 133.7 151.2 6.7
Department stores ................... 531 110.4 113.4 115.9 123.5 128.8 135.5 147.4 4.8Variety stores ........................... 533 191.5 197.4 211.3 238.4 257.7 268.7 319.5 8.4Miscellaneous generalmerchandise stores ............... 539 164.2 164.8 167.3 167.6 170.3 185.7 195.2 5.7
Grocery stores ......................... 541 96.0 95.4 93.9 92.1 91.7 92.2 95.4 -0.1Meat and fish (seafood)markets .................................. 542 97.7 95.7 94.4 86.4 90.8 95.7 99.3 0.0
Retail bakeries ........................ 546 86.5 85.3 83.0 75.9 67.6 68.1 83.8 -0.9New and used car dealers ...... 551 108.6 109.7 108.1 109.1 108.8 108.7 111.9 0.5Auto and home supply stores . 553 100.8 105.3 109.1 108.2 108.1 113.0 116.0 1.3Gasoline service stations ........ 554 115.9 121.1 127.2 126.1 126.1 133.9 140.6 3.5Men’s and boy’s wear stores ... 561 119.5 121.8 121.4 129.8 136.3 145.2 154.6 3.3Women’s clothing stores ......... 562 130.0 130.4 139.9 154.2 157.3 176.1 190.5 6.7Family clothing stores ............. 565 121.5 127.7 141.8 146.9 150.2 153.1 156.5 4.2Shoe stores ............................. 566 117.3 130.7 139.2 151.9 148.4 145.0 151.1 3.8Furniture and homefurnishingsstores ..................................... 571 113.3 114.7 117.4 123.6 124.2 127.2 134.1 2.8
Household appliance stores ... 572 118.0 121.5 138.4 140.7 153.5 181.4 183.9 6.5Radio, television, computer,and music stores ................... 573 154.5 179.1 199.3 208.1 218.4 260.3 314.6 11.2
Eating and drinking places ...... 581 103.8 102.1 102.0 100.6 101.6 102.0 104.3 0.0Drug and proprietary stores .... 591 109.5 109.9 111.1 113.9 119.7 125.6 129.8 2.2Liquor stores ............................ 592 101.8 100.1 104.7 113.8 109.9 116.5 114.6 0.9Used merchandise stores ....... 593 116.8 119.5 120.6 132.7 140.3 163.6 181.9 6.5Miscellaneous shoppinggoods stores .......................... 594 111.5 117.1 123.1 125.3 129.1 138.8 145.2 3.4
Nonstore retailers .................... 596 132.2 149.0 152.4 173.3 186.5 208.0 222.2 8.0Fuel dealers ............................. 598 91.8 99.0 111.4 112.4 109.0 105.8 115.1 3.5Retail stores, n.e.c .................. .. 599 118.1 125.8 127.0 140.2 147.8 157.3 161.0 3.9
Finance and Services
Commercial banks .................. 602 118.5 121.7 126.4 129.7 133.0 132.6 135.2 2.6Hotels and motels ................... 701 106.5 109.9 110.5 110.0 108.2 111.6 113.5 1.8Laundry, cleaning, andgarment services ................... 721 99.9 105.0 106.6 109.8 109.0 116.2 121.8 2.0
Photographic studios, portrait . 722 101.8 108.3 116.2 110.7 114.1 121.6 105.1 0.8Beauty shops ........................... 723 97.0 101.1 104.8 107.6 108.5 110.5 113.3 1.7Barber shops ........................... 724 121.9 118.8 115.7 128.8 150.4 157.4 138.0 3.6Funeral services andcrematories ............................ 726 98.7 104.3 100.2 97.6 101.9 104.2 99.7 1.0
Automotive repair shops ......... 753 105.7 114.3 121.6 116.1 117.2 124.9 127.6 1.9Motion picture theaters ............ 783 113.8 110.4 105.0 104.1 103.4 106.1 110.5 -0.7
Average annualpercentchange
1990-992
1 1987 Standard Industrial Classification.2 Average annual percent change based on compound rate
formula.3 Refers to output per employee.
4 Refers to ouput per full-time equivalent employee yearon fiscal basis.
n.e.c. = not elesewhere classified

159
Total Construc- Manu- Wholesale Retailprivate tion facturing trade trade
1947 ............................ $45.58 $59.89 $58.83 $49.13 – $50.06 $33.77 $43.21 –1948 ............................ 49.00 65.52 65.23 53.08 – 53.59 36.22 45.48 –1949 ............................ 50.24 62.33 67.56 53.80 – 55.45 38.42 47.63 –
1950 ............................ 53.13 67.16 69.68 58.28 – 55.31 39.71 47.50 –1951 ............................ 57.86 74.11 76.96 63.34 – 62.02 42.82 54.67 –1952 ............................ 60.65 77.59 82.86 66.75 – 65.53 43.38 57.08 –1953 ............................ 63.76 83.03 86.41 70.47 – 68.61 45.36 59.57 –1954 ............................ 64.52 82.60 88.54 70.49 – 71.28 47.04 62.04 –1955 ............................ 67.72 89.54 90.90 75.30 – 74.48 48.75 63.92 –1956 ............................ 70.74 95.06 96.38 78.78 – 78.17 50.18 65.68 –1957 ............................ 73.33 98.25 100.27 81.19 – 81.41 52.20 67.53 –1958 ............................ 75.08 96.08 103.78 82.32 – 84.02 54.10 70.12 –1959 ............................ 78.78 103.68 108.41 88.26 – 88.51 56.15 72.74 –
1960 ............................ 80.67 105.04 112.67 89.72 – 90.72 57.76 75.14 –1961 ............................ 82.60 106.92 118.08 92.34 – 93.56 58.66 77.12 –1962 ............................ 85.91 110.70 122.47 96.56 – 96.22 60.96 80.94 –1963 ............................ 88.46 114.40 127.19 99.23 – 99.47 62.66 84.38 –1964 ............................ 91.33 117.74 132.06 102.97 $118.78 102.56 64.75 85.79 $70.031965 ............................ 95.45 123.52 138.38 107.53 125.14 106.08 66.61 88.91 73.601966 ............................ 98.82 130.24 146.26 112.19 128.13 111.11 68.57 92.13 77.041967 ............................ 101.84 135.89 154.95 114.49 130.82 115.66 70.95 95.72 80.381968 ............................ 107.73 142.71 164.49 122.51 138.85 121.90 74.95 101.75 83.971969 ............................ 114.61 154.80 181.54 129.51 147.74 129.85 78.66 108.70 90.57
1970 ............................ 119.83 164.40 195.45 133.33 155.93 136.86 82.47 112.67 96.661971 ............................ 127.31 172.14 211.67 142.44 168.82 143.42 87.62 117.85 103.061972 ............................ 136.90 189.14 221.19 154.71 187.86 151.69 91.85 122.98 110.851973 ............................ 145.39 201.40 235.89 166.46 203.31 159.54 96.32 129.20 117.291974 ............................ 154.76 219.14 249.25 176.80 217.48 169.94 102.68 137.61 126.001975 ............................ 163.53 249.31 266.08 190.79 233.44 182.19 108.86 148.19 134.671976 ............................ 175.45 273.90 283.73 209.32 256.71 194.27 114.60 155.43 143.521977 ............................ 189.00 301.20 295.65 228.90 278.90 209.13 121.66 165.26 153.451978 ............................ 203.70 332.88 318.69 249.27 302.80 228.14 130.20 178.00 163.671979 ............................ 219.91 365.07 342.99 269.34 325.58 247.93 138.62 190.77 175.27
1980 ............................ 235.10 397.06 367.78 288.62 351.25 266.88 147.38 209.60 190.711981 ............................ 255.20 438.75 399.26 318.00 382.18 290.68 158.03 229.05 208.971982 ............................ 267.26 459.88 426.82 330.26 402.48 309.46 163.85 245.44 225.591983 ............................ 280.70 479.40 442.97 354.08 420.81 328.79 171.05 263.90 239.041984 ............................ 292.86 503.58 458.51 374.03 438.13 341.88 174.33 278.50 247.431985 ............................ 299.09 519.93 464.46 386.37 450.30 351.36 174.64 289.02 256.751986 ............................ 304.85 525.81 466.75 396.01 458.64 357.72 176.08 304.30 265.851987 ............................ 312.50 531.70 480.44 406.31 471.58 365.38 178.70 316.90 275.931988 ............................ 322.02 541.44 495.73 418.81 467.57 380.24 183.62 325.25 289.491989 ............................ 334.24 570.18 513.17 429.68 481.43 394.82 188.72 341.17 305.79
1990 ............................ 345.35 603.29 526.01 441.86 496.13 411.10 194.40 356.93 319.481991 ............................ 353.98 630.04 533.40 455.03 502.92 424.82 198.48 370.92 331.451992 ............................ 363.61 638.31 537.70 469.86 514.37 435.10 205.06 387.36 342.551993 ............................ 373.64 646.78 553.63 486.04 532.52 448.47 209.95 406.33 350.351994 ............................ 385.86 666.62 573.00 506.94 547.07 463.10 216.46 423.51 358.801995 ............................ 394.34 683.91 587.00 514.59 556.72 476.07 221.47 442.29 369.041996 ............................ 406.61 707.59 603.33 531.23 572.22 492.92 230.11 459.52 382.001997 ............................ 424.89 733.21 625.56 553.14 592.32 516.48 240.74 481.57 400.331998 ............................ 442.19 742.35 646.13 562.53 604.75 538.88 253.46 512.15 418.581999 ............................ 456.78 736.56 672.13 579.63 607.20 558.80 263.61 529.24 435.86
2000 ............................ 474.38 743.04 702.68 598.21 626.09 585.20 273.39 547.04 454.86
Dash indicates data not available.
NOTE: Current estimates are projected from March 2000 benchmark levels.
Finance,insur-ance,andreal
estate
Trans-porta-tionand
publicutilities
Year Mining Services
Table 30. Average weekly earnings of production workers on private nonfarm payrolls by majorindustry division, annual averages, 1947-2000
(In current dollars)

160
Characteristic 1983 1984 1985 19861 1987 1988 1989 19901 1991
Total, 16 years and over ............................. $313 $326 $343 $358 $373 $385 $399 $412 $42616 to 24 years ......................................... 210 217 223 231 242 249 259 269 277
16 to 19 years ...................................... 163 168 173 178 185 195 204 209 21320 to 24 years ...................................... 222 230 240 248 258 265 276 285 291
25 years and over ................................... 343 361 378 391 403 414 427 449 46725 to 54 years ...................................... 344 362 379 391 403 414 429 450 468
25 to 34 years .................................. 321 335 349 360 373 383 394 407 41535 to 44 years .................................. 369 389 405 418 435 449 472 486 49845 to 54 years .................................. 366 385 400 415 429 452 472 489 507
55 years and over ................................ 337 356 374 389 398 411 420 440 45755 to 64 years .................................. 346 365 380 396 405 419 431 457 46965 years and over ............................ 260 271 296 298 310 323 334 343 381
Men .......................................................... 378 391 406 419 433 449 468 481 493Women .................................................... 252 265 277 290 303 315 328 346 366
White, both sexes ....................................... 319 336 355 370 383 394 409 424 442Men .......................................................... 387 400 417 433 450 465 482 494 506Women .................................................... 254 268 281 294 307 318 334 353 373
Black, both sexes ....................................... 261 269 277 291 301 314 319 329 348 Men .......................................................... 293 302 304 318 326 347 348 361 375
Women .................................................... 231 241 252 263 275 288 301 308 323Hispanic origin, both sexes ....................... (2) (2) (2) 277 284 290 298 304 312 Men .......................................................... (2) (2) (2) 299 306 307 315 318 323 Women ..................................................... (2) (2) (2) 241 251 260 269 278 292
1992 1993 19941 1995 1996 19971 19981 19991 20001
Total, 16 years and over ............................. $440 $459 $467 $479 $490 $503 $523 $549 $57616 to 24 years ......................................... 276 282 286 292 298 306 319 341 361
16 to 19 years ...................................... 212 214 221 231 240 252 268 281 29420 to 24 years ...................................... 290 297 300 306 312 321 339 363 383
25 years and over ................................... 479 491 500 510 520 540 572 592 61125 to 54 years ...................................... 479 492 501 511 521 541 571 592 612
25 to 34 years .................................. 422 436 439 451 463 481 502 518 55035 to 44 years .................................. 503 517 537 550 559 579 597 611 63145 to 54 years .................................. 522 542 566 582 594 607 620 652 671
55 years and over ................................ 472 483 490 502 518 534 579 589 60355 to 64 years .................................. 483 492 501 514 535 558 592 604 61765 years and over ............................ 378 393 384 389 384 393 405 404 442
Men .......................................................... 501 510 522 538 557 579 598 618 646Women .................................................... 380 393 399 406 418 431 456 473 491
White, both sexes ....................................... 458 475 484 494 506 519 545 573 591Men .......................................................... 514 524 547 566 580 595 615 638 669Women .................................................... 387 401 408 415 428 444 468 483 500
Black, both sexes ....................................... 357 369 371 383 387 400 426 445 468Men .......................................................... 380 392 400 411 412 432 468 488 503
Women ..................................................... 335 348 346 355 362 375 400 409 429Hispanic origin, both sexes ....................... 322 331 324 329 339 351 370 385 396
Men .......................................................... 339 346 343 350 356 371 390 406 414Women .................................................... 302 313 305 305 316 318 337 348 364
1 The comparability of historical labor force data has beenaffected at various times by methodological and conceptualchanges. For an explanation, see the Explanatory Notes andEstimates of Error section of Employment and Earnings,
Table 31. Median weekly earnings of full-time wage and salary workers by age, sex, race, andHispanic origin, annual averages, 1983-2000
(In current dollars)
a monthly periodical published by the Bureau of LaborStatistics.
2 Data not available.
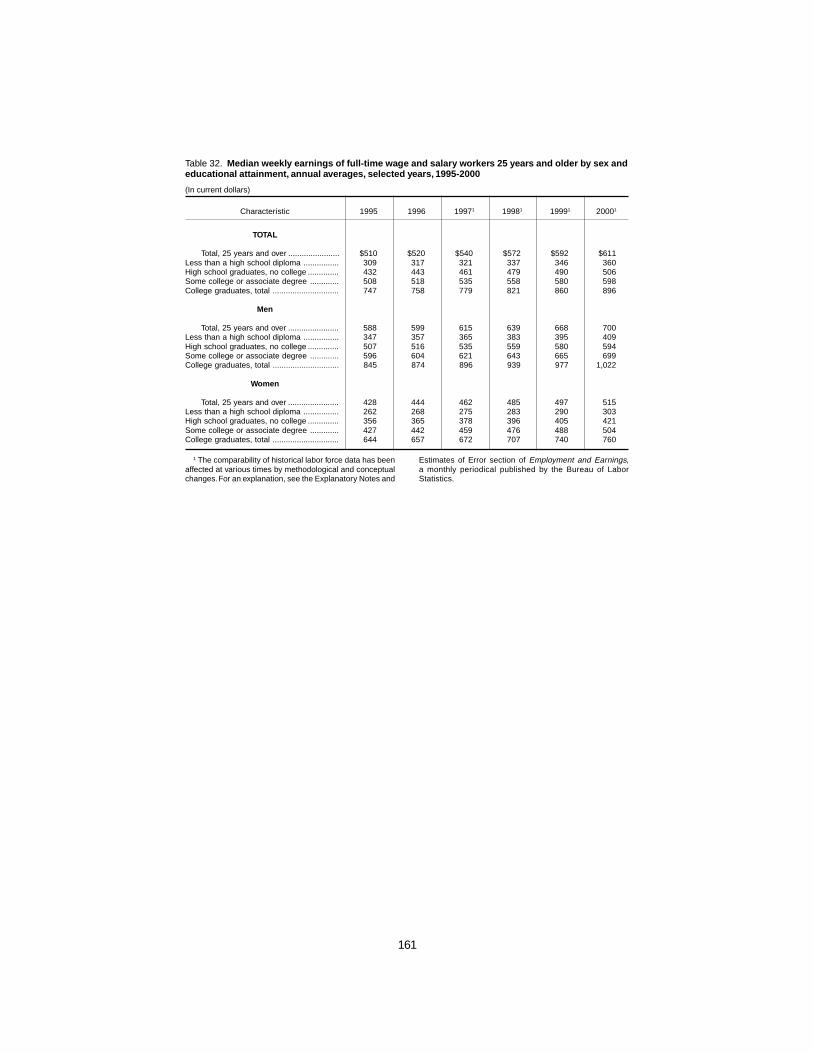
161
Characteristic 1995 1996 19971 19981 19991 20001
TOTAL
Total, 25 years and over ....................... $510 $520 $540 $572 $592 $611Less than a high school diploma ................ 309 317 321 337 346 360High school graduates, no college .............. 432 443 461 479 490 506Some college or associate degree ............. 508 518 535 558 580 598College graduates, total .............................. 747 758 779 821 860 896
Men
Total, 25 years and over ....................... 588 599 615 639 668 700Less than a high school diploma ................ 347 357 365 383 395 409High school graduates, no college .............. 507 516 535 559 580 594Some college or associate degree ............. 596 604 621 643 665 699College graduates, total .............................. 845 874 896 939 977 1,022
Women
Total, 25 years and over ....................... 428 444 462 485 497 515Less than a high school diploma ................ 262 268 275 283 290 303High school graduates, no college .............. 356 365 378 396 405 421Some college or associate degree ............. 427 442 459 476 488 504College graduates, total .............................. 644 657 672 707 740 760
Table 32. Median weekly earnings of full-time wage and salary workers 25 years and older by sex andeducational attainment, annual averages, selected years, 1995-2000
(In current dollars)
1 The comparability of historical labor force data has beenaffected at various times by methodological and conceptualchanges. For an explanation, see the Explanatory Notes and
Estimates of Error section of Employment and Earnings,a monthly periodical published by the Bureau of LaborStatistics.

162
Table 33. Producer price indexes for major commodity groups, 1947-2000
(1982=100)
Farmprod- Hides, Fuels Chemi-ucts, Pro- Indus- Textile skins, and cals Rubberpro- Farm cessed trial products leather, related and and
cessed products foods and commo- and and prod- allied plasticfoods feeds dities apparel prod- ucts and prod- productsand ucts power1 ucts1
feeds
1947 ............................ 37.9 45.1 33.0 22.7 50.6 31.7 11.1 32.1 29.21948 ............................ 40.8 48.5 35.3 24.6 52.8 32.1 13.1 32.8 30.21949 ............................ 36.0 41.9 32.1 24.1 48.3 30.4 12.4 30.0 29.2
1950 ............................ 37.7 44.0 33.2 25.0 50.2 32.9 12.6 30.4 35.61951 ............................ 43.0 51.2 36.9 27.6 56.0 37.7 13.0 34.8 43.71952 ............................ 41.3 48.4 36.4 26.9 50.5 30.5 13.0 33.0 39.61953 ............................ 38.6 43.8 34.8 27.2 49.3 31.0 13.4 33.4 36.91954 ............................ 38.5 43.2 35.4 27.2 48.2 29.5 13.2 33.8 37.51955 ............................ 36.6 40.5 33.8 27.8 48.2 29.4 13.2 33.7 42.41956 ............................ 36.4 40.0 33.8 29.1 48.2 31.2 13.6 33.9 43.01957 ............................ 37.7 41.1 34.8 29.9 48.3 31.2 14.3 34.6 42.81958 ............................ 39.4 42.9 36.5 30.0 47.4 31.6 13.7 34.9 42.81959 ............................ 37.6 40.2 35.6 30.5 48.1 35.9 13.7 34.8 42.6
1960 ............................ 37.7 40.1 35.6 30.5 48.6 34.6 13.9 34.8 42.71961 ............................ 37.7 39.7 36.2 30.4 47.8 34.9 14.0 34.5 41.11962 ............................ 38.1 40.4 36.5 30.4 48.2 35.3 14.0 33.9 39.91963 ............................ 37.7 39.6 36.8 30.3 48.2 34.3 13.9 33.5 40.11964 ............................ 37.5 39.0 36.7 30.5 48.5 34.4 13.5 33.6 39.61965 ............................ 39.0 40.7 38.0 30.9 48.8 35.9 13.8 33.9 39.71966 ............................ 41.6 43.7 40.2 31.5 48.9 39.4 14.1 34.0 40.51967 ............................ 40.2 41.3 39.8 32.0 48.9 38.1 14.4 34.2 41.41968 ............................ 41.1 42.3 40.6 32.8 50.7 39.3 14.3 34.1 42.81969 ............................ 43.4 45.0 42.7 33.9 51.8 41.5 14.6 34.2 43.6
1970 ............................ 44.9 45.8 44.6 35.2 52.4 42.0 15.3 35.0 44.91971 ............................ 45.8 46.6 45.5 36.5 53.3 43.4 16.6 35.6 45.21972 ............................ 49.2 51.6 48.0 37.8 55.5 50.0 17.1 35.6 45.31973 ............................ 63.9 72.7 58.9 40.3 60.5 54.5 19.4 37.6 46.61974 ............................ 71.3 77.4 68.0 49.2 68.0 55.2 30.1 50.2 56.41975 ............................ 74.0 77.0 72.6 54.9 67.4 56.5 35.4 62.0 62.21976 ............................ 73.6 78.8 70.8 58.4 72.4 63.9 38.3 64.0 66.01977 ............................ 75.9 79.4 74.0 62.5 75.3 68.3 43.6 65.9 69.41978 ............................ 83.0 87.7 80.6 67.0 78.1 76.1 46.5 68.0 72.41979 ............................ 92.3 99.6 88.5 75.7 82.5 96.1 58.9 76.0 80.5
1980 ............................ 98.3 102.9 95.9 88.0 89.7 94.7 82.8 89.0 90.11981 ............................ 101.1 105.2 98.9 97.4 97.6 99.3 100.2 98.4 96.41982 ............................ 100.0 100.0 100.0 100.0 100.0 100.0 100.0 100.0 100.01983 ............................ 102.0 102.4 101.8 101.1 100.3 103.2 95.9 100.3 100.81984 ............................ 105.5 105.5 105.4 103.3 102.7 109.0 94.8 102.9 102.31985 ............................ 100.7 95.1 103.5 103.7 102.9 108.9 91.4 103.7 101.91986 ............................ 101.2 92.9 105.4 100.0 103.2 113.0 69.8 102.6 101.91987 ............................ 103.7 95.5 107.9 102.6 105.1 120.4 70.2 106.4 103.01988 ............................ 110.0 104.9 112.7 106.3 109.2 131.4 66.7 116.3 109.31989 ............................ 115.4 110.9 117.8 111.6 112.3 136.3 72.9 123.0 112.6
1990 ............................ 118.6 112.2 121.9 115.8 115.0 141.7 82.3 123.6 113.61991 ............................ 116.4 105.7 121.9 116.5 116.3 138.9 81.2 125.6 115.11992 ............................ 115.9 103.6 122.1 117.4 117.8 140.4 80.4 125.9 115.11993 ............................ 118.4 107.1 124.0 119.0 118.0 143.7 80.0 128.2 116.01994 ............................ 119.1 106.3 125.5 120.7 118.3 148.5 77.8 132.1 117.61995 ............................ 120.5 107.4 127.0 125.5 120.8 153.7 78.0 142.5 124.31996 ............................ 129.7 122.4 133.3 127.3 122.4 150.5 85.8 142.1 123.81997 ............................ 127.0 112.9 134.0 127.7 122.6 154.2 86.1 143.6 123.21998 ............................ 122.7 104.6 131.6 124.8 122.9 148.0 75.3 143.9 122.61999 ............................ 120.3 98.4 131.1 126.5 121.1 146.0 80.5 144.2 122.5
2000 ............................ 122.0 99.5 133.1 134.8 121.4 151.5 103.5 151.0 125.5
See footnote at end of table.
Year

163
Table 33. Producer price indexes for major commodity groups, 1947-2000—Continued
(1982=100)
Lumber Pulp, Metals Machi- Non- Trans- Miscella-and paper, and nery and metallic portation neous
wood and allied metal equip- mineral and prod-products products products ment products equipment ucts
1947 ............................ 25.8 25.1 18.2 19.3 37.2 20.7 – 25.5 26.61948 ............................ 29.5 26.2 20.7 20.9 39.4 22.4 – 28.2 27.71949 ............................ 27.3 25.1 20.9 21.9 40.1 23.0 – 30.1 28.2
1950 ............................ 31.4 25.7 22.0 22.6 40.9 23.5 – 30.0 28.61951 ............................ 34.1 30.5 24.5 25.3 44.4 25.0 – 31.6 30.31952 ............................ 33.2 29.7 24.5 25.3 43.5 25.0 – 33.4 30.21953 ............................ 33.1 29.6 25.3 25.9 44.4 26.0 – 33.3 31.01954 ............................ 32.5 29.6 25.5 26.3 44.9 26.6 – 33.4 31.31955 ............................ 34.1 30.4 27.2 27.2 45.1 27.3 – 34.3 31.31956 ............................ 34.6 32.4 29.6 29.3 46.3 28.5 – 36.3 31.71957 ............................ 32.8 33.0 30.2 31.4 47.5 29.6 – 37.9 32.61958 ............................ 32.5 33.4 30.0 32.1 47.9 29.9 – 39.0 33.31959 ............................ 34.7 33.7 30.6 32.8 48.0 30.3 – 39.9 33.4
1960 ............................ 33.5 34.0 30.6 33.0 47.8 30.4 – 39.3 33.61961 ............................ 32.0 33.0 30.5 33.0 47.5 30.5 – 39.2 33.71962 ............................ 32.2 33.4 30.2 33.0 47.2 30.5 – 39.2 33.91963 ............................ 32.8 33.1 30.3 33.1 46.9 30.3 – 38.9 34.21964 ............................ 33.5 33.0 31.1 33.3 47.1 30.4 – 39.1 34.41965 ............................ 33.7 33.3 32.0 33.7 46.8 30.4 – 39.2 34.71966 ............................ 35.2 34.2 32.8 34.7 47.4 30.7 – 39.2 35.31967 ............................ 35.1 34.6 33.2 35.9 48.3 31.2 – 39.8 36.21968 ............................ 39.8 35.0 34.0 37.0 49.7 32.4 – 40.9 37.01969 ............................ 44.0 36.0 36.0 38.2 50.7 33.6 40.4 41.7 38.1
1970 ............................ 39.9 37.5 38.7 40.0 51.9 35.3 41.9 43.3 39.81971 ............................ 44.7 38.1 39.4 41.4 53.1 38.2 44.2 45.7 40.81972 ............................ 50.7 39.3 40.9 42.3 53.8 39.4 45.5 47.0 41.51973 ............................ 62.2 42.3 44.0 43.7 55.7 40.7 46.1 47.4 43.31974 ............................ 64.5 52.5 57.0 50.0 61.8 47.8 50.3 51.4 48.11975 ............................ 62.1 59.0 61.5 57.9 67.5 54.4 56.7 57.6 53.41976 ............................ 72.2 62.1 65.0 61.3 70.3 58.2 60.5 61.2 55.61977 ............................ 83.0 64.6 69.3 65.2 73.2 62.6 64.6 65.2 59.41978 ............................ 96.9 67.7 75.3 70.3 77.5 69.6 69.5 70.0 66.71979 ............................ 105.5 75.9 86.0 76.7 82.8 77.6 75.3 75.8 75.5
1980 ............................ 101.5 86.3 95.0 86.0 90.7 88.4 82.9 83.1 93.61981 ............................ 102.8 94.8 99.6 94.4 95.9 96.7 94.3 94.6 96.11982 ............................ 100.0 100.0 100.0 100.0 100.0 100.0 100.0 100.0 100.01983 ............................ 107.9 103.3 101.8 102.7 103.4 101.6 102.8 102.2 104.81984 ............................ 108.0 110.3 104.8 105.1 105.7 105.4 105.2 104.1 107.01985 ............................ 106.6 113.3 104.4 107.2 107.1 108.6 107.9 106.4 109.41986 ............................ 107.2 116.1 103.2 108.8 108.2 110.0 110.5 109.1 111.61987 ............................ 112.8 121.8 107.1 110.4 109.9 110.0 112.5 111.7 114.91988 ............................ 118.9 130.4 118.7 113.2 113.1 111.2 114.3 113.1 120.21989 ............................ 126.7 137.8 124.1 117.4 116.9 112.6 117.7 116.2 126.5
1990 ............................ 129.7 141.2 122.9 120.7 119.2 114.7 121.5 118.2 134.21991 ............................ 132.1 142.9 120.2 123.0 121.2 117.2 126.4 122.1 140.81992 ............................ 146.6 145.2 119.2 123.4 122.2 117.3 130.4 124.9 145.31993 ............................ 174.0 147.3 119.2 124.0 123.7 120.0 133.7 128.0 145.41994 ............................ 180.0 152.5 124.8 125.1 126.1 124.2 137.2 131.4 141.91995 ............................ 178.1 172.2 134.5 126.6 128.2 129.0 139.7 133.0 145.41996 ............................ 176.1 168.7 131.0 126.5 130.4 131.0 141.7 134.1 147.71997 ............................ 183.8 167.9 131.8 125.9 130.8 133.2 141.6 132.7 150.91998 ............................ 179.1 171.7 127.8 124.9 131.3 135.4 141.2 131.4 156.01999 ............................ 183.6 174.1 124.6 124.3 131.7 138.9 141.8 131.7 166.6
2000 ............................ 178.2 183.7 128.1 124.0 132.6 142.5 143.8 132.3 170.8
1 Prices for some items in this grouping are lagged and refer to 1 month earlier than the index month.
Year
Motorvehicles
andequip-ment
Furnitureand
house-hold
durables

164
Finish- Con-ed sumer Inter-
Total goods goods Total medi- Inter- Inter- Crudefinish- exclud- exclud- Inter- ate medi- medi- Total foods Crude Crude
ed ing ing medi- foods ate ate crude and energy othergoods foods foods ate and energy other feeds
and and feeds1
energy energy
1947 ........ 26.4 31.9 – – 19.8 – 23.3 – – – 31.7 45.1 – –1948 ........ 28.5 34.9 – – 21.6 – 25.2 – – – 34.7 48.8 – –1949 ........ 27.7 32.1 – – 22.7 – 24.2 – – – 30.1 40.5 – –
1950 ........ 28.2 32.7 – – 23.2 – 25.3 – – – 32.7 43.4 – –1951 ........ 30.8 36.7 – – 25.5 – 28.4 – – – 37.6 50.2 – –1952 ........ 30.6 36.4 – – 25.9 – 27.5 – – – 34.5 47.3 – –1953 ........ 30.3 34.5 – – 26.3 – 27.7 – – – 31.9 42.3 – –1954 ........ 30.4 34.2 – – 26.7 – 27.9 – – – 31.6 42.3 – –1955 ........ 30.5 33.4 – – 27.4 – 28.4 – – – 30.4 38.4 – –1956 ........ 31.3 33.3 – – 29.5 – 29.6 – – – 30.6 37.6 – –1957 ........ 32.5 34.4 – – 31.3 – 30.3 – – – 31.2 39.2 – –1958 ........ 33.2 36.5 – – 32.1 – 30.4 – – – 31.9 41.6 – –1959 ........ 33.1 34.8 – – 32.7 – 30.8 – – – 31.1 38.8 – –
1960 ........ 33.4 35.5 – – 32.8 – 30.8 – – – 30.4 38.4 – –1961 ........ 33.4 35.4 – – 32.9 – 30.6 – – – 30.2 37.9 – –1962 ........ 33.5 35.7 – – 33.0 – 30.6 – – – 30.5 38.6 – –1963 ........ 33.4 35.3 – – 33.1 – 30.7 – – – 29.9 37.5 – –1964 ........ 33.5 35.4 – – 33.4 – 30.8 – – – 29.6 36.6 – –1965 ........ 34.1 36.8 – – 33.8 – 31.2 – – – 31.1 39.2 – –1966 ........ 35.2 39.2 – – 34.6 – 32.0 – – – 33.1 42.7 – –1967 ........ 35.6 38.5 – – 35.8 – 32.2 41.8 – – 31.3 40.3 – –1968 ........ 36.6 40.0 – – 37.0 – 33.0 41.5 – – 31.8 40.9 – –1969 ........ 38.0 42.4 – – 38.3 – 34.1 42.9 – – 33.9 44.1 – –
1970 ........ 39.3 43.8 – – 40.1 – 35.4 45.6 – – 35.2 45.2 – –1971 ........ 40.5 44.5 – – 41.7 – 36.8 46.7 – – 36.0 46.1 – –1972 ........ 41.8 46.9 – – 42.8 – 38.2 49.5 – – 39.9 51.5 – –1973 ........ 45.6 56.5 – 48.1 44.2 50.4 42.4 70.3 – 44.3 54.5 72.6 – 70.81974 ........ 52.6 64.4 26.2 53.6 50.5 55.5 52.5 83.6 33.1 54.0 61.4 76.4 27.8 83.31975 ........ 58.2 69.8 30.7 59.7 58.2 60.6 58.0 81.6 38.7 60.2 61.6 77.4 33.3 69.31976 ........ 60.8 69.6 34.3 63.1 62.1 63.7 60.9 77.4 41.5 63.8 63.4 76.8 35.3 80.21977 ........ 64.7 73.3 39.7 66.9 66.1 67.3 64.9 79.6 46.8 67.6 65.5 77.5 40.4 79.81978 ........ 69.8 79.9 42.3 71.9 71.3 72.2 69.5 84.8 49.1 72.5 73.4 87.3 45.2 87.81979 ........ 77.6 87.3 57.1 78.3 77.5 78.8 78.4 94.5 61.1 80.7 85.9 100.0 54.9 106.2
1980 ........ 88.0 92.4 85.2 87.1 85.8 87.8 90.3 105.5 84.9 90.3 95.3 104.6 73.1 113.11981 ........ 96.1 97.8 101.5 94.6 94.6 94.6 98.6 104.6 100.5 97.7 103.0 103.9 97.7 111.71982 ........ 100.0 100.0 100.0 100.0 100.0 100.0 100.0 100.0 100.0 100.0 100.0 100.0 100.0 100.01983 ........ 101.6 101.0 95.2 103.0 102.8 103.1 100.6 103.6 95.3 101.6 101.3 101.8 98.7 105.31984 ........ 103.7 105.4 91.2 105.5 105.2 105.7 103.1 105.7 95.5 104.7 103.5 104.7 98.0 111.71985 ........ 104.7 104.6 87.6 108.1 107.5 108.4 102.7 97.3 92.6 105.2 95.8 94.8 93.3 104.91986 ........ 103.2 107.3 63.0 110.6 109.7 111.1 99.1 96.2 72.6 104.9 87.7 93.2 71.8 103.11987 ........ 105.4 109.5 61.8 113.3 111.7 114.2 101.5 99.2 73.0 107.8 93.7 96.2 75.0 115.71988 ........ 108.0 112.6 59.8 117.0 114.3 118.5 107.1 109.5 70.9 115.2 96.0 106.1 67.7 133.01989 ........ 113.6 118.7 65.7 122.1 118.8 124.0 112.0 113.8 76.1 120.2 103.1 111.2 75.9 137.9
1990 ........ 119.2 124.4 75.0 126.6 122.9 128.8 114.5 113.3 85.5 120.9 108.9 113.1 85.9 136.31991 ........ 121.7 124.1 78.1 131.1 126.7 133.7 114.4 111.1 85.1 121.4 101.2 105.5 80.4 128.21992 ........ 123.2 123.3 77.8 134.2 129.1 137.3 114.7 110.7 84.3 122.0 100.4 105.1 78.8 128.41993 ........ 124.7 125.7 78.0 135.8 131.4 138.5 116.2 112.7 84.6 123.8 102.4 108.4 76.7 140.21994 ........ 125.5 126.8 77.0 137.1 134.1 139.0 118.5 114.8 83.0 127.1 101.8 106.5 72.1 156.21995 ........ 127.9 129.0 78.1 140.0 136.7 141.9 124.9 114.8 84.1 135.2 102.7 105.8 69.4 173.61996 ........ 131.3 133.6 83.2 142.0 138.3 144.3 125.7 128.1 89.8 134.0 113.8 121.5 85.0 155.81997 ........ 131.8 134.5 83.4 142.4 138.2 145.1 125.6 125.4 89.0 134.2 111.1 112.2 87.3 156.51998 ........ 130.7 134.3 75.1 143.7 137.6 147.7 123.0 116.2 80.8 133.5 96.8 103.9 68.6 142.11999 ........ 133.0 135.1 78.8 146.1 137.6 151.7 123.2 111.1 84.3 133.1 98.2 98.7 78.5 135.2
2000 ........ 138.0 137.2 94.1 148.0 138.8 154.0 129.2 111.7 101.7 136.6 120.6 100.2 122.1 145.2
1 Intermediate materials for food manufacturing and feeds.
Dash indicates data not available.
Finish-ed
foods
Finish-ed
energy
Capitalequip-ment
Year
Table 34. Producer price indexes by stage of processing, special groups, 1947-2000
(1982=100)
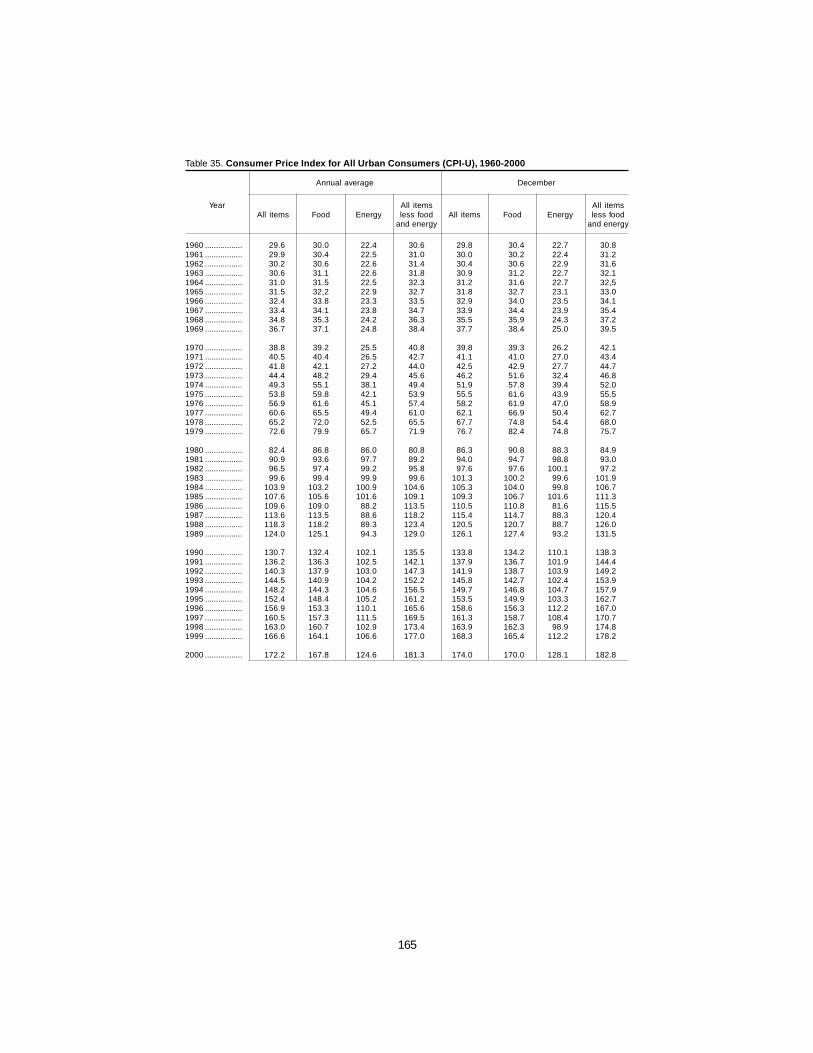
165
Table 35. Consumer Price Index for All Urban Consumers (CPI-U), 1960-2000
Annual average December
Year All items All itemsAll items Food Energy less food All items Food Energy less food
and energy and energy
1960 ................. 29.6 30.0 22.4 30.6 29.8 30.4 22.7 30.81961 ................. 29.9 30.4 22.5 31.0 30.0 30.2 22.4 31.21962 ................. 30.2 30.6 22.6 31.4 30.4 30.6 22.9 31.61963 ................. 30.6 31.1 22.6 31.8 30.9 31.2 22.7 32.11964 ................. 31.0 31.5 22.5 32.3 31.2 31.6 22.7 32,51965 ................. 31.5 32,2 22.9 32.7 31.8 32.7 23.1 33.01966 ................. 32.4 33.8 23.3 33.5 32.9 34.0 23.5 34.11967 ................. 33.4 34.1 23.8 34.7 33.9 34.4 23.9 35.41968 ................. 34.8 35.3 24.2 36.3 35.5 35.9 24.3 37.21969 ................. 36.7 37.1 24.8 38.4 37.7 38.4 25.0 39.5
1970 ................. 38.8 39.2 25.5 40.8 39.8 39.3 26.2 42.11971 ................. 40.5 40.4 26.5 42.7 41.1 41.0 27.0 43.41972 ................. 41.8 42.1 27.2 44.0 42.5 42.9 27.7 44.71973 ................. 44.4 48.2 29.4 45.6 46.2 51.6 32.4 46.81974 ................. 49.3 55.1 38.1 49.4 51.9 57.8 39.4 52.01975 ................. 53.8 59.8 42.1 53.9 55.5 61.6 43.9 55.51976 ................. 56.9 61.6 45.1 57.4 58.2 61.9 47.0 58.91977 ................. 60.6 65.5 49.4 61.0 62.1 66.9 50.4 62.71978 ................. 65.2 72.0 52.5 65.5 67.7 74.8 54.4 68.01979 ................. 72.6 79.9 65.7 71.9 76.7 82.4 74.8 75.7
1980 ................. 82.4 86.8 86.0 80.8 86.3 90.8 88.3 84.91981 ................. 90.9 93.6 97.7 89.2 94.0 94.7 98.8 93.01982 ................. 96.5 97.4 99.2 95.8 97.6 97.6 100.1 97.21983 ................. 99.6 99.4 99.9 99.6 101.3 100.2 99.6 101.91984 ................. 103.9 103.2 100.9 104.6 105.3 104.0 99.8 106.71985 ................. 107.6 105.6 101.6 109.1 109.3 106.7 101.6 111.31986 ................. 109.6 109.0 88.2 113.5 110.5 110.8 81.6 115.51987 ................. 113.6 113.5 88.6 118.2 115.4 114.7 88.3 120.41988 ................. 118.3 118.2 89.3 123.4 120.5 120.7 88.7 126.01989 ................. 124.0 125.1 94.3 129.0 126.1 127.4 93.2 131.5
1990 ................. 130.7 132.4 102.1 135.5 133.8 134.2 110.1 138.31991 ................. 136.2 136.3 102.5 142.1 137.9 136.7 101.9 144.41992 ................. 140.3 137.9 103.0 147.3 141.9 138.7 103.9 149.21993 ................. 144.5 140.9 104.2 152.2 145.8 142.7 102.4 153.91994 ................. 148.2 144.3 104.6 156.5 149.7 146.8 104.7 157.91995 ................. 152.4 148.4 105.2 161.2 153.5 149.9 103.3 162.71996 ................. 156.9 153.3 110.1 165.6 158.6 156.3 112.2 167.01997 ................. 160.5 157.3 111.5 169.5 161.3 158.7 108.4 170.71998 ................. 163.0 160.7 102.9 173.4 163.9 162.3 98.9 174.81999 ................. 166.6 164.1 106.6 177.0 168.3 165.4 112.2 178.2
2000 ................. 172.2 167.8 124.6 181.3 174.0 170.0 128.1 182.8

166
Table 35. Consumer Price Index for All Urban Consumers (CPI-U), 1960-2000—Continued
Year All items All itemsAll items Food Energy less food All items Food Energy less food
and energy and energy
1960 ................. 1.7 1.0 2.3 1.3 1.4 3.1 1.3 1.01961 ................. 1.0 1.3 .4 1.3 .7 -.7 -1.3 1.31962 ................. 1.0 .7 .4 1.3 1.3 1.3 2.2 1.31963 ................. 1.3 1.6 .0 1.3 1.6 2.0 -.9 1.61964 ................. 1.3 1.3 -.4 1.6 1.0 1.3 0 1.21965 ................. 1.6 2.2 1.8 1.2 1.9 3.5 1.8 1.51966 ................. 2.9 5.0 1.7 2.4 3.5 4.0 1.7 3.31967 ................. 3.1 .9 2.1 3.6 3.0 1.2 1.7 3.81968 ................. 4.2 3.5 1.7 4.6 4.7 4.4 1.7 5.11969 ................. 5.5 5.1 2.5 5.8 6.2 7.0 2.9 6.2
1970 ................. 5.7 5.7 2.8 6.3 5.6 2.3 4.8 6.61971 ................. 4.4 3.1 3.9 4.7 3.3 4.3 3.1 3.11972 ................. 3.2 4.2 2.6 3.0 3.4 4.6 2.6 3.01973 ................. 6.2 14.5 8.1 3.6 8.7 20.3 17.0 4.71974 ................. 11.0 14.3 29.6 8.3 12.3 12.0 21.6 11.11975 ................. 9.1 8.5 10.5 9.1 6.9 6.6 11.4 6.71976 ................. 5.8 3.0 7.1 6.5 4.9 .5 7.1 6.11977 ................. 6.5 6.3 9.5 6.3 6.7 8.1 7.2 6.51978 ................. 7.6 9.9 6.3 7.4 9.0 11.8 7.9 8.51979 ................. 11.3 11.0 25.1 9.8 13.3 10.2 37.5 11.3
1980 ................. 13.5 8.6 30.9 12.4 12.5 10.2 18.0 12.21981 ................. 10.3 7.8 13.6 10.4 8.9 4.3 11.9 9.51982 ................. 6.2 4.1 1.5 7.4 3.8 3.1 1.3 4.51983 ................. 3.2 2.1 .7 4.0 3.8 2.7 -.5 4.81984 ................. 4.3 3.8 1.0 5.0 3.9 3.8 .2 4.71985 ................. 3.6 2.3 .7 4.3 3.8 2.6 1.8 4.31986 ................. 1.9 3.2 -13.2 4.0 1.1 3.8 -19.7 3.81987 ................. 3.6 4.1 .5 4.1 4.4 3.5 8.2 4.21988 ................. 4.1 4.1 .8 4.4 4.4 5.2 .5 4.71989 ................. 4.8 5.8 5.6 4.5 4.6 5.6 5.1 4.4
1990 ................. 5.4 5.8 8.3 5.0 6.1 5.3 18.1 5.21991 ................. 4.2 2.9 .4 4.9 3.1 1.9 -7.4 4.41992 ................. 3.0 1.2 .5 3.7 2.9 1.5 2.0 3.31993 ................. 3.0 2.2 1.2 3.3 2.7 2.9 -1.4 3.21994 ................. 2.6 2.4 .4 2.8 2.7 2.9 2.2 2.61995 ................. 2.8 2.8 .6 3.0 2.5 2.1 -1.3 3.01996 ................. 3.0 3.3 4.7 2.7 3.3 4.3 8.6 2.61997 ................. 2.3 2.6 1.3 2.4 1.7 1.5 -3.4 2.21998 ................. 1.6 2.2 -7.7 2.3 1.6 2.3 -8.8 2.41999 ................. 2.2 2.1 3.6 2.1 2.7 1.9 13.4 1.9
2000 ................. 3.4 2.3 16.9 2.4 3.4 2.8 14.2 2.6
Annual average percent changefrom previous year
Percent change to Decemberfrom prior December

167
Table 36. Average annual expenditures and percent distribution of all consumer units, selectedperiods, 1935-36 to 1998-99
Averages Percent of current consumption
1935-36 1960-61 1972-73 1998-99 1935-36 1960-61 1972-73 1998-99
Characteristics
Number of consumer units (in thousands) .. 39,458 55,306 71,220 107,824Income before taxes .................................... $1,502 $6,253 $11,726 $42,770Income after taxes ....................................... - 5,564 10,174 39,489Average consumer unit size ........................ 3.2 3.2 2.9 2.5Percent homeowner .................................... - 61 58 65
Expenditures
Current Consumption .................................. $1,273 $5,056 $7,920 $30,778 100.0 100.0 100.0 100.0 Food ........................................................... 428 1,236 1,679 4,861 33.6 24.4 21.2 15.8 Food at home .......................................... - 990 1,303 2,848 - 19.6 16.5 9.3 Food away from home ............................. - 246 376 2,013 - 4.9 4.7 6.5 Alcoholic beverages .................................. - 78 82 313 - 1.5 1.0 1.0 Shelter ....................................................... 241 664 1,395 6,796 18.9 13.1 17.6 22.1 Household operations and utilities ........... 134 538 715 2,822 10.5 10.6 9.0 9.2 Housefurnishings ...................................... 36 266 378 1,435 2.8 5.3 4.8 4.7 Apparel and services ................................ 133 519 647 1,649 10.4 10.3 8.2 5.4 Vehicle purchases 1 ................................... 96 299 714 3,136 7.5 5.9 9.0 10.2 Vehicle operations ..................................... - 393 935 3,246 - 7.8 11.8 10.5 Public transportation ................................. 22 77 96 368 1.7 1.5 1.2 1.2 Health care ................................................ 56 340 429 1,919 4.4 6.7 5.4 6.2 Insurance ................................................. - 90 152 918 - 1.8 1.9 3.0 Services .................................................. - 168 216 538 - 3.3 2.7 1.7 Drugs ....................................................... - 69 47 358 - 1.4 .6 1.2 Supplies ................................................... - 13 14 105 - .3 .2 .3 Entertainment ............................................ 42 200 373 1,710 3.3 4.0 4.7 5.6 Personal care ............................................ 26 145 101 405 2.0 2.9 1.3 1.3 Tobacco ..................................................... 24 91 128 287 1.9 1.8 1.6 .9 Education .................................................. 13 54 109 485 1.0 1.1 1.4 1.6 Reading ..................................................... 14 45 48 160 1.1 .9 .6 .5 Other items ................................................ 8 111 91 1,187 .6 2.2 1.1 3.9
1 Vehicle purchases also includes vehicle operations for 1935-36 data.
Dash indicates data not available.
Item
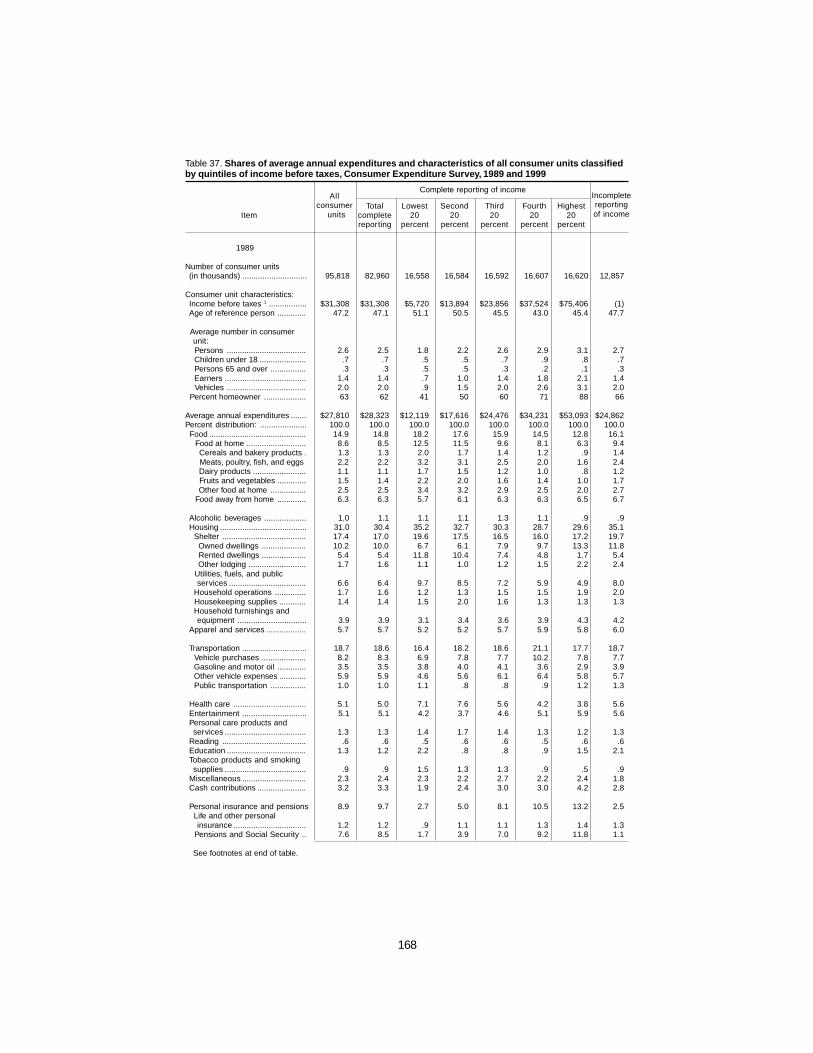
168
Total Lowest Second Third Fourth HighestItem complete 20 20 20 20 20
reporting percent percent percent percent percent
1989
Number of consumer units(in thousands) ............................. 95,818 82,960 16,558 16,584 16,592 16,607 16,620 12,857
Consumer unit characteristics:Income before taxes 1 ................. $31,308 $31,308 $5,720 $13,894 $23,856 $37,524 $75,406 (1)Age of reference person ............. 47.2 47.1 51.1 50.5 45.5 43.0 45.4 47.7
Average number in consumerunit:
Persons .................................... 2.6 2.5 1.8 2.2 2.6 2.9 3.1 2.7 Children under 18 ..................... .7 .7 .5 .5 .7 .9 .8 .7 Persons 65 and over ................ .3 .3 .5 .5 .3 .2 .1 .3 Earners ..................................... 1.4 1.4 .7 1.0 1.4 1.8 2.1 1.4 Vehicles .................................... 2.0 2.0 .9 1.5 2.0 2.6 3.1 2.0 Percent homeowner ................... 63 62 41 50 60 71 88 66
Average annual expenditures ....... $27,810 $28,323 $12,119 $17,616 $24,476 $34,231 $53,093 $24,862Percent distribution: ..................... 100.0 100.0 100.0 100.0 100.0 100.0 100.0 100.0 Food ............................................ 14.9 14.8 18.2 17.6 15.9 14.5 12.8 16.1
Food at home ........................... 8.6 8.5 12.5 11.5 9.6 8.1 6.3 9.4 Cereals and bakery products . 1.3 1.3 2.0 1.7 1.4 1.2 .9 1.4 Meats, poultry, fish, and eggs 2.2 2.2 3.2 3.1 2.5 2.0 1.6 2.4 Dairy products ........................ 1.1 1.1 1.7 1.5 1.2 1.0 .8 1.2 Fruits and vegetables ............. 1.5 1.4 2.2 2.0 1.6 1.4 1.0 1.7 Other food at home ................ 2.5 2.5 3.4 3.2 2.9 2.5 2.0 2.7
Food away from home ............. 6.3 6.3 5.7 6.1 6.3 6.3 6.5 6.7
Alcoholic beverages ................... 1.0 1.1 1.1 1.1 1.3 1.1 .9 .9Housing ....................................... 31.0 30.4 35.2 32.7 30.3 28.7 29.6 35.1
Shelter ...................................... 17.4 17.0 19.6 17.5 16.5 16.0 17.2 19.7 Owned dwellings .................... 10.2 10.0 6.7 6.1 7.9 9.7 13.3 11.8 Rented dwellings .................... 5.4 5.4 11.8 10.4 7.4 4.8 1.7 5.4 Other lodging .......................... 1.7 1.6 1.1 1.0 1.2 1.5 2.2 2.4 Utilities, fuels, and public
services ................................... 6.6 6.4 9.7 8.5 7.2 5.9 4.9 8.0 Household operations .............. 1.7 1.6 1.2 1.3 1.5 1.5 1.9 2.0 Housekeeping supplies ............ 1.4 1.4 1.5 2.0 1.6 1.3 1.3 1.3 Household furnishings and
equipment ............................... 3.9 3.9 3.1 3.4 3.6 3.9 4.3 4.2Apparel and services .................. 5.7 5.7 5.2 5.2 5.7 5.9 5.8 6.0
Transportation ............................. 18.7 18.6 16.4 18.2 18.6 21.1 17.7 18.7 Vehicle purchases .................... 8.2 8.3 6.9 7.8 7.7 10.2 7.8 7.7 Gasoline and motor oil ............. 3.5 3.5 3.8 4.0 4.1 3.6 2.9 3.9 Other vehicle expenses ............ 5.9 5.9 4.6 5.6 6.1 6.4 5.8 5.7 Public transportation ................ 1.0 1.0 1.1 .8 .8 .9 1.2 1.3
Health care ................................. 5.1 5.0 7.1 7.6 5.6 4.2 3.8 5.6Entertainment ............................. 5.1 5.1 4.2 3.7 4.6 5.1 5.9 5.6Personal care products andservices ..................................... 1.3 1.3 1.4 1.7 1.4 1.3 1.2 1.3
Reading ...................................... .6 .6 .5 .6 .6 .5 .6 .6Education .................................... 1.3 1.2 2.2 .8 .8 .9 1.5 2.1Tobacco products and smokingsupplies ..................................... .9 .9 1.5 1.3 1.3 .9 .5 .9
Miscellaneous ............................. 2.3 2.4 2.3 2.2 2.7 2.2 2.4 1.8Cash contributions ...................... 3.2 3.3 1.9 2.4 3.0 3.0 4.2 2.8
Personal insurance and pensions 8.9 9.7 2.7 5.0 8.1 10.5 13.2 2.5 Life and other personal
insurance ................................. 1.2 1.2 .9 1.1 1.1 1.3 1.4 1.3 Pensions and Social Security .. 7.6 8.5 1.7 3.9 7.0 9.2 11.8 1.1
See footnotes at end of table.
Incompletereportingof income
Table 37. Shares of average annual expenditures and characteristics of all consumer units classifiedby quintiles of income before taxes, Consumer Expenditure Survey, 1989 and 1999
Complete reporting of incomeAll
consumerunits
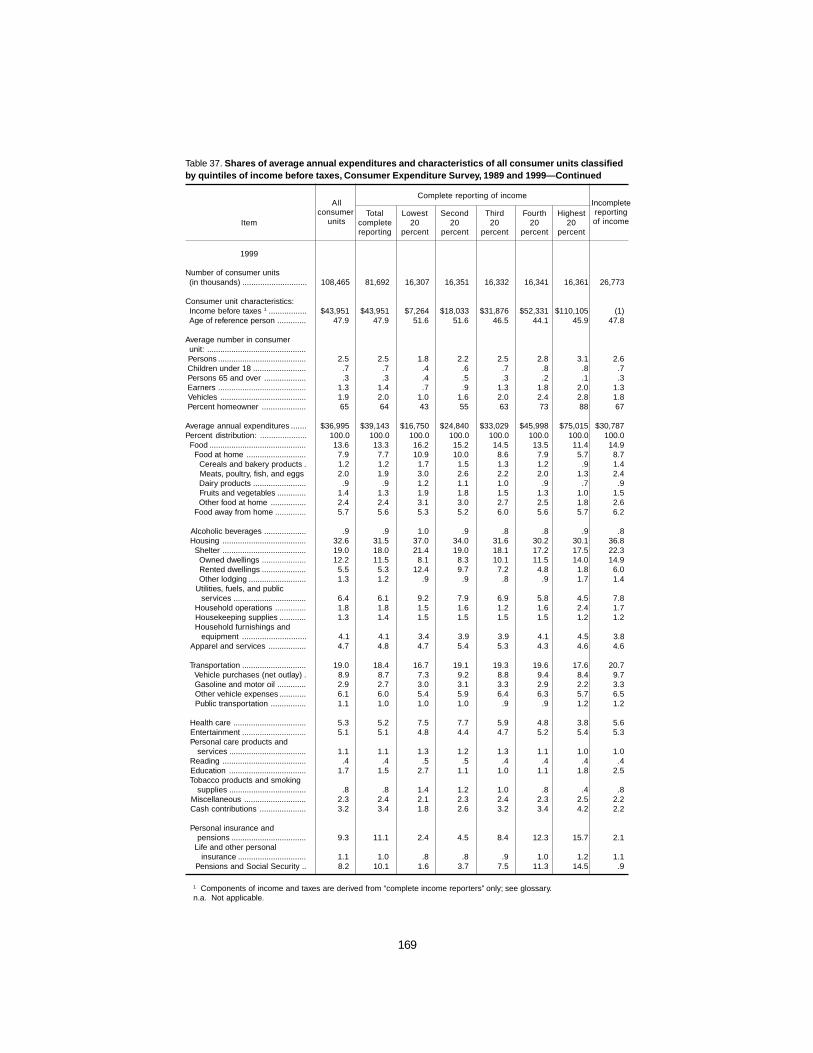
169
Total Lowest Second Third Fourth HighestItem complete 20 20 20 20 20
reporting percent percent percent percent percent
1999
Number of consumer units(in thousands) ............................. 108,465 81,692 16,307 16,351 16,332 16,341 16,361 26,773
Consumer unit characteristics:Income before taxes 1 ................. $43,951 $43,951 $7,264 $18,033 $31,876 $52,331 $110,105 (1)Age of reference person ............. 47.9 47.9 51.6 51.6 46.5 44.1 45.9 47.8
Average number in consumerunit: .............................................
Persons ........................................ 2.5 2.5 1.8 2.2 2.5 2.8 3.1 2.6 Children under 18 ........................ .7 .7 .4 .6 .7 .8 .8 .7 Persons 65 and over ................... .3 .3 .4 .5 .3 .2 .1 .3 Earners ........................................ 1.3 1.4 .7 .9 1.3 1.8 2.0 1.3 Vehicles ....................................... 1.9 2.0 1.0 1.6 2.0 2.4 2.8 1.8 Percent homeowner .................... 65 64 43 55 63 73 88 67
Average annual expenditures ....... $36,995 $39,143 $16,750 $24,840 $33,029 $45,998 $75,015 $30,787Percent distribution: ..................... 100.0 100.0 100.0 100.0 100.0 100.0 100.0 100.0 Food ............................................ 13.6 13.3 16.2 15.2 14.5 13.5 11.4 14.9 Food at home ........................... 7.9 7.7 10.9 10.0 8.6 7.9 5.7 8.7 Cereals and bakery products . 1.2 1.2 1.7 1.5 1.3 1.2 .9 1.4 Meats, poultry, fish, and eggs 2.0 1.9 3.0 2.6 2.2 2.0 1.3 2.4 Dairy products ........................ .9 .9 1.2 1.1 1.0 .9 .7 .9 Fruits and vegetables ............. 1.4 1.3 1.9 1.8 1.5 1.3 1.0 1.5 Other food at home ................ 2.4 2.4 3.1 3.0 2.7 2.5 1.8 2.6 Food away from home .............. 5.7 5.6 5.3 5.2 6.0 5.6 5.7 6.2
Alcoholic beverages ................... .9 .9 1.0 .9 .8 .8 .9 .8 Housing ...................................... 32.6 31.5 37.0 34.0 31.6 30.2 30.1 36.8 Shelter ...................................... 19.0 18.0 21.4 19.0 18.1 17.2 17.5 22.3 Owned dwellings .................... 12.2 11.5 8.1 8.3 10.1 11.5 14.0 14.9 Rented dwellings .................... 5.5 5.3 12.4 9.7 7.2 4.8 1.8 6.0 Other lodging .......................... 1.3 1.2 .9 .9 .8 .9 1.7 1.4 Utilities, fuels, and public
services ................................. 6.4 6.1 9.2 7.9 6.9 5.8 4.5 7.8 Household operations .............. 1.8 1.8 1.5 1.6 1.2 1.6 2.4 1.7 Housekeeping supplies ............ 1.3 1.4 1.5 1.5 1.5 1.5 1.2 1.2 Household furnishings and
equipment ............................. 4.1 4.1 3.4 3.9 3.9 4.1 4.5 3.8 Apparel and services ................. 4.7 4.8 4.7 5.4 5.3 4.3 4.6 4.6
Transportation ............................. 19.0 18.4 16.7 19.1 19.3 19.6 17.6 20.7 Vehicle purchases (net outlay) . 8.9 8.7 7.3 9.2 8.8 9.4 8.4 9.7 Gasoline and motor oil ............. 2.9 2.7 3.0 3.1 3.3 2.9 2.2 3.3 Other vehicle expenses ............ 6.1 6.0 5.4 5.9 6.4 6.3 5.7 6.5 Public transportation ................ 1.1 1.0 1.0 1.0 .9 .9 1.2 1.2
Health care ................................. 5.3 5.2 7.5 7.7 5.9 4.8 3.8 5.6 Entertainment ............................. 5.1 5.1 4.8 4.4 4.7 5.2 5.4 5.3 Personal care products and
services ................................... 1.1 1.1 1.3 1.2 1.3 1.1 1.0 1.0 Reading ...................................... .4 .4 .5 .5 .4 .4 .4 .4 Education ................................... 1.7 1.5 2.7 1.1 1.0 1.1 1.8 2.5 Tobacco products and smoking
supplies ................................... .8 .8 1.4 1.2 1.0 .8 .4 .8 Miscellaneous ............................ 2.3 2.4 2.1 2.3 2.4 2.3 2.5 2.2 Cash contributions ..................... 3.2 3.4 1.8 2.6 3.2 3.4 4.2 2.2
Personal insurance andpensions .................................. 9.3 11.1 2.4 4.5 8.4 12.3 15.7 2.1
Life and other personalinsurance ............................... 1.1 1.0 .8 .8 .9 1.0 1.2 1.1
Pensions and Social Security .. 8.2 10.1 1.6 3.7 7.5 11.3 14.5 .9
1 Components of income and taxes are derived from “complete income reporters” only; see glossary.n.a. Not applicable.
Incompletereportingof income
Table 37. Shares of average annual expenditures and characteristics of all consumer units classifiedby quintiles of income before taxes, Consumer Expenditure Survey, 1989 and 1999—Continued
Complete reporting of incomeAll
consumerunits

170
Table 38. Shares of average annual expenditures and characteristics of all consumer units classifiedby age of the reference person, Consumer Expenditure Survey, 1989 and 1999
All 65Item consumer 25-34 35-44 45-54 55-64 and 65-74
units over
1989
Number of consumer units(in thousands) ........................... 95,818 7,633 20,855 20,436 14,566 12,005 20,323 11,848 8,474
Consumer unit characteristics: Income before taxes 1 ............... $31,308 $14,863 $30,655 $40,915 $41,968 $34,777 $19,690 $22,051 $16,285 Age of reference person ........... 47.2 21.5 29.7 39.4 49.2 59.6 73.9 69.2 80.5
Average number in consumerunit:
Persons ..................................... 2.6 1.8 2.7 3.3 3.0 2.3 1.8 1.9 1.6 Children under 18 ..................... .7 .4 1.1 1.4 .7 .2 .1 .1 (2) Persons 65 and over ................ .3 (2) (2) (2) (2) .1 1.4 1.4 1.4 Earners ..................................... 1.4 1.3 1.5 1.8 2.0 1.5 .5 .6 .2 Vehicles .................................... 2.0 1.2 1.9 2.4 2.7 2.3 1.4 1.7 1.1Percent homeowner ................... 63 8 44 69 74 82 76 78 74
Average annual expenditures ..... $27,810 $16,577 $26,683 $35,589 $36,073 $28,617 $18,967 $21,152 $15,919Percent distribution: ................... 100.0 100.0 100.0 100.0 100.0 100.0 100.0 100.0 100.0 Food .......................................... 14.9 15.1 14.7 14.7 14.9 15.5 15.4 15.2 15.7
Food at home ......................... 8.6 7.8 8.1 8.4 8.3 9.1 10.1 9.7 10.8Cereals and bakeryproducts .............................. 1.3 1.2 1.2 1.3 1.2 1.3 1.6 1.4 1.9
Meats, poultry, fish, and eggs 2.2 1.7 2.0 2.1 2.3 2.5 2.5 2.5 2.6Dairy products ...................... 1.1 1.1 1.1 1.1 1.0 1.1 1.2 1.2 1.4Fruits and vegetables ........... 1.5 1.2 1.3 1.4 1.4 1.6 2.0 1.9 2.2Other food at home .............. 2.5 2.6 2.5 2.5 2.4 2.6 2.6 2.6 2.7
Food away from home ........... 6.3 7.4 6.6 6.3 6.6 6.3 5.3 5.5 5.0
Alcoholic beverages ................... 1.0 1.9 1.4 .9 .8 1.0 .7 .8 .6Housing ...................................... 31.0 28.9 33.4 30.7 29.6 28.5 32.5 32.0 33.4 Shelter ...................................... 17.4 18.4 19.6 17.9 16.7 15.1 15.8 15.5 16.2 Owned dwellings .................... 10.2 1.7 9.7 12.3 10.9 10.2 9.1 9.5 8.4 Rented dwellings .................... 5.4 15.9 8.8 4.1 3.4 2.6 4.8 4.1 6.1 Other lodging .......................... 1.7 .7 1.1 1.6 2.4 2.3 1.8 1.9 1.7 Utilities, fuels, and public
services .................................. 6.6 5.2 6.1 6.0 6.3 7.1 8.9 8.6 9.6 Household operations .............. 1.7 .7 2.3 1.7 1.1 1.2 2.2 1.7 3.0 Housekeeping supplies ............ 1.4 1.0 1.3 1.4 1.3 1.4 1.9 1.8 2.0 Household furnishings and
equipment .............................. 3.9 3.5 4.2 3.8 4.2 3.7 3.8 4.3 2.7Apparel and services ................. 5.7 6.9 5.8 6.0 5.6 5.5 4.8 5.4 3.6
Transportation ............................. 18.7 24.0 19.0 18.5 18.9 18.7 16.3 17.5 14.1 Vehicle purchases .................... 8.2 12.9 8.4 8.5 7.9 8.0 6.7 6.8 6.5 Gasoline and motor oil ............. 3.5 4.3 3.6 3.4 3.6 3.8 3.1 3.6 2.4 Other vehicle expenses ............ 5.9 5.9 6.1 5.8 6.2 5.8 5.1 5.7 4.1 Public transportation ................ 1.0 .9 .9 .8 1.2 1.1 1.3 1.4 1.1
Health care ................................. 5.1 2.1 3.4 3.8 3.9 6.3 11.3 9.4 14.8Entertainment ............................. 5.1 5.6 5.2 5.8 5.1 4.8 3.8 4.0 3.4Personal care products andservices .................................... 1.3 1.5 1.3 1.2 1.3 1.4 1.5 1.5 1.4
Reading ...................................... .6 .5 .5 .5 .5 .6 .7 .7 .7Education ................................... 1.3 4.0 .9 1.4 2.0 .9 .4 .5 .2Tobacco products and smokingsupplies .................................... . 9 1.2 .9 .9 .9 1.1 .8 .9 .6
Miscellaneous ............................ 2.3 1.6 2.2 2.5 2.4 2.3 2.3 2.4 2.1Cash contributions ..................... 3.2 .7 1.9 2.6 3.9 4.0 5.8 4.8 7.5
Personal insurance andpensions .................................... 8.9 6.1 9.5 10.4 10.3 9.3 3.9 5.0 1.9 Life and other personal
insurance ............................... 1.2 .5 .9 1.4 1.3 1.4 1.5 1.7 1.1 Pensions and Social Security .. 7.6 5.6 8.5 9.0 9.0 8.0 2.4 3.3 .7
75and
over
Under25
See footnotes at end of table.

171
Table 38. Shares of average annual expenditures and characteristics of all consumer units classifiedby age of the reference person, Consumer Expenditure Survey, 1989 and 1999—Continued
All 65Item consumer 25-34 35-44 45-54 55-64 and 65-74
units over
1999
Number of consumer units(in thousands) ........................... 108,465 8,164 19,332 24,405 20,903 13,647 22,015 11,578 10,437
Consumer unit characteristics: .. Income before taxes 1 ............... $43,951 $18,276 $42,470 $53,579 $59,822 $49,436 $26,581 $28,928 $23,937 Age of reference person ........... 47.9 21.4 29.7 39.5 49.2 59.1 74.8 69.3 80.8
Average number in consumer unit: ........................................
Persons .................................. 2.5 1.8 2.9 3.2 2.7 2.2 1.7 1.9 1.5 Children under 18 ................... .7 .4 1.1 1.3 .6 .2 .1 .1 (2) Persons 65 and over .............. .3 (2) (2) (2) (2) .1 1.4 1.4 1.3 Earners ................................... 1.3 1.3 1.5 1.7 1.8 1.3 .4 .6 .2 Vehicles .................................. 1.9 1.1 1.7 2.1 2.5 2.2 1.5 1.8 1.2 Percent homeowner ................. 65 13 45 67 77 80 80 82 77
Average annual expenditures ..... $36,995 $21,704 $36,158 $42,792 $46,511 $39,394 $26,521 $29,864 $22,884Percent distribution: ................... 100.0 100.0 100.0 100.0 100.0 100.0 100.0 100.0 100.0 Food .......................................... 13.6 15.5 14.2 14.3 12.8 12.8 13.2 13.9 12.4 Food at home ......................... 7.9 8.4 8.0 8.3 7.2 7.4 8.5 8.6 8.5 Cereals and bakery
products ............................. 1.2 1.2 1.2 1.3 1.1 1.1 1.3 1.3 1.4 Meats, poultry, fish, and
eggs ................................... 2.0 2.2 2.1 2.1 1.9 1.9 2.1 2.2 2.0 Dairy products ...................... .9 .9 .9 1.0 .8 .8 1.0 1.0 1.0 Fruits and vegetables ........... 1.4 1.3 1.3 1.3 1.2 1.3 1.7 1.7 1.8 Other food at home .............. 2.4 2.8 2.5 2.6 2.2 2.3 2.4 2.4 2.4 Food away from home ............ 5.7 7.0 6.2 6.0 5.6 5.4 4.7 5.3 3.9
Alcoholic beverages ................ .9 1.7 1.0 .9 .7 .8 .6 .7 .5Housing .................................... 32.6 30.3 34.6 33.2 31.2 30.7 33.7 32.2 35.9
Shelter ................................... 19.0 19.1 21.1 20.1 18.3 16.9 17.3 16.5 18.3 Owned dwellings ................ 12.2 2.7 10.9 14.3 13.3 12.2 11.2 11.5 10.8 Rented dwellings ................ 5.5 15.2 9.5 5.0 3.3 3.1 4.5 3.2 6.2 Other lodging ...................... 1.3 1.1 .6 .9 1.7 1.6 1.6 1.8 1.3
Utilities, fuels, and publicservices .............................. 6.4 5.4 6.2 6.0 6.1 6.6 8.1 7.9 8.3
Household operations .......... 1.8 .8 2.1 1.9 1.3 1.2 2.8 1.5 4.7Housekeeping supplies ....... 1.3 1.0 1.2 1.4 1.2 1.4 1.6 1.7 1.5Household furnishings andequipment ........................... 4.1 4.0 4.0 3.7 4.3 4.5 4.0 4.5 3.2
Apparel and services ............... 4.7 5.5 5.7 4.8 4.4 4.4 4.0 4.1 3.9
Transportation ........................... 19.0 23.2 19.8 18.8 19.4 18.6 16.5 18.3 14.0 Vehicle purchases (net outlay) 8.9 13.2 9.7 8.9 8.9 8.6 7.2 8.1 5.9 Gasoline and motor oil ........... 2.9 3.3 2.9 2.9 2.9 2.8 2.4 2.7 2.0 Other vehicle expenses .......... 6.1 5.8 6.2 6.0 6.6 5.9 5.4 5.8 4.9 Public transportation .............. 1.1 1.0 .9 1.0 1.0 1.2 1.5 1.7 1.1
Health care ............................... 5.3 2.5 3.2 3.8 4.7 6.2 11.4 10.0 13.3 Entertainment ........................... 5.1 5.3 4.9 5.3 5.1 5.5 4.7 5.2 3.8 Personal care products and
services .................................. 1.1 1.2 1.1 1.1 1.0 1.1 1.3 1.2 1.3 Reading .................................... .4 .3 .3 .4 .5 .5 .6 .6 .6 Education ................................. 1.7 5.9 1.3 1.5 2.4 1.4 .5 .6 .5 Tobacco products and smoking
supplies .................................. .8 1.0 .8 .9 .8 .8 .6 .7 .4 Miscellaneous .......................... 2.3 1.6 2.0 2.2 2.3 2.6 3.0 2.6 3.5 Cash contributions ................... 3.2 .8 1.6 2.5 3.0 4.4 6.1 5.6 6.9
Personal insurance andpensions ................................. 9.3 5.1 9.5 10.4 11.6 10.0 3.7 4.3 2.8
Life and other personalinsurance ............................. 1.1 .3 .7 1.0 1.3 1.4 1.3 1.4 1.0
Pensions and Social Security 8.2 4.8 8.8 9.4 10.3 8.7 2.4 2.8 1.8
1 Components of income and taxes are derived from “complete income reporters” only; see glossary.2 Value less than 0.05.
75and
over
Under25

172
Table 39. Shares of average annual expenditures and characteristics of all consumer unitsclassified by composition of the consumer unit, Consumer Expenditure Survey, 1989 and 1999
Husband and wife consumer units
Husband and wife with children
Husband Totaland wife husband Oldest Oldest Oldest
only and child child child 18wife with under 6 6 to 17 or overchildren
1989
Number of consumer units (in thousands) .......................... 52,728 20,883 28,271 6,265 13,721 8,285 3,574 5,561 37,528
Consumer unit characteristics: Income before taxes 1 .............. $40,913 $37,183 $43,576 $37,601 $43,486 $48,660 $42,171 $17,416 $20,260 Age of reference person .......... 47.4 56.1 40.9 30.7 38.8 51.9 47.9 35.3 48.7
Average number in consumer unit: .......................................... Persons .................................... 3.2 2.0 3.9 3.5 4.1 3.9 4.9 2.9 1.6 Children under 18 .................... .9 n.a. 1.5 1.5 2.1 .6 1.6 1.8 .2 Persons 65 and over ............... .3 .7 .1 (2) (2) .2 .5 (2) .3 Earners .................................... 1.8 1.2 2.1 1.7 1.9 2.7 2.4 1.0 .9 Vehicles ................................... 2.6 2.3 2.9 2.2 2.7 3.6 2.9 1.0 1.3Percent homeowner .................. 78 80 77 64 77 89 77 34 44
Average annual expenditures .... $34,826 $30,604 $37,580 $33,791 $37,644 $40,433 $37,705 $19,186 $19,087Percent distribution .................... 100.0 100.0 100.0 100.0 100.0 100.0 100.0 100.0 100.0 Food ......................................... 14.9 14.3 15.1 13.7 15.6 15.4 16.8 17.8 14.2 Food at home ........................ 8.7 7.9 8.9 8.5 9.2 8.7 11.4 11.6 7.6 Cereals and bakery
products ............................. 1.3 1.2 1.4 1.2 1.5 1.3 1.7 1.8 1.1 Meats, poultry, fish, and eggs 2.2 2.0 2.3 2.0 2.3 2.5 2.9 3.0 1.9 Dairy products ..................... 1.1 1.0 1.1 1.2 1.2 1.0 1.5 1.5 1.0 Fruits and vegetables .......... 1.5 1.5 1.4 1.4 1.4 1.4 1.9 1.9 1.4 Other food at home ............. 2.6 2.2 2.7 2.7 2.8 2.5 3.4 3.4 2.3 Food away from home ........... 6.2 6.5 6.2 5.2 6.3 6.6 5.4 6.2 6.5
Alcoholic beverages ................ .8 1.0 .8 .9 .7 .8 .9 .7 1.5 Housing ................................... 30.0 30.5 29.9 34.4 30.4 26.1 28.8 35.8 32.7 Shelter ................................... 16.4 16.6 16.3 18.2 17.1 13.8 15.3 19.7 19.8 Owned dwellings ................. 11.3 10.9 11.7 12.4 12.3 10.5 9.9 7.9 7.9 Rented dwellings ................. 3.1 3.3 3.0 4.9 3.2 1.4 3.4 11.0 10.4 Other lodging ....................... 1.9 2.4 1.6 1.0 1.6 2.0 1.9 .9 1.5 Utilities, fuels, and public
services .............................. 6.3 6.4 6.2 5.7 6.1 6.5 7.1 8.4 7.1 Household operations ........... 1.8 1.2 2.1 4.4 1.9 .9 1.6 3.0 1.2 Housekeeping supplies ......... 1.5 1.6 1.4 1.6 1.4 1.4 1.4 1.5 1.2 Household furnishings and
equipment .......................... 4.1 4.7 3.9 4.4 3.9 3.5 3.4 3.2 3.4 Apparel and services .............. 5.6 5.4 5.7 5.7 5.9 5.3 5.2 7.9 5.7
Transportation .......................... 19.3 18.5 19.5 18.8 18.6 21.4 20.5 16.0 17.6 Vehicle purchases ................. 8.7 8.0 9.1 9.2 8.7 9.6 9.7 7.3 7.2 Gasoline and motor oil .......... 3.6 3.5 3.7 3.3 3.6 4.2 3.8 2.9 3.4 Other vehicle expenses ......... 6.0 5.9 6.0 5.8 5.6 6.7 6.0 4.8 5.8 Public transportation ............. .9 1.2 .8 .5 .7 .9 1.0 1.0 1.3
Health care .............................. 5.1 6.5 4.2 4.0 4.2 4.4 5.4 3.5 5.2 Entertainment .......................... 5.4 4.6 5.9 5.7 5.8 6.2 5.4 4.7 4.5 Personal care products and
services .............................. 1.3 1.3 1.2 1.2 1.2 1.3 1.2 1.6 1.4 Reading ................................... .5 .6 .5 .5 .5 .5 .5 .5 .6 Education ................................ 1.2 .6 1.6 .4 1.5 2.5 1.2 1.0 1.6 Tobacco products and
smoking supplies .................. .8 .8 .8 .8 .8 .9 1.0 1.0 1.2 Miscellaneous ......................... 2.1 2.1 2.1 1.7 2.2 2.2 2.4 2.5 2.8 Cash contributions .................. 3.2 4.5 2.5 1.6 2.3 3.3 2.6 1.2 3.6
Personal insurance andpensions ................................ 9.6 9.1 10.1 10.6 10.2 9.8 8.2 6.1 7.5
Life and other personalinsurance ............................ 1.4 1.5 1.3 1.3 1.3 1.4 1.3 .8 .9
Pensions and Social Security 8.2 7.6 8.8 9.3 8.8 8.4 6.9 5.3 6.6
See footnotes at end of table.
Item
Singleperson
andothercon-
sumerunits
Oneparent,at least
one childunder 18
Totalhusbandand wife
consumerunits
Otherhusbandand wife
con-sumerunits

173
Husband and wife consumer units
Husband and wife with children
Husband Totaland wife husband Oldest Oldest Oldest
only and child child child 18wife with under 6 6 to 17 or overchildren
1999
Number of consumer units(in thousands) .......................... 56,429 23,406 28,535 5,304 15,378 7,853 4,488 6,571 45,465
Consumer unit characteristics: . Income before taxes 1 .............. $59,126 $54,062 $63,666 $57,922 $63,558 $68,094 $56,519 $25,685 $28,281 Age of reference person .......... 48.2 56.8 41.2 31.7 39.5 50.9 48.4 36.3 49.2
Average number in consumerunit: ........................................... Persons .................................... 3.2 2.0 3.9 3.5 4.1 3.9 4.9 2.9 1.6 Children under 18 .................... .9 n.a. 1.6 1.5 2.1 .6 1.5 1.8 .2 Persons 65 and over ............... .3 .7 .1 (2) (2) .2 .4 (2) .3 Earners .................................... 1.7 1.2 2.0 1.6 1.8 2.6 2.4 1.1 .9 Vehicles ................................... 2.6 2.4 2.7 2.1 2.6 3.2 2.9 1.2 1.3Percent homeowner .................. 81 84 79 67 79 86 76 39 49
Average annual expenditures .... $47,149 $42,133 $51,154 $46,085 $51,453 $54,214 $47,942 $27,900 $25,835Percent distribution: .................. 100.0 100.0 100.0 100.0 100.0 100.0 100.0 100.0 100.0 Food ......................................... 13.5 12.8 13.8 11.7 14.5 13.7 15.5 16.2 13.6 Food at home ........................ 7.8 7.1 8.1 7.3 8.5 7.9 9.4 10.5 7.7 Cereals and bakery
products ............................. 1.2 1.1 1.3 1.1 1.4 1.2 1.4 1.8 1.2 Meats, poultry, fish, and
eggs ................................... 2.0 1.8 2.0 1.7 2.1 2.1 2.6 2.8 2.0 Dairy products ..................... .9 .8 .9 .9 1.0 .9 1.0 1.1 .8 Fruits and vegetables .......... 1.3 1.3 1.3 1.2 1.4 1.3 1.7 1.6 1.3 Other food at home ............. 2.4 2.2 2.5 2.4 2.6 2.4 2.8 3.2 2.4 Food away from home ........... 5.7 5.6 5.6 4.4 6.0 5.8 6.0 5.7 5.9
Alcoholic beverages ................ .7 .9 .6 .6 .6 .5 .6 .5 1.2 Housing ................................... 31.4 30.8 32.0 37.3 31.9 29.0 30.0 36.2 34.7 Shelter ................................... 17.8 17.3 18.4 21.9 18.4 16.3 16.6 21.1 21.1 Owned dwellings ................. 13.6 12.7 14.4 16.4 14.7 12.7 12.1 9.5 9.5 Rented dwellings ................. 2.9 2.8 2.9 4.9 2.8 1.9 3.6 11.1 10.4 Other lodging ....................... 1.4 1.8 1.1 .6 .9 1.8 1.0 .5 1.2 Utilities, fuels, and public
services .............................. 6.1 6.1 5.9 5.6 5.8 6.1 6.9 7.9 7.0 Household operations ........... 1.8 1.3 2.2 4.6 2.1 1.0 1.5 2.5 1.7 Housekeeping supplies ......... 1.4 1.5 1.4 1.2 1.5 1.5 1.3 1.3 1.2 Household furnishings
and equipment ................... 4.2 4.6 4.0 4.0 4.1 4.1 3.6 3.5 3.8 Apparel and services ............. 4.6 4.0 4.9 4.5 5.2 4.6 5.3 7.0 4.6
Transportation .......................... 19.7 19.1 20.0 20.3 18.6 22.2 20.4 16.8 17.5 Vehicle purchases (net outlay) 9.4 9.0 9.7 10.5 9.2 10.0 9.1 8.1 8.0 Gasoline and motor oil .......... 2.9 2.7 3.0 2.8 2.8 3.4 3.4 2.6 2.7 Other vehicle expenses ......... 6.3 6.1 6.4 6.3 5.8 7.7 6.7 5.3 5.7 Public transportation ............. 1.1 1.4 .9 .7 .8 1.1 1.1 .8 1.1
Health care .............................. 5.3 6.9 4.3 3.7 4.2 4.9 5.3 3.6 5.4 Entertainment .......................... 5.3 5.4 5.4 4.6 6.1 4.7 4.4 4.9 4.6 Personal care products and
services ................................. 1.1 1.1 1.1 1.0 1.1 1.1 1.0 1.3 1.2 Reading ................................... .4 .5 .4 .3 .4 .4 .3 .3 .5 Education ................................ 1.8 1.3 2.2 .7 2.0 3.4 1.2 1.5 1.6 Tobacco products and
smoking supplies .................. .7 .6 .7 .5 .7 .7 1.0 .9 1.1 Miscellaneous ......................... 2.2 2.2 2.1 2.4 1.9 2.2 2.8 3.0 2.7 Cash contributions .................. 3.1 4.2 2.3 1.8 2.3 2.7 3.0 1.3 3.7
Personal insurance andpensions ................................ 10.2 10.2 10.4 10.7 10.5 9.9 9.2 6.5 7.6
Life and other personalinsurance ............................... 1.3 1.3 1.3 .9 1.4 1.3 1.3 .6 .7
Pensions and Social Security 8.9 8.9 9.1 9.9 9.1 8.6 7.9 5.9 6.9
1 Components of income and taxes are derived from “complete income reporters” only; see glossary.2 Value less than 0.05.n.a. Not applicable.
Item
Singleperson
andothercon-
sumerunits
Oneparent,at least
one childunder 18
Totalhusbandand wife
consumerunits
Otherhusbandand wife
con-sumerunits
Table 39. Shares of average annual expenditures and characteristics of all consumer unitsclassified by composition of the consumer unit, Consumer Expenditure Survey,1989 and 1999—Continued
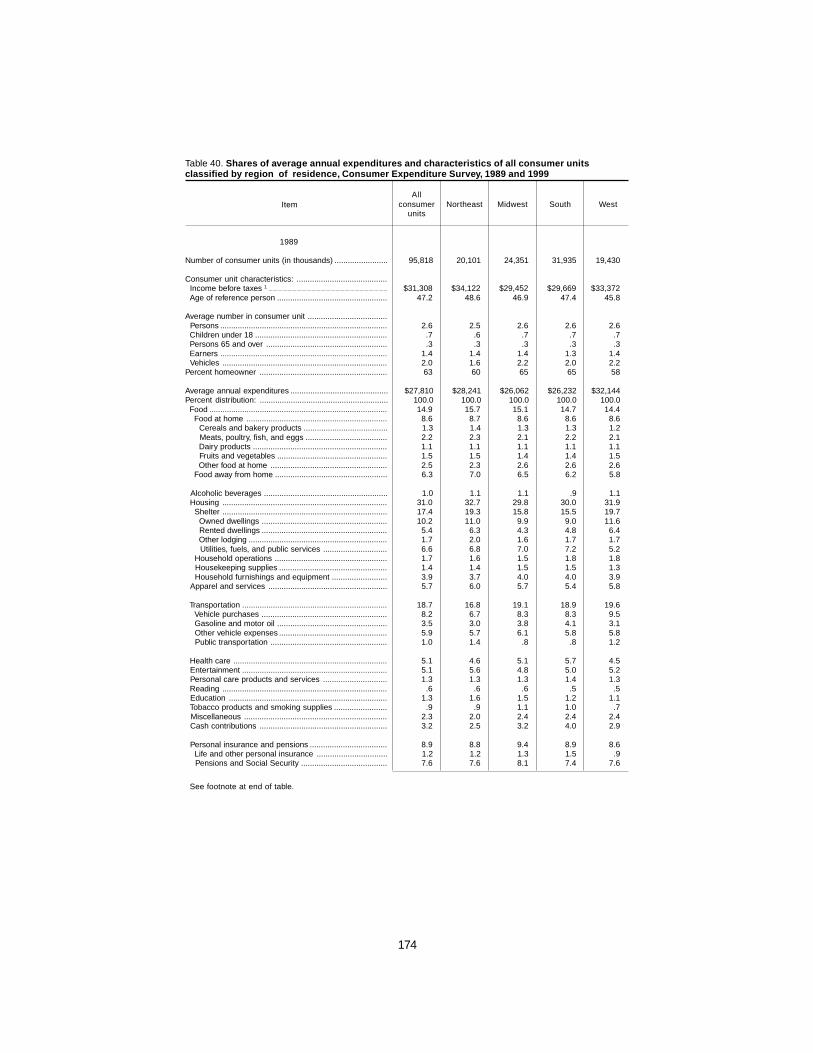
174
Table 40. Shares of average annual expenditures and characteristics of all consumer unitsclassified by region of residence, Consumer Expenditure Survey, 1989 and 1999
Allconsumer Northeast Midwest South West
units
1989
Number of consumer units (in thousands) ........................ 95,818 20,101 24,351 31,935 19,430
Consumer unit characteristics: ......................................... Income before taxes 1 .............................................................................................. $31,308 $34,122 $29,452 $29,669 $33,372 Age of reference person .................................................. 47.2 48.6 46.9 47.4 45.8
Average number in consumer unit .................................... Persons ............................................................................ 2.6 2.5 2.6 2.6 2.6 Children under 18 ............................................................ .7 .6 .7 .7 .7 Persons 65 and over ....................................................... .3 .3 .3 .3 .3 Earners ............................................................................ 1.4 1.4 1.4 1.3 1.4 Vehicles ........................................................................... 2.0 1.6 2.2 2.0 2.2Percent homeowner .......................................................... 63 60 65 65 58
Average annual expenditures ............................................ $27,810 $28,241 $26,062 $26,232 $32,144Percent distribution: .......................................................... 100.0 100.0 100.0 100.0 100.0 Food ................................................................................. 14.9 15.7 15.1 14.7 14.4 Food at home ................................................................ 8.6 8.7 8.6 8.6 8.6 Cereals and bakery products ...................................... 1.3 1.4 1.3 1.3 1.2 Meats, poultry, fish, and eggs ..................................... 2.2 2.3 2.1 2.2 2.1 Dairy products ............................................................. 1.1 1.1 1.1 1.1 1.1 Fruits and vegetables .................................................. 1.5 1.5 1.4 1.4 1.5 Other food at home ..................................................... 2.5 2.3 2.6 2.6 2.6 Food away from home ................................................... 6.3 7.0 6.5 6.2 5.8
Alcoholic beverages ........................................................ 1.0 1.1 1.1 .9 1.1 Housing ........................................................................... 31.0 32.7 29.8 30.0 31.9 Shelter ........................................................................... 17.4 19.3 15.8 15.5 19.7 Owned dwellings ......................................................... 10.2 11.0 9.9 9.0 11.6 Rented dwellings ......................................................... 5.4 6.3 4.3 4.8 6.4 Other lodging ............................................................... 1.7 2.0 1.6 1.7 1.7 Utilities, fuels, and public services ............................. 6.6 6.8 7.0 7.2 5.2 Household operations ................................................... 1.7 1.6 1.5 1.8 1.8 Housekeeping supplies ................................................. 1.4 1.4 1.5 1.5 1.3 Household furnishings and equipment ......................... 3.9 3.7 4.0 4.0 3.9 Apparel and services ...................................................... 5.7 6.0 5.7 5.4 5.8
Transportation .................................................................. 18.7 16.8 19.1 18.9 19.6 Vehicle purchases ......................................................... 8.2 6.7 8.3 8.3 9.5 Gasoline and motor oil .................................................. 3.5 3.0 3.8 4.1 3.1 Other vehicle expenses ................................................. 5.9 5.7 6.1 5.8 5.8 Public transportation ..................................................... 1.0 1.4 .8 .8 1.2
Health care ...................................................................... 5.1 4.6 5.1 5.7 4.5 Entertainment .................................................................. 5.1 5.6 4.8 5.0 5.2 Personal care products and services ............................. 1.3 1.3 1.3 1.4 1.3 Reading ........................................................................... .6 .6 .6 .5 .5 Education ........................................................................ 1.3 1.6 1.5 1.2 1.1 Tobacco products and smoking supplies ........................ .9 .9 1.1 1.0 .7 Miscellaneous ................................................................. 2.3 2.0 2.4 2.4 2.4 Cash contributions .......................................................... 3.2 2.5 3.2 4.0 2.9
Personal insurance and pensions ................................... 8.9 8.8 9.4 8.9 8.6 Life and other personal insurance ................................ 1.2 1.2 1.3 1.5 .9 Pensions and Social Security ....................................... 7.6 7.6 8.1 7.4 7.6
See footnote at end of table.
Item
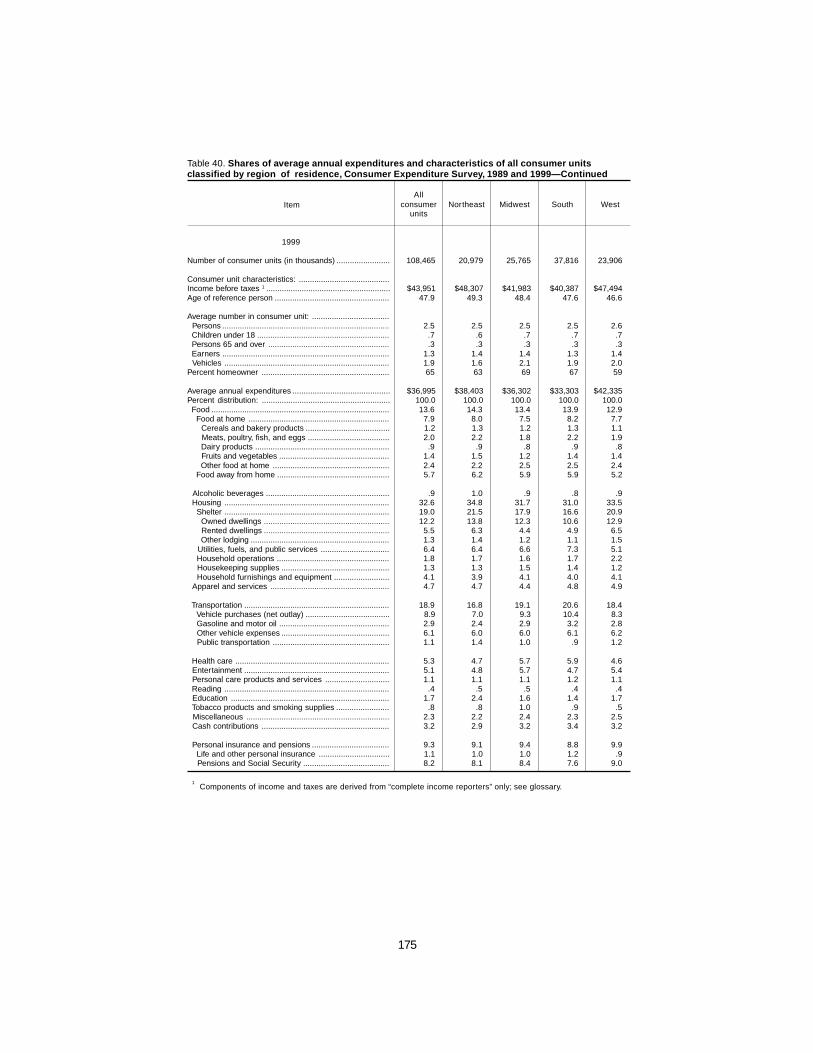
175
Table 40. Shares of average annual expenditures and characteristics of all consumer unitsclassified by region of residence, Consumer Expenditure Survey, 1989 and 1999—Continued
Allconsumer Northeast Midwest South West
units
1999
Number of consumer units (in thousands) ........................ 108,465 20,979 25,765 37,816 23,906
Consumer unit characteristics: .........................................Income before taxes 1 ........................................................ $43,951 $48,307 $41,983 $40,387 $47,494Age of reference person .................................................... 47.9 49.3 48.4 47.6 46.6
Average number in consumer unit: ................................... Persons ............................................................................ 2.5 2.5 2.5 2.5 2.6 Children under 18 ............................................................ .7 .6 .7 .7 .7 Persons 65 and over ....................................................... .3 .3 .3 .3 .3 Earners ............................................................................ 1.3 1.4 1.4 1.3 1.4 Vehicles ........................................................................... 1.9 1.6 2.1 1.9 2.0Percent homeowner .......................................................... 65 63 69 67 59
Average annual expenditures ............................................ $36,995 $38,403 $36,302 $33,303 $42,335Percent distribution: .......................................................... 100.0 100.0 100.0 100.0 100.0 Food ................................................................................. 13.6 14.3 13.4 13.9 12.9 Food at home ................................................................ 7.9 8.0 7.5 8.2 7.7 Cereals and bakery products ...................................... 1.2 1.3 1.2 1.3 1.1 Meats, poultry, fish, and eggs ..................................... 2.0 2.2 1.8 2.2 1.9 Dairy products ............................................................. .9 .9 .8 .9 .8 Fruits and vegetables .................................................. 1.4 1.5 1.2 1.4 1.4 Other food at home ..................................................... 2.4 2.2 2.5 2.5 2.4 Food away from home ................................................... 5.7 6.2 5.9 5.9 5.2
Alcoholic beverages ........................................................ .9 1.0 .9 .8 .9 Housing ........................................................................... 32.6 34.8 31.7 31.0 33.5 Shelter ........................................................................... 19.0 21.5 17.9 16.6 20.9 Owned dwellings ......................................................... 12.2 13.8 12.3 10.6 12.9 Rented dwellings ......................................................... 5.5 6.3 4.4 4.9 6.5 Other lodging ............................................................... 1.3 1.4 1.2 1.1 1.5 Utilities, fuels, and public services ............................... 6.4 6.4 6.6 7.3 5.1 Household operations ................................................... 1.8 1.7 1.6 1.7 2.2 Housekeeping supplies ................................................. 1.3 1.3 1.5 1.4 1.2 Household furnishings and equipment ......................... 4.1 3.9 4.1 4.0 4.1 Apparel and services ...................................................... 4.7 4.7 4.4 4.8 4.9
Transportation .................................................................. 18.9 16.8 19.1 20.6 18.4 Vehicle purchases (net outlay) ...................................... 8.9 7.0 9.3 10.4 8.3 Gasoline and motor oil .................................................. 2.9 2.4 2.9 3.2 2.8 Other vehicle expenses ................................................. 6.1 6.0 6.0 6.1 6.2 Public transportation ..................................................... 1.1 1.4 1.0 .9 1.2
Health care ...................................................................... 5.3 4.7 5.7 5.9 4.6 Entertainment .................................................................. 5.1 4.8 5.7 4.7 5.4 Personal care products and services ............................. 1.1 1.1 1.1 1.2 1.1 Reading ........................................................................... .4 .5 .5 .4 .4 Education ........................................................................ 1.7 2.4 1.6 1.4 1.7 Tobacco products and smoking supplies ........................ .8 .8 1.0 .9 .5 Miscellaneous ................................................................. 2.3 2.2 2.4 2.3 2.5 Cash contributions .......................................................... 3.2 2.9 3.2 3.4 3.2
Personal insurance and pensions ................................... 9.3 9.1 9.4 8.8 9.9 Life and other personal insurance ................................ 1.1 1.0 1.0 1.2 .9 Pensions and Social Security ....................................... 8.2 8.1 8.4 7.6 9.0
1 Components of income and taxes are derived from “complete income reporters” only; see glossary.
Item

176
Table 41. Shares of average annual expenditures and characteristics of all consumer unitsclassified by origin of the reference person, Consumer Expenditure Survey, 1989 and 1999
Allconsumer Hispanic
units
1989
Number of consumer units (in thousands) ........................ 95,818 5,857 89,960 80,961 8,999
Consumer unit characteristics: .........................................Income before taxes 1 ........................................................ $31,308 $23,098 $31,863 $33,007 $21,270Age of reference person .................................................... 47.2 40.6 47.6 47.9 45.4
Average number in consumer unit: ................................... Persons ............................................................................ 2.6 3.3 2.5 2.5 2.8 Children under 18 ............................................................ .7 1.2 .7 .6 1.1 Persons 65 and over ....................................................... .3 .1 .3 .3 .2 Earners ............................................................................ 1.4 1.6 1.4 1.4 1.2 Vehicles ........................................................................... 2.0 1.5 2.0 2.1 1.1Percent homeowner .......................................................... 63 36 64 67 41
Average annual expenditures ............................................ $27,810 $23,226 $28,106 $29,201 $18,294Percent distribution: .......................................................... 100.0 100.0 100.0 100.0 100.0 Food ................................................................................. 14.9 18.9 14.7 14.6 16.1 Food at home ................................................................ 8.6 12.1 8.4 8.3 10.5 Cereals and bakery products ...................................... 1.3 1.7 1.3 1.3 1.5 Meats, poultry, fish, and eggs ..................................... 2.2 3.5 2.1 2.0 3.6 Dairy products ............................................................. 1.1 1.5 1.1 1.1 1.1 Fruits and vegetables .................................................. 1.5 2.2 1.4 1.4 1.8 Other food at home ..................................................... 2.5 3.2 2.5 2.5 2.7 Food away from home ................................................... 6.3 6.8 6.3 6.4 5.6
Alcoholic beverages ........................................................ 1.0 1.0 1.0 1.0 .8 Housing ........................................................................... 31.0 33.9 30.8 30.5 34.4 Shelter ........................................................................... 17.4 21.4 17.2 17.0 19.0 Owned dwellings ......................................................... 10.2 8.7 10.3 10.5 7.6 Rented dwellings ......................................................... 5.4 11.8 5.0 4.7 10.7 Other lodging ............................................................... 1.7 .9 1.8 1.9 .8 Utilities, fuels, and public services ............................... 6.6 6.4 6.6 6.4 9.9 Household operations ................................................... 1.7 1.5 1.7 1.7 1.2 Housekeeping supplies ................................................. 1.4 1.5 1.4 1.4 1.3 Household furnishings and equipment ......................... 3.9 3.1 4.0 4.0 3.1 Apparel and services ...................................................... 5.7 7.0 5.6 5.5 6.9
Transportation .................................................................. 18.7 17.5 18.7 18.8 17.4 Vehicle purchases (net outlay) ...................................... 8.2 8.3 8.2 8.3 6.8 Gasoline and motor oil .................................................. 3.5 3.3 3.6 3.6 3.5 Other vehicle expenses ................................................. 5.9 4.7 5.9 5.9 5.9 Public transportation ..................................................... 1.0 1.2 1.0 1.0 1.2
Health care ...................................................................... 5.1 3.3 5.2 5.2 3.8 Entertainment .................................................................. 5.1 4.0 5.2 5.3 3.1 Personal care products and services ............................. 1.3 1.5 1.3 1.3 1.5 Reading ........................................................................... .6 .3 .6 .6 .4 Education ........................................................................ 1.3 .6 1.4 1.4 1.3 Tobacco products and smoking supplies ........................ .9 .6 1.0 .9 1.3 Miscellaneous ................................................................. 2.3 2.1 2.3 2.3 2.5 Cash contributions .......................................................... 3.2 1.7 3.3 3.4 1.9
Personal insurance and pensions ................................... 8.9 7.6 9.0 9.0 8.6 Life and other personal insurance ................................ 1.2 .6 1.3 1.2 1.7 Pensions and Social Security ....................................... 7.6 7.0 7.7 7.7 6.9
See footnote at end of table.
Item
Non-Hispanic
Non-Hispanicless Afro-American
Afro-American
Total Non-Hispanic

177
1999
Number of consumer units (in thousands) ........................ 108,465 9,111 99,354 87,924 11,431
Consumer unit characteristics: .........................................Income before taxes 1 ........................................................ $43,951 $33,803 $44,955 $46,746 $30,325Age of reference person .................................................... 47.9 41.2 48.5 49.0 45.0
Average number in consumer unit: ................................... Persons ............................................................................ 2.5 3.5 2.4 2.4 2.7 Children under 18 ............................................................ .7 1.3 .6 .6 .9 Persons 65 and over ....................................................... .3 .2 .3 .3 .2 Earners ............................................................................ 1.3 1.6 1.3 1.3 1.3 Vehicles ........................................................................... 1.9 1.6 2.0 2.0 1.3Percent homeowner .......................................................... 65 44 67 69 48
Average annual expenditures ............................................ $36,995 $33,044 $37,356 $38,658 $27,280Percent distribution: .......................................................... 100.0 100.0 100.0 100.0 100.0 Food ................................................................................. 13.6 16.6 13.3 13.2 15.0 Food at home ................................................................ 7.9 10.8 7.6 7.5 9.6 Cereals and bakery products ...................................... 1.2 1.5 1.2 1.2 1.5 Meats, poultry, fish, and eggs ..................................... 2.0 3.3 1.9 1.8 3.2 Dairy products ............................................................. .9 1.1 .8 .8 .9 Fruits and vegetables .................................................. 1.4 2.0 1.3 1.3 1.5 Other food at home ..................................................... 2.4 2.8 2.4 2.4 2.6 Food away from home ................................................... 5.7 5.9 5.7 5.7 5.4
Alcoholic beverages ........................................................ .9 .8 .9 .9 .5 Housing ........................................................................... 32.6 33.3 32.5 32.3 35.2 Shelter ........................................................................... 19.0 20.5 18.8 18.8 19.8 Owned dwellings ......................................................... 12.2 9.6 12.4 12.7 9.9 Rented dwellings ......................................................... 5.5 10.3 5.1 4.7 9.4 Other lodging ............................................................... 1.3 .5 1.3 1.4 .5 Utilities, fuels, and public services ............................... 6.4 6.4 6.4 6.2 8.9 Household operations ................................................... 1.8 1.4 1.8 1.8 1.6 Housekeeping supplies ................................................. 1.3 1.3 1.3 1.3 1.3 Household furnishings and equipment ......................... 4.1 3.6 4.1 4.1 3.6 Apparel and services ...................................................... 4.7 6.3 4.6 4.4 6.9
Transportation .................................................................. 19.0 20.6 18.8 18.8 18.9 Vehicle purchases (net outlay) ...................................... 8.9 10.2 8.8 8.8 8.9 Gasoline and motor oil .................................................. 2.9 3.4 2.8 2.8 2.8 Other vehicle expenses ................................................. 6.1 6.0 6.1 6.1 6.3 Public transportation ..................................................... 1.1 1.0 1.1 1.1 1.0
Health care ...................................................................... 5.3 3.4 5.5 5.6 4.1 Entertainment .................................................................. 5.1 3.8 5.2 5.4 3.4 Personal care products and services ............................. 1.1 1.2 1.1 1.1 1.5 Reading ........................................................................... .4 .2 .4 .5 .3 Education ........................................................................ 1.7 1.1 1.8 1.8 1.4 Tobacco products and smoking supplies ........................ .8 .5 .8 .8 .8 Miscellaneous ................................................................. 2.3 1.9 2.4 2.4 2.1 Cash contributions .......................................................... 3.2 2.1 3.3 3.4 2.1
Personal insurance and pensions ................................... 9.3 8.2 9.4 9.5 7.8 Life and other personal insurance ................................ 1.1 .6 1.1 1.1 1.2 Pensions and Social Security ....................................... 8.2 7.7 8.3 8.4 6.6
1 Components of income and taxes are derived from “complete income reporters” only: see glossary.
Item
Non-Hispanic
Non-Hispanicless Afro-American
Afro-American
Total Non-Hispanic
Table 41. Shares of average annual expenditures and characteristics of all consumer unitsclassified by origin of the reference person, Consumer Expenditure Survey,1989 and 1999—Continued
HispanicAll
consumerunits

178
Table 42. Number of earners in families by type of family, selected years, 1989-99(In thousands)
Characteristic 1989 1993 1994 1995 1996 1997 1998 1999
Total, all families ....................... 66,623 69,211 69,971 70,174 70,840 71,443 72,056 72,574
Married-couple families ................ 52,385 53,246 53,927 53,621 53,654 54,361 54,829 55,352No earners ............................. 6,812 7,280 7,227 7,278 7,148 7,289 7,257 7,163One earner ............................. 11,748 11,842 11,772 11,739 11,556 11,728 12,279 12,328
Husband ............................. 9,212 8,745 8,719 8,821 8,671 8,792 9,198 9,093Wife .................................... 1,840 2,411 2,372 2,253 2,214 2,302 2,419 2,595Other family member ......... 695 687 681 664 671 634 662 640
Two earners ........................... 26,011 26,957 27,472 27,361 27,474 27,935 27,801 28,254Husband and wife .............. 23,929 24,806 25,377 25,478 25,536 25,959 25,928 26,401Husband and other familymember ............................ 1,657 1,540 1,533 1,365 1,443 1,412 1,288 1,307
Husband is not an earner . 425 612 562 518 496 564 586 546Three earners or more .......... 7,815 7,166 7,455 7,243 7,476 7,409 7,492 7,607
Husband and wife .............. 6,950 6,496 6,748 6,582 6,870 6,805 6,883 6,959Husband is an earner,not wife ............................. 716 511 516 514 456 441 438 509
Families maintained by women¹ .. 11,309 12,974 12,768 12,998 13,269 13,112 13,198 13,148No earner ............................... 2,510 3,111 2,855 2,679 2,586 2,342 2,156 1,889One earner ............................. 5,530 6,495 6,581 6,868 7,112 7,146 7,433 7,515
Householder ....................... 4,468 5,367 5,495 5,657 5,906 5,903 6,253 6,207Other family member ......... 1,063 1,128 1,086 1,211 1,205 1,243 1,180 1,308
Two earners or more ............. 3,268 3,368 3,332 3,452 3,572 3,623 3,609 3,744Householder and otherfamily member(s) ............. 2,903 3,049 3,044 3,156 3,341 3,332 3,313 3,420
Householder is not anearner ............................... 365 319 289 296 230 291 296 324
Families maintained by men¹ ....... 2,929 2,992 3,276 3,555 3,916 3,970 4,030 4,074No earner ............................... 281 332 382 357 359 346 387 377One earner ............................. 1,376 1,615 1,705 1,821 1,982 2,106 2,039 2,076
Householder ....................... 1,127 1,372 1,437 1,568 1,683 1,806 1,751 1,758Other family member .......... 249 242 268 253 298 301 288 318
Two earners or more .............. 1,272 1,045 1,189 1,377 1,576 1,518 1,604 1,621Householder and otherfamily member(s) .............. 1,201 983 1,118 1,278 1,454 1,413 1,506 1,481
Householder is not anearner ................................ 72 63 71 98 122 105 99 139
¹ Families maintained by widowed, divorced, separated,or single persons.
NOTE: Data on the number and type of families are col-lected in March of the subsequent year. Earner status refersto the preceding calendar year. The comparability of histori-
cal labor force data has been affected at various times bymethodological and conceptual changes. For an explana-tion, see the Explanatory Notes and Estimates of Error sec-tion of Employment and Earnings, a monthly periodical pub-lished by the Bureau of Labor Statistics.

179
Table B-1. Percent of employees participating in selected benefits, full- and part-time, privateand public sectors, 1996-981
Leave benefit Allemployees
Private sector Public sector
Full-time Part-time Full-time Part-time
Paid leaveHolidays ............................................ 72 85 29 73 31Vacations .......................................... 76 91 35 67 19Personal leave .................................. 18 17 6 38 18Funeral leave .................................... 57 66 22 65 38Jury duty leave ................................. 67 73 28 95 50Military leave ..................................... 33 32 7 76 28Sick leave2 ........................................ 51 53 13 96 43
Unpaid family leave .............................. 64 673 323 95 56
Short-term disability plans2 ................... 34 423 15 20 9
Long-term disability insurance .............. 27 32 2 34 7
Medical care ......................................... 61 70 11 86 37
Dental care ........................................... 39 453 83 60 31
Life Insurance ....................................... 64 74 11 89 42
All retirement4 ....................................... 59 62 20 98 62Defined benefit pension .................... 35 32 8 90 59Defined contribution5 ......................... 36 47 15 14 5
Types of plans:Savings and thrift ........................ 23 31 7 5 1Deferred profit sharing ................ 10 13 6 - -Employee stock ownership ......... 2 3 1 - -Money purchase pension ............ 6 6 2 10 4
1 Data for public sector employees are for 1998, data forprivate sector small establishments (fewer than 100 employees)are for 1996, and data for private sector medium and largeestablishments are for 1997.
2 Sick leave is limited to annual benefits. Per disability sickleave plans are now reported along with sickness and accidentinsurance as short-term disability plans.
3 Private sector data have been revised since 1999
publication.4 Includes defined benefit plans and defined contribution
plans. Some employees participated in both types of plans.5 Includes other types of defined contribution plans not
shown separately. Sums of individual items may not equaltotals because employees may be enrolled in more than onetype of plan.
NOTE: Dashes indicate no employees in this category.
Table 43. Percent of employees participating in selected benefits, full- and part-time privateand public sectors, 1996-981

180
Table B-1. Full-time employees1 participating in selected retirement benefit programs byindustry sector and size of establishment, 1996-98
(In percent, unless otherwise indicated.)
Benefit Civilianworkforce
Private sectorState
and localgovernmentsTotal Small
establishments
Mediumand large
establishments
Total (thousands) ............................ 92,576 78,225 39,816 38,409 14,351
All retirement plans2 ................................. 68 62 46 79 98
Defined benefit pension ...................... 41 32 15 50 90
Defined contribution ............................ 42 47 38 57 14Savings and thrift ........................... 27 31 23 39 5Deferred profit-sharing ................... 11 13 12 13 -Employee stock ownership ............ 2 3 1 43 -Money purchase pension ............... 6 6 4 8 10Simplified employee pension ......... 4( ) 1 1 - 4( )
Deferred earnings arrangements:
With employer contributions ................. 315 35 24 46 13Salary reduction .............................. 29 34 24 44 6
Savings and thrift ......................... 25 29 21 38 4
Without employer contributions ......... 9 6 4 9 22
1 Small private establishments include those employing lessthan 100 workers, data are from 1996; medium and large privateestablishments include those employing 100 workers or more,data are from 1997; and State and local governments, data arefrom 1998.
2 Includes defined benefit pension plans and definedcontribution retirement plans. Some employees participated in
both types of plans.3 Private sector data have been revised since 1999
publication.4 Less than 0.5 percent.5 Includes other deferred earnings arrangements not shown
separately.NOTE: Dash indicates no employees in this category
Table 44. Full-time employees1 participating in selected retirement benefit programs byindustry sector and size of establishment, 1996-98
Table B-2. Percent of employees eligible for selected benefits, full- and part-time, private andpublic sectors, 1996-981
Benefit Allemployees
Private sector Public sector
Full-time Part-time Full-time Part-time
Section 125 cafeteria benefits plans2 ... 34 37 8 55 24Full flexible benefits programs .......... 7 8 2 5 3
Severance pay ...................................... 22 25 5 29 16Supplemental unemploymentbenefits ............................................... 2 2 3( ) 3( ) -
Employer assistance for child care ....... 5 5 4 7 7Long-term care insurance ..................... 5 4 1 11 15Wellness programs ............................... 21 22 10 35 27Employee assistance programs ........... 38 37 18 70 43Job-related travel accident insurance ... 21 27 9 12 7Nonproduction bonuses ........................ 37 43 23 33 7Job-related educational assistance ...... 47 52 20 63 39Non-job-related educationalassistance ........................................... 12 13 3 22 16
1 Data for public sector employees are for 1998, data forprivate sector small establishments (fewer than 100 employees)are for 1996, and data for private sector medium and largeestablishments are for 1997.
2 Includes all plans under Internal Revenue Code Section125.
3 Less than 0.5 percent.NOTE: Dashes indicate no employees in this category.
Table 45. Percent of employees eligible for selected benefits, full- and part-time, private andpublic sectors, 1996-981

181
Table B-3. Percent of employees participating in selected benefits, full-time, bygeographical region, 1996-981
Benefit Northeast South North Central West
Paid leave:Holidays ............................................ 88 82 84 78Vacations .......................................... 89 88 87 84Personal leave .................................. 36 14 22 13Funeral leave .................................... 76 61 70 55Jury duty leave ................................. 87 77 79 60Military leave ..................................... 45 40 40 30Family leave ..................................... 3 2 3 1
Unpaid leave:Unpaid family leave .......................... 81 72 73 70
Disability benefits:2
Paid-sick leave ................................. 69 58 55 58Short-term disability .......................... 64 30 40 23Long-term disability insurance .......... 30 32 36 33
Survivor benefits:Life insurance ................................... 77 77 80 69Accidental death and
dismemberment .............................. 56 60 62 52Survivor income benefits .................. 1 2 6 2
Health care benefits:Medical care ..................................... 74 71 74 72Dental care ....................................... 52 38 48 56Vision care ........................................ 27 15 22 32Outpatient prescription drug
coverage ......................................... 69 66 70 67
Retirement income benefits:All retirement .................................... 72 66 68 65
Defined benefit ............................... 48 37 43 38Defined contribution3 ...................... 42 43 41 42
Savings and thrift ........................ 25 28 25 29Deferred profit sharing ................ 10 9 14 11Employee stock ownership ......... 2 3 2 3Money purchase pension ........... 9 6 6 4
Cash or deferred arrangements:With employer contributions ....... 31 32 31 32
Salary reduction4 .................... 29 29 27 31Savings and thrift ................ 25 26 23 28
Deferral of profit sharingallocation .............................. 1 1 3 1
No employer contributions .......... 9 7 10 10
1 Data for State and local government employeesare from the 1998 survey; data for private sector smallestablishments (fewer than 100 employees) are fromthe 1996 survey; and data for private sector mediumand large establishments (100 employees or greater)are from the 1997 survey.
2 Sick leave is limited to annual benefits. Perdisability sick leave plans are now reported along withsickness and accident insurance as short-termdisability plans.
3 Includes other types of defined contribution plansnot shown separately. Sums of individual items maynot equal totals, because employees may be enrolledin more than one type of plan.
4 Includes other types of salary reduction plans notshown separately.
NOTE: The Northeast region consists ofConnecticut, Maine, Massachusetts, NewHampshire, New Jersey, New York, Pennsylvania,Rhode Island, and Vermont. The South regionconsists of Alabama, Arkansas, Delaware, Districtof Columbia, Florida, Georgia, Kentucky, Louisiana,Maryland, Mississippi, North Carolina, Oklahoma,South Carolina, Tennessee, Texas, Virginia, andWest Virginia. The North Central region consists ofIllinois, Indiana, Iowa, Kansas, Michigan,Minnesota, Missouri, Nebraska, North Dakota,Ohio, South Dakota, and Wisconsin. The Westregion consists of Alaska, Arizona, California,Colorado, Hawaii, Idaho, Montana, Nevada, NewMexico, Oregon, Utah, Washington, and Wyoming.
Table 46. Precent of employees participating in selected benefits, full-time, bygeographical region, 1996-981
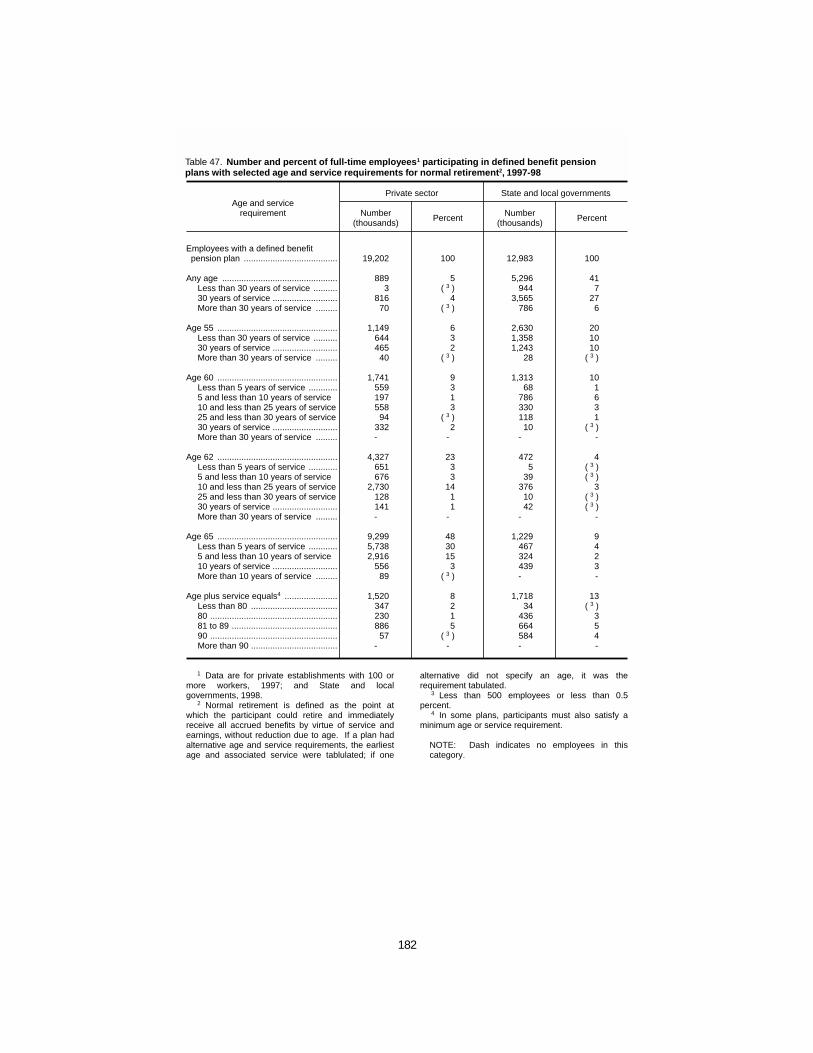
182
Table B-4. Number and percent of full-time employees1 participating in definedbenefit pension plans with selected age and service requirements for normalretirement2, 1997-98
Age and servicerequirement
Private sector State and local governments
Number(thousands) Percent Number
(thousands) Percent
Employees with a defined benefitpension plan ....................................... 19,202 100 12,983 100
Any age ................................................ 889 5 5,296 41Less than 30 years of service .......... 3 3( ) 944 730 years of service ........................... 816 4 3,565 27More than 30 years of service ......... 70 3( ) 786 6
Age 55 .................................................. 1,149 6 2,630 20Less than 30 years of service .......... 644 3 1,358 1030 years of service ........................... 465 2 1,243 10More than 30 years of service ......... 40 3( ) 28 3( )
Age 60 .................................................. 1,741 9 1,313 10Less than 5 years of service ............ 559 3 68 15 and less than 10 years of service 197 1 786 610 and less than 25 years of service 558 3 330 325 and less than 30 years of service 94 3( ) 118 130 years of service ........................... 332 2 10 3( )More than 30 years of service ......... - - - -
Age 62 .................................................. 4,327 23 472 4Less than 5 years of service ............ 651 3 5 3( )5 and less than 10 years of service 676 3 39 3( )10 and less than 25 years of service 2,730 14 376 325 and less than 30 years of service 128 1 10 3( )30 years of service ........................... 141 1 42 3( )More than 30 years of service ......... - - - -
Age 65 .................................................. 9,299 48 1,229 9Less than 5 years of service ............ 5,738 30 467 45 and less than 10 years of service 2,916 15 324 210 years of service ........................... 556 3 439 3More than 10 years of service ......... 89 3( ) - -
Age plus service equals4 ...................... 1,520 8 1,718 13Less than 80 .................................... 347 2 34 3( )80 ..................................................... 230 1 436 381 to 89 ............................................ 886 5 664 590 ..................................................... 57 3( ) 584 4More than 90 .................................... - - - -
1 Data are for private establishments with 100 ormore workers, 1997; and State and localgovernments, 1998.
2 Normal retirement is defined as the point atwhich the participant could retire and immediatelyreceive all accrued benefits by virtue of service andearnings, without reduction due to age. If a plan hadalternative age and service requirements, the earliestage and associated service were tablulated; if one
alternative did not specify an age, it was therequirement tabulated.
3 Less than 500 employees or less than 0.5percent.
4 In some plans, participants must also satisfy aminimum age or service requirement.
NOTE: Dash indicates no employees in thiscategory.
Table 47. Number and percent of full-time employees1 participating in defined benefit pensionplans with selected age and service requirements for normal retirement2, 1997-98

183
Table 49. Number and percent distribution of fatal occupational injuries by event or exposure, 1998-99
Event or exposure1
Fatalities
1998 1999
Number Percent Number Percent
Total .......................................................................................................... 6,055 100 6,023 100
Transportation incidents ........................................................................ 2,645 44 2,613 43Highway ................................................................................................ 1,442 24 1,491 25
Collision between vehicles, mobile equipment .................................. 707 12 711 12Moving in same direction .............................................................. 120 2 129 2Moving in opposite directions, oncoming ...................................... 272 4 269 4Moving in intersection ................................................................... 143 2 160 3
Vehicle struck stationary object or equipment ................................... 307 5 334 6Noncollision ....................................................................................... 375 6 388 6
Jack-knifed or overturned--no collision ......................................... 302 5 321 5Nonhighway (farm, industrial premises) ................................................ 388 6 353 6
Noncollision accident ........................................................................ 332 5 306 5Fell from and struck by vehicle, mobile equipment ....................... 70 1 58 1Overturned .................................................................................... 217 4 206 3
Aircraft ................................................................................................... 224 4 227 4Worker struck by a vehicle .................................................................... 413 7 377 6
Worker struck by vehicle, mobile equipment in roadway .................. 131 2 137 2Worker struck by vehicle, mobile equipment on side of road ............ 66 1 65 1Worker struck by vehicle, mobile equipment in parking lot or
non-road area .................................................................................. 199 3 165 3Water vehicle ........................................................................................ 112 2 102 2Railway .................................................................................................. 60 1 56 1
Collision between railway vehicle and other vehicle ......................... 48 1 42 1
Assaults and violent acts ....................................................................... 962 16 893 15Homicides ............................................................................................. 714 12 645 11
Shooting ............................................................................................ 574 9 506 8Stabbing ............................................................................................ 61 1 60 1
Self-inflicted injury ................................................................................. 221 4 208 3
Contact with objects and equipment .................................................... 944 16 1,029 17Struck by object ..................................................................................... 520 9 585 10
Struck by falling object ...................................................................... 319 5 358 6Struck by flying object ....................................................................... 59 1 55 1Struck by rolling, sliding objects on floor or ground level .................. 75 1 97 2
Caught in or compressed by equipment or objects ............................... 266 4 302 5Caught in running equipment or machinery ...................................... 129 2 163 3
Caught in or crushed in collapsing materials ........................................ 140 2 128 2
Falls .......................................................................................................... 706 12 717 12Fall to lower level .................................................................................. 625 10 634 11
Fall from ladder ................................................................................. 111 2 96 2Fall from roof ..................................................................................... 157 3 153 3Fall from scaffold, staging ................................................................. 98 2 92 2
Fall on same level ................................................................................. 51 1 66 1
Exposure to harmful substances or environments ............................. 576 10 529 9Contact with electric current .................................................................. 334 6 278 5
Contact with electric current of machine, tool, appliance, light fixture ....................................................................................... 51 1 51 1
Contact with wiring, transformers, or other electrical component ..... 84 1 75 1Contact with overhead power lines ................................................... 153 3 124 2
Contact with temperature extremes ...................................................... 48 1 50 1Exposure to caustic, noxious, or allergenic substances ........................ 105 2 106 2
Inhalation of substance ..................................................................... 48 1 55 1Oxygen deficiency ................................................................................. 87 1 93 2
Drowning, submersion ...................................................................... 75 1 75 1
Fires and explosions .............................................................................. 206 3 216 4Fires--unintended or uncontrolled ......................................................... 117 2 115 2Explosion ............................................................................................... 89 1 99 2
Other events or exposures2 ................................................................... 16 3( ) 26 3( )
1 Based on the 1992 BLS Occupational Injury andIllness Classification Manual.
2 Includes the category "Bodily reaction and exertion."3 Less than 0.5 percent.
NOTE: Totals for major categories may include
subcategories not shown separately. Dashes indicate nodata reported or data that do not meet publication criteria.
SOURCE: U.S. Department of Labor, Bureau of LaborStatistics, in cooperation with State and Federal agencies,Census of Fatal Occupational Injuries
Table 48. Number and percent distribution of fatal occupational injuries by event or exposure, 1998-99

184
Table 50. Number, percent and rate of fatal occupational injuries for selected occupations, 1998-99
Occupation1
1998 1999
Number Percent
Fatalityrate per100,000workers2
Number Percent
Fatalityrate per100,000workers2
Total ....................................................................................... 6,055 100 4.5 6,023 100 4.5
Managerial and professional specialty .............................. 642 11 1.6 597 10 1.5Executive, administrative, and managerial ...................................................................... 410 7 2.1 371 6 1.9
Professional specialty ........................................................ 232 4 1.2 226 4 1.1
Technical, sales, and administrative support ................... 679 11 1.8 610 10 1.6Technicians and related support occupations ................... 167 3 3.9 158 3 3.6
Airplane pilots and navigators ........................................ 91 2 80.5 94 2 65.7Sales occupations .............................................................. 398 7 2.5 356 6 2.2
Supervisors and proprietors, sales occupations ............ 186 3 3.9 140 2 2.9Sales workers, retail and personal services .................. 153 3 2.2 144 2 2.1
Administrative support occupations, including clerical ....... 114 2 .6 96 2 .5
Service occupations ............................................................ 441 7 2.4 468 8 2.6Protective service occupations .......................................... 259 4 10.6 261 4 10.7
Police and detectives, including supervisors ................. 138 2 11.6 132 2 11.0Guards, including supervisors ....................................... 76 1 7.9 72 1 7.5
Farming, forestry, and fishing ............................................ 930 15 25.5 897 15 26.2Farming occupations ......................................................... 600 10 28.6 557 9 30.0
Farmers, except horticultural ......................................... 281 5 29.5 233 4 25.9Managers, farms, except horticultural ............................ 81 1 45.9 118 2 80.8Farm workers ................................................................. 221 4 23.6 199 3 26.3
Related agricultural occupations ........................................ 123 2 9.6 124 2 9.6Forestry and logging occupations ...................................... 119 2 129.7 122 2 114.0
Timber cutting and logging occupations ........................ 90 1 148.3 102 2 154.5Fishers, hunters, and trappers ........................................... 72 1 134.0 78 1 156.0
Fishers, including vessel captains and officers .............. 71 1 137.3 78 1 162.5
Precision production, craft, and repair .............................. 1,090 18 7.5 1,142 19 7.8Mechanics and repairers ................................................... 287 5 6.0 353 6 7.3Construction trades ............................................................ 633 10 11.3 633 11 10.9
Carpenters and apprentices .......................................... 91 2 6.7 103 2 7.4Electricians and apprentices .......................................... 124 2 15.4 105 2 12.6Roofers .......................................................................... 50 1 20.7 59 1 27.6Structural metal workers ................................................ 52 1 82.5 43 1 60.6
Operators, fabricators, and laborers ................................. 2,155 36 11.8 2,194 36 12.1Machine operators, assemblers, and inspectors ............... 221 4 2.8 216 4 2.9Transportation and material moving occupations .............. 1,260 21 23.4 1,320 22 23.9
Motor vehicle operators ................................................. 1,023 17 25.1 1,063 18 25.3Truck drivers .............................................................. 882 15 29.2 898 15 28.8Taxicab drivers and chauffeurs .................................. 82 1 30.0 74 1 27.3
Material moving equipment operators ........................... 197 3 17.5 205 3 17.8Handlers, equipment cleaners, helpers, and laborers ....... 674 11 13.2 658 11 12.5
Construction laborers ..................................................... 335 6 40.7 341 6 37.1Laborers, except construction ........................................ 193 3 14.7 193 3 15.0
Military occupations3 .......................................................... 88 1 7.2 80 1 6.8
1 Based on the 1990 Occupational ClassificationSystem developed by the Bureau of the Census.
2 The rate represents the number of fatal occupationalinjuries per 100,000 employed workers and was calculatedas follows: (N/W) x 100,000, where N = the number of fatalwork injuries, and W = the number of employed workersbased on Current Population Survey and Bureau of theCensus figures. Workers under the age of 16 years werenot included in the rate calculations so consistency with theCPS employment figures could be maintained.
3 Resident armed forces.
NOTE: Totals for major categories may includesubcategories not shown separately. Dashes indicate nodata reported or data that do not meet publication criteria.
SOURCE: U.S. Department of Labor, Bureau of LaborStatistics, in cooperation with State and Federal agencies,Census of Fatal Occupational Injuries
Table 49. Number, percent and rate of fatal occupational injuries for selected occupations, 1998-99

185
Table 51. Number, percent, and rate of fatal occupational injuries by industry, 1998-99
Industry1 SICcode1
1998 1999
Number Percent
Fatality rate per100,000workers2
Number Percent
Fatality rate per100,000workers2
Total ............................................................................ 6,055 100 4.5 6,023 100 4.5
Private industry ......................................................... 5,457 90 4.8 5,461 91 4.8
Agriculture, forestry and fishing ......................... 840 14 23.3 807 13 24.1Agricultural production - crops ............................ 01 380 6 35.6 350 6 36.6Agricultural production - livestock ....................... 02 174 3 15.3 163 3 16.4Agricultural services ............................................ 07 170 3 13.3 164 3 12.5
Mining .................................................................... 147 2 23.6 121 2 21.5Oil and gas extraction ......................................... 13 76 1 20.4 50 1 15.2
Construction .......................................................... 1,174 19 14.5 1,190 20 14.0General building contractors ............................... 15 213 4 - 183 3 -Heavy construction, except building ................... 16 272 4 - 280 5 -Special trades contractors .................................. 17 680 11 - 709 12 -
Manufacturing ....................................................... 698 12 3.3 719 12 3.6Food and kindred products ................................. 20 72 1 4.3 83 1 5.1Lumber and wood products ................................ 24 172 3 19.7 190 3 23.1
Transportation and public utilities ...................... 911 15 11.8 1,006 17 12.7Local and interurban passenger transportation .. 41 85 1 15.4 102 2 17.2Trucking and warehousing .................................. 42 564 9 21.8 605 10 22.6Transportation by air ........................................... 45 74 1 8.9 74 1 8.6Electric, gas, and sanitary services ..................... 49 83 1 7.8 86 1 8.4
Wholesale trade .................................................... 229 4 4.5 237 4 4.6Durable goods ..................................................... 50 138 2 5.0 132 2 4.7Nondurable goods ............................................... 51 91 2 3.9 105 2 4.5
Retail trade ............................................................ 570 9 2.6 507 8 2.3Food stores ......................................................... 54 135 2 3.7 115 2 3.3Automotive dealers and service stations ............ 55 120 2 5.4 82 1 3.7Eating and drinking places .................................. 58 107 2 1.6 145 2 2.2
Finance, insurance, and real estate .................... 92 2 1.1 105 2 1.2
Services ................................................................. 763 13 2.0 732 12 1.9Automotive repair, services, and parking ............ 75 133 2 8.6 132 2 8.4
Government3 ............................................................. 598 10 3.0 562 9 2.8Federal ...................................................................... 162 3 3.7 147 2 3.3State .......................................................................... 136 2 2.6 108 2 2.1Local ......................................................................... 296 5 3.0 301 5 2.9
1 Classified according to the Standard IndustrialClassification Manual, 1987.
2 The rate represents the number of fatal occupationalinjuries per 100,000 employed workers and was calculatedas follows: (N/W) x 100,000, where N = the number of fatalwork injuries, and W = the number of employed workersbased on Current Population Survey and Bureau of theCensus figures. Workers under the age of 16 years werenot included in the rate calculations so consistency with theCPS employment figures could be maintained.
3 Includes fatalities to workers employed bygovernmental organizations regardless of industry.
NOTE: Totals for major categories may includesubcategories not shown separately. Dashes indicate nodata reported or data that do not meet publication criteria.
SOURCE: U.S. Department of Labor, Bureau of LaborStatistics, in cooperation with State and Federal agencies,Census of Fatal Occupational Injuries
Table 50. Number, percent, and rate of fatal occupational injuries by industry, 1998-99

186
Table 52. Number, percent, and rate of fatal occupational injuries by selected worker characteristics,1998-99
Characteristics
1998 1999
Number Percent
Fatality rate per100,000workers1
Number Percent
Fatality rate per100,000workers1
Total ................................................................. 6,055 100 4.5 6,023 100 4.5
Employee status
Wage and salary workers2 ............................... 4,804 79 3.9 4,884 81 3.9Self-employed3 ................................................ 1,251 21 11.7 1,139 19 11.1
Sex
Men .................................................................. 5,569 92 7.7 5,582 93 7.7Women ............................................................. 486 8 .8 441 7 .7
Age
Under 16 years ................................................. 33 1 - 26 4( ) -16 to 17 years .................................................. 32 1 1.2 46 1 1.6 18 to 19 years .................................................. 137 2 3.1 122 2 2.720 to 24 years .................................................. 421 7 3.2 450 7 3.425 to 34 years .................................................. 1,238 20 3.9 1,171 19 3.735 to 44 years .................................................. 1,525 25 4.2 1,499 25 4.145 to 54 years .................................................. 1,279 21 4.6 1,326 22 4.655 to 64 years .................................................. 836 14 6.5 814 14 6.165 and over ...................................................... 541 9 14.3 559 9 14.4
Race
White ................................................................ 5,041 83 4.5 4,990 83 4.4Black or African American ................................ 594 10 4.0 626 10 4.1American Indian or Alaskan Native .................. 29 4( ) - 57 1 -Asian, Native Hawaiian or Pacific Islander ....... 264 4 - 191 3 -Other or not reported ........................................ 127 2 - 159 3 -
Hispanic origin
Hispanic5 .......................................................... 707 12 5.2 725 12 5.2
1 The rate represents the number of fataloccupational injuries per 100,000 employed workersand was calculated as follows: (N/W) x 100,000,where N = the number of fatal work injuries, and W =the number of employed workers based on CurrentPopulation Survey and Bureau of the Censusfigures. Workers under the age of 16 years were notincluded in the rate calculations so consistency withthe CPS employment figures could be maintained.
2 May include volunteers and other workersreceiving compensation.
3 Includes paid and unpaid family workers, andmay include owners of incorporated businesses, ormembers of partnerships.
4 Less than 0.5 percent.5 Persons identified as Hispanic may be of any
race.
NOTE: Totals for major categories may includesubcategories not shown separately. Dashesindicate no data reported or data that do not meetpublication criteria.
SOURCE: U.S. Department of Labor, Bureau ofLabor Statistics, in cooperation with State andFederal agencies, Census of Fatal OccupationalInjuries
Table 51. Number, percent, and rate of fatal occupational injures by selected worker characteristics,1998-99

187
Table 52. Number of nonfatal occupational injuries and illnesses involving days away from work1 by selectedoccupation and industry division, 1999
(thousands)
Occupation Privateindustry2
Goods producing Service producing
Agricul-ture,
forestry,and
fishing2
Mining3 Con-struction
Manu-facturing
Trans-portation
andpublic
utilities3
Whole-saletrade
Retailtrade
Finance,insur-ance,
and realestate
Servi-ces
Total ....................................... 1,702.5 34.9 11.3 193.8 403.6 196.7 136.1 291.6 39.5 394.9
Truck drivers .......................... 141.1 1.1 .8 7.3 12.1 61.9 26.2 14.6 .5 16.5Laborers, nonconstruction ..... 89.1 .5 1.3 – 29.0 7.1 25.7 14.2 .8 10.5Nursing aides, orderlies ......... 75.7 – – – – – – – .4 75.3Construction laborers ............. 46.5 – – 45.5 .4 .3 – .1 .1 .1Janitors and cleaners ............. 43.4 .4 4( ) .3 6.1 1.2 1.0 5.3 4.6 24.4Assemblers ............................ 40.0 .1 – .6 34.9 .7 1.8 1.1 – .8Carpenters ............................. 35.0 – 4( ) 27.3 3.2 .3 .5 1.8 .4 1.4Cooks ..................................... 28.0 – – – .3 .2 .1 19.2 .2 8.0Stock handlers and baggers .. 27.3 4( ) 4( ) .1 1.6 .3 2.4 22.7 – .2Registered nurses .................. 25.7 – – – 4( ) .1 – – .2 25.3Supervisors and proprietors ... 25.4 – – .1 .5 .1 3.2 19.5 .5 1.6Miscellaneous foodpreparation ........................... 24.9 – – – .1 – .1 18.6 .1 5.9
Welders and cutters ............... 24.7 4( ) .2 1.8 18.9 .7 2.3 – 4( ) .7Cashiers ................................. 22.8 .1 – – 4( ) .1 .4 20.8 4( ) 1.4Sales workers, othercommodities ......................... 21.9 .1 – .1 .3 .2 2.0 17.5 .1 1.6
Maids and housemen ............ 21.4 – 4( ) – .1 4( ) – – .7 20.5Groundskeepers andgardeners, except farm ........ 18.9 9.0 – .3 .2 .2 .1 .5 2.8 5.6
Electricians ............................ 17.9 – .3 13.6 2.2 .3 .2 .2 .1 1.1Shipping and receivingclerks ................................... 16.6 – – .1 5.2 3.9 3.0 3.8 4( ) .6
Mechanics, automobile .......... 16.5 .1 – – .2 .3 1.1 10.8 – 4.1Driver-sales workers .............. 14.5 – – – 3.6 .7 6.3 2.7 – 1.2Kitchen workers ..................... 14.1 – – – .1 – – 11.4 – 2.6Industrial truck operators ....... 13.9 .3 .5 .6 6.1 1.8 3.3 .9 – .3Waiters and waitresses .......... 13.2 – – – 4( ) 4( ) – 9.4 .1 3.6Plumbers and pipefitters ........ 12.4 – – 9.7 1.1 .4 .3 – 4( ) .8Repairers, industrialmachinery ............................ 11.9 – 1.1 .1 8.9 .5 .6 .2 – .5
Licensed practical nurses ...... 11.7 – – – – – – – 4( ) 11.6Mechanics, bus, truck,stationary engine ................. 11.6 .1 4( ) .3 .7 4.8 2.3 1.3 – 2.1
Farm workers ......................... 11.5 10.5 – – .4 – .4 – – .2Packaging, filling machineoperators .............................. 11.5 – – – 10.3 – .8 – – .3
Stock and inventory clerks ..... 11.4 4( ) – .2 2.2 .6 1.2 4.8 .1 2.3Supervisors, productionworkers ................................ 10.7 – .1 – 8.2 .4 .6 .5 .2 .8
Health aides, exceptnursing ................................. 10.1 – – – – .1 – – – 9.9
Hand packers andpackagers ............................ 9.8 .3 – – 4.7 .4 2.2 1.6 – .5
Butchers and meat cutters ..... 9.8 .1 – – 2.6 – .4 6.5 – 4( )Guards and police, exceptpublic ................................... 9.1 – 4( ) – .3 .5 .1 .8 .4 7.0
Attendants, publictransportation ....................... 9.0 – – – – 9.0 – – – –
Heating, air conditioning, andrefrigeration mechanics ....... 8.9 – – 5.8 .2 .4 .7 .5 .2 1.1
Machinists .............................. 8.7 – 4( ) .1 7.8 4( ) .3 – – .5Helpers, construction trades .. 8.7 – – 8.3 .1 – .1 .1 – –
1 Days-away-from-work cases include those which resultin days away from work with or without restricted workactivity.
2 Excludes farms with fewer than 11 employees.3 Data conforming to OSHA definitions for mining
operators in coal, metal, and nonmetal mining and foremployers in railroad transportation are provided to BLS bythe Mine Safety and Health Administration, U.S. Departmentof Labor, and by the Federal Railroad Administration, U.S.Department of Transportation. Independent miningcontractors are excluded from the coal, metal, and nonmetal
industries. 4 Fewer than 50 cases.
NOTE: Dashes indicate data that are not available. Because of rounding and nonclassifiable responses, datamay not sum to the totals.The n.e.c. abbreviation meansthat the category includes those components not elsewhereclassified.
SOURCE: U.S. Department of Labor, Bureau of LaborStatistics
Table 52. Number of nonfatal occupational injuries and illnesses involving days away from work1 byselected occupation and industry division, 1999
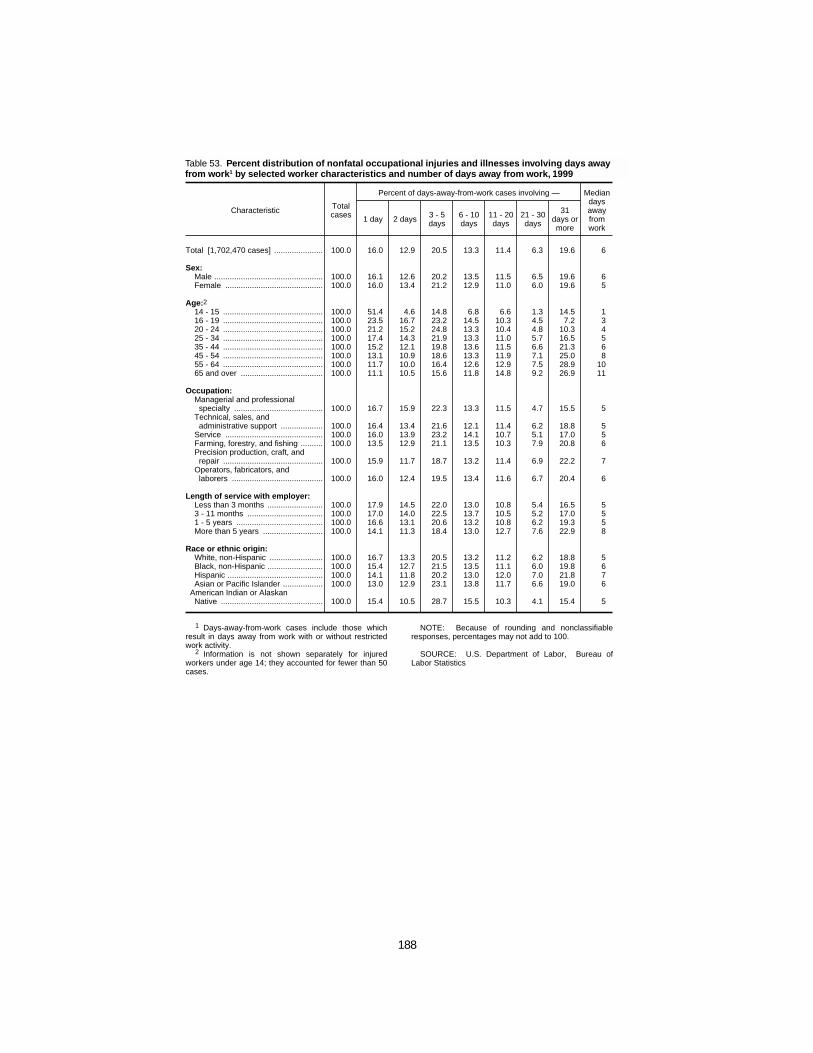
188
Table 53. Percent distribution of nonfatal occupational injuries and illnesses involving days away from work1 byselected worker characteristics and number of days away from work,1999
Characteristic Totalcases
Percent of days-away-from-work cases involving — Mediandaysawayfromwork
1 day 2 days 3 - 5days
6 - 10days
11 - 20days
21 - 30days
31days ormore
Total [1,702,470 cases] ...................... 100.0 16.0 12.9 20.5 13.3 11.4 6.3 19.6 6
Sex:Male ................................................. 100.0 16.1 12.6 20.2 13.5 11.5 6.5 19.6 6Female ............................................ 100.0 16.0 13.4 21.2 12.9 11.0 6.0 19.6 5
Age:214 - 15 ............................................. 100.0 51.4 4.6 14.8 6.8 6.6 1.3 14.5 116 - 19 ............................................. 100.0 23.5 16.7 23.2 14.5 10.3 4.5 7.2 320 - 24 ............................................. 100.0 21.2 15.2 24.8 13.3 10.4 4.8 10.3 425 - 34 ............................................. 100.0 17.4 14.3 21.9 13.3 11.0 5.7 16.5 535 - 44 ............................................. 100.0 15.2 12.1 19.8 13.6 11.5 6.6 21.3 645 - 54 ............................................. 100.0 13.1 10.9 18.6 13.3 11.9 7.1 25.0 855 - 64 ............................................. 100.0 11.7 10.0 16.4 12.6 12.9 7.5 28.9 1065 and over ..................................... 100.0 11.1 10.5 15.6 11.8 14.8 9.2 26.9 11
Occupation:Managerial and professionalspecialty ........................................ 100.0 16.7 15.9 22.3 13.3 11.5 4.7 15.5 5
Technical, sales, andadministrative support ................... 100.0 16.4 13.4 21.6 12.1 11.4 6.2 18.8 5
Service ............................................ 100.0 16.0 13.9 23.2 14.1 10.7 5.1 17.0 5Farming, forestry, and fishing .......... 100.0 13.5 12.9 21.1 13.5 10.3 7.9 20.8 6Precision production, craft, andrepair ............................................. 100.0 15.9 11.7 18.7 13.2 11.4 6.9 22.2 7
Operators, fabricators, andlaborers ......................................... 100.0 16.0 12.4 19.5 13.4 11.6 6.7 20.4 6
Length of service with employer:Less than 3 months ......................... 100.0 17.9 14.5 22.0 13.0 10.8 5.4 16.5 53 - 11 months .................................. 100.0 17.0 14.0 22.5 13.7 10.5 5.2 17.0 51 - 5 years ....................................... 100.0 16.6 13.1 20.6 13.2 10.8 6.2 19.3 5More than 5 years ........................... 100.0 14.1 11.3 18.4 13.0 12.7 7.6 22.9 8
Race or ethnic origin:White, non-Hispanic ........................ 100.0 16.7 13.3 20.5 13.2 11.2 6.2 18.8 5Black, non-Hispanic ......................... 100.0 15.4 12.7 21.5 13.5 11.1 6.0 19.8 6Hispanic ........................................... 100.0 14.1 11.8 20.2 13.0 12.0 7.0 21.8 7Asian or Pacific Islander .................. 100.0 13.0 12.9 23.1 13.8 11.7 6.6 19.0 6
American Indian or AlaskanNative .............................................. 100.0 15.4 10.5 28.7 15.5 10.3 4.1 15.4 5
1 Days-away-from-work cases include those whichresult in days away from work with or without restrictedwork activity.
2 Information is not shown separately for injuredworkers under age 14; they accounted for fewer than 50cases.
NOTE: Because of rounding and nonclassifiableresponses, percentages may not add to 100.
SOURCE: U.S. Department of Labor, Bureau ofLabor Statistics
Table 53. Percent distribution of nonfatal occupational injuries and illnesses involving days awayfrom work1 by selected worker characteristics and number of days away from work, 1999

189
Table 54. Incidence rates and number of cases of nonfatal occupational injuries and illnesses for private industryby selected case types, 1973-99
Year1
Incidence rate2 Number (in thousands)
Totalcases
Lost workday casesCaseswithout
lostworkdays
Totalcases
Lost workday casesCaseswithout
lostworkdays
Total3With daysaway from
work4Total3
With daysaway from
work4
1973 ...................... 11.0 3.4 – 7.5 6,078.7 1,908.0 – 4,165.01974 ...................... 10.4 3.5 – 6.9 5,915.8 2,001.8 – 3,908.11975 ...................... 9.1 3.3 3.2 5.8 4,983.1 1,825.2 1,730.5 3,152.61976 ...................... 9.2 3.5 3.3 5.7 5,163.7 1,978.8 1,875.4 3,180.41977 ...................... 9.3 3.8 3.6 5.5 5,460.3 2,203.6 2,092.1 3,250.6
19785 .................... 9.4 4.1 3.8 5.3 5,799.4 2,492.0 2,327.5 3,302.019795 .................... 9.5 4.3 4.0 5.2 6,105.7 2,757.7 2,553.5 3,342.31980 ...................... 8.7 4.0 3.7 4.7 5,605.8 2,539.9 2,353.8 3,060.41981 ...................... 8.3 3.8 3.5 4.5 5,404.4 2,457.5 2,269.2 2,941.81982 ...................... 7.7 3.5 3.2 4.2 4,856.4 2,182.4 2,016.2 2,668.6
19835 .................... 7.6 3.4 3.2 4.2 4,854.1 2,182.7 2,014.2 2,667.619845 .................... 8.0 3.7 3.4 4.3 5,419.7 2,501.5 2,303.7 2,913.41985 ...................... 7.9 3.6 3.3 4.3 5,507.2 2,537.0 2,319.2 2,965.91986 ...................... 7.9 3.6 3.3 4.3 5,629.0 2,590.3 2,356.9 3,034.61987 ...................... 8.3 3.8 3.4 4.4 6,035.9 2,801.6 2,483.9 3,230.6
1988 ...................... 8.6 4.0 3.5 4.6 6,440.4 2,977.8 2,483.9 3,458.71989 ...................... 8.6 4.0 3.4 4.6 6,576.3 3,073.9 2,624.2 3,497.91990 ...................... 8.8 4.1 3.4 4.7 6,753.0 3,123.8 2,613.5 3,625.61991 ...................... 8.4 3.9 3.2 4.5 6,345.7 2,944.2 2,398.4 3,398.319926 .................... 8.9 3.9 3.0 5.0 6,799.4 2,953.4 2,331.1 3,846.0
19936 .................... 8.5 3.8 2.9 4.8 6,737.4 2,967.4 2,252.5 3,770.019946 .................... 8.4 3.8 2.8 4.6 6,766.9 3,061.0 2,236.6 3,705.919956 .................... 8.1 3.6 2.5 4.4 6,575.4 2,972.1 2,040.9 3,603.219966 .................... 7.4 3.4 2.2 4.1 6,238.9 2,832.5 1,880.6 3,406.419976 .................... 7.1 3.3 2.1 3.8 6,145.6 2,866.2 1,833.4 3,279.4
19986 .................... 6.7 3.1 2.0 3.5 5,922.8 2,780.7 1,730.5 3,142.119996 .................... 6.3 3.0 1.9 3.3 5,707.2 2,742.8 1,702.5 2,964.5
1 Data for 1973-75 are based on the StandardIndustrial Classification Manual, 1967 Edition; data for1976-87 are based on the Standard IndustrialClassification Manual, 1972 Edition; and data for 1988-99are based on the Standard Industrial ClassificationManual, 1987 Edition. The recordkeeping guidelines foroccupational injuries and illnesses were revised in 1986,and the Survey of Occupational Injuries and Illnesses wasredesigned in 1992.
2 The incidence rates represent the number of injuriesand illnesses per 100 full-time workers and werecalculated as: (N/EH) x 200,000, where
N = number of injuries and illnesses EH = total hours worked by all employees
during the calendar year 200,000 = base for 100 equivalent full-time workers
(working 40 hours per week, 50 weeksper year)
3 Total lost workday cases involve days away fromwork, days of restricted work activity, or both.
4 Days-away-from-work cases include those whichresult in days away from work with or without restrictedwork activity.
5 To maintain historical comparability with the rest ofthe series, data for small nonfarm employers in low-riskindustries who were not surveyed were imputed andincluded in the survey estimates.
6 Data exclude fatal work-related injuries andillnesses.
NOTE: Because of rounding, components may not addto the totals. Data for 1976-99 exclude farms with fewerthan 11 employees.
SOURCE: U.S. Department of Labor, Bureau of LaborStatistics
Table 54. Incidence rates and number of cases of nonfatal occupational injuries and illnessesfor private industry by selected case types, 1973-99

190
Table 55. Unemployment for selected demographic groups, annual averages, 1948-2000
(In thousands)
Men Women
20 20years yearsand andover over
1948 ................................ 2,276 1,559 256 1,305 717 153 564 – – – –1949 ................................ 3,637 2,572 353 2,219 1,065 223 841 – – – –
1950 ................................ 3,288 2,239 318 1,922 1,049 195 854 – – – –1951 ................................ 2,055 1,221 191 1,029 834 145 689 – – – –1952 ................................ 1,883 1,185 205 980 698 140 559 – – – –19531 ............................... 1,834 1,202 184 1,019 632 123 510 – – – –1954 ................................ 3,532 2,344 310 2,035 1,188 191 997 2,859 – – –1955 ................................ 2,852 1,854 274 1,580 998 176 823 2,252 – 972 –1956 ................................ 2,750 1,711 269 1,442 1,039 209 832 2,159 – 905 –1957 ................................ 2,859 1,841 300 1,541 1,018 197 821 2,289 – 982 –1958 ................................ 4,602 3,098 416 2,681 1,504 262 1,242 3,680 – 1,799 –1959 ................................ 3,740 2,420 398 2,022 1,320 256 1,063 2,946 – 1,296 –
19601 ............................... 3,852 2,486 426 2,060 1,366 286 1,080 3,065 – 1,334 –1961 ................................ 4,714 2,997 479 2,518 1,717 349 1,368 3,743 – 1,676 –19621 ............................... 3,911 2,423 408 2,016 1,488 313 1,175 3,052 – 1,300 –1963 ................................ 4,070 2,472 501 1,971 1,598 383 1,216 3,208 – 1,235 –1964 ................................ 3,786 2,205 487 1,718 1,581 385 1,195 2,999 – 1,039 –1965 ................................ 3,366 1,914 479 1,435 1,452 395 1,056 2,691 – 883 –1966 ................................ 2,875 1,551 432 1,120 1,324 405 921 2,255 – 706 –1967 ................................ 2,975 1,508 448 1,060 1,468 391 1,078 2,338 – 685 701968 ................................ 2,817 1,419 426 993 1,397 412 985 2,226 – 620 1241969 ................................ 2,832 1,403 440 963 1,429 413 1,015 2,260 – 582 130
1970 ................................ 4,093 2,238 599 1,638 1,855 506 1,349 3,339 – 1,002 1611971 ................................ 5,016 2,789 693 2,097 2,227 568 1,658 4,085 – 1,255 23619721 ............................... 4,882 2,659 711 1,948 2,222 598 1,625 3,906 906 1,100 24519731 ............................... 4,365 2,275 653 1,624 2,089 583 1,507 3,442 846 916 2491974 ................................ 5,156 2,714 757 1,957 2,441 665 1,777 4,097 965 1,087 2661975 ................................ 7,929 4,442 966 3,476 3,486 802 2,684 6,421 1,369 2,063 4011976 ................................ 7,406 4,036 939 3,098 3,369 780 2,588 5,914 1,334 1,709 4281977 ................................ 6,991 3,667 874 2,794 3,324 789 2,535 5,441 1,393 1,462 42219781 ............................... 6,202 3,142 813 2,328 3,061 769 2,292 4,698 1,330 1,135 4171979 ................................ 6,137 3,120 811 2,308 3,018 743 2,276 4,664 1,319 1,134 425
1980 ................................ 7,637 4,267 913 3,353 3,370 755 2,615 5,884 1,553 1,709 4821981 ................................ 8,273 4,577 962 3,615 3,696 800 2,895 6,343 1,731 1,766 5791982 ................................ 10,678 6,179 1,090 5,089 4,499 886 3,613 8,241 2,142 2,632 6751983 ................................ 10,717 6,260 1,003 5,257 4,457 825 3,632 8,128 2,272 2,634 7061984 ................................ 8,539 4,744 812 3,932 3,794 687 3,107 6,372 1,914 1,896 6271985 ................................ 8,312 4,521 806 3,715 3,791 661 3,129 6,191 1,864 1,767 65119861 ............................... 8,237 4,530 779 3,751 3,707 675 3,032 6,140 1,840 1,819 6321987 ................................ 7,425 4,101 732 3,369 3,324 616 2,709 5,501 1,684 1,625 6131988 ................................ 6,701 3,655 667 2,987 3,046 558 2,487 4,944 1,547 1,360 5471989 ................................ 6,528 3,525 658 2,867 3,003 536 2,467 4,770 1,544 1,276 558
19901 ............................... 7,047 3,906 667 3,239 3,140 544 2,596 5,186 1,565 1,446 5801991 ................................ 8,628 4,946 751 4,195 3,683 608 3,074 6,560 1,723 1,875 6631992 ................................ 9,613 5,523 806 4,717 4,090 621 3,469 7,169 2,011 2,150 7371993 ................................ 8,940 5,055 768 4,287 3,885 597 3,288 6,655 1,844 1,899 73119941 ............................... 7,996 4,367 740 3,627 3,629 580 3,049 5,892 1,666 1,592 6921995 ................................ 7,404 3,983 744 3,239 3,421 602 2,819 5,459 1,538 1,424 6241996 ................................ 7,236 3,880 733 3,146 3,356 573 2,783 5,300 1,592 1,322 65819971 ............................... 6,739 3,577 694 2,882 3,162 577 2,585 4,836 1,560 1,167 68419981 ............................... 6,210 3,266 686 2,580 2,944 519 2,424 4,484 1,426 1,034 61219991 ............................... 5,880 3,066 633 2,433 2,814 529 2,285 4,273 1,309 990 560
20001 ............................... 5,655 2,954 604 2,350 2,701 489 2,212 4,099 1,269 891 522
Marriedmen,
spousepre-sent
BlackWhite
Womenwho
main-tain
families
16 to19
yearsTotal Total
YearTotalunem-ployed
1 The comparability of historical labor force data has beenaffected at various times by methodological and conceptualchanges. For an explanation, see the Explanatory Notes andEstimates of Error section of Employment and Earnings,
16 to19
years
a monthly periodical published by the Bureau of LaborStatistics.
Dash indicates data not available.

191
1948 ................................ 3.8 3.6 9.8 3.2 4.1 8.3 3.6 – – – –1949 ................................ 5.9 5.9 14.3 5.4 6.0 12.3 5.3 – – – –
1950 ................................ 5.3 5.1 12.7 4.7 5.7 11.4 5.1 – – – –1951 ................................ 3.3 2.8 8.1 2.5 4.4 8.3 4.0 – – – –1952 ................................ 3.0 2.8 8.9 2.4 3.6 8.0 3.2 – – – –19531 ............................... 2.9 2.8 7.9 2.5 3.3 7.2 2.9 – – – –1954 ................................ 5.5 5.3 13.5 4.9 6.0 11.4 5.5 5.0 – – –1955 ................................ 4.4 4.2 11.6 3.8 4.9 10.2 4.4 3.9 – 2.6 –1956 ................................ 4.1 3.8 11.1 3.4 4.8 11.2 4.2 3.6 – 2.3 –1957 ................................ 4.3 4.1 12.4 3.6 4.7 10.6 4.1 3.8 – 2.8 –1958 ................................ 6.8 6.8 17.1 6.2 6.8 14.3 6.1 6.1 – 5.1 –1959 ................................ 5.5 5.2 15.3 4.7 5.9 13.5 5.2 4.8 – 3.6 –
19601 ............................... 5.5 5.4 15.3 4.7 5.9 13.9 5.1 5.0 – 3.7 –1961 ................................ 6.7 6.4 17.1 5.7 7.2 16.3 6.3 6.0 – 4.6 –19621 ............................... 5.5 5.2 14.7 4.6 6.2 14.6 5.4 4.9 – 3.6 –1963 ................................ 5.7 5.2 17.2 4.5 6.5 17.2 5.4 5.0 – 3.4 –1964 ................................ 5.2 4.6 15.8 3.9 6.2 16.6 5.2 4.6 – 2.8 –1965 ................................ 4.5 4.0 14.1 3.2 5.5 15.7 4.5 4.1 – 2.4 –1966 ................................ 3.8 3.2 11.7 2.5 4.8 14.1 3.8 3.4 – 1.9 –1967 ................................ 3.8 3.1 12.3 2.3 5.2 13.5 4.2 3.4 – 1.8 4.91968 ................................ 3.6 2.9 11.6 2.2 4.8 14.0 3.8 3.2 – 1.6 4.41969 ................................ 3.5 2.8 11.4 2.1 4.7 13.3 3.7 3.1 – 1.5 4.4
1970 ................................ 4.9 4.4 15.0 3.5 5.9 15.6 4.8 4.5 – 2.6 5.41971 ................................ 5.9 5.3 16.6 4.4 6.9 17.2 5.7 5.4 – 3.2 7.319721 ............................... 5.6 5.0 15.9 4.0 6.6 16.7 5.4 5.1 10.4 2.8 7.219731 ............................... 4.9 4.2 13.9 3.3 6.0 15.3 4.9 4.3 9.4 2.3 7.11974 ................................ 5.6 4.9 15.6 3.8 6.7 16.6 5.5 5.0 10.5 2.7 7.01975 ................................ 8.5 7.9 20.1 6.8 9.3 19.7 8.0 7.8 14.8 5.1 10.01976 ................................ 7.7 7.1 19.2 5.9 8.6 18.7 7.4 7.0 14.0 4.2 10.11977 ................................ 7.1 6.3 17.3 5.2 8.2 18.3 7.0 6.2 14.0 3.6 9.419781 ............................... 6.1 5.3 15.8 4.3 7.2 17.1 6.0 5.2 12.8 2.8 8.51979 ................................ 5.8 5.1 15.9 4.2 6.8 16.4 5.7 5.1 12.3 2.8 8.3
1980 ................................ 7.1 6.9 18.3 5.9 7.4 17.2 6.4 6.3 14.3 4.2 9.21981 ................................ 7.6 7.4 20.1 6.3 7.9 19.0 6.8 6.7 15.6 4.3 10.41982 ................................ 9.7 9.9 24.4 8.8 9.4 21.9 8.3 8.6 18.9 6.5 11.71983 ................................ 9.6 9.9 23.3 8.9 9.2 21.3 8.1 8.4 19.5 6.5 12.21984 ................................ 7.5 7.4 19.6 6.6 7.6 18.0 6.8 6.5 15.9 4.6 10.31985 ................................ 7.2 7.0 19.5 6.2 7.4 17.6 6.6 6.2 15.1 4.3 10.419861 ............................... 7.0 6.9 19.0 6.1 7.1 17.6 6.2 6.0 14.5 4.4 9.81987 ................................ 6.2 6.2 17.8 5.4 6.2 15.9 5.4 5.3 13.0 3.9 9.21988 ................................ 5.5 5.5 16.0 4.8 5.6 14.4 4.9 4.7 11.7 3.3 8.11989 ................................ 5.3 5.2 15.9 4.5 5.4 14.0 4.7 4.5 11.4 3.0 8.1
19901 ............................... 5.6 5.7 16.3 5.0 5.5 14.7 4.9 4.8 11.4 3.4 8.31991 ................................ 6.8 7.2 19.8 6.4 6.4 17.5 5.7 6.1 12.5 4.4 9.31992 ................................ 7.5 7.9 21.5 7.1 7.0 18.6 6.3 6.6 14.2 5.1 10.01993 ................................ 6.9 7.2 20.4 6.4 6.6 17.5 5.9 6.1 13.0 4.4 9.719941 ............................... 6.1 6.2 19.0 5.4 6.0 16.2 5.4 5.3 11.5 3.7 8.91995 ................................ 5.6 5.6 18.4 4.8 5.6 16.1 4.9 4.9 10.4 3.3 8.01996 ................................ 5.4 5.4 18.1 4.6 5.4 15.2 4.8 4.7 10.5 3.0 8.219971 ............................... 4.9 4.9 16.9 4.2 5.0 15.0 4.4 4.2 10.0 2.7 8.119981 ............................... 4.5 4.4 16.2 3.7 4.6 12.9 4.1 3.9 8.9 2.4 7.219991 ............................... 4.2 4.1 14.7 3.5 4.3 13.2 3.8 3.7 8.0 2.2 6.4
20001 ............................... 4.0 3.9 14.0 3.3 4.1 12.1 3.6 3.5 7.6 2.0 5.9
Men WomenMarried Women
20 20 men, whoYear years years spouse maintain
and and present familiesover over
BlackWhite16 to19
yearsTotalTotal
Total,all
workers16 to
19years
Table 56. Unemployment rates for selected demographic groups, annual averages, 1948-2000
(Percent)
1 The comparability of historical labor force data has beenaffected at various times by methodological and conceptualchanges. For an explanation, see the Explanatory Notes andEstimates of Error section of Employment and Earnings,
a monthly periodical published by the Bureau of LaborStatistics.
Dash indicates data not available.

192
Duration of unemployment Reason for unemployment
Year Less 27 Mean Medianthan 5 to14 15 to 26 weeks dura- dura- Job Job Reen- New
5 weeks weeks and tion tion losers1 leavers trants entrantsweeks over (weeks) (weeks)
1948 ................................ 2,276 1,300 669 193 116 8.6 – – – – –1949 ................................ 3,637 1,756 1,194 428 256 10.0 – – – – –
1950 ................................ 3,288 1,450 1,055 425 357 12.1 – – – – –1951 ................................ 2,055 1,177 574 166 137 9.7 – – – – –1952 ................................ 1,883 1,135 516 148 84 8.4 – – – – –19532 ............................... 1,834 1,142 482 132 78 8.0 – – – – –1954 ................................ 3,532 1,605 1,116 495 317 11.8 – – – – –1955 ................................ 2,852 1,335 815 366 336 13.0 – – – – –1956 ................................ 2,750 1,412 805 301 232 11.3 – – – – –1957 ................................ 2,859 1,408 891 321 239 10.5 – – – – –1958 ................................ 4,602 1,753 1,396 785 667 13.9 – – – – –1959 ................................ 3,740 1,585 1,114 469 571 14.4 – – – – –
19602 ............................... 3,852 1,719 1,176 503 454 12.8 – – – – –1961 ................................ 4,714 1,806 1,376 728 804 15.6 – – – – –19622 ............................... 3,911 1,663 1,134 534 585 14.7 – – – – –1963 ................................ 4,070 1,751 1,231 535 553 14.0 – – – – –1964 ................................ 3,786 1,697 1,117 491 482 13.3 – – – – –1965 ................................ 3,366 1,628 983 404 351 11.8 – – – – –1966 ................................ 2,875 1,573 779 287 239 10.4 – – – – –1967 ................................ 2,975 1,634 893 271 177 8.7 2.3 1,229 438 945 3961968 ................................ 2,817 1,594 810 256 156 8.4 4.5 1,070 431 909 4071969 ................................ 2,832 1,629 827 242 133 7.8 4.4 1,017 436 965 413
1970 ................................ 4,093 2,139 1,290 428 235 8.6 4.9 1,811 550 1,228 5041971 ................................ 5,016 2,245 1,585 668 519 11.3 6.3 2,323 590 1,472 63019722 ............................... 4,882 2,242 1,472 601 566 12.0 6.2 2,108 641 1,456 67719732 ............................... 4,365 2,224 1,314 483 343 10.0 5.2 1,694 683 1,340 6491974 ................................ 5,156 2,604 1,597 574 381 9.8 5.2 2,242 768 1,463 6811975 ................................ 7,929 2,940 2,484 1,303 1,203 14.2 8.4 4,386 827 1,892 8231976 ................................ 7,406 2,844 2,196 1,018 1,348 15.8 8.2 3,679 903 1,928 8951977 ................................ 6,991 2,919 2,132 913 1,028 14.3 7.0 3,166 909 1,963 95319782 ............................... 6,202 2,865 1,923 766 648 11.9 5.9 2,585 874 1,857 8851979 ................................ 6,137 2,950 1,946 706 535 10.8 5.4 2,635 880 1,806 817
1980 ................................ 7,637 3,295 2,470 1,052 820 11.9 6.5 3,947 891 1,927 8721981 ................................ 8,273 3,449 2,539 1,122 1,162 13.7 6.9 4,267 923 2,102 9811982 ................................ 10,678 3,883 3,311 1,708 1,776 15.6 8.7 6,268 840 2,384 1,1851983 ................................ 10,717 3,570 2,937 1,652 2,559 20.0 10.1 6,258 830 2,412 1,2161984 ................................ 8,539 3,350 2,451 1,104 1,634 18.2 7.9 4,421 823 2,184 1,1101985 ................................ 8,312 3,498 2,509 1,025 1,280 15.6 6.8 4,139 877 2,256 1,03919862 ............................... 8,237 3,448 2,557 1,045 1,187 15.0 6.9 4,033 1,015 2,160 1,0291987 ................................ 7,425 3,246 2,196 943 1,040 14.5 6.5 3,566 965 1,974 9201988 ................................ 6,701 3,084 2,007 801 809 13.5 5.9 3,092 983 1,809 8161989 ................................ 6,528 3,174 1,978 730 646 11.9 4.8 2,983 1,024 1,843 677
19902 ............................... 7,047 3,265 2,257 822 703 12.0 5.3 3,387 1,041 1,930 6881991 ................................ 8,628 3,480 2,791 1,246 1,111 13.7 6.8 4,694 1,004 2,139 7921992 ................................ 9,613 3,376 2,830 1,453 1,954 17.7 8.7 5,389 1,002 2,285 9371993 ................................ 8,940 3,262 2,584 1,297 1,798 18.0 8.3 4,848 976 2,198 91919942 ............................... 7,996 2,728 2,408 1,237 1,623 18.8 9.2 3,815 791 2,786 6041995 ................................ 7,404 2,700 2,342 1,085 1,278 16.6 8.3 3,476 824 2,525 5791996 ................................ 7,236 2,633 2,287 1,053 1,262 16.7 8.3 3,370 774 2,512 58019972 ............................... 6,739 2,538 2,138 995 1,067 15.8 8.0 3,037 795 2,338 56919982 ............................... 6,210 2,622 1,950 763 875 14.5 6.7 2,822 734 2,132 52019992 ............................... 5,880 2,568 1,832 755 725 13.4 6.4 2,622 783 2,005 469
20002 ............................... 5,655 2,543 1,803 665 644 12.6 5.9 2,492 775 1,957 431
Totalunem-ployed
1 Beginning January 1994 includes persons who completedtemporary jobs.
2 The comparability of historical labor force data has beenaffected at various times by methodological and conceptualchanges. For an explanation, see the Explanatory Notes and
Table 57. Unemployed persons by duration and reason, annual averages, 1948-2000
(Numbers in thousands)
Estimates of Error section of Employment and Earnings,a monthly periodical published by the Bureau of LaborStatistics.
Dash indicates data not available.

193
Table 58. Unemployment rates of persons 25 to 64 years of age by educational attainment andsex, March 1970-2000(Percent)
CollegeLess than 4 years of
Year 4 years of high school, 4 yearshigh school only 1 to 3 years or
more
TOTAL
1970 ........................................................................... 4.6 2.9 2.9 1.31971 ........................................................................... 6.4 4.0 3.7 2.019721 ......................................................................... 5.8 3.9 3.5 2.019731 ......................................................................... 5.4 3.3 2.9 1.71974 ........................................................................... 5.3 3.4 3.4 1.71975 ........................................................................... 10.7 6.9 5.5 2.51976 ........................................................................... 8.6 6.1 5.2 2.41977 ........................................................................... 9.0 5.6 5.0 2.819781 ......................................................................... 7.4 4.5 3.3 2.21979 ........................................................................... 7.2 4.4 3.5 2.1
1980 ........................................................................... 8.4 5.1 4.3 1.91981 ........................................................................... 10.1 6.2 4.5 2.21982 ........................................................................... 12.5 8.5 6.4 3.01983 ........................................................................... 15.8 10.0 7.3 3.51984 ........................................................................... 12.1 7.2 5.3 2.71985 ........................................................................... 11.4 6.9 4.7 2.419861 ......................................................................... 11.6 6.9 4.7 2.31987 ........................................................................... 11.1 6.3 4.5 2.31988 ........................................................................... 9.4 5.4 3.7 1.71989 ........................................................................... 8.9 4.8 3.4 2.2
19901 ......................................................................... 9.6 4.9 3.7 1.91991 ........................................................................... 12.3 6.7 5.0 2.919921 ......................................................................... 13.5 7.7 5.9 2.91993 ........................................................................... 13.0 7.3 5.5 3.219941 ......................................................................... 12.6 6.7 5.0 2.91995 ........................................................................... 10.0 5.2 4.5 2.51996 ........................................................................... 10.9 5.5 4.1 2.219971 ......................................................................... 10.4 5.1 3.8 2.019981 ......................................................................... 8.5 4.8 3.6 1.819991 ......................................................................... 7.7 4.0 3.1 1.9
20001 ......................................................................... 7.9 3.8 3.0 1.5
MenMenMenMenMen
1970 ........................................................................... 4.0 2.4 2.7 1.11971 ........................................................................... 6.0 3.6 3.5 1.819721 ......................................................................... 5.4 3.6 3.1 1.919731 ......................................................................... 5.0 2.8 2.8 1.61974 ........................................................................... 4.7 3.1 2.9 1.51975 ........................................................................... 10.5 6.7 5.1 2.21976 ........................................................................... 8.3 5.8 5.1 2.21977 ........................................................................... 8.6 5.1 4.5 2.419781 ......................................................................... 7.1 4.2 3.1 1.91979 ........................................................................... 6.6 4.2 3.2 1.7
1980 ........................................................................... 8.2 5.3 4.4 1.71981 ........................................................................... 10.2 6.6 4.4 1.91982 ........................................................................... 12.7 9.3 6.8 2.91983 ........................................................................... 16.1 11.9 8.4 3.41984 ........................................................................... 12.3 8.1 5.2 2.71985 ........................................................................... 11.2 7.2 4.5 2.419861 ......................................................................... 11.7 7.4 4.7 2.31987 ........................................................................... 11.2 6.7 5.0 2.51988 ........................................................................... 10.0 6.2 3.9 1.61989 ........................................................................... 9.4 5.4 3.2 2.3
See footnote at end of table.

194
Table 58. Unemployment rates of persons 25 to 64 years of age by educational attainment and sex,March 1970-2000—Continued(Percent)
CollegeLess than 4 years of
Year 4 years of high school, 4 yearshigh school only 1 to 3 years or
more
Men—Continued
19901 ......................................................................... 9.6 5.3 3.9 2.11991 ........................................................................... 13.4 7.7 5.2 3.21992 ........................................................................... 14.8 8.8 6.4 3.21993 ........................................................................... 14.1 8.7 6.3 3.419941 ......................................................................... 12.8 7.2 5.3 2.91995 ........................................................................... 10.9 5.7 4.4 2.619961 ......................................................................... 11.0 6.4 4.5 2.319971 ......................................................................... 9.9 5.6 4.0 2.119981 ......................................................................... 8.0 5.1 3.7 1.719991 ......................................................................... 7.0 4.1 3.2 1.9
20001 ......................................................................... 7.1 3.9 3.1 1.6
Women
1970 ........................................................................... 5.7 3.6 3.1 1.91971 ........................................................................... 7.2 4.5 4.3 2.419721 ......................................................................... 6.6 4.3 4.2 2.319731 ......................................................................... 6.2 3.9 3.0 2.11974 ........................................................................... 6.4 3.8 4.4 2.11975 ........................................................................... 10.5 7.1 6.3 3.41976 ........................................................................... 9.2 6.5 5.5 2.71977 ........................................................................... 9.7 6.2 5.7 3.619781 ......................................................................... 7.9 4.9 3.6 2.61979 ........................................................................... 8.3 4.7 3.8 2.8
1980 ........................................................................... 8.9 5.0 4.1 2.21981 ........................................................................... 10.0 5.8 4.6 2.71982 ........................................................................... 12.2 7.8 5.3 3.31983 ........................................................................... 15.3 8.0 6.0 3.71984 ........................................................................... 11.7 6.3 5.3 2.71985 ........................................................................... 11.7 6.5 4.8 2.519861 ......................................................................... 11.4 6.3 4.8 2.41987 ........................................................................... 10.9 5.8 4.0 2.11988 ........................................................................... 8.5 4.6 3.4 1.91989 ........................................................................... 8.1 4.2 3.7 2.0
19901 ......................................................................... 9.5 4.6 3.5 1.71991 ........................................................................... 10.7 5.5 4.8 2.519921 ......................................................................... 11.4 6.5 5.3 2.51993 ........................................................................... 11.2 5.8 4.6 2.919941 ......................................................................... 12.4 6.2 4.7 2.91995 ........................................................................... 8.6 4.6 4.5 2.41996 ........................................................................... 10.7 4.4 3.8 2.119971 ......................................................................... 11.3 4.5 3.6 2.019981 ......................................................................... 9.3 4.4 3.5 1.919991 ......................................................................... 8.8 3.9 3.0 1.9
20001 ......................................................................... 9.1 3.6 2.9 1.4
1 Data on educational attainment, beginning in 1992, re-flect degrees or diplomas received rather than years of schoolcompleted and are not strictly comparable with data for prioryears. In addition, the comparability of historical labor forcedata has been affected at various times by methodological
and conceptual changes. For an explanation, see the Ex-planatory Notes and Estimates of Error section of Employ-ment and Earnings, a monthly periodical published by theBureau of Labor Statistics.
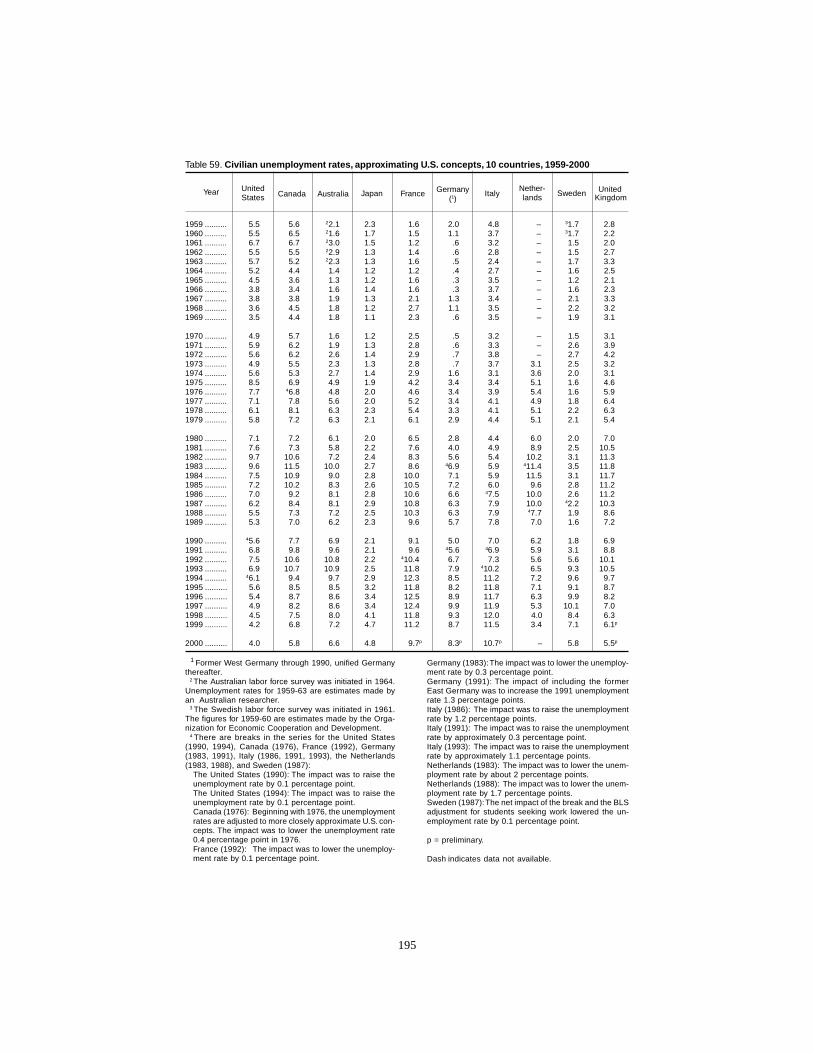
195
Table 59. Civilian unemployment rates, approximating U.S. concepts, 10 countries, 1959-2000
United Nether-States lands Kingdom
1959 .......... 5.5 5.6 22.1 2.3 1.6 2.0 4.8 – 31.7 2.81960 .......... 5.5 6.5 21.6 1.7 1.5 1.1 3.7 – 31.7 2.21961 .......... 6.7 6.7 23.0 1.5 1.2 .6 3.2 – 1.5 2.01962 .......... 5.5 5.5 22.9 1.3 1.4 .6 2.8 – 1.5 2.71963 .......... 5.7 5.2 22.3 1.3 1.6 .5 2.4 – 1.7 3.31964 .......... 5.2 4.4 1.4 1.2 1.2 .4 2.7 – 1.6 2.51965 .......... 4.5 3.6 1.3 1.2 1.6 .3 3.5 – 1.2 2.11966 .......... 3.8 3.4 1.6 1.4 1.6 .3 3.7 – 1.6 2.31967 .......... 3.8 3.8 1.9 1.3 2.1 1.3 3.4 – 2.1 3.31968 .......... 3.6 4.5 1.8 1.2 2.7 1.1 3.5 – 2.2 3.21969 .......... 3.5 4.4 1.8 1.1 2.3 .6 3.5 – 1.9 3.1
1970 .......... 4.9 5.7 1.6 1.2 2.5 .5 3.2 – 1.5 3.11971 .......... 5.9 6.2 1.9 1.3 2.8 .6 3.3 – 2.6 3.91972 .......... 5.6 6.2 2.6 1.4 2.9 .7 3.8 – 2.7 4.21973 .......... 4.9 5.5 2.3 1.3 2.8 .7 3.7 3.1 2.5 3.21974 .......... 5.6 5.3 2.7 1.4 2.9 1.6 3.1 3.6 2.0 3.11975 .......... 8.5 6.9 4.9 1.9 4.2 3.4 3.4 5.1 1.6 4.61976 .......... 7.7 46.8 4.8 2.0 4.6 3.4 3.9 5.4 1.6 5.91977 .......... 7.1 7.8 5.6 2.0 5.2 3.4 4.1 4.9 1.8 6.41978 .......... 6.1 8.1 6.3 2.3 5.4 3.3 4.1 5.1 2.2 6.31979 .......... 5.8 7.2 6.3 2.1 6.1 2.9 4.4 5.1 2.1 5.4
1980 .......... 7.1 7.2 6.1 2.0 6.5 2.8 4.4 6.0 2.0 7.01981 .......... 7.6 7.3 5.8 2.2 7.6 4.0 4.9 8.9 2.5 10.51982 .......... 9.7 10.6 7.2 2.4 8.3 5.6 5.4 10.2 3.1 11.31983 .......... 9.6 11.5 10.0 2.7 8.6 46.9 5.9 411.4 3.5 11.81984 .......... 7.5 10.9 9.0 2.8 10.0 7.1 5.9 11.5 3.1 11.71985 .......... 7.2 10.2 8.3 2.6 10.5 7.2 6.0 9.6 2.8 11.21986 .......... 7.0 9.2 8.1 2.8 10.6 6.6 47.5 10.0 2.6 11.21987 .......... 6.2 8.4 8.1 2.9 10.8 6.3 7.9 10.0 42.2 10.31988 .......... 5.5 7.3 7.2 2.5 10.3 6.3 7.9 47.7 1.9 8.61989 .......... 5.3 7.0 6.2 2.3 9.6 5.7 7.8 7.0 1.6 7.2
1990 .......... 45.6 7.7 6.9 2.1 9.1 5.0 7.0 6.2 1.8 6.91991 .......... 6.8 9.8 9.6 2.1 9.6 45.6 46.9 5.9 3.1 8.81992 .......... 7.5 10.6 10.8 2.2 410.4 6.7 7.3 5.6 5.6 10.11993 .......... 6.9 10.7 10.9 2.5 11.8 7.9 410.2 6.5 9.3 10.51994 .......... 46.1 9.4 9.7 2.9 12.3 8.5 11.2 7.2 9.6 9.71995 .......... 5.6 8.5 8.5 3.2 11.8 8.2 11.8 7.1 9.1 8.71996 .......... 5.4 8.7 8.6 3.4 12.5 8.9 11.7 6.3 9.9 8.21997 .......... 4.9 8.2 8.6 3.4 12.4 9.9 11.9 5.3 10.1 7.01998 .......... 4.5 7.5 8.0 4.1 11.8 9.3 12.0 4.0 8.4 6.31999 .......... 4.2 6.8 7.2 4.7 11.2 8.7 11.5 3.4 7.1 6.1p
2000 .......... 4.0 5.8 6.6 4.8 9.7p 8.3p 10.7p – 5.8 5.5p
Canada Australia Japan France ItalyYear UnitedSwedenGermany(1)
1 Former West Germany through 1990, unified Germanythereafter.
2 The Australian labor force survey was initiated in 1964.Unemployment rates for 1959-63 are estimates made byan Australian researcher.
3 The Swedish labor force survey was initiated in 1961.The figures for 1959-60 are estimates made by the Orga-nization for Economic Cooperation and Development.
4 There are breaks in the series for the United States(1990, 1994), Canada (1976), France (1992), Germany(1983, 1991), Italy (1986, 1991, 1993), the Netherlands(1983, 1988), and Sweden (1987):
The United States (1990): The impact was to raise theunemployment rate by 0.1 percentage point.The United States (1994): The impact was to raise theunemployment rate by 0.1 percentage point.Canada (1976): Beginning with 1976, the unemploymentrates are adjusted to more closely approximate U.S. con-cepts. The impact was to lower the unemployment rate0.4 percentage point in 1976.France (1992): The impact was to lower the unemploy-ment rate by 0.1 percentage point.
Germany (1983): The impact was to lower the unemploy-ment rate by 0.3 percentage point.Germany (1991): The impact of including the formerEast Germany was to increase the 1991 unemploymentrate 1.3 percentage points.Italy (1986): The impact was to raise the unemploymentrate by 1.2 percentage points.Italy (1991): The impact was to raise the unemploymentrate by approximately 0.3 percentage point.Italy (1993): The impact was to raise the unemploymentrate by approximately 1.1 percentage points.Netherlands (1983): The impact was to lower the unem-ployment rate by about 2 percentage points.Netherlands (1988): The impact was to lower the unem-ployment rate by 1.7 percentage points.Sweden (1987): The net impact of the break and the BLSadjustment for students seeking work lowered the un-employment rate by 0.1 percentage point.
p = preliminary.
Dash indicates data not available.
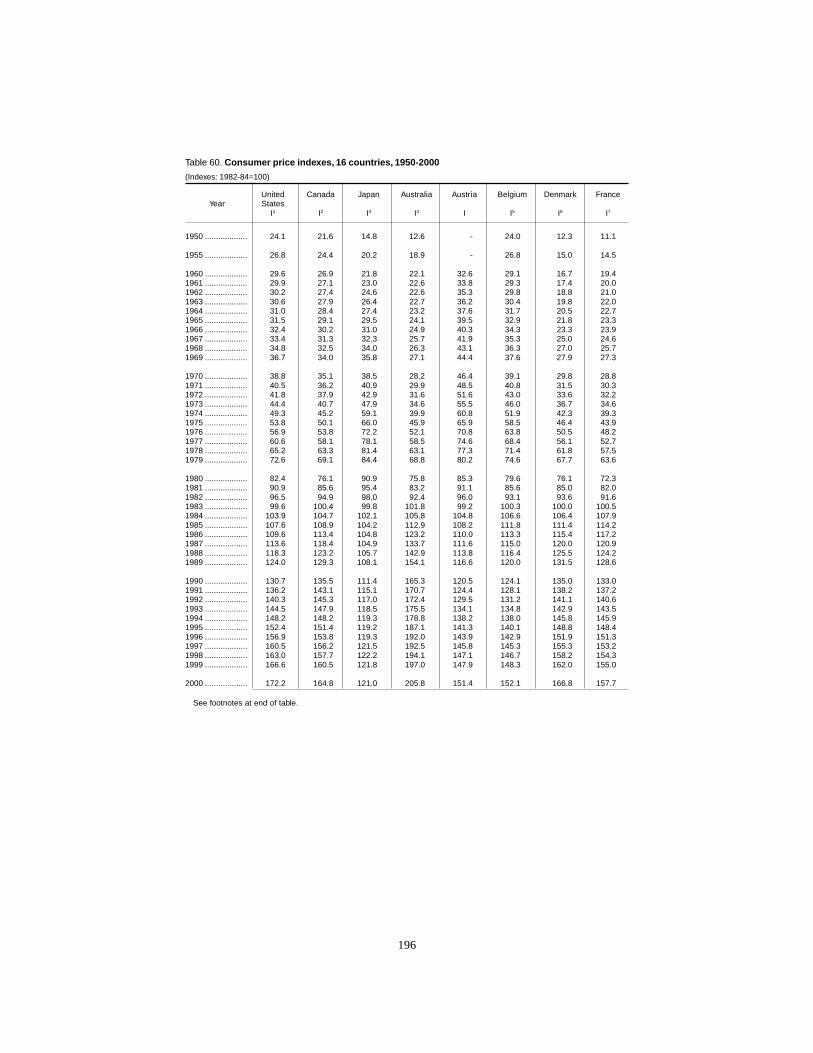
196
United Canada Japan Australia Austria Belgium Denmark FranceYear States
I1 I2 I3 I4 I I5 I6 I7
1950 ................... 24.1 21.6 14.8 12.6 - 24.0 12.3 11.1
1955 ................... 26.8 24.4 20.2 18.9 - 26.8 15.0 14.5
1960 ................... 29.6 26.9 21.8 22.1 32.6 29.1 16.7 19.41961 ................... 29.9 27.1 23.0 22.6 33.8 29.3 17.4 20.01962 ................... 30.2 27.4 24.6 22.6 35.3 29.8 18.8 21.01963 ................... 30.6 27.9 26.4 22.7 36.2 30.4 19.8 22.01964 ................... 31.0 28.4 27.4 23.2 37.6 31.7 20.5 22.71965 ................... 31.5 29.1 29.5 24.1 39.5 32.9 21.8 23.31966 ................... 32.4 30.2 31.0 24.9 40.3 34.3 23.3 23.91967 ................... 33.4 31.3 32.3 25.7 41.9 35.3 25.0 24.61968 ................... 34.8 32.5 34.0 26.3 43.1 36.3 27.0 25.71969 ................... 36.7 34.0 35.8 27.1 44.4 37.6 27.9 27.3
1970 ................... 38.8 35.1 38.5 28.2 46.4 39.1 29.8 28.81971 ................... 40.5 36.2 40.9 29.9 48.5 40.8 31.5 30.31972 ................... 41.8 37.9 42.9 31.6 51.6 43.0 33.6 32.21973 ................... 44.4 40.7 47.9 34.6 55.5 46.0 36.7 34.61974 ................... 49.3 45.2 59.1 39.9 60.8 51.9 42.3 39.31975 ................... 53.8 50.1 66.0 45.9 65.9 58.5 46.4 43.91976 ................... 56.9 53.8 72.2 52.1 70.8 63.8 50.5 48.21977 ................... 60.6 58.1 78.1 58.5 74.6 68.4 56.1 52.71978 ................... 65.2 63.3 81.4 63.1 77.3 71.4 61.8 57.51979 ................... 72.6 69.1 84.4 68.8 80.2 74.6 67.7 63.6
1980 ................... 82.4 76.1 90.9 75.8 85.3 79.6 76.1 72.31981 ................... 90.9 85.6 95.4 83.2 91.1 85.6 85.0 82.01982 ................... 96.5 94.9 98.0 92.4 96.0 93.1 93.6 91.61983 ................... 99.6 100.4 99.8 101.8 99.2 100.3 100.0 100.51984 ................... 103.9 104.7 102.1 105.8 104.8 106.6 106.4 107.91985 ................... 107.6 108.9 104.2 112.9 108.2 111.8 111.4 114.21986 ................... 109.6 113.4 104.8 123.2 110.0 113.3 115.4 117.21987 ................... 113.6 118.4 104.9 133.7 111.6 115.0 120.0 120.91988 ................... 118.3 123.2 105.7 142.9 113.8 116.4 125.5 124.21989 ................... 124.0 129.3 108.1 154.1 116.6 120.0 131.5 128.6
1990 ................... 130.7 135.5 111.4 165.3 120.5 124.1 135.0 133.01991 ................... 136.2 143.1 115.1 170.7 124.4 128.1 138.2 137.21992 ................... 140.3 145.3 117.0 172.4 129.5 131.2 141.1 140.61993 ................... 144.5 147.9 118.5 175.5 134.1 134.8 142.9 143.51994 ................... 148.2 148.2 119.3 178.8 138.2 138.0 145.8 145.91995 ................... 152.4 151.4 119.2 187.1 141.3 140.1 148.8 148.41996 ................... 156.9 153.8 119.3 192.0 143.9 142.9 151.9 151.31997 ................... 160.5 156.2 121.5 192.5 145.8 145.3 155.3 153.21998 ................... 163.0 157.7 122.2 194.1 147.1 146.7 158.2 154.31999 ................... 166.6 160.5 121.8 197.0 147.9 148.3 162.0 155.0
2000 ................... 172.2 164.8 121.0 205.8 151.4 152.1 166.8 157.7
See footnotes at end of table.
Table 60. Consumer price indexes, 16 countries, 1950-2000
(Indexes: 1982-84=100)

197
Unified West Italy Nether- Norway Spain Sweden Switzer- UnitedYear Germany Germany lands land Kingdom
I I8 I9 I10 I11 II12 I I13 I14
1950 ................. 33.9 8.9 21.2 13.6 5.5 13.4 33.2 9.8
1955 ................. 37.3 10.9 24.9 18.4 6.3 17.5 36.0 12.9
1960 ................. 40.9 11.9 28.3 21.1 9.1 21.0 38.2 14.61961 ................. 41.9 12.2 28.6 21.6 9.2 21.5 38.9 15.11962 ................. 43.1 12.7 29.3 22.8 9.7 22.5 40.6 15.81963 ................. 44.4 13.7 30.3 23.4 10.6 23.2 42.0 16.11964 ................. 45.4 14.5 32.0 24.7 11.3 23.9 43.3 16.61965 ................. 46.9 15.2 33.3 25.7 12.8 25.1 44.8 17.41966 ................. 48.6 15.5 35.2 26.6 13.6 26.8 46.9 18.11967 ................. 49.4 16.1 36.4 27.8 14.5 27.9 48.8 18.51968 ................. 50.2 16.3 37.8 28.7 15.2 28.4 50.0 19.41969 ................. 51.1 16.7 40.6 29.6 15.5 29.2 51.3 20.5
1970 ................. 52.8 17.5 42.1 32.8 16.4 31.3 53.1 21.81971 ................. 55.6 18.4 45.3 34.8 17.7 33.6 56.6 23.81972 ................. 58.7 19.4 48.9 37.3 19.2 35.6 60.4 25.51973 ................. 62.8 21.6 52.9 40.1 21.4 38.0 65.7 27.91974 ................. 67.2 25.7 58.1 43.8 24.8 41.7 72.1 32.31975 ................. 71.2 30.0 63.8 49.0 29.0 45.8 76.9 40.11976 ................. 74.2 35.1 69.6 53.5 34.1 50.5 78.2 46.81977 ................. 77.0 41.0 74.1 58.3 42.4 56.3 79.2 54.21978 ................. 79.0 46.0 77.2 63.1 50.8 61.9 80.1 58.71979 ................. 82.3 52.8 80.5 66.1 58.8 66.4 83.0 66.6
1980 ................. 86.7 64.0 86.1 73.3 67.9 75.5 86.3 78.51981 ................. 92.2 75.4 91.9 83.3 77.8 84.6 91.9 87.91982 ................. 97.1 87.8 97.2 92.7 89.0 91.9 97.1 95.41983 ................. 100.3 100.7 99.8 100.5 99.9 100.0 100.0 99.81984 ................. 102.7 111.5 103.0 106.8 111.1 108.1 102.9 104.81985 ................. 104.8 121.8 105.3 112.9 120.9 116.0 106.4 111.11986 ................. 104.7 129.0 105.6 121.0 131.5 121.0 107.2 114.91987 ................. 104.9 135.1 105.1 131.6 138.5 126.1 108.8 119.71988 ................. 106.3 141.9 106.1 140.4 145.1 133.4 110.8 125.61989 ................. 109.2 150.8 107.1 146.8 155.0 142.0 114.3 135.4
1990 ................. 112.1 160.5 109.9 152.8 165.4 156.7 120.5 148.21991 ................. 100.0 116.2 170.6 113.3 158.0 175.2 171.5 127.5 156.91992 ................. 105.1 120.9 179.4 116.9 161.7 185.6 175.6 132.7 162.71993 ................. 109.8 125.2 187.5 120.0 165.4 194.1 183.9 137.0 165.31994 ................. 112.8 128.6 195.0 123.3 167.7 203.3 187.8 138.3 169.31995 ................. 114.7 130.7 205.1 125.7 171.8 212.8 192.4 140.8 175.21996 ................. 116.3 132.4 213.4 128.2 174.0 220.3 193.5 141.9 179.41997 ................. 118.5 134.8 217.7 131.0 178.5 224.8 194.8 142.5 185.11998 ................. 119.7 136.0 222.0 133.6 182.5 228.8 194.2 142.7 191.41999 ................. 120.3 136.9 225.7 136.5 186.7 234.2 195.1 143.8 194.3
2000 ................. 122.6 139.7 231.4 140.0 192.5 242.1 196.9 146.0 200.1
Table 60. Consumer price indexes, 16 countries, 1950-2000—Continued
(Indexes: 1982-84=100)
I = All Households Index, II = Worker Households Index.
1 All urban households from 1978; urban worker house-holds prior to 1978.
2 All households from January 1995; all urban householdsfrom September 1978 to December 1994; and middle in-come urban households prior to September 1978.
3 Excluding agricultural and single person households.4 Urban worker households prior to September 1998.5 Excluding rent and several other services prior to 1976.6 Excluding rent prior to 1964.
7 All households from 1991; urban worker households from1962 to 1990; worker households in Paris only prior to 1962.
8 Refers to the former West Germany. Middle income workerhouseholds prior to 1962.
9 Middle income worker households prior to 1953.10 Middle income worker households prior to 1969.11 Urban worker households prior to 1960.12 Middle income worker households.13 Urban worker households prior to May 1993.14 Excluding pensioner and high income households.

198
Table 61. Hourly compensation costs in U.S. dollars for production workers in manufacturing,29 countries or areas, 1975-99
UnitedCanada Mexico Australia1 Israel Japan Korea
New Singa-Year States Zealand pore
1975 .......... $6.36 $5.96 $1.47 $5.62 $0.76 $2.25 $3.00 $0.32 $3.15 $0.841976 .......... 6.92 7.06 1.64 6.22 .87 2.38 3.25 .42 2.94 .861977 .......... 7.59 7.34 1.34 6.29 1.03 2.68 3.96 .56 3.30 .911978 .......... 8.28 7.42 1.62 7.00 1.18 2.57 5.45 .76 4.06 1.051979 .......... 9.04 7.87 1.91 7.47 1.31 3.30 5.40 1.01 4.62 1.26
1980 .......... 9.87 8.67 2.21 8.47 1.51 3.79 5.52 .96 5.22 1.491981 .......... 10.87 9.57 2.82 9.80 1.55 4.18 6.08 1.02 5.59 1.801982 .......... 11.68 10.45 1.97 9.98 1.66 4.43 5.60 1.09 5.51 1.961983 .......... 12.14 11.16 1.42 9.31 1.51 4.88 6.03 1.15 5.09 2.211984 .......... 12.55 11.15 1.56 9.83 1.58 4.65 6.23 1.20 4.56 2.461985 .......... 13.01 10.95 1.59 8.20 1.73 4.06 6.34 1.23 4.38 2.471986 .......... 13.26 11.07 1.09 8.54 1.88 5.20 9.22 1.31 5.39 2.231987 .......... 13.52 12.02 1.04 9.46 2.09 6.34 10.79 1.59 6.64 2.311988 .......... 13.91 13.47 1.25 11.35 2.40 7.67 12.63 2.20 8.02 2.671989 .......... 14.32 14.72 1.43 12.41 2.79 7.69 12.53 3.17 7.65 3.15
1990 .......... 14.91 15.94 1.58 13.07 3.20 8.55 12.80 3.71 8.17 3.781991 .......... 15.58 17.28 1.84 13.53 3.58 8.79 14.67 4.61 8.20 4.351992 .......... 16.09 17.17 2.17 13.02 3.92 9.09 16.38 5.22 7.76 4.951993 .......... 16.51 16.55 2.40 12.49 4.29 8.82 19.21 5.64 8.85 5.251994 .......... 16.87 15.88 2.47 14.12 4.61 9.19 21.35 6.40 8.76 6.291995 .......... 17.19 16.10 1.51 15.27 4.82 10.54 23.82 7.29 9.91 7.331996 .......... 17.70 16.64 1.54 16.88 5.14 11.32 21.00 8.22 10.81 8.321997 .......... 18.27 16.47 1.78 16.58 5.42 12.04 19.54 7.86 10.81 8.241998 .......... 18.66 15.60 1.84 14.92 5.47 12.02 18.29 5.39 9.01 7.771999 .......... 19.20 15.60 2.12 15.89 5.44 11.91 20.89 6.71 9.14 7.18
SriTaiwan Austria3 Belgium Denmark Finland4 France Germany5 Greece IrelandLanka
1975 .......... $0.28 $0.40 $4.51 $6.41 $6.28 $4.61 $4.52 $6.31 $1.69 $3.031976 .......... .24 .46 4.78 6.90 6.63 5.19 4.70 6.68 1.92 2.861977 .......... .32 .53 5.67 8.29 7.25 5.58 5.21 7.81 2.29 3.121978 .......... .26 .62 6.91 10.14 8.98 5.88 6.43 9.58 2.84 3.971979 .......... .23 .79 7.96 11.82 10.53 7.51 7.69 11.21 3.37 4.85
1980 .......... .22 1.00 8.88 13.11 10.83 8.24 8.94 12.25 3.73 5.951981 .......... .21 1.21 7.78 11.31 9.41 8.04 8.02 10.45 3.66 5.591982 .......... .24 1.24 7.78 9.49 8.87 8.03 7.85 10.28 4.12 5.711983 .......... .25 1.29 7.81 9.08 8.69 7.54 7.74 10.19 3.78 5.671984 .......... .25 1.42 7.35 8.63 8.03 7.77 7.29 9.37 3.74 5.591985 .......... .28 1.50 7.58 8.97 8.13 8.16 7.52 9.53 3.66 5.921986 .......... .29 1.73 10.73 12.43 11.07 10.71 10.28 13.34 4.07 8.021987 .......... .30 2.26 13.67 15.25 14.61 13.44 12.29 16.91 4.61 9.311988 .......... .31 2.81 14.52 15.82 15.19 15.70 12.95 18.16 5.22 10.001989 .......... .31 3.52 14.16 15.48 14.53 16.85 12.65 17.66 5.49 9.61
1990 .......... .35 3.93 17.75 19.17 18.04 21.03 15.49 21.88 6.76 11.661991 .......... .40 4.36 18.09 19.75 18.39 21.25 15.65 22.63 6.95 11.911992 .......... .40 5.09 20.29 22.05 20.20 19.92 17.47 25.38 7.60 13.121993 .......... .42 5.24 20.16 21.44 19.11 16.63 16.79 25.19 7.23 11.901994 .......... .45 5.56 21.55 23.07 20.30 19.06 17.63 26.70 7.73 12.421995 .......... .48 5.94 25.32 26.65 24.07 24.10 20.01 31.58 9.17 13.611996 .......... .48 5.95 24.80 25.97 24.11 23.41 19.93 31.20 9.59 13.911997 .......... .46 5.90 21.97 22.88 22.03 21.32 17.99 27.68 9.20 13.611998 .......... .47 5.27 22.21 23.20 22.69 21.66 18.28 27.52 8.91 13.391999 .......... – 5.62 21.83 22.82 22.96 21.10 17.98 26.93 – 13.57
See footnotes at end of table.
HongKongSAR2

199
Table 61. Hourly compensation costs in U.S. dollars for production workers in manufacturing,29 countries or areas, 1975-99—Continued
Year Italy Norway Portugal Spain Sweden
1975 ............................ $4.67 $6.50 $6.58 $6.77 $1.58 $2.53 $7.18 $6.09 $3.371976 ............................ 4.34 6.99 6.90 7.52 1.66 2.86 8.25 6.45 3.211977 ............................ 4.99 8.06 8.02 8.56 1.58 3.18 8.88 6.88 3.451978 ............................ 5.83 9.86 9.98 9.51 1.63 3.88 9.65 9.59 4.411979 ............................ 7.06 11.12 11.41 10.28 1.68 5.31 11.33 10.56 5.70
1980 ............................ 8.15 12.03 12.06 11.59 2.06 5.89 12.51 11.09 7.561981 ............................ 7.57 9.85 9.91 11.01 2.04 5.55 11.80 10.14 7.311982 ............................ 7.44 8.61 9.78 10.83 1.88 5.28 10.07 10.42 6.921983 ............................ 7.70 8.15 9.49 10.32 1.62 4.56 8.89 10.46 6.491984 ............................ 7.35 7.79 8.70 10.07 1.45 4.47 9.17 9.64 6.041985 ............................ 7.63 7.81 8.75 10.37 1.53 4.66 9.66 9.66 6.271986 ............................ 10.47 10.86 12.22 13.24 2.08 6.25 12.43 13.76 7.661987 ............................ 13.02 13.35 15.14 16.79 2.52 7.63 15.12 17.08 9.091988 ............................ 13.98 14.22 15.83 18.45 2.78 8.55 16.82 18.01 10.611989 ............................ 14.40 13.92 15.00 18.29 2.97 8.96 17.52 16.73 10.56
1990 ............................ 17.45 16.74 18.06 21.47 3.77 11.38 20.93 20.86 12.701991 ............................ 18.32 17.14 18.13 21.63 4.24 12.29 22.15 21.69 13.741992 ............................ 19.35 19.10 20.10 23.03 5.17 13.50 24.59 23.23 14.371993 ............................ 15.80 18.74 19.94 20.21 4.50 11.62 17.59 22.63 12.411994 ............................ 15.89 20.33 20.73 20.97 4.60 11.54 18.62 24.91 12.801995 ............................ 16.22 23.35 24.12 24.38 5.37 12.88 21.44 29.30 13.671996 ............................ 17.75 22.55 23.22 25.05 5.58 13.51 24.37 28.34 14.091997 ............................ 17.57 19.02 20.98 23.72 5.38 12.24 22.22 24.19 15.471998 ............................ 17.11 18.74 21.17 23.50 5.48 12.14 22.02 24.38 16.431999 ............................ 16.60 – 20.94 23.91 – 12.11 21.58 23.56 16.56
UnitedKing-dom
Luxem-bourg
Nether-lands
Switzer-land
1 Production and nonproduction workers other than those inmanagerial, executive, professional, and higher supervisorypositions.
2 Hong Kong Special Administrative Region of China. Aver-age of selected manufacturing industries.
3 Excludes handicraft manufacturers, printing and publish-ing, and miscellaneous manufacturing.
4 Including mining and electrical power plants.
5 Former West Germany. Excluding handicraft manufactur-ers.
Dash indicates data not available.

200
Ger- FormerUnited
Year United Canada Japan Bel- Den- France many West Italy Nether- Norway Swe-King-States gium mark (uni- Ger- lands dendomfied) many
Output per hour
1950 ... _ 26.6 _ _ 22.6 13.2 _ 13.2 11.5 11.3 24.7 19.5 25.51955 ... _ 32.7 8.6 _ 24.6 16.6 _ 19.7 16.1 14.4 28.7 21.3 27.5
1960 ... _ 38.7 13.8 18.0 29.9 21.8 _ 29.2 20.2 18.6 37.0 27.3 31.11961 ... _ 40.8 15.6 18.2 31.6 23.1 _ 30.6 21.8 19.6 38.3 28.7 31.21962 ... _ 44.3 16.4 19.2 33.2 24.7 _ 32.8 24.1 20.4 38.3 30.9 31.91963 ... _ 46.2 17.7 19.9 34.3 26.0 _ 34.1 24.8 21.2 40.3 32.7 33.61964 ... _ 48.2 20.1 21.2 37.1 28.0 _ 37.1 25.0 23.1 42.6 35.5 35.81965 ... _ 50.3 21.0 22.3 38.9 30.0 _ 39.3 27.9 24.7 45.1 38.2 36.81966 ... _ 51.0 23.0 23.8 40.8 32.5 _ 40.9 30.3 26.3 47.0 39.8 38.11967 ... _ 51.5 26.0 25.1 43.8 34.5 _ 43.4 31.8 28.3 48.7 43.2 39.81968 ... _ 54.5 29.1 27.3 47.8 38.1 _ 47.0 34.3 31.8 51.7 47.2 42.71969 ... _ 57.4 33.4 29.9 49.8 40.5 _ 50.4 35.6 34.9 56.5 50.9 43.7
1970 ... _ 56.6 37.5 32.9 52.7 43.0 _ 52.0 37.9 38.1 58.3 52.2 44.71971 ... _ 60.0 39.8 35.1 56.3 45.5 _ 54.0 38.5 40.4 60.0 54.5 46.81972 ... _ 62.7 43.6 39.2 60.8 47.5 _ 57.4 41.7 43.6 63.1 57.2 49.41973 ... _ 66.2 47.6 43.5 66.9 50.9 _ 61.1 45.2 48.3 66.9 61.4 53.01974 ... _ 67.2 48.8 45.8 69.1 52.0 _ 63.2 48.1 51.9 69.5 64.0 53.91975 ... _ 64.7 50.2 47.6 76.1 53.8 _ 65.9 46.5 51.2 68.8 65.0 52.81976 ... _ 70.3 53.2 52.4 78.8 57.1 _ 70.6 52.9 56.8 70.5 66.0 55.01977 ... 68.3 74.9 55.3 55.0 80.4 60.5 _ 72.7 54.0 61.4 71.5 65.0 55.51978 ... 69.2 76.7 57.5 58.3 81.6 63.2 _ 75.2 57.5 65.4 72.8 66.8 56.31979 ... 70.1 75.9 62.2 61.4 85.6 66.2 _ 78.4 63.0 68.6 78.1 72.0 56.7
1980 ... 70.5 75.1 63.2 65.4 90.3 66.5 _ 77.2 65.9 69.2 76.7 73.1 56.11981 ... 74.1 77.8 65.2 70.1 91.8 68.5 _ 78.7 67.4 70.8 76.5 72.7 59.01982 ... 76.2 77.3 67.9 73.5 92.1 73.3 _ 78.8 68.6 72.1 79.7 75.4 62.21983 ... 80.0 82.4 68.8 81.0 96.6 75.0 _ 82.6 71.8 77.8 82.4 80.9 67.11984 ... 83.2 90.2 71.1 85.0 96.1 76.1 _ 85.4 78.4 85.4 87.4 85.2 70.71985 ... 86.0 92.4 76.5 87.0 96.7 79.1 _ 89.1 82.6 89.0 90.2 86.2 72.31986 ... 86.0 90.0 76.1 87.8 91.1 80.4 _ 89.6 83.8 90.8 89.0 87.5 74.81987 ... 92.9 90.6 80.2 88.9 90.6 81.8 _ 88.1 85.7 91.6 93.3 89.2 79.41988 ... 96.9 90.9 83.9 92.0 94.1 87.5 _ 91.5 86.7 93.7 92.2 90.5 82.31989 ... 95.7 93.7 88.5 96.9 99.6 91.9 _ 94.6 89.4 97.1 94.6 93.2 86.1
1990 ... 96.9 95.7 94.4 96.8 99.1 93.5 _ 99.0 92.5 98.6 96.6 94.6 88.31991 ... 97.9 95.3 99.0 99.1 99.6 96.9 99.0 101.9 95.2 99.6 97.5 95.5 92.11992 ... 100.0 100.0 100.0 100.0 100.0 100.0 100.0 100.0 100.0 100.0 100.0 100.0 100.01993 ... 102.1 104.5 101.7 102.5 104.5 100.6 101.8 100.6 102.9 101.4 100.6 107.3 104.01994 ... 107.3 109.9 103.3 108.4 _ 108.5 109.9 107.9 105.6 112.7 101.4 119.4 106.81995 ... 113.8 111.0 111.0 113.2 _ 114.5 112.8 111.2 109.3 117.7 102.0 121.9 104.31996 ... 117.0 109.5 116.1 117.1 _ 115.0 115.3 115.1 109.5 119.7 102.0 124.5 102.31997 ... 121.2 112.8 121.0 126.8 _ 122.6 121.0 121.8 111.5 121.9 103.0 132.9 103.01998 ... 126.8 112.5 121.2 128.8 _ 124.0 121.0 127.1 111.1 124.6 103.9 136.7 102.91999 ... 135.1 115.2 125.8 128.9 _ 128.9 122.4 _ 112.9 127.3 103.9 140.8 107.5
See footnotes at end of table.
Table 62. Output per hour, hourly compensation, and unit labor costs in manufacturing,12 countries, 1950-99
(Indexes: 1992=100)
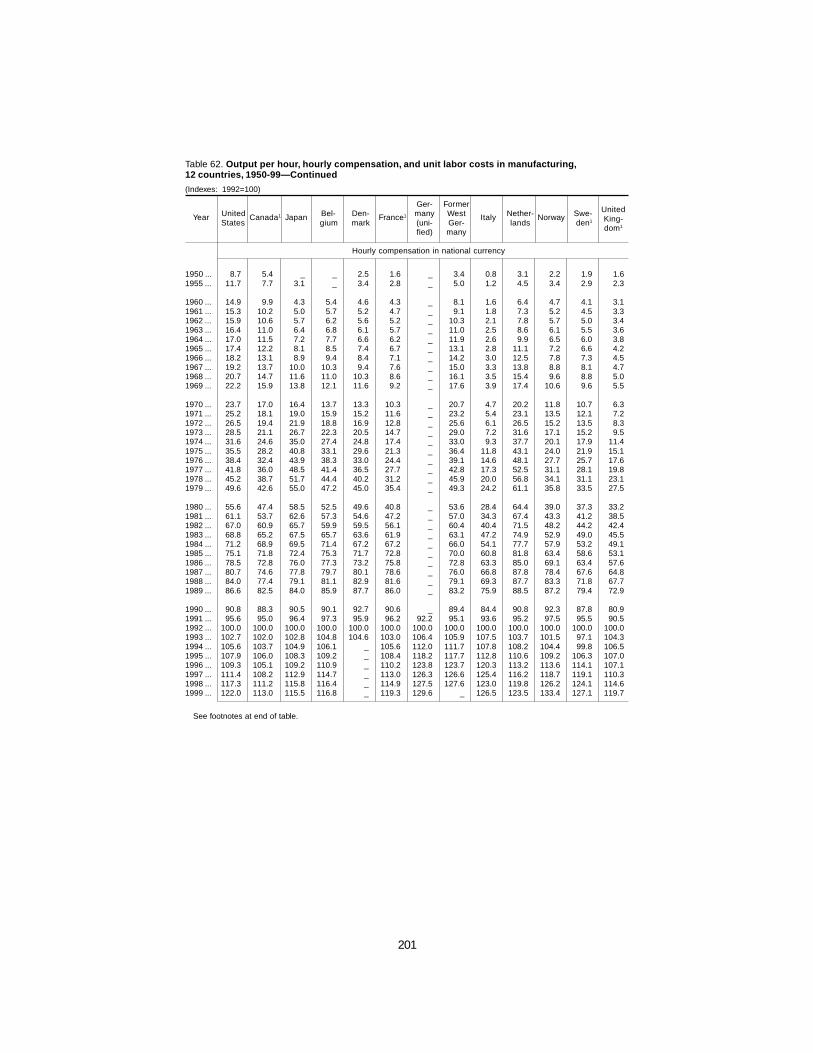
201
Ger- FormerUnited
Year United Canada1 Japan Bel- Den- France1 many West Italy Nether- Norway Swe-King-States gium mark (uni- Ger- lands den1
dom1fied) many
Hourly compensation in national currency
1950 ... 8.7 5.4 _ _ 2.5 1.6 _ 3.4 0.8 3.1 2.2 1.9 1.61955 ... 11.7 7.7 3.1 _ 3.4 2.8 _ 5.0 1.2 4.5 3.4 2.9 2.3
1960 ... 14.9 9.9 4.3 5.4 4.6 4.3 _ 8.1 1.6 6.4 4.7 4.1 3.11961 ... 15.3 10.2 5.0 5.7 5.2 4.7 _ 9.1 1.8 7.3 5.2 4.5 3.31962 ... 15.9 10.6 5.7 6.2 5.6 5.2 _ 10.3 2.1 7.8 5.7 5.0 3.41963 ... 16.4 11.0 6.4 6.8 6.1 5.7 _ 11.0 2.5 8.6 6.1 5.5 3.61964 ... 17.0 11.5 7.2 7.7 6.6 6.2 _ 11.9 2.6 9.9 6.5 6.0 3.81965 ... 17.4 12.2 8.1 8.5 7.4 6.7 _ 13.1 2.8 11.1 7.2 6.6 4.21966 ... 18.2 13.1 8.9 9.4 8.4 7.1 _ 14.2 3.0 12.5 7.8 7.3 4.51967 ... 19.2 13.7 10.0 10.3 9.4 7.6 _ 15.0 3.3 13.8 8.8 8.1 4.71968 ... 20.7 14.7 11.6 11.0 10.3 8.6 _ 16.1 3.5 15.4 9.6 8.8 5.01969 ... 22.2 15.9 13.8 12.1 11.6 9.2 _ 17.6 3.9 17.4 10.6 9.6 5.5
1970 ... 23.7 17.0 16.4 13.7 13.3 10.3 _ 20.7 4.7 20.2 11.8 10.7 6.31971 ... 25.2 18.1 19.0 15.9 15.2 11.6 _ 23.2 5.4 23.1 13.5 12.1 7.21972 ... 26.5 19.4 21.9 18.8 16.9 12.8 _ 25.6 6.1 26.5 15.2 13.5 8.31973 ... 28.5 21.1 26.7 22.3 20.5 14.7 _ 29.0 7.2 31.6 17.1 15.2 9.51974 ... 31.6 24.6 35.0 27.4 24.8 17.4 _ 33.0 9.3 37.7 20.1 17.9 11.41975 ... 35.5 28.2 40.8 33.1 29.6 21.3 _ 36.4 11.8 43.1 24.0 21.9 15.11976 ... 38.4 32.4 43.9 38.3 33.0 24.4 _ 39.1 14.6 48.1 27.7 25.7 17.61977 ... 41.8 36.0 48.5 41.4 36.5 27.7 _ 42.8 17.3 52.5 31.1 28.1 19.81978 ... 45.2 38.7 51.7 44.4 40.2 31.2 _ 45.9 20.0 56.8 34.1 31.1 23.11979 ... 49.6 42.6 55.0 47.2 45.0 35.4 _ 49.3 24.2 61.1 35.8 33.5 27.5
1980 ... 55.6 47.4 58.5 52.5 49.6 40.8 _ 53.6 28.4 64.4 39.0 37.3 33.21981 ... 61.1 53.7 62.6 57.3 54.6 47.2 _ 57.0 34.3 67.4 43.3 41.2 38.51982 ... 67.0 60.9 65.7 59.9 59.5 56.1 _ 60.4 40.4 71.5 48.2 44.2 42.41983 ... 68.8 65.2 67.5 65.7 63.6 61.9 _ 63.1 47.2 74.9 52.9 49.0 45.51984 ... 71.2 68.9 69.5 71.4 67.2 67.2 _ 66.0 54.1 77.7 57.9 53.2 49.11985 ... 75.1 71.8 72.4 75.3 71.7 72.8 _ 70.0 60.8 81.8 63.4 58.6 53.11986 ... 78.5 72.8 76.0 77.3 73.2 75.8 _ 72.8 63.3 85.0 69.1 63.4 57.61987 ... 80.7 74.6 77.8 79.7 80.1 78.6 _ 76.0 66.8 87.8 78.4 67.6 64.81988 ... 84.0 77.4 79.1 81.1 82.9 81.6 _ 79.1 69.3 87.7 83.3 71.8 67.71989 ... 86.6 82.5 84.0 85.9 87.7 86.0 _ 83.2 75.9 88.5 87.2 79.4 72.9
1990 ... 90.8 88.3 90.5 90.1 92.7 90.6 _ 89.4 84.4 90.8 92.3 87.8 80.91991 ... 95.6 95.0 96.4 97.3 95.9 96.2 92.2 95.1 93.6 95.2 97.5 95.5 90.51992 ... 100.0 100.0 100.0 100.0 100.0 100.0 100.0 100.0 100.0 100.0 100.0 100.0 100.01993 ... 102.7 102.0 102.8 104.8 104.6 103.0 106.4 105.9 107.5 103.7 101.5 97.1 104.31994 ... 105.6 103.7 104.9 106.1 _ 105.6 112.0 111.7 107.8 108.2 104.4 99.8 106.51995 ... 107.9 106.0 108.3 109.2 _ 108.4 118.2 117.7 112.8 110.6 109.2 106.3 107.01996 ... 109.3 105.1 109.2 110.9 _ 110.2 123.8 123.7 120.3 113.2 113.6 114.1 107.11997 ... 111.4 108.2 112.9 114.7 _ 113.0 126.3 126.6 125.4 116.2 118.7 119.1 110.31998 ... 117.3 111.2 115.8 116.4 _ 114.9 127.5 127.6 123.0 119.8 126.2 124.1 114.61999 ... 122.0 113.0 115.5 116.8 _ 119.3 129.6 _ 126.5 123.5 133.4 127.1 119.7
See footnotes at end of table.
Table 62. Output per hour, hourly compensation, and unit labor costs in manufacturing,12 countries, 1950-99—Continued
(Indexes: 1992=100)

202
Ger- FormerUnited
Year United Canada1 Japan Bel- Den- France1 many West Italy Nether- Norway Swe-King-States gium mark (uni- Ger- lands den1
dom1fied) many
Hourly compensation in U.S. dollars
1950 ... 8.7 6.0 _ _ 2.2 2.4 _ 1.3 1.7 1.4 1.9 2.1 2.51955 ... 11.7 9.4 1.1 _ 3.0 4.3 _ 1.9 2.4 2.1 2.9 3.3 3.6
1960 ... 14.9 12.4 1.5 3.5 4.0 4.6 _ 3.0 3.2 3.0 4.1 4.6 4.91961 ... 15.3 12.2 1.8 3.7 4.5 5.1 _ 3.5 3.5 3.5 4.5 5.0 5.21962 ... 15.9 12.0 2.0 4.0 4.9 5.6 _ 4.0 4.1 3.8 5.0 5.6 5.51963 ... 16.4 12.3 2.2 4.4 5.4 6.1 _ 4.3 4.9 4.2 5.3 6.2 5.71964 ... 17.0 12.9 2.5 5.0 5.8 6.6 _ 4.7 5.2 4.8 5.6 6.8 6.11965 ... 17.4 13.6 2.8 5.5 6.4 7.2 _ 5.1 5.5 5.4 6.2 7.5 6.61966 ... 18.2 14.6 3.1 6.1 7.3 7.6 _ 5.5 5.9 6.1 6.8 8.2 7.21967 ... 19.2 15.4 3.5 6.7 8.1 8.2 _ 5.9 6.5 6.7 7.6 9.1 7.31968 ... 20.7 16.5 4.1 7.1 8.3 9.2 _ 6.3 7.0 7.5 8.4 9.9 6.81969 ... 22.2 17.8 4.9 7.7 9.3 9.4 _ 7.0 7.6 8.5 9.3 10.8 7.4
1970 ... 23.7 19.7 5.8 8.9 10.7 9.9 _ 8.9 9.2 9.8 10.3 12.0 8.61971 ... 25.2 21.7 6.9 10.5 12.4 11.1 _ 10.4 10.8 11.6 11.9 13.8 10.01972 ... 26.5 23.7 9.1 13.7 14.7 13.4 _ 12.6 12.8 14.5 14.3 16.5 11.81973 ... 28.5 25.5 12.5 18.5 20.5 17.5 _ 17.1 15.1 20.0 18.5 20.3 13.21974 ... 31.6 30.3 15.2 22.6 24.6 19.2 _ 19.9 17.7 24.7 22.6 23.5 15.11975 ... 35.5 33.5 17.4 29.0 31.1 26.3 _ 23.1 22.3 30.1 28.6 30.8 19.01976 ... 38.4 39.8 18.8 31.9 32.9 27.0 _ 24.3 21.7 32.0 31.6 34.3 17.91977 ... 41.8 41.0 22.9 37.1 36.7 29.8 _ 28.8 24.2 37.6 36.3 36.7 19.61978 ... 45.2 41.0 31.4 45.4 44.1 36.7 _ 35.8 29.0 46.2 40.4 40.2 25.11979 ... 49.6 43.9 32.0 51.7 51.6 44.0 _ 42.0 35.9 53.5 43.9 45.6 33.0
1980 ... 55.6 49.0 32.7 57.7 53.2 51.1 _ 46.1 40.8 57.0 49.0 51.4 43.71981 ... 61.1 54.1 36.0 49.5 46.2 46.0 _ 39.3 37.1 47.4 46.9 47.4 44.11982 ... 67.0 59.6 33.4 42.1 43.0 45.1 _ 38.8 36.8 47.1 46.4 41.0 42.01983 ... 68.8 63.9 36.0 41.3 42.0 43.0 _ 38.6 38.2 46.1 45.0 37.2 39.01984 ... 71.2 64.3 37.1 39.7 39.2 40.7 _ 36.3 37.9 42.6 44.1 37.5 37.21985 ... 75.1 63.5 38.5 40.8 40.9 42.9 _ 37.2 39.2 43.3 45.8 39.7 39.01986 ... 78.5 63.3 57.2 55.6 54.6 57.9 _ 52.4 52.3 61.1 58.0 51.8 47.81987 ... 80.7 68.0 68.2 68.6 70.6 69.2 _ 66.0 63.5 76.2 72.3 62.1 60.21988 ... 84.0 76.0 78.2 70.9 74.3 72.5 _ 70.4 65.5 78.0 79.3 68.2 68.31989 ... 86.6 84.1 77.1 70.1 72.3 71.4 _ 69.1 68.1 73.4 78.4 71.6 67.7
1990 ... 90.8 91.5 79.1 86.6 90.4 88.0 _ 86.4 86.8 87.7 91.7 86.4 81.71991 ... 95.6 100.1 90.8 91.5 90.5 90.2 86.7 89.4 92.9 89.4 93.3 91.9 90.51992 ... 100.0 100.0 100.0 100.0 100.0 100.0 100.0 100.0 100.0 100.0 100.0 100.0 100.01993 ... 102.7 95.5 117.3 97.4 97.4 96.2 100.4 100.0 84.2 98.1 88.8 72.6 88.71994 ... 105.6 91.7 130.1 102.1 _ 100.8 107.8 107.6 82.4 104.6 91.9 75.3 92.41995 ... 107.9 93.3 146.2 119.1 _ 115.1 128.9 128.3 85.3 121.2 107.1 86.7 95.61996 ... 109.3 93.1 127.2 115.1 _ 114.1 128.5 128.4 96.1 118.0 109.3 99.1 94.71997 ... 111.4 94.4 118.3 103.0 _ 102.5 113.7 114.0 90.7 104.6 104.1 90.7 102.31998 ... 117.3 90.6 112.0 103.0 _ 103.1 113.1 113.3 87.3 106.2 103.8 90.9 107.51999 ... 122.0 91.9 128.8 99.2 _ 102.6 110.3 _ 85.8 105.0 106.2 89.5 109.6
See footnotes at end of table.
Table 62. Output per hour, hourly compensation, and unit labor costs in manufacturing,12 countries, 1950-99—Continued
(Indexes: 1992=100)

203
Ger- FormerUnited
Year United Canada1 Japan Bel- Den- France1 many West Italy Nether- Norway Swe-King-States gium mark (uni- Ger- lands den1
dom1fied) many
Unit labor costs in national currency
1950 ... _ 20.3 _ _ 11.0 12.2 _ 25.5 7.3 27.5 8.9 9.5 6.31955 ... _ 23.5 36.4 _ 13.8 17.0 _ 25.4 7.5 31.3 11.7 13.8 8.3
1960 ... _ 25.6 31.3 30.1 15.4 19.5 _ 27.8 7.9 34.4 12.8 15.0 9.81961 ... _ 25.0 32.1 31.5 16.3 20.3 _ 29.7 8.1 37.1 13.5 15.6 10.51962 ... _ 23.9 34.9 32.1 17.0 21.1 _ 31.5 8.6 38.2 14.9 16.2 10.81963 ... _ 23.8 36.1 34.2 17.9 21.8 _ 32.2 9.9 40.4 15.1 16.9 10.71964 ... _ 23.8 35.8 36.3 17.9 22.0 _ 32.1 10.5 42.9 15.2 16.9 10.71965 ... _ 24.2 38.7 38.3 18.9 22.3 _ 33.3 10.1 45.1 15.9 17.4 11.41966 ... _ 25.6 38.9 39.6 20.5 21.8 _ 34.7 9.9 47.3 16.7 18.2 11.91967 ... _ 26.7 38.5 40.9 21.4 22.1 _ 34.5 10.4 48.8 18.0 18.7 11.71968 ... _ 26.9 40.0 40.3 21.6 22.6 _ 34.3 10.2 48.4 18.7 18.5 11.71969 ... _ 27.6 41.4 40.4 23.4 22.7 _ 35.0 10.9 50.0 18.8 18.8 12.5
1970 ... _ 30.1 43.8 41.7 25.2 24.0 _ 39.8 12.4 52.9 20.3 20.6 14.11971 ... _ 30.2 47.8 45.2 27.1 25.5 _ 42.9 14.1 57.1 22.5 22.2 15.41972 ... _ 31.0 50.1 47.9 27.8 26.9 _ 44.7 14.6 60.8 24.1 23.6 16.81973 ... _ 32.0 56.2 51.2 30.6 28.8 _ 47.5 15.8 65.3 25.5 24.8 17.91974 ... _ 36.6 71.8 59.9 35.9 33.5 _ 52.1 19.4 72.7 28.9 27.9 21.11975 ... _ 43.6 81.3 69.5 38.9 39.5 _ 55.2 25.4 84.3 34.8 33.7 28.71976 ... _ 46.2 82.6 73.1 41.8 42.7 _ 55.4 27.7 84.8 39.3 38.9 31.91977 ... 61.2 48.1 87.6 75.3 45.4 45.8 _ 58.8 32.1 85.5 43.5 43.3 35.71978 ... 65.3 50.5 89.8 76.1 49.3 49.4 _ 61.1 34.7 86.8 46.8 46.6 41.11979 ... 70.7 56.0 88.4 76.8 52.5 53.5 _ 62.9 38.4 89.0 45.8 46.6 48.5
1980 ... 78.8 63.2 92.5 80.3 55.0 61.3 _ 69.4 43.1 93.0 50.8 51.0 59.11981 ... 82.4 69.0 96.0 81.7 59.5 69.0 _ 72.4 50.9 95.1 56.6 56.6 65.31982 ... 87.9 78.8 96.7 81.5 64.6 76.5 _ 76.7 58.9 99.2 60.5 58.7 68.21983 ... 86.0 79.0 98.0 81.1 65.8 82.6 _ 76.4 65.7 96.2 64.2 60.7 67.81984 ... 85.6 76.3 97.7 84.0 69.9 88.2 _ 77.3 68.9 90.9 66.3 62.5 69.41985 ... 87.3 77.7 94.6 86.5 74.2 92.0 _ 78.6 73.5 91.8 70.2 68.0 73.51986 ... 91.2 81.0 99.9 88.0 80.4 94.3 _ 81.2 75.6 93.7 77.7 72.4 77.01987 ... 86.9 82.4 97.0 89.7 88.4 96.1 _ 86.3 78.0 95.9 84.1 75.8 81.61988 ... 86.7 85.2 94.3 88.1 88.2 93.3 _ 86.5 79.9 93.6 90.4 79.4 82.31989 ... 90.5 88.0 94.9 88.7 88.1 93.6 _ 87.9 84.9 91.1 92.2 85.1 84.7
1990 ... 93.7 92.3 95.9 93.0 93.6 96.8 _ 90.3 91.3 92.1 95.6 92.9 91.71991 ... 97.6 99.7 97.4 98.1 96.3 99.3 93.1 93.3 98.4 95.5 100.0 100.0 98.21992 ... 100.0 100.0 100.0 100.0 100.0 100.0 100.0 100.0 100.0 100.0 100.0 100.0 100.01993 ... 100.6 97.6 101.1 102.3 100.1 102.4 104.5 105.3 104.4 102.3 100.9 90.5 100.31994 ... 98.5 94.3 101.5 97.9 93.0 97.3 101.9 103.6 102.1 96.0 102.9 83.5 99.71995 ... 94.8 95.5 97.6 96.4 93.8 94.7 104.7 105.9 103.2 94.0 107.0 87.2 102.61996 ... 93.5 95.9 94.0 94.7 100.9 95.9 107.4 107.5 109.9 94.5 111.4 91.7 104.81997 ... 91.9 95.9 93.3 90.5 102.0 92.2 104.4 103.9 112.4 95.3 115.2 89.6 107.11998 ... 92.5 98.8 95.5 90.3 102.8 92.7 105.3 100.4 110.8 96.1 121.5 90.8 111.41999 ... 90.3 98.1 91.8 90.6 108.9 92.6 105.9 _ 112.0 97.0 128.4 90.3 111.4
See footnotes at end of table.
Table 62. Output per hour, hourly compensation, and unit labor costs in manufacturing,12 countries, 1950-99—Continued
(Indexes: 1992=100)

204
Ger- FormerUnited
Year United Canada1 Japan Bel- Den- France1 many West Italy Nether- Norway Swe-King-States gium mark (uni- Ger- lands den1
dom1fied) many
Unit labor costs in U.S. dollars
1950 ... _ 22.5 _ _ 9.6 18.5 _ 9.5 14.4 12.7 7.8 10.7 10.01955 ... _ 28.8 12.8 _ 12.0 25.7 _ 9.4 14.8 14.5 10.2 15.5 13.2
1960 ... _ 32.0 11.0 19.4 13.5 21.1 _ 10.4 15.6 16.0 11.2 16.9 15.61961 ... _ 29.8 11.3 20.3 14.3 21.9 _ 11.6 16.0 18.0 11.8 17.6 16.71962 ... _ 27.0 12.3 20.7 14.9 22.8 _ 12.3 17.1 18.7 12.9 18.3 17.21963 ... _ 26.7 12.7 22.0 15.7 23.5 _ 12.6 19.7 19.8 13.1 18.9 17.01964 ... _ 26.7 12.5 23.5 15.6 23.7 _ 12.6 20.7 20.9 13.2 19.1 17.01965 ... _ 27.1 13.6 24.8 16.5 24.0 _ 13.0 19.9 22.0 13.8 19.6 18.01966 ... _ 28.7 13.6 25.6 17.9 23.5 _ 13.6 19.5 23.0 14.5 20.6 18.91967 ... _ 29.9 13.5 26.5 18.5 23.7 _ 13.5 20.5 23.8 15.6 21.1 18.31968 ... _ 30.2 14.1 25.9 17.4 24.2 _ 13.4 20.3 23.5 16.2 20.9 15.91969 ... _ 31.0 14.6 25.9 18.8 23.1 _ 13.9 21.3 24.3 16.4 21.1 16.9
1970 ... _ 34.8 15.5 27.0 20.3 23.0 _ 17.1 24.4 25.7 17.6 23.1 19.21971 ... _ 36.1 17.4 29.9 22.1 24.5 _ 19.3 28.1 28.8 19.9 25.3 21.31972 ... _ 37.8 21.0 35.0 24.1 28.2 _ 21.9 30.8 33.3 22.7 28.9 23.81973 ... _ 38.6 26.3 42.4 30.7 34.4 _ 28.0 33.5 41.3 27.6 33.1 24.81974 ... _ 45.2 31.2 49.5 35.6 36.9 _ 31.5 36.8 47.6 32.5 36.7 28.01975 ... _ 51.8 34.8 60.9 40.9 48.8 _ 35.1 47.9 58.7 41.5 47.4 36.11976 ... _ 56.6 35.3 60.9 41.8 47.3 _ 34.4 41.1 56.5 44.8 52.0 32.61977 ... 61.2 54.7 41.5 67.6 45.7 49.3 _ 39.6 44.8 61.3 50.8 56.4 35.31978 ... 65.3 53.5 54.6 77.8 54.1 58.1 _ 47.6 50.4 70.7 55.5 60.1 44.61979 ... 70.7 57.8 51.3 84.2 60.3 66.5 _ 53.6 57.0 78.0 56.2 63.3 58.3
1980 ... 78.8 65.3 51.8 88.3 58.9 76.8 _ 59.6 62.0 82.3 63.9 70.2 77.91981 ... 82.4 69.5 55.2 70.6 50.4 67.1 _ 49.9 55.1 66.9 61.3 65.1 74.81982 ... 87.9 77.2 49.2 57.2 46.7 61.6 _ 49.3 53.6 65.3 58.2 54.4 67.41983 ... 86.0 77.5 52.3 51.0 43.4 57.4 _ 46.7 53.3 59.3 54.7 46.1 58.21984 ... 85.6 71.2 52.2 46.8 40.8 53.5 _ 42.4 48.4 49.8 50.5 44.0 52.61985 ... 87.3 68.7 50.3 46.9 42.3 54.2 _ 41.7 47.5 48.7 50.8 46.1 54.01986 ... 91.2 70.4 75.2 63.4 60.0 72.1 _ 58.5 62.4 67.3 65.3 59.2 64.01987 ... 86.9 75.1 85.0 77.2 77.9 84.6 _ 74.9 74.1 83.2 77.5 69.6 75.81988 ... 86.7 83.6 93.2 77.0 79.0 82.9 _ 76.9 75.6 83.2 86.1 75.4 83.01989 ... 90.5 89.8 87.1 72.3 72.6 77.6 _ 73.0 76.2 75.5 82.9 76.8 78.6
1990 ... 93.7 95.6 83.8 89.5 91.3 94.1 _ 87.3 93.8 88.9 95.0 91.3 92.61991 ... 97.6 105.1 91.7 92.3 90.8 93.1 87.6 87.8 97.6 89.8 95.7 96.3 98.31992 ... 100.0 100.0 100.0 100.0 100.0 100.0 100.0 100.0 100.0 100.0 100.0 100.0 100.01993 ... 100.6 91.4 115.4 95.1 93.2 95.6 98.6 99.4 81.8 96.8 88.3 67.7 85.31994 ... 98.5 83.4 125.9 94.2 88.3 92.9 98.2 99.8 78.1 92.8 90.7 63.1 86.51995 ... 94.8 84.1 131.7 105.2 101.1 100.6 114.2 115.5 78.0 103.0 105.0 71.1 91.71996 ... 93.5 85.0 109.6 98.3 105.0 99.2 111.5 111.6 87.8 98.6 107.1 79.6 92.61997 ... 91.9 83.6 97.7 81.2 93.1 83.6 94.0 93.5 81.3 85.9 101.0 68.3 99.31998 ... 92.5 80.5 92.4 80.0 92.6 83.2 93.5 89.1 78.6 85.2 100.0 66.5 104.51999 ... 90.3 79.8 102.4 76.9 94.1 79.6 90.1 _ 75.9 82.4 102.2 63.6 102.0
Table 62. Output per hour, hourly compensation, and unit labor costs in manufacturing,12 countries, 1950-99—Continued
(Indexes: 1992=100)
1Compensation adjusted to include changes in employmenttaxes that are not compensation to employees, but are laborcosts to employers.
Dash indicates data not available.
NOTE: The data relate to employees (wage and salaryearners) in Belgium, Denmark, and Italy; and to all employedpersons (employees and self-employed workers) in the othercountries.