Report on Geotechnical Assessment Proposed 132/33 kV ...
60
Report on Geotechnical Assessment Proposed 132/33 kV Substation 21 Waterloo Road, Macquarie Park Prepared for Ausgrid Project 86471.00 August 2018
Transcript of Report on Geotechnical Assessment Proposed 132/33 kV ...
Report on Geotechnical Assessment
Proposed 132/33 kV Substation 21 Waterloo Road, Macquarie Park
Prepared for Ausgrid
Project 86471.00 August 2018

Geotechnical Assessment, Proposed 132/33 kV Substation 86471.00.R.001.Rev0 21 Waterloo Road, Macquarie Park August 2018
Table of Contents
Page
1. Introduction..................................................................................................................................... 1
2. Previous Investigations .................................................................................................................. 2
3. Site Description and Geology......................................................................................................... 2
4. Field Work Methods ....................................................................................................................... 3
5. Field Work Results ......................................................................................................................... 4
6. Laboratory Testing ......................................................................................................................... 7
6.1 Rock Core ............................................................................................................................ 7
6.2 Soil Samples – Chemical Analysis ...................................................................................... 7
6.3 Soil Samples – Mechanical Analysis ................................................................................... 7
7. Proposed Development .................................................................................................................. 8
8. Geotechnical Model ....................................................................................................................... 8
8.1 Historical Geotechnical Model ............................................................................................. 8
8.2 Current Geotechnical Model ................................................................................................ 8
9. Comments ...................................................................................................................................... 9
9.1 Site Classification ................................................................................................................. 9
9.2 Site Preparation and Trafficability ......................................................................................10
9.3 Excavation .........................................................................................................................11
9.3.1 Methods ................................................................................................................11
9.3.2 Vibration Control ...................................................................................................11
9.3.3 Disposal of Excavated Material .............................................................................12
9.3.4 Groundwater .........................................................................................................12
9.3.5 Excavation Slopes ................................................................................................13
9.4 Excavation Support ............................................................................................................13
9.4.1 General .................................................................................................................13
9.4.2 Shoring Design and Retaining Walls ....................................................................14
9.5 Foundations .......................................................................................................................15
9.6 Materials Re-Use ...............................................................................................................16
9.7 Floor Slab and Pavement Design Parameters ..................................................................16
9.8 Seismic Design ..................................................................................................................17
10. References ................................................................................................................................... 17
11. Limitations .................................................................................................................................... 17

Geotechnical Assessment, Proposed 132/33 kV Substation 86471.00.R.001.Rev0 21 Waterloo Road, Macquarie Park August 2018
Appendix A: About This Report
Appendix B: Drawings
Appendix C: Site Photographs
Appendix D: Field Work Results
Appendix E: Laboratory Test Results

Page 1 of 19
Geotechnical Assessment, Proposed 132/33 kV Substation 86471.00.R.001.Rev0 21 Waterloo Road, Macquarie Park August 2018
Report on Geotechnical Assessment
Proposed 132/33 kV Substation
21 Waterloo Road, Macquarie Park
1. Introduction
This report presents the results of a geotechnical assessment undertaken for a proposed 132/33kV
Substation to be constructed adjacent to an existing substation at 21 Waterloo Road, Macquarie Park.
The investigation was commissioned in an email dated 28 June 2018 by Mr Paul Hurst of Ausgrid and
was undertaken in accordance with Douglas Partners Pty Ltd (DP) proposal SYD180586 dated
22 June 2018.
The proposed substation footprint is between Waterloo Road and an existing operational substation to
the north-east.
It is understood that the proposed development will include:
shallow excavations for a transformer yard, with 2 transformer bays;
shallow excavations for a control room, on the northern side of the development footprint;
excavations for a single-level cable basement below a switchroom, with the basement floor level
understood to be no deeper than RL45.5 m, relative to the Australian Height Datum (m AHD);
shallow excavations for cable trenches, to link into an existing 11 kV cable pit (south-west of the
proposed substation); and
construction of a 132/33 kV switchroom over the cable basement footprint, and construction of
the control room, with the switchroom and control room proposed to have a design floor level of
approximately RL49.5 m.
Site investigation (including hand augered and machine drilled boreholes) was carried out to provide
detailed sub-surface information on the depth to rock within the development footprint, and to obtain
soil and rock samples for logging, testing and waste classification purposes. The objective of the
geotechnical assessment is to confirm the site geotechnical model.
The investigation included borehole drilling, installation of a standpipe piezometer, and laboratory
testing of selected groundwater, soil and rock samples. The field work was conducted in conjunction
with a Preliminary Site Investigation and Limited Stage 2 Contamination Investigation, and Preliminary
Waste Classification, which are both reported separately (DP reports 86471.01.R.001.Rev0 and
86471.01.R.002.Rev0, dated August 2018).
The details of the field work and laboratory testing are presented in this report, together with
comments and recommendations relating to design and construction practice.
Page 2 of 19
Geotechnical Assessment, Proposed 132/33 kV Substation 86471.00.R.001.Rev0 21 Waterloo Road, Macquarie Park August 2018
2. Previous Investigations
Documents supplied indicate that previous geotechnical and environmental site investigations were
completed at the site in 1997 and 2000 by Jeffery and Katauskas Pty Ltd (J&K), and in 2000 by
Environmental Investigation Services Pty Ltd (EIS: a division of J&K) and Golder Associates Pty Ltd
(Golder). It is noted that the drilling results from the 1997 geotechnical investigation were included as
an appendix within the J&K report prepared for Enerserve (Report reference 15400SLrpt, dated
9 September 2000).
The previous geotechnical and environmental investigations completed for the wider substation
development site are understood to have included a total of 19 boreholes by J&K (including three
boreholes cored into the underlying rock: Boreholes 1, 3 and 7), 5 boreholes by EIS, and 22 test pits
by Golder. The boreholes and test pits completed in close proximity to the proposed substation
development footprint are shown on Drawing 1.
The 2000 J&K report Section 3.1 indicates that previous cut and fill earthworks at the site resulted in a
‘benched’ profile, with temporary batters ranging up to 4 m high and grades of around 1(H):1(V).
Excavations for a cable trench, a pit with sloping side batters, and exposed sandstone which were
noted on several of the J&K test location plans (e.g. Figure 7) were not observed during the current
field work. It is assumed that the “3m deep pit” shown on the Golder site plan was for the cable pit
excavation, which is located adjacent to the southern property boundary along Waterloo Road.
It is understood that two trenches have recently been excavated by Ausgrid (to about 3 m depth),
using non-destructive digging (NDD) methods, to expose the buried high voltage cables. The
locations of both trenches are shown on Drawing 1. It is assumed that these trenches were
terminated within the filling, with logs for these trenches not available at the time of reporting. It is
noted that logs for five boreholes completed by EIS were not included in their report (i.e. Boreholes
BH A to BH E), and that the log for test pit TP17 was omitted from the Golder report.
The Golder test pits (excavated with a trailer-mounted backhoe) generally reached refusal to the
backhoe bucket at or up to 0.3 m below the top of sandstone. The 2000 J&K report Section 3.4 notes
that the Golder logs were for “environmental investigation purposes and therefore they do not show
the detail that would be expected with geotechnical logging”, that the Golder test pit logs “did not have
any surface reduced levels”, and that the Golder test location plan is “not to scale and therefore the
locations of these test pits can only be approximated”.
3. Site Description and Geology
The site, identified as Lot 1 in DP 1006960, includes an existing, active substation (Macquarie Park
Substation, ZN 8000), with street address 21 Waterloo Road, Macquarie Park. Industrial and
commercial properties are located adjacent to the site. A review of aerial imagery indicates that the
site was developed into a substation around 2003.
The proposed substation footprint is within a grass-covered area, on the eastern side of an existing
concrete driveway and locked access gate and south-west of the existing substation control room and
live transformer yards (refer Plate 1 in Appendix C). It is understood that this area was filled to the
current surface levels using site-won materials, after completion of the previous geotechnical reports

Page 3 of 19
Geotechnical Assessment, Proposed 132/33 kV Substation 86471.00.R.001.Rev0 21 Waterloo Road, Macquarie Park August 2018
(i.e. after the year 2000), with these filling materials placed over existing filling materials, which are
inferred to also have been sourced from the site.
The proposed development area has plan dimensions of approximately 25 m (parallel to Waterloo
Road) by 40 m. The western part of the site is relatively flat, with a gradual slope down to the south
and east. To the east the ground surface slopes towards a small car parking area and a concrete
driveway (refer Plate 2). The provided site survey drawing indicates that surface levels within the
development footprint vary between RL49.9 m to RL47.0 m (north-west to south-east corners,
respectively).
A buried stormwater service transects the proposed footprint, with a buried fire hydrant pipe adjacent
to the north-western corner of the development footprint.
Reference to the Sydney 1:100 000 Geological Series Sheet (Geological Survey of NSW:
Reference 1) indicates that the site is underlain by Hawkesbury Sandstone of Triassic age, which
typically comprises medium to coarse grained quartz sandstone, very minor shale and laminite lenses.
A review of the NSW Acid Sulfate Soil Risk Map for Prospect/Parramatta River (Reference 2) indicates
that the site is not located within an area of known acid sulfate soil risk.
4. Field Work Methods
The field work was undertaken over two days between 10 and 11 July 2018, and included:
scanning for buried services using a scanning sub-contractor;
excavation using non-destructive digging (NDD) techniques of two ‘L’-shaped test trenches
adjacent to proposed machine-drilled borehole locations;
reinstatement of the NDD trenches using certified clean sand backfilling, compacted in layers
using hand compaction equipment (i.e. ‘wacker packer’);
excavation of five hand augered boreholes HA1 to HA5, to depths of 0.4 – 0.6 m;
drilling of two boreholes (BH01 and BH02) using a track-mounted drilling rig, to depths of 7.33 m
and 7.0 m (respectively);
installation of a standpipe piezometer within Borehole BH01, screened within the sandstone
(refer to borehole log for well construction details);
groundwater observations during NDD excavations and drilling;
sampling of soils during drilling for geotechnical, contamination and waste classification purposes;
measurement of the groundwater level and developing of the groundwater well on 17 July 2018;
and
measurement of the groundwater level and sampling of the groundwater well on 24 July 2018.
The two machine-drilled boreholes were advanced within the soils and the upper 0.3 m to 0.7 m of the
underlying extremely low to very low strength sandstone using auger drilling methods, with both
boreholes deepened into the underlying extremely low and higher strength rock using NMLC diamond

Page 4 of 19
Geotechnical Assessment, Proposed 132/33 kV Substation 86471.00.R.001.Rev0 21 Waterloo Road, Macquarie Park August 2018
core drilling techniques. The boreholes drilled using hand tools encountered shallow refusal on coarse
inclusions within the filling, such as gravel, cobbles and boulders (0.4 m to 0.6 m total drilled depths).
Logging of the soil and rock materials within the boreholes was undertaken in general accordance with
Australian Standard AS 1726 - 2017 (Reference 3), with observations made during NDD excavation
utilised to supplement observations made during borehole drilling.
All field work was carried out under the full-time supervision of a geotechnical engineer. Co-ordinates
and surface levels of the test locations were obtained using a high-precision differential GPS, and
checked using measurements relative to surveyed site features. The inferred accuracy of the co-
ordinates is 0.1 m in both plan and elevation. The positions of the boreholes, and the scaled locations
of previous boreholes and test pits from the 1997 and 2000 site investigations, are shown on
Drawing 1, Appendix B.
Further details of the methods and procedures employed in the investigation are presented in the
attached Notes About This Report.
5. Field Work Results
The subsurface conditions encountered in the boreholes are presented on the attached borehole logs
in Appendix D, along with standard notes defining the descriptive terms and the classification methods
used, and core photographs from boreholes BH01 and BH02. Site photographs are presented in
Appendix C. A cross-section through the development footprint is presented as Drawing 2, in
Appendix B.
The subsurface conditions encountered in the boreholes can be summarised as:
FILLING: silty clay topsoil with some rootlets (0.1 m thick), over silty clay, sandy clay and
clay filling with concrete and brick fragments, and cobbles and boulders of
sandstone and siltstone, to 3.5 m depth (elevation of RL46.0 m to RL46.9 m),
damp to moist, generally firm to stiff (inclusive of filling placed after the
completion of the previous geotechnical site investigations in the year 2000);
over
RESIDUAL CLAY: stiff, brown, slightly silty clay with trace ironstone gravel, damp, 0.3 m thick (to
an elevation of RL45.7 m, possibly filling: encountered at the base of a former
pit shown on Drawing 7 of the J&K report); over
SANDSTONE: extremely low to very low strength, medium grained sandstone, becoming high
strength and moderately weathered within 0.95 m below the top of rock. It is
noted that intervals of extremely low and low strength sandstone (0.4 – 0.6 m
thick) were encountered within both cored boreholes.
It is understood that records of earthworks compaction and/or density testing records for the filling
material were not available at the time of reporting. The variability of the encountered materials
suggests that the filling material across the site is “uncontrolled filling”, in that it has not been placed
and compacted with Level 1 earthworks inspections and testing, as defined in Australian Standard
AS 3798 – 2007 “Guidelines on earthworks for commercial and residential developments”
(Reference 4).

Page 5 of 19
Geotechnical Assessment, Proposed 132/33 kV Substation 86471.00.R.001.Rev0 21 Waterloo Road, Macquarie Park August 2018
The surface levels and depths at which various materials were encountered in the current boreholes
during the investigation are summarised in Table 1. Depths of various materials from selected
historical site investigations (assuming surface levels for previous investigations are within about 0.3 m
below the current ground surface levels) are summarised in Table 2. Details for Bore E and Test Pit
TP17 are not included in Table 2, as no investigation logs were included in the various supplied
reports.
Table 1: Borehole Surface levels and Summary of Subsurface Profile
Borehole Surface RL
(m AHD)
Top of Residual Clay Top of Weathered Sandstone
Depth (m) RL (AHD) Depth (m) RL (AHD)
BH01 49.5 3.5 46.0 3.8 45.7
BH02 49.6 ne ne 2.7 46.9
HA1 48.5 > 0.4 < 48.1 ne ne
HA2 47.6 > 0.55 < 47.0 ne ne
HA3 49.7 > 0.5 < 49.2 ne ne
HA4 48.2 > 0.6 < 47.6 ne ne
HA5 49.6 > 0.4 < 49.2 ne ne
Notes: “ne” indicates Not Encountered
Table 2: Summary of Historical Site Investigation Data
Historical
Test
Location
Historical
Surface
Level
(m AHD)
Top of Residual Clay
(m AHD)
Top of Weathered
Sandstone
(m AHD)
Interpolated
Current
Surface
Level
(m AHD) Depth (m) RL (m AHD) Depth (m) RL (m AHD)
TP1 48.53 0.8 47.7
3 1.4 47.1
3 48.0
TP2 49.13 1.2 47.9
3 2.0 47.1
3 49.3
TP3 50.03 1.5 48.5
3 2.2 47.8
3 50.2
TP15 49.73 1.5 45.9
3 2.4 47.3
3 49.8
TP16 47.43 0.8 46.6
3 1.4 46.0
3 47.5
TP18 49.93 2.4 47.5
3 3.0 46.9
3 49.9
TP19 50.03 2.0 48.0
3 2.6 47.4
3 50.1
Bore 1 48.5 1.6 46.9 2.0 46.5 48.6
Bore 2 49.7 1.7 48.0 2.3 47.4 49.9
Bore 6 44.5 ne1 ne 1.5 43.0 45.0
Bore 7 46.5 0.5 46.0 0.8 45.7 45.4
Bore 201 46.3 ne1 ne 0.3 46.0 46.4

Page 6 of 19
Geotechnical Assessment, Proposed 132/33 kV Substation 86471.00.R.001.Rev0 21 Waterloo Road, Macquarie Park August 2018
Historical
Test
Location
Historical
Surface
Level
(m AHD)
Top of Residual Clay
(m AHD)
Top of Weathered
Sandstone
(m AHD)
Interpolated
Current
Surface
Level
(m AHD) Depth (m) RL (m AHD) Depth (m) RL (m AHD)
Bore 206 50.0 ne1 ne 1.4 48.6 50.1
Bore 207 49.8 1.5 48.3 2.5 47.3 50.1
Bore 208 49.7 1.2 48.5 3.32 46.4 49.9
Bore 209 49.1 ne1 ne 1.0 48.1 49.4
Notes: (1) “ne” indicates Not Encountered. (2) Extremely low strength bands above this depth within the residual clay. (3) Level inferred.
Groundwater was not observed within the recent boreholes during auger drilling or NDD excavation,
and the use of water as a drilling fluid during coring of the rock prevented further groundwater
observations. Measurement of the standpipe piezometer installed within Borehole BH01 was
completed on 17 July 2018 and 24 July 2018 (i.e. between one and two weeks following installation
and development of the piezometer). The water level measurements are presented in Table 3.
Table 3: Groundwater Measurements in Standpipe Piezometer
Borehole
Surface
RL
(m AHD)
Groundwater Measurements
Stratum Notes for
Groundwater 17 July 2018 24 July 2018
Depth
(m)
RL (m
AHD)
Depth
(m)
RL (m
AHD)
BH01 49.5 6.0 43.5 5.0 44.5
Within sandstone. Closely
spaced clay seams and
rock defects between
5.3 - 5.9 m depth
Only two of the nearby historical site investigations encountered groundwater during auger drilling.
The measurements within these two boreholes (Bore 2 and Bore 207) are presented in Table 4.
Table 4: Reported Groundwater Measurements from Historical Boreholes, 13 May 1997
Borehole
Surface
RL
(m AHD)
Measurements
Groundwater Notes from Borehole Log Depth (m)
RL (m
AHD)
Bore 2 49.7 2.6 47.1
Within sandstone. Level measured
3.75 hours following completion of auger
drilling, inflow at 4.8 m depth during drilling
Bore 207 49.8 3.6 46.2
Within sandstone. Level measured on
completion of the borehole, with inflow at
4.5 m depth during drilling
Page 7 of 19
Geotechnical Assessment, Proposed 132/33 kV Substation 86471.00.R.001.Rev0 21 Waterloo Road, Macquarie Park August 2018
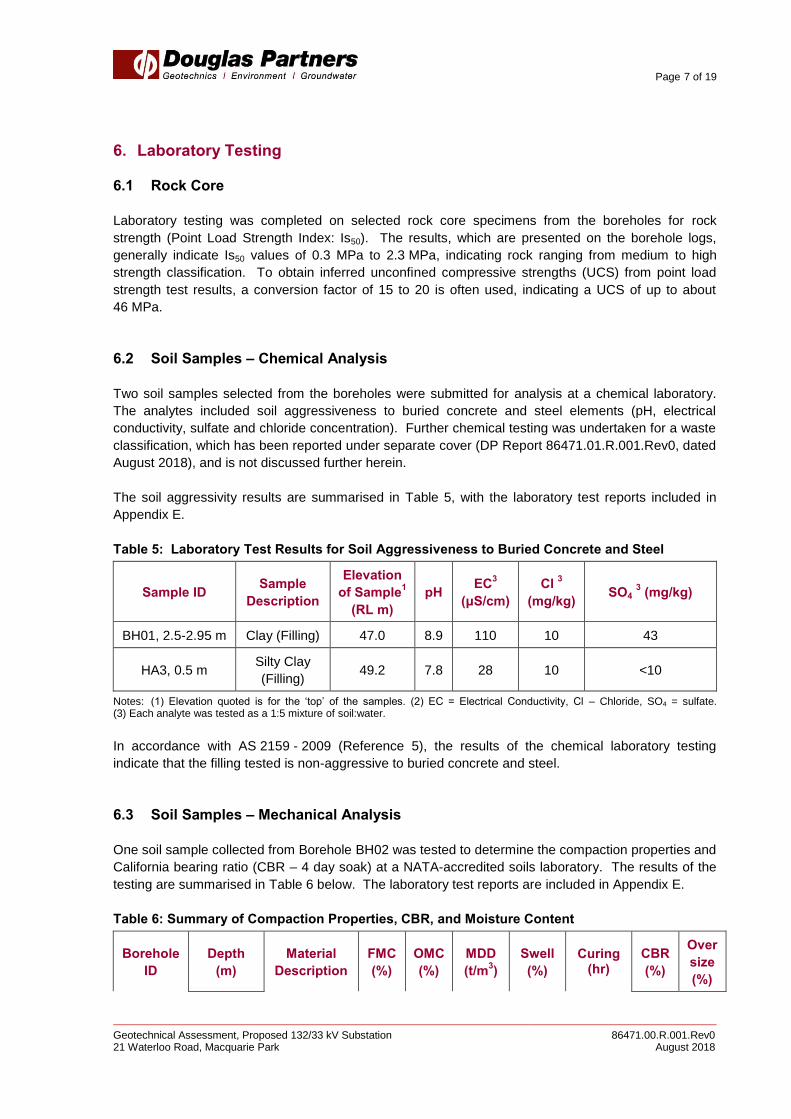
6. Laboratory Testing
6.1 Rock Core
Laboratory testing was completed on selected rock core specimens from the boreholes for rock
strength (Point Load Strength Index: Is50). The results, which are presented on the borehole logs,
generally indicate Is50 values of 0.3 MPa to 2.3 MPa, indicating rock ranging from medium to high
strength classification. To obtain inferred unconfined compressive strengths (UCS) from point load
strength test results, a conversion factor of 15 to 20 is often used, indicating a UCS of up to about
46 MPa.
6.2 Soil Samples – Chemical Analysis
Two soil samples selected from the boreholes were submitted for analysis at a chemical laboratory.
The analytes included soil aggressiveness to buried concrete and steel elements (pH, electrical
conductivity, sulfate and chloride concentration). Further chemical testing was undertaken for a waste
classification, which has been reported under separate cover (DP Report 86471.01.R.001.Rev0, dated
August 2018), and is not discussed further herein.
The soil aggressivity results are summarised in Table 5, with the laboratory test reports included in
Appendix E.
Table 5: Laboratory Test Results for Soil Aggressiveness to Buried Concrete and Steel
Sample ID Sample
Description
Elevation
of Sample1
(RL m)
pH EC
3
(μS/cm)
Cl 3
(mg/kg) SO4
3 (mg/kg)
BH01, 2.5-2.95 m Clay (Filling) 47.0 8.9 110 10 43
HA3, 0.5 m Silty Clay
(Filling) 49.2 7.8 28 10 <10
Notes: (1) Elevation quoted is for the ‘top’ of the samples. (2) EC = Electrical Conductivity, Cl – Chloride, SO4 = sulfate. (3) Each analyte was tested as a 1:5 mixture of soil:water.
In accordance with AS 2159 - 2009 (Reference 5), the results of the chemical laboratory testing
indicate that the filling tested is non-aggressive to buried concrete and steel.
6.3 Soil Samples – Mechanical Analysis
One soil sample collected from Borehole BH02 was tested to determine the compaction properties and
California bearing ratio (CBR – 4 day soak) at a NATA-accredited soils laboratory. The results of the
testing are summarised in Table 6 below. The laboratory test reports are included in Appendix E.
Table 6: Summary of Compaction Properties, CBR, and Moisture Content
Borehole
ID
Depth
(m)
Material
Description
FMC
(%)
OMC
(%)
MDD
(t/m3)
Swell
(%)
Curing (hr)
CBR
(%)
Over
size
(%)

Page 8 of 19
Geotechnical Assessment, Proposed 132/33 kV Substation 86471.00.R.001.Rev0 21 Waterloo Road, Macquarie Park August 2018
Borehole
ID
Depth
(m)
Material
Description
FMC
(%)
OMC
(%)
MDD
(t/m3)
Swell
(%)
Curing (hr)
CBR
(%)
Over
size
(%)
BH02 0.5 – 1.5 Sandy clay
(Filling)
14.6 11.5 1.91 0.5 172 15 5.7
Notes: FMC = Field Moisture Content, OMC = Optimum Moisture Content, MDD = Maximum Dry Density, CBR = California Bearing Ratio, Oversize = material retained on the 19 mm sieve.
7. Proposed Development
It is understood that the proposed development on the southern part of the existing substation site is to
include a transformer yard with two transformer bays, a new 132/33 kV switchroom, and an adjoining
control room. The development includes shallow excavations for a single level cable basement
beneath the switchroom (basement design floor level understood to be no deeper than RL45.5 m),
with a cable trench to link into an existing 11 kV cable pit.
Given the site topography, it is anticipated that excavations for the cable basement will require a 4 m
deep excavation to achieve the design floor level, with further deepening of the excavation to
accommodate floor slabs and footings.
8. Geotechnical Model
8.1 Historical Geotechnical Model
The historical geotechnical model for the proposed switchroom and transformer yard footprint (based
on the J&K report and borehole logs near the proposed development footprint) comprised three
geotechnical units, given below in order of increasing depth below the ground surface:
MATERIAL A: Silty clay or sandy clay filling, with sandstone gravel, to depths of between 1 – 2.5 m;
MATERIAL B: Residual silty clay, with bands of iron cementation or extremely weathered
sandstone, between 0 – 2.2 m thick; over
MATERIAL C: generally described (e.g. in boreholes 208 and 209) as red-brown and grey to
brown, fine to medium grained, extremely low to very low strength sandstone.
8.2 Current Geotechnical Model
Past cut/fill construction activities were noted within a historical geotechnical report (J&K: 2000), with
the original site levels having apparently been extensively modified (i.e. topsoil and residual soils
almost completely removed). The origin of the filling used to level the site at that time was not
included in the report, however, it is likely that site re-profiling utilised site-won material.
Historical and current investigations completed in close proximity to each other (i.e. Borehole BH02
and Test Pit TP15) indicate some variability in the encountered soil profile, however, elevations for the

Page 9 of 19
Geotechnical Assessment, Proposed 132/33 kV Substation 86471.00.R.001.Rev0 21 Waterloo Road, Macquarie Park August 2018
top of rock are similar. Elsewhere, the elevation of the top of rock as encountered in the current
boreholes is similar to the inferred contours for the top of rock presented in Figure 4 of the J&K Report.
These contours indicate the elevation of the top of rock reduces in a southerly direction, in a series of
broad, shallow ‘steps’.
Comparison of historical spot survey levels and surface levels of boreholes with current survey data
supplied by Ausgrid indicates that minimal stripping of filling across the site has occurred. Further, the
survey data indicates that the surface level within a former pit / excavation within the current
development footprint has been raised by about 2.5 m: refer Drawing 2. The origin of the ‘new’ filling
(i.e. post-year 2000) is likely to be from site-won material, sourced from excavations for the substation
which was reportedly constructed circa 2003. Descriptions of filling materials placed prior to and after
the year 2000 are similar, with the exception that the new filling appears to have an increased relative
proportion of sand and demolition rubble (i.e. concrete and brick inclusions). The thickness of filling
and residual soils over weathered sandstone appears to decrease towards the southern side of the
development footprint.
Based on the current and historical geotechnical information for the site, the current geotechnical
model for the proposed development area is considered to comprise three geotechnical units, as
follows (in order of increasing depth below the ground surface: refer to Drawing 2 in Appendix B):
UNIT 1: Silty Clay, Sandy Clay and Clay filling (including topsoil), with brick fragments, and
cobbles and boulders of sandstone and siltstone, to depths of between 2 – 3.5 m;
over
UNIT 2: Clay residual soil with ironstone gravel (up to about 0.5 m thick); over
UNIT 3: Extremely low to very low strength sandstone at depths of between 1.5 – 3.5 m,
becoming high strength within 1 m of the top of rock.
The installed standpipe piezometers, and historical groundwater observations, indicate that
groundwater seepage flow is occurring within the underlying sandstone, likely from rock defects.
Groundwater levels and flow rates are likely to vary over time, depending on downslope drainage and
climatic conditions.
9. Comments
9.1 Site Classification
Uncontrolled filling materials were encountered within the boreholes and test pits at the site,
interpreted to occur to depths of up to 3.5 m below current surface levels. Based on visual
observations and SPT testing, the filling appears to be generally firm to stiff. Some brick and concrete
fragments were observed within the filling in five of the seven test locations (i.e. Boreholes BH01,
BH02, and HA1 to HA3).
As there is more than 0.4 m of clay filling on the site, the site will be classified as Class P, when
assessed in accordance with the requirements of Australian Standard AS 2870 - 2011 “Residential
Slabs and Footings” (Reference 6). It is noted that one small tree is present near to the proposed
development site, with another small tree within the development footprint.

Page 10 of 19
Geotechnical Assessment, Proposed 132/33 kV Substation 86471.00.R.001.Rev0 21 Waterloo Road, Macquarie Park August 2018
The Standard does, however, allow for an alternative site classification, provided the site is assessed
using engineering principles. Due to the relatively shallow depth to rock, and the proposed design
finished levels for the proposed switchroom and cable basement (i.e. at or close to the top of rock),
these structures are likely to be founded on weathered sandstone, for a Class A site. Therefore, the
site classification in the area of the proposed switchroom is considered to be Class P, with an
alternative classification of Class A following site preparation and earthworks.
9.2 Site Preparation and Trafficability
Bulk excavations to around 4 m depth for the cable basement will be within clay and sandy clay filling
with cobbles and boulders of sandstone and siltstone (with brick and concrete inclusions), and through
a thin layer of residual clay. A limited amount of vertical excavation is expected within extremely low
to low strength sandstone near bulk excavation level (BEL: assumed to be at RL45.5 m).
For the construction of pavements and floor slabs the following site preparation measures are
recommended:
Excavate to bulk excavation levels within the pavement and building footprints;
Remove any vegetation or organic filling and any other deleterious materials below design / bulk
excavation levels;
Where rock is not exposed, test roll the exposed surface using a minimum 12 tonne smooth drum
roller in non-vibration mode. The surface should be rolled a minimum of six times with the last
two passes observed by an experienced geotechnical engineer to detect any ‘weak spots’, in
accordance with the project Specification;
Any heaving materials identified during test rolling should be removed as directed by the
geotechnical engineer; and
Placement of suitable filling materials up to design levels, and density testing of the compacted
layers, should be undertaken in accordance with the project Specification.
Access to the proposed development, such as for concrete trucks and other vehicles, is likely to be via
an existing concrete pavement driveway on the western side of the site.
The filling materials are likely to remain trafficable during the construction period under the applied
loading of vehicles with tyres, although some rutting / surface damage is to be expected if traversed
following periods of prolonged rainfall. It may be difficult for machines to access the eastern side of
the site, due to the side slope (approximate grade 4(H):1(V) - refer Photo 4 in Appendix C). It is
suggested a layer of crushed rock or recycled concrete working platform at least 300 mm thick be
placed and compacted on the upper part of the site to improve all-weather trafficability. Consideration
could be given to incorporating this layer of crushed rock or concrete into the final surface layer of the
transformer yard.
For support of mobile crane outriggers on filling materials, thicker working platforms comprising
compacted crushed rockfill are likely to be required. An assessment of the required platform thickness
should be made once mobile crane equipment has been selected. The suitability of the concrete
pavement to take mobile crane outrigger loads will also need to be assessed.

Page 11 of 19
Geotechnical Assessment, Proposed 132/33 kV Substation 86471.00.R.001.Rev0 21 Waterloo Road, Macquarie Park August 2018
9.3 Excavation
9.3.1 Methods
Excavations for the proposed new switchroom, control room and cable basement are expected
through silty clay and sandy clay filling (with cobbles and boulders of sandstone and siltstone), and
within extremely low to very low strength sandstone (to a maximum of approximately 0.5 m below the
top of rock). Minimal excavations are proposed for the transformer yard. Based upon the assumed
cable basement BEL of RL45.5 m, the depth of excavation will be up to about 4 m below existing
surface levels.
The clay filling materials cannot be expected to stand vertically for any length of time. Clay filling and
extremely low to very low strength sandstone is expected to be exposed at the cable basement bulk
level. It is noted that existing buried services (e.g. fire-fighting and stormwater services) are within the
proposed building footprint, and may need to be re-located.
Excavations for proposed cable trenches (to link into the existing cable trench: a further approximately
2.3 m depth of excavation) are expected through sandy clay filling (with cobbles and boulders of
sandstone and siltstone), and then through sand filling (cable trench backfilling). It is anticipated that
clay filling will be exposed along most of the trench length, with the thickness of clay filling and the
depth to the base of the cable trench reducing towards Waterloo Road.
It is considered that excavation of the filling, including of the cobbles and boulders, can be readily
carried out using conventional earthmoving equipment. Some additional allowance should be made
for the on-site handling of these large sandstone pieces. Excavations into the underlying extremely
low and very low strength sandstone for bulk and detailed excavations, such as for footing excavations
or deepening of trenches, are also likely to be readily carried out using conventional earthmoving
equipment. Excavation contractors should make their own assessment of likely productivity
depending on their equipment capabilities and operator skills.
9.3.2 Vibration Control
The use of rock hammers or ripping of low and higher strength rock, such as may be encountered at
the site below an elevation of RL44.8 m, will cause vibrations which, if not controlled, could possibly
result in damage to nearby structures and underground services (e.g. closer than 20 m).
It is assumed that the foundation systems of the nearby substation buildings are founded on low and
medium strength sandstone. It is suggested that vibrations be provisionally limited to a peak particle
velocity (PPV) of 8 mm/s at the ground level of the neighbouring buildings to protect architectural
features, and at cable level within identified underground service trenches. This level complies with
AS/ISO 2631.2 - 2014 (Reference 7) and is well below the normal building damage threshold level.
It is suggested that the client assess whether the proposed vibration limit will have a serviceability
impact on the existing cables nearby. This provisional limit may need to be modified depending on the
result of such assessments. A site specific vibration monitoring trial may be required to determine
vibration attenuation once excavation plant and methods have been finalised.

Page 12 of 19
Geotechnical Assessment, Proposed 132/33 kV Substation 86471.00.R.001.Rev0 21 Waterloo Road, Macquarie Park August 2018
9.3.3 Disposal of Excavated Material
Off-site disposal of excavated material will require assessment for re-use or classification in
accordance with Waste Classification Guidelines (NSW EPA, 2014: Reference 8), prior to disposal to
an appropriately licensed landfill or receiving site. This includes filling and virgin excavated natural
materials (VENM), such as may be removed from this site.
It is noted that chemical analysis was carried out on selected soil and groundwater samples obtained
from boreholes and standpipe piezometers, and that a waste classification has been carried out based
on these test results (refer to DP Report 86471.01.R.002.Rev0, dated August 2018). Subject to the
recommendations given in that report, further environmental testing may need to be carried out to
classify excavated spoil prior to disposal. The type and extent of testing undertaken will depend on
the final use or destination of the spoil, and requirements of the receiving site. The results of the
environmental testing and waste classification are not further discussed herein.
9.3.4 Groundwater
Groundwater was encountered in the current and previous investigation at depths of 2.6 – 6 m
(RL47.1 – 43.5 m). It is likely that the proposed excavation for the cable trenches and cable basement
will not intersect the regional groundwater table (within the sandstone), however, intermittent
groundwater seepage into the cable basement and footing excavations through the soil at the soil-rock
interface below RL44 m, during and after periods of wet weathered, is possible. Some de-watering
during construction will probably be required, possibly prior to placing concrete in foundation
excavations.
Based on experience, it is anticipated that seepage volumes into the cable basement excavation will
be small. If groundwater seepage into the basement is not tolerable then the cable basement will
need to be waterproofed.
If some seepage into the basement is tolerable (i.e. the basement designed for drained conditions), it
can probably be controlled over the long-term via a sub-floor drainage and collection system for
seepage removal and to safeguard against uplift pressures. This could comprise a minimum 100 mm
thick, durable, open-graded, crushed rock layer with subsurface drains and sumps. It is normally
necessary to incorporate provision for regular flushing and cleaning of iron oxide sludge in the
maintenance and design of the sub-floor drainage system.
Groundwater entering excavations and post-construction accumulation of groundwater below the
basement floor will need to be disposed of in accordance with the Protection of the Environment
Operations Act 1997 (POEO Act). Ultimately, this requires that any water discharged into the natural
environment should comply with the Australian and New Zealand Guidelines for Fresh and Marine
Water Quality, Australian and New Zealand Environment and Conservation Council (ANZECC) and
Agricultural and Resource Management Council of Australia and New Zealand.
The above water quality guideline criteria include trigger values for pH, turbidity, nutrients, dissolved
oxygen and faecal coliforms (unlikely to be present in excavation water). An appropriate strategy
would be to carry out testing of groundwater samples during construction to assess its compliance with
the ANZECC water quality guidelines. If the tested water quality complies with the guidelines, it can
normally be pumped directly into the stormwater system, subject to regulatory and Council approvals,
who normally also have limits on dissolved iron. Alternatively, the pumped groundwater seepage

Page 13 of 19
Geotechnical Assessment, Proposed 132/33 kV Substation 86471.00.R.001.Rev0 21 Waterloo Road, Macquarie Park August 2018
would require on-site treatment such as sedimentation and dosing to improve the quality of water to a
sufficient level to comply with the ANZECC requirements before disposal into stormwater, again
subject to appropriate approvals. In some circumstances, if groundwater is substantially
contaminated, it may be necessary to dispose of it off-site as liquid waste or through the sewer via a
trade waste agreement.
9.3.5 Excavation Slopes
It is understood that excavations for the proposed cable basement will be required beneath the
footprint of the switchroom, with a transformer yard proposed to be constructed to the west. Based on
the supplied buried services drawings (“S23336 Reduced file size.pdf”), services are indicated to occur
parallel to and within the Waterloo Road property boundary. On the assumption that the filling soils
beneath the transformer yard are not to be excavated, these documents indicate that there will be
insufficient space between the proposed buildings and transformer yard (western side), and the buried
services along the property boundary (southern side) to enable the excavation faces to be battered to
a safe angle during construction and which will therefore need to be supported. Sufficient space will
exist on the other two sides of the excavation to enable slope batters to be formed, which will require a
mid-height bench with width no less than 1 m.
Suggested temporary and permanent maximum batter slope angles for slopes not exceeding 2 m in
height are presented in Table 7.
Table 7: Recommended Temporary and Permanent Maximum Batter Slopes
Material Batter Slope Ratio (H:V)
Short-term (Temporary) Long-term (Permanent)
Filling, firm to stiff condition 1 : 1 1.5 : 1a
Residual Clay, stiff condition 1 : 1 1.5 : 1a
Extremely low to very low
strength sandstone 0.75 : 1 1 : 1
Notes: (a) 1.5(H):1(V) slope is equivalent to a 34 degree slope, 3(H):1(V) slope if vegetation and maintenance of the batters is required.
Vertical excavations for cable trenches will likely require shoring boxes. Material stockpiles and
machinery / equipment should not be stored at the crest of unsupported excavations.
9.4 Excavation Support
9.4.1 General
As insufficient space exists to batter the western and southern sides of the 4 m deep cable basement
excavation to the recommended slope angles, the excavation will require both temporary and
permanent lateral support, to ensure that excavation stability is maintained.
The shoring / support system considered suitable to retain the soil slope on the western and southern
sides of the cable basement is bored concrete soldier piles, with the ‘gap’ between piles supported

Page 14 of 19
Geotechnical Assessment, Proposed 132/33 kV Substation 86471.00.R.001.Rev0 21 Waterloo Road, Macquarie Park August 2018
using steel mesh-reinforced shotcrete, with short (i.e. 1 m long) steel soil nails or dowels installed into
the filling material, and incorporated into the shotcrete using ‘spider plates’.
Geotechnical inspections must be carried out during excavation, with further stabilisation and drainage
measures to be implemented as required (e.g. strip drains) to maintain appropriate excavation
stability.
9.4.2 Shoring Design and Retaining Walls
Excavation faces retained either temporarily or permanently will be subjected to earth pressures from
the ground surface down to the top of medium strength rock, which for the current site is the full
excavation depth. Retaining walls are also subjected to earth pressures for their full height.
Material and strength parameters that may be used for preliminary design of excavation support
structures and retaining walls (if required) are presented in Table 8 and Table 9. A triangular earth
pressure distribution may be adopted on the rear of the shotcrete. Unless positive drainage measures
can be incorporated to prevent water pressure build up behind the shoring walls, full hydrostatic head
should be allowed for in design while, at the same time, allowing for the soil density to reduce to the
buoyant condition.
The values of active earth pressure coefficient, Ka, to be used for estimating soil pressures, are for a
level ground surface and a flexible wall allowing for some lateral movement. To minimise movement
of adjacent footings, the soil and weathered rock below the foundations should be designed using an
“at rest” lateral earth pressure coefficient (Ko) – refer Table 8.
Table 8: Typical Material and Strength Parameters for Excavation Support Structures – Earth
Pressures
Material Bulk Density
(g: kN/m3)
Coefficient of
Active Earth
Pressure (Ka)
Coefficient of
Earth Pressure
at Rest (Ko)
Ultimate Passive
Earth Pressure
(kPa)
Filling 20 0.3 0.6 -
Residual Clay 20 0.25 0.45 -
Sandstone: EL to VL 22 0.1 0.15 300
Notes: Strength descriptors: EL = Extremely low, VL = Very low
Table 9: Typical Material and Strength Parameters for Excavation Support Structures
Material Type Effective Friction
Angle (f’)
Effective Modulus E’
(MPa) Poisson’s Ratio (n’)
Filling (Clay) 25 4 0.35
Residual Clay 25 8 0.35
Sandstone: EL to VL 30 75 0.15
Notes: Strength descriptors: EL = Extremely low, VL = Very low

Page 15 of 19
Geotechnical Assessment, Proposed 132/33 kV Substation 86471.00.R.001.Rev0 21 Waterloo Road, Macquarie Park August 2018
Design of retaining walls should allow for lateral pressures from surcharge loads above the wall, such
as from sloping ground, traffic loading, or arising from construction plant. The ultimate passive
pressure given in Table 8 should incorporate a suitable factor of safety to limit deflection.
9.5 Foundations
Based upon the results of the investigations, the following materials are anticipated to be encountered
at bulk excavation level:
Cable basement (BEL: RL45.5 m) – residual clay and extremely low to very low strength
sandstone;
Control room (BEL: RL49.0 m) – clay filling; and
Transformer yard (BEL: RL49.0 m) – clay filling.
It is recommended that all footings be taken to sandstone, via driven or bored piles for the control
room and transformer yard, or shallow pad footings for the switchroom and cable basement. The piles
should be socketed into a uniform founding stratum such as low or higher strength sandstone:
Borehole BH01 encountered consistent high strength sandstone at a depth of 1.9 m below the “top of
rock”. An allowance for temporary steel casing may be required for the bored piles, to prevent the
cobbles and boulders from falling into pile holes and creating other challenges. The extremely low to
very low strength sandstone stratum could be used for shallow footings (at basement level), with an
allowable bearing pressure of 1,000 kPa.
Recommended maximum allowable (and ultimate) bearing pressures, shaft adhesions and modulus
values for the rock encountered in boreholes at the site are presented in Table 10. These parameters
apply to the design of socketed bored piles, for the support of axial compression loadings. They can
be adopted on the assumption that the excavations are clean and free of loose debris, with pile
sockets free of smear and adequately roughened immediately prior to concrete placement. For piles
driven to refusal on rock, the structural capacity of the piles is likely to govern design.
Table 10: Recommended Design Parameters and Moduli for Foundation Design
Foundation Stratum1
Allowable
End
Bearing
(MPa)
Ultimate
End
Bearing
(MPa)
Allowable
Shaft
Adhesion
(kPa)
Ultimate
Shaft
Adhesion
(kPa)
Field
Elastic
Modulus
(MPa)
Sandstone – Extremely
low to very low strength 1.0 3.0 75 150 50
Sandstone – Low
Strength 3.5 20 350 800 350
Sandstone – High
Strength 6.0 60 600 1500 900
Notes: (1) Based on Pells et. al (1998).
(2) Shaft adhesion applicable to the design of bored piles, uncased over the rock socket length, where adequate
sidewall cleanliness and roughness are achieved

Page 16 of 19
Geotechnical Assessment, Proposed 132/33 kV Substation 86471.00.R.001.Rev0 21 Waterloo Road, Macquarie Park August 2018
Foundations proportioned using the allowable parameters would be expected to settle less than 1% of
the footing width (or pile diameter) under the applied working load, with differential settlements
between adjacent columns expected to be less than half of this value. An experienced geotechnical
professional should inspect all bored pile excavations prior to the placement of concrete and steel, to
check the adequacy of the foundation material and to undertake spoon testing as appropriate.
Whilst the allowable bearing pressure is not likely to be critical to the design, pile footings taken down
into consistent high strength sandstone could potentially be designed for an allowable bearing
pressure of 6,000 kPa and possibly up to 12,000 kPa, subject to additional investigation or spoon
testing during construction. If higher bearing pressures are used in design, however, then additional
testing will be required in the form of cored boreholes and/or spoon testing of footings, to ensure there
are no defects beneath footings. Alternatively, if a lower allowable bearing pressure of 3,500 kPa is
adopted then testing during construction could be limited to inspection of foundations.
9.6 Materials Re-Use
The provided drawings indicate that placement of filling elsewhere on the site is not proposed as part
of the proposed substation development, and that limited additional new areas of pavement are
proposed.
The materials anticipated to be excavated from within the building footprint (e.g. clay filling, residual
clay and weathered sandstone) are considered to be suitable from a geotechnical perspective for re-
use at the site, however, sieving and segregation / stockpiling of the coarse material (e.g. boulders)
from the filling is likely to be required. Re-use could be considered for new pavement areas, provided
the materials are moisture conditioned prior to compaction, and as general filling for landscaping,
although past experience with these materials indicates the potential for low soil fertility. Cross-fall to
suitable drainage will be required to prevent saturation, waterlogging and softening of the clay.
Further advice should be sought when further details are known, on issues including placement and
test rolling methodologies, required compaction densities and recommended layer thicknesses.
9.7 Floor Slab and Pavement Design Parameters
The floor at basement level can be designed as a slab on ground. The final rock surface (at BEL)
should be trimmed and scraped clean of debris, and the stiff residual clay or clay filling (where it
occurs at BEL) compacted using a smooth drum roller.
Based upon CBR test results from the filling and on residual clay samples from nearby sites, and
allowing for some variability, it is suggested that a design CBR value for the subgrade material and
reworked filling material not exceed 5%. If imported material is used to level the site and form
subgrade levels, the design CBR value will depend on the type of imported material.
The design CBR value is based on the provision of adequate surface and subsoil drainage to maintain
the subgrade as close to the optimum moisture content as possible. Subsoil drainage should be
installed adjacent to pavement edges abutting lawns or garden areas.

Page 17 of 19
Geotechnical Assessment, Proposed 132/33 kV Substation 86471.00.R.001.Rev0 21 Waterloo Road, Macquarie Park August 2018
It will be necessary to provide under-floor drainage to safeguard against uplift pressures if the
basement floor and walls are designed for drained conditions. This could comprise a minimum
100 mm thick, durable open-graded crushed rock with subsurface drains and sumps.
9.8 Seismic Design
In accordance with the Earthquake Loading Standard, AS1170.4 – 2007 (Reference 9), the site has a
hazard factor (z) of 0.08 and a site sub-soil class of shallow soil (Ce), being underlain by materials with
a compressive strength less than 0.8 MPa, and with a surface layer of less than 25 m depth of stiff
cohesive soil.
10. References
1. Herbert C., 1983, Sydney 1:100 000 Geological Sheet 9130, 1st edition. Geological Survey of
New South Wales, Sydney.
2. The Department of Land and Water Conservation, 1997 (Edition 2). 1:25 000 Acid Sulphate Soil
Risk map for Prospect / Parramatta River.
3. Australian Standard AS1726-2017, “Geotechnical Site Investigations”, Standards Australia.
4. Australian Standard AS3798-2007, “Guidelines on Earthworks for commercial and Residential
Developments”, March 2007, Standards Australia.
5. Australian Standard AS2159-2009, “Piling – Design and Installation”, third edition, 2009,
Standards Australia.
6. Australian Standard AS2870-2011, “Residential Slabs and Footings”, April 2011, Standards
Australia.
7. Australian / International Standard AS/ISO 2631.2 – 2014, “Mechanical vibration and shock –
Evaluation of human exposure to whole-body vibration – Vibration in buildings (1 Hz to 80 Hz)”.
8. NSW Environment Protection Authority (EPA), 2014, “Waste Classification Guidelines”.
9. Australian Standard AS1170.4 – 2007, “Structural design actions, Part 4: Earthquake actions in
Australia”.
11. Limitations
Douglas Partners Pty Ltd (DP) has prepared this report for this project at Macquarie Park Substation,
21 Waterloo Road, Macquarie Park, in accordance with DP’s proposal SYD180586 dated
22 June 2018 and acceptance received from Mr Paul Hurst dated 28 June 2018. The work was
carried out under the amended Master Services Agreement – Design and Related Services Panel
(Purchase Order Number 4500978730). This report is provided for the exclusive use of Ausgrid for
this project only and for the purposes as described in the report. It should not be used by or be relied
upon for other projects or purposes on the same or other site or by a third party. Any party so relying
upon this report beyond its exclusive use and purpose as stated above, and without the express

Page 18 of 19
Geotechnical Assessment, Proposed 132/33 kV Substation 86471.00.R.001.Rev0 21 Waterloo Road, Macquarie Park August 2018
written consent of DP, does so entirely at its own risk and without recourse to DP for any loss or
damage. In preparing this report DP has necessarily relied upon information provided by the client
and/or their agents.
The results provided in the report are indicative of the sub-surface conditions on the site only at the
specific sampling and/or testing locations, and then only to the depths investigated and at the time the
work was carried out. Sub-surface conditions can change abruptly due to variable geological
processes and also as a result of human influences. Such changes may occur after DP’s field testing
has been completed.
DP’s advice is based upon the conditions encountered during this investigation. The accuracy of the
advice provided by DP in this report may be affected by undetected variations in ground conditions
across the site between and beyond the sampling and/or testing locations. The advice may also be
limited by budget constraints imposed by others or by site accessibility.
This report must be read in conjunction with all of the attached pages and should be kept in its entirety
without separation of individual pages or sections. DP cannot be held responsible for interpretations
or conclusions made by others unless they are supported by an expressed statement, interpretation,
outcome or conclusion stated in this report.
This report, or sections from this report, should not be used as part of a specification for a project,
without review and agreement by DP. This is because this report has been written as advice and
opinion rather than instructions for construction.
The scope for work for this report did not include the assessment of surface or sub-surface materials
or groundwater for contaminants, with Preliminary Site Investigation and Limited Stage 2
Contamination Investigation, and Preliminary Waste Classification reports produced under separate
covers. Should evidence of filling of unknown origin be noted in the report, and in particular the
presence of building demolition materials, it should be recognised that there may be some risk that
such filling may contain contaminants and hazardous building materials.
Asbestos containing material was not detected by observation from boreholes or at the ground
surface, at the test locations sampled and analysed. Building demolition materials, such as bricks and
concrete fragments, were also located within previous below-ground filling, and these are considered
as indicative of the possible presence of hazardous building materials (HBM), including asbestos.
Although the sampling plan adopted for this investigation is considered appropriate to achieve the
stated project objectives, there are necessarily parts of the site that have not been sampled and
analysed. This is either due to undetected variations in ground conditions or to budget constraints (as
discussed above). It is therefore considered possible that HBM, including asbestos, may be present in
unobserved or untested parts of the site, between and beyond sampling locations, and hence no
warranty can be given that asbestos is not present.
The contents of this report do not constitute formal design components such as are required, by the
Health and Safety Legislation and Regulations, to be included in a Safety Report specifying the
hazards likely to be encountered during construction and the controls required to mitigate risk. This
design process requires risk assessment to be undertaken, with such assessment being dependent
upon factors relating to likelihood of occurrence and consequences of damage to property and to life.
This, in turn, requires project data and analysis presently beyond the knowledge and project role

Page 19 of 19
Geotechnical Assessment, Proposed 132/33 kV Substation 86471.00.R.001.Rev0 21 Waterloo Road, Macquarie Park August 2018
respectively of DP. DP may be able, however, to assist the client in carrying out a risk assessment of
potential hazards contained in the Comments section of this report, as an extension to the current
scope of works, if so requested, and provided that suitable additional information is made available to
DP. Any such risk assessment would, however, be necessarily restricted to the geotechnical /
groundwater components set out in this report and to their application by the project designers to
project design, construction, maintenance and demolition.
Douglas Partners Pty Ltd

Appendix A
About This Report

July 2010
Introduction These notes have been provided to amplify DP's report in regard to classification methods, field procedures and the comments section. Not all are necessarily relevant to all reports. DP's reports are based on information gained from limited subsurface excavations and sampling, supplemented by knowledge of local geology and experience. For this reason, they must be regarded as interpretive rather than factual documents, limited to some extent by the scope of information on which they rely. Copyright This report is the property of Douglas Partners Pty Ltd. The report may only be used for the purpose for which it was commissioned and in accordance with the Conditions of Engagement for the commission supplied at the time of proposal. Unauthorised use of this report in any form whatsoever is prohibited. Borehole and Test Pit Logs The borehole and test pit logs presented in this report are an engineering and/or geological interpretation of the subsurface conditions, and their reliability will depend to some extent on frequency of sampling and the method of drilling or excavation. Ideally, continuous undisturbed sampling or core drilling will provide the most reliable assessment, but this is not always practicable or possible to justify on economic grounds. In any case the boreholes and test pits represent only a very small sample of the total subsurface profile. Interpretation of the information and its application to design and construction should therefore take into account the spacing of boreholes or pits, the frequency of sampling, and the possibility of other than 'straight line' variations between the test locations. Groundwater Where groundwater levels are measured in boreholes there are several potential problems, namely: • In low permeability soils groundwater may
enter the hole very slowly or perhaps not at all during the time the hole is left open;
• A localised, perched water table may lead to an erroneous indication of the true water table;
• Water table levels will vary from time to time with seasons or recent weather changes. They may not be the same at the time of construction as are indicated in the report; and
• The use of water or mud as a drilling fluid will mask any groundwater inflow. Water has to be blown out of the hole and drilling mud must first be washed out of the hole if water measurements are to be made.
More reliable measurements can be made by installing standpipes which are read at intervals over several days, or perhaps weeks for low permeability soils. Piezometers, sealed in a particular stratum, may be advisable in low permeability soils or where there may be interference from a perched water table. Reports The report has been prepared by qualified personnel, is based on the information obtained from field and laboratory testing, and has been undertaken to current engineering standards of interpretation and analysis. Where the report has been prepared for a specific design proposal, the information and interpretation may not be relevant if the design proposal is changed. If this happens, DP will be pleased to review the report and the sufficiency of the investigation work. Every care is taken with the report as it relates to interpretation of subsurface conditions, discussion of geotechnical and environmental aspects, and recommendations or suggestions for design and construction. However, DP cannot always anticipate or assume responsibility for: • Unexpected variations in ground conditions.
The potential for this will depend partly on borehole or pit spacing and sampling frequency;
• Changes in policy or interpretations of policy by statutory authorities; or
• The actions of contractors responding to commercial pressures.
If these occur, DP will be pleased to assist with investigations or advice to resolve the matter.

July 2010
Site Anomalies In the event that conditions encountered on site during construction appear to vary from those which were expected from the information contained in the report, DP requests that it be immediately notified. Most problems are much more readily resolved when conditions are exposed rather than at some later stage, well after the event. Information for Contractual Purposes Where information obtained from this report is provided for tendering purposes, it is recommended that all information, including the written report and discussion, be made available. In circumstances where the discussion or comments section is not relevant to the contractual situation, it may be appropriate to prepare a specially edited document. DP would be pleased to assist in this regard and/or to make additional report copies available for contract purposes at a nominal charge. Site Inspection The company will always be pleased to provide engineering inspection services for geotechnical and environmental aspects of work to which this report is related. This could range from a site visit to confirm that conditions exposed are as expected, to full time engineering presence on site.

Appendix B
Drawings

4
7
.
3
1
4
6
.
0
8
4
6
.
0
9
4
7
.
2
6
4
7
.
6
6
4
7
.
6
8
4
8
.
5
1
4
8
.
5
0
4
9
.
3
6
4
9
.
3
5
4
7
.
5
0
4
9
.
7
9
4
9
.
7
9
4
9
.
8
0
4
9
.
8
1
4
9
.
0
4
4
9
.
0
3
4
8
.
5
2
4
8
.
4
6
4
8
.
4
6
4
5
.
6
4
4
5
.
6
3
4
5
.
6
5
4
5
.
6
3
4
5
.
6
2
4
5
.
6
3
4
5
.
6
34
5
.
6
3
4
5
.
6
2
4
2
.
2
3
4
3
.
3
7
4
8
.
4
1
4
8
.
5
1
4
8
.
5
7
4
8
.
4
6
4
8
.
4
8
4
5
.
1
5
4
7
.
0
7
4
9
.
8
7
4
9
.
8
7
4
9
.
8
9
6
7
1
209
208
207
206
201
TP15
TP2
TP19
HA1
BH01
BH02
HA2
HA3
HA4
HA5
TP16
TP18
TP1
TP3
2
E
TP17
86471.00
04.7.2018
Sydney PSCH
1:300 @ A3
Test Location Plan
Proposed 132/33kV Substation
21 Waterloo Road, MACQUARIE PARK
1DRAWING No:
PROJECT No:
REVISION:
CLIENT:
DRAWN BY:
SCALE: DATE:
OFFICE:
TITLE:
N
AusGrid
LEGEND
Locality Plan
NOTE:
1: Base drawing from Degotardi Smith & Partners Pty Ltd
(Dwg S 23336,dated 12.1.2018)
2: Test locations are approximate only and
are shown with reference to existing features
3: Survey levels are relative to the Australian Height Datum.
20 30m10864210 15
1:300 @ A3
Historical test pit (Golders)
Historical borehole (J&K / EIS)
Cored borehole
Hand augered borehole
NDD trench
Geotechnical cross-section
Standpipe Piezometer
A'A
OUTLINE OF PROPOSED
SUBSTATION
A'
A
PROPOSED TRANSFORMER YARD
PROPOSED SWITCHROOMS,
CONTROL ROOM AND CABLE
BASEMENT
SITE BOUNDARY
P
P
SITE
AutoCAD SHX Text
200%%C
AutoCAD SHX Text
50.17TK
AutoCAD SHX Text
45.43TK
AutoCAD SHX Text
50.10
AutoCAD SHX Text
49.94
AutoCAD SHX Text
H
AutoCAD SHX Text
H
AutoCAD SHX Text
LH
AutoCAD SHX Text
S
AutoCAD SHX Text
S
AutoCAD SHX Text
CMS
AutoCAD SHX Text
WATER METER
AutoCAD SHX Text
DISH DRAIN
AutoCAD SHX Text
DISH DRAIN
AutoCAD SHX Text
DISH DRAIN
AutoCAD SHX Text
%%U3
AutoCAD SHX Text
%%U4
AutoCAD SHX Text
%%U11
AutoCAD SHX Text
LH
AutoCAD SHX Text
S
AutoCAD SHX Text
VOCUS
AutoCAD SHX Text
VEHICLE CROSSING
AutoCAD SHX Text
VEHICLE CROSSING
AutoCAD SHX Text
ELC
AutoCAD SHX Text
ELC
AutoCAD SHX Text
ELC
AutoCAD SHX Text
ELC
AutoCAD SHX Text
(A)
AutoCAD SHX Text
(A)
AutoCAD SHX Text
(D)
AutoCAD SHX Text
(A)
AutoCAD SHX Text
R O A D
AutoCAD SHX Text
W A T E R L O O
AutoCAD SHX Text
47.50
AutoCAD SHX Text
50.00
AutoCAD SHX Text
50.00
AutoCAD SHX Text
50.00
AutoCAD SHX Text
50.00
AutoCAD SHX Text
45.75
AutoCAD SHX Text
44.70TK
AutoCAD SHX Text
48.59TK
AutoCAD SHX Text
48.70TK
AutoCAD SHX Text
48.78TK
AutoCAD SHX Text
48.82TK
AutoCAD SHX Text
49.81TK
AutoCAD SHX Text
49.98TK
AutoCAD SHX Text
49.99TK
AutoCAD SHX Text
44.82TK
AutoCAD SHX Text
44.82TK
AutoCAD SHX Text
44.75TK
AutoCAD SHX Text
44.74TK
AutoCAD SHX Text
50.00TK
AutoCAD SHX Text
50.03TK
AutoCAD SHX Text
50.06TK
AutoCAD SHX Text
50.16TK
AutoCAD SHX Text
50.25TK
AutoCAD SHX Text
50.18TK
AutoCAD SHX Text
50.16TK
AutoCAD SHX Text
50.17TK
AutoCAD SHX Text
50.17TK
AutoCAD SHX Text
50.15TK
AutoCAD SHX Text
50.14TK
AutoCAD SHX Text
50.15TK
AutoCAD SHX Text
50.14TK
AutoCAD SHX Text
49.96TK
AutoCAD SHX Text
45.18TK
AutoCAD SHX Text
45.39TK
AutoCAD SHX Text
45.99TK
AutoCAD SHX Text
50.15TK
AutoCAD SHX Text
44.81TK
AutoCAD SHX Text
44.89TK
AutoCAD SHX Text
44.92TK
AutoCAD SHX Text
45.03TK
AutoCAD SHX Text
44.93TK
AutoCAD SHX Text
44.62TK
AutoCAD SHX Text
44.32TK
AutoCAD SHX Text
44.56G
AutoCAD SHX Text
48.53G
AutoCAD SHX Text
48.55G
AutoCAD SHX Text
48.62G
AutoCAD SHX Text
48.65G
AutoCAD SHX Text
49.27G
AutoCAD SHX Text
49.66G
AutoCAD SHX Text
49.84G
AutoCAD SHX Text
49.83G
AutoCAD SHX Text
44.75G
AutoCAD SHX Text
44.68G
AutoCAD SHX Text
44.61G
AutoCAD SHX Text
44.59G
AutoCAD SHX Text
49.84G
AutoCAD SHX Text
49.88G
AutoCAD SHX Text
49.90G
AutoCAD SHX Text
50.00G
AutoCAD SHX Text
50.09G
AutoCAD SHX Text
50.03G
AutoCAD SHX Text
50.01G
AutoCAD SHX Text
50.01G
AutoCAD SHX Text
50.01G
AutoCAD SHX Text
49.99G
AutoCAD SHX Text
49.99G
AutoCAD SHX Text
49.97G
AutoCAD SHX Text
49.93G
AutoCAD SHX Text
45.03G
AutoCAD SHX Text
45.24G
AutoCAD SHX Text
45.86G
AutoCAD SHX Text
50.00G
AutoCAD SHX Text
44.66G
AutoCAD SHX Text
44.74G
AutoCAD SHX Text
44.78G
AutoCAD SHX Text
44.89G
AutoCAD SHX Text
44.80G
AutoCAD SHX Text
44.49G
AutoCAD SHX Text
44.21G
AutoCAD SHX Text
49.93
AutoCAD SHX Text
49.86
AutoCAD SHX Text
49.35
AutoCAD SHX Text
48.94
AutoCAD SHX Text
48.64
AutoCAD SHX Text
48.62
AutoCAD SHX Text
44.60
AutoCAD SHX Text
44.66
AutoCAD SHX Text
50.17
AutoCAD SHX Text
50.17
AutoCAD SHX Text
50.16
AutoCAD SHX Text
50.03
AutoCAD SHX Text
50.02
AutoCAD SHX Text
50.02
AutoCAD SHX Text
50.03
AutoCAD SHX Text
50.00
AutoCAD SHX Text
49.98
AutoCAD SHX Text
50.11
AutoCAD SHX Text
49.82
AutoCAD SHX Text
49.74
AutoCAD SHX Text
44.81
AutoCAD SHX Text
45.10
AutoCAD SHX Text
45.36
AutoCAD SHX Text
45.64
AutoCAD SHX Text
45.92
AutoCAD SHX Text
46.10
AutoCAD SHX Text
46.23
AutoCAD SHX Text
45.92
AutoCAD SHX Text
45.56
AutoCAD SHX Text
45.24
AutoCAD SHX Text
44.98
AutoCAD SHX Text
49.99
AutoCAD SHX Text
49.98
AutoCAD SHX Text
44.63
AutoCAD SHX Text
44.67
AutoCAD SHX Text
44.81
AutoCAD SHX Text
46.42
AutoCAD SHX Text
46.53
AutoCAD SHX Text
46.39
AutoCAD SHX Text
46.67
AutoCAD SHX Text
46.74
AutoCAD SHX Text
46.22
AutoCAD SHX Text
48.64BW
AutoCAD SHX Text
49.00BW
AutoCAD SHX Text
49.47BW
AutoCAD SHX Text
49.89BW
AutoCAD SHX Text
49.93BW
AutoCAD SHX Text
50.00BW
AutoCAD SHX Text
50.00BW
AutoCAD SHX Text
45.64BW
AutoCAD SHX Text
45.85BW
AutoCAD SHX Text
46.02BW
AutoCAD SHX Text
46.10BW
AutoCAD SHX Text
46.21BW
AutoCAD SHX Text
46.34BW
AutoCAD SHX Text
46.44BW
AutoCAD SHX Text
46.45BW
AutoCAD SHX Text
46.41BW
AutoCAD SHX Text
49.96BW
AutoCAD SHX Text
50.00BW
AutoCAD SHX Text
50.28BW
AutoCAD SHX Text
50.27BW
AutoCAD SHX Text
50.25BW
AutoCAD SHX Text
49.89BW
AutoCAD SHX Text
49.46BW
AutoCAD SHX Text
49.20BW
AutoCAD SHX Text
48.63BW
AutoCAD SHX Text
49.89BW
AutoCAD SHX Text
49.46BW
AutoCAD SHX Text
49.20BW
AutoCAD SHX Text
50.01BW
AutoCAD SHX Text
49.99BW
AutoCAD SHX Text
48.71
AutoCAD SHX Text
48.63
AutoCAD SHX Text
49.96
AutoCAD SHX Text
49.96
AutoCAD SHX Text
49.97
AutoCAD SHX Text
49.98
AutoCAD SHX Text
50.07
AutoCAD SHX Text
50.05
AutoCAD SHX Text
48.60
AutoCAD SHX Text
48.62
AutoCAD SHX Text
49.63
AutoCAD SHX Text
49.65
AutoCAD SHX Text
44.56
AutoCAD SHX Text
44.74
AutoCAD SHX Text
44.26
AutoCAD SHX Text
49.84
AutoCAD SHX Text
49.83
AutoCAD SHX Text
50.00
AutoCAD SHX Text
50.04
AutoCAD SHX Text
45.50
AutoCAD SHX Text
45.55
AutoCAD SHX Text
45.52
AutoCAD SHX Text
45.47
AutoCAD SHX Text
45.53
AutoCAD SHX Text
44.93
AutoCAD SHX Text
44.89
AutoCAD SHX Text
44.93
AutoCAD SHX Text
44.86
AutoCAD SHX Text
44.54
AutoCAD SHX Text
44.72
AutoCAD SHX Text
44.70
AutoCAD SHX Text
46.29
AutoCAD SHX Text
46.32
AutoCAD SHX Text
46.37
AutoCAD SHX Text
46.90INV
AutoCAD SHX Text
45.69INV
AutoCAD SHX Text
40.56INV
AutoCAD SHX Text
47.03INV
AutoCAD SHX Text
47.61INV
AutoCAD SHX Text
49.65INV
AutoCAD SHX Text
43.52INV
AutoCAD SHX Text
43.16INV
AutoCAD SHX Text
41.68INV
AutoCAD SHX Text
44.03INV
AutoCAD SHX Text
50.14
AutoCAD SHX Text
49.97
AutoCAD SHX Text
49.90
AutoCAD SHX Text
49.73
AutoCAD SHX Text
49.36
AutoCAD SHX Text
48.79
AutoCAD SHX Text
48.53
AutoCAD SHX Text
48.24
AutoCAD SHX Text
47.69
AutoCAD SHX Text
47.23
AutoCAD SHX Text
47.30
AutoCAD SHX Text
47.31
AutoCAD SHX Text
46.52
AutoCAD SHX Text
45.77
AutoCAD SHX Text
45.81
AutoCAD SHX Text
45.84
AutoCAD SHX Text
46.11
AutoCAD SHX Text
45.67
AutoCAD SHX Text
45.47
AutoCAD SHX Text
45.16
AutoCAD SHX Text
45.42
AutoCAD SHX Text
46.34
AutoCAD SHX Text
47.72
AutoCAD SHX Text
48.00
AutoCAD SHX Text
47.89
AutoCAD SHX Text
48.10
AutoCAD SHX Text
48.43
AutoCAD SHX Text
48.97
AutoCAD SHX Text
49.44
AutoCAD SHX Text
49.99
AutoCAD SHX Text
49.52
AutoCAD SHX Text
49.56
AutoCAD SHX Text
49.40
AutoCAD SHX Text
48.59
AutoCAD SHX Text
49.54
AutoCAD SHX Text
50.06
AutoCAD SHX Text
49.58
AutoCAD SHX Text
48.46
AutoCAD SHX Text
47.75
AutoCAD SHX Text
47.03
AutoCAD SHX Text
45.59
AutoCAD SHX Text
45.48
AutoCAD SHX Text
45.05
AutoCAD SHX Text
44.88
AutoCAD SHX Text
45.30
AutoCAD SHX Text
45.39
AutoCAD SHX Text
45.62
AutoCAD SHX Text
46.83
AutoCAD SHX Text
48.41
AutoCAD SHX Text
49.92
AutoCAD SHX Text
50.21
AutoCAD SHX Text
50.08
AutoCAD SHX Text
49.88
AutoCAD SHX Text
48.57
AutoCAD SHX Text
47.05
AutoCAD SHX Text
47.89
AutoCAD SHX Text
49.22
AutoCAD SHX Text
49.78
AutoCAD SHX Text
48.66
AutoCAD SHX Text
48.69
AutoCAD SHX Text
49.17
AutoCAD SHX Text
49.54
AutoCAD SHX Text
49.80
AutoCAD SHX Text
49.88
AutoCAD SHX Text
49.90
AutoCAD SHX Text
49.94
AutoCAD SHX Text
50.08
AutoCAD SHX Text
50.02
AutoCAD SHX Text
49.98
AutoCAD SHX Text
49.96
AutoCAD SHX Text
50.12
AutoCAD SHX Text
50.92
AutoCAD SHX Text
50.49
AutoCAD SHX Text
49.95
AutoCAD SHX Text
50.21
AutoCAD SHX Text
50.49
AutoCAD SHX Text
50.08
AutoCAD SHX Text
50.96
AutoCAD SHX Text
50.83
AutoCAD SHX Text
50.10
AutoCAD SHX Text
49.89
AutoCAD SHX Text
49.93
AutoCAD SHX Text
49.68
AutoCAD SHX Text
49.53
AutoCAD SHX Text
47.33
AutoCAD SHX Text
48.07
AutoCAD SHX Text
47.70
AutoCAD SHX Text
44.99
AutoCAD SHX Text
46.34
AutoCAD SHX Text
46.24
AutoCAD SHX Text
45.43
AutoCAD SHX Text
45.16
AutoCAD SHX Text
45.43
AutoCAD SHX Text
45.31
AutoCAD SHX Text
45.21
AutoCAD SHX Text
48.37
AutoCAD SHX Text
48.27
AutoCAD SHX Text
46.28
AutoCAD SHX Text
45.75
AutoCAD SHX Text
45.60
AutoCAD SHX Text
45.68
AutoCAD SHX Text
45.64
AutoCAD SHX Text
45.67
AutoCAD SHX Text
45.70
AutoCAD SHX Text
45.76
AutoCAD SHX Text
45.77
AutoCAD SHX Text
45.77
AutoCAD SHX Text
45.76
AutoCAD SHX Text
45.76
AutoCAD SHX Text
45.05
AutoCAD SHX Text
45.13
AutoCAD SHX Text
45.16
AutoCAD SHX Text
45.15
AutoCAD SHX Text
45.27
AutoCAD SHX Text
45.45
AutoCAD SHX Text
45.35
AutoCAD SHX Text
45.25
AutoCAD SHX Text
44.89
AutoCAD SHX Text
45.16
AutoCAD SHX Text
45.17
AutoCAD SHX Text
45.16
AutoCAD SHX Text
45.16
AutoCAD SHX Text
45.16
AutoCAD SHX Text
45.16
AutoCAD SHX Text
45.16
AutoCAD SHX Text
48.40
AutoCAD SHX Text
48.30
AutoCAD SHX Text
44.29
AutoCAD SHX Text
49.84
AutoCAD SHX Text
50.05
AutoCAD SHX Text
50.10
AutoCAD SHX Text
50.13
AutoCAD SHX Text
50.13
AutoCAD SHX Text
50.16
AutoCAD SHX Text
50.01
AutoCAD SHX Text
50.01
AutoCAD SHX Text
50.00
AutoCAD SHX Text
50.00
AutoCAD SHX Text
50.53
AutoCAD SHX Text
51.08
AutoCAD SHX Text
51.22
AutoCAD SHX Text
51.15
AutoCAD SHX Text
51.12
AutoCAD SHX Text
49.86
AutoCAD SHX Text
49.86
AutoCAD SHX Text
50.03
AutoCAD SHX Text
50.05
AutoCAD SHX Text
50.04
AutoCAD SHX Text
50.08
AutoCAD SHX Text
50.11
AutoCAD SHX Text
47.91TW
AutoCAD SHX Text
47.51TW
AutoCAD SHX Text
47.50TW
AutoCAD SHX Text
47.10TW
AutoCAD SHX Text
47.10TW
AutoCAD SHX Text
46.70TW
AutoCAD SHX Text
46.69TW
AutoCAD SHX Text
46.30TW
AutoCAD SHX Text
46.30TW
AutoCAD SHX Text
47.51TW
AutoCAD SHX Text
47.84TW
AutoCAD SHX Text
47.91TW
AutoCAD SHX Text
47.90TW
AutoCAD SHX Text
47.91TW
AutoCAD SHX Text
46.05
AutoCAD SHX Text
45.78
AutoCAD SHX Text
45.22
AutoCAD SHX Text
45.02
AutoCAD SHX Text
44.76
AutoCAD SHX Text
44.84
AutoCAD SHX Text
45.04
AutoCAD SHX Text
45.33
AutoCAD SHX Text
45.59
AutoCAD SHX Text
45.88
AutoCAD SHX Text
46.10
AutoCAD SHX Text
46.55
AutoCAD SHX Text
46.48
AutoCAD SHX Text
46.53
AutoCAD SHX Text
46.34
AutoCAD SHX Text
46.34
AutoCAD SHX Text
46.39BW
AutoCAD SHX Text
50.14BK
AutoCAD SHX Text
50.15BK
AutoCAD SHX Text
50.15BK
AutoCAD SHX Text
50.03BK
AutoCAD SHX Text
50.16BK
AutoCAD SHX Text
50.17BK
AutoCAD SHX Text
50.17BK
AutoCAD SHX Text
50.15BK
AutoCAD SHX Text
50.14BK
AutoCAD SHX Text
49.96BK
AutoCAD SHX Text
50.18BK
AutoCAD SHX Text
50.25BK
AutoCAD SHX Text
50.16BK
AutoCAD SHX Text
50.06BK
AutoCAD SHX Text
50.03BK
AutoCAD SHX Text
50.00BK
AutoCAD SHX Text
49.99BK
AutoCAD SHX Text
49.98BK
AutoCAD SHX Text
49.81BK
AutoCAD SHX Text
49.44BK
AutoCAD SHX Text
48.82BK
AutoCAD SHX Text
48.78BK
AutoCAD SHX Text
47.52
AutoCAD SHX Text
44.79
AutoCAD SHX Text
46.62
AutoCAD SHX Text
48.45
AutoCAD SHX Text
45.72
AutoCAD SHX Text
48.23
AutoCAD SHX Text
44.85
AutoCAD SHX Text
44.82
AutoCAD SHX Text
47.54
AutoCAD SHX Text
45.18
AutoCAD SHX Text
48.73VC
AutoCAD SHX Text
44.67VC
AutoCAD SHX Text
43.79VC
AutoCAD SHX Text
47.96VC
AutoCAD SHX Text
48.62VC
AutoCAD SHX Text
44.53VC
AutoCAD SHX Text
47.90VC
AutoCAD SHX Text
50.11G
AutoCAD SHX Text
50.08G
AutoCAD SHX Text
50.02G
AutoCAD SHX Text
50.01G
AutoCAD SHX Text
50.07G
AutoCAD SHX Text
50.02G
AutoCAD SHX Text
50.01G
AutoCAD SHX Text
50.05G
AutoCAD SHX Text
50.07G
AutoCAD SHX Text
50.12G
AutoCAD SHX Text
47.83G
AutoCAD SHX Text
45.64G
AutoCAD SHX Text
47.25G
AutoCAD SHX Text
45.29G
AutoCAD SHX Text
48.58G
AutoCAD SHX Text
46.52G
AutoCAD SHX Text
44.49G
AutoCAD SHX Text
47.88G
AutoCAD SHX Text
45.86G
AutoCAD SHX Text
44.54G
AutoCAD SHX Text
50.17TK
AutoCAD SHX Text
50.20TK
AutoCAD SHX Text
50.24TK
AutoCAD SHX Text
50.27TK
AutoCAD SHX Text
50.14TK
AutoCAD SHX Text
50.22TK
AutoCAD SHX Text
50.27TK
AutoCAD SHX Text
50.19TK
AutoCAD SHX Text
46.67TK
AutoCAD SHX Text
47.39TK
AutoCAD SHX Text
48.65LP
AutoCAD SHX Text
48.19LP
AutoCAD SHX Text
47.27LP
AutoCAD SHX Text
45.32LP
AutoCAD SHX Text
47.85LP
AutoCAD SHX Text
45.71LP
AutoCAD SHX Text
45.92LP
AutoCAD SHX Text
46.53LP
AutoCAD SHX Text
44.58LP
AutoCAD SHX Text
49.94
AutoCAD SHX Text
49.95
AutoCAD SHX Text
50.11
AutoCAD SHX Text
50.10
AutoCAD SHX Text
45.63
AutoCAD SHX Text
45.00
AutoCAD SHX Text
45.82
AutoCAD SHX Text
45.73
AutoCAD SHX Text
44.93
AutoCAD SHX Text
45.73
AutoCAD SHX Text
45.20INV
AutoCAD SHX Text
41.11INV
AutoCAD SHX Text
48.78
AutoCAD SHX Text
48.62
AutoCAD SHX Text
44.11
AutoCAD SHX Text
47.64
AutoCAD SHX Text
44.60
AutoCAD SHX Text
45.43
AutoCAD SHX Text
45.30
AutoCAD SHX Text
47.56
AutoCAD SHX Text
48.65
AutoCAD SHX Text
44.02
AutoCAD SHX Text
47.06
AutoCAD SHX Text
44.64
AutoCAD SHX Text
44.72
AutoCAD SHX Text
46.06
AutoCAD SHX Text
44.16
AutoCAD SHX Text
48.31
AutoCAD SHX Text
48.62
AutoCAD SHX Text
48.62
AutoCAD SHX Text
48.40
AutoCAD SHX Text
46.28
AutoCAD SHX Text
44.69
AutoCAD SHX Text
46.77
AutoCAD SHX Text
47.96
AutoCAD SHX Text
48.79BW
AutoCAD SHX Text
44.99
AutoCAD SHX Text
48.62
AutoCAD SHX Text
48.63
AutoCAD SHX Text
48.63
AutoCAD SHX Text
48.49
AutoCAD SHX Text
45.69
AutoCAD SHX Text
48.75
AutoCAD SHX Text
49.87
AutoCAD SHX Text
47.44
AutoCAD SHX Text
45.04
AutoCAD SHX Text
49.77
AutoCAD SHX Text
46.67
AutoCAD SHX Text
46.02LT
AutoCAD SHX Text
45.82LT
AutoCAD SHX Text
47.08
AutoCAD SHX Text
49.97
AutoCAD SHX Text
50.11
AutoCAD SHX Text
50.02
AutoCAD SHX Text
50.00
AutoCAD SHX Text
50.03
AutoCAD SHX Text
49.99
AutoCAD SHX Text
50.03
AutoCAD SHX Text
50.05
AutoCAD SHX Text
50.04
AutoCAD SHX Text
50.05
AutoCAD SHX Text
50.05
AutoCAD SHX Text
49.75TW
AutoCAD SHX Text
49.97TW
AutoCAD SHX Text
45.83
AutoCAD SHX Text
47.81
AutoCAD SHX Text
48.53
AutoCAD SHX Text
48.80
AutoCAD SHX Text
45.47
AutoCAD SHX Text
45.69
AutoCAD SHX Text
46.87
AutoCAD SHX Text
47.79
AutoCAD SHX Text
48.94
AutoCAD SHX Text
45.52
AutoCAD SHX Text
45.84
AutoCAD SHX Text
46.85
AutoCAD SHX Text
48.55
AutoCAD SHX Text
48.59
AutoCAD SHX Text
45.71
AutoCAD SHX Text
TRENCH
AutoCAD SHX Text
45.69BW
AutoCAD SHX Text
EDGE
AutoCAD SHX Text
ROCK
AutoCAD SHX Text
BARRIERS
AutoCAD SHX Text
CONCRETE DRIVEWAY
AutoCAD SHX Text
CONCRETE DRIVEWAY
AutoCAD SHX Text
CONCRETE DRIVEWAY
AutoCAD SHX Text
BLOCK
AutoCAD SHX Text
RET.
AutoCAD SHX Text
WALL
AutoCAD SHX Text
BLOCK
AutoCAD SHX Text
RET.
AutoCAD SHX Text
WALL
AutoCAD SHX Text
BLOCK
AutoCAD SHX Text
RET.
AutoCAD SHX Text
WALL
AutoCAD SHX Text
LOG
AutoCAD SHX Text
BARRIERS
AutoCAD SHX Text
OF
AutoCAD SHX Text
CARPARK
AutoCAD SHX Text
CONC.
AutoCAD SHX Text
DRIVEWAY
AutoCAD SHX Text
DRIVEWAY
AutoCAD SHX Text
CONC.
AutoCAD SHX Text
CONC.
AutoCAD SHX Text
FOOTPATH
AutoCAD SHX Text
CONC.
AutoCAD SHX Text
LARGE
AutoCAD SHX Text
SIGN
AutoCAD SHX Text
GRATED
AutoCAD SHX Text
DRAIN
AutoCAD SHX Text
BOUNDARY
AutoCAD SHX Text
BOUNDARY
AutoCAD SHX Text
BOUNDARY
AutoCAD SHX Text
TIMBER RET. WALL
AutoCAD SHX Text
WALL
AutoCAD SHX Text
BLOCK
AutoCAD SHX Text
RET.
AutoCAD SHX Text
CONC. & BLOCK BUILDING
AutoCAD SHX Text
WIRE
AutoCAD SHX Text
MESH
AutoCAD SHX Text
FENCE
AutoCAD SHX Text
WIRE
AutoCAD SHX Text
MESH
AutoCAD SHX Text
FENCE
AutoCAD SHX Text
CONC.
AutoCAD SHX Text
CONC.
AutoCAD SHX Text
48.47
AutoCAD SHX Text
49.90
AutoCAD SHX Text
ELC
AutoCAD SHX Text
ELC
AutoCAD SHX Text
ELC
AutoCAD SHX Text
AUSGRID NDD TRENCH
AutoCAD SHX Text
AUSGRID NDD TRENCH

OFFICE: DRAWN BY:
CLIENT: TITLE: PROJECT No:
DRAWING No:
REVISION:27.07.2018
2
0
HDS
EL
EV
AT
IO
N (A
HD
)
Topsoil
Filling
Clay
1:200 (H)
1:100 (V)
SITE MAP
Horizontal Scale (metres)
SCALE: @ A3
Sydney
DATE:
TESTS / OTHER
LEGEND
DISTANCE ALONG PROFILE (m)
Sandstone
Macquarie Park Zone Substation
A A'
SITE MAP
Vertical Exaggeration = 2.0
21 Waterloo Road, MACQUARIE PARK
Ausgrid
Geotechnical Cross-Section A-A'
86471.00
N - Standard penetration test value
- Water level
INFERRED DEEPEST
EXTENT OF PROPOSED CABLE
BASEMENT
PROPERTY
BOUNDARY
Retaining wall
Large boulders (indicative)
Car parking
CLA
Y
C
L
A
Y
TRENCH
SANDSTONE
SANDSTONE
SANDSTONE
RL45.5 m
RL43.16 m
PROPERTY
BOUNDARY
Notes:
1. Vertical and horizontal scales are not equal
2. Profile of top of rock for an inferred pit based on
J&K Report 15400SL Figure 7, dated September 2000.
3. Summarised boreholes and borehole surface levels
taken from J&K Report (September 2000).
4. Level of base of existing high voltage cable trench taken from
Enerserve Drawing 128302 (Rev1), dated November 2000.
NOTE:
1. Subsurface conditions are accurate at the borehole
locations only and variations may occur away from
the borehole locations.
2. Strata layers and rock classification shown are
generalised and each layer can include bands
of lower or higher strength rock and also bands
of less or more fractured rock.
3. Summary logs only. Should be read in conjunction
with detailed logs.
FILLING
FILLING
FILLING
FILLING
(POST-YEAR 2000)
CABLE
BACKFILLING
?
FILLING
CLA
Y
CLA
Y
FILLING
(POST-YEAR 2000)
?
AutoCAD SHX Text
BH01
AutoCAD SHX Text
BH01
AutoCAD SHX Text
209
AutoCAD SHX Text
6
AutoCAD SHX Text
0
AutoCAD SHX Text
4
AutoCAD SHX Text
34
AutoCAD SHX Text
36
AutoCAD SHX Text
38
AutoCAD SHX Text
40
AutoCAD SHX Text
42
AutoCAD SHX Text
44
AutoCAD SHX Text
46
AutoCAD SHX Text
48
AutoCAD SHX Text
50
AutoCAD SHX Text
52
AutoCAD SHX Text
54
AutoCAD SHX Text
-10
AutoCAD SHX Text
0
AutoCAD SHX Text
10
AutoCAD SHX Text
20
AutoCAD SHX Text
30
AutoCAD SHX Text
40
AutoCAD SHX Text
50
AutoCAD SHX Text
60
AutoCAD SHX Text
34
AutoCAD SHX Text
36
AutoCAD SHX Text
38
AutoCAD SHX Text
40
AutoCAD SHX Text
42
AutoCAD SHX Text
44
AutoCAD SHX Text
46
AutoCAD SHX Text
48
AutoCAD SHX Text
50
AutoCAD SHX Text
52
AutoCAD SHX Text
54
AutoCAD SHX Text
Offset - 0.2m
AutoCAD SHX Text
Bottom Depth
AutoCAD SHX Text
7.33 m
AutoCAD SHX Text
EL
AutoCAD SHX Text
VL
AutoCAD SHX Text
L
AutoCAD SHX Text
M
AutoCAD SHX Text
H
AutoCAD SHX Text
VH
AutoCAD SHX Text
EH
AutoCAD SHX Text
Rock Strength
AutoCAD SHX Text
BH01
AutoCAD SHX Text
EL-VL
AutoCAD SHX Text
L-M
AutoCAD SHX Text
N = 25
AutoCAD SHX Text
Offset - 0.8m
AutoCAD SHX Text
Bottom Depth
AutoCAD SHX Text
3 m
AutoCAD SHX Text
209
AutoCAD SHX Text
M
AutoCAD SHX Text
M-H
AutoCAD SHX Text
L-M
AutoCAD SHX Text
M-H
AutoCAD SHX Text
N = 14
AutoCAD SHX Text
Offset - 6.8m
AutoCAD SHX Text
Bottom Depth
AutoCAD SHX Text
3.3 m
AutoCAD SHX Text
6
AutoCAD SHX Text
N = 11
AutoCAD SHX Text
N = 14
AutoCAD SHX Text
refusal
AutoCAD SHX Text
24/07/2018
AutoCAD SHX Text
Offset - 3.1m
AutoCAD SHX Text
Bottom Depth
AutoCAD SHX Text
2.6 m
AutoCAD SHX Text
TP2
AutoCAD SHX Text
TP2

Appendix C
Site Photographs
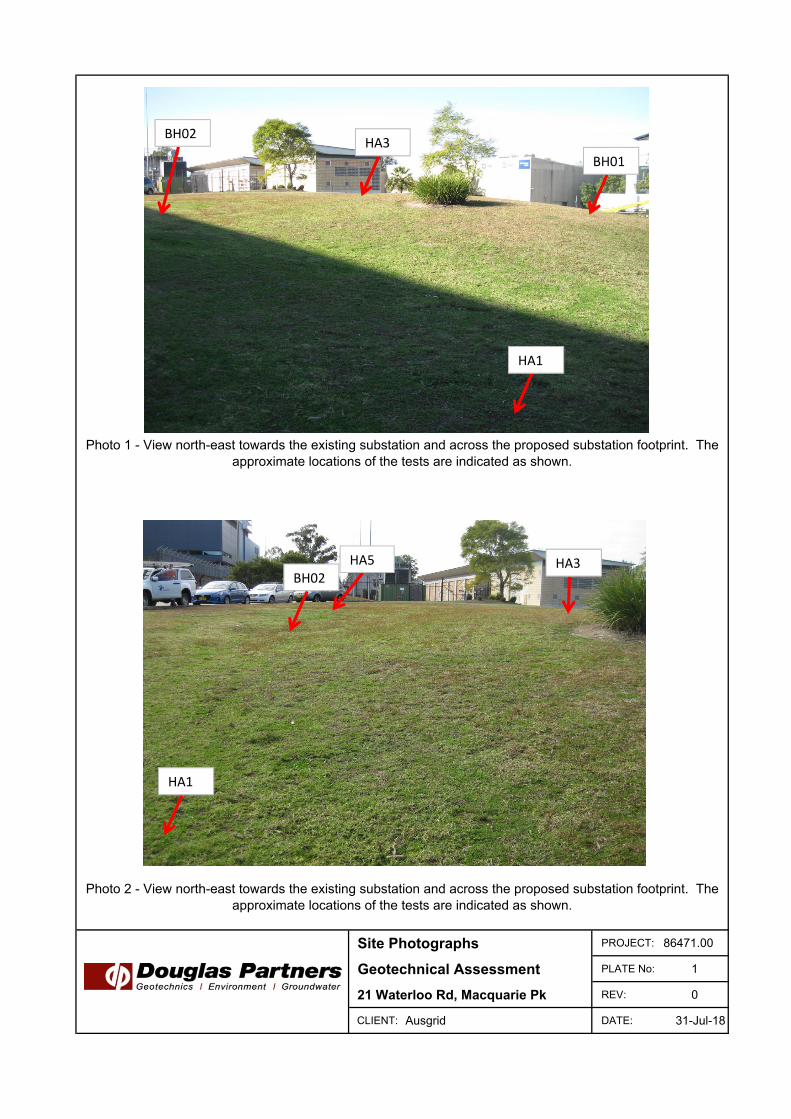
Site Photographs PROJECT: 86471.00
Geotechnical Assessment PLATE No: 1
21 Waterloo Rd, Macquarie Pk REV: 0
CLIENT: Ausgrid DATE: 31-Jul-18
Photo 2 - View north-east towards the existing substation and across the proposed substation footprint. The
approximate locations of the tests are indicated as shown.
Photo 1 - View north-east towards the existing substation and across the proposed substation footprint. The
approximate locations of the tests are indicated as shown.
BH01
HA1
HA3BH02
BH02
HA1
HA5 HA3

Site Photographs PROJECT: 86471.00
Geotechnical Assessment PLATE No: 2
21 Waterloo Rd, Macquarie Pk REV: 0
CLIENT: Ausgrid DATE: 31-Jul-18
Photo 3 - View south-west across the proposed substation footprint, with Waterloo Road in the background.
Approximate locations of test positions are as shown.
Photo 4 - View north-east towards the existing substation buildings, east of the proposed substation footprint.
HA4
HA3
HA2
BH01

Appendix D
Field Work Results

July 2010
Sampling Sampling is carried out during drilling or test pitting to allow engineering examination (and laboratory testing where required) of the soil or rock. Disturbed samples taken during drilling provide information on colour, type, inclusions and, depending upon the degree of disturbance, some information on strength and structure. Undisturbed samples are taken by pushing a thin-walled sample tube into the soil and withdrawing it to obtain a sample of the soil in a relatively undisturbed state. Such samples yield information on structure and strength, and are necessary for laboratory determination of shear strength and compressibility. Undisturbed sampling is generally effective only in cohesive soils. Test Pits Test pits are usually excavated with a backhoe or an excavator, allowing close examination of the in-situ soil if it is safe to enter into the pit. The depth of excavation is limited to about 3 m for a backhoe and up to 6 m for a large excavator. A potential disadvantage of this investigation method is the larger area of disturbance to the site. Large Diameter Augers Boreholes can be drilled using a rotating plate or short spiral auger, generally 300 mm or larger in diameter commonly mounted on a standard piling rig. The cuttings are returned to the surface at intervals (generally not more than 0.5 m) and are disturbed but usually unchanged in moisture content. Identification of soil strata is generally much more reliable than with continuous spiral flight augers, and is usually supplemented by occasional undisturbed tube samples. Continuous Spiral Flight Augers The borehole is advanced using 90-115 mm diameter continuous spiral flight augers which are withdrawn at intervals to allow sampling or in-situ testing. This is a relatively economical means of drilling in clays and sands above the water table. Samples are returned to the surface, or may be collected after withdrawal of the auger flights, but they are disturbed and may be mixed with soils from the sides of the hole. Information from the drilling (as distinct from specific sampling by SPTs or undisturbed samples) is of relatively low
reliability, due to the remoulding, possible mixing or softening of samples by groundwater. Non-core Rotary Drilling The borehole is advanced using a rotary bit, with water or drilling mud being pumped down the drill rods and returned up the annulus, carrying the drill cuttings. Only major changes in stratification can be determined from the cuttings, together with some information from the rate of penetration. Where drilling mud is used this can mask the cuttings and reliable identification is only possible from separate sampling such as SPTs. Continuous Core Drilling A continuous core sample can be obtained using a diamond tipped core barrel, usually with a 50 mm internal diameter. Provided full core recovery is achieved (which is not always possible in weak rocks and granular soils), this technique provides a very reliable method of investigation. Standard Penetration Tests Standard penetration tests (SPT) are used as a means of estimating the density or strength of soils and also of obtaining a relatively undisturbed sample. The test procedure is described in Australian Standard 1289, Methods of Testing Soils for Engineering Purposes - Test 6.3.1. The test is carried out in a borehole by driving a 50 mm diameter split sample tube under the impact of a 63 kg hammer with a free fall of 760 mm. It is normal for the tube to be driven in three successive 150 mm increments and the 'N' value is taken as the number of blows for the last 300 mm. In dense sands, very hard clays or weak rock, the full 450 mm penetration may not be practicable and the test is discontinued. The test results are reported in the following form. • In the case where full penetration is obtained
with successive blow counts for each 150 mm of, say, 4, 6 and 7 as:
4,6,7 N=13
• In the case where the test is discontinued before the full penetration depth, say after 15 blows for the first 150 mm and 30 blows for the next 40 mm as:
15, 30/40 mm

July 2010
The results of the SPT tests can be related empirically to the engineering properties of the soils. Dynamic Cone Penetrometer Tests / Perth Sand Penetrometer Tests Dynamic penetrometer tests (DCP or PSP) are carried out by driving a steel rod into the ground using a standard weight of hammer falling a specified distance. As the rod penetrates the soil the number of blows required to penetrate each successive 150 mm depth are recorded. Normally there is a depth limitation of 1.2 m, but this may be extended in certain conditions by the use of extension rods. Two types of penetrometer are commonly used. • Perth sand penetrometer - a 16 mm diameter
flat ended rod is driven using a 9 kg hammer dropping 600 mm (AS 1289, Test 6.3.3). This test was developed for testing the density of sands and is mainly used in granular soils and filling.
• Cone penetrometer - a 16 mm diameter rod with a 20 mm diameter cone end is driven using a 9 kg hammer dropping 510 mm (AS 1289, Test 6.3.2). This test was developed initially for pavement subgrade investigations, and correlations of the test results with California Bearing Ratio have been published by various road authorities.

May 2017
Description and Classification Methods The methods of description and classification of
soils and rocks used in this report are based on
Australian Standard AS 1726-1993, Geotechnical
Site Investigations Code. In general, the
descriptions include strength or density, colour,
structure, soil or rock type and inclusions.
Soil Types Soil types are described according to the
predominant particle size, qualified by the grading
of other particles present:
Type Particle size (mm)
Boulder >200
Cobble 63 - 200
Gravel 2.36 - 63
Sand 0.075 - 2.36
Silt 0.002 - 0.075
Clay <0.002
The sand and gravel sizes can be further
subdivided as follows:
Type Particle size (mm)
Coarse gravel 20 - 63
Medium gravel 6 - 20
Fine gravel 2.36 - 6
Coarse sand 0.6 - 2.36
Medium sand 0.2 - 0.6
Fine sand 0.075 - 0.2
The proportions of secondary constituents of soils
are described as:
Term Proportion Example
And Specify Clay (60%) and
Sand (40%)
Adjective 20 - 35% Sandy Clay
Slightly 12 - 20% Slightly Sandy
Clay
With some 5 - 12% Clay with some
sand
With a trace of 0 - 5% Clay with a trace
of sand
Definitions of grading terms used are:
• Well graded - a good representation of all
particle sizes
• Poorly graded - an excess or deficiency of
particular sizes within the specified range
• Uniformly graded - an excess of a particular
particle size
• Gap graded - a deficiency of a particular
particle size with the range
Cohesive Soils Cohesive soils, such as clays, are classified on the
basis of undrained shear strength. The strength
may be measured by laboratory testing, or
estimated by field tests or engineering
examination. The strength terms are defined as
follows:
Description Abbreviation Undrained shear strength
(kPa)
Very soft vs <12
Soft s 12 - 25
Firm f 25 - 50
Stiff st 50 - 100
Very stiff vst 100 - 200
Hard h >200
Cohesionless Soils Cohesionless soils, such as clean sands, are
classified on the basis of relative density, generally
from the results of standard penetration tests
(SPT), cone penetration tests (CPT) or dynamic
penetrometers (PSP). The relative density terms
are given below:
Relative Density
Abbreviation SPT N value
CPT qc value (MPa)
Very loose vl <4 <2
Loose l 4 - 10 2 -5
Medium
dense
md 10 - 30 5 - 15
Dense d 30 - 50 15 - 25
Very
dense
vd >50 >25

May 2017
Soil Origin It is often difficult to accurately determine the origin
of a soil. Soils can generally be classified as:
• Residual soil - derived from in-situ weathering
of the underlying rock;
• Transported soils - formed somewhere else
and transported by nature to the site; or
• Filling - moved by man.
Transported soils may be further subdivided into:
• Alluvium - river deposits
• Lacustrine - lake deposits
• Aeolian - wind deposits
• Littoral - beach deposits
• Estuarine - tidal river deposits
• Talus - scree or coarse colluvium
• Slopewash or Colluvium - transported
downslope by gravity assisted by water.
Often includes angular rock fragments and
boulders.

May 2017
Rock Strength Rock strength is defined by the Point Load Strength Index (Is(50)) and refers to the strength of the rock
substance and not the strength of the overall rock mass, which may be considerably weaker due to defects.
The test procedure is described by Australian Standard 4133.4.1 - 2007. The terms used to describe rock
strength are as follows:
Term Abbreviation Point Load Index
Is(50) MPa
Approximate Unconfined Compressive Strength MPa*
Extremely low EL <0.03 <0.6
Very low VL 0.03 - 0.1 0.6 - 2
Low L 0.1 - 0.3 2 - 6
Medium M 0.3 - 1.0 6 - 20
High H 1 - 3 20 - 60
Very high VH 3 - 10 60 - 200
Extremely high EH >10 >200
* Assumes a ratio of 20:1 for UCS to Is(50). It should be noted that the UCS to Is(50) ratio varies significantly
for different rock types and specific ratios should be determined for each site.
Degree of Weathering The degree of weathering of rock is classified as follows:
Term Abbreviation Description
Extremely weathered EW Rock substance has soil properties, i.e. it can be remoulded and classified as a soil but the texture of the original rock is still evident.
Highly weathered HW Limonite staining or bleaching affects whole of rock substance and other signs of decomposition are evident. Porosity and strength may be altered as a result of iron leaching or deposition. Colour and strength of original fresh rock is not recognisable
Moderately weathered
MW Staining and discolouration of rock substance has taken place
Slightly weathered SW Rock substance is slightly discoloured but shows little or no change of strength from fresh rock
Fresh stained Fs Rock substance unaffected by weathering but staining visible along defects
Fresh Fr No signs of decomposition or staining
Degree of Fracturing The following classification applies to the spacing of natural fractures in diamond drill cores. It includes
bedding plane partings, joints and other defects, but excludes drilling breaks.
Term Description
Fragmented Fragments of <20 mm
Highly Fractured Core lengths of 20-40 mm with some fragments
Fractured Core lengths of 40-200 mm with some shorter and longer sections
Slightly Fractured Core lengths of 200-1000 mm with some shorter and longer sections
Unbroken Core lengths mostly > 1000 mm

May 2017
Rock Quality Designation The quality of the cored rock can be measured using the Rock Quality Designation (RQD) index, defined
as:
RQD % = cumulative length of 'sound' core sections ≥ 100 mm long
total drilled length of section being assessed
where 'sound' rock is assessed to be rock of low strength or better. The RQD applies only to natural
fractures. If the core is broken by drilling or handling (i.e. drilling breaks) then the broken pieces are fitted
back together and are not included in the calculation of RQD.
Stratification Spacing For sedimentary rocks the following terms may be used to describe the spacing of bedding partings:
Term Separation of Stratification Planes
Thinly laminated < 6 mm
Laminated 6 mm to 20 mm
Very thinly bedded 20 mm to 60 mm
Thinly bedded 60 mm to 0.2 m
Medium bedded 0.2 m to 0.6 m
Thickly bedded 0.6 m to 2 m
Very thickly bedded > 2 m

May 2017
Introduction These notes summarise abbreviations commonly
used on borehole logs and test pit reports.
Drilling or Excavation Methods C Core drilling
R Rotary drilling
SFA Spiral flight augers
NMLC Diamond core - 52 mm dia
NQ Diamond core - 47 mm dia
HQ Diamond core - 63 mm dia
PQ Diamond core - 81 mm dia
Water � Water seep
� Water level
Sampling and Testing A Auger sample
B Bulk sample
D Disturbed sample
E Environmental sample
U50 Undisturbed tube sample (50mm)
W Water sample
pp Pocket penetrometer (kPa)
PID Photo ionisation detector
PL Point load strength Is(50) MPa
S Standard Penetration Test
V Shear vane (kPa)
Description of Defects in Rock The abbreviated descriptions of the defects should
be in the following order: Depth, Type, Orientation,
Coating, Shape, Roughness and Other. Drilling
and handling breaks are not usually included on
the logs.
Defect Type
B Bedding plane
Cs Clay seam
Cv Cleavage
Cz Crushed zone
Ds Decomposed seam
F Fault
J Joint
Lam Lamination
Pt Parting
Sz Sheared Zone
V Vein
Orientation
The inclination of defects is always measured from
the perpendicular to the core axis.
h horizontal
v vertical
sh sub-horizontal
sv sub-vertical
Coating or Infilling Term
cln clean
co coating
he healed
inf infilled
stn stained
ti tight
vn veneer
Coating Descriptor
ca calcite
cbs carbonaceous
cly clay
fe iron oxide
mn manganese
slt silty
Shape
cu curved
ir irregular
pl planar
st stepped
un undulating
Roughness
po polished
ro rough
sl slickensided
sm smooth
vr very rough
Other
fg fragmented
bnd band
qtz quartz

May 2017
Graphic Symbols for Soil and Rock General
Soils
Sedimentary Rocks
Metamorphic Rocks
Igneous Rocks
Road base
Filling
Concrete
Asphalt
Topsoil
Peat
Clay
Conglomeratic sandstone
Conglomerate
Boulder conglomerate
Sandstone
Slate, phyllite, schist
Siltstone
Mudstone, claystone, shale
Coal
Limestone
Porphyry
Cobbles, boulders
Sandy gravel
Laminite
Silty sand
Clayey sand
Silty clay
Sandy clay
Gravelly clay
Shaly clay
Silt
Clayey silt
Sandy silt
Sand
Gravel
Talus
Gneiss
Quartzite
Dolerite, basalt, andesite
Granite
Tuff, breccia
Dacite, epidote

4.50-4.75m: Cs, 250mm
5.30m: Cs, 20mm5.36m: B, 0-10°, pl, ro,cly co5.47m: J, 40-50°, pl, ro,cly co5.7m: B, 0-10°, pl, ro, clyco 5mm5.91m: B, 0-10°, ro, cln
TOPSOIL: dark grey and grey, siltysand topsoil filling, trace clay.
FILLING: brown to dark brown,sandy clay filling, with somesandstone, siltstone, brick andconcrete gravel and cobbles, moist,generally in a stiff condition.
FILLING: grey to dark brown, clayfilling, with some sandstone andsiltstone gravel and cobbles, tracesand, moist, generally in a stiff tovery stiff condition.
CLAY: stiff, brown, slightly silty clay,with trace ironstone gravel, damp(possibly filling).
SANDSTONE: extremely low to verylow strength, extremely weathered,pale grey, medium grainedsandstone with ironstone bands.
SANDSTONE: high strength, highlyweathered, fractured to slightlyfractured, pale grey to red-brown,medium grained sandstone.
SANDSTONE: low strength, highlyweathered, fractured to slightlyfractured, pale grey, mediumgrained sandstone.
SANDSTONE: high strength,moderately weathered, slightlyfractured to unbroken, pale brown tored-brown, medium grainedsandstone.
Bore discontinued at 7.33m- Target depth reached.
3,6,5N = 11
4,3,11N = 14
16,19,6/60refusal
PL(A) = 1.2
PL(A) = 1.8
PL(A) = 1.5
PL(A) = 1.5
86100
A/E
A/E
A/E*
S
A/E
S
A/E
S
C
0.1
2.2
3.5
3.8
4.75
5.3
5.71
7.33
FractureSpacing
(m)
0.01
Depth(m) B - Bedding
S - Shear
RockStrength
Typ
e
Sampling & In Situ Testing
Ex
Low
Ver
y Lo
wLo
w
Med
ium
Hig
h
Ver
y H
igh
Ex
Hig
h
0.10
0.50
1.00 R
QD
%
Cor
eR
ec. %
Gra
phic
Log
Wat
er
Degree ofWeathering
EW
HW
MW
SW
FS
FR
Description
of
Strata
1
2
3
4
5
6
7
J - Joint
F - Fault
RL
4948
4746
4544
4342
Test Results&
Comments0.05
Discontinuities
CLIENT:PROJECT:LOCATION: 21 Waterloo Road, Macquarie Park
SAMPLING & IN SITU TESTING LEGENDA Auger sample G Gas sample PID Photo ionisation detector (ppm)B Bulk sample P Piston sample PL(A) Point load axial test Is(50) (MPa)BLK Block sample Ux Tube sample (x mm dia.) PL(D) Point load diametral test Is(50) (MPa)C Core drilling W Water sample pp Pocket penetrometer (kPa)D Disturbed sample Water seep S Standard penetration testE Environmental sample Water level V Shear vane (kPa)
BORE No: BH01PROJECT No: 86471.00DATE: 11/7/2018SHEET 1 OF 1
DRILLER: BG LOGGED: AT CASING: HQ to 4.5m
AusgridMacquarie Park Zone Substation
REMARKS:
RIG: Hanjin D8
WATER OBSERVATIONS:
TYPE OF BORING:
No free groundwater observed whilst augering
Solid flight auger to 4.5m, NMLC coring to 7.33m.
*TR1110718 and TR2110718 taken at 0.9-1.0m.Standpipe installed, blank 0-4.33m; screen 4.33-7.33m; backfill 0-3.5m; bentonite plug 3.5-4.0m; gravel 4.0-7.33m, gatic cover at surface.
SURFACE LEVEL: 49.5 AHDEASTING: 327069NORTHING: 6259841DIP/AZIMUTH: 90°/--
BOREHOLE LOG

BORE: BH01 PROJECT: M ACQUARIE PARK STS AUGUST 2018
4 . 5 m – 7 . 3 3 m

3.18m: Cs, 20mm
3.5m: B, 0-10°, ro, cln3.63m: Cs, 25mm
3.9m: Cs, 20mm
4.14m: B, 0-10°, ro, festn
4.4m: B, 0-10°, ro, cly vn4.41m: B, 0-10°, ro, cln4.56m: B, 0-10°, ro, cln4.66m: B, 0-10°, ro, cln4.76m: B, 0-10°, ro, cln4.83m: B, 0-10°, ro, cln4.89m: B, 0-10°, ro, cln4.94m: B, 0-10°, ro, cln
5.39m: Cs, 10mm
6.46m: Cs, 40mm6.55m: B, 0-10°, ro, cln
TOPSOIL: dark grey and grey, siltysand topsoil filling, trace clay.
FILLING: brown to dark brown,sandy clay filling, with somesandstone, siltstone, brick andconcrete gravels and cobbles, moist,generally in a firm to stiff condition.
SANDSTONE: very low strength,highly weathered, red-brown,medium grained sandstone withsome ironstone bands.
SANDSTONE: low to mediumstrength, highly weathered,fractured, pale grey to red-brown,medium grained sandstone withsome extremely low strength claybands.
SANDSTONE: extremely lowstrength, extremely to highlyweathered, highly fractured, palegrey, medium grained sandstone.
SANDSTONE: high strength,moderately weathered, slightlyfractured and unbroken, pale brown,medium grained sandstone.
Bore discontinued at 7.0m- Target depth reached.
3,2,4N = 6
19,20/100refusal
PL(A) = 0.27
PL(A) = 0.41
PL(A) = 1.2
PL(A) = 2.3
74
56
100
100
A/E
A/E
E*B
S
S
C
C
0.1
2.7
3.24
4.4
5.0
7.0
FractureSpacing
(m)
0.01
Depth(m) B - Bedding
S - Shear
RockStrength
Typ
e
Sampling & In Situ Testing
Ex
Low
Ver
y Lo
wLo
w
Med
ium
Hig
h
Ver
y H
igh
Ex
Hig
h
0.10
0.50
1.00 R
QD
%
Cor
eR
ec. %
Gra
phic
Log
Wat
er
Degree ofWeathering
EW
HW
MW
SW
FS
FR
Description
of
Strata
1
2
3
4
5
6
7
J - Joint
F - Fault
RL
4948
4746
4544
4342
Test Results&
Comments0.05
Discontinuities
CLIENT:PROJECT:LOCATION: 21 Waterloo Road, Macquarie Park
SAMPLING & IN SITU TESTING LEGENDA Auger sample G Gas sample PID Photo ionisation detector (ppm)B Bulk sample P Piston sample PL(A) Point load axial test Is(50) (MPa)BLK Block sample Ux Tube sample (x mm dia.) PL(D) Point load diametral test Is(50) (MPa)C Core drilling W Water sample pp Pocket penetrometer (kPa)D Disturbed sample Water seep S Standard penetration testE Environmental sample Water level V Shear vane (kPa)
BORE No: BH02PROJECT No: 86471.00DATE: 11/7/2018SHEET 1 OF 1
DRILLER: BG LOGGED: AT CASING: HQ to 3.0m
AusgridMacquarie Park Zone Substation
REMARKS:
RIG: Hanjin D8
WATER OBSERVATIONS:
TYPE OF BORING:
No free groundwater observed whilst augering
Solid flight auger to 3.0m, NMLC coring to 7.0m.
*TR6110718 and TR7110718 taken at 0.9-1.0m.
SURFACE LEVEL: 49.6 AHDEASTING: 327066NORTHING: 6259856DIP/AZIMUTH: 90°/--
BOREHOLE LOG

BORE: BH02 PROJECT: M ACQUARIE PARK STS AUGUST 2018
3 . 0 m – 7 . 0 m

0.1
0.4
TOPSOIL: brown, silty clay topsoil filling, some rootlets.
FILLING: brown, silty clay filling, slightly gravelly andsandy, gravels are sub-angular to sub-rounded and fine tocoarse igneous, sandstone, siltstone and brick, with somecobbles up to 80mm diameter, damp.
Bore discontinued at 0.4m- Hand auger refusal on possible cobble/boulder.
Typ
e
4847
4645
4443
4241
Depth(m)
1
2
3
4
5
6
7
RL
Wat
er
Dep
th
Sam
ple
Description
of
Strata Gra
phic
Log
Results &Comments
Sampling & In Situ Testing
1
2
3
4
5
6
7
CLIENT:PROJECT:LOCATION: 21 Waterloo Road, Macquarie Park
SAMPLING & IN SITU TESTING LEGENDA Auger sample G Gas sample PID Photo ionisation detector (ppm)B Bulk sample P Piston sample PL(A) Point load axial test Is(50) (MPa)BLK Block sample Ux Tube sample (x mm dia.) PL(D) Point load diametral test Is(50) (MPa)C Core drilling W Water sample pp Pocket penetrometer (kPa)D Disturbed sample Water seep S Standard penetration testE Environmental sample Water level V Shear vane (kPa)
BORE No: HA1PROJECT No: 86471.00DATE: 11/7/2018SHEET 1 OF 1
DRILLER: RMM LOGGED: RMM CASING: None
AusgridMacquarie Park Zone Substation
REMARKS:
RIG: Hand tools
WATER OBSERVATIONS:
TYPE OF BORING:
No free groundwater observed whilst augering
Hand auger (100mm diameter) to 0.4m.
*TR4110718 and TR5110718 taken at 0.4m.
SURFACE LEVEL: 48.5 AHDEASTING: 327051NORTHING: 6259840DIP/AZIMUTH: 90°/--
BOREHOLE LOG
Dynamic Penetrometer Test(blows per 0mm)
5 10 15 20
Sand Penetrometer AS1289.6.3.3 Cone Penetrometer AS1289.6.3.2
A/E
A/E*
0.1
0.4

0.1
0.55
TOPSOIL: brown, silty clay topsoil filling, some rootlets.
FILLING: brown then grey, silty clay filling, slightlygravelly, gravels are sub-angular to sub-rounded and fineto coarse, mostly siltstone with igneous, sandstone andbrick, with some siltstone cobbles up to 100mm diameter,damp to humid.
Bore discontinued at 0.55m- Hand auger refusal in gravelly filling.
Typ
e
4746
4544
4342
4140
Depth(m)
1
2
3
4
5
6
7
RL
Wat
er
Dep
th
Sam
ple
Description
of
Strata Gra
phic
Log
Results &Comments
Sampling & In Situ Testing
1
2
3
4
5
6
7
CLIENT:PROJECT:LOCATION: 21 Waterloo Road, Macquarie Park
SAMPLING & IN SITU TESTING LEGENDA Auger sample G Gas sample PID Photo ionisation detector (ppm)B Bulk sample P Piston sample PL(A) Point load axial test Is(50) (MPa)BLK Block sample Ux Tube sample (x mm dia.) PL(D) Point load diametral test Is(50) (MPa)C Core drilling W Water sample pp Pocket penetrometer (kPa)D Disturbed sample Water seep S Standard penetration testE Environmental sample Water level V Shear vane (kPa)
BORE No: HA2PROJECT No: 86471.00DATE: 11/7/2018SHEET 1 OF 1
DRILLER: RMM LOGGED: RMM CASING: None
AusgridMacquarie Park Zone Substation
REMARKS:
RIG: Hand tools
WATER OBSERVATIONS:
TYPE OF BORING:
No free groundwater observed whilst augering
Hand auger (100mm diameter) to 0.55m.
SURFACE LEVEL: 47.6 AHDEASTING: 327062NORTHING: 6259831DIP/AZIMUTH: 90°/--
BOREHOLE LOG
Dynamic Penetrometer Test(blows per 0mm)
5 10 15 20
Sand Penetrometer AS1289.6.3.3 Cone Penetrometer AS1289.6.3.2
A/E
A/E
0.1
0.5

0.1
0.5
TOPSOIL: brown, silty clay topsoil filling, some rootlets.
FILLING: brown, silty clay filling, slightly gravelly andsandy, gravels are sub-angular to sub-rounded and fine tocoarse, mostly sandstone with some igneous and brick,damp to humid.
Bore discontinued at 0.5m- Hand auger refusal on possible cobble/boulder.
Typ
e
4948
4746
4544
4342
Depth(m)
1
2
3
4
5
6
7
RL
Wat
er
Dep
th
Sam
ple
Description
of
Strata Gra
phic
Log
Results &Comments
Sampling & In Situ Testing
1
2
3
4
5
6
7
CLIENT:PROJECT:LOCATION: 21 Waterloo Road, Macquarie Park
SAMPLING & IN SITU TESTING LEGENDA Auger sample G Gas sample PID Photo ionisation detector (ppm)B Bulk sample P Piston sample PL(A) Point load axial test Is(50) (MPa)BLK Block sample Ux Tube sample (x mm dia.) PL(D) Point load diametral test Is(50) (MPa)C Core drilling W Water sample pp Pocket penetrometer (kPa)D Disturbed sample Water seep S Standard penetration testE Environmental sample Water level V Shear vane (kPa)
BORE No: HA3PROJECT No: 86471.00DATE: 11/7/2018SHEET 1 OF 1
DRILLER: RMM LOGGED: RMM CASING: None
AusgridMacquarie Park Zone Substation
REMARKS:
RIG: Hand tools
WATER OBSERVATIONS:
TYPE OF BORING:
No free groundwater observed whilst augering
Hand auger (100mm diameter) to 0.5m.
SURFACE LEVEL: 49.7 AHDEASTING: 327078NORTHING: 6259851DIP/AZIMUTH: 90°/--
BOREHOLE LOG
Dynamic Penetrometer Test(blows per 0mm)
5 10 15 20
Sand Penetrometer AS1289.6.3.3 Cone Penetrometer AS1289.6.3.2
A/E
A/E
0.1
0.5

0.1
0.6
TOPSOIL: brown, silty clay topsoil filling, some rootlets.
FILLING: brown then grey, silty clay filling, slightlygravelly, gravels are sub-angular and fine to coarse,mostly siltstone with some sandstone, damp to humid.
Bore discontinued at 0.6m- Hand auger refusal in gravelly filling.
Typ
e
4847
4645
4443
4241
Depth(m)
1
2
3
4
5
6
7
RL
Wat
er
Dep
th
Sam
ple
Description
of
Strata Gra
phic
Log
Results &Comments
Sampling & In Situ Testing
1
2
3
4
5
6
7
CLIENT:PROJECT:LOCATION: 21 Waterloo Road, Macquarie Park
SAMPLING & IN SITU TESTING LEGENDA Auger sample G Gas sample PID Photo ionisation detector (ppm)B Bulk sample P Piston sample PL(A) Point load axial test Is(50) (MPa)BLK Block sample Ux Tube sample (x mm dia.) PL(D) Point load diametral test Is(50) (MPa)C Core drilling W Water sample pp Pocket penetrometer (kPa)D Disturbed sample Water seep S Standard penetration testE Environmental sample Water level V Shear vane (kPa)
BORE No: HA4PROJECT No: 86471.00DATE: 11/7/2018SHEET 1 OF 1
DRILLER: RMM LOGGED: RMM CASING: None
AusgridMacquarie Park Zone Substation
REMARKS:
RIG: Hand tools
WATER OBSERVATIONS:
TYPE OF BORING:
No free groundwater observed whilst augering
Hand auger (100mm diameter) to 0.6m.
SURFACE LEVEL: 48.2 AHDEASTING: 327057NORTHING: 6259835DIP/AZIMUTH: 90°/--
BOREHOLE LOG
Dynamic Penetrometer Test(blows per 0mm)
5 10 15 20
Sand Penetrometer AS1289.6.3.3 Cone Penetrometer AS1289.6.3.2
A/E 0.5

0.1
0.4
TOPSOIL: brown, silty clay topsoil filling, some rootlets.
FILLING: brown, silty clay filling, slightly gravelly andsandy, gravels are sub-angular to sub-rounded, fine tocoarse, mostly sandstone, siltstone and igneous, damp tohumid.
Bore discontinued at 0.4m- Hand auger refusal in gravelly filling.
Typ
e
4948
4746
4544
4342
Depth(m)
1
2
3
4
5
6
7
RL
Wat
er
Dep
th
Sam
ple
Description
of
Strata Gra
phic
Log
Results &Comments
Sampling & In Situ Testing
1
2
3
4
5
6
7
CLIENT:PROJECT:LOCATION: 21 Waterloo Road, Macquarie Park
SAMPLING & IN SITU TESTING LEGENDA Auger sample G Gas sample PID Photo ionisation detector (ppm)B Bulk sample P Piston sample PL(A) Point load axial test Is(50) (MPa)BLK Block sample Ux Tube sample (x mm dia.) PL(D) Point load diametral test Is(50) (MPa)C Core drilling W Water sample pp Pocket penetrometer (kPa)D Disturbed sample Water seep S Standard penetration testE Environmental sample Water level V Shear vane (kPa)
BORE No: HA5PROJECT No: 86471.00DATE: 11/7/2018SHEET 1 OF 1
DRILLER: RMM LOGGED: RMM CASING: None
AusgridMacquarie Park Zone Substation
REMARKS:
RIG: Hand tools
WATER OBSERVATIONS:
TYPE OF BORING:
No free groundwater observed whilst augering
Hand auger (100mm diameter) to 0.4m.
SURFACE LEVEL: 49.6 AHDEASTING: 327073NORTHING: 6259864DIP/AZIMUTH: 90°/--
BOREHOLE LOG
Dynamic Penetrometer Test(blows per 0mm)
5 10 15 20
Sand Penetrometer AS1289.6.3.3 Cone Penetrometer AS1289.6.3.2


Appendix E
Laboratory Test Results

Material Test Report
Report Number: 86471.00-1
Issue Number: 1
Date Issued: 24/07/2018
Client: Ausgrid
Level 1/9-13 Carter Street, Lidcombe NSW 2141
Contact: Paul Hurst
Project Number: 86471.00
Project Name: MACQUARIE PARK Zone Substation
Project Location: Macquarie Park Substation, Macquarie Park
Work Request: 3477
Sample Number: 18-3477A
Date Sampled: 11/07/2018
Sampling Method: Sampled by Engineering Department
Sample Location: BH02 (0.5 - 1.5m)
Material: Sandy Clay Filling
Douglas Partners Pty Ltd
Sydney Laboratory
96 Hermitage Road West Ryde NSW 2114
Phone: (02) 9809 0666
Fax: (02) 9809 0666
Email: [email protected]
Accredited for compliance with ISO/IEC 17025 - Testing
Approved Signatory: Michael Gref
NATA Accredited Laboratory Number: 828
California Bearing Ratio (AS 1289 6.1.1 & 2.1.1) Min Max
CBR taken at 5 mm
CBR % 15
Method of Compactive Effort Standard
Method used to Determine MDD AS 1289 5.1.1 & 2.1.1
Method used to Determine Plasticity Visual Assessment
Maximum Dry Density (t/m3) 1.91
Optimum Moisture Content (%) 11.5
Laboratory Density Ratio (%) 100.0
Laboratory Moisture Ratio (%) 100.0
Dry Density after Soaking (t/m3) 1.90
Field Moisture Content (%) 14.6
Moisture Content at Placement (%) 11.6
Moisture Content Top 30mm (%) 14.2
Moisture Content Rest of Sample (%) 13.9
Mass Surcharge (kg) 4.5
Soaking Period (days) 4
Curing Hours 172
Swell (%) 0.5
Oversize Material (mm) 19
Oversize Material Included Excluded
Oversize Material (%) 5.7
California Bearing Ratio
Results 2.5 5 Tangent Corrected
0 1 2 3 4 5 6 7 8 9 1 0 1 1 1 2 1 3
0
1
2
3
4
5
Report Number: 86471.00-1 Page 1 of 1

Envirolab Services Pty Ltd
ABN 37 112 535 645
12 Ashley St Chatswood NSW 2067
ph 02 9910 6200 fax 02 9910 6201
www.envirolab.com.au
CERTIFICATE OF ANALYSIS 196123-A
96 Hermitage Rd, West Ryde, NSW, 2114Address
Huw SmithAttention
Douglas Partners Pty LtdClient
Client Details
12/07/2018Date completed instructions received
12/07/2018Date samples received
11 SoilNumber of Samples
86471.00, Geotech. Investigation, Macquarie ParkYour Reference
Sample Details
Results are reported on a dry weight basis for solids and on an as received basis for other matrices.
Samples were analysed as received from the client. Results relate specifically to the samples as received.
Please refer to the following pages for results, methodology summary and quality control data.
Analysis Details
Tests not covered by NATA are denoted with *Accredited for compliance with ISO/IEC 17025 - Testing.
NATA Accreditation Number 2901. This document shall not be reproduced except in full.
19/07/2018Date of Issue
20/07/2018Date results requested by
Report Details
Jacinta Hurst, Laboratory Manager
Authorised By
Priya Samarawickrama, Senior Chemist
Results Approved By
Revision No: R00
196123-AEnvirolab Reference: Page | 1 of 6

Client Reference: 86471.00, Geotech. Investigation, Macquarie Park
<1043mg/kgSulphate, SO4 1:5 soil:water
1010mg/kgChloride, Cl 1:5 soil:water
36091ohm mResistivity by calculation
28110µS/cmElectrical Conductivity 1:5 soil:water
7.88.9pH UnitspH 1:5 soil:water
SoilSoilType of sample
11/07/201811/07/2018Date Sampled
0.52.5-2.95Depth
HA3BH01UNITSYour Reference
196123-A-11196123-A-2Our Reference
Soil Aggressivity
Envirolab Reference: 196123-A
R00Revision No:
Page | 2 of 6

Client Reference: 86471.00, Geotech. Investigation, Macquarie Park
Anions - a range of Anions are determined by Ion Chromatography, in accordance with APHA latest edition, 4110-B. Alternatively determined by colourimetry/turbidity using Discrete Analyer.
Inorg-081
Conductivity and Salinity - measured using a conductivity cell at 25oC in accordance with APHA 22nd ED 2510 and Rayment & Lyons. Resistivity is calculated from Conductivity.
Inorg-002
Conductivity and Salinity - measured using a conductivity cell at 25°C in accordance with APHA latest edition 2510 and Rayment & Lyons.
Inorg-002
pH - Measured using pH meter and electrode in accordance with APHA latest edition, 4500-H+. Please note that the results for water analyses are indicative only, as analysis outside of the APHA storage times.
Inorg-001
Methodology SummaryMethod ID
Envirolab Reference: 196123-A
R00Revision No:
Page | 3 of 6

Client Reference: 86471.00, Geotech. Investigation, Macquarie Park
113115545432<10Inorg-08110mg/kgSulphate, SO4 1:5 soil:water
106111010102<10Inorg-08110mg/kgChloride, Cl 1:5 soil:water
[NT][NT]686912<0.1Inorg-0020.1ohm mResistivity by calculation
[NT]10691201102<1Inorg-0021µS/cmElectrical Conductivity 1:5 soil:water
[NT]10208.98.92[NT]Inorg-001pH UnitspH 1:5 soil:water
196123-A-1LCS-1RPDDup.Base#BlankMethodPQLUnitsTest Description
Spike Recovery %DuplicateQUALITY CONTROL: Soil Aggressivity
Envirolab Reference: 196123-A
R00Revision No:
Page | 4 of 6

Client Reference: 86471.00, Geotech. Investigation, Macquarie Park
Not ReportedNR
National Environmental Protection MeasureNEPM
Not specifiedNS
Laboratory Control SampleLCS
Relative Percent DifferenceRPD
Greater than>
Less than<
Practical Quantitation LimitPQL
Insufficient sample for this testINS
Test not requiredNA
Not testedNT
Result Definitions
Australian Drinking Water Guidelines recommend that Thermotolerant Coliform, Faecal Enterococci, & E.Coli levels are less than1cfu/100mL. The recommended maximums are taken from "Australian Drinking Water Guidelines", published by NHMRC & ARMC2011.
Surrogates are known additions to each sample, blank, matrix spike and LCS in a batch, of compounds whichare similar to the analyte of interest, however are not expected to be found in real samples.
Surrogate Spike
This comprises either a standard reference material or a control matrix (such as a blank sand or water) fortifiedwith analytes representative of the analyte class. It is simply a check sample.
LCS (LaboratoryControl Sample)
A portion of the sample is spiked with a known concentration of target analyte. The purpose of the matrix spikeis to monitor the performance of the analytical method used and to determine whether matrix interferencesexist.
Matrix Spike
This is the complete duplicate analysis of a sample from the process batch. If possible, the sample selectedshould be one where the analyte concentration is easily measurable.
Duplicate
This is the component of the analytical signal which is not derived from the sample but from reagents,glassware etc, can be determined by processing solvents and reagents in exactly the same manner as forsamples.
Blank
Quality Control Definitions
Envirolab Reference: 196123-A
R00Revision No:
Page | 5 of 6

Client Reference: 86471.00, Geotech. Investigation, Macquarie Park
Measurement Uncertainty estimates are available for most tests upon request.
Where sampling dates are not provided, Envirolab are not in a position to comment on the validity of the analysis whererecommended technical holding times may have been breached.
When samples are received where certain analytes are outside of recommended technical holding times (THTs), the analysis hasproceeded. Where analytes are on the verge of breaching THTs, every effort will be made to analyse within the THT or as soon aspracticable.
In circumstances where no duplicate and/or sample spike has been reported at 1 in 10 and/or 1 in 20 samples respectively, thesample volume submitted was insufficient in order to satisfy laboratory QA/QC protocols.
Matrix Spikes, LCS and Surrogate recoveries: Generally 70-130% for inorganics/metals; 60-140% for organics (+/-50% surrogates)and 10-140% for labile SVOCs (including labile surrogates), ultra trace organics and speciated phenols is acceptable.
Duplicates: <5xPQL - any RPD is acceptable; >5xPQL - 0-50% RPD is acceptable.
For VOCs in water samples, three vials are required for duplicate or spike analysis.
Spikes for Physical and Aggregate Tests are not applicable.
Filters, swabs, wipes, tubes and badges will not have duplicate data as the whole sample is generally extracted during sampleextraction.
Duplicate sample and matrix spike recoveries may not be reported on smaller jobs, however, were analysed at a frequency to meetor exceed NEPM requirements. All samples are tested in batches of 20. The duplicate sample RPD and matrix spike recoveries forthe batch were within the laboratory acceptance criteria.
Laboratory Acceptance Criteria
Envirolab Reference: 196123-A
R00Revision No:
Page | 6 of 6