Report on Environmental Attitudes Survey Performed by ...
38
1 Report on Environmental Attitudes Survey Performed by SNAME T&R Panel EC-7 By Edward Schembor (Horizon Lines SNAME T&R EC-7 intern) and Hendrik van Hemmen (Chairman EC-7) Abstract Panel EC-7 Environmental Management, a T&R panel within the Society of Naval Architecture and Marine Engineers developed a Survey Monkey survey to poll attitude with regard to maritime environmental issues both within and outside the maritime industry. The survey ran from August 25th, 2010 to August 8, 2011 and collected 369 responses, at which time the analysis of the data was performed. The survey continues to be active and additional responses are being collected. The survey has confirmed some assumed attitudes of the public and the marine industry and also provides new insights.
Transcript of Report on Environmental Attitudes Survey Performed by ...

1
Report on Environmental Attitudes Survey Performed by SNAME T&R
Panel EC-7
By Edward Schembor (Horizon Lines SNAME T&R EC-7 intern) and Hendrik van Hemmen (Chairman EC-7)
Abstract Panel EC-7 Environmental Management, a T&R panel within the Society of Naval Architecture and
Marine Engineers developed a Survey Monkey survey to poll attitude with regard to maritime
environmental issues both within and outside the maritime industry. The survey ran from August 25th,
2010 to August 8, 2011 and collected 369 responses, at which time the analysis of the data was
performed. The survey continues to be active and additional responses are being collected. The survey
has confirmed some assumed attitudes of the public and the marine industry and also provides new
insights.

2
Contents
Report on Environmental Attitudes Survey Performed by SNAME T&R Panel EC-7 .................................... 1
Abstract ..................................................................................................................................................... 1
Introduction .............................................................................................................................................. 4
Survey Description .................................................................................................................................... 7
Responder Characteristics .................................................................................................................... 7
Responder Environmental Attitude ...................................................................................................... 7
Responder Maritime Knowledge .......................................................................................................... 8
Responder Maritime Environmental Perceptions ................................................................................ 8
Responder Relation to Maritime Industry ............................................................................................ 9
Bilge Water Involvement ...................................................................................................................... 9
Bilge Water Treatment Training ........................................................................................................... 9
Bilge Water Prosecution Involvement ................................................................................................ 10
View on Environmental Officers ......................................................................................................... 10
MARPOL compliance ........................................................................................................................... 10
Additional Information ........................................................................................................................ 11
Accuracy Considerations ......................................................................................................................... 13
Sample Size ......................................................................................................................................... 13
Responders Characteristics ................................................................................................................. 13
Pre-Survey Expected Answers................................................................................................................. 16
Expected Answers on Yes/No Questions ............................................................................................ 16
Expected Answers on Public/Industry Comparison ............................................................................ 16
Question and Response Ambiguities ...................................................................................................... 17
3
Primary Data Analysis ............................................................................................................................. 18
Maritime vs. Non Maritime ................................................................................................................. 18
Environmentalists vs. Non-Environmentalists .................................................................................... 20
Public Maritime vs. Non-Public Maritime ........................................................................................... 22
OWS Training ...................................................................................................................................... 23
MARPOL Regulations .......................................................................................................................... 23
Ocean Pollution Estimates .................................................................................................................. 24
Environmental Officers ....................................................................................................................... 26
Differences Between Ship-Based and Shore-Based Maritime Workers ............................................. 28
Secondary Data Analysis ......................................................................................................................... 30
Public Views of the Maritime Industry and OWS Effectiveness ......................................................... 32
Industry Views of the Marine Environment and OWS effectiveness.................................................. 32
Findings Summary ................................................................................................................................... 33
Recommendations .................................................................................................................................. 34
Suggested Further Activities ................................................................................................................... 35
Comments by Hendrik “Rik” van Hemmen, Chair of SNAME T&R Panel EC-7 ....................................... 35
Acknowledgements ................................................................................................................................. 36
References .............................................................................................................................................. 37

4
Introduction
Evaluation and analysis of shipboard environmental management practices poses a unique conundrum.
One of the peculiar problems with regard to environmental management aboard ships is that ships are
moving systems that operate for long periods of time without external oversight. In traditional naval
architecture and marine engineering this has not been an insurmountable problem since voyage
completion has always been the objective. The designer designs the ship and it goes on its way and at
the completion of the voyage the system is evaluated. A successful voyage is an on-time voyage without
damage and on budget (at which stage a designer might consider she over designed the ship) while an
unsuccessful voyage might include damage (or in extreme cases the loss of ship, cargo and crew at
which stage the design feedback loop may be somewhat hampered)
However, environmental systems do not increase or decrease the success of a voyage, but instead are
add on systems that are there to benefit the public at large and not the voyage.
In theory, one can ask the crew to evaluate these systems, but from a practical point of view there is
simply no crew benefit to report any defects or deficiencies and to answer: “It’s fine, no need to bother
me any further” is the optimal crew response.
The only other alternative is to provide neutral observers aboard the vessel, but this would be a very
expensive proposition by the time a full set of data has been developed.
As such, it has been difficult to determine the effectiveness of shipboard environmental systems and
this has become a struggle that now involves criminal prosecutions, which has made data collection
even more difficult.
Still, data is required for improvement and panel EC-7 and its supporters have struggled with this
question for quite a while.
One alternative is data collection through public and maritime industry surveys. This methodology has
been used by the USCG for quite a number of years through its public comment systems during
regulatory development.
The USCG has even used this system for data gathering on OWS systems, but has had only limited
success in this regard, with a total of no more than 50 respondents in two survey efforts. (Reference 1)
SNAME has studied environmental maritime industry issues through the Technology & Research
structure within the Society (Reference 2, Reference 4). T&R Panels are populated with engineers and
individuals who have knowledge and interest in the panels’ subjects. In its present form Panel EC-7
performs research with regard to optimization of the environmental components within maritime
industry systems.

5
With the emergence of internet based survey tools, panel EC-7 decided to make a new effort and
developed a Survey Monkey based survey on maritime environmental practices which initially focused
on OWS issues.
In considering and reviewing this effort, EC-7 supporters noted that while there is a real need to get data
at the shipboard level, it also noted that, at this stage, SNAME members and the industry have no idea
as to how the maritime industry stacks up against the rest of the world with regard to environmental
attitudes and understandings.
This led to a re-evaluation of this effort and a decision to take a more hierarchical approach, where the
panel would poll both the public and maritime stake holders and only focus on OWS at the deeper levels
of the survey.
To a large extent, this was driven by questions such as:
Is the public aware of the plentiful and various environmental systems aboard a
common cargo carrier?
Is there a difference between public perception of levels of pollution by ocean going
ships and perceptions by shipboard personnel?
Are there more shipboard or shore based environmentalists?
If there are significant differences, as engineers and designers, we may be able to adjust management
practices to take advantage of those differences.
For example, if there are more shore based environmentalists than ship based environmentalists, what
can we do aboard ship to raise environmental awareness? Vice versa, if there are more ship based
environmentalists, maybe we are doing something aboard ships that we should be doing ashore.
Or, if there are more ship based environmentalists, maybe we are incorrect in our perceptions of ship’s
crews being polluters.
Or maybe personal perception of one’s environmentalism has nothing to do with actual operational
practices.
In simple terms, the survey would fire up with general public questions (Do you know what bilge water
is?) and slowly dig down to the shipboard level. Once it became apparent that a survey responder was
faced with detailed questions to which they had no real familiarity, the survey would skip to the last
page and gratefully thank the responder.
On the other hand a ship operator, like a Master or a Chief Engineer, might be asked to reply to ever
more detailed questions.

6
The way the survey was designed, a public responder would be done in about 5 minutes, but a very
knowledgeable ship operator may need 20 minutes or even more time if they provided a lot of freeform
essay style answers.
The survey was first released for response through the SNAME website and through the personal
mailing list of the EC-7 panel chairman.
By monitoring responses to the survey over time, some inferences could be made about response rates
and obviously a personal request to complete a survey is more successful than a blanket request
through a professional organization.
In both cases, those requested to take the survey were also asked to send the survey on to their
contacts. In theory this could make a survey go viral, but this did not happen. Although there were a
number of respondents who contacted EC-7 to let them know they forwarded the survey request. By
matching response dates and times and responder locations and ages it can be concluded that there
were “forwarded” respondents whose connection to the maritime world is very tenuous to say the
least.
The initial push resulted in about 150 respondents and additional pushes ran the total number of
respondents to 288 on June 23, 2011. Undoubtedly, 288 respondents do not represent a world
population of 7 billion people and a larger sample would be very desirable, but compared to 30
respondents (the measure of the prior most successful survey) it actually represents an order of
magnitude improvement. Preliminary review of the data indicated that useful information was being
collected. (A near random sample of about 150 maritime people and 150 non maritime people can
provide reasonably useful data with regard to yes and no questions). 1
At that time panel EC-7 engaged Edward Schembor, a Red Bank Regional High School senior, to start to
evaluate the data. Mr. Schembor does not have any prior familiarity with shipboard environmental
management practices and, as such, entered the data without preconceived notions, which probably
makes the analysis of the data an even more daunting task, but on the other hand reduced analysis bias.
Survey data analysis is fraught with traps, possible misinterpretations and sample errors. Everybody is
familiar with the maxim: There are lies, damn lies and then there are politicians and then there are
statistics.
Everybody knows that 90% of the time 90% of the people will use fake statistics to come up with
convenient answers.
1 In August there were 369 respondents and this paper is based on that level of responses.
7
On the other hand, panel EC-7 is not looking for convenient answers; it is looking for any answers at all,
and the data is therefore presented in a fashion that can be checked and crosschecked.
Furthermore, the data is available on the EC-7 website for further analysis
(www.sname.org/ec7environmentalmanagement). While this paper analyses the responses collected
through 9/15/2011, the survey will continue to be available for additional responders and EC-7
welcomes anybody who will make an effort at making this survey go viral, say through face book, large
environmental organizations or other social networks.
Survey Description
The survey was initially designed by Abby van Hemmen using the survey monkey website.
The survey design went through various tests and iterations to optimize response usefulness and
response rates.
The questions in the survey are hierarchal and go from broad to specific.
It was anticipated that the combined review of responses would provide further insights. Such as a
comparison of responses from people within or outside the industry or responses depending on
professed environmental attitudes.
The following questions and question groups were provided and some explanation with regard to the
reasoning for the design of the questions is provided.
Responder Characteristics
Question 1: How old are you?
Question 2: What is your highest level of education?
Question 3: Where do you live?
These were basic respondent characteristics questions that could be used to sort answers by responder
characteristics.
Responder Environmental Attitude

8
Question 4: Do you describe yourself as an environmentalist?
Question 5: Have you donated time or money to an environmental cause in the last year?
These two questions were provided to be able to sort the answers by self represented environmental
attitude. Two slightly different questions were provided to test the reliability of the self confessed
environmentalist responses. As such, the responses could be tested against a respondent group that is
both a self described environmentalist and an actual supporter of environmental causes.
Responder Maritime Knowledge
Question 6: Do you know what MARPOL is?
Question 7: Do you know what bilge water is?
Question 8: Do you know where shipboard sludge comes from?
Question 9: Do you know what an Oily Water Separator is?
Question 10: Do you know how effective Oily Water Separators are?
Question 11: Rate Oily Water Separators 0 through 10.
Question 12: Provide your own description of OWS effectiveness.
Question 13: Have you heard or read about ships’ crews being criminally prosecuted and sometimes
sent to jail for improperly dealing with bilge water?
Question 14: Have you ever heard or read about ship owners and ship operators paying very large fines
for not properly dealing with bilge water treatment and disposal?
These questions explore general maritime awareness of the respondent, particularly with maritime
environmental concepts and go to a detailed level depending on the respondent’s awareness.
Responder Maritime Environmental Perceptions
Question 15: How much of an effect on the environment do you believe improper treatment of ship’s
bilge water has?
Question 16: Do you think of ocean going merchant ships as major ocean polluters?

9
Question 17: What percentage of ocean pollution do you guess is caused by ocean going merchant
vessels?
These questions explore broad marine environmental perceptions of all of the respondents. The
responses can be later compared to responder backgrounds.
Responder Relation to Maritime Industry
Question 18: Are you an active member of the maritime industry?
Question 19: What is your involvement in the marine industry?
Question 20: In what sector are you employed?
These three questions were provided to allow separation of the respondents between the public and
the maritime industry. Non maritime industry respondents will be routed towards the end of the survey
while maritime respondents will be asked ever more detailed questions depending on their level of
involvement in shipboard environmental issues.
Bilge Water Involvement
Question 21: Have you been involved in bilge water management/ sludge disposal issues at all (even
marginally)?
Question 22: What has been your involvement in Bilge Water management?
Question 23: Which single option most closely approximates your present (or most recent)
employment?
Question 24: Do you have actual onboard operational bilge water management experience?
At this stage the survey is focusing on respondents that have actual experience with bilge water issues
and, if not, respondents will simply be directed past this section.
Bilge Water Treatment Training
Question 25: Have you been formally trained in the use of bilge water management equipment?

10
Question 26: In which years have you received formal OWS/OCM equipment training?
Question 27: Was the training effective?
Bilge Water Prosecution Involvement
Question 28: Have you personally been involved in any form of bilge water management/pollution
criminal prosecutions?
Question 29: Did your involvement in criminal prosecutions result in mandatory compliance programs,
fines, or plea agreements to you or any of the other parties?
The questions in this section were provided to determine if there is a response bias or change in attitude
by people who have been involved in criminal marine environmental issues.
View on Environmental Officers
Question 30: After the TITANIC sinking, ocean going merchant vessels were required by international
regulation to carry a radio officer. Changes in communication technologies have resulted in the
discontinuation of this requirement in recent years. Meanwhile, there has been an explosion of
shipboard environmental regulations in the last few decades. With all the many environmental
regulations that have been and are being instituted by IMO, do you think it is time that there is an
international requirement that merchant vessels carry an environmental officer in addition to the
regular vessel complement to deal with proper recording and execution of the ship’s environmental
requirements and to function as a training and safety officer?
Panel EC-7 published a paper regarding human factor aboard ships and particularly the effect on human
factors of shipboard environmental regulations that have emerged over the last 30 years. This question
polls attitudes with regard to this issue, without expecting the respondents to have knowledge of the
data provided in the paper (Reference 3).
MARPOL compliance
Question 31: In your personal opinion, what percentage of ocean going ship’s crews violate MARPOL
Annex 1 (OWS) regulations when operating their ship today?

11
Question 32: In your personal opinion, what percentage of ocean going ship’s crews violated MARPOL
Annex 1 (OWS) regulations when operating their ship prior to 2000?
Question 33: What best describes your personal opinion regarding MARPOL compliance aboard vessels
today?
Additional Information
Question 34: Do you have any additional comments you would like to share on this topic?
Below is a flow chart showing how those with little knowledge on the subject would have few questions
to answer, while those who were involved in the maritime industry and were educated on it had many
more questions to respond to.

12

13
Accuracy Considerations
Sample Size
While the sample size was small, it was huge compared to previous USCG surveys. As stated above, the
survey was an order of magnitude improvement when it came to the amount of responders. The sample
size remained low even after multiple attempts to make the survey “viral.” However, further attempts at
increasing the survey’s exposure are still occurring in order to gain more substantial results.
Responders Characteristics
While sifting through the data to look for significant trends, the following responder characteristics were
found:
The environmentalist/non-environmentalist groups were about even. On the other hand, the survey was
mainly answered in North America (with 87.2% of the respondents coming from the continent) even
though the survey was intended to be conducted worldwide. Also, 33.7% of respondents had advanced
degrees, while only 5.1% had high school as their highest education level. Therefore, there is a chance
that the public’s knowledge of Oily Water Separators and other maritime devices is lower than shown in
the survey.
The responder data indicates that the responders were not truly random. Those who responded were
almost all, whether directly or indirectly, related to the maritime industry or the environmental industry,
as the survey was mainly distributed through maritime-related and environmental-related websites or
e-mailing lists. And those who had the survey passed on to them were having it passed to them by
someone in the maritime industry. For example, someone in the 10-20 age range may have been the
child of a lifelong maritime worker; the child would respond differently from another child because of
his/her previous maritime exposure. A larger sample size would have been preferred and would have
led to more randomized results.

14
Distribution by Age
10-20 20-30 30-40 40-50 50-60 60-70 70-80 80-90 90-100 Total
10.3% 13.3% 11.9% 16.5% 24.7% 15.4% 6.2% 1.4% .3% 100%
38 49 44 61 91 57 23 5 1 369
The chart above shows how the respondents were quite nicely distributed throughout all age groups
with the largest population of the respondents being in the age range of 50-60. There were a decent
amount of respondents under 20, but not enough to be able to make any accurate inferences about this
younger generation
Distribution by Location
North
America
South
America
Asia Africa Europe New Zealand
/ Australia
Response
Count
83.7% 1.4% 1.6% .5% 12.2% .5% 100%
309 5 6 2 45 2 369
The chart above shows how drastically the survey was biased towards North America. The data from
South America, Asia, Africa, and Oceania is virtually statistically insignificant. It is impossible to draw any
accurate conclusions with only 6 respondents. Therefore, the inferences made from the survey can only
reasonably reflect the people in North America and Europe.

15
Figure 1: Responses to Q 2: What is your highest level of education?

16
Pre-Survey Expected Answers
Coming into the survey analysis, the data analyst had few preconceived ideas having never worked in
the maritime industry before. However, those few preconceptions were quite major. This section
explains the preconceived notions by an uninitiated analyst as related to the type of responses he would
expect to see from this survey.
Expected Answers on Yes/No Questions
The analyst (Ed Schembor) expected that there would be a huge disconnect between the
environmentalists and the non-environmentalists. It was thought that on question 11 of the survey, the
non-environmentalists would rate the Oily Water Separators highly because they would feel that any oil
separation would be great, while the environmentalists would feel that even OWS putting out water at
20 PPM was horrendous. The analyst thought for questions 15, 16, and 17 that the non-
environmentalists would say ocean going merchants cause little pollution, while environmentalists
would say the opposite.
Secondly, the analyst expected that there would have been a large difference in responses from general
maritime workers and maritime workers who have onboard operational bilge water management
experience. The analyst thought that general workers would think that Oily Water Separators work fine
because they would not have first-hand experience with them, while workers who had experience with
them would think the opposite.
The first preconception was proven to be almost completely false from the survey; according to it,
environmentalists and non-environmentalists differ only slightly in their opinions on the maritime
industry.
The second preconception was also proven quite false; most of those who were currently working on-
shore may have had previous off-shore experience. Therefore, there was little shift in ideas between the
groups as they overlaid each other.
Expected Answers on Public/Industry Comparison
The main expectation held by the analyst was that those who were members of the maritime industry
would have answers quite different from the general public. It was expected that members of the
maritime industry would answer questions 15, 16, and 17 (Questions on the maritime industry’s effect

17
on the environment) similar to how the analyst expected the non-environmentalists to answer them,
while the analyst expected the general public to answer these questions like environmentalists.
The analyst also expected the general public to be extremely uninformed. The analyst thought that all
the average person would know about the maritime industry would be what they had viewed on TV,
which is usually disasters like the Exxon Valdez and, more recently, the Deepwater Horizon Gulf of
Mexico Oil Spill. Therefore, the analyst expected them to answer like the environmentalists and think as
if the maritime industry was the main source of pollution.
Finally, the analyst expected the answers of those who work in the public sector maritime industry to
have answers varying from those who work in the private sector maritime industry. The analyst thought
public workers would tend towards the environmentalists since they would have to be more careful due
to their involvement with the government, but private workers would tend towards the non-
environmentalists because they couldn’t care less about these regulations.
The above considerations will be addressed in the secondary analysis below.
Question and Response Ambiguities
A few of the questions did leave room for uncertainties. Questions 11 (rating OWS effectiveness), 15
(rating the effect of improper bilge water treatment on the environment), and 17 (selecting the amount
of ocean pollution caused by ocean going merchant vessels) may have asked for too much precision
from respondents who may have lacked proper maritime knowledge. On question 11, for an
uneducated respondent, a rating of a 1 may seem quite similar to a rating of a 4; however, to someone
reading this paper, a 1 is quite different from a 4.

18
Primary Data Analysis
The survey provided a myriad of answers to the various questions surrounding OWS’. Below is a
description of the analysis of the results of the survey, separated by topics and subtopics.
Maritime vs. Non Maritime
To separate responses between those in the maritime industry and those not in the maritime industry,
the results of Question 18 (Are you an active member of the maritime industry?) were referenced to the
maritime respondents (those who answered Yes to question 18) and the non-maritime (general public)
respondents (those who answered “No” to question 18). 57.3% of the respondents were active
members of the maritime industry, while 42.7% were not.
Before this analysis begins, it is important to state that many of the general public respondents still had
some relation to the maritime industry. 30 of the 140 public respondents were in the retirement age
range (that being the ages of 60 – 100) (Question 1) and most likely had past maritime experience. This
conclusion can be reached from two factors: (1) the survey was created for maritime workers and
spread by maritime workers, so the respondents are only 1 step removed from the maritime industry
and (2) when asked to describe the effectiveness of an OWS, a third of the knowledgeable general public
respondents were in the retirement age range (Question 12).
First, it showed that, while there are disconnects between the maritime respondents and the general
public, they are not as extreme as might be expected.
The general public knows the basics of the maritime industry, but none of the specifics. For example,
even though 74% of all respondents knew what Oily Water Separators (OWS) were (quite possibly
because of its self-explanatory name), only 55.1% of all general public respondents had an idea of what
MARPOL was (Questions 9 and 6). The public knows that those on ships try to stop oil leakage into the
ocean, but they have no idea what the specific maritime organizations that do this are.
19
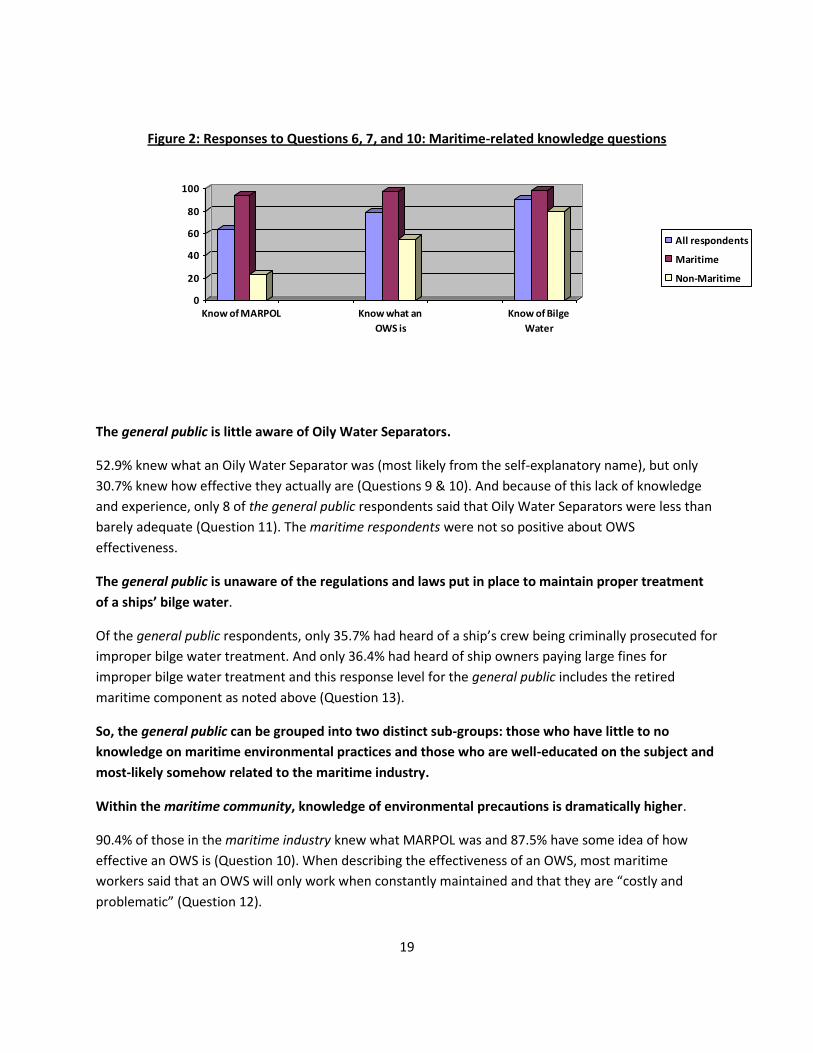
Figure 2: Responses to Questions 6, 7, and 10: Maritime-related knowledge questions
0
20
40
60
80
100
Know of MARPOL Know what an
OWS is
Know of Bilge
Water
All respondents
Maritime
Non-Maritime
The general public is little aware of Oily Water Separators.
52.9% knew what an Oily Water Separator was (most likely from the self-explanatory name), but only
30.7% knew how effective they actually are (Questions 9 & 10). And because of this lack of knowledge
and experience, only 8 of the general public respondents said that Oily Water Separators were less than
barely adequate (Question 11). The maritime respondents were not so positive about OWS
effectiveness.
The general public is unaware of the regulations and laws put in place to maintain proper treatment
of a ships’ bilge water.
Of the general public respondents, only 35.7% had heard of a ship’s crew being criminally prosecuted for
improper bilge water treatment. And only 36.4% had heard of ship owners paying large fines for
improper bilge water treatment and this response level for the general public includes the retired
maritime component as noted above (Question 13).
So, the general public can be grouped into two distinct sub-groups: those who have little to no
knowledge on maritime environmental practices and those who are well-educated on the subject and
most-likely somehow related to the maritime industry.
Within the maritime community, knowledge of environmental precautions is dramatically higher.
90.4% of those in the maritime industry knew what MARPOL was and 87.5% have some idea of how
effective an OWS is (Question 10). When describing the effectiveness of an OWS, most maritime
workers said that an OWS will only work when constantly maintained and that they are “costly and
problematic” (Question 12).

20
Environmentalists vs. Non-Environmentalists
To analyze responses between environmentalists and non-environmentalists, the results of Question 5
were sorted by environmentalists and non environmentalists. Environmentalists were selected by a
positive response to question 5.
The survey showed the lack of difference in opinions between environmentalists and non-
environmentalists.
First, it is noted that the line between environmentalists and non-environmentalists is a blurred one.
48.3% off all respondents described themselves as environmentalists (Question 4), yet 53.1% of all
respondents donated time/money to environmental causes in the past year (Question 5).
Also, when rating the effectiveness of OWS’, 72 of the 81 environmentalists who answered thought that
OWS’ were in the adequate to great range. 79 of the 87 non-environmentalists who answered thought
the same about OWS’ (Question 11). Both groups do generally feel that OWS systems are more than
adequate at performing their job. While some may say that this is an objective question, wouldn’t one
expect biases to bleed through it? The biases don’t; everyone has the same general thoughts on OWS’,
whether an environmentalist or not.
57.6% of environmentalists know how effective OWS’ are, while 61% of non-environmentalists know
how effective OWS’ are (Question 10). The non-environmentalists appear to be slightly more educated
on the issue than the environmentalists.
Also, only 16.4% of maritime non-environmentalists feel that merchant vessels should have to carry an
environmental officer, as opposed to the 22.2% of environmentalists who thought so. There is a divide,
but not as large as one would expect.

21
Figure 3: Responses to Q 5: Have you donated to environmental causes in the past year?
0
10
20
30
40
50
60
70
80
Environmentalist Non-
environmentalists
Percent who donated to environmentalcauses
Younger generations lean much more towards the non-environmentalist side while being much less
educated on maritime subjects.
Of the 31 respondents under 20, only 25.8% described themselves as environmentalists, as opposed to
those over 20, 52.1% of who describe themselves as environmentalists. However, even though the sub-
20 group is less environmentally engaged, 58.1% of them have donated to environmental causes in the
past year.
Also, only 12.8% of those under 20 have any idea of how effective Oily Water Separators are, while
69.3% of those over 20 do. This of course can simply be because of the younger generation’s lack of
experience and education.
However, those in the sub-20 generation who are aware of Oily Water Separators feel that they are
much less reliable than those who are above the age of 20. When rating the effectiveness of OWS on a
scale of 1 to 10, those below 20 stayed in the 4 to 6 range, while those above 20 tended towards the 6
to 8 range. While this is statistically insignificant, it is still quite interesting and leaves one to wonder
where these young people acquired this knowledge.
When asked about how much of an effect on the environment does improper bilge water treatment
have (Question 15), 36% of those under 20 responded with the most severe response of “very much,
major source of ocean pollution.”
Of the sub-20 generation, 56.7% felt that ocean going merchants ships were a major cause of ocean
pollution (Question 16). This percentage is much higher than the 29.3% of respondents over 20 who feel
the same way.
22
Public Maritime vs. Non-Public Maritime
Question 20 was used to determine response differences between those in the maritime industry who
perform a public (government) function and those in the commercial sector. Those who work in the
government sector were renamed as public maritime employees and those who work in the commercial
sector were renamed as private maritime employees. 71.7% of respondents who were active members
of the maritime industry were employed in the private sector, while only 13.7% were employed in the
public sector. The other 14.6% were generally students.
The line between environmentalists and non-environmentalists, in the private maritime industry and
the public maritime sector also appears to be blurred.
Of public sector employees, only 31.8% describe themselves as environmentalists and 57.7% donated
time/money to environmental causes in the past year (However, this is based on a small sample size).
On the other hand, of private sector employees, 45.5% described themselves as environmentalists and
47.7% donated time/money to environmental causes in the past year. Perhaps those working for the
government do not gain environmental awareness from increased oversight.
The attitudes of the private and public employees could truly be seen through their response to the
final question, which asked for any additional comments.
Private sector employees said things such as:
“Training and certification should be compulsory for a ship’s crew.”
Public sector employees said things such as:
“The problem is broader than the OWS or OCM. A holistic approach needs to be taken. An OWS and
OCM cannot compensate for all the other issues that a vessel and its crew may be experiencing. The
responses to this survey are my personal opinion and not necessarily those of my employer.”

23
Figure 4: Maritime Responses to Questions 4, 5, and 30: Questions relating to environmental views.
0
10
20
30
40
50
60
Are
environmentalists
Donate to
environmental
causes
Want an
environmental
officer
Public
Private
OWS Training
The survey also showed how those in the maritime industry who have had formal OWS training feel
about it.
11 of 20 respondents had their OWS training before 2000. In just the past 11 years, a myriad of things
regarding OWS systems have changed.
Their physical components may soon change to include better piping systems and new environmental
seals, which could cause confusion or frustration with workers who rely on older working practices.
However, of those 20, only 1 person said that the training was ineffective. One respondent said that
“Training was adequate for the equipment available at the time;” while another said that “The deciding
factor is the will by the Ship manager to effectively apply the OWS procedure on board its Ships, and
that also involves training.” In the case of Oily Water Separators, a little training tends to go a long way.
MARPOL Regulations
Many maritime employees are aware of other ships completely or partially disregarding MARPOL
regulations.
69 of the 155 maritime employees who responded to Question 33 (which asks for the respondents’
opinion on MARPOL regulation compliance among contemporary ships) said that, while the major bilge
water and waste regulations are followed, there is a huge amount of non-compliance with the detailed
parts which results in minor pollution. 46 of respondents said that better technical and human factor

24
solutions are needed and another 46 said that MARPOL has reduced pollution to a significant extent. 54
said that MARPOL regulations are just now beginning to be understood and followed.
Those from the public sector responded to the question with mainly positive responses, such as
“Ships’ crews are starting to get MARPOL’s message” and “Whistle blowers are mostly honest crew
members.”
Those from the private sector responded with positive responses, but not as positive as those in the
public sector. The private sector main responses were that crews follow the major regulations, but not
the minor ones, and that ships are starting to get MARPOL’s message.
Most maritime public sector employees felt that 15 to 20% ocean pollution was caused by ocean going
merchant vessels, as opposed to the private industry’s average estimate, which was 0 to 5%. It is noted
that according to a different survey, about 20% of ocean pollution is caused by ship activities (Ocean
Pollution).
Also, of the public sector employees who responded to Question 28, 23.1% said they had been involved
in a bilge water related prosecution as opposed to the 16.4% of private sector employees who had been
involved in bilge water related prosecution. The public sector deals with more prosecutions, which in
turn may lead to deeper insight in the subject.
Figure 5: Maritime Response to Questions 21 and 28: Questions related to bilge water issues.
0
10
20
30
40
50
60
70
Have been involved in
bilge water related
prosecutions
Have been involved in
bilge water issues
Public
Private
Ocean Pollution Estimates
Of all of the respondents, about 31%, felt that merchant going ships were a major source of oceanic
pollution.

25
Of those who felt that merchant vessels were a major source of ocean pollution, 51.4% knew what
MARPOL was. Therefore, MARPOL may not be doing the best of jobs of providing correct pollution
estimates to their “customers.”
Also of those who felt that merchant vessels were a major source of ocean pollution, 41.9% were non-
environmentalists, showing that it isn’t just stereotypically the environmentalists who feel that ships are
creating immense amounts of pollution.
One may expect those who feel ships pollute a lot to be younger and less educated on other sources
of ocean pollution. However, the opposite is true.
Figure 6: Response to Q 16: Do you think merchant ships are a major source of ocean pollution?
0
10
20
30
40
50
10 to 20 20 to 30 30 to 40 40 to 50 50 to 60 60 to 70 70 to 80
Percent of estimated pollution
Note: The age groups of 80 to 90 and 90 to 100 were excluded due to a lack of responses.
Oily Water Separators alone cannot be blamed for this large number of respondents who feel the
maritime industry is the main proponent of ocean pollution.
First, most people rated OWS effectiveness as a 7 on a scale of 1 to 10. Secondly, a third of the group
didn’t even know what an Oily Water Separator was. Finally, only 39% were active members of the
maritime industry and, therefore, most who answered had no experience with an Oily Water Separator.
If Oily Water Separators cannot be blamed for causing ocean pollution, then what can?
Well, 51.4% of the group had heard/read about ship’s crews being criminally prosecuted for improper
bilge water treatment. Seeing articles and news stories about ships polluting could contribute to a
feeling that the maritime industry causes large amounts of pollution.
Also, 27 of the respondents who were maritime workers had been involved in bilge water disposal
issues. These issues could have led to different feelings about bilge water and how much pollution the
maritime industry causes. Perhaps, to fix the issue, they were told to simply pump the bilges overboard

26
without treatment. Therefore, he/she now feels that the maritime industry is a major part of pollution
due to his/her own personal experience.
Environmental Officers
Maritime employees are unsure on whether or not an environmental officer should be required
aboard ships.
Of the 178 maritime workers who responded to Question 30, 81 answered “No” or “Don’t think so” to
an environmental officer being required aboard ships. Of these 81 workers, 35 (or 40.7%) described
themselves as environmentalists. This shows that non-environmentalists are more against
environmental officers than environmentalists, but not to the extent which one may expect.
The group of maritime workers who do not want an environmental officer is significant in that 74.1% of
its members work in the commercial sector of the maritime industry. Perhaps those in the commercial
sector don’t want environmental officers not because they’re non-environmentalists, but because they
don’t want to risk losing money having to pay an environmental officer. (Perhaps if the environmental
officers were paid for by the government, the responses would have been much different.) On the other
hand the cost of a worldwide requirement for environmental officer will actually be carried by the
shippers and not ship operators. Since all ships would be required to carry an environmental officer,
there would be no competitive difference between ship operators.
Also, 26.3% of the maritime-employed environmentalists said that 0 to 5% of ships violate MARPOL
Annex 1 and 22.2% felt that only 5 to 10% of ocean pollution is caused by merchant vessels. The
statistics indicate that the group feels that ships are already doing a good enough job of following
environmental regulations and that an environmental officer would simply be unnecessary. These
statistics could be caused by the employees being involved in pollution litigations, as 24 of them were.

27
Figure 7: Non-Environmentalist Responses to Q 30: Yes or No to Environmental Officer?
0
5
10
15
20
25
30
35
Yes No, but would
like more data
Don't think so No
Non-Environmentalist Percent
Figure 8: Environmentalist Responses to Q 30: Yes or No to Environmental Officer?
0
5
10
15
20
25
30
35
Yes No, but would like
to see more data
Don't think so No
Environmentalist Percent
Note: Question 30 is “Do you think it is time that there is an international requirement that merchant
vessels carry an environmental officer in addition to the regular vessel complement to deal with the
proper recording and execution of the ship’s environmental requirements and to function as a training
and safety officer?”

28
Differences Between Ship-Based and Shore-Based Maritime Workers
Maritime workers who actually work on the ships (including those in operations, ship-owners,
maintenance, deck department, masters, engine department, chief engineers, shipbuilding, and
environmental responders) have a somewhat similar view on the environmental soundness of ships to
those who only work on docks and ashore (including those in regulatory, port-state control, financial,
design, legal, manufacturing, education, insurance, surveying, classification, recycling, and students).
First, 49.6% of ship-based workers have donated to environmental causes in the past year, which is
extremely close to the 51% of shore-based maritime workers who have.
23.5% of shore-based workers feel that merchant going ships are a major cause of ocean pollution,
which is also close to the 22% of on-board workers who feel the same.
76.4% of ship-based workers have dealt with bilge water/sludge issues, a 10.4% difference from the 66%
of shore-based workers who have had the same issues.
46.3% of shore-based workers have been trained in the use of bilge water management equipment, as
compared to the 48.5% of those who work on board ships.
The above percentages show similarity of the knowledge by on-board workers and the knowledge of on-
shore workers. This similarity is most likely because those who work on-board have also, at one point in
their lives, worked on-shore, and vice versa.
However, even with all of these similarities, there was one minor difference between the groups.
Of on-shore workers, 29.3% feel that environmental officers should not be on ships, while only 19.3%
felt they should be on ships. Of on-board workers, 24.8% feel that environmental officers should not be
on ships, while 26.4% they should be on ships. In other words a slightly larger percentage of on-board
respondents felt that an environmental officer would be useful.
Those who are aware of MARPOL tend to have much deeper knowledge on the other parts of the
maritime industry.
For example, 99.1% of those who knew MARPOL also knew what bilge water was and 95.8% also knew
what Oily Water Separators were. While this is not definitive, this statistic may indicate that once
MARPOL is properly explained, knowledge on other subjects may follow more naturally.

29
Regulatory Port
State
Control
Operations Ship
Owner
Financial Design
&
Maintenance
Chief
Engineer
Ship
Building
Public
Number of
Responses
23 9 44 17 6 121
23 58 164
Percent
Environmentalist
59.1% 66.7% 50% 52.9% 41% 58.1% 56.5% 48.3% 55.5%
Percent Who
Donate to
Environmental
Causes
52.2% 66.7% 52.3% 64.7% 66.7% 55.1% 60.9% 48.4% 57.3%
Average OWS
Ranking
8 8 7 7 8 7 7 7 6
Percent who
believe ships are
a major cause of
ocean pollution
22.6% 33.3% 15.1% 19% 50% 21% 19.4% 21.5% 42.1%
Percent involved
in bilge related
prosecutions
90.9% 66.7% 86.4% 28.6% 0% 8.8% 21.7% 2.4% 0%
Percent with
advanced
degrees
39% 66.7% 40.9% 58% 50% 36% 21.7% 39.7% 34.8%
Almost all fields had an average OWS rank of 7, with the exception of the Regulatory, Port-State
Control, and Financial fields (all of which had an average OWS rank of 8 and have little first-hand OWS
experience related to them).
The maintenance field had the highest percentage of people who felt that merchant ships were a
minor cause of ocean pollution (with 76.7%).
This is most likely because those in the maintenance field see first-hand all of the issues that occur on
ships and how few of them have to do with bilge water, etc.

30
The financial industry had the highest percent of people in the industry who felt that merchant going
ships were a major cause of ocean pollution (with 50%).
Those in the financial field have little to no first-hand maritime experience and in turn may believe only
what they see on TV and may remember only horrendous incidents at sea; all of the financial
respondents had heard of ships being fined for improper bilge water disposal. However, it is noted that
only 6 financial industry members completed the survey.
The trend was that the fields most closely related to the actual ships felt that the ships were not a major
cause of ocean pollution (with the top 3 being Maintenance, Operations, and Regulatory), while the
fields least closely related to the ships felt that the ships were a major cause of ocean pollution (with the
top 3 being Financial, Education, and Students).
In general, there were no major differences between the shore-based maritime employees and ship-
based maritime employees.
Secondary Data Analysis
The secondary analysis was used to compare the results of the survey with information from various
outside sources. These sources (including other surveys and media articles), backed up the survey
results and indicate that the results were not seriously skewed.
First, the environmentalist to non-environmentalist ratio from this survey was quite similar to that of
other surveys.
According to a different survey, about 53% of people have taken steps to make their daily lives more
environmentally friendly (Reference 8). According to another survey, only about 44% of Americans
would want to label themselves as environmentalists due to the poor image that comes with it
(Reference 13).
Other surveys have shown a much larger gap between the views of environmentalists and the general
public than the blurred line showed in this survey.
Most Americans are worried about issues which they feel are more important than the environment,
with financial woes, religious values, and modernity being the most prominent (Reference 6). 54% of
Americans feel that economic growth should be given priority over environmental protection (Reference
6).
Environmentalists are also politically different. 63% said they were liberals as opposed to 18% of the
general public (Reference 14).

31
Also, according to one survey, environmentalists tend to disagree with the specialists over certain
topics. While only 33% of cancer specialists believe there is a current cancer epidemic, 73% of
environmentalists believe that there is one. 51% of energy scientists feel that nuclear energy is safe;
only 10% of environmentalists feel the same way (Reference 14).
Environmentalists also have a history of being inherently opposed to the maritime industry. In one case,
an environmental officer stopped maritime workers from using water from a hose to provide cooling
water to a sail drive because it had been chlorinated; the water which those in the area could drink and
bathe with was not pure enough to be put in the waterway (Reference 7).
However, all surveys have shown that there is some controversy over what makes someone an
environmentalist.
In one survey, only 16% of respondents said that they were active members in the environmental
movement, while 50% considered themselves to be environmentalists. Only 9% belonged to a local or
regional environmental group and only 5% belonged to a national or international environmental
organization (Reference 12).
One survey showed that, of students surveyed, 87% were environmentalists, as opposed to this
survey, which showed that 55.6% of students were environmentalist.
However, both surveys had only a few of student respondents (The EC-7 survey having only 18 and the
other having only 15) (Reference 12). Combining the two indicates that students do tend to lean
towards the environmentalist side; however, the intensity and quantity at which they lean this way is
currently unknown.
The media creates quite a bit of disconnect between the thoughts of the public and the actual
numbers.
The media tends to exaggerate anything that remotely deals with the environment. In a 2009 survey, it
was found that 41% of Americans feel that the seriousness of global warming is generally exaggerated
(Reference 16).
During the week of June 31st, 2011, the media reported a “record-breaking” heat-wave; only .5% of high
records were broken that week. Even with that said, the search term “record-breaking heat July 2011”
yields over 35 million results on Google (Reference 11).
In the summer of 2006, various news stories claimed that global warming was at fault for the increasing
amount of wildfires and droughts in the West. These stories were in response to a paper by A.L.
Westerling. What the news stories failed to note was that, statistically, the correlation between global
warming and droughts is zero and that the West has historically been a fire-prone region of dry land
(Reference 9, Reference 15).

32
According to Nature magazine, when the Deepwater Horizon disaster occurred in 2010, the media
created an environmentalist frenzy. Vernon Asper, a member of the research team which discovered the
oil leak acted as an ambassador to the media. While Asper noted that a better analysis was needed to
see how bad the damage was, the media reports, as Asper put it in Nature magazine, “gave the
impression that huge lakes of crude oil were hiding in the deep” (Reference 5).
Public Views of the Maritime Industry and OWS Effectiveness
Now more than ever, making sure that the public has a positive view of the maritime industry is crucial.
If the public has a poor view of Oily Water Separators, then they will complain to the politicians, who
will in turn create and promote unnecessarily strict environmental precautions, which the maritime
industry simply cannot handle
Since the majority of the public is unaware of the specifics of the maritime industry, such as Oil Record
Books and Oily Water Separators, the public critics of the maritime industry must gain their negative
views from somewhere: the media. As previously stated, the media tends to greatly exaggerate anything
remotely related to the environment and manages to put a great deal of blame on the maritime
industry.
The public’s view of OWS effectiveness is generally neutral. This is due to the public’s lack of basic
maritime knowledge. Only 30.8% of non-maritime respondents even knew what an OWS was.
MARPOL also is barely known by the public; only 21% of non-maritime respondents, many of whom are
in some degree related to the maritime industry, knew of the organization (being from part of the
general public myself, I can personally say that I had never heard of MARPOL, or for that matter, any
environmental regulations in the maritime industry). Therefore, the public cannot accurately comment
on the effectiveness of the environmental precautions of the maritime industry as they aren’t even
aware of them.
Industry Views of the Marine Environment and OWS effectiveness
These issues have been raised in various OWS literature. The survey provides further insight in this
matter in that it showed the actual responses of actual maritime employees. Since the responses were
anonymous, the respondents could answer with complete honesty.
In general, those in the maritime industry are aware of how much pollution ocean going merchant ships
actually cause. As stated in the primary analysis, within the maritime community, knowledge of
environmental precautions is very high. 87.5% had some idea of how effective an OWS is (Question 10).

33
When describing the effectiveness of an OWS, most maritime workers said that an OWS will only work
when constantly maintained and that they are “costly and problematic” (Question 12). According to the
maritime workers who responded to the survey, in the simplest terms, Oily Water Separators are a
nuisance to have on board ships.
Some specific examples of these comments include:
“In actual shipboard conditions, OWSs are virtually inoperable. I have never been on a ship (I am a
licensed Chief Engineer) where the OWS/bilge water treatment system worked properly. In my
experience, even the slightest amount of suspended sediment, sludge, or other contamination (show
me a clean bilge or holding tank and I'll show you a ship that isn't operating) renders them either
ineffective or needy to the point of requiring their operation to be the singular focus of the
engineering/maintenance department.”
“OWS are slightly better than adequate to perform the service of separating oil from water. However,
OWS are complex machines that require frequent repair and attention, making them less than ideal for
shipboard applications. In practice, they are not serviced as often or as professionally as required, and
this reduces their effectiveness.”
“Our company has three different types of OWS's. They each work very well in their own right, but do
require some fairly significant maintenance, servicing and calibration of OCMs.”
Only 16.4% responded that they work great (Question 11).
Findings Summary
After a deep analysis of the survey’s results and further investigation, a few points can be made:
1. While the views of those in the maritime industry did differ from the views of the general public,
they were not polar opposites.
2. The public is uneducated on both the maritime industry as a whole and the industry’s
environmental regulations and policies; the public’s view of the maritime industry tends to
come from the over-exaggerated media stories, like those described in the secondary analysis.
Also, those who were educated on maritime issues tended to have some relation to the
maritime industry.
3. The line between environmentalists and non-environmentalists is blurred; for example, a person
who has donated time/money to an environmental cause will not necessarily describe
themselves as an environmentalist.
34
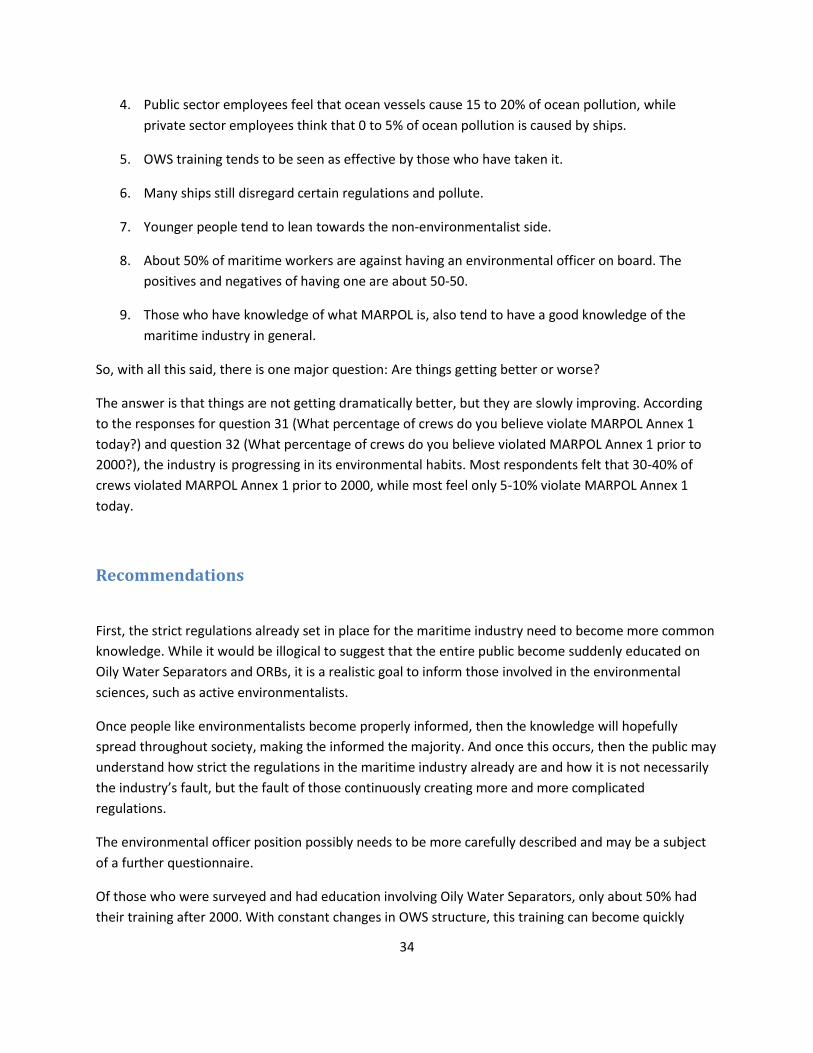
4. Public sector employees feel that ocean vessels cause 15 to 20% of ocean pollution, while
private sector employees think that 0 to 5% of ocean pollution is caused by ships.
5. OWS training tends to be seen as effective by those who have taken it.
6. Many ships still disregard certain regulations and pollute.
7. Younger people tend to lean towards the non-environmentalist side.
8. About 50% of maritime workers are against having an environmental officer on board. The
positives and negatives of having one are about 50-50.
9. Those who have knowledge of what MARPOL is, also tend to have a good knowledge of the
maritime industry in general.
So, with all this said, there is one major question: Are things getting better or worse?
The answer is that things are not getting dramatically better, but they are slowly improving. According
to the responses for question 31 (What percentage of crews do you believe violate MARPOL Annex 1
today?) and question 32 (What percentage of crews do you believe violated MARPOL Annex 1 prior to
2000?), the industry is progressing in its environmental habits. Most respondents felt that 30-40% of
crews violated MARPOL Annex 1 prior to 2000, while most feel only 5-10% violate MARPOL Annex 1
today.
Recommendations
First, the strict regulations already set in place for the maritime industry need to become more common
knowledge. While it would be illogical to suggest that the entire public become suddenly educated on
Oily Water Separators and ORBs, it is a realistic goal to inform those involved in the environmental
sciences, such as active environmentalists.
Once people like environmentalists become properly informed, then the knowledge will hopefully
spread throughout society, making the informed the majority. And once this occurs, then the public may
understand how strict the regulations in the maritime industry already are and how it is not necessarily
the industry’s fault, but the fault of those continuously creating more and more complicated
regulations.
The environmental officer position possibly needs to be more carefully described and may be a subject
of a further questionnaire.
Of those who were surveyed and had education involving Oily Water Separators, only about 50% had
their training after 2000. With constant changes in OWS structure, this training can become quickly

35
outdated. A required “refresher” course every 2 years or so would keep those dealing with Oily Water
Separators educated on recent changes to the systems. However, if a ship had an environmental officer
on board, the engineers would not have to go through this training.
You can only say this if you have data to show this. The maritime industry also must somehow prevent
the media from over-exaggerating issues dealing with the environment. When the media exaggerates
these issues, the public begins to think that the maritime industry is the evil polluter, which then leads
to complaints to the government for stricter environmental regulations. If the maritime industry could
co-operatively create a website where official data regarding oil spills, accidents, etc. is releases,
perhaps these starting news stories could be diluted by the truth.
Suggested Further Activities
One further activity which definitely should be done is a survey to see how educated the public is on the
maritime industry and its related components. The first 9 questions of this survey could be re-asked,
along with many other maritime-related questions to see in which areas the public lacks proper
knowledge.
Then, using the results, the various maritime organizations, such as IMO, can work towards educating
the public on those topics in which they are lacking proper knowledge. For example, if the public lacks a
proper knowledge of what percentage of ocean pollution is caused by ships, the maritime industry could
present data showing the other and more major causes of ocean pollution to both environmentalist and
media websites.
Comments by Hendrik “Rik” van Hemmen, Chair of SNAME T&R Panel EC-7
The analysis of survey and statistical data is always a complex process and there can be substantial
variation in interpretation from analyst to analyst. The interpretive sections above were prepared by Ed
Schembor and, while I have questioned issues of numerical accuracy, I have tried not to assert my
interpretations of the data managed and presented by him.
As such, the interpretations noted above are those made by Ed Schembor and will need to be defended
by him if questioned by the readers of this paper.
On the other hand, in introducing, coaching, and reviewing Ed’s work, I have spent a significant amount
of time with the survey data and independently provide the following observations that in my opinion
are significant and that appear to be supported by the survey data:

36
1. There are no widely varying opinions between maritime industry sectors, instead opinions tend
to be scattered throughout all sectors.
2. The public thinks that maritime industry oil pollution is a much higher portion of ocean pollution
than it is generally acknowledged to be and education of the public about this issue would be
worthwhile.
3. The survey indicates that teaching people about the general MARPOL approach first is a good
approach at driving higher general understanding of maritime pollution issues, rather than
getting into the nitty gritty of OWS, OCM and other acronyms. This finding was also supported in
some other recent work that involved Panel EC-7 and relates both to the public at large and the
marine industry at large. The maritime industry is doing a pretty good job, the public does not
know and first explaining MARPOL appears to be the most effective approach.
4. OWS equipment can work, but it is not easy equipment to use.
5. Training appears to be able to deal with a lot of the OWS issues that are encountered.
6. People are not born environmentalists; they become environmentalists.
7. There is insufficient awareness of environmental issues by ship designers, repairers and builders.
Mr. Schembor has uploaded the full data file in spreadsheet form to the EC-7 panel website at
http://www.sname.org/EC7EnvironmentalManagement/Home/ and the panel welcomes further review
and analysis.
While data in the form of numbers and statistics is significant, the very numerous essay answers and
comments also provide invaluable insight. This survey has shown that with increasing availability of data
the shipboard environmental management approach will continue to evolve.
Panel EC-7 thanks all of those who took the time to respond to the survey, the participation by many is
much more likely to result in the most effective solution of complex problems.
Acknowledgements
First and foremost, I would like to thank Mr. Rik van Hemmen for being the best mentor I could possibly
ask for. Not only did he teach me literally everything I know about the maritime industry, but he also
taught me everything I know about technical writing. Thanks to him, my interest in the engineering
industry has grown exponentially and it now may become my major.

37
The entire Martin & Ottaway staff should also be thanked, for being so kind and welcoming to me during
this process. Most businesses would have shunned a 16 year old, but they took me in and assisted me
with anything I needed.
I thank Horizon Lines for providing me with their 2011 student intern environmental award. I am
honored to have performed this task and deeply appreciate Horizon Lines’ recognition of my work and
the accompanying financial award in funding my college career.
Also, thank you to Abby van Hemmen for developing the survey and testing it in order to maximize that
amount of information gained from each question.
References
1. Van Hemmen, Hendrik F. Initial Recommendations for Bilge Oily Water Separator System Design
and Operation. Tech. Martin Ottaway. Print.
2. SNAME T&R. http://www.sname.org/directories/trcommittees/
3. Van Hemmen, Hendrik F. The Need for Additional Human Factors Considerations in Ship
Operations. Tech. Martin Ottaway. Print.
4. Van Hemmen, Hendrik F. Remarks on Oily Water Separators. Tech. Martin Ottaway. Print.
5. Dolinar, Lou. "Slippery Oil, Slipshod Coverage." National Review Online. 31 Aug. 2010. Web.
http://www.nationalreview.com/articles/245201/slippery-oil-slipshod-coverage-lou-dolinar.
6. "Environment." Gallup. 2011. Web. <http://www.gallup.com/poll/1615/environment.aspx#1>.
7. "Environmentalists Vs Boatyards." Pacific Northwest Boating June 2006. Web.
<http://www.boatkb.com/Uwe/Forum.aspx/boats/10170/Environmentalists-Vs-Boatyards-
Maybe-even-a-boatyard-near-you>.
8. "Harris Poll on Green Living." The Nature Conservancy. 25 Oct. 2010. Web.
<http://www.nature.org/greenliving/gogreen/everydayenvironmentalist/harris-poll-on-green-
living.xml>.
9. Michaels, Patrick J. "Drought Scare Goes Up in Smoke." Heartlander Magazine. The Heartland
Institute. Web. 1 Oct. 2006. <http://news.heartland.org/newspaper-
article/2006/10/01/drought-scare-goes-smoke>.
10. "Oil Water Separators." Anchorage Tank & Welding Inc., 1 Feb. 2007. Web. 28 Aug. 2011.
<http://www.anchoragetank.com/Oil_Water_Separators/oil_water_separators.html>.

38
11. Sheppard, Noel. "Media Myth Debunked: Almost No Temperature Records Broken in Last
Week's 'Record-Breaking Heat' | NewsBusters.org." NewsBusters. 24 July 2011. Web.
<http://newsbusters.org/blogs/noel-sheppard/2011/07/24/media-myth-debunked-almost-no-
temperature-records-broken-last-weeks-r>.
12. Tesch, Danielle, and Willett Kempton. "Who Is an Environmentalist? The Polysemy of
Environmentalist Terms and Correlated Environmental Actions." College of Arts and Sciences.
University of Southern Florida, 2004. Web.
<http://www.gallup.com/poll/1615/environment.asp>.
13. "The American Environmental Values Survey." (2006). Eco America. Eco America / SRI
Consulting, Oct. 2006. Web.
<http://ecoamerica.typepad.com/blog/files/ecoAmerica_AEVS_Report.pdf>.
14. Williams, Walter E. "Average Americans." Econ Faculty. George Mason University, Mar. 2003.
Web. <http://econfaculty.gmu.edu/wew/articles/fee/average.html>.
15. “Southern California Wildfires and Global Warming: No Connection.” Center for Science and
Public Policy. 24 October 2007.
<http://www.ff.org/index.php?option=com_content&task=view&id=393>
16. "Environment." Gallup. 2009. Web. <http://www.gallup.com/poll/116590/increased-number-
think-global-warming-exaggerated.aspx