Community attitudes to privacy survey
49
Community Atudes to Privacy survey Research Report 2013 Protecting information rights — advancing information policy
Transcript of Community attitudes to privacy survey

Community Attitudes to Privacy survey
Research Report
2013
Protecting information rights — advancing information policy

THE OFFICE OF THE AUSTRALIAN INFORMATION COMMISSIONER WOULD LIKE TO THANK THE FOLLOWING SPONSORS FOR THEIR SUPPORT OF
THE COMMUNITY ATTITUDES TO PRIVACY SURVEY
Primary Sponsor
Key Sponsor
Sponsor
PREPARED FOR THE OFFICE OF THE AUSTRALIAN INFORMATION COMMISSIONER BY

The Office of the Australian Information Commissioner (OAIC) was established on 1 November 2010 by the Australian Information Commissioner Act 2010.
All OAIC publications can be made available in a range of accessible formats for people with disabilities. If you require assistance, please contact the OAIC.
ISBN 978-1-877079-76-4
Creative Commons
With the exception of the Commonwealth Coat of Arms, this report Community attitudes to privacy survey, Research report 2013 is licensed under a Creative Commons Attribution 3.0 Australia licence (http://creativecommons.org/licenses/by/3.0/au/deed.en).
This publication should be attributed as: Office of the Australian Information Commissioner, Community attitudes to privacy survey, Research report 2013 .
Enquiries regarding the licence and any use of this report are welcome at:
Office of the Australian Information CommissionerGPO Box 2999CANBERRA ACT 2601Tel: 02 9284 9800TTY: 1800 620 241 (no voice calls)Email: [email protected]

TABLE OF CONTENTS
1.0 Summary of key findings 3
The survey ........................................................................................................................ 3
The findings ...................................................................................................................... 3
2.0 Background and objectives 7
Previous surveys ............................................................................................................... 7
3.0 Methodology 9
Data collection ................................................................................................................. 9
Sample — source and management .............................................................................. 11
Questionnaire development ........................................................................................... 11
Pilot study ...................................................................................................................... 12
Weighting ....................................................................................................................... 12
Analysis .......................................................................................................................... 14
Definitions ...................................................................................................................... 14
4.0 Detailed findings 15
Awareness of Federal privacy laws ................................................................................ 16
General attitudes towards privacy and personal information ....................................... 17
Privacy problems and complaints .................................................................................. 22
Trust ............................................................................................................................... 23
Personal responsibility ................................................................................................... 29
Medical and health information .................................................................................... 30
Privacy in the workplace ................................................................................................ 32
Identification document scanning .................................................................................. 34
Internet and smartphones ............................................................................................. 36
ID theft and fraud........................................................................................................... 43
Credit reporting .............................................................................................................. 44
5.0 Appendix 1: Questionnaire 47
OAIC | Community Attitudes to Privacy Research Report
Office of Australian Information Commissioner 2
OAIC | Community Attitudes to Privacy Research Report
f
I
f
(
i
Office of Australian Information Commissioner 3
1.0 Summary of key findings
The survey
The 2013 Office of the Australian Information Commissioner (OAIC) Community Attitudes to Privacy
study aims to measure Australians’ changing awareness and opinions about privacy, as well as their
expectations in relation to the handling of their personal information. The study also seeks views
on a range of privacy issues, such as online privacy, credit reporting and privacy in the workplace.
The study has been conducted since 1990 and was last undertaken in 2007. All previous studies
were conducted by telephone, and respondents were selected at random from an electronic listing
of telephone numbers.
The number of Australians with a listed fixed line phone is declining and the proportion of younger
Australians with a fixed line phone is even lower. Therefore, it was decided to conduct the 2013
study by telephone, but this time using lists of fixed line and mobile phones as well as numbers
generated at random and checked against known live numbers. During July 2013, 1,000 Australians
rom a range of age groups, locations and backgrounds were contacted and agreed to participate.
Some questions asked in this study have been asked before and trend data are available. However,
a number of questions were modified to reflect advances in technology as well as changes in
privacy laws. In particular, questions relating to health information, online privacy, privacy in the
workplace and ID theft and fraud were heavily modified. The survey includes a number of new
questions, including questions about online tracking, smart phones, social networking, credit
reporting and what actions people take to protect their own privacy.
The OAIC was keen to conduct the survey this year as the Australian public, businesses and
government agencies prepare for significant changes to the Privacy Act 1988 (Privacy Act) that are
due to take effect from March 2014.
The findings
n the context of talking about personal information, Australians believe the biggest privacy risks
acing people are online services — including social media sites. Almost a half of the population
48%) mentioned these risks spontaneously. A quarter (23%) felt that the risk of ID fraud and theft
was the biggest, followed by data security (16%) and the risks to financial data in general (11%).
Young Australians were most concerned about personal information and online services, with six in
ten (60%) mentioning this as a privacy risk. There were other concerns, but none of the others were
mentioned as a major risk by more than one in ten Australians.
This new, opening survey question gave context to the rest of the interview. The one in six (17%)
Australians who regret something they have posted on a social networking site together with the
ncreasing proportion of the population that has been affected by ID fraud and theft, or knows
someone who has, have clearly been affected by their experiences. Two thirds (69%) are concerned
that they may become a victim in the next year — a significant increase on the situation six years
ago (60%). One third (33%) of Australians say that they have had problems with the way that their
personal information was handled in the previous year.
OAIC | Community Attitudes to Privacy Research Report
Office of Australian Information Commissioner 4
Another trend that has no doubt served to underpin increasing caution amongst Australians is the
increasing proportion of the population that is aware of Federal privacy laws (82% versus 69% in
2007). Presumably the public is also aware of other consumer protection laws, given the increased
proportion of the community that has made a complaint about misuse of their personal
information to a number of different ombudsmen, including the OAIC. A worrying finding is that
while people now seem to have a better understanding of how ombudsmen schemes operate, a
quarter (27%) does not know who to report their problems to — a significant increase on the
situation six years ago (20%).
The use of personal information such as revealing one customer’s data to another customer (97%),
information being used for a purpose other than the reason for which it was given (97%), and being
contacted by an unfamiliar organisation (96%) is considered almost universally to be inappropriate.
Related to this, the backlash against unsolicited marketing activity is gaining pace, with the majority
feeling annoyed (56%) with the contact or concerned about how their details were obtained by the
organisation contacting them (39%). In 2013, just under half (45%) were annoyed by this activity
versus just over a quarter (27%) in 2007. Australians were less likely to feel it was “a bit annoying,
but mostly harmless” (11% in 2013 versus 23% in 2007).
The majority of Australians do not like their personal information being sent offshore. Eight in ten
(79%) believe this to be a misuse of their personal information and nine in ten (90%) have concerns
about the practice.
Australians are not keen on having their activities monitored covertly on the internet (78% are
uncomfortable with this practice) and having sales and marketing approaches made to them based
on their actions (69% are uncomfortable). However, they prefer this activity to the idea of having
information on their behaviour stored in databases to be used to target offers at them (77% are
uncomfortable).
The majority believes that most or all websites (59%) and smartphone apps (48%) collect
information about the user and are uncomfortable with this practice. The result is that a growing
number of people are taking pre‐emptive measures to protect their information, from nine in ten
(90%) refusing to provide personal information in some circumstances, to eight in ten (78%)
checking the security of websites before entering personal data, to seven in ten (72%) clearing their
internet browsing history, to six in ten (62%) opting not to use smartphone apps because of
concerns about the way personal information would be used. Still only three in ten falsify their
name (30%) or details (32%) in order to protect themselves.
The majority (60%) believes that social networking is mainly a public activity where information can
be seen by many people. One in six (17%) has posted something onto a social networking site that
they regret, rising to a third (33%) amongst young people.
In the face of these results it might seem strange that a slight majority (51%) continues not to read
online privacy policies. The reasons that these policies are not read are concerning — it is because
they are considered to be too long (52%), complex (20%) or boring (9%). The large minority (37%)
reading privacy policies are rewarded by gaining the information they need to decide whether or
not to use the site.

OAIC | Community Attitudes to Privacy Research Report
Office of Australian Information Commissioner 5
Over time this study has sought to understand the level of trust that Australians have in the way
that organisations handle their personal information. It is still the case that Australians have more
trust in government entities (69%) than most private enterprises, with the exception of health
organisations (90%) and financial institutions (74%). Notable shifts in levels of trust since 2007 are
an increase in trust in financial institutions (58% to 74%); insurance companies (46% to 54%); real
estate agents (25% to 33%) and eCommerce companies (18% to 26%). The only type of company to
be considered less trustworthy was market and social research organisations (35% to 30%).
The majority (60%) of Australians have decided not to deal with a private company due to concerns
as to how their personal information will be used, and nearly a quarter (23%) has decided not to
deal with a public organisation.
The public expects similarly high standards of transparency in data handling from all types of
organisations with almost universal agreement that organisations should inform them if their
personal information is lost and how they protect and handle personal information in the first
place. For government agencies, nearly all Australians (96%) believe that they should tell them how
their personal information is stored and protected, and that they should be informed if their
personal information is lost (96%). The results for private businesses are similar (95% and 96%
respectively).
Half (49%) of Australians continue to be most reluctant to provide financial details to organisations,
but a small but growing proportion is reluctant to provide address (7%), date of birth (6%) or home
phone number (4%) details. Nonetheless, over a quarter of the population is prepared to provide
personal information in exchange for improved service (34%) or reduced prices (28%).
Reluctance to provide medical information has fallen (from 25% in 2001 to 7% in 2013). Related to
this, the proportion that is prepared to have information shared is rising, with two thirds (66%)
prepared to accept their doctor discussing their health information with other health professionals
versus six in ten (59%) in 2007.
Australians do see circumstances in which personal liberties can be outweighed by the public good
as well. In the workplace, over nine in ten Australians believe it is acceptable for employers of
people: operating heavy machinery (96%); handling dangerous substances (95%); operating
vehicles on company business (94%); or dealing with children and young people (91%), to undergo
random drug and alcohol tests. Having said this, they expect employers engaged in these or
surveillance activities to have policies in place that govern their use (85%).
Biometric data are widely available and its use concerns Australians. The majority is concerned with
the need for the use of such information to access licensed premises (71%), the workplace or place
of study (55%) and to do day‐to‐day banking (54%), but the minority (40%) is concerned with using
it to get on a flight. Related to this, scanning identification documents is considered to be
acceptable in order to obtain a credit card (69%), but not for more everyday activities such as
purchasing general goods — even those which require the purchaser to be an adult (31%), entry to
licensed premises (28%), or to purchase cigarettes (24%). Scanning identification was strongly
opposed for other general goods (95% believed it is unacceptable).

OAIC | Community Attitudes to Privacy Research Report
Office of Australian Information Commissioner 6
Finally the survey asked Australians about their understanding of credit reporting. Half (48%)
believe that they can access their information but that they may have to pay to do so, a quarter
(26%) believe that their information is freely available and one in six (17%) believe that it cannot
access the data at all. The balance, one in ten (9%), professes to have no knowledge on how the
provisions work. One in six (17%) Australians claimed to have accessed their credit report and four
in ten (43%) of these people were charged for access. Happily, in most cases (70%) the information
contained in the report was correct. Almost six in ten (57%) of those people who reported incorrect
information in their reports were able to have the information corrected. Nonetheless, four in ten
(39%) of those with incorrect information chose not to complain. The people who did complain
largely chose to do so to the organisation involved.
OAIC | Community Attitudes to Privacy Research Report
Office of Australian Information Commissioner 7
2.0 Background and objectives
The Office of the Australian Information Commissioner (OAIC) is an independent Australian
Government agency established under the Australian Information Commissioner Act 2010.
The OAIC has three primary functions:
• privacy functions, conferred by the Privacy Act 1988 (Privacy Act) and other laws
• freedom of information (FOI) functions, in particular, oversight of the operation of the Freedom
of Information Act 1982 (FOI Act) and review of decisions made by agencies and ministers
under that Act
• government information policy functions, conferred on the Australian Information
Commissioner under the Australian Information Commissioner Act 2010.
The OAIC Community Attitudes to Privacy study aims to understand Australians’ changing
awareness and opinions about privacy, as well as their expectations in relation to the handling of
their personal information. The study also seeks views on a range of particular issues, including
online privacy, credit reporting and privacy in the workplace.
The objectives of the 2013 study include:
• to assist in the OAIC’s dispute resolution, regulation and strategy work, and communications
work
• to provide information on privacy trends and developments for the OAIC’s stakeholders
• to map changes in community attitudes since the last research and to use this information as a
benchmark for future studies.
It is also worth noting that the FOI Act states that information held by the Australian Government is
a national resource, and is to be managed for public purposes. In practice, this means that the OAIC
is committed to making public sector information more readily and freely available to the public to
maximise its reuse and value. In this regard, the OAIC will make the de‐identified data available on
data.gov.au, an Australian Government initiative that provides an easy way to find, access and
reuse public datasets from the Australian Government.
Previous surveys
In 1990, 1991, 1993 and 1994, the Privacy Commissioner (as part of the then Human Rights and
Equal Opportunity Commission) conducted surveys to measure changes in public attitudes towards
and awareness of privacy‐related concerns to which their activities may have contributed. Major
research studies were subsequently undertaken by the former Office of the Privacy Commissioner
(OPC) in 2001, 2004 and 2007, to assist the OPC to prioritise its activities based on public concerns.
The 2007 research consisted of a quantitative survey of community attitudes. A national phone
survey of 1,503 adults was undertaken using Computer‐Assisted Telephone Interviewing (CATI).
The average time taken for the survey was 26 minutes, although it ranged up to 45 minutes.
There have been a number of significant developments in the privacy environment since the 2007
survey that shaped the current study.

OAIC | Community Attitudes to Privacy Research Report
Office of Australian Information Commissioner 8
The last study provided information for the then OPC to use in its submission to the Australian Law
Reform Commission (ALRC) inquiry into Australian privacy law and practices.
The ALRC released its report For Your Information: Australian privacy law and practice (ALRC Report
108) in 2008, and the Australian Government released a response to a number of the
recommendations of the report.
In November 2012, the Privacy Amendment (Enhancing Privacy Protection) Amendment Act 2012
(Cth) was passed. This Act amends the Privacy Act to implement the major legislative elements of
the Government’s first stage response to the ALRC report. Key changes include a set of new
harmonised privacy principles (known as the Australian Privacy Principles) that will regulate the
handling of personal information by both Australian government agencies and businesses, changes
to credit reporting laws, and enhanced enforcement powers for the OAIC.
Further, major changes to Federal FOI law made in 2010 established the OAIC as the body
responsible for all three of these functions. The Office of the Privacy Commissioner, which was the
national privacy regulator, was integrated into the OAIC at this time.
In the six years since 2007 technology, in particular, has changed. For example, in 2007 social
networking site Facebook had 21 million registered members1. By the middle of 2013 it had over
980 million. In 2007, Twitter reported 400,000 tweets per quarter2, by 2011 users were tweeting
140 million tweets per day3.
The gigantic uptake of online activity has led to an age of ‘big data’. Online activity, such as online
shopping, has seen a sharp rise in the provision of personal information online in exchange for
goods, services and other benefits.
Coupled with this is a dramatic increase in smart phone and tablet ownership and the way in which
these devices are used has also changed. For example, Apple launched the first iPhone in June
2007. These devices have combined a phone with other functionality that will often rely on the
provision of additional information about the user, including location information.
There have also been a number of changes in the market research industry that have shaped the
approach taken to this survey. These changes include the review of the industry’s privacy code,
changes in telephone number sampling products and random digit dialling, changed views about
the benefits of online surveys and new software and hardware enabling true multi‐mode
deployment of complex samples.
Clearly, these changes in technology and the public’s behaviour in relation to the provision of
personal information, along with business and government’s ability to collect and use this
information are all worthy of investigation. These themes are now woven into the study to ensure
these trends can be mapped into the future.
1 Lange, Ryan. and Lampe, Cliff. "Feeding the Privacy Debate: An Examination of Facebook" Paper presented at the annual meeting of the International Communication Association, TBA, Montreal, Quebec, Canada, May 22, 2008: p.20 2 Beaumont, Claudine (February 23, 2010). "Twitter Users Send 50 Million Tweets Per Day – Almost 600 Tweets Are Sent Every Second Through the Microblogging Site, According to Its Own Metrics". The Daily Telegraph (London). 3 https://blog.twitter.com/2011/numbers

OAIC | Community Attitudes to Privacy Research Report
Office of Australian Information Commissioner 9
3.0 Methodology
Following the 2007 study, Wallis prepared a detailed methodology report that raised a number of
issues with the methodology that had been used up to that point. While it has always been difficult
to interview young adults, especially those aged 18‐24, because they are highly mobile, the
increasing trend for this age group to use only mobile communications posed a problem for fixed
line telephone surveying, if the views of this group were to be included at reasonable cost. In
addition, the proportion of households relying solely on a fixed line phone is declining, although
still around eight in ten households (80%) have a fixed line phone.
In 2007, online research was becoming increasingly popular. Online research respondents are pre‐
recruited and some of their characteristics are known. This made the technique particularly useful
for ensuring a fast turnaround of respondents to pre‐arranged specifications. Wallis suggested
boosting telephone interviews with interviews conducted online, particularly for the younger age
groups.
Since 2007, the approach to online research has matured. Many surveys have been conducted and
providers of online surveys are now wary of over‐researching younger people in their pre‐recruited
respondent panels. In addition, we now know that mobile young Australians are no more
interested in completing surveys online than they are in talking on the telephone. In the interim,
new listings of connected mobile telephone numbers have become available and it was decided to
continue to interview Australians by telephone but using a mixed starting sample of fixed and
mobile phone numbers.
Data collection
Data for this study was collected through Computer Assisted Telephone Interviewing (CATI)
between 13 June and 10 July 2013. All calls were made from Wallis Consulting Group’s CATI facility
in Melbourne. In total 1,000 interviews were completed with Australians aged over 18 years of age.
Quotas were set for age and location to ensure that the sample was broadly representative of the
Australian population and that there were enough responses in each group of interest for robust
analysis. The actual number of interviews completed by location is shown in Table 1. Table 2 shows
the number of interviews conducted by age groups and Table 3 shows the number broken down by
gender.
For the purpose of this report, due to rounding, percentages may not add to 100 per cent.

OAIC | Community Attitudes to Privacy Research Report
Office of Australian Information Commissioner 10
Table 1. Achieved responses versus population by location
Location Base n Base % Pop. %
NSW/ACT (sub‐total) 328 32.8 33.9
Sydney 193 19.3 20.5
Rest of NSW/ACT 135 13.5 13.3
VICTORIA (sub‐total) 263 26.3 25.1
Melbourne 191 19.1 18.9
Rest of VIC 72 7.2 6.3
QUEENSLAND (sub‐total) 195 19.5 19.8
Brisbane 104 10.4 9.5
Rest of QLD 91 9.1 10.3
SOUTH AUSTRALIA (sub‐total) 85 8.5 8.5
Adelaide 56 5.6 5.8
Rest of SA /NT 29 2.9 2.6
WESTERN AUSTRALIA (sub‐total) 105 10.5 10.3
Perth 82 8.2 8.1
Rest of WA 23 2.3 2.3
TASMANIA (sub‐total) 24 2.4 2.3
Hobart 9 0.9 1.0
Rest of TAS 15 1.5 1.3
TOTAL 1000 100.0 100.0
Table 2. Achieved responses versus population by age groups
Table 3. Achieved responses versus population by gender
The interview took 26 minutes, on average, for respondents to complete. The questionnaire used
for the study is available at Appendix One.
Age Base n Base % Pop. %
18 to 24 104 10.4 12.2
25 to 34 119 11.9 17.9
35 to 54 308 30.8 36.4
55 to 64 274 27.4 15.1
65 and over 195 19.5 18.3
Total 1000 100.0 100.0
Gender Base n Base % Pop. %
Male 432 43.2 48.8
Female 568 56.8 51.2
Total 1000 100.0 100.0

OAIC | Community Attitudes to Privacy Research Report
Office of Australian Information Commissioner 11
Sample — source and management
This study used a dual‐frame sampling approach; that is, including both mobile and fixed line phone
numbers in the starting sample. This sampling frame gives almost universal access to Australians.
One of the limitations of using mobile phone sampling is that it is not possible to determine the
location of the telephone’s owner, which is important for the study given the critical importance
that respondents are not called at inappropriate times as well as the logistics of filling location‐
based quotas. For this reason, and partly to keep the project within budget, the proportion of
mobile phone numbers was lower than fixed line numbers.
To accommodate the dual‐frame approach, the sample included Random Digit Dialling (RDD)
mobile and fixed line numbers generated by SampleWorx, as well as additional sample of fixed line
telephone numbers provided by SamplePages. Both sample sources are only available for the
purposes of market and social research.
The decision to use RDD mobile and fixed line numbers as the primary source for the sample was
made to ensure that the respondent base was as free from bias as possible. The RDD process takes
known number ranges for Australian fixed line and telephone numbers and generates phone
numbers in those ranges randomly. For mobile RDD, these numbers are verified as “live” by the
sample provider prior to inclusion in the sample.
The inclusion of a mobile sample facilitated the sending of SMS messages to sample members.
After they had been called once with no contact made, 4,411 sample members were sent an SMS
with the following wording:
We are contacting you on behalf of the Office of the Australian Information Commissioner to do a
survey on privacy. Wallis market and social research will call you from 03 9940 2###. You do not have
to do the survey. When we call, let us know and we will not call again. More info: www.oaic.gov.au
or www.wallisgroup.com.au.
They were able to reply to the message to opt out of the study. In total 96 replied with 85 opting
out of the study.
The standard ring time for the project was increased to 30 seconds to allow sufficient time for
sample members with mobile phones to locate the phone and answer it.
Questionnaire development
The questionnaire was based on the last Community Attitudes to Privacy Study conducted in 2007.
The questionnaire was developed for the 2013 study by the OAIC in consultation with an internal
steering committee comprised of representatives from the OAIC’s three branches — Dispute
resolution, Regulation and strategy and Corporate support and communications.
The Privacy Advisory Committee — a Committee established under the Privacy Act and comprising
of representatives from unions, health service providers, business and government as well as a
consumer representative — was also consulted. The study’s primary sponsor, the Commonwealth
Bank of Australia, was provided with an opportunity to contribute a question to the survey. The
OAIC | Community Attitudes to Privacy Research Report
Office of Australian Information Commissioner 12
Commonwealth Bank provided feedback on a number of areas covered by the survey but did not
seek the addition of a question.
A number of questions were retained in the form that they had been asked since the study was first
conducted in 2001. These questions relate to awareness of privacy laws and trust in organisations.
Most other questions were modified slightly to reflect changes that have occurred. For example
the last study contained a set of questions on attitudes towards CCTV, which was a big issue in
2007. Similarly, a question on trustworthiness of industry sectors was modified to include social
media and technology companies, which were in their infancy then.
Some new questions were added, including questions on what people regard as the biggest privacy
risks, transparency of information handling practices, data loss, online tracking, smart phones,
social networking, the actions people take to protect their own privacy, and credit reporting.
It was also decided to define the scope for the study at the beginning of the questionnaire by
providing the following information:
In Australia, privacy law relates to the protection of an individual’s ‘personal information’. This is
any information about you that identifies you or could reasonably be used to identify you. For
example, this includes things like:
• your name or address
• financial details
• photos
• your opinions and beliefs
• membership of groups and affiliations
• racial or ethnic origin
• health information (including genetic information)
• sexual preferences
• criminal record.
Pilot study
A pilot study comprising 21 interviews was conducted on 6 June 2013. The pilot aimed to test the
questionnaire for sense and duration. While the questionnaire was deemed by the pilot team to
have good flow and was well understood by respondents, it ran for 28 minutes. Following the pilot
the questionnaire was modified slightly to reduce the overall length. The main method used to do
this was to assess each question and to combine together some that were measuring very similar
ideas. Nonetheless, nearly all questions were deemed to be essential to the study and the average
length was only shortened by two minutes.
Weighting
The data were weighted for age, sex and location to adjust it to represent the Australian
community. As interviewing quotas had been set for age and location to reflect the actual numbers
in the population, the effect of the weighting was minimal.
OAIC | Community Attitudes to Privacy Research Report
Office of Australian Information Commissioner 13
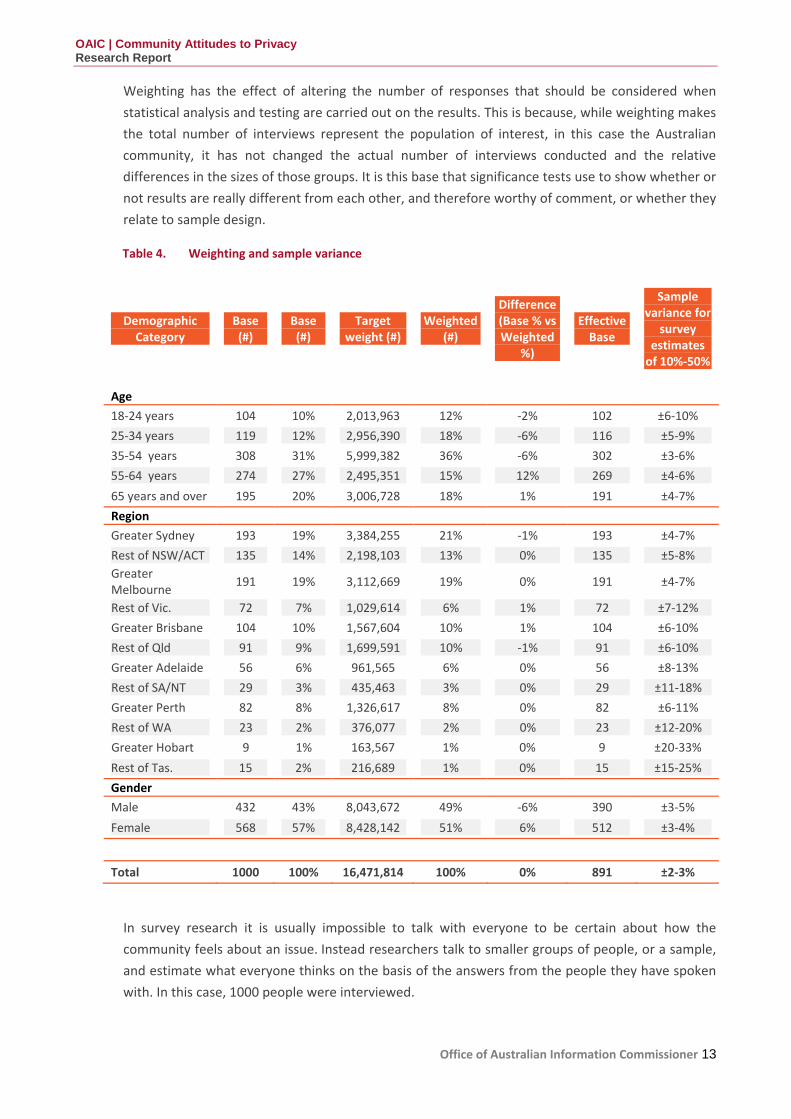
Weighting has the effect of altering the number of responses that should be considered when
statistical analysis and testing are carried out on the results. This is because, while weighting makes
the total number of interviews represent the population of interest, in this case the Australian
community, it has not changed the actual number of interviews conducted and the relative
differences in the sizes of those groups. It is this base that significance tests use to show whether or
not results are really different from each other, and therefore worthy of comment, or whether they
relate to sample design.
Table 4. Weighting and sample variance
Demographic Category
Base (#)
Base (#)
Target weight (#)
Weighted (#)
Difference (Base % vs Weighted
%)
Effective Base
Sample variance for
survey estimates of 10%‐50%
Age
18‐24 years 104 10% 2,013,963 12% ‐2% 102 ±6‐10%
25‐34 years 119 12% 2,956,390 18% ‐6% 116 ±5‐9%
35‐54 years 308 31% 5,999,382 36% ‐6% 302 ±3‐6%
55‐64 years 274 27% 2,495,351 15% 12% 269 ±4‐6%
65 years and over 195 20% 3,006,728 18% 1% 191 ±4‐7%
Region
Greater Sydney 193 19% 3,384,255 21% ‐1% 193 ±4‐7%
Rest of NSW/ACT
Greater Melbourne
135
191
14%
19%
2,198,103
3,112,669
13%
19%
0%
0%
135
191
±5‐8%
±4‐7%
Rest of Vic. 72 7% 1,029,614 6% 1% 72 ±7‐12%
Greater Brisbane 104 10% 1,567,604 10% 1% 104 ±6‐10%
Rest of Qld 91 9% 1,699,591 10% ‐1% 91 ±6‐10%
Greater Adelaide 56 6% 961,565 6% 0% 56 ±8‐13%
Rest of SA/NT 29 3% 435,463 3% 0% 29 ±11‐18%
Greater Perth 82 8% 1,326,617 8% 0% 82 ±6‐11%
Rest of WA 23 2% 376,077 2% 0% 23 ±12‐20%
Greater Hobart 9 1% 163,567 1% 0% 9 ±20‐33%
Rest of Tas. 15 2% 216,689 1% 0% 15 ±15‐25%
Gender
Male 432 43% 8,043,672 49% ‐6% 390 ±3‐5%
Female 568 57% 8,428,142 51% 6% 512 ±3‐4%
Total 1000 100% 16,471,814 100% 0% 891 ±2‐3%
In survey research it is usually impossible to talk with everyone to be certain about how the
community feels about an issue. Instead researchers talk to smaller groups of people, or a sample,
and estimate what everyone thinks on the basis of the answers from the people they have spoken
with. In this case, 1000 people were interviewed.

OAIC | Community Attitudes to Privacy Research Report
Office of Australian Information Commissioner 14
People in the sample are chosen to represent the community and, as explained earlier, minimum
numbers of people are required to make reliable estimates. Nonetheless, it is impossible to be
completely certain that a sample of respondents thinks exactly the same way as everyone making
up the population. There are, therefore some errors inherent in making an estimate from a smaller
group of the population. In addition, there is an issue of variability. Every time a survey is
conducted there is a likelihood that the survey results may differ slightly as the same people are
not being interviewed. Quite small total numbers of interviews may, nonetheless, give very
accurate estimates. The total sample of 1,000 gives answers that will fall within a 2‐3% error range,
the bulk of the time.
Researchers run “significance” tests to check if differences between two results are real or whether
they have happened because of variability. The standard approach is to report on findings at the
95% level. This means that if the survey is repeated 100 times, 95 times out of 100 times, the
results would be within the same error range. Table 4 shows the error limits for variables that are
used in analysis. Thus, readers can be confident that all results reported are based on findings that
are real and different by at least the amounts shown in the table, which for age is 3‐10%,
depending on age group, and for gender is 3‐5%.
The sample variance is at its greatest the closer to 50% the results are and at its least the closer to
0% or 100%. Table 4 shows the accuracy of survey estimates for the analytical variables for 10%
and 50% — most answers will fall somewhere between these two, but significance tests calculate
the actual value for every number.
Analysis
The data from this study and the 2007 study were cross‐tabulated and significance tests were run
on the data at the 95% confidence interval as outlined earlier. Cross‐tabulation involves
automatically adding up all the responses to a question by some variables that are of interest, for
example, age, gender or location. The analyst can then see patterns of response and whether there
are any different responses between variables, and whether variables are dependent on others. For
example, there is a clear relationship between increasing level of education achieved and
increasing household income.
Definitions
Most definitions used are self‐explanatory, for example, age groups, geographic location and
gender. Throughout this report people working in different types of occupations are referred to as
“blue collar” and “white collar”. These are standard classifications used by the Australian Bureau of
Statistics and follow the Australia and New Zealand Standard Classification of Occupations
(ANZSCO). White collar refers to people working in largely office based roles and includes
Managers, Professionals, Community and Personal Service Workers, Clerical and Administrative
Workers, and Sales Workers. Blue collar refers to people working in mainly manual occupations and
includes Technicians and Trades Workers, Machinery Operators and Drivers, and Labourers. These
groups are divided into upper and lower. For white collar workers “upper” generally denotes
managers or professionals while lower refers to more clerical positions. For blue collar workers
“upper” generally denotes skilled trades people while “lower” refers to unskilled workers.

OAIC | Community Attitudes to Privacy Research Report
Office of Australian Information Commissioner 15
This study of community attitudes to privacy covered a number of key areas, namely:
• awareness of Federal privacy laws
• general attitudes towards privacy and personal information
• privacy problems and complaints
• trust
• personal responsibility
• medical and health information
• privacy in the workplace
• ID scanning
• internet and smart phones
• ID theft and fraud
• credit reporting.
The survey findings are organised under these key headings. The questionnaire, which is appended,
does not follow this same structure exactly as it was more important to ensure that questions
flowed logically for the respondent than for the analyst.
Definition of ‘personal information’
In Australia, privacy law relates to the protection of an individual’s personal information. Therefore,
a number of survey questions refer to ‘personal information’. As this was a lengthy survey, the
decision was taken to provide respondents a definition of what is meant by personal information
based on the definition in the Privacy Act.
In Australia, privacy law relates to the protection of an individual’s ‘personal information’. This is
any information about you that identifies you or could reasonably be used to identify you. For
example, this includes things like:
• your name or address
• financial details
• photos
• your opinions and beliefs
• membership of groups and affiliations
• racial or ethnic origin
• health information (including genetic information)
• sexual preferences
• criminal record.
In previous studies, while the line of questioning aimed to keep respondents focussed on the area
of interest, some of the answers showed that they were straying into the area of personal space in
their answers.
4.0 Detailed findings

OAIC | Community Attitudes to Privacy Research Report
Office of Australian Information Commissioner 16
Giving survey participants a working definition early in the survey does not seem to have had a
major impact on answers to questions that have been asked before. It has, naturally, affected the
range of answers given to open‐ended questions, particularly those at the beginning of the survey
where participants were asked to define perceived privacy risks and areas of perceived
infringement of their privacy.
Factors that may have influenced responses
Not surprisingly privacy has rarely been out of the news since the study was last conducted in 2007.
The media continues to report on exciting new technologies that raise privacy questions, as well as
significant invasions of privacy and data breaches.
Not long before the study commenced the media started to report on US intelligence surveillance
programs that involved the participation of technology companies that offer a range of popular
online services. Public debate on these revelations grew significantly during the life of the survey
and may have had some effect on how people chose to respond to some of the survey questions, in
particular questions on general attitudes to privacy, trust and the internet.
Awareness of Federal privacy laws
The Privacy Act is an Australian law that regulates the handling of personal information about
individuals. This includes the collection, use, storage and disclosure of personal information.
The Privacy Act is of pivotal importance to this study.4 One of the key reasons for undertaking this
study now is to gain a baseline measure of understanding prior to introduction of amendments to
the Privacy Act in March 2014. Nonetheless, the name of the legislation will remain the same.
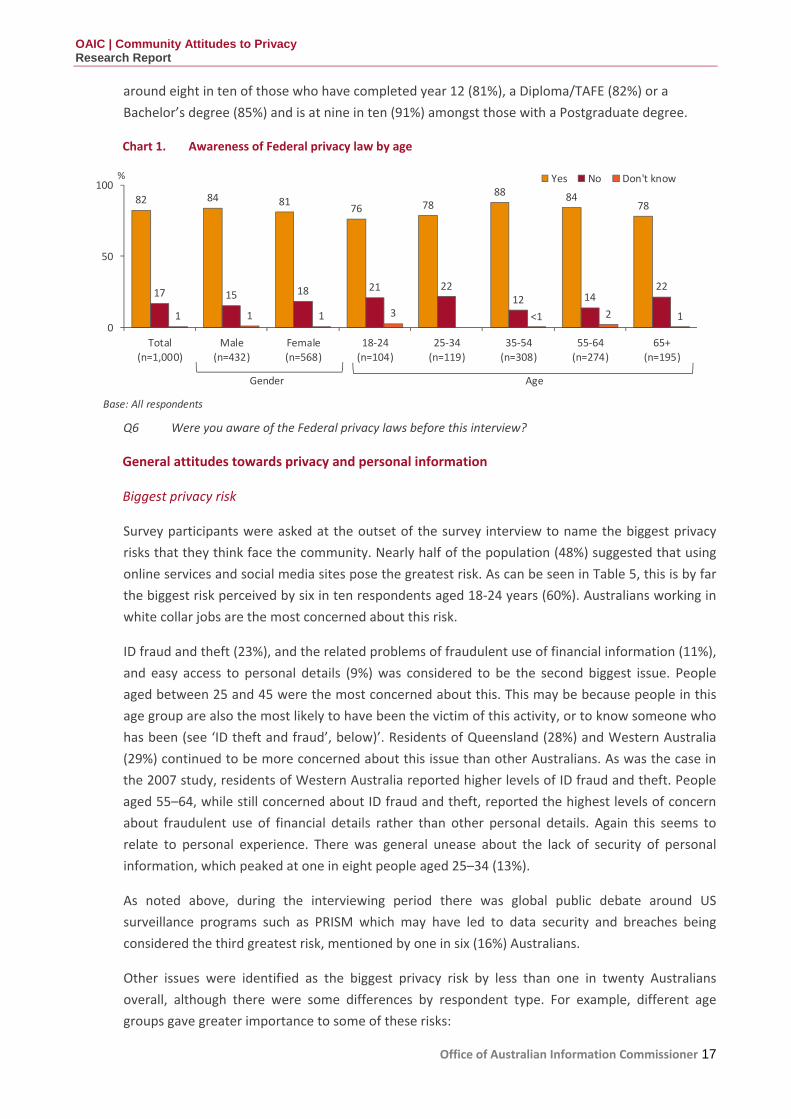
Chart 1 shows that the vast majority (82%) of Australians claimed to be aware of Federal privacy
laws prior to this interview. The proportion of respondents who reported they were not aware was
one in six (17%) and a very small proportion (1%) of respondents indicated they were unsure.
This compares favourably to the result when last measured when two thirds of Australians claimed
awareness of the laws (69%). It continues a gradual increase in awareness from its low point when
first measured in 2001 at just over four in ten (43%) to a majority awareness in 2004 of six in ten
(60%).
The pattern of awareness has not changed substantially. In 2013, awareness peaks in the 35‐64 age
range at just under nine in ten (86%). This is similar to 2007 where awareness was also relatively
high amongst this age group (74%), compared to younger and older Australians.
Australians maintain a similar level of awareness of Federal privacy laws regardless of gender. In
2013, just over eight in ten males (84%) and females (81%) were aware of Federal privacy laws
versus seven in ten of each in 2007 (70% and 68% respectively).
The level of awareness increases in accordance with educational attainment, and is significantly
greater amongst those who have completed year 12 than those who have not. In 2013, seven in ten
(72%) respondents who completed up to year 10 were aware of Federal privacy laws, compared to
4 See: http://www.oaic.gov.au/privacy/privacy-act/the-privacy-act
OAIC | Community Attitudes to Privacy Research Report
Office of Australian Information Commissioner 17
around eight in ten of those who have completed year 12 (81%), a Diploma/TAFE (82%) or a
Bachelor’s degree (85%) and is at nine in ten (91%) amongst those with a Postgraduate degree.
Chart 1. Awareness of Federal privacy law by age
Base: All respondents
10088
82 84 848176 78 78
50
21 22 2217 1815 12 14
1 1 1 3 <1 2 10
Total Male Female 18‐24 25‐34 35‐54 55‐64 65+
(n=1,000) (n=432) (n=568) (n=104) (n=119) (n=308) (n=274) (n=195)
Yes No% Don't know
Gender Age
Q6 Were you aware of the Federal privacy laws before this interview?
General attitudes towards privacy and personal information
Biggest privacy risk
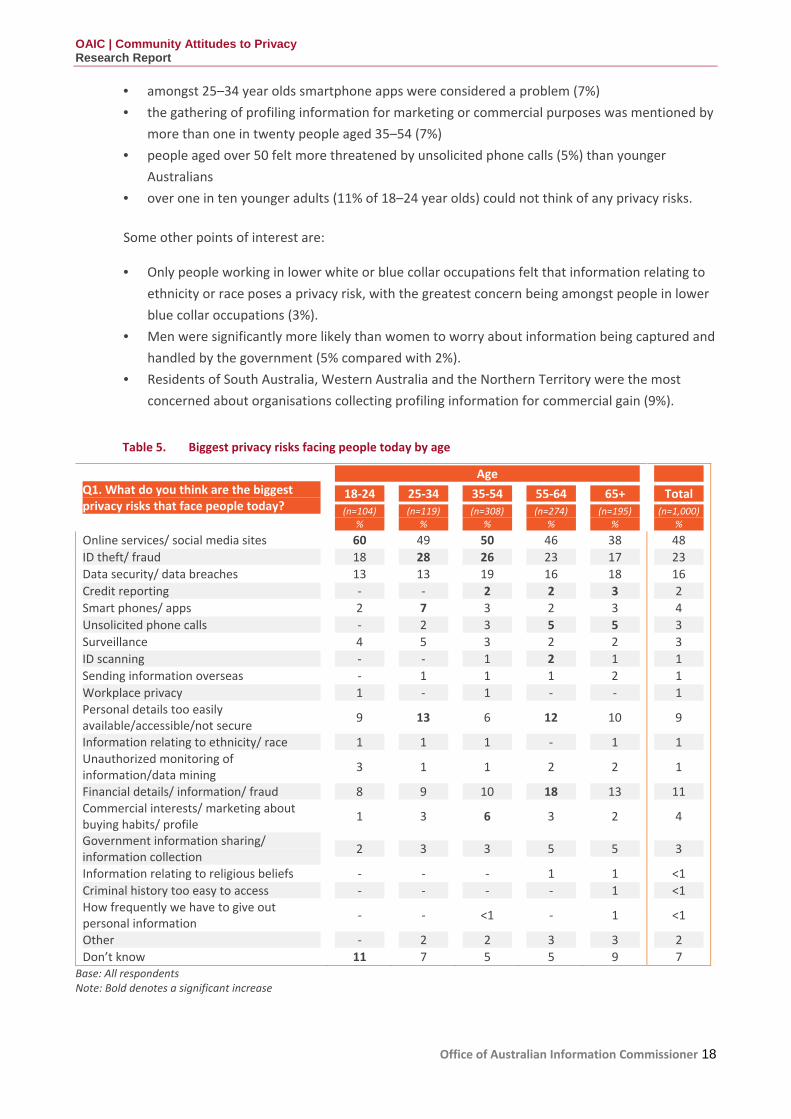
Survey participants were asked at the outset of the survey interview to name the biggest privacy
risks that they think face the community. Nearly half of the population (48%) suggested that using
online services and social media sites pose the greatest risk. As can be seen in Table 5, this is by far
the biggest risk perceived by six in ten respondents aged 18‐24 years (60%). Australians working in
white collar jobs are the most concerned about this risk.
ID fraud and theft (23%), and the related problems of fraudulent use of financial information (11%),
and easy access to personal details (9%) was considered to be the second biggest issue. People
aged between 25 and 45 were the most concerned about this. This may be because people in this
age group are also the most likely to have been the victim of this activity, or to know someone who
has been (see ‘ID theft and fraud’, below)’. Residents of Queensland (28%) and Western Australia
(29%) continued to be more concerned about this issue than other Australians. As was the case in
the 2007 study, residents of Western Australia reported higher levels of ID fraud and theft. People
aged 55–64, while still concerned about ID fraud and theft, reported the highest levels of concern
about fraudulent use of financial details rather than other personal details. Again this seems to
relate to personal experience. There was general unease about the lack of security of personal
information, which peaked at one in eight people aged 25–34 (13%).
As noted above, during the interviewing period there was global public debate around US
surveillance programs such as PRISM which may have led to data security and breaches being
considered the third greatest risk, mentioned by one in six (16%) Australians.
Other issues were identified as the biggest privacy risk by less than one in twenty Australians
overall, although there were some differences by respondent type. For example, different age
groups gave greater importance to some of these risks:
OAIC | Community Attitudes to Privacy Research Report
Office of Australian Information Commissioner 18
• amongst 25–34 year olds smartphone apps were considered a problem (7%)
• the gathering of profiling information for marketing or commercial purposes was mentioned by
more than one in twenty people aged 35–54 (7%)
• people aged over 50 felt more threatened by unsolicited phone calls (5%) than younger
Australians
• over one in ten younger adults (11% of 18–24 year olds) could not think of any privacy risks.
Some other points of interest are:
• Only people working in lower white or blue collar occupations felt that information relating to
ethnicity or race poses a privacy risk, with the greatest concern being amongst people in lower
blue collar occupations (3%).
• Men were significantly more likely than women to worry about information being captured and
handled by the government (5% compared with 2%).
• Residents of South Australia, Western Australia and the Northern Territory were the most
concerned about organisations collecting profiling information for commercial gain (9%).
Table 5. Biggest privacy risks facing people today by age
Age Q1. What do you think are the biggest 18‐24 25‐34 35‐54 55‐64 65+ Total privacy risks that face people today? (n=104) (n=119) (n=308) (n=274) (n=195) (n=1,000)
% % % % % %
Online services/ social media sites 60 49 50 46 38 48
ID theft/ fraud 18 28 26 23 17 23
Data security/ data breaches 13 13 19 16 18 16
Credit reporting ‐ ‐ 2 2 3 2
Smart phones/ apps 2 7 3 2 3 4
Unsolicited phone calls ‐ 2 3 5 5 3
Surveillance 4 5 3 2 2 3
ID scanning ‐ ‐ 1 2 1 1
Sending information overseas ‐ 1 1 1 2 1
Workplace privacy 1 ‐ 1 ‐ ‐ 1 Personal details too easily available/accessible/not secure
9 13 6 12 10 9
Information relating to ethnicity/ race 1 1 1 ‐ 1 1 Unauthorized monitoring of information/data mining
3 1 1 2 2 1
Financial details/ information/ fraud 8 9 10 18 13 11 Commercial interests/ marketing about buying habits/ profile
1 3 6 3 2 4
Government information sharing/ information collection
2 3 3 5 5 3
Information relating to religious beliefs ‐ ‐ ‐ 1 1 <1
Criminal history too easy to access ‐ ‐ ‐ ‐ 1 <1 How frequently we have to give out personal information
‐ ‐ <1 ‐ 1 <1
Other ‐ 2 2 3 3 2
Don’t know 11 7 5 5 9 7 Base: All respondents Note: Bold denotes a significant increase

OAIC | Community Attitudes to Privacy Research Report
Office of Australian Information Commissioner 19
Table 5 shows these results in more detail by age group, as this was the biggest differentiating
factor in views.
Generally, Australians held very consistent opinions. However, some significant differences in
results are summarised below.
• ID fraud and theft was of greatest concern to people aged between 25 and 54 years of age.
• Inappropriate access to financial details was of most concern to people aged between 55 and
64.
• Lack of security of personal details was of greatest concern to people aged 25–34 and 55–64.
• Potential risks posed by smartphone apps caused more than one in twenty people (7%) aged
25–34 to mention this as a privacy risk spontaneously — twice the level of any other age group.
• Unsolicited phone calls were of greatest concern with people aged over 55.
• Credit reporting was mentioned increasingly by people aged over 35.
• ID scanning was more of a concern for 55–64 year olds.
• People aged under 24 were the most likely to not hold any fears with one in ten (11%) being
unable to identify any risks.
Activities considered a misuse of information
Australians were read a number of scenarios similar to some that had been put to them in a
previous study in 2007. They were asked whether or not they considered each scenario to describe
misuse of personal information. The majority agreed that all scenarios represented a misuse of
information.
Chart 2. A misuse of information
Base: All respondents (n=1000)
An organisation reveals a customer's information to other97customers
You supply your information to an organisation for a specific97purpose and they use it for another purpose
An organisation that you haven't dealt with gets hold of your96personal information
An organisation asks you for personal information that doesn't93seem relevant to the purpose of the transaction
An organisation monitors your activities on the internet, recording93information on the sites you visit without your knowledge
An organisation sends customer data to an overseas processing79centre
%0 50 100
Q12 Which of the following instances would you regard to be a misuse of your personal information?
There is almost universal agreement that the following are a misuse of personal information.
• Revealing personal information to other customers (97%);
• Using personal information for a purpose other than the one it was provided (97%); and
• The collection of personal information by an organisation that a person has not dealt with
before (96%).

OAIC | Community Attitudes to Privacy Research Report
Office of Australian Information Commissioner 20
More than nine in ten (93%) people believe that an organisation asking for information that is not
relevant to the transaction and monitoring activities on the internet without the individual’s
knowledge are misuses too. Almost eight in ten (79%) believe sending customer data to an
overseas processing centre is also a misuse.
Similar scenarios were asked in 2007 and these results are similar with the 2013 results. Over seven
in ten respondents reported it is a misuse of their personal information for each scenario.
In 2007, the scenarios were asked for private business and government departments separately.
The results were as follows:
• A (business / government department) monitors your activities on the Internet, recording
information on the sites you visit without your knowledge (96% / 86% respectively)
• A (business / government department) asks you for personal information that doesn't seem to
be relevant to the purpose of the transaction (94% / 87% respectively)
• You supply your information to a (business / government department) for a specific purpose
and the business/agency uses it for another purpose (94% / 86% respectively)
• A (business / government department) you haven't dealt with gets hold of your personal
information (93% / 73% respectively).
Australians have been asked how they feel when an organisation they have not dealt with sends
them unsolicited marketing information. It appears that Australians are feeling increasingly
annoyed by this practice, with the proportion of people who say it annoys them reaching almost
half of the population (45%) from a quarter when it was first measured in 2001 (25%).
The other options, namely it is annoying but harmless (11%) declined by half compared with the
last survey in 2007. Only one in twenty Australians now say that unsolicited marketing information
either doesn’t bother them (3%) or that they enjoy reading it (2%). Together these categories
accounted for three in ten Australians when measured in 2001 and 2004.
Chart 3. Feelings in relation to being sent unsolicited marketing information by an unknown organisation
Q33 Which of the following statements best describes how you generally feel when organisations that
you have never dealt with before send you unsolicited marketing information?
Base: All respondents
25
55
17 20
9
21
48
1523
7
27
53
23
114
4539
113 2
0
10
20
30
40
50
60
I feel annoyed I feel concernedabout where they
obtained mypersonal
information
It's a bit annoyingbut it's harmless
It doesn't botherme either way,I don't care
I enjoy reading thematerial and don'tmind getting it at all
2001 (n=1,524)
2004 (n=1,507)
2007 (n=1,503)
2013 (n=1,000)
%

OAIC | Community Attitudes to Privacy Research Report
Q
Office of Australian Information Commissioner 21
The level of concern with how their personal information was obtained seems to have decreased
since 2007, however, it is worth noting that when last asked, this question allowed multiple
responses. Therefore the decline from a situation where just over five in ten (53%) respondents
were concerned in 2007, to just under four in ten in 2013 (39%) may relate to the fact that
respondents had to choose one of the options presented to them, not many.
Concern about sending personal information overseas
When asked to express their level of concern over Australian organisations sending customers’
personal data overseas, six in ten (62%) expressed strong concern (in 2007, 63%) with a further
three in ten (28%) saying they were somewhat concerned about this practice (in 2007, 27%).
While the results are similar in comparison to 2007, there were some notable differences amongst
respondents, particularly:
• Older people were more concerned than younger people. While eight in ten (83%) people aged
18–24 were concerned, the proportion who were very concerned (29%) was considerably lower
than amongst people aged over 65. Nearly all (96%) people over 65 were concerned, with eight
in ten (83%) of them being very concerned.
• High income households were less concerned than lower income households. Nine in ten (94%)
people in low income households were concerned with the majority (71%) being very
concerned. Amongst people living in households with incomes above $100,000 eight in ten
(83%) people were concerned with just under a half (48%) being very concerned.
• Women were more concerned than men. In particular, two thirds of women (67%) were very
concerned out of a total of nine in ten (92%) being concerned, compared with only three in ten
(29%) men being very concerned out of a total of nine in ten (88%) being concerned.
Chart 4. Concern about personal information being sent overseas
Base: All respondents
62 5867
29
5561
7383
7163
5648
28 3025
54
3027
2213
2327
32
35
10 12 817 15 12
4 4 6 9 11 17
<1 1 <1 <1 1 1 1 1 1
0
50
100
Total
(n=1,000)
Male
(n=432)
Female
(n=568)
18‐24
(n=104)
25‐34
(n=119)
35‐54
(n=308)
55‐64
(n=274)
65+
(n=195)
<$25k
(n=158)
$25k‐$75k
(n=268)
$75k‐$100k
(n=134)
>$100k
(n=222)
Very concerned Somewhat concerned Not concerned Don't know
%
Gender Age Household Income
13 How concerned are you about Australian businesses sending their customers' personal
information overseas to be processed?

OAIC | Community Attitudes to Privacy Research Report
Office of Australian Information Commissioner 22
Privacy problems and complaints
Respondents were asked whether they had experienced a problem with how their personal
information had been handled in the last 12 months. This question has not been asked before and
demonstrates that a considerable proportion of the community had experienced problems.
A third (33%) of Australians said that they had a problem with the way their personal information
was handled in the last year. The proportion rises steeply amongst working Australians (38% of
those working versus 26% of those not working). It increases steeply as household income rises to
the point where nearly four in ten Australians (39%) living in households earning over $100,000
have had a recent problem.
Chart 5. Organisations people would report misuse of personal information to
%
Base: All respondents
27
2
<1
<1
1
1
2
2
2
3
3
4
9
17
17
29
20
3
‐
<1
‐
2
2
7
4
1
4
10
8
19
30
13
0
Can't Say
Other
Do not call register
The media (e.g. TV/radio/newspapers/internet)
Internet search/research
Local Council
Department of Fair Trading
Local/State MP
Lawyers/solicitors
Seek advice from a friend or relative
Consumer Affairs (in your state)
The Privacy Commissioner (Federal or State)
State government department
Ombudsman
Police
The organisation that was involved
2007 (n=1,503)
2013 (n=1,000)
Q17 If you wanted to report misuse of your personal information to someone, who would you be MOST
likely to contact?
In previous studies, people had been asked to comment on the organisations they believe are
appropriate to report such a misuse to. Chart 5 shows 2013 responses compared to 2007:
• More people are now aware that they should contact the organisation that misused the
information. Three in ten (30%) suggest this is the best course of action (versus 13% in 2007).
40

OAIC | Community Attitudes to Privacy Research Report
Office of Australian Information Commissioner 23
• Fewer people suggested that reporting such information to the Police would be appropriate,
with the proportion dropping to one in six (17%) from three in ten (30%).
• A similar proportion (9%) thought that they would go to the appropriate Ombudsman as when
last measured (8%).
• The proportion who mentioned the Privacy Commissioner (4%) declined from 2007 (10%).
• There was an increase in the proportion of people who did not know who to report problems
to — now over a quarter (27%) of the population gave this response —up from one in five
(20%). These respondents were also less likely to be aware of privacy laws (34%) in comparison
to those who were aware (25%).
Trust
This section examines the extent to which people’s level of trust in certain organisations has a
bearing on the amount and nature of information they are willing to provide. Topics examined are:
• the types of information that people are reluctant to provide
• the levels of trust that people place in different types of organisations’ information handling
capabilities
• expectations of transparency in information handling practices in both the public and private
sectors (including when it comes to data breach)
• attitudes towards providing personal information in exchange for benefits.
Types of personal information people are reluctant to provide
People continue to be the most concerned about providing financial details (58%) and the
proportion of people who display this level of concern has been constant since it was first
measured in 2001 (59%). While the provision of this information is a concern for all, reluctance to
provide these details increases with age, with under a half of people aged 18–24 mentioning it
(44%) compared with six in ten amongst people aged 65 or over (60%).
After financial details, there have been some changes — some of which can be explained by the
provision of the definition of ‘personal information’ at the beginning of the questionnaire. In
particular, mentioning ‘photographs’ and ‘sexual preferences’ in the introduction has clearly raised
awareness of the sensitivity of these types of personal information and they have been mentioned
spontaneously for the first time (7% and 3% respectively).
The changing technological environment has undoubtedly underpinned other trends. For example,
‘home address’, is becoming a more protected piece of information with a quarter of people saying
they are reluctant to give this (24%) in comparison to almost one in five people (19%) in 2007. This
result is strongly related to age, with almost twice as many people aged under 35 (32%) being
reluctant to provide this information compared to people aged 55–64 (15%) or 65 and over (17%).
Victorians are also the least reluctant to give this information (29%).
Other interesting trends are:
• An increased reluctance to provide date of birth details, particularly amongst people who are
working, in general, and those who are earning high incomes in particular.
OAIC | Community Attitudes to Privacy Research Report
Office of Australian Information Commissioner 24
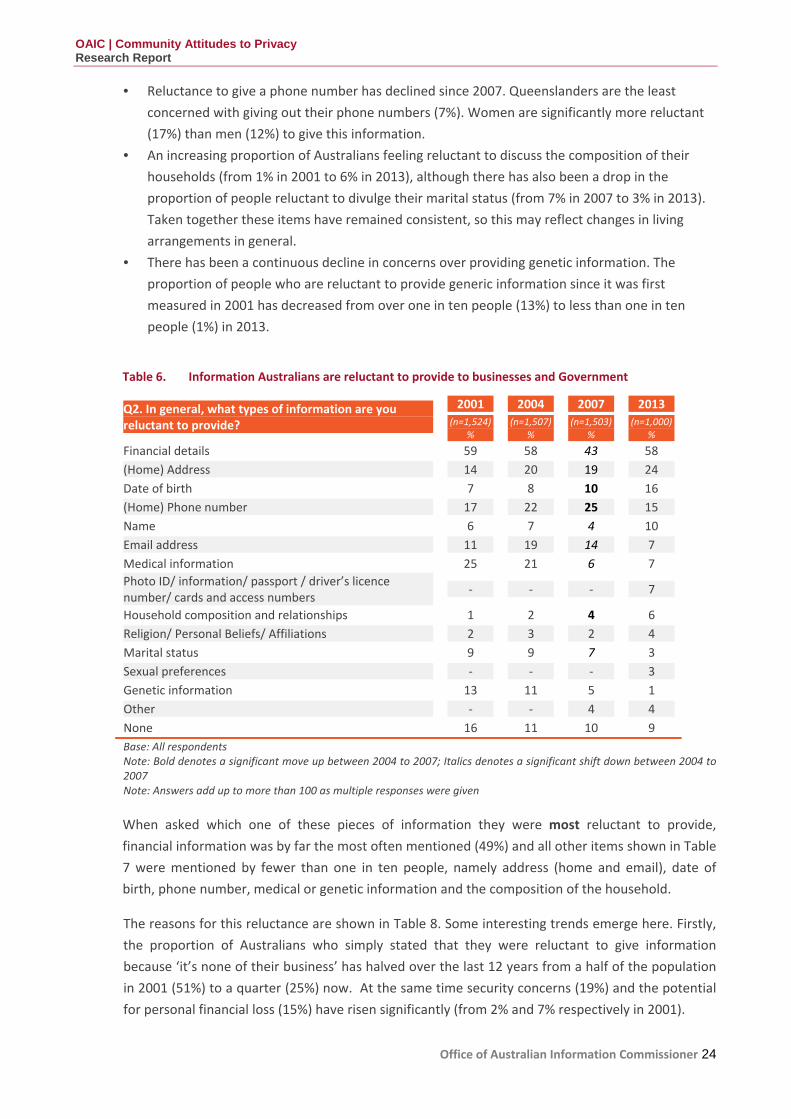
• Reluctance to give a phone number has declined since 2007. Queenslanders are the least
concerned with giving out their phone numbers (7%). Women are significantly more reluctant
(17%) than men (12%) to give this information.
• An increasing proportion of Australians feeling reluctant to discuss the composition of their
households (from 1% in 2001 to 6% in 2013), although there has also been a drop in the
proportion of people reluctant to divulge their marital status (from 7% in 2007 to 3% in 2013).
Taken together these items have remained consistent, so this may reflect changes in living
arrangements in general.
• There has been a continuous decline in concerns over providing genetic information. The
proportion of people who are reluctant to provide generic information since it was first
measured in 2001 has decreased from over one in ten people (13%) to less than one in ten
people (1%) in 2013.
Table 6. Information Australians are reluctant to provide to businesses and Government
Q2. In general, what types of information are you reluctant to provide?
2001
(n=1,524)%
2004
(n=1,507)%
2007
(n=1,503) %
2013
(n=1,000)%
Financial details 59 58 43 58
(Home) Address
Date of birth
14
7
20
8
19
10
24
16
(Home) Phone number
Name
17
6
22
7
25
4
15
10
Email address 11 19 14 7
Medical information 25 21 6 7
Photo ID/ information/ passport / driver’s licence number/ cards and access numbers
Household composition and relationships
Religion/ Personal Beliefs/ Affiliations
Marital status
‐
1
2
9
‐
2
3
9
‐
4
2
7
7
6
4
3
Sexual preferences
Genetic information
‐
13
‐
11
‐
5
3
1
Other ‐ ‐ 4 4
None 16 11 10 9
Base: All respondents Note: Bold denotes a significant move up between 2004 to 2007; Italics denotes a significant shift down between 2004 to 2007 Note: Answers add up to more than 100 as multiple responses were given
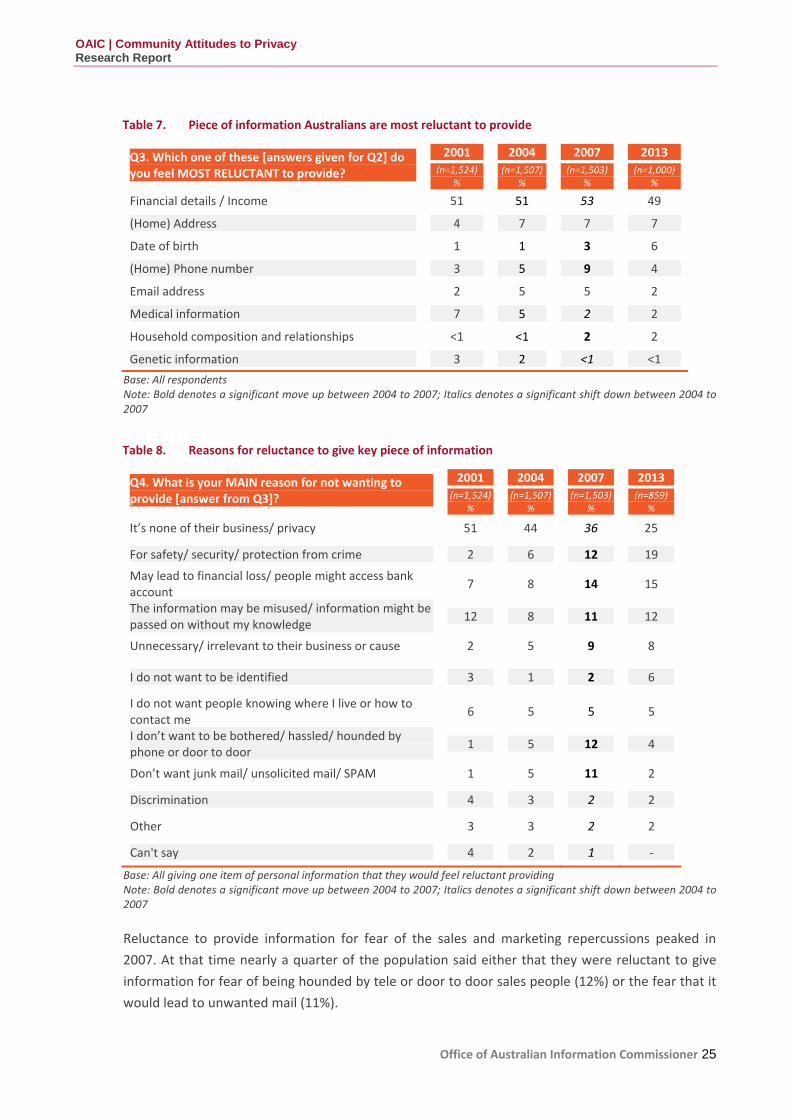
When asked which one of these pieces of information they were most reluctant to provide,
financial information was by far the most often mentioned (49%) and all other items shown in Table
7 were mentioned by fewer than one in ten people, namely address (home and email), date of
birth, phone number, medical or genetic information and the composition of the household.
The reasons for this reluctance are shown in Table 8. Some interesting trends emerge here. Firstly,
the proportion of Australians who simply stated that they were reluctant to give information
because ‘it’s none of their business’ has halved over the last 12 years from a half of the population
in 2001 (51%) to a quarter (25%) now. At the same time security concerns (19%) and the potential
for personal financial loss (15%) have risen significantly (from 2% and 7% respectively in 2001).
OAIC | Community Attitudes to Privacy Research Report
Office of Australian Information Commissioner 25
Table 7. Piece of information Australians are most reluctant to provide
Q3. Which one of these [answers given for Q2] do you feel MOST RELUCTANT to provide?
Financial details / Income
(Home) Address
Date of birth
2001
(n=1,524)%
51
4
1
2004
(n=1,507)%
51
7
1
2007
(n=1,503) %
53
7
3
2013
(n=1,000)%
49
7
6
(Home) Phone number
Email address
3
2
5
5
9
5
4
2
Medical information 7 5 2 2
Household composition and relationships
Genetic information
<1
3
<1
2
2
<1
2
<1
Base: All respondents Note: Bold denotes a significant move up between 2004 to 2007; Italics denotes a significant shift down between 2004 to 2007
Table 8. Reasons for reluctance to give key piece of information
Base: All giving one item of personal information that they would feel reluctant providing Note: Bold denotes a significant move up between 2004 to 2007; Italics denotes a significant shift down between 2004 to 2007
Q4. What is your MAIN reason for not wanting to provide [answer from Q3]?
2001
(n=1,524)%
2004
(n=1,507)%
2007
(n=1,503) %
2013
(n=859)%
It’s none of their business/ privacy 51 44 36 25
For safety/ security/ protection from crime
May lead to financial loss/ people might access bank account The information may be misused/ information might be passed on without my knowledge
Unnecessary/ irrelevant to their business or cause
2
7
12
2
6
8
8
5
12
14
11
9
19
15
12
8
I do not want to be identified 3 1 2 6
I do not want people knowing where I live or how to contact me I don’t want to be bothered/ hassled/ hounded by phone or door to door
Don’t want junk mail/ unsolicited mail/ SPAM
6
1
1
5
5
5
5
12
11
5
4
2
Discrimination 4 3 2 2
Other 3 3 2 2
Can't say 4 2 1 ‐
Reluctance to provide information for fear of the sales and marketing repercussions peaked in
2007. At that time nearly a quarter of the population said either that they were reluctant to give
information for fear of being hounded by tele or door to door sales people (12%) or the fear that it
would lead to unwanted mail (11%).

OAIC | Community Attitudes to Privacy Research Report
Office of Australian Information Commissioner 26
In the 2013 study, just over one in twenty Australians reported that they have these concerns (4%
and 2% respectively). These trends may also relate to the introduction of the Spam Act 2003 and
the Do Not Call Register Act 2006. Both pieces of legislation clarified Australians’ rights and
provided an avenue for complaint.
Providing personal information for benefits
Participants were asked whether discounted purchases, a prize or improved service would
overcome this reticence. As Chart 6 shows, the majority says that they are not prepared to
exchange personal information for these benefits. However, a sizeable minority says they are likely
to give information in exchange for a tangible benefit, particularly in exchange for lower prices
(28%) or better service (34%).
Respondents in 2007 were asked whether they are likely to give up information in exchange for a
lower prices or a prize. Just over two out of ten (22%) respondents said they would in exchange for
a discount (22%) and over two in twenty (13%) said they would for a prize.
Prizes are considered to provide the least incentive for giving personal information with over eight
in ten people (81%) saying they are unlikely to do this, with well over half of the population (56%)
saying that they are very unlikely to do so.
Respondents were more willing to provide personal information in exchange for better services if
they are aged 18‐24 (41% compared with 29% for people aged over 35) or if they live in a
metropolitan area (37% compared with 28% in regional Australia).
People who are not working and/or live in households that earn less than $75,000 are the least
likely to trade off personal information for better service.
Chart 6. Australians’ willingness to give personal information in exchange for a benefit
Q9/10/11 How likely or unlikely are you to provide your personal information to an organisation if it
meant you would receive discounted purchases/the chance to win a prize/better service?
7
2
4
27
12
24
7
5
9
26
25
27
31
56
35
3
1
1
Better Service
Prize
Discount
Very Likely Quite Likely Neither Quite Unlikely Very Unlikely Can't Say
%
OAIC | Community Attitudes to Privacy search Report Re
Office of Australian Information Commissioner 27
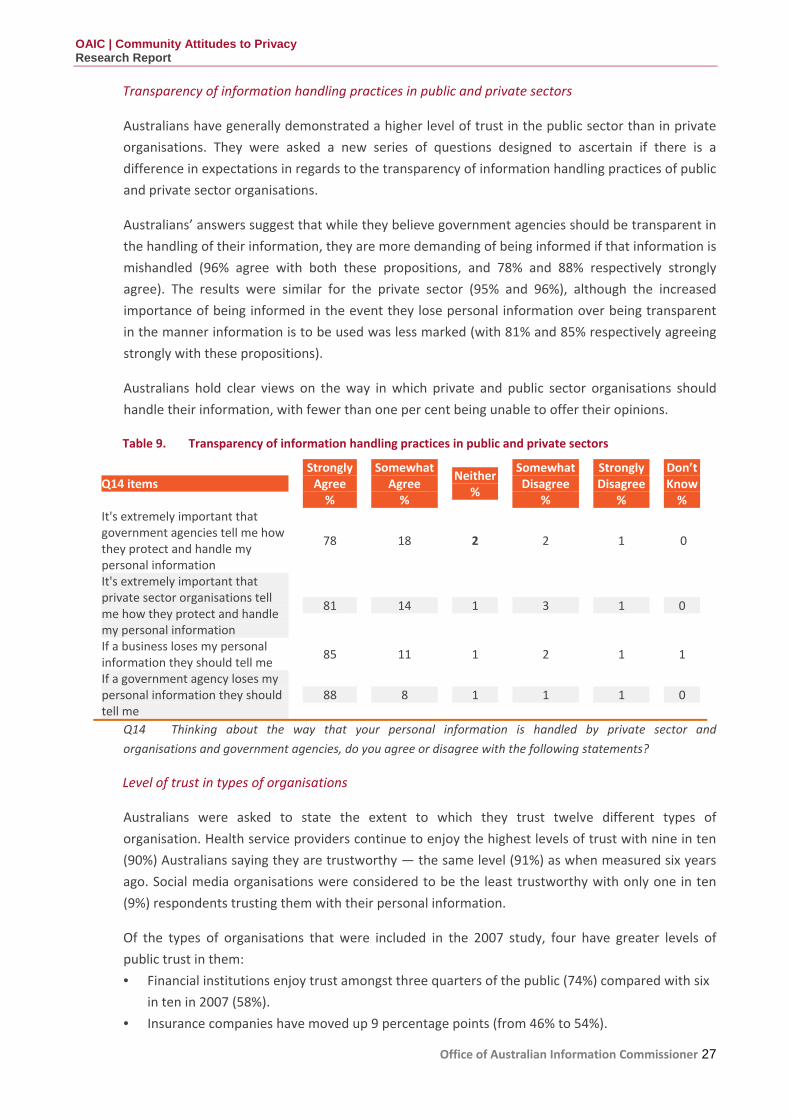
Transparency of information handling practices in public and private sectors
Australians have generally demonstrated a higher level of trust in the public sector than in private
organisations. They were asked a new series of questions designed to ascertain if there is a
difference in expectations in regards to the transparency of information handling practices of public
and private sector organisations.
Australians’ answers suggest that while they believe government agencies should be transparent in
the handling of their information, they are more demanding of being informed if that information is
mishandled (96% agree with both these propositions, and 78% and 88% respectively strongly
agree). The results were similar for the private sector (95% and 96%), although the increased
importance of being informed in the event they lose personal information over being transparent
in the manner information is to be used was less marked (with 81% and 85% respectively agreeing
strongly with these propositions).
Australians hold clear views on the way in which private and public sector organisations should
handle their information, with fewer than one per cent being unable to offer their opinions.
Table 9. Transparency of information handling practices in public and private sectors
Q14 Thinking about the way that your personal information is handled by private sector and
organisations and government agencies, do you agree or disagree with the following statements?
Q14 items StronglyAgree %
SomewhatAgree %
Neither %
Somewhat Disagree
%
Strongly Disagree
%
Don’tKnow %
It's extremely important that government agencies tell me how they protect and handle my
78 18 2 2 1 0
personal information It's extremely important that private sector organisations tell me how they protect and handle
81 14 1 3 1 0
my personal information If a business loses my personal information they should tell me
85 11 1 2 1 1
If a government agency loses my personal information they should 88 8 1 1 1 0 tell me
Level of trust in types of organisations
Australians were asked to state the extent to which they trust twelve different types of
organisation. Health service providers continue to enjoy the highest levels of trust with nine in ten
(90%) Australians saying they are trustworthy — the same level (91%) as when measured six years
ago. Social media organisations were considered to be the least trustworthy with only one in ten
(9%) respondents trusting them with their personal information.
Of the types of organisations that were included in the 2007 study, four have greater levels of
public trust in them:
• Financial institutions enjoy trust amongst three quarters of the public (74%) compared with six
in ten in 2007 (58%).
• Insurance companies have moved up 9 percentage points (from 46% to 54%).

OAIC | Community Attitudes to Privacy Research Report
Office of Australian Information Commissioner 28
• Real estate agents are now considered trustworthy by a third of the population (33%)
compared with a quarter six years ago (24%).
• e‐Commerce companies now have the trust of a quarter of the population (26%) compared
with one in five (18%).
The position of health service providers, government departments, charities and retailers were
relatively unchanged. The most trusted organisation to handle personal information is health
service providers (in 2013, 90%; in 2007, 91%). The level of trust associated with government
departments has slightly decreased (in 2013 to 69% from 73% in 2007). Charities remain relatively
consistent as just over half of the respondents (53% and 55%, respectively) reported they trust
charities to handle personal information. Just over one in three respondents reported they trust
retailers (34% and 36%, respectively).
Only market and social research companies were considered significantly less trustworthy in
handling personal information than in 2007 (35% versus 30% in 2013).
Chart 7. Trust in organisations to handle personal information
91Health Service Providers90
58Financial Institutions74
73Government Departments69
47Insurance Companies54
55Charities53
‐Technology Companies37
37Retailers34
24Real Estate Agents33
‐Debt Collectors31
35Market Research Organisations30
17E‐commerce Industry26
‐Social Media9
0 50 100
2007 (n=1,503)
2013 (n=1,000)
%
Base: All respondents Q8 How trustworthy or untrustworthy would you say the following organisations are with regards to
how they protect or use your personal information?
Three additional types of organisation were included in this study, all of which were considered to
be untrustworthy by the majority of Australians:
• Technology companies were more likely to be considered untrustworthy (49%) than
trustworthy (37%).
• Debt collectors — only three in ten (31%) Australians considered debt collectors to be
trustworthy.
OAIC | Community Attitudes to Privacy Research Report
Office of Australian Information Commissioner 29
• Social media organisations were considered to be trustworthy by only one in ten (9%)
Australians.
There was a pattern of declining trust with increasing age in relation to nearly all types of
organisations. The exceptions to this were retailers, where nearly a half of over 65 year olds said
they were trustworthy (46%) and social media, where trust was highest amongst over 65 year olds.
Personal responsibility
Measures taken to protect personal information
Australians were asked how often, if ever, they took a number of measures in order to protect their
personal information. Their answers are summarised in Chart 8, which shows the proportion of
Australians who:
• refuse to provide personal information
• read privacy policies prior to providing personal information
• ask questions of organisations as to why particular information is needed
• shred documents
• check the security of a website
• clear their searching and browsing history
• choose not to use a smartphone app because of the information requested in order to use it
• adjust privacy settings on social networking sites
• provide false details
• provide a false name.
Only three people out of all the people interviewed claimed never to take any of these measures
(less than 0.2%). However, while practically all Australians do something, they do not do everything
routinely. Over four in ten (43%) said they “always” check that a website is secure before providing
personal information, and around three in ten said they always shred documents (32%) or ask
organisations why they need personal information prior to giving it (29%).
It is interesting to note that females (38%) are more likely to shred documents to protect personal
information in comparison to males (25%). Four out of ten respondents (40%) aged 35+ years
reported taking this measure in comparison to younger respondents aged 18‐34 years (16%) and
they were also more likely to read privacy policies with almost three out of ten people (29%) stating
this in comparison to respondents aged 18‐35 years (12%). On the other hand, younger
respondents (aged 18‐34 years) were more likely to check the security of a website than those aged
35+ years (51% and 38% respectively).
Fewer people provide false personal details (32%) and/or a false name (30%) to protect their
privacy and less than one in twenty does so always or often. Similar questions were asked in 2007.
Respondents were asked whether they have provided false personal details when completing
online forms or applications as a means of protecting their privacy. Most respondents said ‘no’
(67%) while one in four (25%) said they have. However, just over six in ten people (61%) reported
they intentionally leave some questions that ask for their personal details blank to protect their
privacy.

OAIC | Community Attitudes to Privacy Research Report
Office of Australian Information Commissioner 30
Chart 8. Measures taken by Australians to protect their personal information
Base: All respondents (n=1,000)
1
23
18
16
32
43
30
24
7
4
5
18
18
24
18
17
18
20
23
13
12
12
19
20
19
12
21
29
46
12
15
7
7
11
9
6
13
13
15
70
67
24
24
22
22
15
17
13
9
16
14
6
7
1
1
1
Use false name when giving personal information
Provide false personal details
Adjust privacy settings on a social networking website
Choose not to use an app due to concerns over handling
personal information
Clear your browsing and search history
Shred documents
Check that a website is secure before providing personal
information
Ask public or private sector organisations why they need
your information
Read privacy policies and notifications before providing
personal information
Refuse to provide personal information
Always Often Sometimes Rarely Never Don’t know
%
90%
86%
82%
78%
78%
72%
62%
60%
32%
30%
Have used
Q21 In order to protect your personal information, do you…
Avoided dealing with organisations due to privacy concerns
Since 2001, Australians have been asked whether they have decided not to deal with either a
government or private sector company because of concerns over the way that organisation might
handle their personal information. Their responses are shown in Chart 9.
Chart 9. Australians who have decided not to deal with an organisation because of concerns over the use of personal information
Q18/19 Have you ever decided not to deal with a government agency or public sector / private sector
organization because of concerns over the protection or use of your personal information?
These results indicate a significant change since 2007. While there have been increases amongst
Australians of all types, there has been a significant rise in the proportion of people working in
Base: All respondents
14
42
16
33
12
36
23
60
0
70
Decided not to deal with a governmentagency or public sector organisation
Decided not to deal with a privatesector organisation
2001 (n=1,524)
2004 (n=1,507)
2007 (n=1,503)
2013 (n=1,000)
%
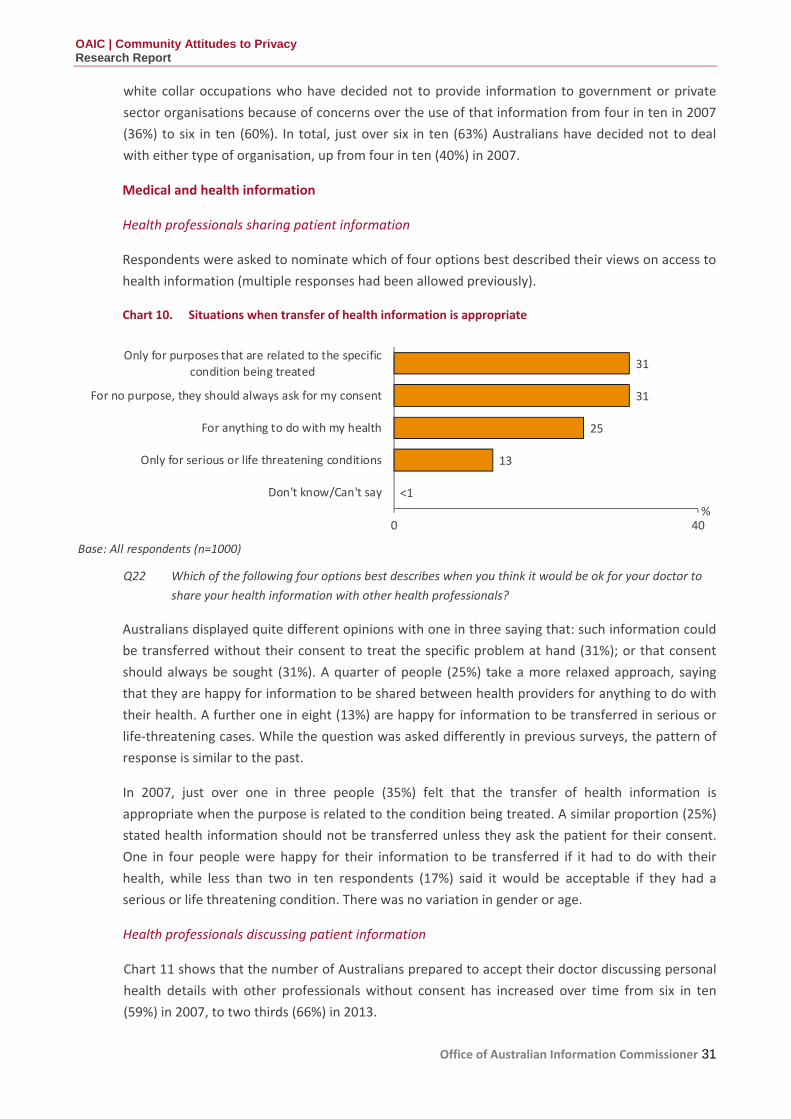
OAIC | Community Attitudes to Privacy Research Report
Office of Australian Information Commissioner 31
white collar occupations who have decided not to provide information to government or private
sector organisations because of concerns over the use of that information from four in ten in 2007
(36%) to six in ten (60%). In total, just over six in ten (63%) Australians have decided not to deal
with either type of organisation, up from four in ten (40%) in 2007.
Medical and health information
Health professionals sharing patient information
Respondents were asked to nominate which of four options best described their views on access to
health information (multiple responses had been allowed previously).
Chart 10. Situations when transfer of health information is appropriate
Australians displayed quite different opinions with one in three saying that: such information could
be transferred without their consent to treat the specific problem at hand (31%); or that consent
should always be sought (31%). A quarter of people (25%) take a more relaxed approach, saying
that they are happy for information to be shared between health providers for anything to do with
their health. A further one in eight (13%) are happy for information to be transferred in serious or
life‐threatening cases. While the question was asked differently in previous surveys, the pattern of
response is similar to the past.
In 2007, just over one in three people (35%) felt that the transfer of health information is
appropriate when the purpose is related to the condition being treated. A similar proportion (25%)
stated health information should not be transferred unless they ask the patient for their consent.
One in four people were happy for their information to be transferred if it had to do with their
health, while less than two in ten respondents (17%) said it would be acceptable if they had a
serious or life threatening condition. There was no variation in gender or age.
Health professionals discussing patient information
Chart 11 shows that the number of Australians prepared to accept their doctor discussing personal
health details with other professionals without consent has increased over time from six in ten
(59%) in 2007, to two thirds (66%) in 2013.
Base: All respondents (n=1000)
Q22 Which of the following four options best describes when you think it would be ok for your doctor to
share your health information with other health professionals?
<1
13
25
31
31
0
Don't know/Can't say
Only for serious or life threatening conditions
For anything to do with my health
For no purpose, they should always ask for my consent
Only for purposes that are related to the specific
condition being treated
%40
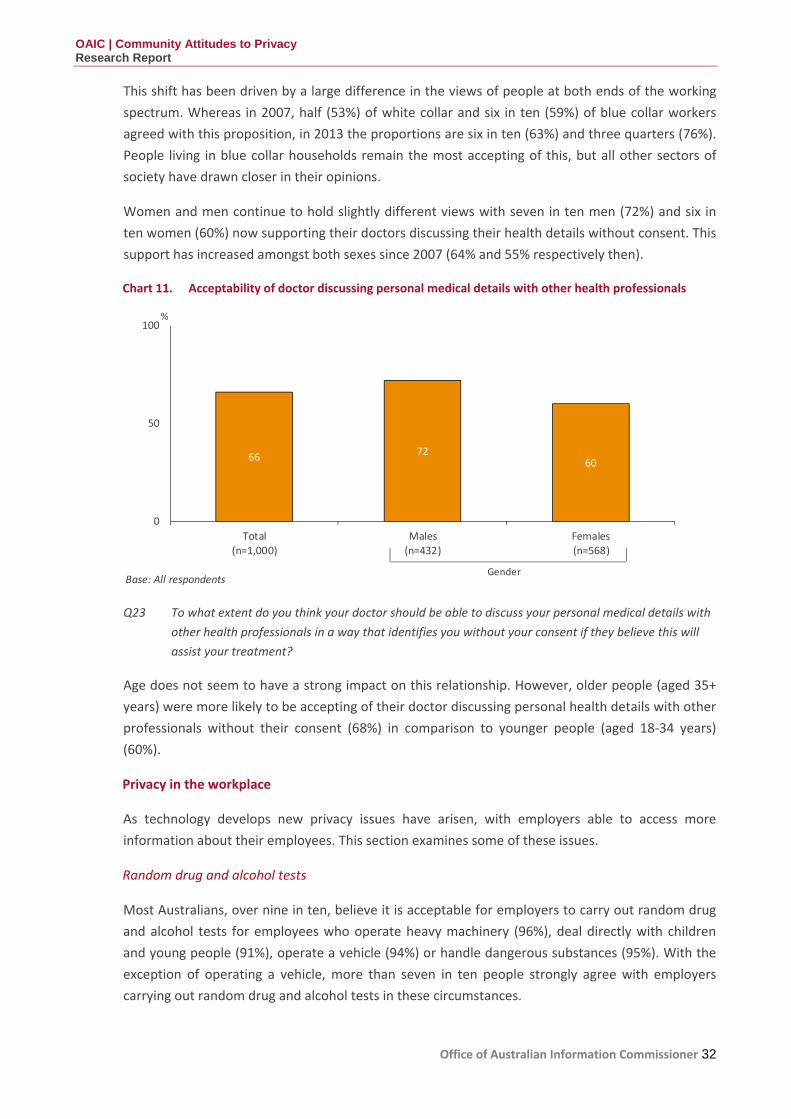
OAIC | Community Attitudes to Privacy Research Report
Office of Australian Information Commissioner 32
This shift has been driven by a large difference in the views of people at both ends of the working
spectrum. Whereas in 2007, half (53%) of white collar and six in ten (59%) of blue collar workers
agreed with this proposition, in 2013 the proportions are six in ten (63%) and three quarters (76%).
People living in blue collar households remain the most accepting of this, but all other sectors of
society have drawn closer in their opinions.
Women and men continue to hold slightly different views with seven in ten men (72%) and six in
ten women (60%) now supporting their doctors discussing their health details without consent. This
support has increased amongst both sexes since 2007 (64% and 55% respectively then).
Chart 11. Acceptability of doctor discussing personal medical details with other health professionals
Base: All respondents
6672
60
0
50
100
Total
(n=1,000)
Males
(n=432)
Females
(n=568)
%
Gender
Q23 To what extent do you think your doctor should be able to discuss your personal medical details with
other health professionals in a way that identifies you without your consent if they believe this will
assist your treatment?
Age does not seem to have a strong impact on this relationship. However, older people (aged 35+
years) were more likely to be accepting of their doctor discussing personal health details with other
professionals without their consent (68%) in comparison to younger people (aged 18‐34 years)
(60%).
Privacy in the workplace
As technology develops new privacy issues have arisen, with employers able to access more
information about their employees. This section examines some of these issues.
Random drug and alcohol tests
Most Australians, over nine in ten, believe it is acceptable for employers to carry out random drug
and alcohol tests for employees who operate heavy machinery (96%), deal directly with children
and young people (91%), operate a vehicle (94%) or handle dangerous substances (95%). With the
exception of operating a vehicle, more than seven in ten people strongly agree with employers
carrying out random drug and alcohol tests in these circumstances.
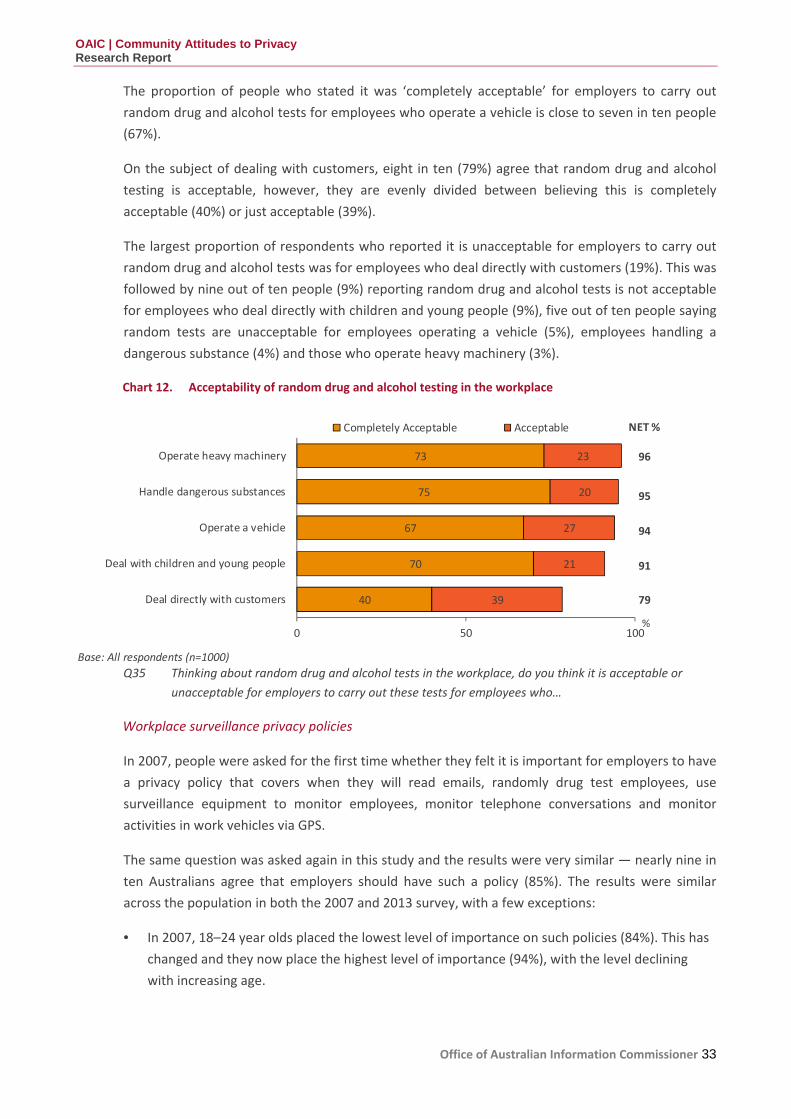
OAIC | Community Attitudes to Privacy Research Report
Office of Australian Information Commissioner 33
The proportion of people who stated it was ‘completely acceptable’ for employers to carry out
random drug and alcohol tests for employees who operate a vehicle is close to seven in ten people
(67%).
On the subject of dealing with customers, eight in ten (79%) agree that random drug and alcohol
testing is acceptable, however, they are evenly divided between believing this is completely
acceptable (40%) or just acceptable (39%).
The largest proportion of respondents who reported it is unacceptable for employers to carry out
random drug and alcohol tests was for employees who deal directly with customers (19%). This was
followed by nine out of ten people (9%) reporting random drug and alcohol tests is not acceptable
for employees who deal directly with children and young people (9%), five out of ten people saying
random tests are unacceptable for employees operating a vehicle (5%), employees handling a
dangerous substance (4%) and those who operate heavy machinery (3%).
Chart 12. Acceptability of random drug and alcohol testing in the workplace
Base: All respondents (n=1000)
40
70
67
75
73
39
21
27
20
23
0 50 100
Deal directly with customers
Deal with children and young people
Operate a vehicle
Handle dangerous substances
Operate heavy machinery
Completely Acceptable Acceptable
%
NET %
96
95
94
91
79
Q35 Thinking about random drug and alcohol tests in the workplace, do you think it is acceptable or
unacceptable for employers to carry out these tests for employees who…
Workplace surveillance privacy policies
In 2007, people were asked for the first time whether they felt it is important for employers to have
a privacy policy that covers when they will read emails, randomly drug test employees, use
surveillance equipment to monitor employees, monitor telephone conversations and monitor
activities in work vehicles via GPS.
The same question was asked again in this study and the results were very similar — nearly nine in
ten Australians agree that employers should have such a policy (85%). The results were similar
across the population in both the 2007 and 2013 survey, with a few exceptions:
• In 2007, 18–24 year olds placed the lowest level of importance on such policies (84%). This has
changed and they now place the highest level of importance (94%), with the level declining
with increasing age.

OAIC | Community Attitudes to Privacy Research Report
Office of Australian Information Commissioner 34
• In 2007, people living in households with incomes over $100,000 were the most likely to say
these policies were very important (70%), whereas they now hold similar views to the rest of
the population (although still significantly higher than low income households) (61%).
Chart 13. Consider it important that employers should have a policy covering surveillance practices
Base: All respondents
85 8388
94
8784 84 82
0
50
100
Total(n=1,000)
Male(n=432)
Female(n=568)
18‐24 years(n=104)
25‐34 years(n=119)
35‐54 years(n=308)
55‐64 years(n=274)
65+ years(n=195)
Gender Age
Q34 Thinking about the workplace, how important is it to you that an employer has a privacy policy that
covers when they will read employee details, randomly drug test employees, use surveillance
equipment to monitor employees and monitor telephone conversations and monitor GPS in work
vehicles?
Identification document scanning
Acceptability of identification document scanning
In 2007, respondents were asked whether they felt it was acceptable to be asked to show or have a
copy of identification documents made in a range of day‐to‐day circumstances. In 2013, the
question was modified slightly to ask only about the acceptability of making a copy or scan of these
documents.
The pattern of results between the two studies was similar. The greatest support for copying
material was in order to obtain a credit card, which was considered to be acceptable by two thirds
of the population (69% now compared with 57% in 2007). Support was lowest for purchasing
general goods with only one in twenty (5% now and 4% in 2007) saying this is acceptable.
In general, Australians are more accepting of having their identification documentation copied
compared to in 2007:
• An increase from 57% to 69% who say it is acceptable to scan or copy documentation in order
to obtain a credit card.
• An increase from 23% to 31% for people who believe it is acceptable when purchasing goods
that require the purchaser to be over 18.

OAIC | Community Attitudes to Privacy Research Report
Office of Australian Information Commissioner 35
• An increase from 18% to 28% in those finding it acceptable to have their identity documents
copied in order to enter licensed premises (e.g. pub, club or hotel).
Table 10. Attitudes towards scanning or copying identification documents
Base: All respondents (n=1000) Note: Multiple responses given
Q36 In which of the following situations, if any, do you think it is acceptable that a COPY or SCAN is made
of your identification documents?
Q36 items Acceptable
%
NotAcceptable
%
Don’tKnow %
To purchase general goods 5 95 1
To purchase cigarettes 24 75 1
On entry to licensed premises
To purchase good for which you need to be over 18
28
31
72
67
1
2
To obtain a credit card 69 29 2
There are a few differences of opinion within the community on this issue. In particular, people
who are working are significantly more likely to support having identification documents scanned in
order to obtain a credit card (72%) compared with those who are not working (64%).
The opposite position is true for purchasing goods for which you need to be aged 18 or over, where
people who are working find this significantly less acceptable (29%) than those who are not
working (36%). The acceptability of having identification documentation copied in order to be able
to buy general goods (e.g. clothing and food) declines from nearly one in ten (9%) people educated
up to Year 10 to one per cent of people who have completed postgraduate studies.
Biometrics
The use of biometric data is increasing at a rapid rate. For example, it is now common practice to
be required to provide such information in order to travel internationally. Australians were asked
to indicate how concerned they are about having to provide biometric data, including their
fingerprints, photo ID or iris scans in a number of different situations.
Australians were not keen on the need to use this data to gain access to a pub, club bar or hotel,
with seven in ten (71%) being either very concerned (41%) or somewhat concerned (28%) at this
prospect. The level of concern was consistent across age groups, but there were higher levels in
New South Wales (76%), and South Australia and the Northern Territory (77%).
Over half of the population was concerned about having to use biometric information to access
their place of work or study (55%) or to do their day to day banking (54%). 18–24 year olds were
the most concerned with both ideas, with concern declining with age. However, concern was at
over 50% for all age groups.
The majority of respondents were less concerned by the use of biometric information to get on a
flight, with four in ten people saying they were concerned — women (44%), significantly more than
men (36%).

OAIC | Community Attitudes to Privacy Research Report
Office of Australian Information Commissioner 36
One in five people had no concerns about the use of biometric information in any of the situations
suggested to them (20%). This was true across all demographic categories, although those with no
concerns were more likely to be Queenslanders (27%).
Table 11. Concern with using biometric data in a number of day to day situations
Q37 items Very
Concerned %
SomewhatConcerned
%
NotConcerned
%
Don’t Know %
Go into a licenced bar, club or hotel
43 28 29 1
Get into your place of work or study
25 30 43 2
Do your day to day banking 25 28 45 2
Get on a flight 17 23 59 <1
Base: All respondents (n=1000)
Q37 How concerned are you about using biometric information for you to…
Internet and smartphones
The way in which people access the internet has changed dramatically since the last survey. A
number of factors have contributed to this, including a significant growth in the use of social
networking sites and the development of smartphone and tablet technology.
According to a recent report by the Australian Communications and Media Authority (ACMA), by
May 2012 almost half of adult Australians had a smartphone and they were being used increasingly
to access the internet (ACMA, Communications Report 2011‐12 Series. Report 3 – Smartphones and
Tablets, 2012). Whereas mobile phones were used largely to make calls or send SMS messages or
emails, the raft of services now available on smartphones and other mobile platforms is enormous,
as is the amount of personal information that is being transmitted through them.
The series of questions posed in the 2007 study has been augmented and changed to reflect the
different circumstances now.
Understanding of passive data collection on the internet
For the first time, Australians were asked to estimate the proportion of websites and smartphone
applications (or apps) that collect information about users.
As Chart 14 shows, over a quarter of the population believes that all websites and Smartphones
collect personal information about them. In addition, almost a further six in ten believe that most
(42%) or some (17%) websites collect information and nearly half (48%) believe that most (32%) or
some (16%) smartphones apps collect information about users of them.
Survey participants were encouraged to make an estimate even if they were not users of the
technology themselves. However, those who simply could not make an estimate were asked
whether they used the technology or not and the majority said that they could not estimate
because they did not use these technologies.

OAIC | Community Attitudes to Privacy Research Report
Office of Australian Information Commissioner 37
Chart 14. Proportion of websites or Smartphones that collect information about users
%
<1
3
19
1
2
16
32
27
<1
4
6
1
2
17
42
28
0
Refused
Use the internet / Smartphone but have no idea
Don't use the internet / Smartphone and can't estimate
None
Few
Some
Most
All
Websites (n=1,000)
Smartphone (n=1,000)
Base: All respondents
Q24/24a What proportion of websites/smartphone apps do you think collect information about the people
who visit/use them?
50
Online tracking and behavioural advertising
Participants were introduced to the concept that search engines and social networking sites track
patterns of usage on the internet and maintain databases of information about users to enable
sites to target advertising and other offerings to website users. They were then asked to comment.
Chart 15 shows that Australians are generally uncomfortable with the prospect of information
being captured and used to target advertising and other offerings to them. They are marginally
more comfortable with the concept of having advertising targeted to them based on their online
activities, rather than the prospect of having their online activities stored in a database for non‐
specific purposes — nearly half of the population felt very uncomfortable at this prospect (49%).
Nonetheless, a quarter of the public is comfortable with targeted advertising based on internet
behaviour at the time of using the internet (25%), although three in ten people under the age of 55
(27%) are comfortable compared with less than one in seven aged 55 or over (15%).
A slightly smaller proportion is comfortable with browsing behaviour being stored for later
targeting (15%). Again people aged under 55 (19%) are more comfortable with this idea and they
are twice as likely to be comfortable with this than people aged over 55 (9%).
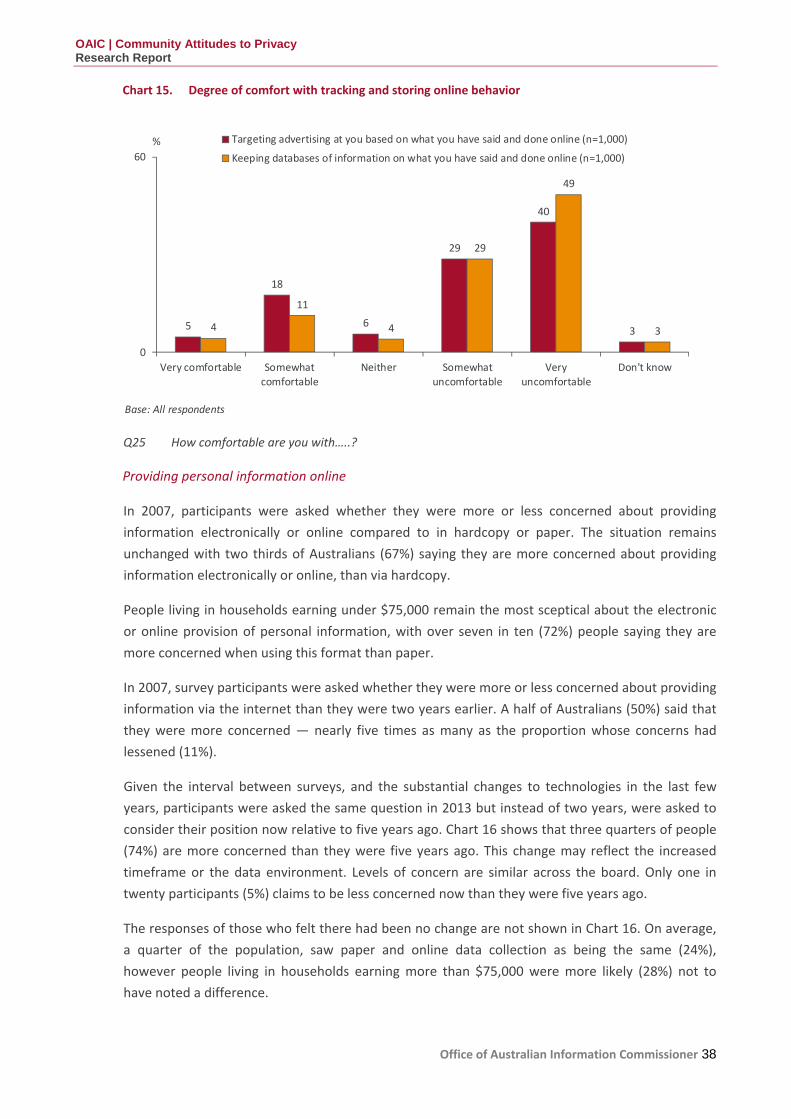
OAIC | Community Attitudes to Privacy Research Report
Office of Australian Information Commissioner 38
Chart 15. Degree of comfort with tracking and storing online behavior
60
49
40
29 29
18
11
5 64 4 3 3
0
Very comfortable Somewhat Neither Somewhat Very Don't knowcomfortable uncomfortable uncomfortable
Targeting advertising at you based on what you have said and done online (n=1,000)%
Keeping databases of information on what you have said and done online (n=1,000)
Base: All respondents
Q25 How comfortable are you with…..?
Providing personal information online
In 2007, participants were asked whether they were more or less concerned about providing
information electronically or online compared to in hardcopy or paper. The situation remains
unchanged with two thirds of Australians (67%) saying they are more concerned about providing
information electronically or online, than via hardcopy.
People living in households earning under $75,000 remain the most sceptical about the electronic
or online provision of personal information, with over seven in ten (72%) people saying they are
more concerned when using this format than paper.
In 2007, survey participants were asked whether they were more or less concerned about providing
information via the internet than they were two years earlier. A half of Australians (50%) said that
they were more concerned — nearly five times as many as the proportion whose concerns had
lessened (11%).
Given the interval between surveys, and the substantial changes to technologies in the last few
years, participants were asked the same question in 2013 but instead of two years, were asked to
consider their position now relative to five years ago. Chart 16 shows that three quarters of people
(74%) are more concerned than they were five years ago. This change may reflect the increased
timeframe or the data environment. Levels of concern are similar across the board. Only one in
twenty participants (5%) claims to be less concerned now than they were five years ago.
The responses of those who felt there had been no change are not shown in Chart 16. On average,
a quarter of the population, saw paper and online data collection as being the same (24%),
however people living in households earning more than $75,000 were more likely (28%) not to
have noted a difference.

OAIC | Community Attitudes to Privacy Research Report
Office of Australian Information Commissioner 39
Chart 16. Change in level of concern for providing information over the internet in different forms
Base: All respondents (n=1000)
5
7
74
67
Less More
Concerned about providing your personal details electronically or online compared to in a
hard copy/paper based format
Concerned about the privacy of your personal information while using the internet than you
were five years ago
Q28/29 Are you more or less concerned about providing your personal details electronically or online
compare to in hard copy format/ compared with five years ago
One in six Australians (18%) said that they there were no more or less concerned about the privacy
of their personal information than they were five years ago. Men were especially likely to have
noted no change (21%).
Privacy policies on websites
While the majority of Australians continues to not read privacy policies, the proportion has
declined from nearly six in ten (59%) in 2007 to around half (51%) in 2013. Overall, just over four in
ten (44%) Australians claim to read website privacy policies. Australians’ tendency to read them
varied along demographic and attitudinal lines.
• Readership of privacy policies relates to internet usage, with Australians aged over 65 being the
least likely to read them (38%).
• Females (47%) are more likely to read them than males (41%).
• Australians with a bachelor degree (46%) or postgraduate qualification (51%) were more likely
to read privacy policies than those who had been educated up to year 10 (34%).
• Experience and behaviour also played a role in propensity to read privacy policies, with those
who had boycotted a private company (51%), public organisation (61%), had experienced a
problem with personal information (52%) or had some experience of identity theft (51%) being
most likely to read privacy policies.
The survey participants who read website policies were asked to describe the impact these have on
them. The main response was that they help respondents to make a decision on whether or not to
use the site (at 37% an increase from 27% in 2007). Some respondents reported that reading
privacy policies gives them more confidence about using the site (15%) — this has decreased from
2007 (25%).
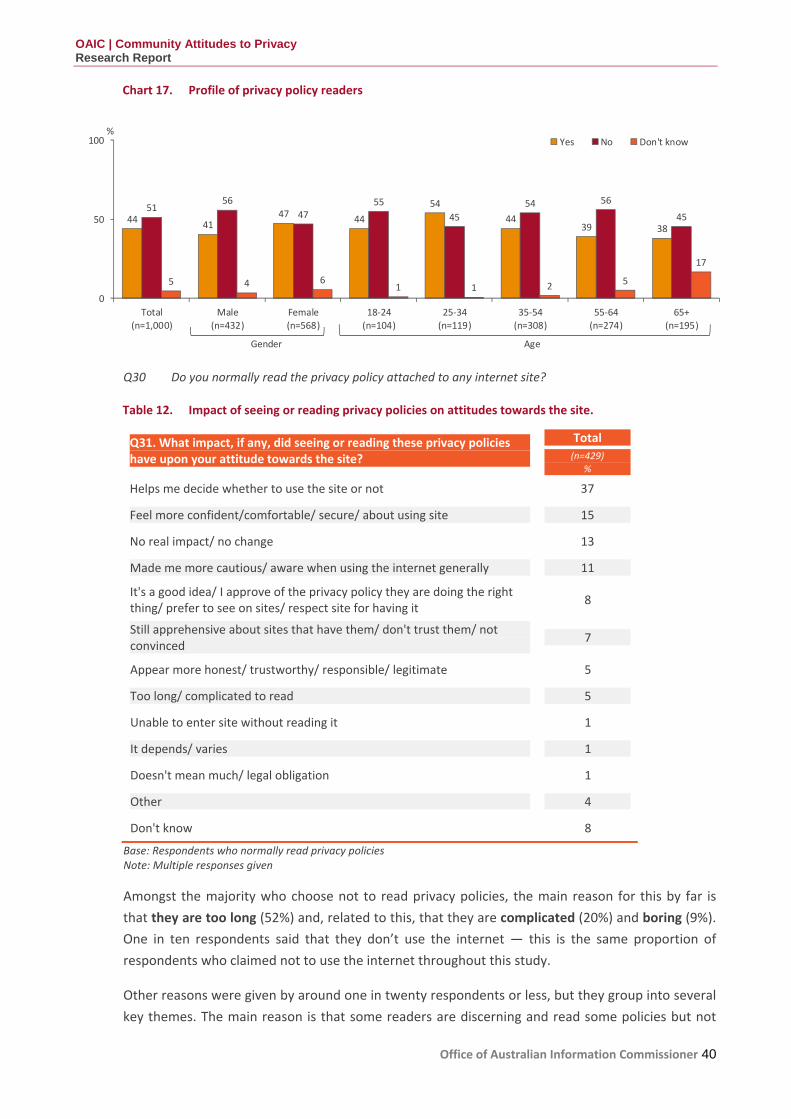
OAIC | Community Attitudes to Privacy Research Report
Office of Australian Information Commissioner 40
Chart 17. Profile of privacy policy readers
100
56 55 54 54 5651
47 4750 44 44 45 44 4541 39 38
17
5 4 6 51 1 2
0
Total Male Female 18‐24 25‐34 35‐54 55‐64 65+
(n=1,000) (n=432) (n=568) (n=104) (n=119) (n=308) (n=274) (n=195)
Yes No%
Don't know
Gender Age
Q30 Do you normally read the privacy policy attached to any internet site?
Table 12. Impact of seeing or reading privacy policies on attitudes towards the site.
Q31. What impact, if any, did seeing or reading these privacy policies have upon your attitude towards the site?
Total
(n=429) %
Helps me decide whether to use the site or not 37
Feel more confident/comfortable/ secure/ about using site 15
No real impact/ no change 13
Made me more cautious/ aware when using the internet generally 11
It's a good idea/ I approve of the privacy policy they are doing the right thing/ prefer to see on sites/ respect site for having it
8
Still apprehensive about sites that have them/ don't trust them/ not convinced
7
Appear more honest/ trustworthy/ responsible/ legitimate 5
Too long/ complicated to read 5
Unable to enter site without reading it 1
It depends/ varies 1
Doesn't mean much/ legal obligation 1
Other 4
Don't know 8
Base: Respondents who normally read privacy policies Note: Multiple responses given
Amongst the majority who choose not to read privacy policies, the main reason for this by far is
that they are too long (52%) and, related to this, that they are complicated (20%) and boring (9%).
One in ten respondents said that they don’t use the internet — this is the same proportion of
respondents who claimed not to use the internet throughout this study.
Other reasons were given by around one in twenty respondents or less, but they group into several
key themes. The main reason is that some readers are discerning and read some policies but not
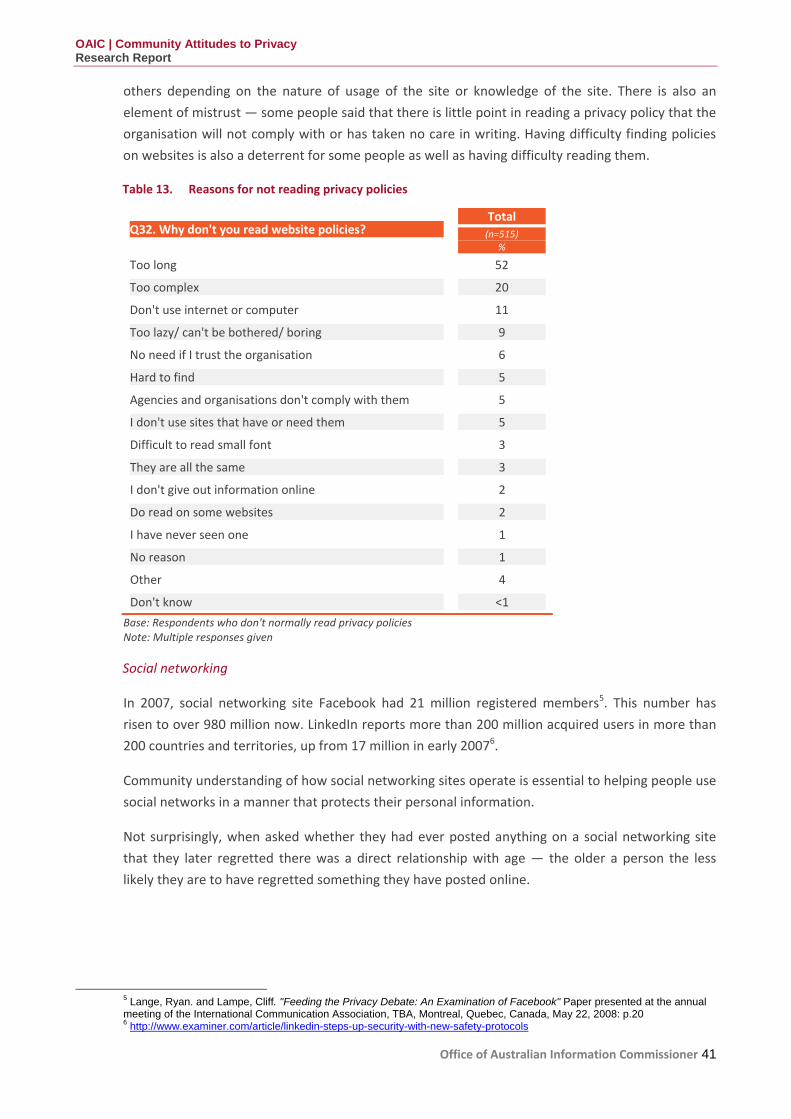
OAIC | Community Attitudes to Privacy Research Report
Office of Australian Information Commissioner 41
others depending on the nature of usage of the site or knowledge of the site. There is also an
element of mistrust — some people said that there is little point in reading a privacy policy that the
organisation will not comply with or has taken no care in writing. Having difficulty finding policies
on websites is also a deterrent for some people as well as having difficulty reading them.
Table 13. Reasons for not reading privacy policies
Q32. Why don't you read website policies? Total
(n=515)%
Too long 52
Too complex 20
Don't use internet or computer 11
Too lazy/ can't be bothered/ boring 9
No need if I trust the organisation 6
Hard to find 5
Agencies and organisations don't comply with them 5
I don't use sites that have or need them 5
Difficult to read small font 3
They are all the same 3
I don't give out information online 2
Do read on some websites 2
I have never seen one 1
No reason 1
Other 4
Don't know <1
Base: Respondents who don't normally read privacy policies Note: Multiple responses given
Social networking
In 2007, social networking site Facebook had 21 million registered members5. This number has
risen to over 980 million now. LinkedIn reports more than 200 million acquired users in more than
200 countries and territories, up from 17 million in early 20076.
Community understanding of how social networking sites operate is essential to helping people use
social networks in a manner that protects their personal information.
Not surprisingly, when asked whether they had ever posted anything on a social networking site
that they later regretted there was a direct relationship with age — the older a person the less
likely they are to have regretted something they have posted online.
5 Lange, Ryan. and Lampe, Cliff. "Feeding the Privacy Debate: An Examination of Facebook" Paper presented at the annual meeting of the International Communication Association, TBA, Montreal, Quebec, Canada, May 22, 2008: p.20 6 http://www.examiner.com/article/linkedin-steps-up-security-with-new-safety-protocols
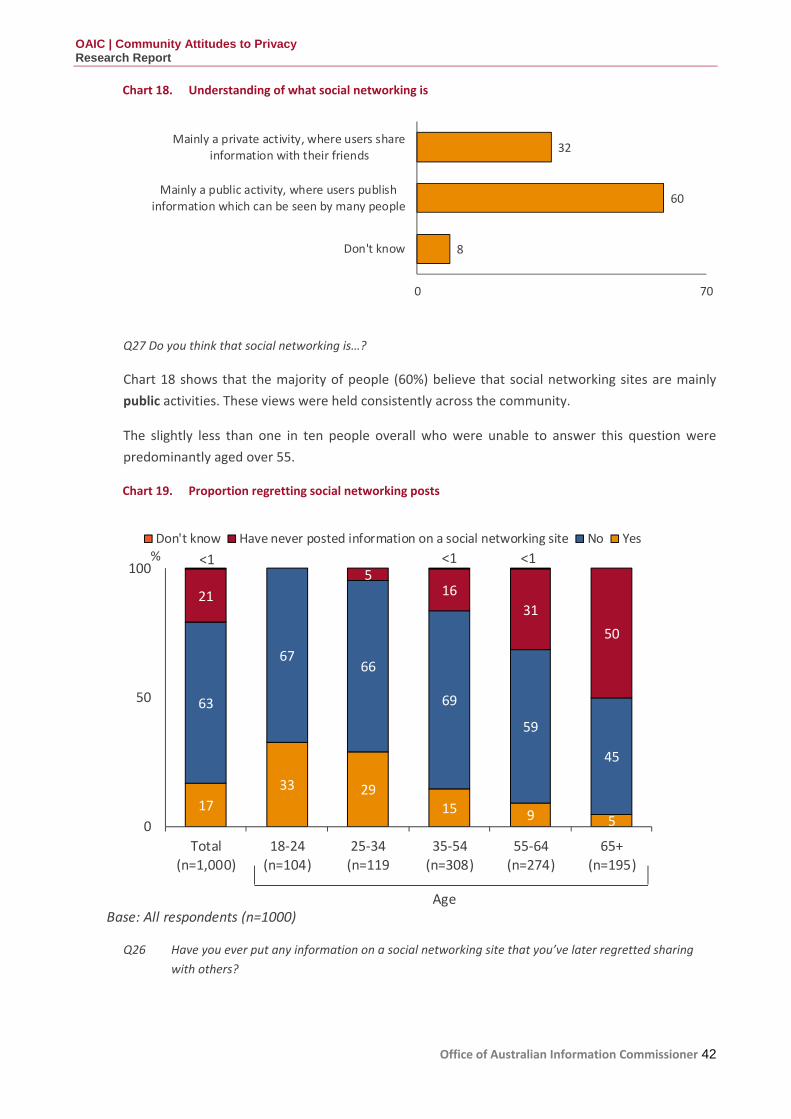
OAIC | Community Attitudes to Privacy Research Report
Office of Australian Information Commissioner 42
%
Base: All respondents (n=1000)
Q27 Do you think that social networking is…?
Chart 18 shows that the majority of people (60%) believe that social networking sites are mainly
public activities. These views were held consistently across the community.
The slightly less than one in ten people overall who were unable to answer this question were
predominantly aged over 55.
Chart 18. Understanding of what social networking is
Mainly a private activity, where users share32
information with their friends
Mainly a public activity, where users publish60
information which can be seen by many people
Don't know 8
0 70
<1 <1 <1100 5
162131
50
6766
50 63 69
59
45
33 2917 15 9 50
Total 18‐24 25‐34 35‐54 55‐64 65+(n=1,000) (n=104) (n=119 (n=308) (n=274) (n=195)
Don't know Have never posted information on a social networking site No Yes%
Age
Chart 19. Proportion regretting social networking posts
Base: All respondents (n=1000)
Q26 Have you ever put any information on a social networking site that you’ve later regretted sharing
with others?
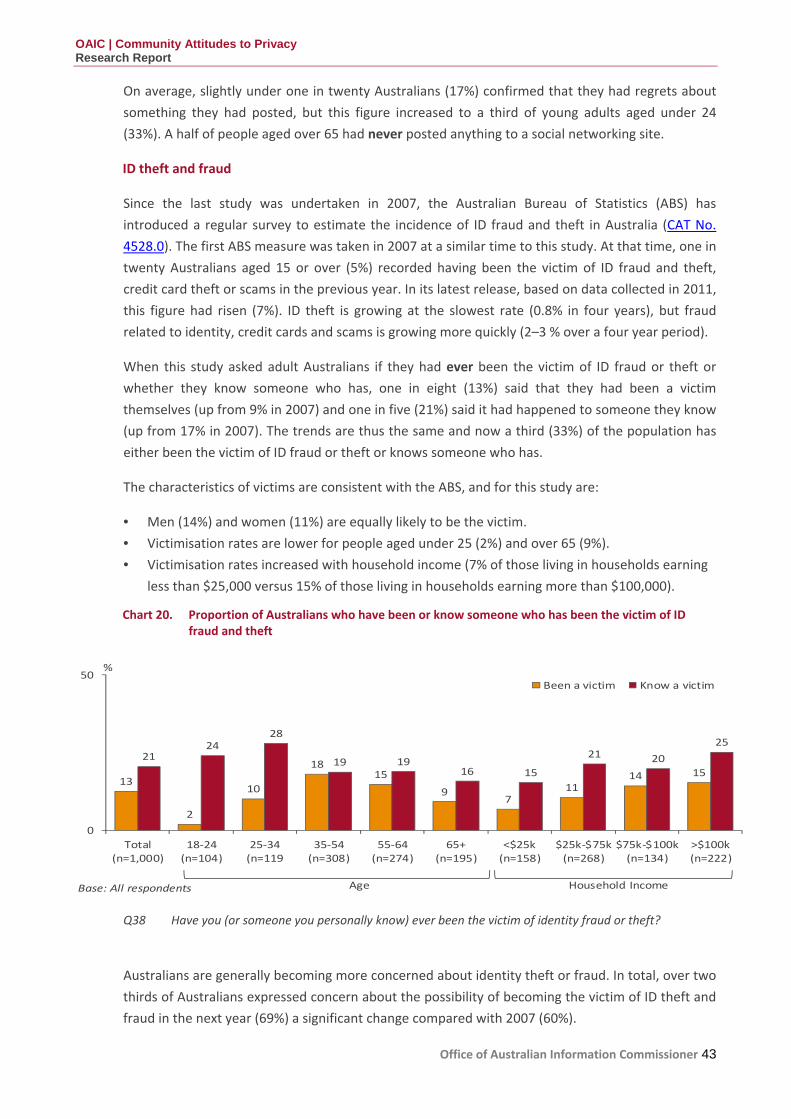
OAIC | Community Attitudes to Privacy Research Report
Office of Australian Information Commissioner 43
On average, slightly under one in twenty Australians (17%) confirmed that they had regrets about
something they had posted, but this figure increased to a third of young adults aged under 24
(33%). A half of people aged over 65 had never posted anything to a social networking site.
ID theft and fraud
Since the last study was undertaken in 2007, the Australian Bureau of Statistics (ABS) has
introduced a regular survey to estimate the incidence of ID fraud and theft in Australia (CAT No.
4528.0). The first ABS measure was taken in 2007 at a similar time to this study. At that time, one in
twenty Australians aged 15 or over (5%) recorded having been the victim of ID fraud and theft,
credit card theft or scams in the previous year. In its latest release, based on data collected in 2011,
this figure had risen (7%). ID theft is growing at the slowest rate (0.8% in four years), but fraud
related to identity, credit cards and scams is growing more quickly (2–3 % over a four year period).
When this study asked adult Australians if they had ever been the victim of ID fraud or theft or
whether they know someone who has, one in eight (13%) said that they had been a victim
themselves (up from 9% in 2007) and one in five (21%) said it had happened to someone they know
(up from 17% in 2007). The trends are thus the same and now a third (33%) of the population has
either been the victim of ID fraud or theft or knows someone who has.
The characteristics of victims are consistent with the ABS, and for this study are:
• Men (14%) and women (11%) are equally likely to be the victim.
• Victimisation rates are lower for people aged under 25 (2%) and over 65 (9%).
• Victimisation rates increased with household income (7% of those living in households earning
less than $25,000 versus 15% of those living in households earning more than $100,000).
Chart 20. Proportion of Australians who have been or know someone who has been the victim of ID fraud and theft
Base: All respondents
50
2824 25
21 2118 19 19 20
15 16 15 14 1513
10 1197
2
0
Total 18‐24 25‐34 35‐54 55‐64 65+ <$25k $25k‐$75k $75k‐$100k >$100k(n=1,000) (n=104) (n=119 (n=308) (n=274) (n=195) (n=158) (n=268) (n=134) (n=222)
Been a victim
%
Know a victim
Age Household Income
Q38 Have you (or someone you personally know) ever been the victim of identity fraud or theft?
Australians are generally becoming more concerned about identity theft or fraud. In total, over two
thirds of Australians expressed concern about the possibility of becoming the victim of ID theft and
fraud in the next year (69%) a significant change compared with 2007 (60%).

OAIC | Community Attitudes to Privacy Research Report
Office of Australian Information Commissioner 44
Another significant change is the level of concern — a quarter of people interviewed in 2013 said
they were “very concerned” (25%) compared with one in six (17%) in 2007. As was the case in
2007, the people who are least likely to be the victims of ID fraud and theft are those most
concerned about the possibility of it happening to them.
A quarter of people aged under 35 know a victim (25%), but a much lower percentage has been the
victim themselves. Nonetheless, younger Australians are the least likely to think that they may
become the victim of ID theft and fraud in the next 12 months.
Australians living in Western Australian were most likely to have been a victim of identity theft
(18%) or know someone who was (40%). This is similar to 2007 where one in seven (14%) WA
residents had been a victim.
Credit reporting
The Privacy Act provides safeguards for individuals in relation to consumer credit reporting. In
particular, Part IIIA governs the handling of credit reports and other credit worthiness information
about individuals by credit reporting agencies (CRAs), credit providers and a limited number of
other recipients.
The Privacy Amendment (Enhancing Privacy Protection) Act 2012 contains significant changes to the
current credit reporting regime. While the bulk of the changes have not yet come into effect, the
credit reforms came into effect from the passing of the Act. This means that from December 2012,
information relating to individuals’ repayment histories will become part of the new more
comprehensive reporting structure.
Given that the provisions are yet to come into effect, it was considered timely to ask Australians to
comment on their understanding of the law, so that changes in attitudes and understanding may
be measured in future.
As this was the first time these questions have been asked in this study, and to ensure that
respondents understood the line of questioning, they were told:
I’d like to ask you a few questions now about credit ratings and information that organisations use
to work these out. Most people who have rented a house, paid bills for utilities or borrowed money
have a credit rating. The information needed to build this rating is available in a credit report.
People were read three statements about how credit reports might work. A quarter of Australians
(26%) selected that everyone is able to see credit information held about them and they are able to
get this from the organisation free of charge. This view was widely held amongst Australians of all
types, although a higher proportion of people called on their mobile phone agreed with this option
(34%) as well as males (29%).
The majority opted for the statement everyone is able to see credit information held about them
but they may have to pay a fee to the organisation that holds the information. Nearly half of the
community chose this (48%) and working Australians, especially those living in high income
households were the most likely to choose it (57% of those living in households earning more than
$75,000).

OAIC | Community Attitudes to Privacy Research Report
Office of Australian Information Commissioner 45
The option that no‐one can get access to credit information whether they’re prepared to pay for it
or not was chosen by one in six Australians (17%), rising at both ends of the age spectrum to over
one in five younger Australians (22% of 18–24‐year‐olds) and a quarter of older Australians (aged
65+) (26%).
One in ten Australians were unable to respond (9%). Women (13%) and older Australians (17% of
over 65 year olds) were the least likely to choose one of the three options.
The oldest (92% of those aged over 65 years) and youngest adult Australians (96% of those aged
between 18 and 24 years) were the least likely to have tried to get access to their credit reports.
Overall, one in six Australians had tried to access their credit report (17%) and subsequent
questioning asked these people to describe their experiences. The group most likely to have
accessed their report were aged 25–55 with around a quarter of people in this age range having
accessed one.
Not surprisingly, given this age range, working Australians (20%) were more likely to have gained
access than non‐working Australians (13%). Otherwise people came from all walks of life. One
characteristic of this group is that they were much more likely than those who had not accessed
their credit report to have:
• refused to give information to public companies because of concerns over the use of their
information (30% versus 23% overall)
• had problems with personal information handling (49% versus 33% overall)
• read an online privacy policy (55% versus 44% overall)
• been the victim of ID fraud or theft (21% versus 13% overall).
The one in six (17%) Australians who had accessed their credit report experienced the following:
• Just over four in ten (43%) were charged for access to their data (7% of the population)
• Seven in ten (70%) found the information on the report to be correct
• Of the three in ten (30%) who found it to be incorrect:
o Nearly six in ten (57%) were able to have the information corrected
o Just over half (55%) made a complaint about the fact that the information was
incorrect. Of these, the majority made that complaint to the organisation involved
(41%), with others complaining to a credit report organisation (25%), the financial
institution (19%), the Ombudsman (12%) or a government department (3%).
Office of the Australian Information CommissionerGPO Box 2999, Canberra ACT 2601GPO Box 5218, Sydney NSW 2001
For further informationtel: 1300 363 992
email: [email protected]
or visit our website atwww.oaic.gov.au