Report on Auto-Fuel Price Monitoring 2016 · 1 CONSUMER COUNCIL Report on Auto-Fuel Price...
22
1 CONSUMER COUNCIL Report on Auto-Fuel Price Monitoring 2016 BACKGROUND 1. In view of public concerns about a drastic decline in international crude oil prices but not an equivalent reduction in retail auto-fuel prices, the Consumer Council (the Council) conducted an auto-fuel price analysis last year by examining the relationship between the daily pump prices for regular gasoline of the five oil companies in Hong Kong 1 , the daily international (Brent) crude oil prices 2 , and the monthly import prices 3 for the period from January 2013 to December 2014. The results of the analysis were released in February 2015 4 . 2. Given the continuous downward trend in crude oil prices through 2015, albeit with slightly upward trends starting in 2016, the Council continued examining the current status of the auto-fuel market 5 . The Council commenced its study early this year and adopted a similar analytical approach in studying the relationships between the three price data sets: daily pump prices, daily Brent crude oil prices and monthly import prices over the three year period from 2013 to the first quarter of 2016 6 . 3. As the crude oil price is only one major component of the imported fuel price and in turn the retail auto-fuel price, other pieces of information are required to assess whether or not retail auto-fuel is fairly priced. Ideally, an economic margin analysis would also be conducted; if the following information was available: i. market shares by oil companies in terms of sales volume; ii. revenue by oil companies; and 1 The five oil companies are: Chevron Hong Kong Limited (Caltex), ExxonMobil Hong Kong Limited (Esso), PetroChina International (Hong Kong) Corporation Limited (PetroChina), Shell Hong Kong Limited (Shell) and Sinopec (Hong Kong) Petrol Filling Station Co., Ltd. (Sinopec). The daily pump prices are collected by the Council. 2 Source: Hong Kong Economic Times. 3 Source: Census and Statistics Department 4 See the Council’s website at www.consumer.org.hk 5 The scope of the study is limited to regular gasoline but not premium gasoline because they share a very similar pattern in the pump price adjustments. Diesel price is not included in the study for the reason that business-to-business discounts dominate the market and such kind of commercial information is not publicly available. 6 Due to the unavailability of the second quarter of 2016 data by the time of preparation of this report, the study only included data up to the first quarter of 2016.
Transcript of Report on Auto-Fuel Price Monitoring 2016 · 1 CONSUMER COUNCIL Report on Auto-Fuel Price...

1
CONSUMER COUNCIL
Report on Auto-Fuel Price Monitoring 2016
BACKGROUND
1. In view of public concerns about a drastic decline in international crude oil prices
but not an equivalent reduction in retail auto-fuel prices, the Consumer Council
(the Council) conducted an auto-fuel price analysis last year by examining the
relationship between the daily pump prices for regular gasoline of the five oil
companies in Hong Kong1, the daily international (Brent) crude oil prices2, and
the monthly import prices3 for the period from January 2013 to December 2014.
The results of the analysis were released in February 20154.
2. Given the continuous downward trend in crude oil prices through 2015, albeit
with slightly upward trends starting in 2016, the Council continued examining the
current status of the auto-fuel market5. The Council commenced its study early
this year and adopted a similar analytical approach in studying the relationships
between the three price data sets: daily pump prices, daily Brent crude oil prices
and monthly import prices over the three year period from 2013 to the first
quarter of 20166.
3. As the crude oil price is only one major component of the imported fuel price and
in turn the retail auto-fuel price, other pieces of information are required to
assess whether or not retail auto-fuel is fairly priced. Ideally, an economic margin
analysis would also be conducted; if the following information was available:
i. market shares by oil companies in terms of sales volume;
ii. revenue by oil companies; and
1
The five oil companies are: Chevron Hong Kong Limited (Caltex), ExxonMobil Hong Kong Limited
(Esso), PetroChina International (Hong Kong) Corporation Limited (PetroChina), Shell Hong Kong
Limited (Shell) and Sinopec (Hong Kong) Petrol Filling Station Co., Ltd. (Sinopec). The daily pump prices
are collected by the Council. 2 Source: Hong Kong Economic Times.
3 Source: Census and Statistics Department
4 See the Council’s website at www.consumer.org.hk
5 The scope of the study is limited to regular gasoline but not premium gasoline because they share a
very similar pattern in the pump price adjustments. Diesel price is not included in the study for the
reason that business-to-business discounts dominate the market and such kind of commercial
information is not publicly available. 6 Due to the unavailability of the second quarter of 2016 data by the time of preparation of this
report, the study only included data up to the first quarter of 2016.
2
iii. cost breakdowns (e.g. product costs, marketing cost including discounts and
rebates with relative uptake of different offers, land costs, operating costs,
credit card commission, government rent and rates, terminal storage,
distribution) for the oil companies.
4. In March this year, the Council wrote to the five oil companies for cost
information such as import costs, discounts and rebates and operating costs
including land costs, in order to assist in elucidating the differences between
retail prices and import prices. Among the five companies, two provided partial
responses, one refused to supply information and the other two, by the time of
preparation of this report, provided no information. The two companies that
made partial responses7 claimed they were not able to fully meet the Council’s
request as the information was considered commercially sensitive data.
OBJECTIVES
5. The objectives of the study in auto-fuel prices and the changes of cost are to look
into whether findings regarding allegations of pricing tactics such as “quick going
up, slow coming down”8 and / or “no going up, less coming down”9 that the
Council observed in the period of 2013 and 2014, continued in 2015; and to
examine if there are other reasons that can help to ease the public’s suspicion
that there has been profiteering in the auto-fuel industry over recent years.
METHODOLOGY
6. Owing to the unavailability of the above-mentioned information, the Council’s
analysis relied mostly on publicly available information obtained from the Census
and Statistics Department, and data compiled from the Council’s Oil Price
Calculator data archive. The Council’s analysis adopted the following approach:
i. an average approach to the pump price and discount levels of the auto-fuel
industry and oil companies;
7 One company replied that the average discounts for gasoline to customers have increased by 47%
from 2010 to 2015. Another company quoted examples of the loyalty program and card offers in these
years and commented that the local retail auto-fuels market is highly competitive. 8
There are allegations that pump price changes more quickly when international crude oil price rises,
and more slowly when it falls. 9
There are also allegations that pump prices increase more in response to an increase in the
international crude oil price and decrease less in respond to a decrease in the international crude oil
price.

3
ii. an average approach to the land cost of the tendered petrol filling station
(PFS) sites in different areas in Hong Kong;
iii. a market estimation approach to the lease price of the PFS sites that had
not been tendered after 2006; and
iv. annual land cost for each PFS site equalized over the lease period of 21
years.
7. Oil companies have always argued that they use Mean of Platts Singapore
(“MOPS”) as the benchmark price rather the Brent oil price10 and stated that
they use Singapore MOPS prices, not crude oil prices in their cost accounting and
pricing decisions for retail petrol. Crude oil price is the price of unrefined oil while
MOPS price is the price at which oil companies purchase the refined wholesale
petrol from the refineries. MOPS price tends to be higher than crude oil price as
it includes the cost of refining the crude oil into wholesale petrol. In 2015, it is
claimed that MOPS price (i.e. wholesale auto-fuel price) or import fuel price
made up 24% of the retail auto-fuel price11.
8. The MOPS data is only available on subscription, and thus not publicly available.
The only available access to information on MOPS is through the Environment
Bureau which provides a graphical trend of MOPS on its web site12; published
every week (a typical graph is shown in Annex 1)13.
9. It is understood that the refinery cost is fairly stable. A structural relationship
between the MOPS and Brent crude oil price is expected unless there are
speculative trades or manipulations that cannot be eliminated through market
arbitration14. As the Council’s interest is to determine the stability of the
response of the pump price to relevant international benchmark price over a
period of time and that the calculated correlation coefficient between the Brent
crude oil price and the average pump price before tax was as high as 0.98 from
2013 to the first quarter of 2016, there should not be any significant difference in
the finding for using the Brent crude oil price in its analysis.
10
Two companies responded to the enquiry of the Council commented that the Mean of Platts
Singapore (MOPS) price is a better indicator of the product cost than the Brent crude oil price. 11
Sources: correspondence between the Council and oil companies in Hong Kong 12
http://www.enb.gov.hk/en/about_us/policy_responsibilities/financial_monitoring.html. 13
There is still increasing gap between the absolute value change of average MOPS and the average
pump price in 2013-2015. 14
According to the finding by the Competition Commission of Singapore, for the period of June 2014
to January 2016, crude oil price fell by an average of HK$3.38 (-67%), MOPS price fell by HK$2.93
(-53%).
4
FINDINGS
Price Trend
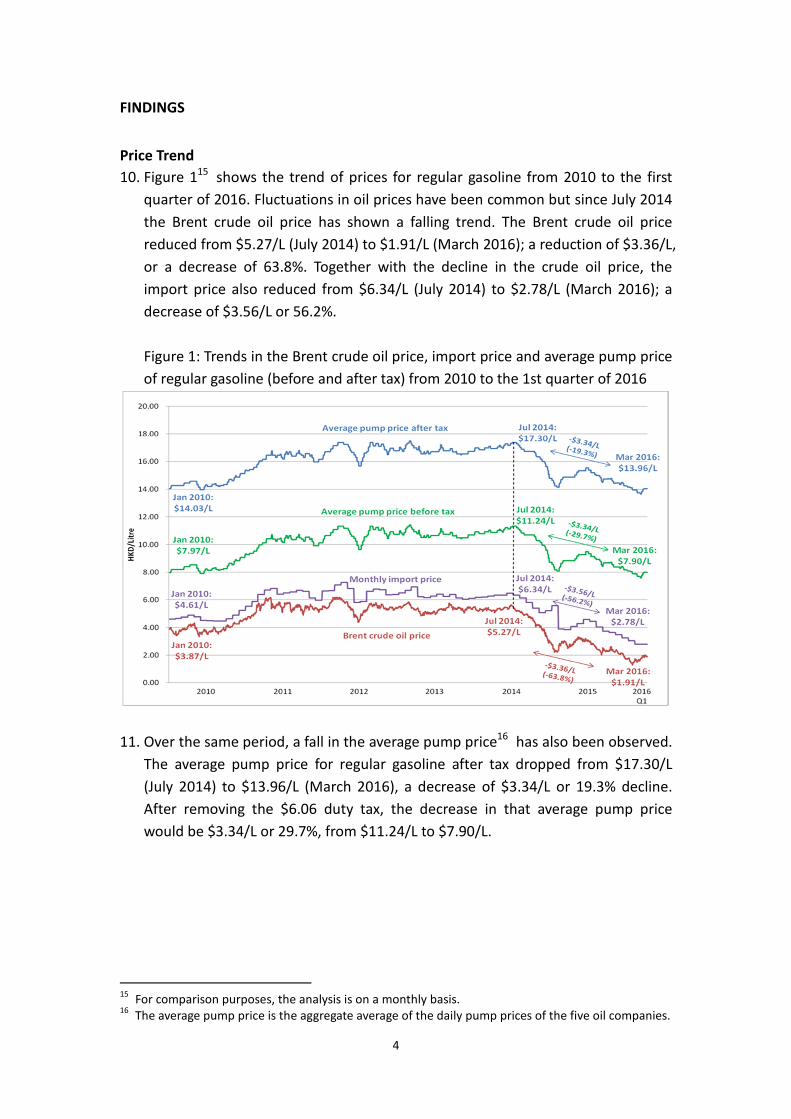
10. Figure 115 shows the trend of prices for regular gasoline from 2010 to the first
quarter of 2016. Fluctuations in oil prices have been common but since July 2014
the Brent crude oil price has shown a falling trend. The Brent crude oil price
reduced from $5.27/L (July 2014) to $1.91/L (March 2016); a reduction of $3.36/L,
or a decrease of 63.8%. Together with the decline in the crude oil price, the
import price also reduced from $6.34/L (July 2014) to $2.78/L (March 2016); a
decrease of $3.56/L or 56.2%.
Figure 1: Trends in the Brent crude oil price, import price and average pump price
of regular gasoline (before and after tax) from 2010 to the 1st quarter of 2016
11. Over the same period, a fall in the average pump price16 has also been observed.
The average pump price for regular gasoline after tax dropped from $17.30/L
(July 2014) to $13.96/L (March 2016), a decrease of $3.34/L or 19.3% decline.
After removing the $6.06 duty tax, the decrease in that average pump price
would be $3.34/L or 29.7%, from $11.24/L to $7.90/L.
15
For comparison purposes, the analysis is on a monthly basis. 16
The average pump price is the aggregate average of the daily pump prices of the five oil companies.

5
Table 1: Price change of Brent crude oil price, import price and average pump price
for regular gasoline
At
July 2014
At
March
2016
Absolute
Change
Percentage
Change
Brent crude oil price $5.27/L $1.91/L - $3.36/L - 63.8%
Import price $6.34/L $2.78/L - $3.56/L - 56.2%
Average pump price (before tax) $11.24/L $7.90/L - $3.34/L - 29.7%
Average pump price (after tax) $17.30/L $13.96/L - $3.34/L - 19.3%
12. Table 1 shows that the Brent crude oil price, the import price and the average
pump price have fallen but they are not of the same magnitude (both in terms of
absolute and percentage changes). The difference in the absolute change was
only $0.02/L between the Brent crude oil price and the average pump price
($3.36/L - $3.34/L) and only $0.22/L between the import price and the average
pump price ($3.56/L - $3.34/L).
13. Local consumption of unleaded motor gasoline in 2015 was about 613.8 million
litres17. Despite the fact that the respective absolute difference in change was
only $0.02/L and $0.22/L, a minor difference in price may still therefore result in
a huge increase in the amount of total revenue in the industry, and as a
consequence, a similar increase in total expenditure by consumers (see para. 29
and 30 for more statistics).
Pricing Tactics
14. The above analysis compared the overall discrepancy between the Brent crude oil
price, the import price and the average pump price since the beginning of the
recent slump in the crude oil price. If the previously observed pricing tactics of
“quick going up, slow coming down” and / or “no going up, less coming down”
continue to be adopted over an extended period of time, it can be expected that
the impact of the tactics on the change in price to consumers will be much bigger.
17
Source:《Hong Kong Energy Statistics》of the Census and Statistics Department.
6
Quick going up, slow coming down
15. To assess the reactiveness of the daily pump price to changes in the international
benchmark price, a regression analysis was conducted. As daily import price
information is not available, the daily Brent crude oil price has been used to see
how the change in the Brent crude oil price, on different lag days, would affect
any change in the pump price. Making reference to the price trend in Figure 1,
the regression analysis was undertaken on a half-yearly interval basis.
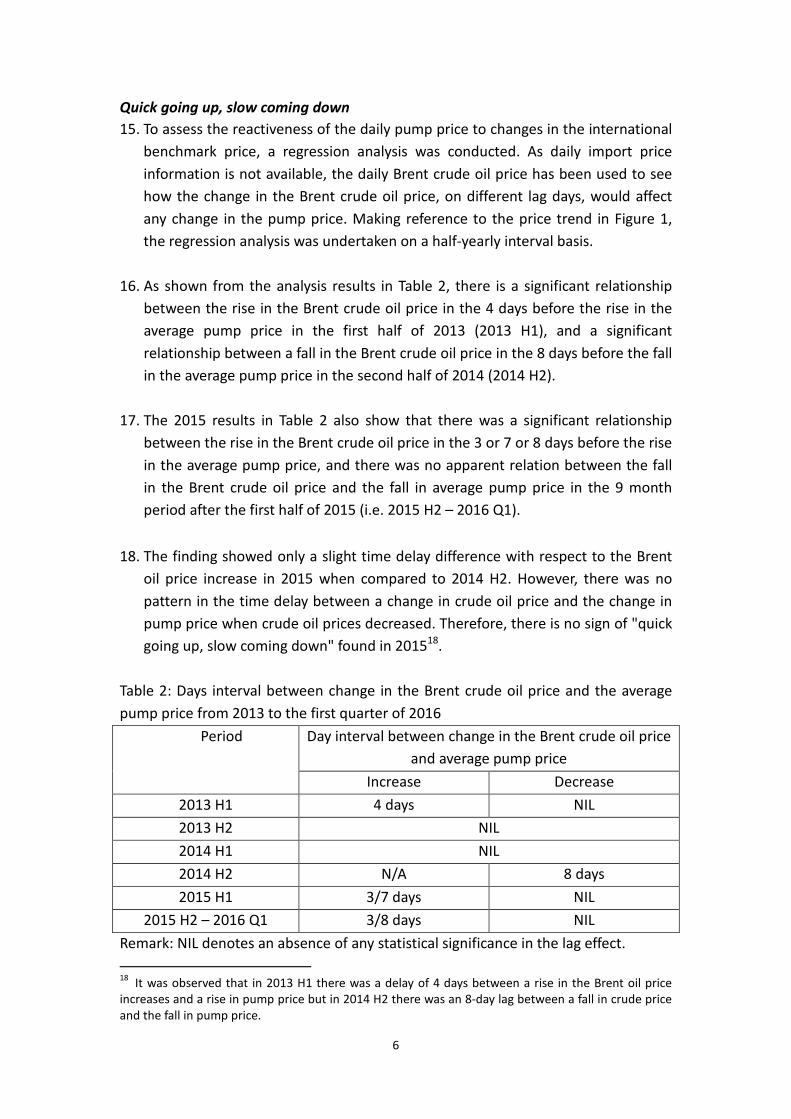
16. As shown from the analysis results in Table 2, there is a significant relationship
between the rise in the Brent crude oil price in the 4 days before the rise in the
average pump price in the first half of 2013 (2013 H1), and a significant
relationship between a fall in the Brent crude oil price in the 8 days before the fall
in the average pump price in the second half of 2014 (2014 H2).
17. The 2015 results in Table 2 also show that there was a significant relationship
between the rise in the Brent crude oil price in the 3 or 7 or 8 days before the rise
in the average pump price, and there was no apparent relation between the fall
in the Brent crude oil price and the fall in average pump price in the 9 month
period after the first half of 2015 (i.e. 2015 H2 – 2016 Q1).
18. The finding showed only a slight time delay difference with respect to the Brent
oil price increase in 2015 when compared to 2014 H2. However, there was no
pattern in the time delay between a change in crude oil price and the change in
pump price when crude oil prices decreased. Therefore, there is no sign of "quick
going up, slow coming down" found in 201518.
Table 2: Days interval between change in the Brent crude oil price and the average
pump price from 2013 to the first quarter of 2016
Period Day interval between change in the Brent crude oil price
and average pump price
Increase Decrease
2013 H1 4 days NIL
2013 H2 NIL
2014 H1 NIL
2014 H2 N/A 8 days
2015 H1 3/7 days NIL
2015 H2 – 2016 Q1 3/8 days NIL
Remark: NIL denotes an absence of any statistical significance in the lag effect.
18
It was observed that in 2013 H1 there was a delay of 4 days between a rise in the Brent oil price
increases and a rise in pump price but in 2014 H2 there was an 8-day lag between a fall in crude price
and the fall in pump price.

7
N/A denotes no increase in pump price of regular gasoline.
19. Patterns of price changes of the market were observed in the periods of the first
half year of 2013, the second half of 2014 and from 2015 to 2016 Q1. Individual
company price changes were checked whether the pattern was caused by a
pattern of responses of any particular group of companies in response to the
Brent crude oil price changes.
20. As shown in Table 3, significantly different patterns were observed among oil
companies in 2013 H1 and 2014 H2. For oil companies B, D, and G, their pump
price responses in the period when the Brent crude oil price decreased and
increased were very different. However, for companies A and F, there were no
significant difference in response found regardless of when the Brent crude oil
price increased or decreased. Starting from 2015, only oil company F showed a
pump price response to the increase in Brent crude oil price at H1. It can be
deduced from these observations that whatever pattern was observed it might
be dominantly caused by unilateral action by some companies in their response
to the Brent crude oil price changes.
Table 3: Days interval between a change in the Brent crude oil price and the
average pump price from 2013 to the first quarter of 2016 (by company)
Company
Day interval between change in the Brent crude oil price and average
pump price
2013 H1
Increase
2014 H2
Decrease
2015 H1
Increase
2015 H2 – 2016 Q1
Increase
A 4-7 days 4/8 days NIL
B NIL 4 days NIL
D NIL 7 days NIL
G NIL 6 days NIL
F 3 days 4 days 7 days NIL
Remark: NIL denotes an absence of any statistical significance in the lag effect.
No going up, less coming down
21. As shown in Table 1, the absolute and percentage changes between the Brent
crude oil price, the import price and the average pump price are not equivalent.
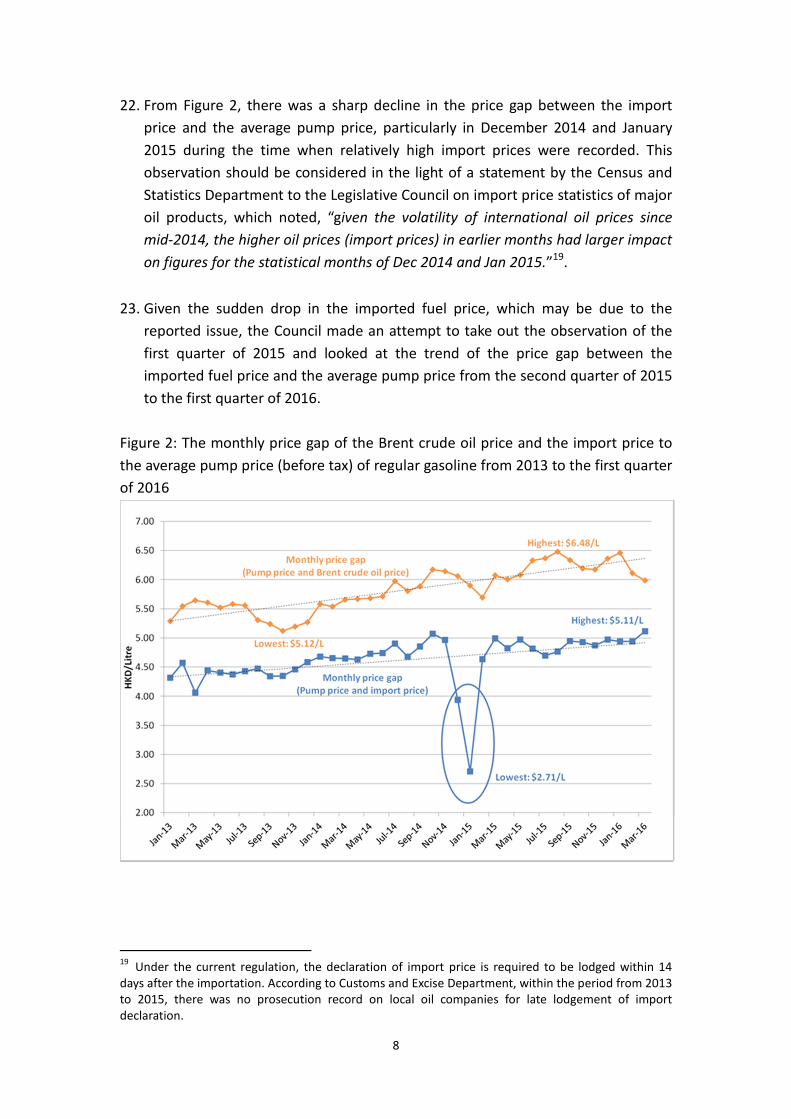
The Council’s analysis indicates that there are in general increasing monthly price
gaps between the Brent crude oil price and the average pump price, and the
import price and the average pump price over the period 2013 to the first quarter
of 2016, as shown in Figure 2.
8
22. From Figure 2, there was a sharp decline in the price gap between the import
price and the average pump price, particularly in December 2014 and January
2015 during the time when relatively high import prices were recorded. This
observation should be considered in the light of a statement by the Census and
Statistics Department to the Legislative Council on import price statistics of major
oil products, which noted, “given the volatility of international oil prices since
mid-2014, the higher oil prices (import prices) in earlier months had larger impact
on figures for the statistical months of Dec 2014 and Jan 2015.”19.
23. Given the sudden drop in the imported fuel price, which may be due to the
reported issue, the Council made an attempt to take out the observation of the
first quarter of 2015 and looked at the trend of the price gap between the
imported fuel price and the average pump price from the second quarter of 2015
to the first quarter of 2016.
Figure 2: The monthly price gap of the Brent crude oil price and the import price to
the average pump price (before tax) of regular gasoline from 2013 to the first quarter
of 2016
19
Under the current regulation, the declaration of import price is required to be lodged within 14
days after the importation. According to Customs and Excise Department, within the period from 2013
to 2015, there was no prosecution record on local oil companies for late lodgement of import
declaration.
9
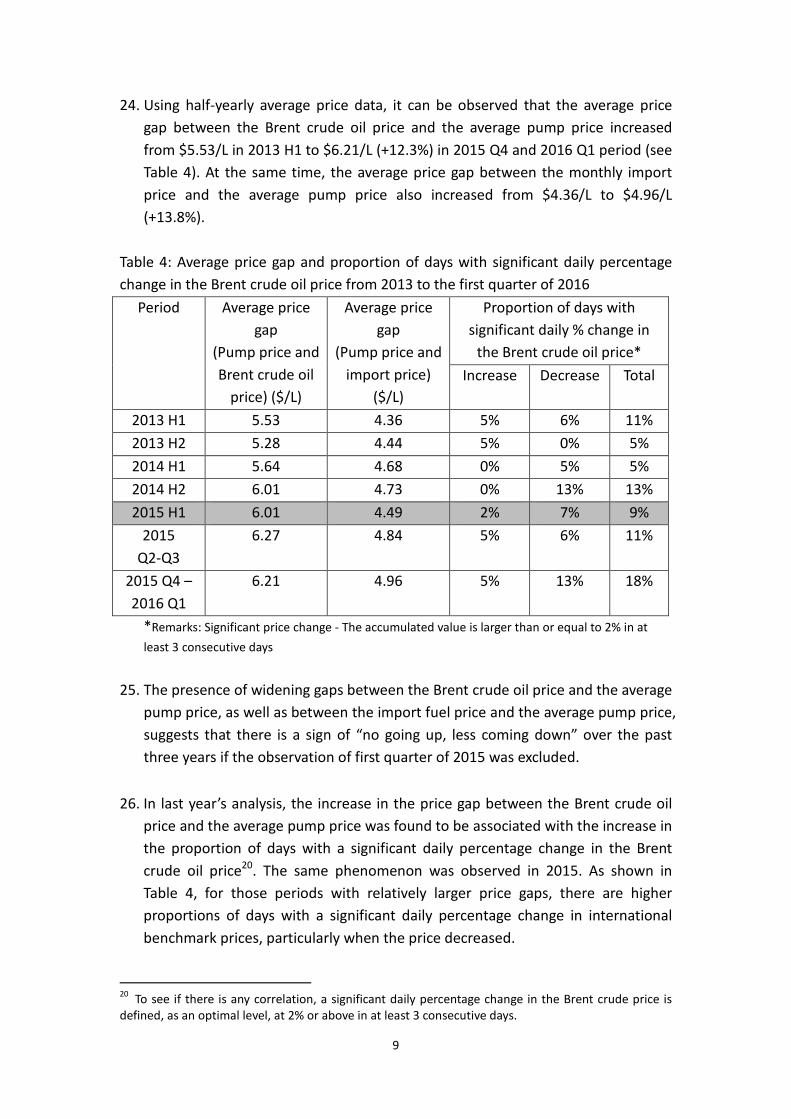
24. Using half-yearly average price data, it can be observed that the average price
gap between the Brent crude oil price and the average pump price increased
from $5.53/L in 2013 H1 to $6.21/L (+12.3%) in 2015 Q4 and 2016 Q1 period (see
Table 4). At the same time, the average price gap between the monthly import
price and the average pump price also increased from $4.36/L to $4.96/L
(+13.8%).
Table 4: Average price gap and proportion of days with significant daily percentage
change in the Brent crude oil price from 2013 to the first quarter of 2016
Period Average price
gap
(Pump price and
Brent crude oil
price) ($/L)
Average price
gap
(Pump price and
import price)
($/L)
Proportion of days with
significant daily % change in
the Brent crude oil price*
Increase Decrease Total
2013 H1 5.53 4.36 5% 6% 11%
2013 H2 5.28 4.44 5% 0% 5%
2014 H1 5.64 4.68 0% 5% 5%
2014 H2 6.01 4.73 0% 13% 13%
2015 H1 6.01 4.49 2% 7% 9%
2015
Q2-Q3
6.27 4.84 5% 6% 11%
2015 Q4 –
2016 Q1
6.21 4.96 5% 13% 18%
*Remarks: Significant price change - The accumulated value is larger than or equal to 2% in at
least 3 consecutive days
25. The presence of widening gaps between the Brent crude oil price and the average
pump price, as well as between the import fuel price and the average pump price,
suggests that there is a sign of “no going up, less coming down” over the past
three years if the observation of first quarter of 2015 was excluded.
26. In last year’s analysis, the increase in the price gap between the Brent crude oil
price and the average pump price was found to be associated with the increase in
the proportion of days with a significant daily percentage change in the Brent
crude oil price20. The same phenomenon was observed in 2015. As shown in
Table 4, for those periods with relatively larger price gaps, there are higher
proportions of days with a significant daily percentage change in international
benchmark prices, particularly when the price decreased.
20
To see if there is any correlation, a significant daily percentage change in the Brent crude price is
defined, as an optimal level, at 2% or above in at least 3 consecutive days.
10
FURTHER ANALYSIS
27. In last section the Council observed that there are signs of “no going up, less
coming down”. The Council understands that the crude oil price is only one
component of the auto-fuel price, and that there are other costs which are
constituted within the retail price; such as import costs, discounts and rebates,
land costs and operating costs (such as labour, maintenance, marketing, utilities,
etc.).
28. As mentioned at the beginning of this report, the five oil companies did not
provide the Council with requested cost information. In order to assess if there
are signs that the oil companies have been increasing or decreasing their profits
in recent years, the Council conducted its cost analysis with reference to publicly
available information, and the limited information provided by the two oil
companies. Some discussions on sales trend and different cost components were
shown below.
Sales Trend
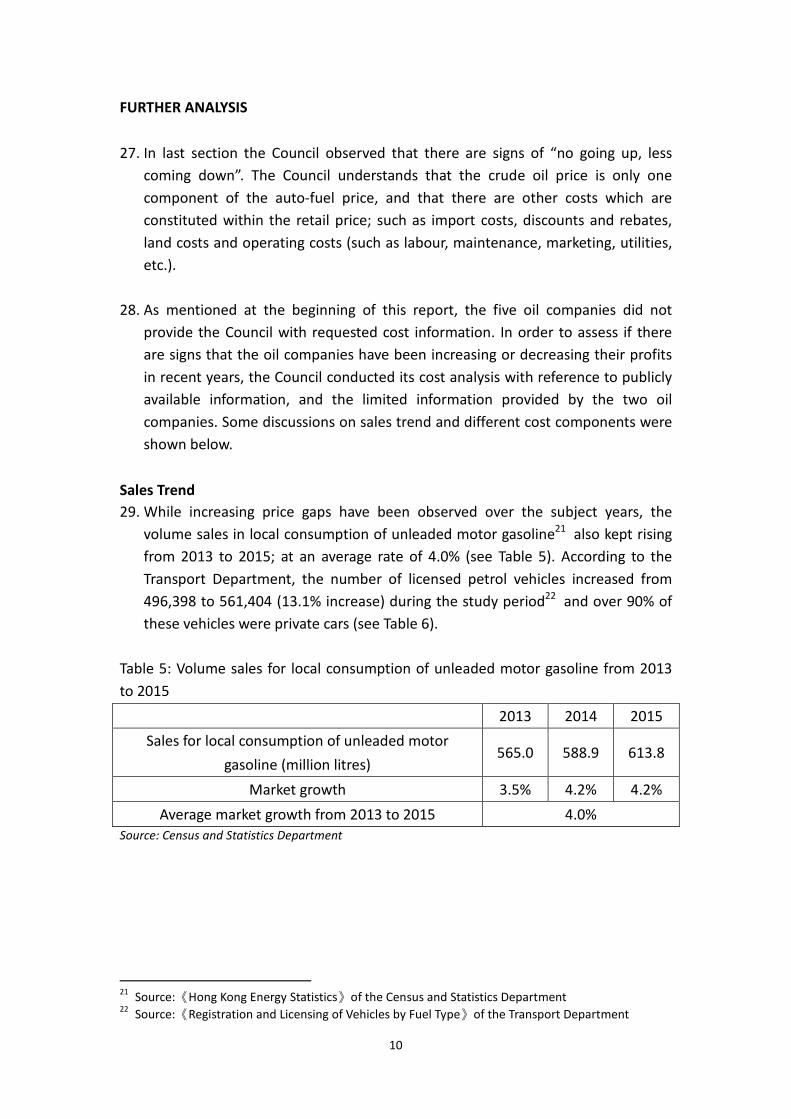
29. While increasing price gaps have been observed over the subject years, the
volume sales in local consumption of unleaded motor gasoline21 also kept rising
from 2013 to 2015; at an average rate of 4.0% (see Table 5). According to the
Transport Department, the number of licensed petrol vehicles increased from
496,398 to 561,404 (13.1% increase) during the study period22 and over 90% of
these vehicles were private cars (see Table 6).
Table 5: Volume sales for local consumption of unleaded motor gasoline from 2013
to 2015
2013 2014 2015
Sales for local consumption of unleaded motor
gasoline (million litres) 565.0 588.9 613.8
Market growth 3.5% 4.2% 4.2%
Average market growth from 2013 to 2015 4.0%
Source: Census and Statistics Department
21
Source:《Hong Kong Energy Statistics》of the Census and Statistics Department 22
Source:《Registration and Licensing of Vehicles by Fuel Type》of the Transport Department
11
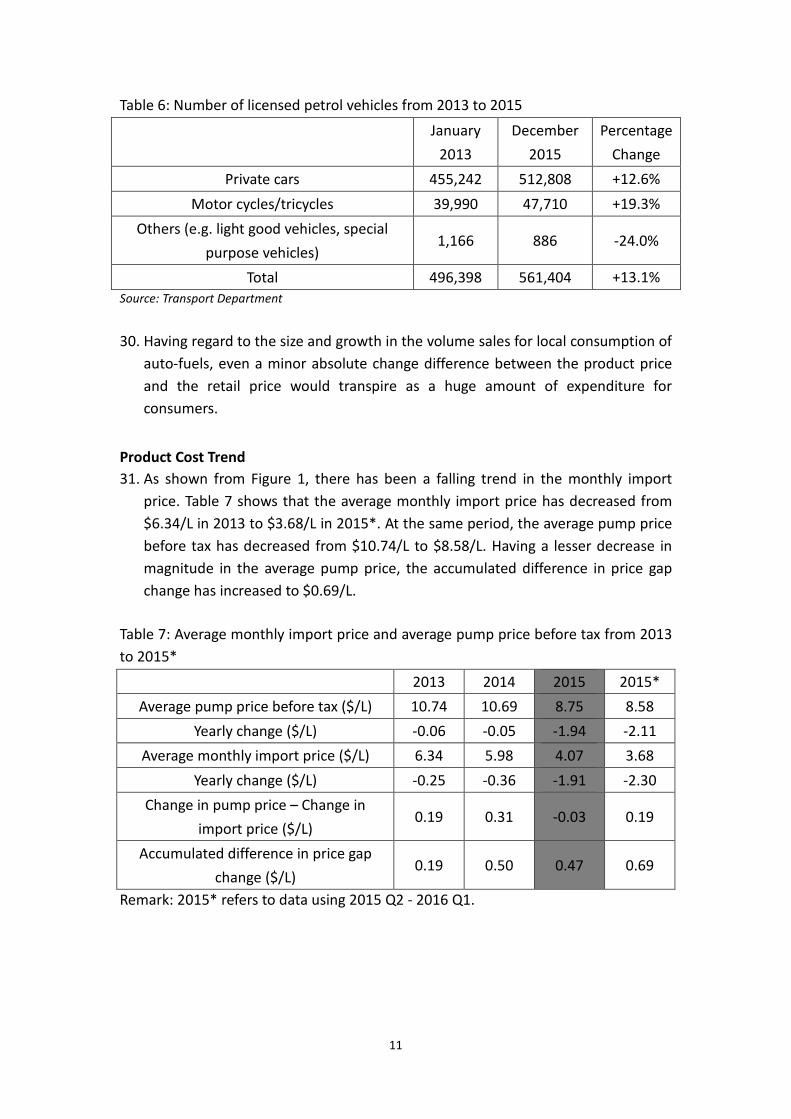
Table 6: Number of licensed petrol vehicles from 2013 to 2015
January
2013
December
2015
Percentage
Change
Private cars 455,242 512,808 +12.6%
Motor cycles/tricycles 39,990 47,710 +19.3%
Others (e.g. light good vehicles, special
purpose vehicles) 1,166 886 -24.0%
Total 496,398 561,404 +13.1%
Source: Transport Department
30. Having regard to the size and growth in the volume sales for local consumption of
auto-fuels, even a minor absolute change difference between the product price
and the retail price would transpire as a huge amount of expenditure for
consumers.
Product Cost Trend
31. As shown from Figure 1, there has been a falling trend in the monthly import
price. Table 7 shows that the average monthly import price has decreased from
$6.34/L in 2013 to $3.68/L in 2015*. At the same period, the average pump price
before tax has decreased from $10.74/L to $8.58/L. Having a lesser decrease in
magnitude in the average pump price, the accumulated difference in price gap
change has increased to $0.69/L.
Table 7: Average monthly import price and average pump price before tax from 2013
to 2015*
2013 2014 2015 2015*
Average pump price before tax ($/L) 10.74 10.69 8.75 8.58
Yearly change ($/L) -0.06 -0.05 -1.94 -2.11
Average monthly import price ($/L) 6.34 5.98 4.07 3.68
Yearly change ($/L) -0.25 -0.36 -1.91 -2.30
Change in pump price – Change in
import price ($/L) 0.19 0.31 -0.03 0.19
Accumulated difference in price gap
change ($/L) 0.19 0.50 0.47 0.69
Remark: 2015* refers to data using 2015 Q2 - 2016 Q1.
12
Change in Land Costs
32. Apart from product costs, land costs are also a major cost component of
auto-fuel retail prices. Since the new tender arrangements from June 2003, there
were 20 tendered PFS sites up to 2005, no tendered PFS site in 2006 and 34 PFS
sites tendered in the period of 2007 -2015 upon expiry of lease agreements. The
annual number over the period ranged from 2 to 7 PFS sites.
33. For estimation of land costs, public available information about land lease costs
can be used to estimate the land cost of some PFS sites. However, the land lease
cost is only publicly available from 2003 onwards. For reasonable estimation, the
Council used 2006 as the cut-off year in the estimation. The average land lease
cost of 20 sites tendered between 2003 and 2005 was used as an estimate of the
land lease cost for any PFS site that had not been tendered after 2006. For the
PFS sites that were tendered from 2007 to 2015, the Council used the actual land
lease cost of the 34 PFS sites to compute their annual land cost.
34. For the PFS sites that had not been tendered after 2006, the estimated land cost
per site for 21 years is computed as $78.1 million (the average land lease cost of
20 sites tendered between 2003 and 2005). From this estimate, the annual land
cost for each PFS site equalized over the lease period of 21 years was calculated
as $3.72 million. By multiplying the number of PFS sites not tendered after 2006
to respective year, one can calculate the total annual cost of land lease of those
sites.
35. Similarly, for the PFS sites that were tendered from 2007 to 2015, the annual land
cost was calculated by dividing the lease cost by 21 year. By averaging over all
tendered sites up to that year, the average annual land cost per site of those
tendered after 2006 can be computed, $6.21 million in 2013, $6.41 million in
2014 and $6.64 million in 2015, as shown in Table 8. By multiplying the number
of PFS sites tendered after 2006 to respective year, one can calculate the total
annual cost of land lease of those tendered sites.
13
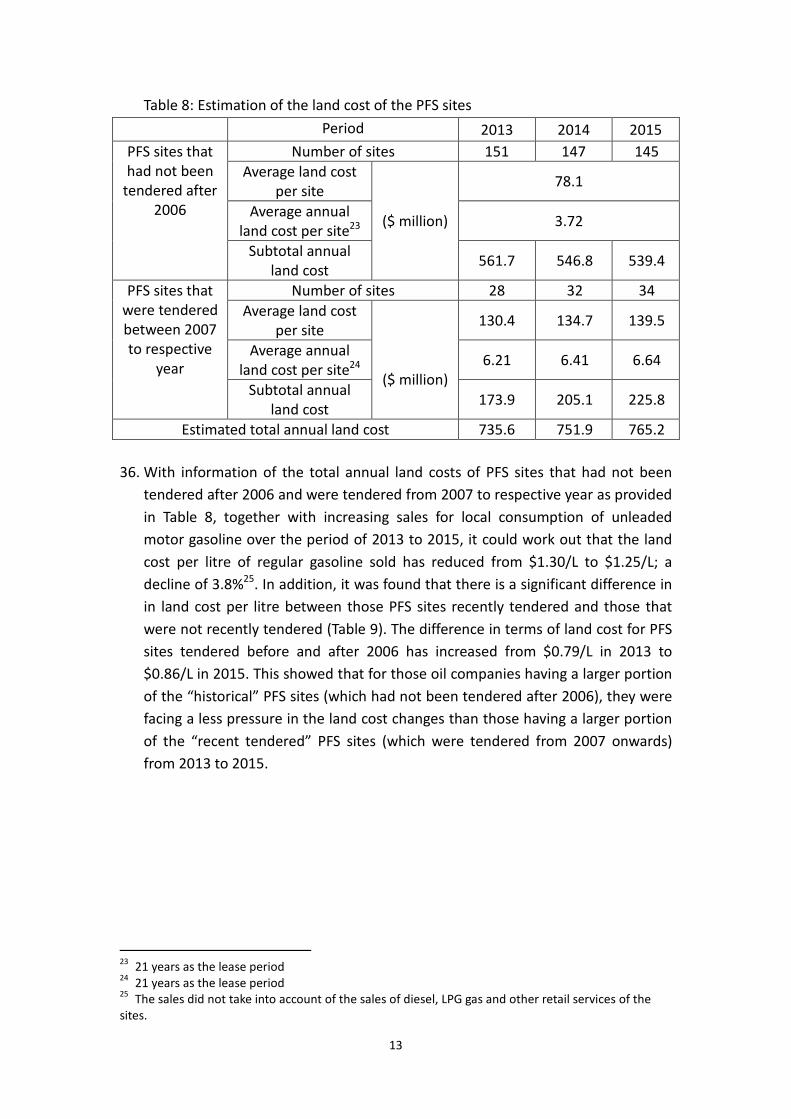
Table 8: Estimation of the land cost of the PFS sites
Period 2013 2014 2015
PFS sites that
had not been
tendered after
2006
Number of sites 151 147 145
Average land cost
per site
($ million)
78.1
Average annual
land cost per site23 3.72
Subtotal annual
land cost 561.7 546.8 539.4
PFS sites that
were tendered
between 2007
to respective
year
Number of sites 28 32 34
Average land cost
per site
($ million)
130.4 134.7 139.5
Average annual
land cost per site24 6.21 6.41 6.64
Subtotal annual
land cost 173.9 205.1 225.8
Estimated total annual land cost 735.6 751.9 765.2
36. With information of the total annual land costs of PFS sites that had not been
tendered after 2006 and were tendered from 2007 to respective year as provided
in Table 8, together with increasing sales for local consumption of unleaded
motor gasoline over the period of 2013 to 2015, it could work out that the land
cost per litre of regular gasoline sold has reduced from $1.30/L to $1.25/L; a
decline of 3.8%25. In addition, it was found that there is a significant difference in
in land cost per litre between those PFS sites recently tendered and those that
were not recently tendered (Table 9). The difference in terms of land cost for PFS
sites tendered before and after 2006 has increased from $0.79/L in 2013 to
$0.86/L in 2015. This showed that for those oil companies having a larger portion
of the “historical” PFS sites (which had not been tendered after 2006), they were
facing a less pressure in the land cost changes than those having a larger portion
of the “recent tendered” PFS sites (which were tendered from 2007 onwards)
from 2013 to 2015.
23
21 years as the lease period 24
21 years as the lease period 25
The sales did not take into account of the sales of diesel, LPG gas and other retail services of the
sites.

14
Table 9: Estimation of the land cost change from 2013 to 2015
2013 2014 2015
Estimated total annual land cost ($ million) 735.6 751.9 765.2
Sales for local consumption (ML) 565.0 588.9 613.8
Estimated land cost per litre of overall PFS sites ($/L) 1.30 1.28 1.25
Average sales per PFS site (ML) 3.16 3.29 3.43
Estimated land cost per litre of those PFS sites that
had not been tendered after 2006 (a)
1.18 1.13 1.08
Estimated land cost per litre of the PFS sites that were
tendered from 2007 to respective year (b)
1.97 1.95 1.94
Difference between (a) and (b) ($/L) 0.79 0.82 0.86
Source: Lands Department and Census and Statistics Department
Discount Levels
37. Because there was no detailed discount information provided by the oil
companies, the Council sampled the oil companies’ general discounts on the first
day, middle day and the end day of each month between 2013 and 2015 from
information in the Council’s Oil Price Calculator database, in order to estimate
general discount levels in the market (Table 10). As the extent of different
discount programmes offered by individual oil companies is not known, a simple
average approach was adopted to calculate the overall effect.
Table 10: Discount levels of regular gasoline (after tax) from 2013 to 2015
Types Descriptions 2013 2014 2015
Average pump price after tax $16.80/L $16.75/L $14.81/L
Cash
walk-in discounts, price
discounts (purchasing on or
above certain amount)
6.3%
($1.06/L)
5.7%
($0.95/L)
6.4%
($0.95/L)
Credit
Cards
percentage discounts for
specific card holders, fuel
rebate program
6.5%
($1.09/L)
6.4%
($1.07/L)
7.3%
($1.08/L)
Discount
Cards
extra cash discounts, volume
discounts (refilling on or
above certain amount)
7.5%
($1.26/L)
7.4%
($1.24/L)
7.9%
($1.17/L)
Coupon price discounts (purchasing
on or above certain amount)
8.7%
($1.46/L)
11.1%
($1.86/L)
11.1%
($1.64/L)
15
38. From the Council’s estimations, it can be inferred that consumers generally
enjoyed a 5-7% discount off the pump price after tax when paying with cash or
credit cards; as walk-in consumers. Larger discounts would be offered to them by
using membership discount cards for different oil companies, or using discount
coupons at specific companies. It is noted that the discount levels in terms of
percentage increased, but there was a slightly drop in some discount value. In
other words, unless there were changes in the uptake of different discounts
between 2013 and 2015, no significant impact on the cost of providing a discount
was observed on the price gap.
39. Moreover, it was also observed that the types of discount did not just bring
options, but also created complexity and confusion for consumers. For instance,
those consumers using cash or credit cards to pay for unleaded motor gasoline on
a promotion day for a particular company could enjoy a larger discount than
those using discount cards. In other cases, consumers using discount cards could
be better off than those using credit cards (see illustrative examples in Annex 2).
All in all, consumers are faced with a very complex and difficult environment to
identify the cheapest payment method.
Overall
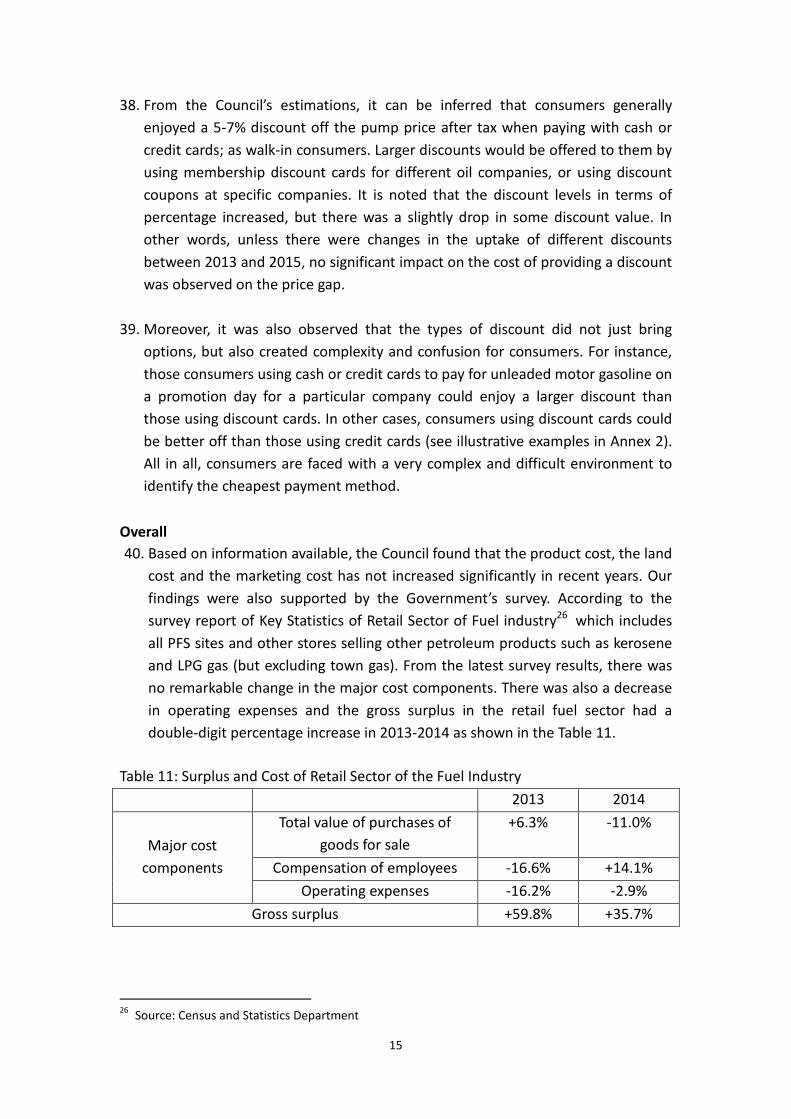
40. Based on information available, the Council found that the product cost, the land
cost and the marketing cost has not increased significantly in recent years. Our
findings were also supported by the Government’s survey. According to the
survey report of Key Statistics of Retail Sector of Fuel industry26 which includes
all PFS sites and other stores selling other petroleum products such as kerosene
and LPG gas (but excluding town gas). From the latest survey results, there was
no remarkable change in the major cost components. There was also a decrease
in operating expenses and the gross surplus in the retail fuel sector had a
double-digit percentage increase in 2013-2014 as shown in the Table 11.
Table 11: Surplus and Cost of Retail Sector of the Fuel Industry
2013 2014
Major cost
components
Total value of purchases of
goods for sale
+6.3% -11.0%
Compensation of employees -16.6% +14.1%
Operating expenses -16.2% -2.9%
Gross surplus +59.8% +35.7%
26
Source: Census and Statistics Department

16
41. Although there is evidence that the changes in cost and sales are favourable to
the oil companies, the unavailability of the actual cost structure cannot enable a
clear conclusion in the change in profitability of the industry. Having said that, the
Council is more concerned that the sign of “No going up, less coming down”
reflects the deterioration of competition in the market place.
MARKET COMPETITION AND PRICING BEHAVIOUR
42. The Council has long been concerned with the pricing practices and the
competitive environment of the auto-fuel market and its implications for local
consumers. In 1999, the Council conducted a study into (amongst other fuel
markets) the auto-fuel market and made policy recommendations specifically to
encourage entry by new retail operators, induce price competition and improve
government oversight.
43. In response to the Council’s study, the Government has since 1999 taken a series
of measures to facilitate new market entrants including: (a) removing the
requirement for bidders of PFS sites to hold an import licence and supply contract;
(b) re-tendering all existing PFS sites upon expiry of their leases, instead of
renewing the leases to the existing operators; and (c) depending on the land
supply situation, tendering PFS sites in batches consisting of 2 to 5 sites per batch
so as to facilitate new entrants in acquiring a critical mass of PFS to achieve
economies of scale in order to provide effective competition.
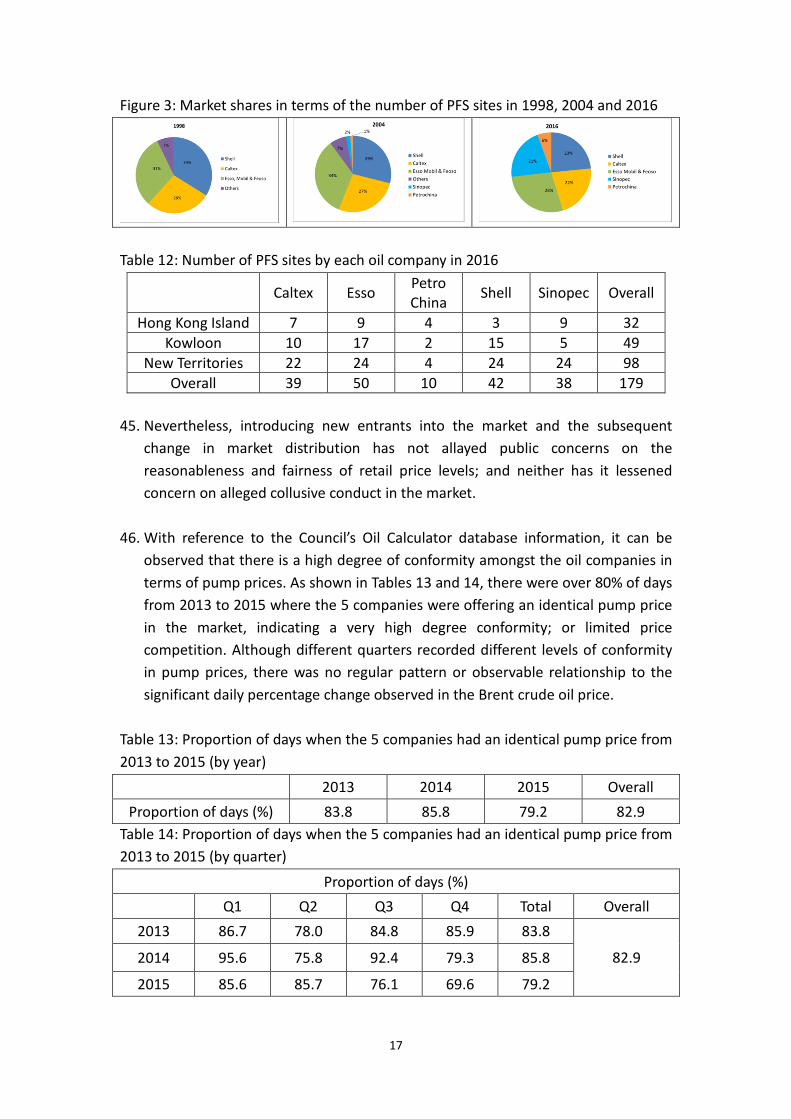
44. Since June 2003, PetroChina and Sinopec have entered the market resulting in
the market shares (in terms of the number of PFS sites) of the other three
incumbent operators being reduced from 93% in 1998 to 73% in 2016 (see Figure
3). Up to the first quarter of 2016, there were 179 PFS sites and no single
operator occupied a substantial market share in any of the main districts (see
Table 12).
17
Figure 3: Market shares in terms of the number of PFS sites in 1998, 2004 and 2016
Table 12: Number of PFS sites by each oil company in 2016
Caltex Esso
Petro
China Shell Sinopec Overall
Hong Kong Island 7 9 4 3 9 32
Kowloon 10 17 2 15 5 49
New Territories 22 24 4 24 24 98
Overall 39 50 10 42 38 179
45. Nevertheless, introducing new entrants into the market and the subsequent
change in market distribution has not allayed public concerns on the
reasonableness and fairness of retail price levels; and neither has it lessened
concern on alleged collusive conduct in the market.
46. With reference to the Council’s Oil Calculator database information, it can be
observed that there is a high degree of conformity amongst the oil companies in
terms of pump prices. As shown in Tables 13 and 14, there were over 80% of days
from 2013 to 2015 where the 5 companies were offering an identical pump price
in the market, indicating a very high degree conformity; or limited price
competition. Although different quarters recorded different levels of conformity
in pump prices, there was no regular pattern or observable relationship to the
significant daily percentage change observed in the Brent crude oil price.
Table 13: Proportion of days when the 5 companies had an identical pump price from
2013 to 2015 (by year)
2013 2014 2015 Overall
Proportion of days (%) 83.8 85.8 79.2 82.9
Table 14: Proportion of days when the 5 companies had an identical pump price from
2013 to 2015 (by quarter)
Proportion of days (%)
Q1 Q2 Q3 Q4 Total Overall
2013 86.7 78.0 84.8 85.9 83.8
82.9 2014 95.6 75.8 92.4 79.3 85.8
2015 85.6 85.7 76.1 69.6 79.2
18
CONCLUSION
47. Despite a continuous downward trend in crude oil prices (with an upward trend
starting in 2016), there are signs that the practice of “no going up, less coming
down” remains, even though there was no sign of “quick going up, slow coming
down”. The increasing price gap between product cost and pump price in recent
years, together with no observable changes in major costs like land cost and
discount cost (based on the Council’s own estimation), might also suggest that
any surplus has been transferred to the oil companies as an increase in profit.
48. Despite the fact that new entrants have entered the market since mid-2000,
there is still a high level conformity of pump prices and no observable change or
difference in the discounts offered (in terms of discount value). Though
multitudinous discount types are offered, they are complicated and confuse the
choices available to consumers at the time of purchase. A direct reduction of the
pump price would be more straightforward, simple and beneficial to consumers.
49. Enhancing transparency in market information would allow greater public
scrutiny of auto-fuel price fluctuations and the ultimate impact on consumers.
The Council suggests that oil companies should consider that if their pricing
actions do in fact reflect competition and their margins are not excessive, then
they should have the strength to increase transparency by disclosing more cost
and sales information. In this way, a comprehensive market analysis could then
be conducted to allay public concerns on the oil companies’ pricing tactics, and
that ultimately this would be in their interests.
50. As a matter of course, the Council could devise a mechanism, in conjunction with
the oil companies, to receive that information in confidence, and make it public
in a manner that would preserve commercial confidentiality, but still retain
credibility as a true measure of the cost pressures they face. The overriding
principle that the Council stresses is that while the oil companies remain secret in
respect of that information, then suspicion about their behavior, due to a high
degree of retail price conformity, will always persist.
51. On the other hand, as remarked by the Census & Statistics Department about the
exceptionally high import price in December 2014 and January 2015, the Council
believes that there are rooms for improvement in the declaration procedures and
consolidation of the oil figures, as well as the frequency of reporting of these
figures to enhance the information transparency in the market.
19
52. As the Council’s findings could also relate the competition environment of the
auto-fuel market and noted that the Competition Commission (the Commission)
is looking into the state of competition in the market. The Council is looking
forward to the report of the Commission and wishes more findings and
recommendations been in place to further enhance the competition in the
market.

20
Annex 1: Price Movement Monitoring by Environment Bureau
1. In the interests of improving transparency of prices of auto-fuel products, the
Government posts onto its website, on a weekly basis, the movements in local
import prices and retail prices of auto-fuel in comparison with movements in
FOB prices of Singapore unleaded petrol and motor vehicle diesel. It is the
Government’s objective in publishing the data to better inform the public of the
market trend of auto-fuel prices.
2. The local ex-duty retail prices (in the figures below) are pump prices net of duty
but before taking into account any discounts. Oil companies are offering various
types of discounts to consumers (including walk-in discounts, credit card
discounts or oil company membership card discounts etc.). The Government
commissioned the Consumer Council to post onto its website, starting from
November 2008, and on a weekly basis, the local auto-fuel retail prices,
including net prices after walk-in discounts and information on various types of
cash and non-cash retail discounts and promotional offers by oil companies; and
to launch the "Oil Price Calculator" in February 2009 (and its mobile phone
version website and smart phone application in April 2009 and July 2012
respectively for drivers' easy reference), so as to enhance price competition
among oil companies and to help consumers make their own choices among the
various kinds of discounts and benefits available.
3. As auto-fuels sold locally are all imported, mainly from refineries in the Asia
Pacific Region, the import prices for local auto-fuels are closely correlated with
commodity prices in the Asia Pacific fuel market. The Mean of Platts Singapore
(MOPS) is the generally accepted benchmark for Asia Pacific FOB fuel prices.
4. The import prices that are compiled are based on information given in trade
declarations, which importers are required by the Import and Export
(Registration) Regulations to lodge with the Customs and Excise Department.
Declarations received by the Customs and Excise Department are then
forwarded to the Census and Statistics Department for compilation of trade
statistics. All declarations, which are processed in compiling trade statistics, are
checked against cargo manifests supplied by carriers to ensure that there are no
omissions or duplications.
5. Importers are, by law, allowed 14 days to lodge declarations with the
Government. The Census and Statistics Department verifies and processes the
information and releases import price statistics for a given month with a time

21
lag of around four weeks. The respective import price statistics and charts are
available from the website of the Legislative Council - Panel on Economic
Development.
6. The chart below (extracted from the Environment Bureau’s website) showing
the trend of price movements for unleaded petrol, indicates the following:

22
Annex 2: Examples of the multitudinous types of discount
Example 1 (Company X):
Scenario Usual days Days with ad-hoc walk-in
promotion
Payment method Discount card Cash Discount card Cash
Discount ($/L) 1.2 0.9 1.2 2.0
Cheaper payment
method
Discount card Cash
Example 2 (Company Y):
Scenario Pump price = $16.25/L Pump price = $13.75/L
Payment method Discount card
($1.2/L
discount)
Credit card
(8% discount)
Discount card
($1.2/L
discount)
Credit card
(8% discount)
Discount value 1.2 1.3 1.2 1.1
Cheaper payment
method
Credit card Discount card