REPORT OF WASTE DISCHARGE - California State Water ... · PDF fileREPORT OF WASTE DISCHARGE...
56
Prepared for CG Roxane, LLC 1210 South Highway 395 Olancha, California 93549 REPORT OF WASTE DISCHARGE Olancha Spring Water Bottling Facility 1210 South U.S. Highway 395 Olancha, California Prepared by 924 Anacapa Street, Suite 4A Santa Barbara, California 93105 21 October 2015
Transcript of REPORT OF WASTE DISCHARGE - California State Water ... · PDF fileREPORT OF WASTE DISCHARGE...
Prepared for
CG Roxane, LLC 1210 South Highway 395
Olancha, California 93549
REPORT OF WASTE DISCHARGE
Olancha Spring Water Bottling Facility 1210 South U.S. Highway 395
Olancha, California
Prepared by
924 Anacapa Street, Suite 4A Santa Barbara, California 93105
21 October 2015
REPORT OF WASTE DISCHARGE
Olancha Spring Water Bottling Facility
1210 South U.S. Highway 395
Olancha, California
Prepared for
Crystal Geyser Roxane
21 October 2015
Ryan Smith, P.G., C.Hg. Geosyntec Consultants Project Geologist
ii 10/15/2015
TABLE OF CONTENTS
1.0 INTRODUCTION............................................................................................... 1
2.0 GENERAL SITE INFORMATION .................................................................. 3
3.0 WASTE STREAMS, WASTE WATER PROCESS, AND DISCHARGE DESCRIPTION ............................................................................................................... 4
3.1 Domestic / Industrial Water Circuit .......................................................... 5 3.2 Domestic Water Use ................................................................................. 5 3.3 Industrial Cooling Towers. ....................................................................... 6 3.4 Production Water Circuits......................................................................... 6 3.5 Miscellaneous Solutions. .......................................................................... 9
4.0 SITE GEOLOGY AND HYDROGEOLOGY................................................ 11 4.1 Regional Geology ................................................................................... 11 4.2 Site Geohydrology .................................................................................. 11
5.0 SUMMARY OF PREVIOUS GROUNDWATER INVESTIGATIONS ..... 13
6.0 DESCRIPTION OF GROUNDWATER, WASTE WATER, AND POND WATER QUALITY ...................................................................................................... 15
6.1 Upgradient Groundwater Quality ........................................................... 15 6.2 Groundwater Quality Downgradient of East Pond ................................. 16 6.3 Groundwater Quality Downgradient of Fire Pond.................................. 16 6.4 North Bottling Plant Waste Water and East Pond Water Quality .......... 17 6.5 South Bottling Plant Waste Water and Fire Pond Water Quality ........... 18
7.0 POTENTIAL IMPACTS TO GROUNDWATER QUALITY ..................... 19
8.0 REFERENCES .................................................................................................. 20

iii 10/15/2015
LIST OF TABLES
Table 1: Groundwater Levels and Well Construction Data
Table 2: Groundwater Sample Results – Detected Metals
Table 3: Groundwater Sample Results – Detected Inorganic Constituents
Table 4: Groundwater Sample Results – Total and Fecal Coliform
Table 5: Waste Water Sample Results – Detected Metals
Table 6: Waste Water Sample Results – Detected Inorganic Constituents
Table 7: Waste Water Sample Results – Total Coliform Bacteria
Table 8: Waste Water Sample Results – Detected Volatile Organic Compounds
LIST OF FIGURES
Figure 1: Site Location Map
Figure 2: Groundwater Monitoring Well
Figure 3: 3QGWM (September 14-15, 2015) Groundwater Elevations and Gradient
APPENDICES
APPENDIX A: Table of Waste Water Flow Estimates
APPENDIX B: Process Flow Diagrams
APPENDIX C: Scaled Plot Plans
ROWD Report_21102015 1 10/21/2015
1.0 INTRODUCTION
Geosyntec Consultants, Inc. (Geosyntec), on behalf of Crystal Geyser Roxane (CGR), is pleased to present the following Report of Waste Discharge (ROWD) for the CGR Spring Water Bottling Facility (Site) located at 1210 South U.S. Highway 395, near Olancha, California.
The ROWD was prepared to address the requirements of the Lahontan Regional Water Quality Control Board (RWQCB) Notice of Violation (NOV) memo dated April 30, 2015. The NOV was issued for unauthorized discharge of industrial waste water at the Site. This ROWD meets the requirements in Water Code sections 13160 and 13260, which requires a complete ROWD for discharges of waste that could affect the quality of the waters of the state. This ROWD fully describes and characterizes the discharge as required in the April 30, 2015 letter and provides the following information and items to meet the requirements:
• Environmental documents, technical reports, plans, diagrams, maps, mitigation and monitoring proposals, and other documents that characterize the discharge and its impacts upon receiving waters (surface water and groundwater).
• State Water Resources Control Board (State Water Board) Form 200 - Application
for Report of Waste Discharge.
• Complete characterization of all waste streams generated at the Facility, including discharge rates/volumes.
• A narrative description of each facility process that generates a waste stream. The
narrative must also identify all products added during each facility process and the purpose of each product, as it relates to the facility process being described.
• System (flow) diagrams illustrating facility processes that generate waste streams. The system diagrams must identify products added during facility processes, and where in the process they are added.
• Scaled plans illustrating the Facility's waste stream collection, waste treatment (e.g., pH adjustment), storage, and conveyance systems including all waste treatment locations. The scaled plans identify system materials and include plan details/typicals (plan and cross-sectional views) of collection (e.g., drains, floor trenches), waste treatment, storage, and conveyance systems.
• Scaled plans (plan and cross-sectional views) illustrating all Facility waste
disposal facilities.
ROWD Report_21102015 2 10/21/2015
• A description and analysis (constituents) of background groundwater quality (up-gradient of the Facility) with the supporting data and information. The analysis identifies the monitoring and/or supply wells from which data was obtained for the analysis, the well construction details for the wells used in the analysis, and groundwater elevation data. A scaled site map showing the locations of the wells used in the analysis is provided.
• A description and analysis of the Facility's impacts upon groundwater quality with the supporting data and information. The analysis identifies the monitoring and/or supply wells from which data was obtained for the analysis, the well construction details for the wells used in the analysis, and groundwater elevation data. In addition, a scaled site map showing the locations of the wells used in the analysis is provided.
Additionally, CGR is concurrently submitting an Industrial General Stormwater Permit to bring the Site into compliance with the RWQCB stormwater permitting regulations. CGR intends to co-mingle stormwater runoff with the industrial wastewater discharges covered in this ROWD. The proposed discharge location for stormwater from the impervious areas of the Site will be at the unlined infiltration pond that currently receives industrial waste water. Additional description of the proposed stormwater discharge and permitting program will be provided under separate stormwater permit application.
ROWD Report_21102015 3 10/21/2015
2.0 GENERAL SITE INFORMATION
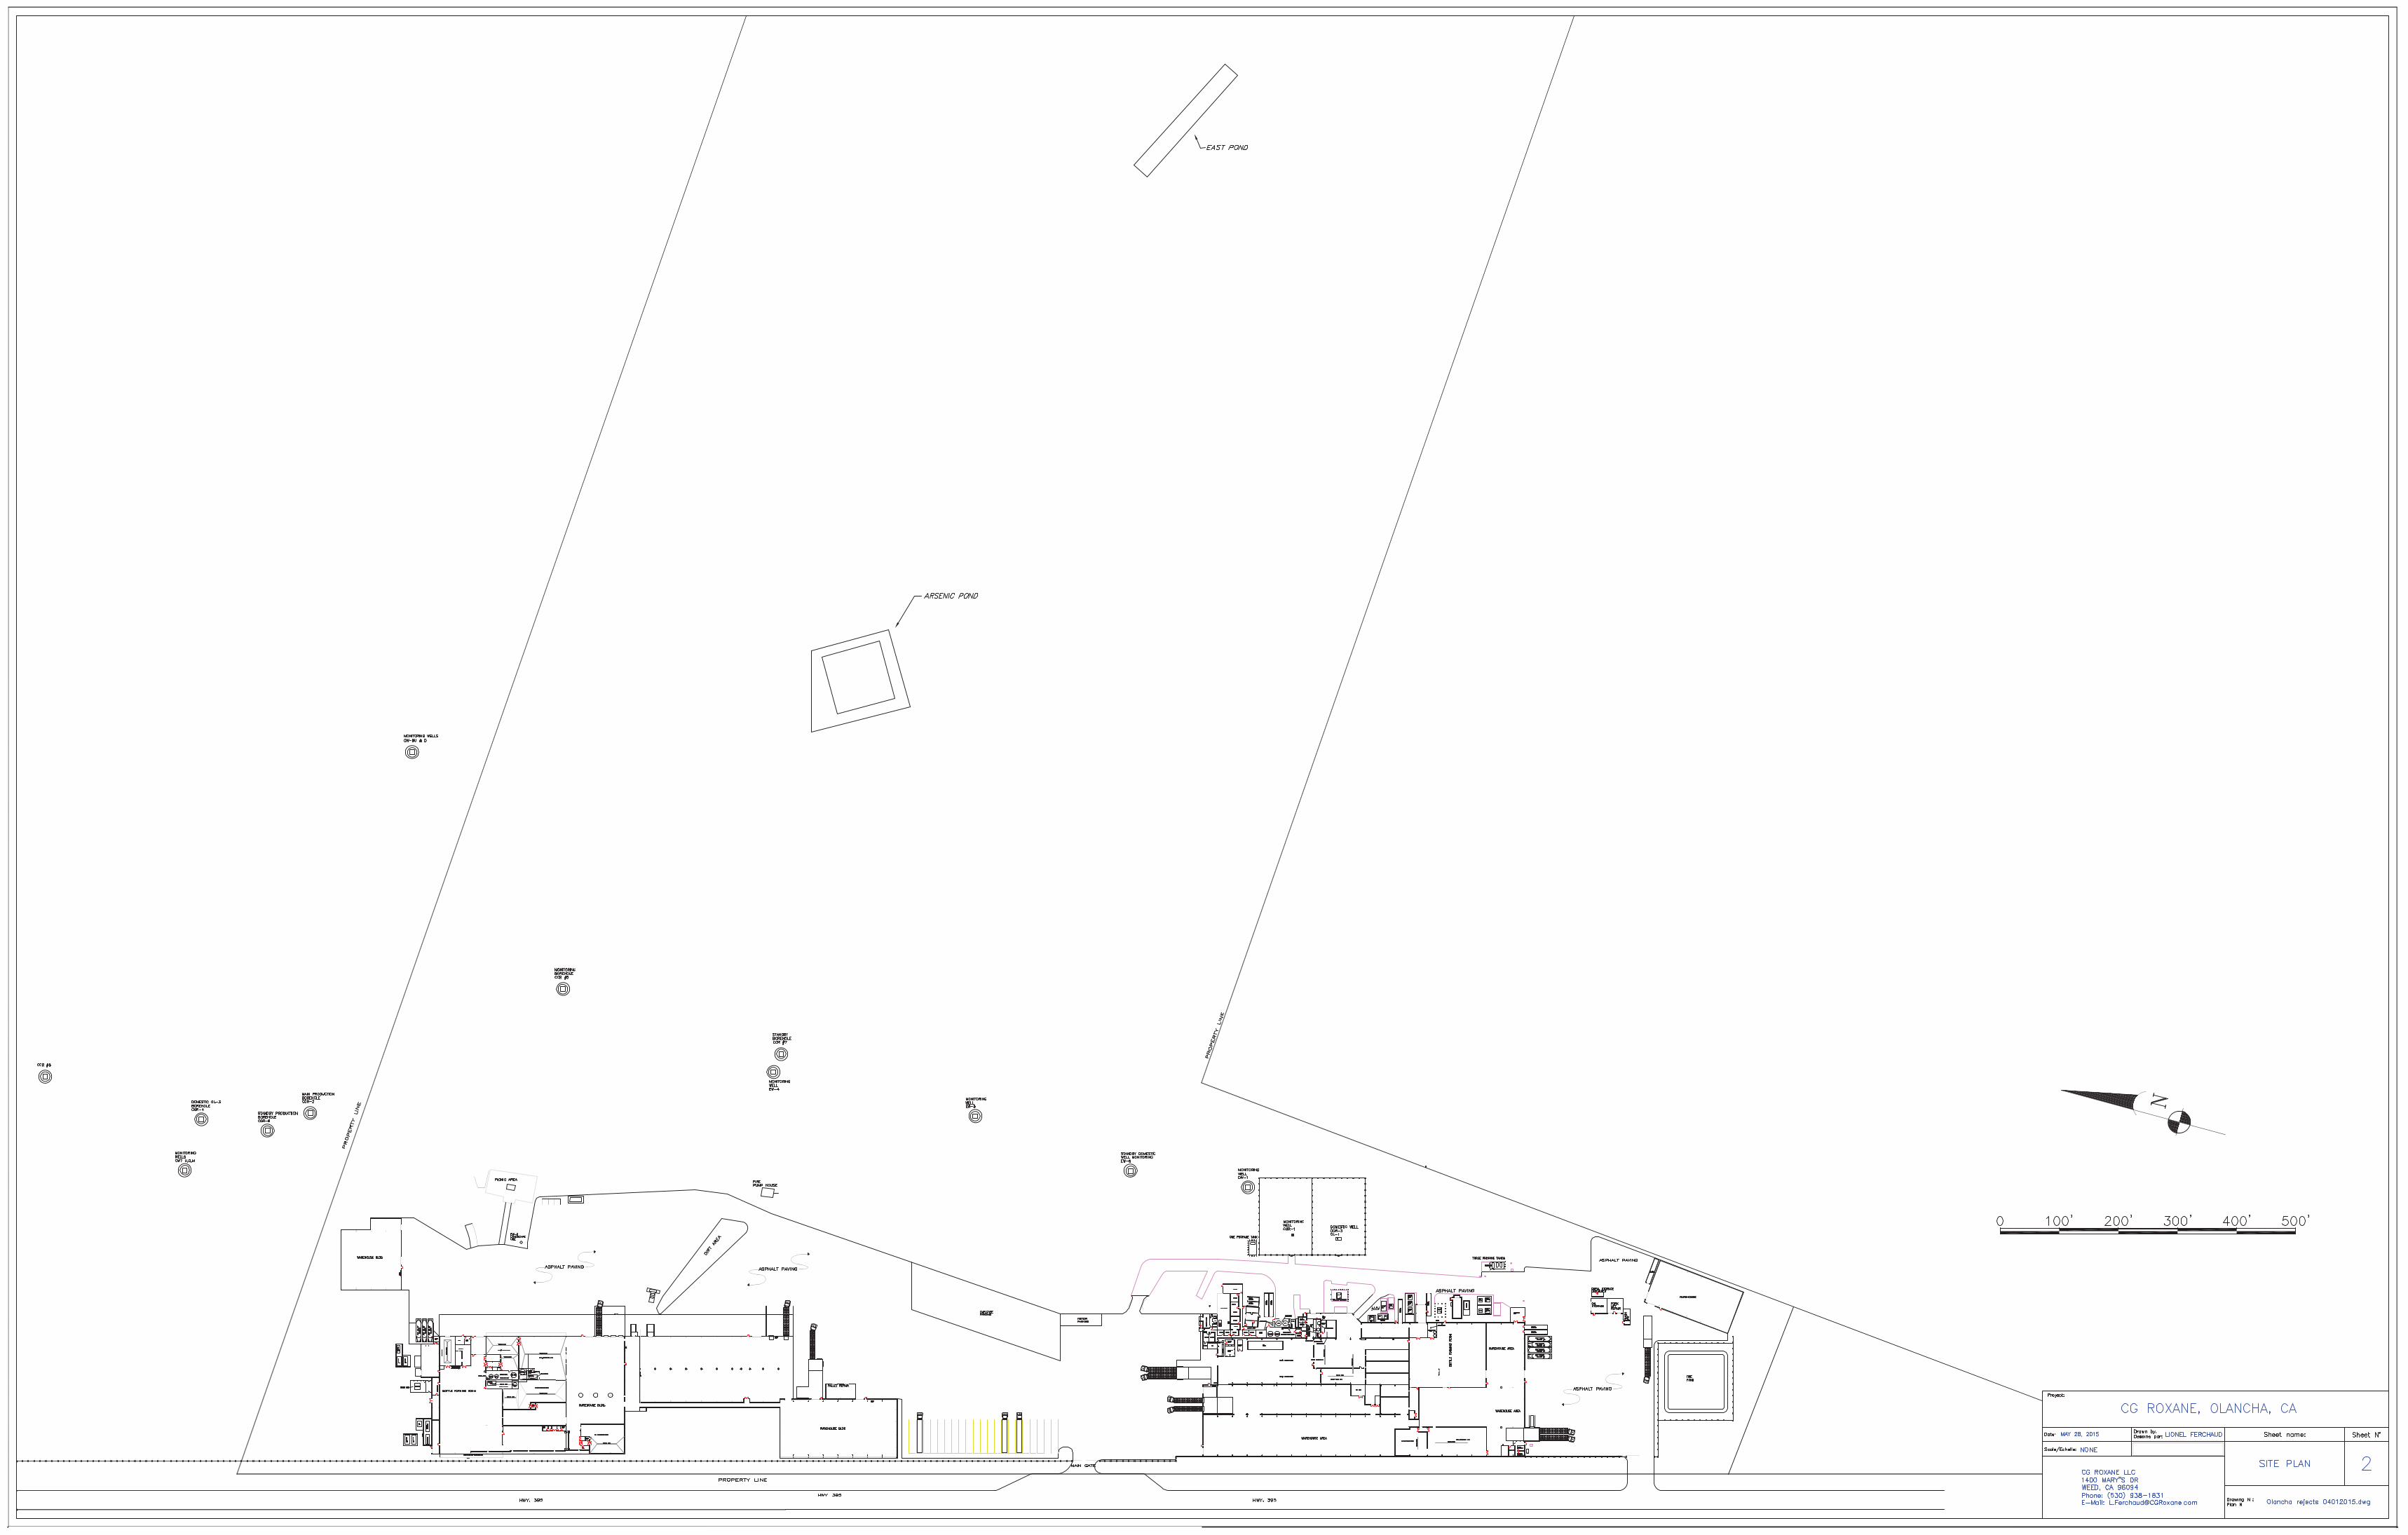
The CGR Site is an irregularly-shaped property that consists of approximately 170 acres adjacent to Highway 395 and located approximately 3 miles north of Olancha, California (Figure 1). Regionally, the Site is located in the southern portion of the Owens Valley. Owens Lake (dry lake bed) is located approximately ½ mile east of the Site, and the base of the Sierra Nevada Mountains is located 1 mile west of the Site. Highway 395, which runs north-south, crosses the western portion of the Site (Figure 1). The Los Angeles Aqueduct is located approximately ½-mile west and upgradient of the Site.
The CGR Site is an active spring water bottling plant. The facility consists of two large bottling-production and warehouse buildings, CGR North and CGR South, that contains a total of six main bottling production lines. On-Site groundwater production wells are the source of spring water for bottling, and are used for domestic and industrial purposes in the plant.
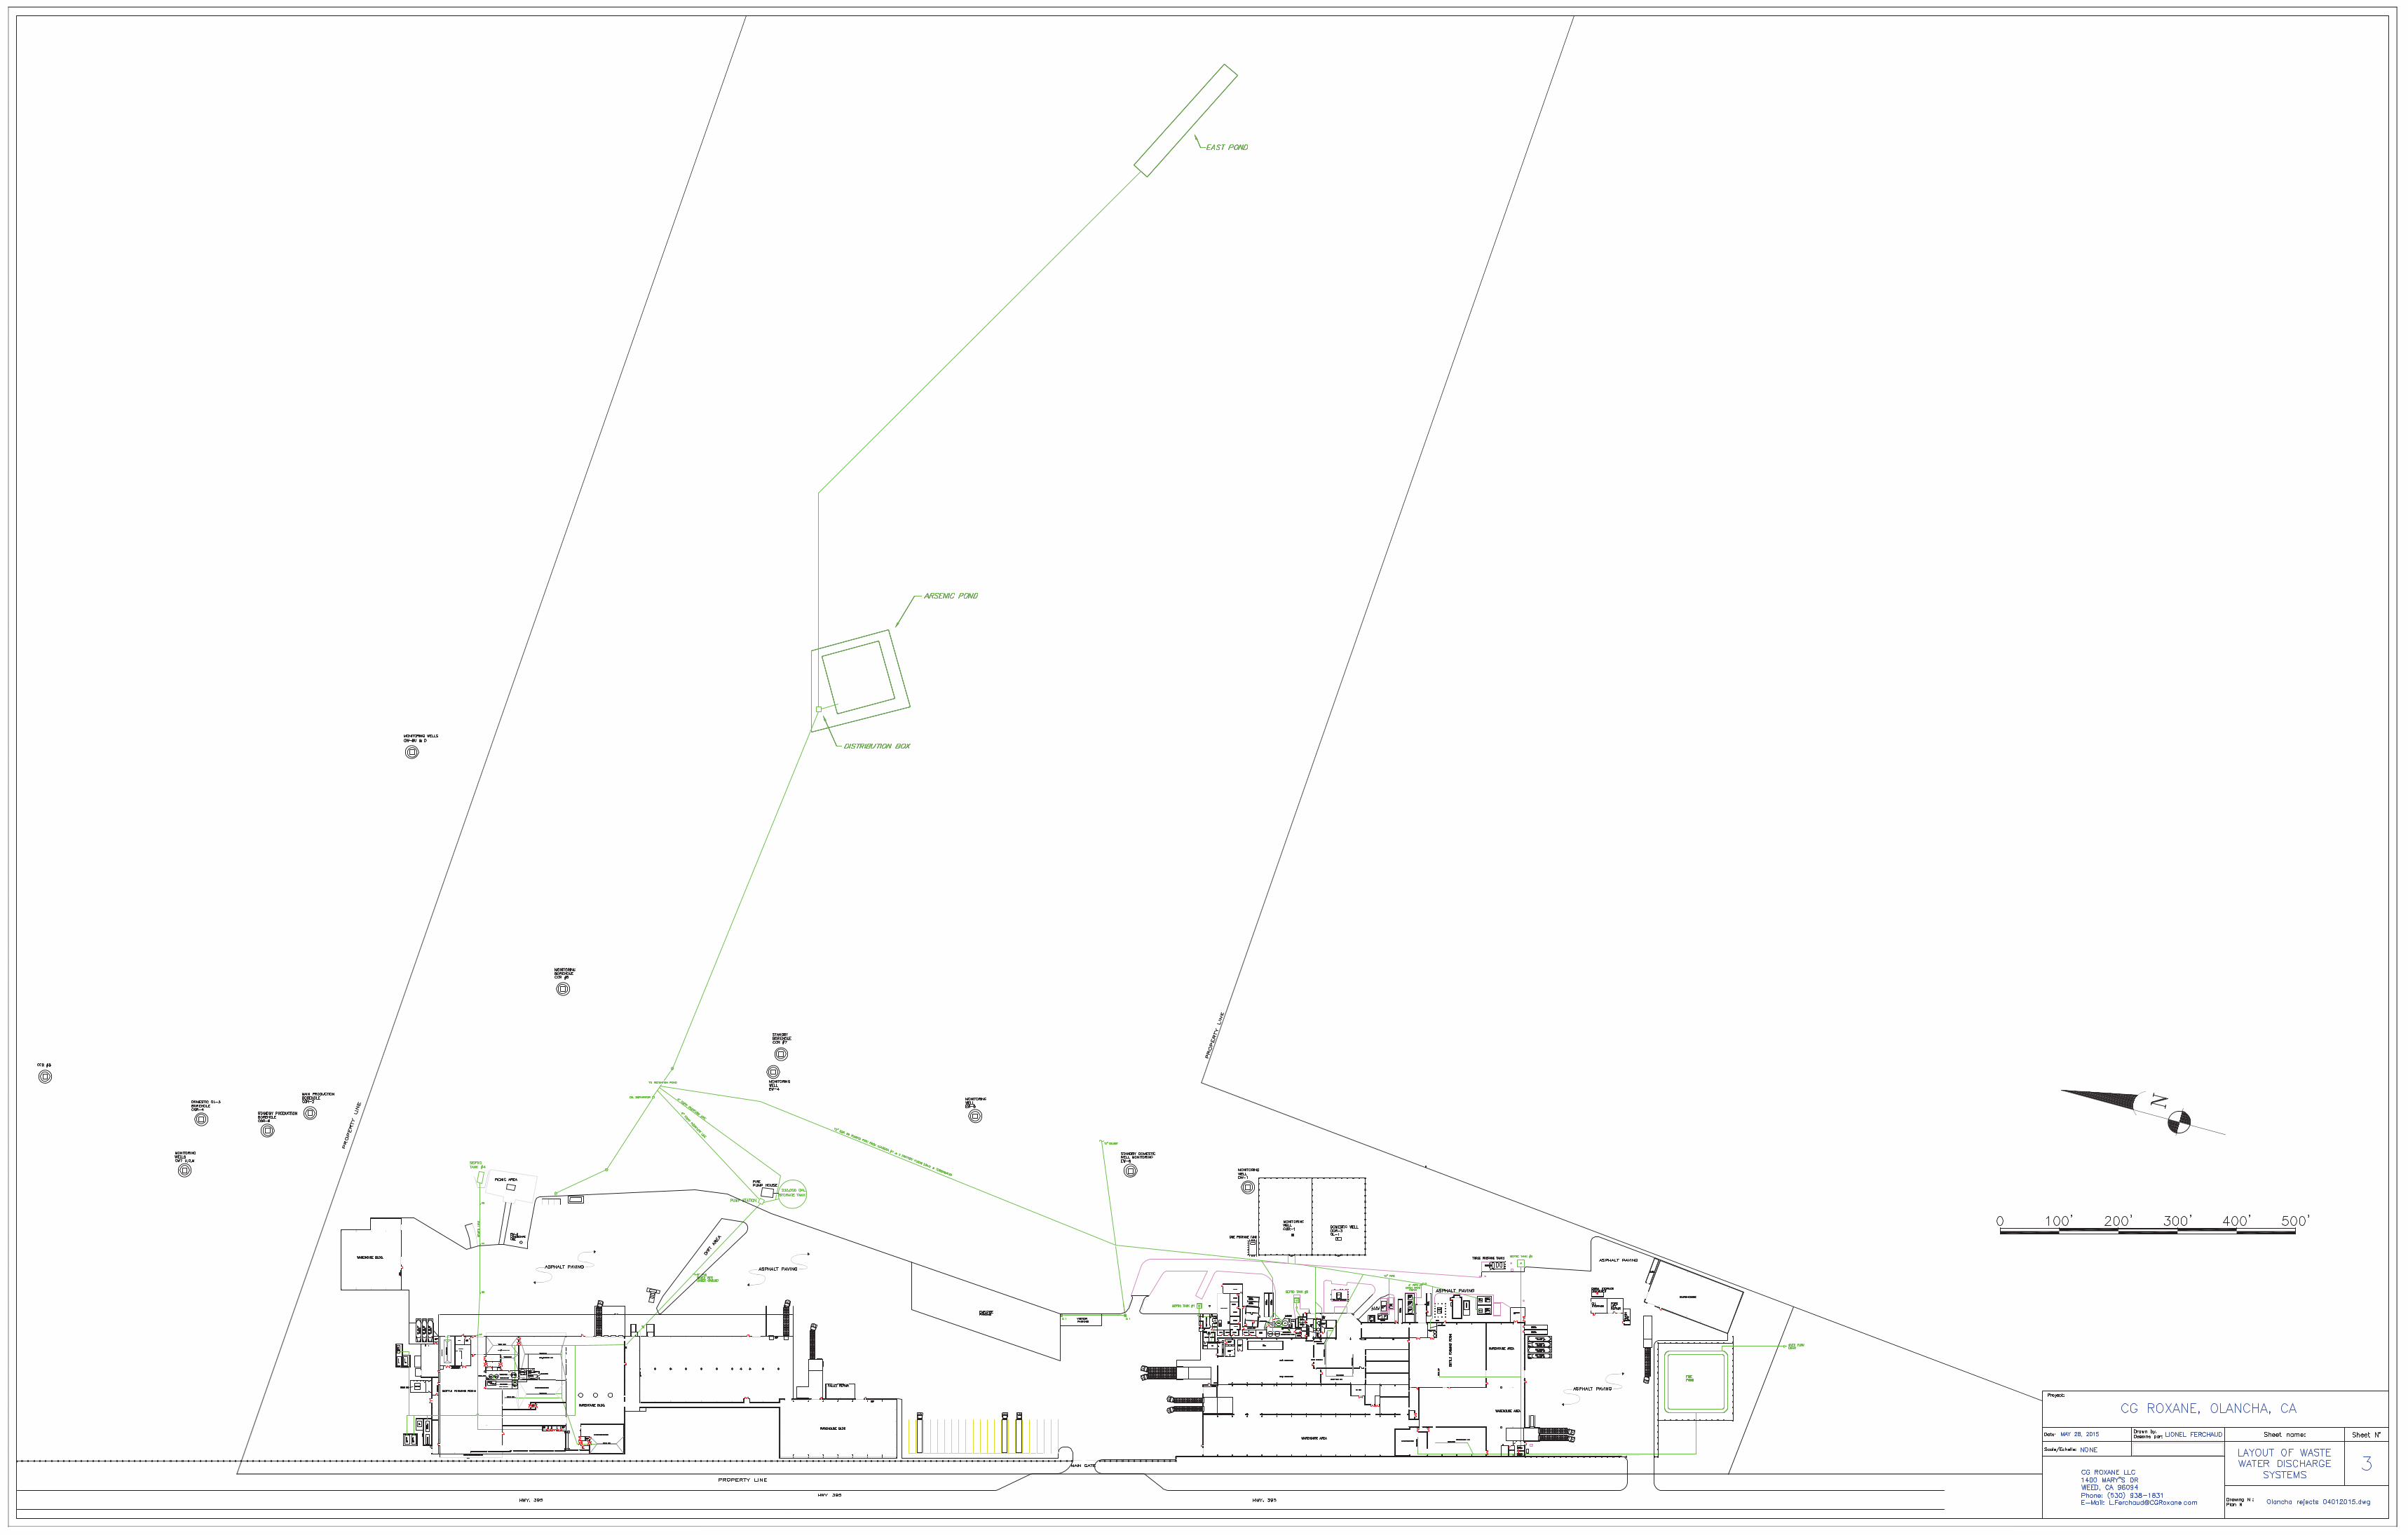
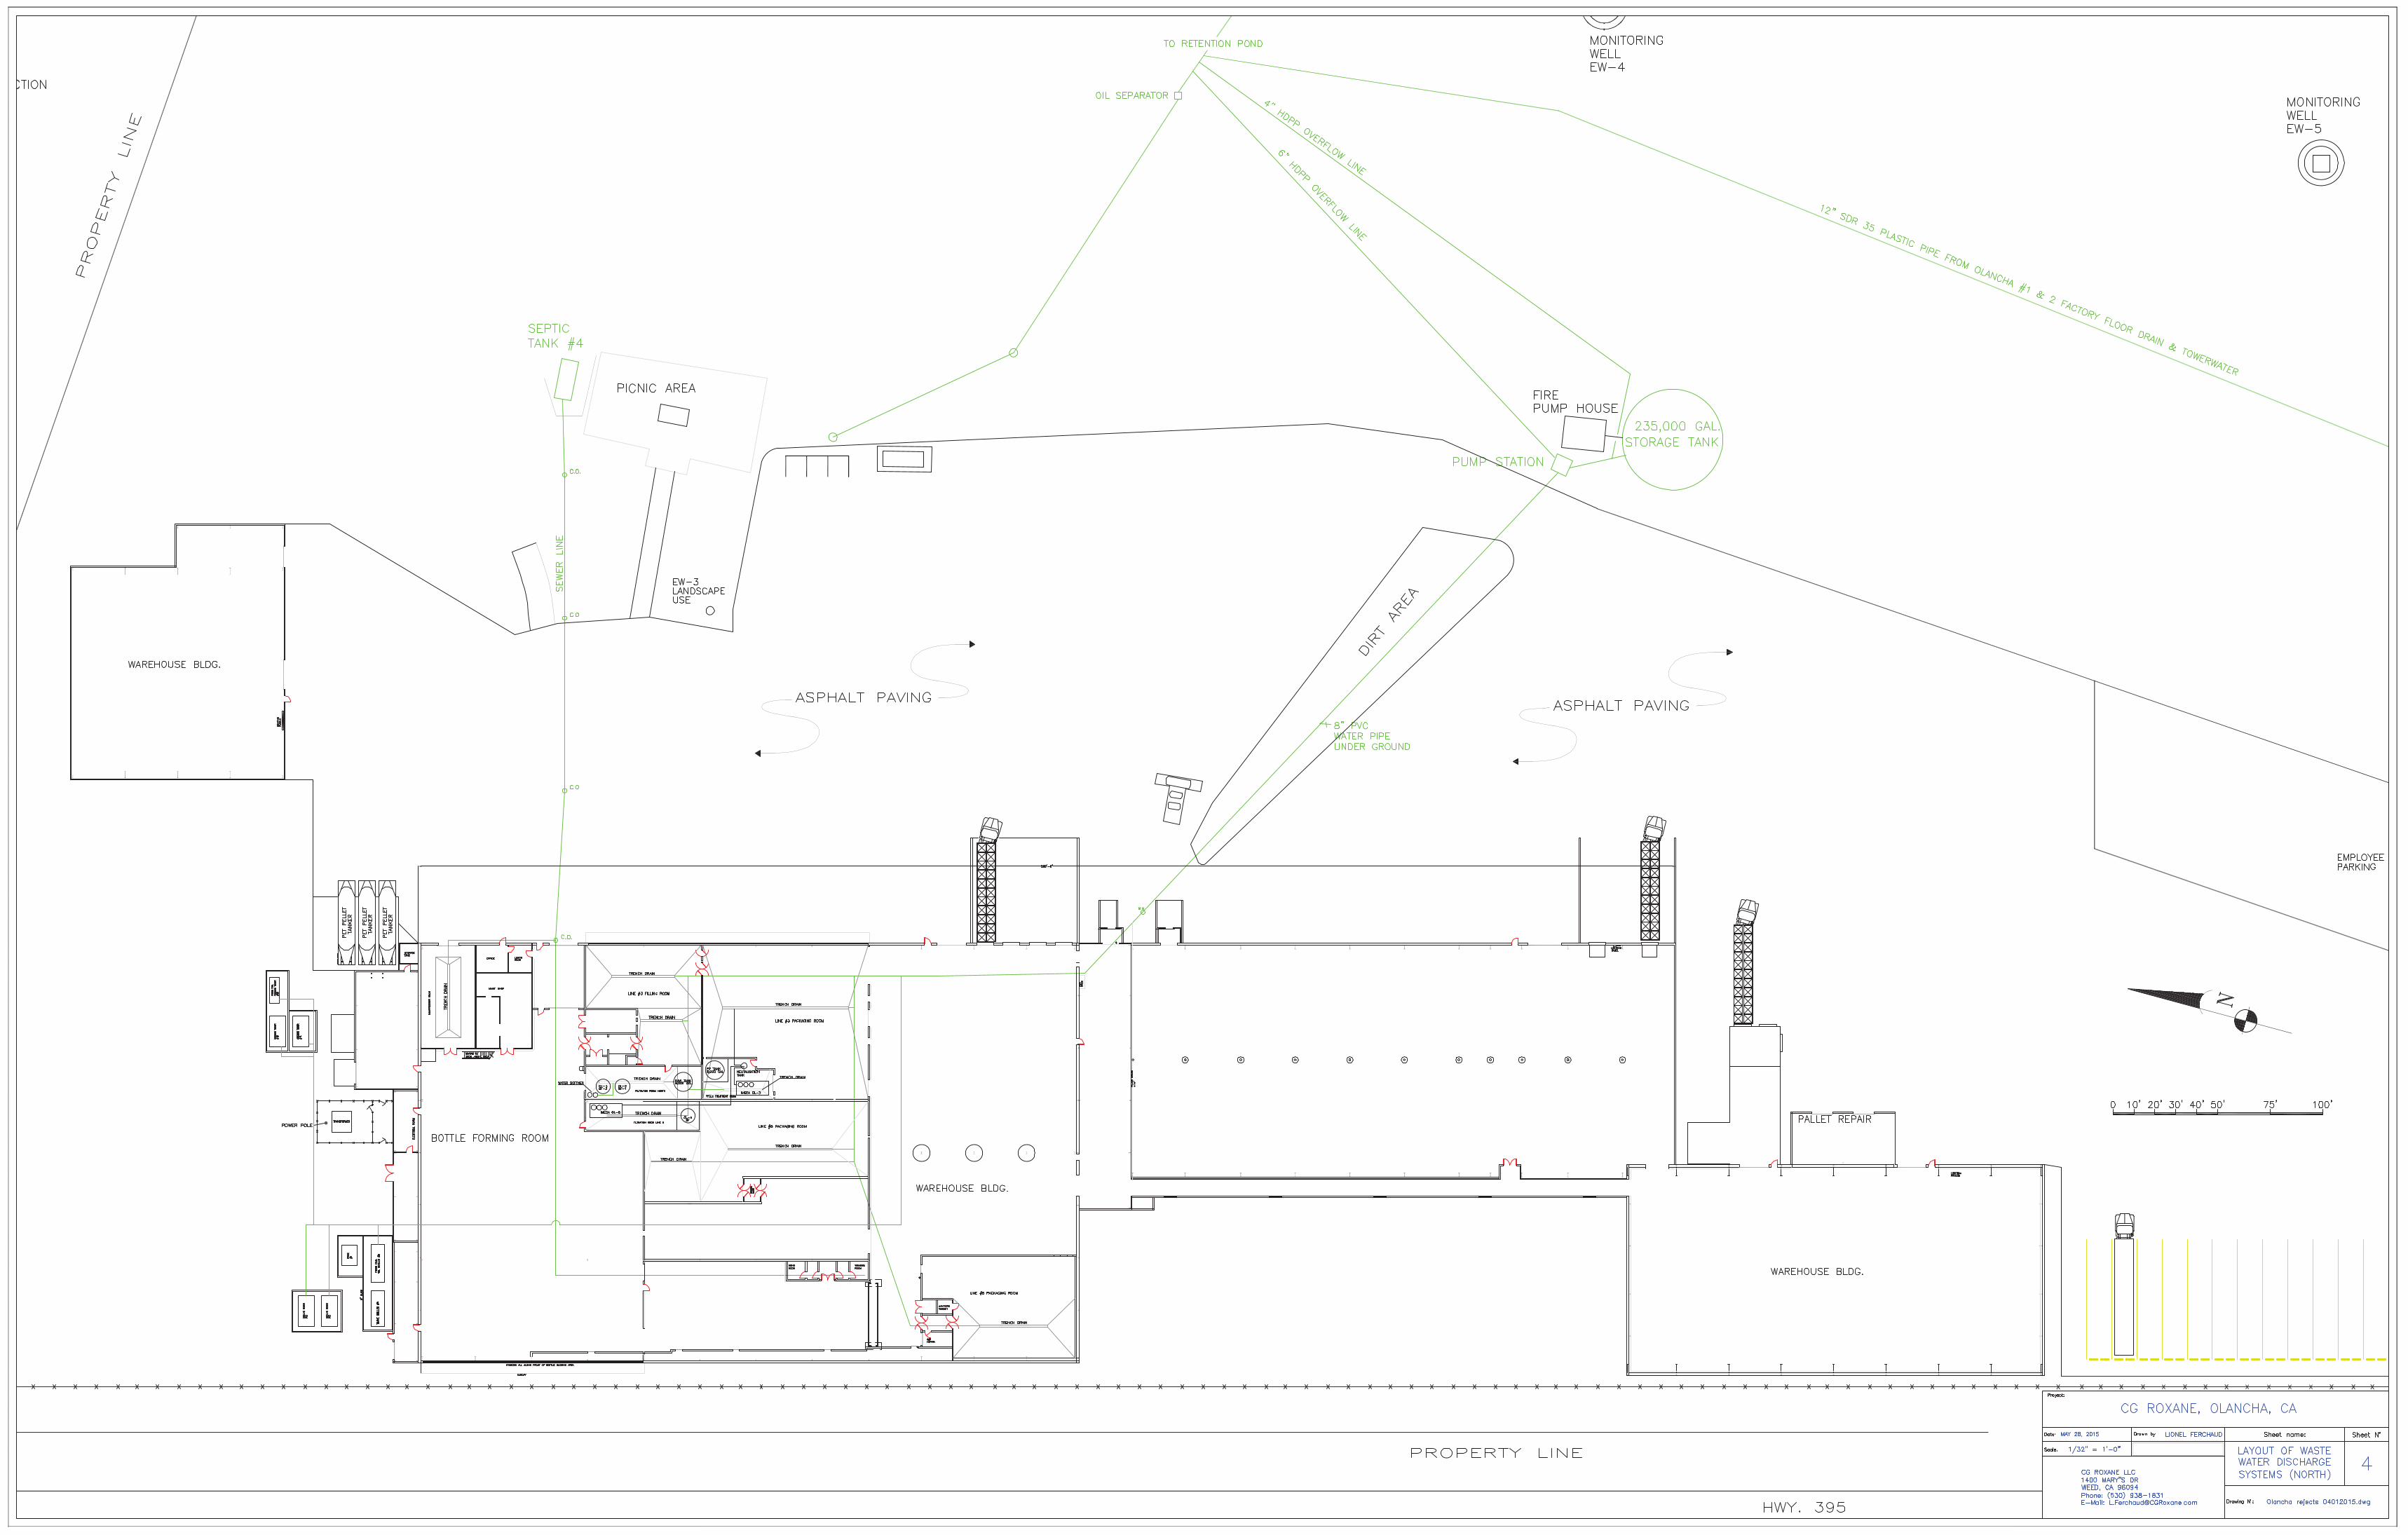
Waste water associated with bottle filling and sanitation is generated during spring water bottling activities and has been discharged to land in two areas. CGR North waste water is discharged to East Pond (EP) and CGR South waste water is discharged to Fire Pond (FP). The EP is an unlined infiltration pond, while the FP is a concrete lined pond which discharges to land via an overflow outlet pipe. Additional discussion of the waste water processes and discharge is provided in Section 3.
A third pond, the Arsenic Pond (AP) was previously used for waste water generated from backwashing of in-line arsenic filters. However the AP has been removed and the waste water generated from this process has been modified by CGR so that it is completely contained in a closed loop. The waste water from this process is reportedly removed and disposed of off-Site (see Section 3 for additional details). Therefore waste water from this process is reportedly no longer discharged to any surface impoundment or to land surface.
ROWD Report_21102015 4 10/21/2015
3.0 WASTE STREAMS, WASTE WATER PROCESS, AND DISCHARGE DESCRIPTION
The following section describes the waste water streams, waste water processes and waste water discharge locations for each of these processes1. A detailed description of these waste water streams and processes that generate the waste water was also provided in the Facility Waste Generation and Discharge Systems Report, dated October 16, 2014 (CGR, 2014). This report was produced by CGR in general accordance with the RWQCB’s investigation requirements for the Site. A summary of the daily waste water flow rate estimates were included in this report and are included as Appendix A. Additionally, process flow diagrams are provided in Appendix B.
The Facility is comprised of two distinct bottling-production and warehousing areas (i.e., “Olancha North” and “Olancha South”) which run in north-south direction along Highway 395. Olancha North and Olancha South each contain three Production Water lines (i.e., #3, #5, #6 and #1, #2, #4, respectively). Olancha North and Olancha South also utilize separate water supply systems for its domestic supply and industrial supply that are both used apart from the Production Water.
Olancha North and Olancha South each generate discharges from both a domestic / industrial water circuit and a production water circuit. These separate circuits are described in more detail below. This section contains a narrative of the processes that generate wastewater, concentrations and volumes of waste streams, and destination of those waste streams.
CGR installed a sand filter process within the Facility to remove naturally occurring arsenic within the groundwater. As more particularly described below, the various sand filter units are periodically (approximately every three to four months) regenerated through an arsenic desorption process and the wastewater was previously discharged to a lined surface impoundment (“Arsenic Pond”). As a result the RWCQB and Department of Toxic Substances Control (DTSC) have initiated investigations into CGR’s discharge practices. CGR has ceased further discharges to the Arsenic Pond. Instead, hazardous waste water from the regeneration process is hauled off-site to waste facilities under appropriate waste manifest documentation.
The Site handles and stores various solutions and chemicals which are used in its disinfection, sanitization and filter regeneration processes, including those deemed “hazardous materials” such as caustic soda, sulfuric acid, and phosphoric acid. The Site is authorized and permitted as a Certified Unified Program Agency / Hazardous Materials (CUPA) Facility by the Inyo County Environmental Health Services. As required by state
1 Section 3 is based on the Facility Waste Generation and Discharge Systems Report, dated October 16, 2014, generated by CGR. All discussion of waste water discharge processes are reported based on information supplied by CGR.
ROWD Report_21102015 5 10/21/2015
law, the Facility routinely updates and submits a Hazardous Materials Business Plan and Hazardous Materials Inventory to remain CUPA compliant.
3.1 Domestic / Industrial Water Circuit
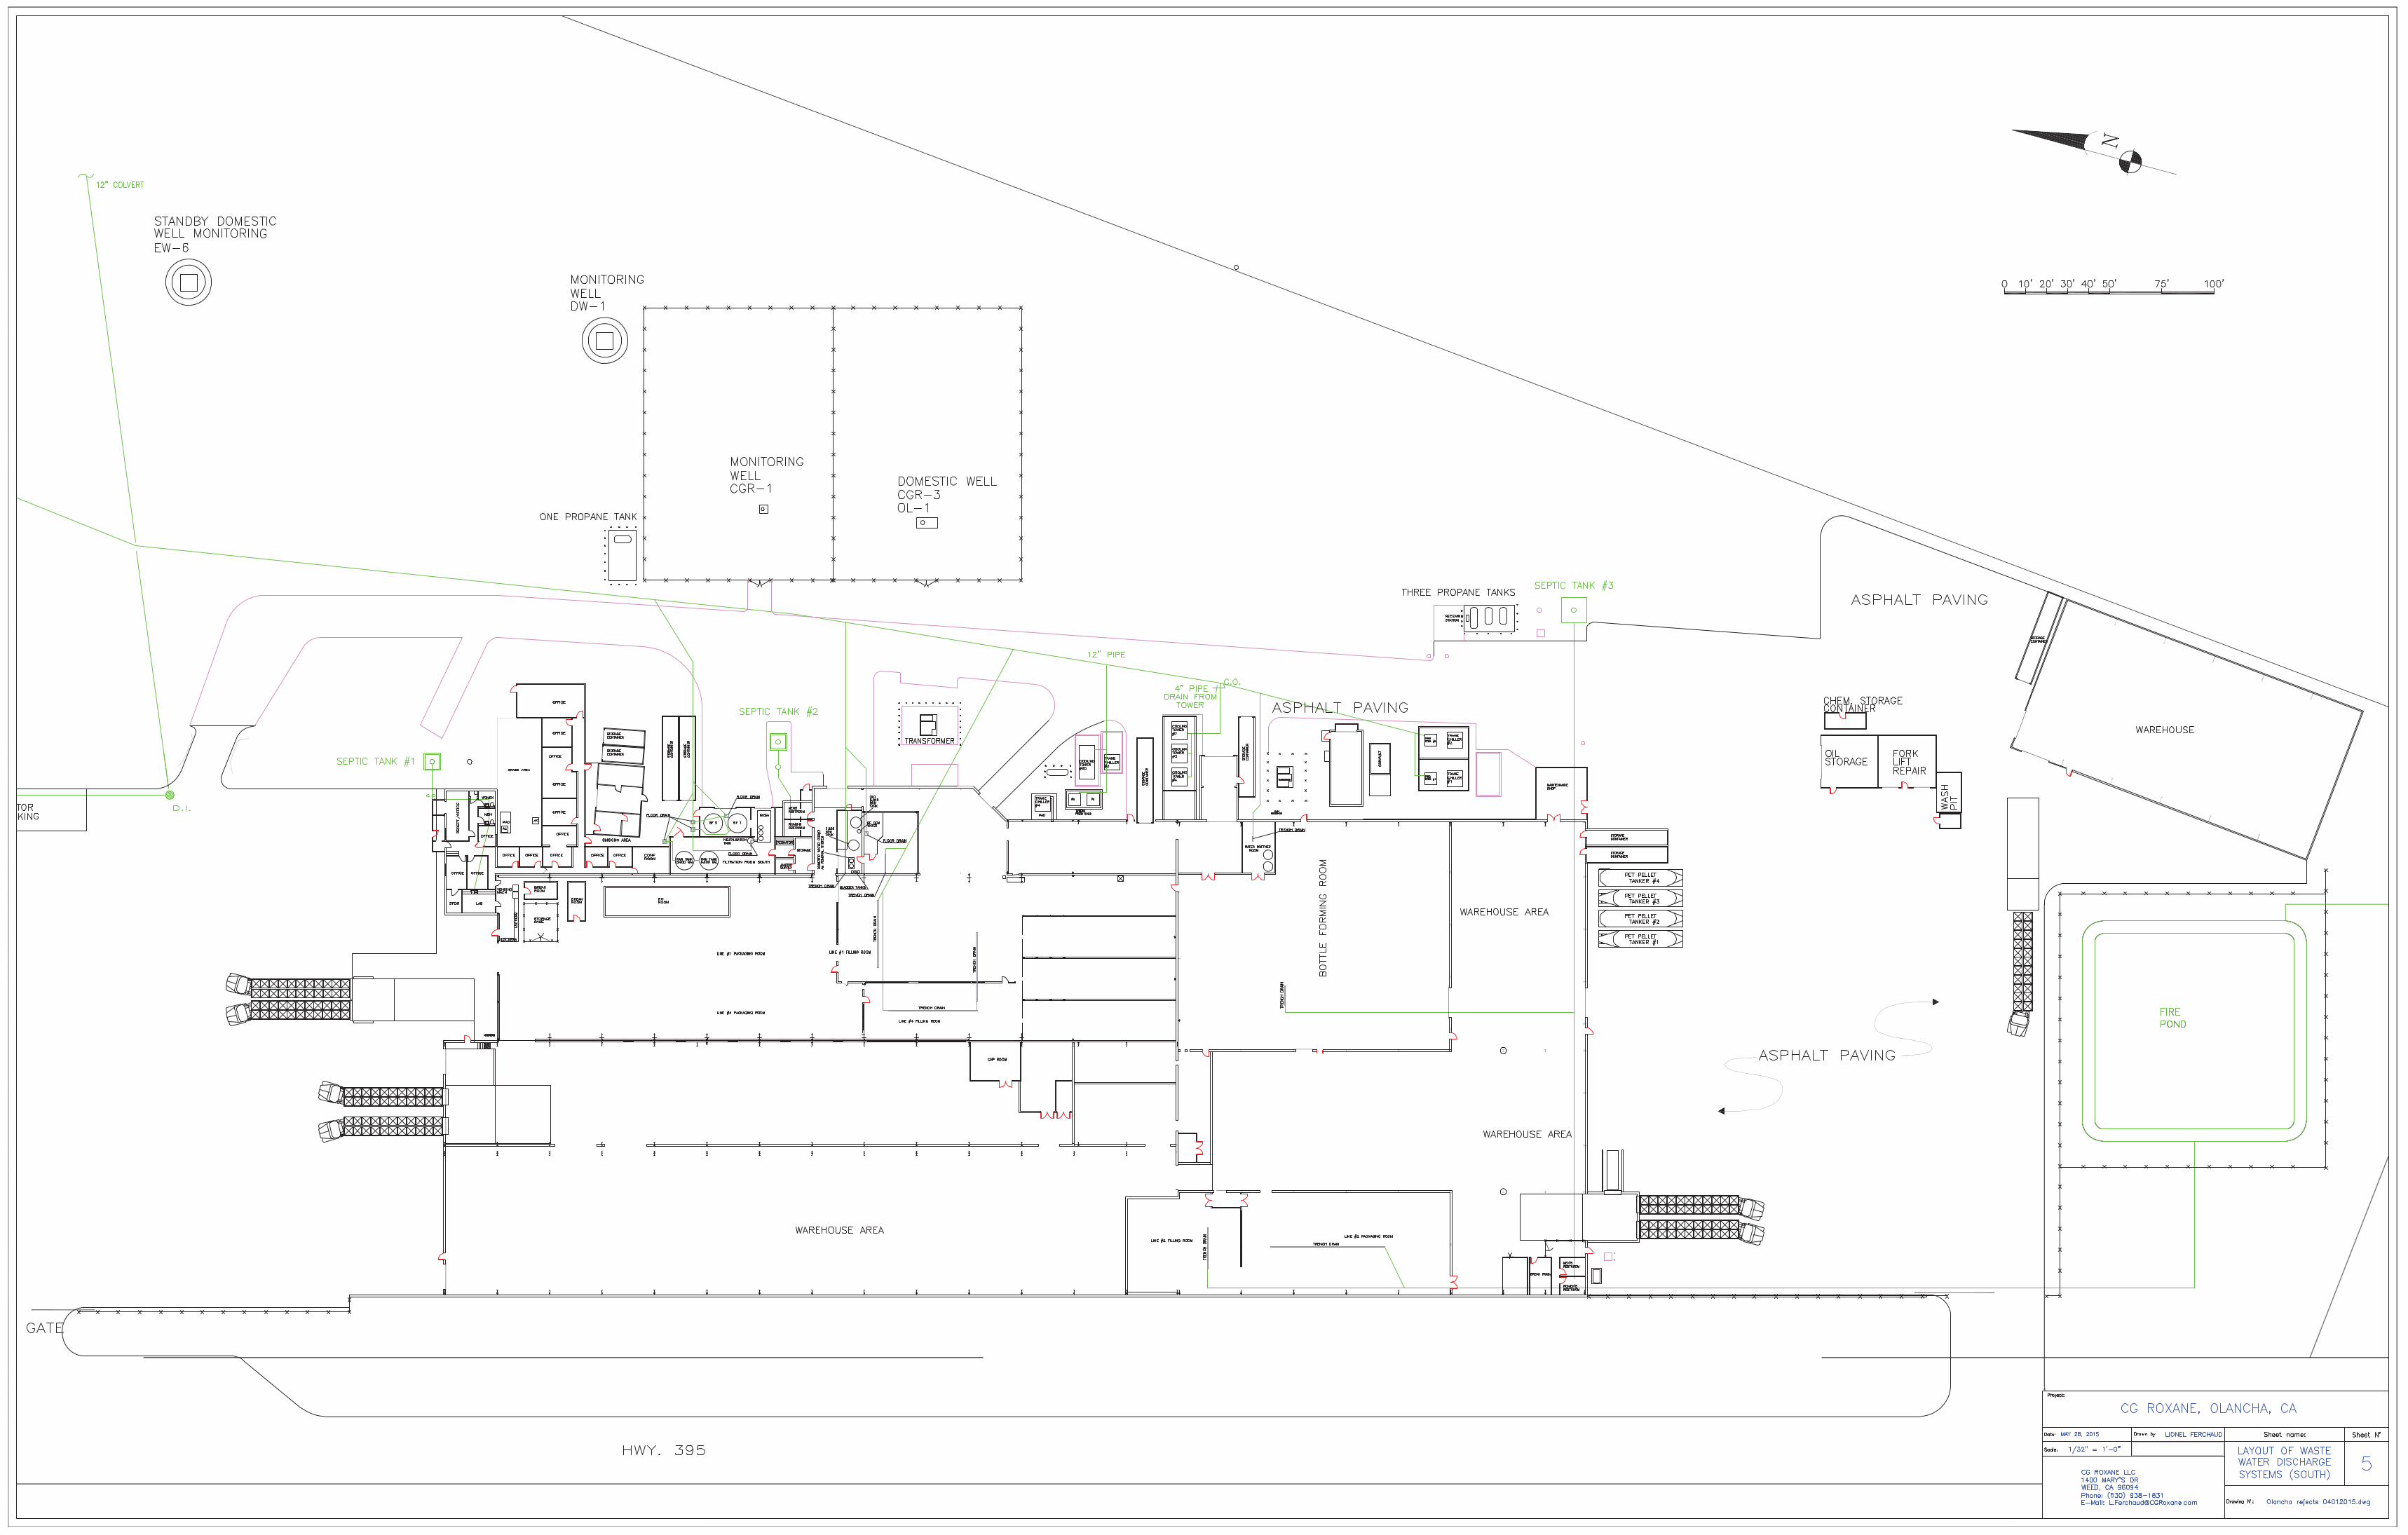
There are separate domestic water circuits for Olancha North and Olancha South; however, the treatment process is the same for both circuit locations. Both Olancha North and Olancha South use water from two groundwater wells “CGR-3”, and “CGR-4”, respectively. Notably, the naturally occurring arsenic concentrations in groundwater levels from CGR-3 and CGR-4 are 30 micrograms per liter (µg/l) and 15 µg/l, respectively, which exceed the maximum contaminant level (MCL) for arsenic.
For both Olancha North and Olancha South, all water is withdrawn from the wells using a stainless steel, submersible pump and delivered to the Facility through a high-density polyethylene (HDPE) pipe. All water is then filtered through 5 Micron Polyester Filter Bags (Bag Filter) before being utilized for either (1) onsite domestic water use (i.e., restrooms, break rooms, laboratory sink, hose bibs, or other similar uses) or (2) the industrial cooling towers. Bag Filters are used to remove larger particles (such as silt, sediment, and sand) from the spring water prior to use. The Bag Filter system is equipped with pressure gauges, purges, valves and a sample port to facilitate cleaning, purging and monitoring. Prior to use, the Bag Filters are rinsed using hoses with spring water from the domestic wells and the rinseate is collected through a floor drainage system and discharged to the EP by a pipeline outlet. The bag filters are periodically replaced. The replaced bag filter is removed and disposed of as solid waste in the trash.
3.2 Domestic Water Use
Domestic water use at the Facility consists of the following:
• Restroom facilities
• Drinking water fountains
• Lab Facilities
• Hose Bibs
After the Bag Filter process, the domestic water for both Olancha North and Olancha South is filtered for arsenic through the use of independent arsenic removal units2. This process has been approved by the Inyo County Health and Human Services, Public Health Division. These units utilize a special media that removes arsenic from the water. Notably, these units are entirely self-contained and do not generate a waste stream as the
2 AdEdge Technologies – Model 33-3072-CO-2-315.
ROWD Report_21102015 6 10/21/2015
arsenic remains attached to the media and contained in the units until the media will be periodically disposed of off-Site. The specialized media has not required disposal to date at the facility. It is anticipated that at some date in the future the media may require disposal. At such time, the material will be appropriately handled pursuant to both state and federal law.
Following arsenic removal, the treated water for domestic use is then piped to a plastic tank where it is disinfected with chlorine solution. The domestic water is tested daily for chlorine at points-of-use (i.e., labs). The chlorine levels are maintained within a value range of 0.2 - 0.8 parts per million (ppm).
Domestic sewage wastewater is discharged to underground septic tanks through a system of pipes (3 septic units for Olancha South and 1 septic unit for Olancha North). The septic tanks are regularly pumped by a licensed third-party agent3. Notably, the septic units do not generate any waste outside of the system itself as they remain entirely self-contained (i.e. they are not connected to leachfields or other disposal outlets).
3.3 Industrial Cooling Towers.
The industrial cooling towers circulate water in order to remove process heat from various bottling production machinery. There are twelve total cooling tower units in the Facility (7 units for Olancha South and 5 units for Olancha North); each utilizing approximately 2,000 gallons per day (GPD) when operational. After the bag filter process, cooling water is “softened” by an ion exchange resin that replaces calcium ion with sodium ion within the spring water. The softeners are associated with each cooling unit. Depending on its location, the unit will discharge wastewater (i.e., softened spring water) through a continuous draining process to either a drainage system toward the EP or directly to the ground near the cooling towers.
The ion exchange resin is regularly and automatically regenerated with sodium chloride. The regeneration process utilizes a sea salt solution that is passed through the ion exchange resin to remove the retained calcium.
3.4 Production Water Circuits
The production water (used in bottling) for Olancha South is sourced from groundwater well “CGR-2”. Production water for Olancha North is sourced from a blending of two groundwater wells: “CGR-2” and “CGR-7”. Notably, the naturally occurring groundwater concentrations for arsenic in CGR-2 and CGR-7 are 10 µg/l and 23 µg/l, respectively.
3 Preferred Septic and Disposal, Inc.
ROWD Report_21102015 7 10/21/2015
As with the domestic/industrial water circuits, production water is withdrawn from the same wells by stainless steel, submersible pumps and delivered to the respective Facility areas through either HDPE or stainless steel pipelines. At the Facility (North and South), the water is filtered through the same Bag Filter process previously described above. The water is then sent to stainless steel storage tanks for disinfection by ozonation. Olancha South utilizes two 8,000-gallons storage tanks in parallel. Olancha North utilizes one 8,000-gallon storage tank. Water in those tanks is treated with ozone gas. The ozone concentration is analyzed and regulated by an automated system, which is regularly checked by onsite quality control staff. There are no chemicals used for cleaning or sanitation of the water within the storage tanks. Therefore, when the storage tanks are routinely purged between production periods4 the discharge is only ozonated spring water, which contains the same compositions and concentrations as when withdrawn.. The wastewater generated through purging of the tanks is collected through a floor drain and associated underground pipeline system, and discharged to the EP by a pipeline outlet.
As discussed above, depending on the location in the Site, the ozonated spring water from the storage tanks will pass through one of three Manganese Sand Filters (Sand Filter)5. One Sand Filter (containing two vessels in parallel) is located in Olancha South serving production lines #1, #2, and #4. Two Sand Filters are located in Olancha North. One (containing two vessels in parallel) services lines #3 and #5, and the other (containing one vessel) services line #6. Each Sand Filter is used to remove certain threshold levels of natural occurring arsenic so that the production water meets Federal and State regulatory standards for drinking water. Each Sand Filter is used to remove certain threshold levels of natural occurring arsenic so that the production water meets Federal and State regulatory standards for drinking water.
Following arsenic removal, the production water is then delivered to a 0.1 Micron IMECA tangential microfiltration system made from ceramic composites (IMECA). There are two IMECA units in Olancha North and one IMECA unit in Olancha South. The purpose of these IMECA units is to serve as a fail-safe filter system in the unlikely event that some particulates are discharged through the Sand Filter. Approximately every 30 minutes during a production cycle, the IMECAs are purged using ozonated water in order to remove any particulate matter from the membrane. This wastewater is collected through a floor drainage system and discharged to the EP by a pipeline outlet.
A routine cleaning of each IMECA occurs approximately three times per year. Each unit has a dedicated Clean-In-Place (CIP) system, consisting of three separate tanks: (1) a tank containing approximately 185 gallons of 2% phosphoric acid solution (Acid Solution), (2) a tank containing approximately 185 gallons of 3% sodium hydroxide solution (“Alkaline Solution”), and (3) a water tank sourced from the storage tank. During a given cleaning 4 Purging is done in order to avoid water stagnation within the storage tank. 5 Natural manganese sand, NSF approved.
ROWD Report_21102015 8 10/21/2015
cycle, the first phase of cleaning involves circulation of the Alkaline Solution into the IMECA system and back to the CIP tank. This is a fully automated closed loop system. Next, a water rinse is delivered from the CIP water tank and used to flush and remove organic deposits (i.e., colloids), if any, from the unit (approximately 800 gallons of water is used to rinse). This rinse water is discharged to the EP through a floor drain and associated pipeline system with an outlet6. The second phase of cleaning involves application of the Acidic Solution into to the IMECA unit and back to the CIP tank. This is a fully automated closed loop system. Next, a water rinse is again delivered from the CIP water tank to the unit in order to remove mineral deposits, such as iron, from the unit (approximately 800 gallons of water is used to rinse). This rinse water is discharged to the EP through the same floor drainage system and pipeline outlet. A total of 1,600 gallons of ozonated spring water is used to rinse the IMECA during this stage.
The third phase (sanitation) involves three cycles of ozonated water rinse from the storage tank only. This rinse water is discharged to the East Pond though the same floor drainage system and pipeline outlet.
The fourth phase (conditioning) involves three cycles of water from the CIP water tank. This rinse water is discharged to the EP though the same process as above.
After the cleaning has been completed, the CIP tanks for each IMECA unit are neutralized and purged according to the following process. All Acid Solution within the tank is individually purged into parallel tanks used for neutralization (or neutralized in situ). In the case of the Acid Solution, the Alkaline Solution is added for neutralization. When the solution has reached a pH value of between 6 and 9, the solution is discharged to the EP through a floor drainage system and pipeline outlet. In the same fashion, the Alkaline Solution tank is individually purged into parallel tanks used for neutralization (or neutralized in situ). In the case of the Alkaline Solution, the Acid Solution is added for neutralization. When the solution has reached a pH value of between 6 and 9, the solution is discharged to the EP through a floor drainage system and pipeline outlet. The water tank is simply purged and allowed to discharge to the EP.
The production water that has passed through the IMECA units is then delivered to a second set of stainless steel storage tanks prior to bottling. These tanks consist of an 8,000-gallon tank in Olancha North and a 2,500-gallon tank for Olancha South that source the Facility’s six bottling fillers. The production water in these storage tanks is not treated in any way. Furthermore, the filler piping circuit (outside of the tanks) does not require internal cleaning or sanitizing.
Depending on the location of an individual production line within the Site building, the production water is then delivered by an internal network of pipelines to two distinct types of bottle fillers: gravimetric or volumetric. Lines #2, #3, #4 and #5 use volumetric

ROWD Report_21102015 9 10/21/2015
fillers that contain a water storage tank within the machine unit. At the end of a production cycle, the production water (i.e., spring water only) within these storage tanks is purged and discharged to the EP (except for line #2) through a floor drainage system and the same pipeline outlet7. The production water (i.e., spring water only) in the filler machine for line #2 is collected in a floor drain system and discharged to the FP. Notably, this filler production water, including draining of the raw water storage tank, (together, spring water only) is discharged to the FP. The Filler from line #2 is the only source of wastewater to the FP. The FP contains a vertical screened pipe located within the pond itself to allow for overflow. When the water occasionally reaches a certain level within the pond (the level of water in the pond is naturally regulated by evaporation), the pipe captures and discharges water to a small portion of land owned by the Company located directly south of the FP8.
A routine cleaning and sanitization of certain production equipment surfaces, such as the fillers (i.e., food contact surfaces), is required under the Food and Drug Administration’s (“FDA”), Good Manufacturing Procedures (“GMP”). The following two food-grade sanitizing foams are used: Phosphoric Acid (CD 470) and Quaternary Ammonium (Quorum clear V). The sanitizing foams are applied onto requisite surfaces with a spray application and rinsed-off with various hose bibs using domestic water. The rinse water is discharged to the EP (except from filler 2 which goes to the FP) through a floor drainage system and pipeline outlet.
Furthermore, a potassium hydroxide solution (Kleensall) is infrequently used to sanitize Facility surfaces, such as floors. The solution is mainly applied using towels and rags, which are collected and disposed of in solid wastebaskets. Small food grade machinery parts, such as filler heads, are occasionally soaked in a Peracetic Acid Solution (Vortexx).
3.5 Miscellaneous Solutions.
In addition to the above-mentioned items, there are various chemicals used within the Facility for its ongoing operations, such as: oil for engines and machines which are collected and deposited into plastic storage containers and hauled off-site by a third-party company9; solutions to clean manufacturing parts in non-drained injection-blow molding production areas which are collected and hauled off-site10; hand-sanitizers11 for personnel which are rinsed-off in the domestic circuit and discharged to the septic tank or dissipate through evaporation; hand-care solution for personnel which are rinsed-off in the domestic circuit and discharged to the septic tank; ink for printing manufacturing codes
7 Purging is done in order to avoid water stagnation within the tank. 8 The overflow from the FP was previously discharged to a cattle grazing field east of Olancha South, but has been redirected due to concerns raised by LRWQB. 9 Crane’s Waste Oil Disposal Company 10 Safety Clean 11 Eco-care
ROWD Report_21102015 10 10/21/2015
on bottles, trays and overwraps are collected and deposited into plastic storage containers and hauled off-site12; isopropyl alcohol used on rags to clean surfaces which are collected and disposed of in solid waste baskets; and DryEXX conveyer lubricant sprayed on conveyer belts.
None of the above mentioned chemicals are discharged to the ponds or ground at the site.
12 Crane’s Waste Oil Disposal Company
ROWD Report_21102015 11 10/21/2015
4.0 SITE GEOLOGY AND HYDROGEOLOGY
4.1 Regional Geology
The Site is located in the southern portion of the Owens Valley which has a length of 150 miles and width of generally less than 8 miles. The Owens Valley is the westernmost valley of the Basin Range Province and is formed by the Sierra Nevada Mountains to the west and the White/Inyo Mountains to the east. The Sierra Nevada Mountains are generally composed of Mesozoic age igneous rocks of granodiorite-granite composition whereas the White/Inyo Mountains, to the east, consist of Pre-Cambrian to Triassic sedimentary rock locally intruded with Mesozoic granitic rocks.
Structurally, the Owens Valley is a graben bounded by the Sierra Nevada Frontal fault and the Inyo Mountain Frontal fault. These faults are considered active and the offset on these faults is the cause of the dramatic relief in the Owens Valley area. The Site is located on the valley floor at an elevation of approximately 3,640 feet, while Olancha peak, to the west of the Site in the Sierra Nevada Mountains, stands at an elevation of over 12,000 feet. The Inyo Mountains east of the Site have an elevation greater than 8,000 feet.
4.2 Site Geohydrology
The California Department of Water Resources (DWR, 2003) shows the Site to be located in the southern portion of the Owens Valley Groundwater Basin. The groundwater basin has a surface area of 1,030 square miles and includes valleys in both Mono and Inyo County. The basin, as defined by the Department of Water Resources, is bounded to the south by the Coso Range, the Sierra Nevada to the west, the White/Inyo Mountains to the east, and the Benton Range to the north.
The most important water bearing formation in the vicinity of the Site is alluvium consisting of sands and gravels derived from erosion of the surrounding mountains. The upper zone of the alluvial aquifer, in which the westernmost Site production wells are installed, is unconfined. Deeper zones of water bearing alluvium beneath the Site are under semi-confined conditions. The sandy and gravelly alluvium is locally interbedded or interfingered with fine-grained lacustrine (lake) deposits. Fine-grained lacustrine deposits increase in occurrence and thickness to the east towards Owens Lake (GSI, 1983). The thickness of the alluvial and lacustrine sequence is thought to be several thousand feet thick and up to 6,000 feet or more in the middle of the Owens Lake (Pakiser et. al., 1964).
The primary source of groundwater recharge in the Owens Valley Groundwater basin is from percolation of stream flow from the Sierra Nevada range. In the case of the Site and the Cartago area, the main aquifer is thought to recharge primarily by flow in Olancha
ROWD Report_21102015 12 10/21/2015
Creek, Cartago Creek, and Walker Creek that have watersheds to the west of the Site in the Sierra Nevada Mountains. Stream flow in these creeks is derived from precipitation in the mountains and infiltrates through relatively permeable alluvium closer to the valley floor. There is also thought to be some recharge of the alluvium from underflow of groundwater in fractures in the mountain bedrock, although the volume of such recharge is not known. Recharge of direct precipitation into the alluvium may also contribute a relatively small component of recharge into the groundwater basin.
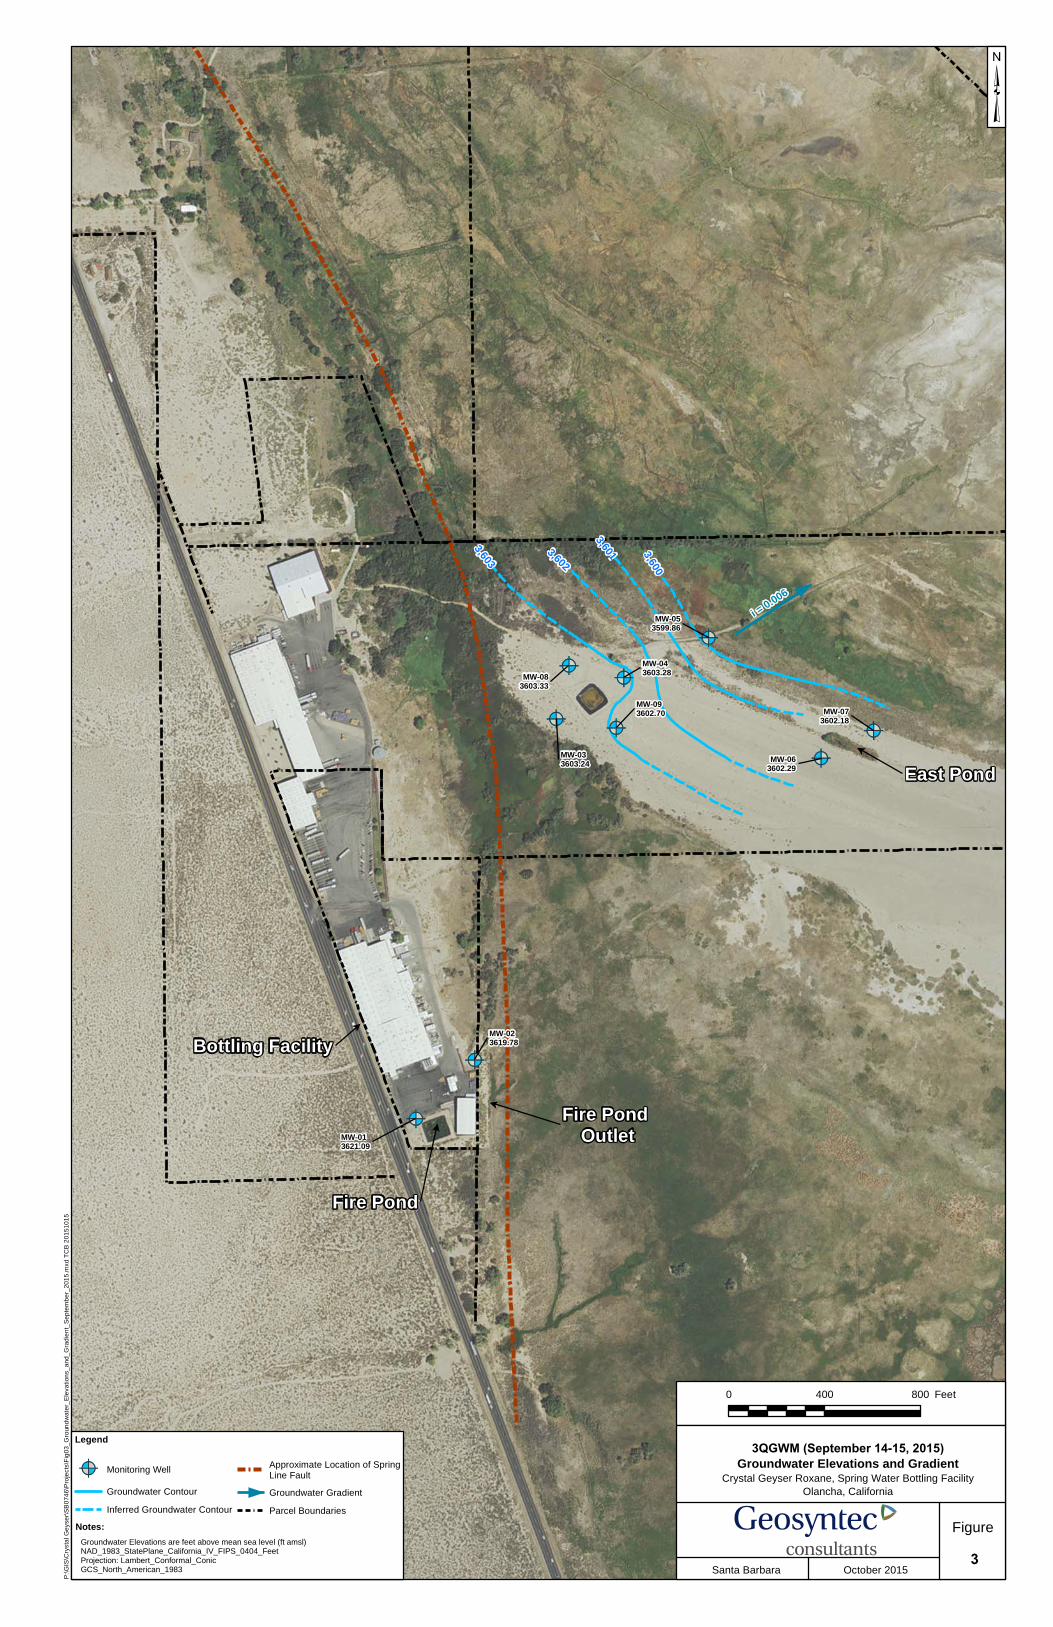
Groundwater in the shallow unconfined aquifer is the source for numerous springs and seeps that collectively form along a north-south trending fault (a part of the Sierra Nevada Frontal fault system). The north-south trending fault, known locally as the “Spring Line fault”, intersects the property to the east of MW-02 and to the west of MW-03 (Figure 3). The fault is inferred to cause a “damming” effect and the subsequent rise of groundwater to the surface creates the large linear spring areas or spring seeps (Dames and Moore, 1991). Production wells that have been installed by CGR draw water from the shallow unconfined aquifer in hydraulic connection with the spring water. Wells used for spring water production are all located west of the spring line fault.
ROWD Report_21102015 13 10/21/2015
5.0 SUMMARY OF PREVIOUS GROUNDWATER INVESTIGATIONS
There are eight previous hydrogeological Site studies relating to the CGR spring water bottling operations as provided in chronological order below. Electronic copies of these reports (excepting the first listed report) were provided with the Investigation Work Plan, (Geosyntec, 2014) dated October 17, 2014.
• Phase I – Water Resources Investigation, Crystal Geyser-Roxane, Bottling Facility, Inyo County, California, February 19, 1990. Completed by Dames and Moore. Note: Report is referenced in subsequent reports, but a copy of the report is not available.
• Phase II – Water Resources Investigation, Crystal Geyser-Roxane, Bottling Facility, Inyo County, California, January 20, 1991. Completed by Dames and Moore.
• Report – Water Supply Well CGR-2, Crystal Geyser Roxane, Olancha, California, March 31, 1993. Completed by Dames and Moore.
• Report – Water Supply Wells CGR-4, CGR-5 and CGR-6 Crystal Geyser-Roxane, Olancha, California, April 21, 1995. Completed by Dames and Moore.
• Test Well Installation and Hydrogeology Report, Cabin Bar Ranch, Olancha, California. February 7, 2011. Completed by Geosyntec Consultants.
• Phase 1 – Site Groundwater Investigation Report, Olancha Spring Water Bottling Facility, Olancha, California, February 16, 2015. Completed by Geosyntec Consultants.
• Phase 2 – Site Groundwater Investigation Report, Olancha Spring Water Bottling Facility, Olancha, California, August 14, 2015. Completed by Geosyntec Consultants.
• Third Quarter 2015 Groundwater Monitoring Report, Crystal Geyser Roxane Spring Water Bottling Facility, Olancha, California, October 15, 2015. Completed by Geosyntec Consultants.
The majority of the hydrogeologic studies at the Site focused on the western portion of the property, where most of the production wells used for spring water bottling are located. As the subject of this ROWD is waste water discharge to the southern and eastern portions of the Site, information relevant to that area is provided below. A more detailed discussion of water quality is provided in Sections 6.0 and 7.0.
ROWD Report_21102015 14 10/21/2015
The 2015 Phase 1 investigation evaluated the groundwater and waste water quality in the areas around the current and former waste discharge ponds (EP, FP, and AP). During the investigation, a total of 10 groundwater grab samples were collected to gather screening level data in order to better evaluate groundwater quality conditions and identify appropriate locations for groundwater monitoring wells. In addition, production and sanitation waste water samples were collected during standard waste water discharge activities from both the northern and southern bottling plants, and from the waste discharge ponds to characterize the chemical composition of waste water generated.
Based on the screening level results of the Phase 1 investigation, the Phase 2 Site investigation was completed. This investigation included installation and sampling of nine groundwater monitoring wells in the shallow aquifer (Figure 2). Construction details and well gauging details for the wells are included in Table 1. The monitoring wells were installed within the upper shallow aquifer, with 15 foot well screens set between 5 and 25 feet below ground surface (ft bgs), with the exception of MW-01, which was installed with a screen interval between 18 and 33 ft bgs.
Groundwater samples have been collected from the Site monitoring wells in July and September 2015, and analyzed for a wide range of water quality constituents including:
• CAM 17 metals, (total and dissolved) using EPA Method 6010B and 7470A ;
• VOCs using EPA Method 8260B;
• Semi-Volatile Organic Compounds (SVOCs) using EPA Method 8270C;
• Methylene Blue Active Substances (MBAS) using SM Method 5540;
• General Minerals (sodium, calcium, magnesium, chloride, bicarbonate, and sulfate) using EPA Method 200.7, 300.0 and Standard Method (SM) 2320B;
• Total Dissolved Solids (TDS) using SM 2540C;
• Total phosphate and phosphorus using SM 4500;
• Total nitrogen, nitrate as nitrogen, ammonia, and Total Kjeldahl nitrogen using SM 4500;
Further discussion of the groundwater quality is described in Section 6.1, and a discussion of the waste water quality is discussed in Sections 6.2 and 6.3.
ROWD Report_21102015 15 10/21/2015
6.0 DESCRIPTION OF GROUNDWATER, WASTE WATER, AND POND WATER QUALITY
6.1 Upgradient Groundwater Quality
Groundwater wells MW-06 and MW-01 were installed during Phase 2 Site Investigations generally upgradient of the EP and FP waste discharge ponds respectively, therefore these wells can be used as a representation for background water quality upgradient of the proposed discharge locations. Well installation details are included in Table 1 and a detailed summary of detected analytical results is included in Tables 2 through 4 including the MCLs for drinking water. The results of laboratory analysis for MW-06 and MW-01 are summarized below.
The following is a summary of laboratory detections above the laboratory MRL in one or more of the groundwater samples from MW-06 in July and September 2015:
• Dissolved or total metals: arsenic, molybdenum, selenium, and zinc; and
• Inorganic and general mineral constituents: alkalinity, ammonia as nitrogen, calcium, chloride, magnesium, total nitrogen, total Kjeldahl nitrogen, phosphate, phosphorous, sodium, sulfate, and TDS.
Total and fecal coliform, VOCs, SVOCs, and MBAS were analyzed but not detected in the samples collected from MW-06.
Groundwater analytical results from samples collected from MW-06 generally indicate low detections of dissolved metals, total metals, TDS, and other inorganic and organic constituents that did not exceed established MCLs. The only constituent that has exceeded the MCL in MW-06 has been dissolved arsenic at concentrations ranging from 10.7 to 17.1 µg/l. The concentrations of dissolved arsenic are within the range of concentrations detected in the production wells.
The following is a summary of laboratory detections above the laboratory MRL in the groundwater samples from MW-01 in July and September 2015:
• Dissolved or total metals: arsenic, barium, molybdenum, and zinc;
• Inorganic and general mineral constituents: alkalinity, calcium, chloride, magnesium, nitrate and nitrite, total nitrogen, phosphate, phosphorous, sodium, sulfate, and TDS; and
• Total coliform.
ROWD Report_21102015 16 10/21/2015
Fecal coliform, VOCs, SVOCs, and MBAS were analyzed but not detected in the samples collected from MW-01.
Groundwater analytical results from samples collected from MW-01 generally indicate low detections of dissolved metals, total metals, TDS, and other inorganic and organic constituents that did not exceed established MCLs. The only constituent that has exceeded the MCL in MW-01 has been dissolved arsenic in July 2015 at a concentration of 13.6 µg/l. The concentrations of dissolved arsenic are within the range of concentrations detected in the production wells.
6.2 Groundwater Quality Downgradient of East Pond
Groundwater well MW-07 was installed downgradient of EP during Phase 2 Site Investigations. See Table 1 for well installation details and Tables 2 through 4 for a summary of analytical results. The following is a summary of laboratory detections above the laboratory MRL in one or more of the groundwater samples from MW-07 in July and September 2015:
• Total and dissolved arsenic, total barium, total and dissolved copper, total and dissolved molybdenum, total nickel, total and dissolved vanadium, and total zinc;
• Inorganic and general mineral constituents: alkalinity, calcium, chloride, magnesium, total nitrogen, total Kjeldahl nitrogen, phosphate, phosphorous, sodium, sulfate, and TDS.
• Total coliform
VOCs, SVOCs, and MBAS were analyzed but not detected in the samples. Groundwater analytical results from samples collected from MW-07 generally indicate low detections of dissolved metals, total metals, TDS, and other inorganic and organic constituents that did not exceed established MCLs. The only constituent that has exceeded the MCL in MW-07 has been dissolved arsenic in July 2015 at a concentration of 47.9 µg/l. The concentration of dissolved arsenic decreased to below the laboratory MRL in September 2015.
6.3 Groundwater Quality Downgradient of Fire Pond
Groundwater well MW-02 was installed cross and down-gradient of the FP discharge location. The following is a summary of laboratory detections above the laboratory MRL in one or more of the groundwater samples from MW-02 in July and September 2015:
ROWD Report_21102015 17 10/21/2015
• Dissolved and total arsenic, dissolved and total barium, and total zinc;
• Inorganic and general mineral constituents: alkalinity, ammonia nitrogen, calcium, chloride, magnesium, phosphate, phosphorous, sodium, sulfate, and TDS, and
• Total coliform
VOCs, SVOCs, and MBAS were analyzed but not detected in the samples. Groundwater analytical results from samples collected from MW-02 generally indicate low detections of dissolved metals, total metals, TDS, and other inorganic and organic constituents that did not exceed established MCLs. The only constituent that has exceeded the MCL in MW-02 has been dissolved arsenic in July 2015 at a concentration of 23.3 µg/l. The concentration of dissolved and total arsenic decreased to below the laboratory MRL in September 2015.
6.4 North Bottling Plant Waste Water and East Pond Water Quality
The EP is an unlined pond used for discharge of the northern bottling plant waste water. During Phase 1 Site investigations samples were collected from the northern bottling plant waste water during production and sanitation, at the point of discharge into EP during production, and in EP standing water.
The waste water sample analytical results are summarized in Tables 5 through 8. These samples represent the expected quality of water discharged to the EP during waste water discharge.
The following is a summary of laboratory detections above the laboratory MRL in one or more of the waste water samples collected from the EP or FP:
• Total and dissolved antimony, total and dissolved arsenic, total and dissolved barium, total chromium, total and dissolved copper, total and dissolved molybdenum, dissolved vanadium, and total and dissolved zinc.
• Inorganic and general mineral constituents: Alkalinity (total), biochemical oxygen demand, calcium carbonate, calcium, chemical oxygen demand, chloride, magnesium, nitrate as nitrogen, total nitrogen, total Kjeldahl nitrogen, orthophosphate as phosphorous, total phosphorus, sodium, sulfate, surfactants, TDS, and total organic halides.
• VOCs and SVOCs: 2-butanone (MEK)
• Total coliform
ROWD Report_21102015 18 10/21/2015
Based on the analytical results from the EP waste water samples, the dissolved arsenic was the only constituent that exceeded the MCL of 10 µg/l. The dissolved arsenic concentrations in waste water produced during a sanitation cycle at the northern bottling plant and in the point of discharge to EP during production ranged from 12 to 18 µg/l. These arsenic results are within the range of arsenic detected in background groundwater concentrations, and therefore is not expected to degrade or impact groundwater quality in the proposed EP waste water discharge area. 6.5 South Bottling Plant Waste Water and Fire Pond Water Quality
The FP is a concrete lined pond used for discharge of the southern bottling plant waste water. An overflow drain pipe from the FP discharges to land surface and infiltrates approximately 100 feet to the south of the FP. During Phase 1 Site investigations, samples were collected from the southern bottling plant waste water during sanitation, in standing water in FP, and from the FP overflow. The waste water sample analytical results are summarized in Tables 5 through 8 including MCLs for drinking water. These samples represent the expected quality of water discharged to the FP during waste water discharge. The following is a summary of laboratory detections above the laboratory MRL in one or more of the waste water and FP samples:
• Total antimony, total and dissolved arsenic, barium, total chromium, total and dissolved copper, total vanadium, and total zinc.
• Inorganic and general mineral constituents: Alkalinity (total), calcium carbonate, calcium, chemical oxygen demand, chloride, magnesium, nitrate as nitrogen, total nitrogen, total Kjeldahl nitrogen, orthophosphate as phosphorous, total phosphorus, sodium, sulfate, surfactants, TDS, and total organic halides.
• 2-butanone (MEK)
• Total coliform
The waste water samples collected from the FP discharge stream and from discharge overflow did not exceed any MCLs. Therefore the waste water discharge is not expected to degrade or impact groundwater quality in the proposed EP waste water discharge area.
ROWD Report_21102015 19 10/21/2015
7.0 POTENTIAL IMPACTS TO GROUNDWATER QUALITY
In general, the results of waste water samples collected from the northern bottling plant during normal production, during a sanitation cycle, waste water samples collected at the point of discharge to EP, and in standing water at EP indicate that the waste water discharged to EP is generally similar in composition to the groundwater upgradient of the EP at MW-06. Consequently, waste water discharge to groundwater in this location is unlikely to impact the receiving groundwater quality, as documented in downgradient monitoring well MW-07. Similarly, the results of waste water samples collected from the southern bottling plant during a sanitation cycle, in standing water at FP, and in the FP overflow indicate that the waste water discharged to FP is generally similar in composition to the groundwater quality upgradient of the FP at MW-01. Consequently, waste water discharge to groundwater in this location is unlikely to impact the receiving groundwater quality, as documented in downgradient monitoring well MW-02. In summary, waste water discharge during sanitation and production from the north and south bottling plants to the EP and FP are of similar quality to the representative samples collected from surrounding up and downgradient groundwater monitoring wells, and discharge of waste water to groundwater has a very low potential to impact groundwater quality at the Site.
ROWD Report_21102015 20 10/21/2015
8.0 REFERENCES
CRWQCB, 2005. Water Quality Control Plan for the North Lahontan Basin, December 21, 2005.
CGR 2014, Facility Waste Generation and Discharge Systems Report, Prepared by CG Roxane, LLC, 1210 South U.S. Highway 395, Olancha, California, October 21, 2014.
Dames and Moore, 1990, Phase I – Water Resources Investigation, Crystal Geyser-Roxane, Bottling Facility, Inyo County, California, February 19, 1990.
Dames and Moore, 1991, Phase II – Water Resources Investigation, Crystal Geyser-Roxane, Bottling Facility, Inyo County, California, January 20, 1991.
Dames and Moore, 1993, Report – Water Supply Well CGR-2, Crystal Geyser Roxane, Olancha, California, March 31, 1993.
Dames and Moore, 1995, Report – Water Supply Wells CGR-4, CGR-5 and CGR-6 Crystal Geyser-Roxane, Olancha, California, April 21, 1995.
Department of Water Resources, 2003, California’s Groundwater, Bulletin 118.
Geosyntec Consultants, Inc. 2011, Test Well Installation and Hydrogeology Report, Cabin Bar Ranch, Olancha, California. February 7, 2011.
Geosyntec 2015a, Phase 1 Site Groundwater Investigation Report, Olancha Spring Water Bottling Facility, 1210 South U.S. Highway 395, Olancha, California, February 16, 2015.
Geosyntec 2015b, Phase 2 Site Groundwater Investigation Report, Olancha Spring Water Bottling Facility, 1210 South U.S. Highway 395, Olancha, California, August 14, 2015.
Geothermal Surveys Inc., 1983, Ground Temperature Survey and Additional Geohydrologic Investigation, Cabin Bar Ranch, Inyo County. California.
ROWD Report_21102015 21 10/21/2015
Levy et al., 1999 D.B. Levy, J.A. Schramke, K.J. Esposito, T.A. Erickson and J.C. Moore, The shallow ground water chemistry of arsenic, fluorine, and major elements: Eastern Owens Lake, California, Appl. Geochem. 14 (1999),
Pakiser, L.C., Kane, M.F., and Jackson, W.H., 1964, Structural Geology and Volcanism of Owens Valley Region, California, a Geophysical Study. U.S.G.S. Professional Paper No. 438.

Oct -15
TABLES

Table 1Groundwater Levels and Well Construction Data
Crystal Geyser RoxaneOlancha, CA
Geosyntec Consultants
Northing Easting
MW-01 9/14/2015 22.71 3643.80 3621.09 18 - 33 33 36.3011461 -118.0207444
MW-02 9/14/2015 18.43 3638.21 3619.78 10 - 25 25 36.3018132 -118.0199017
MW-03 9/15/2015 15.02 3618.26 3603.24 5 - 20 20 36.3057165 -118.0186995
MW-04 9/15/2015 11.94 3615.22 3603.28 5 - 20 20 36.3061799 -118.0177333
MW-05 9/15/2015 8.47 3608.33 3599.86 5 - 20 20 36.3066296 -118.0165260
MW-06 9/15/2015 13.04 3615.33 3602.29 8 - 23 23 36.3052343 -118.0149476
MW-07 9/15/2015 7.98 3610.16 3602.18 5 - 20 20 36.3055453 -118.0142003
MW-08 9/14/2015 13.95 3617.28 3603.33 5 - 20 20 36.3063264 -118.0185088
MW-09 9/15/2015 17.34 3620.04 3602.70 9 - 24 24 36.3056073 -118.0178481
Notes:Wellhead elevation and location survey completed by Triad/Holmes Associates, Inc. Coordinate data in NAD 83 State Plane IV. Elevation data in NAV 88.
ft btoc: feet below top of casingft amsl: feet above mean sea level
ft bgs: feet below ground surface
Well Total Depth (ft bgs)
Location CoordinatesWell ID Date
Depth to Water
(ft btoc)
Top of Well Casing
Elevation (ft amsl)
Groundwater Elevation (ft amsl)
Well Screen Interval (ft bgs)
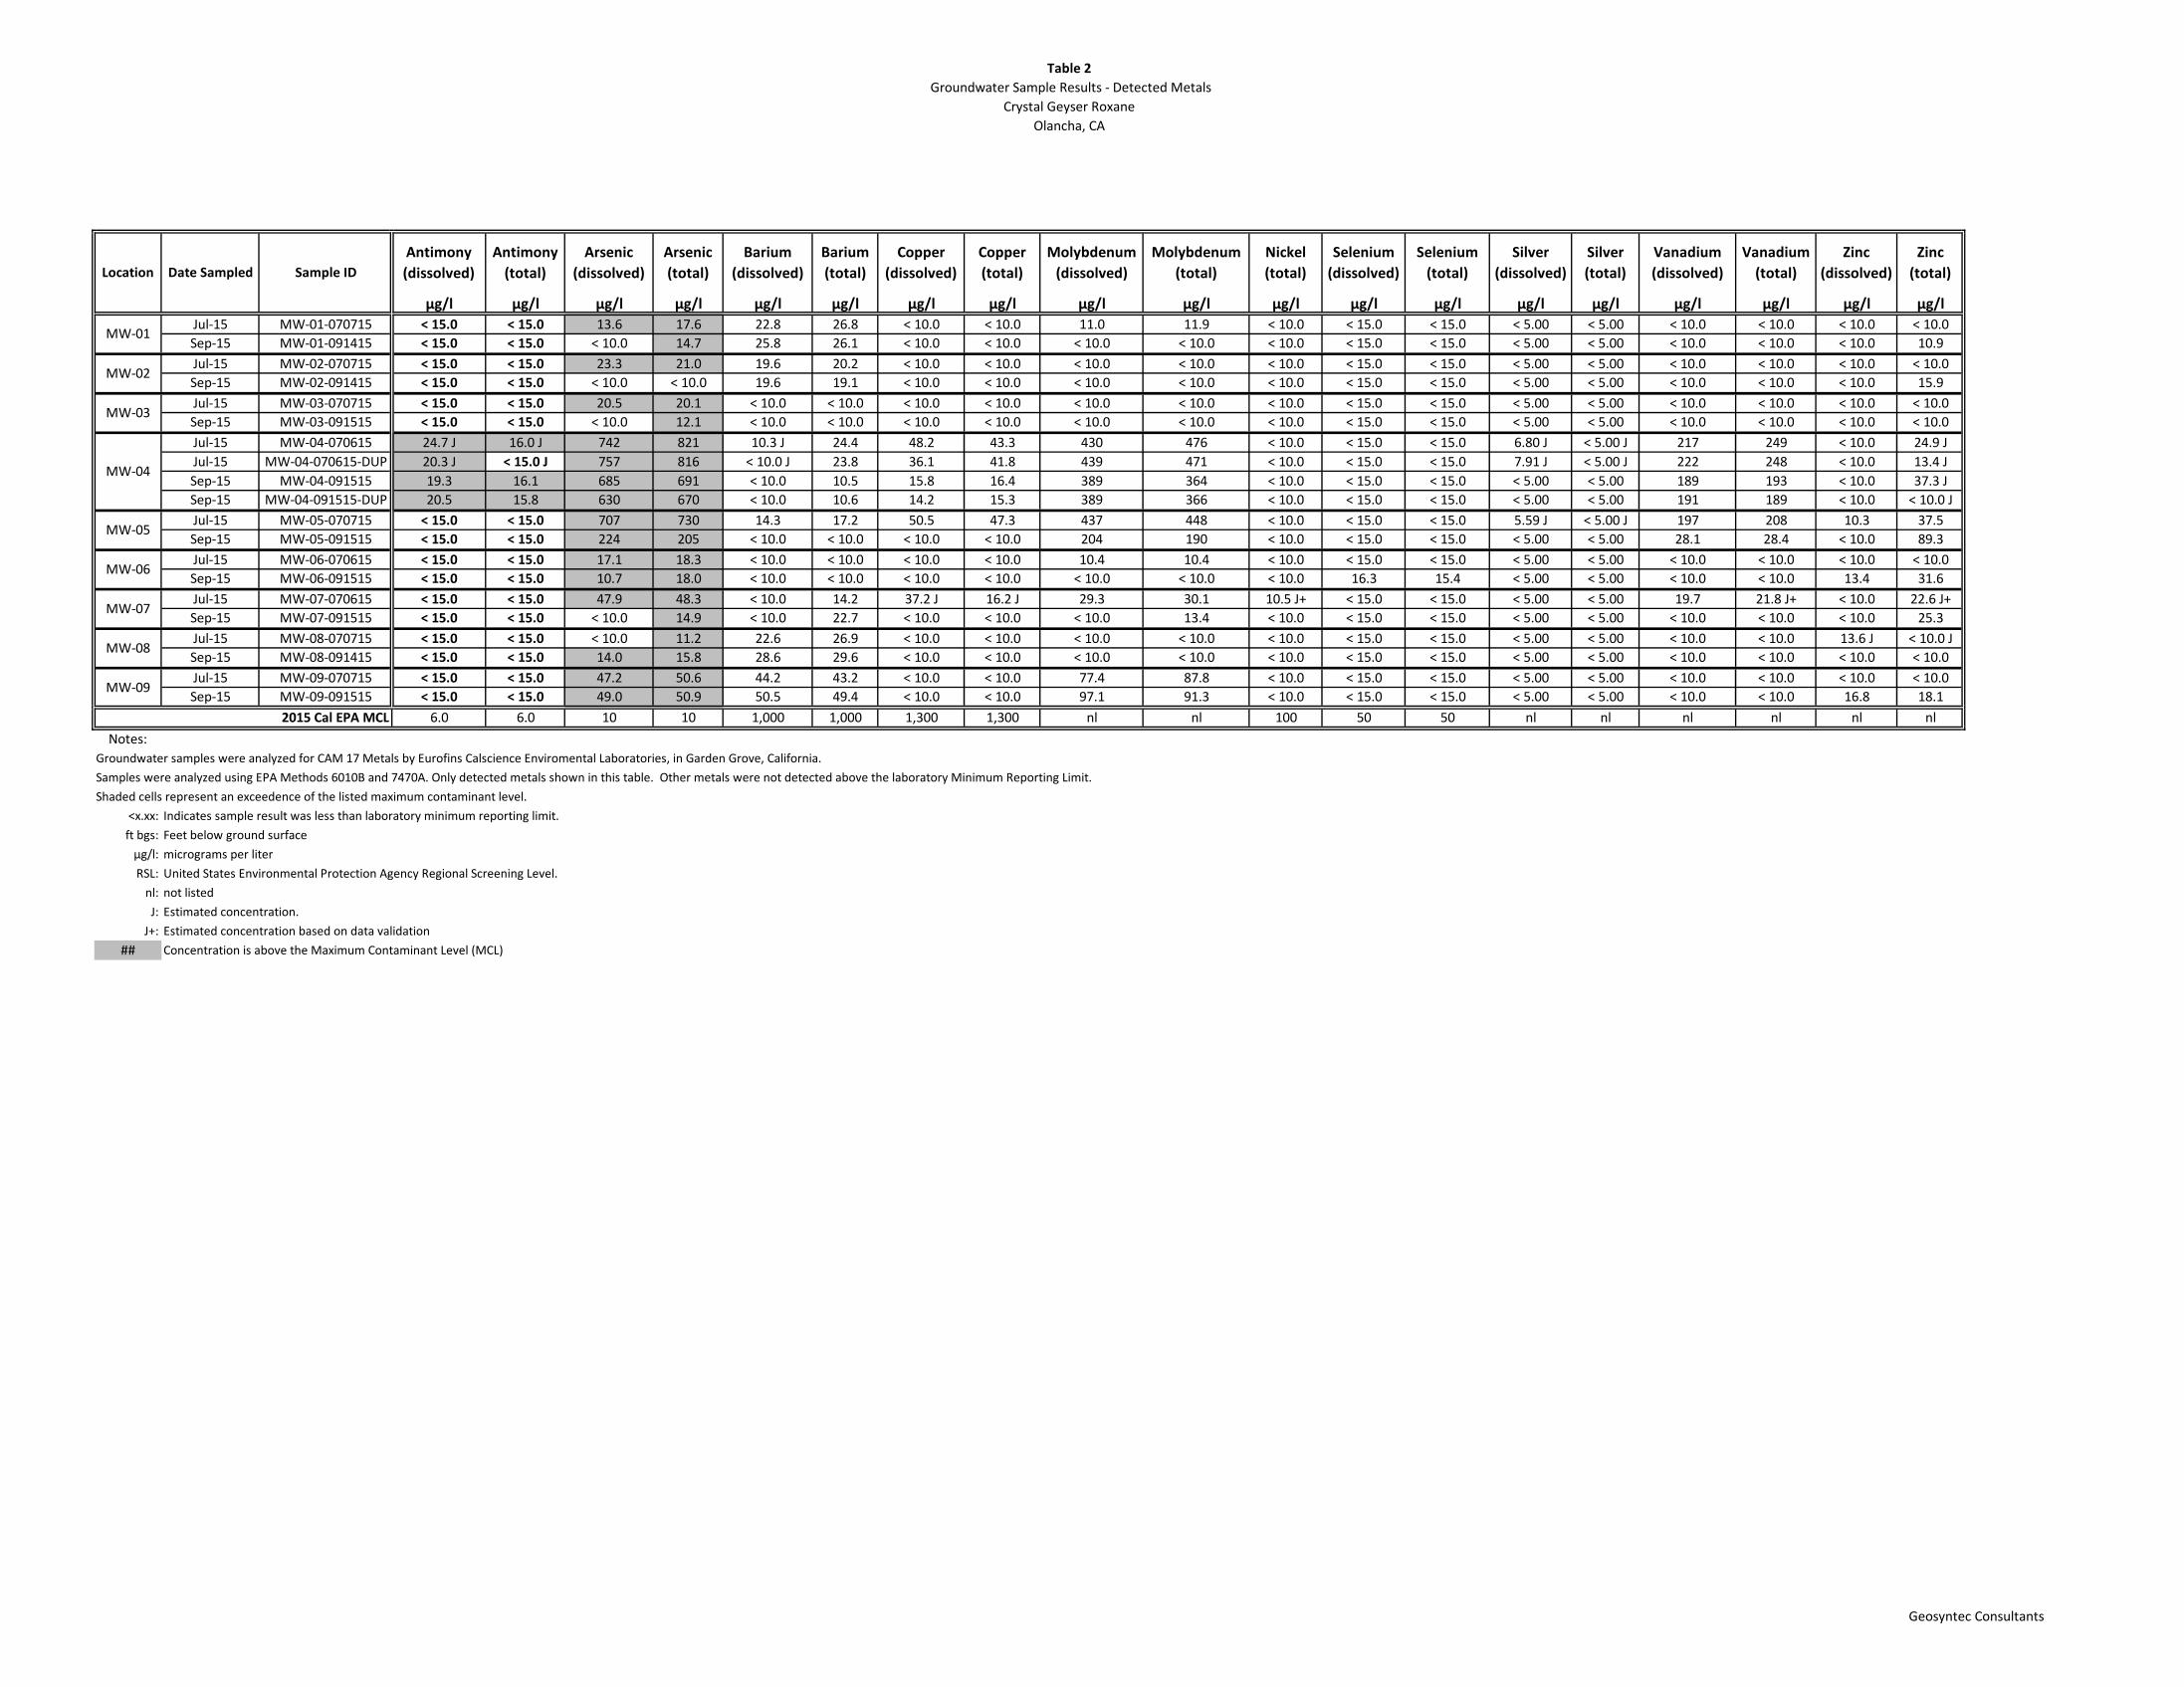
Table 2 Groundwater Sample Results - Detected Metals
Crystal Geyser RoxaneOlancha, CA
Geosyntec Consultants
Antimony (dissolved)
Antimony (total)
Arsenic (dissolved)
Arsenic (total)
Barium (dissolved)
Barium (total)
Copper (dissolved)
Copper (total)
Molybdenum (dissolved)
Molybdenum (total)
Nickel (total)
Selenium (dissolved)
Selenium (total)
Silver (dissolved)
Silver (total)
Vanadium (dissolved)
Vanadium (total)
Zinc (dissolved)
Zinc (total)
µg/l µg/l µg/l µg/l µg/l µg/l µg/l µg/l µg/l µg/l µg/l µg/l µg/l µg/l µg/l µg/l µg/l µg/l µg/lJul-15 MW-01-070715 < 15.0 < 15.0 13.6 17.6 22.8 26.8 < 10.0 < 10.0 11.0 11.9 < 10.0 < 15.0 < 15.0 < 5.00 < 5.00 < 10.0 < 10.0 < 10.0 < 10.0Sep-15 MW-01-091415 < 15.0 < 15.0 < 10.0 14.7 25.8 26.1 < 10.0 < 10.0 < 10.0 < 10.0 < 10.0 < 15.0 < 15.0 < 5.00 < 5.00 < 10.0 < 10.0 < 10.0 10.9Jul-15 MW-02-070715 < 15.0 < 15.0 23.3 21.0 19.6 20.2 < 10.0 < 10.0 < 10.0 < 10.0 < 10.0 < 15.0 < 15.0 < 5.00 < 5.00 < 10.0 < 10.0 < 10.0 < 10.0Sep-15 MW-02-091415 < 15.0 < 15.0 < 10.0 < 10.0 19.6 19.1 < 10.0 < 10.0 < 10.0 < 10.0 < 10.0 < 15.0 < 15.0 < 5.00 < 5.00 < 10.0 < 10.0 < 10.0 15.9Jul-15 MW-03-070715 < 15.0 < 15.0 20.5 20.1 < 10.0 < 10.0 < 10.0 < 10.0 < 10.0 < 10.0 < 10.0 < 15.0 < 15.0 < 5.00 < 5.00 < 10.0 < 10.0 < 10.0 < 10.0Sep-15 MW-03-091515 < 15.0 < 15.0 < 10.0 12.1 < 10.0 < 10.0 < 10.0 < 10.0 < 10.0 < 10.0 < 10.0 < 15.0 < 15.0 < 5.00 < 5.00 < 10.0 < 10.0 < 10.0 < 10.0Jul-15 MW-04-070615 24.7 J 16.0 J 742 821 10.3 J 24.4 48.2 43.3 430 476 < 10.0 < 15.0 < 15.0 6.80 J < 5.00 J 217 249 < 10.0 24.9 JJul-15 MW-04-070615-DUP 20.3 J < 15.0 J 757 816 < 10.0 J 23.8 36.1 41.8 439 471 < 10.0 < 15.0 < 15.0 7.91 J < 5.00 J 222 248 < 10.0 13.4 JSep-15 MW-04-091515 19.3 16.1 685 691 < 10.0 10.5 15.8 16.4 389 364 < 10.0 < 15.0 < 15.0 < 5.00 < 5.00 189 193 < 10.0 37.3 JSep-15 MW-04-091515-DUP 20.5 15.8 630 670 < 10.0 10.6 14.2 15.3 389 366 < 10.0 < 15.0 < 15.0 < 5.00 < 5.00 191 189 < 10.0 < 10.0 JJul-15 MW-05-070715 < 15.0 < 15.0 707 730 14.3 17.2 50.5 47.3 437 448 < 10.0 < 15.0 < 15.0 5.59 J < 5.00 J 197 208 10.3 37.5Sep-15 MW-05-091515 < 15.0 < 15.0 224 205 < 10.0 < 10.0 < 10.0 < 10.0 204 190 < 10.0 < 15.0 < 15.0 < 5.00 < 5.00 28.1 28.4 < 10.0 89.3Jul-15 MW-06-070615 < 15.0 < 15.0 17.1 18.3 < 10.0 < 10.0 < 10.0 < 10.0 10.4 10.4 < 10.0 < 15.0 < 15.0 < 5.00 < 5.00 < 10.0 < 10.0 < 10.0 < 10.0Sep-15 MW-06-091515 < 15.0 < 15.0 10.7 18.0 < 10.0 < 10.0 < 10.0 < 10.0 < 10.0 < 10.0 < 10.0 16.3 15.4 < 5.00 < 5.00 < 10.0 < 10.0 13.4 31.6Jul-15 MW-07-070615 < 15.0 < 15.0 47.9 48.3 < 10.0 14.2 37.2 J 16.2 J 29.3 30.1 10.5 J+ < 15.0 < 15.0 < 5.00 < 5.00 19.7 21.8 J+ < 10.0 22.6 J+Sep-15 MW-07-091515 < 15.0 < 15.0 < 10.0 14.9 < 10.0 22.7 < 10.0 < 10.0 < 10.0 13.4 < 10.0 < 15.0 < 15.0 < 5.00 < 5.00 < 10.0 < 10.0 < 10.0 25.3Jul-15 MW-08-070715 < 15.0 < 15.0 < 10.0 11.2 22.6 26.9 < 10.0 < 10.0 < 10.0 < 10.0 < 10.0 < 15.0 < 15.0 < 5.00 < 5.00 < 10.0 < 10.0 13.6 J < 10.0 JSep-15 MW-08-091415 < 15.0 < 15.0 14.0 15.8 28.6 29.6 < 10.0 < 10.0 < 10.0 < 10.0 < 10.0 < 15.0 < 15.0 < 5.00 < 5.00 < 10.0 < 10.0 < 10.0 < 10.0Jul-15 MW-09-070715 < 15.0 < 15.0 47.2 50.6 44.2 43.2 < 10.0 < 10.0 77.4 87.8 < 10.0 < 15.0 < 15.0 < 5.00 < 5.00 < 10.0 < 10.0 < 10.0 < 10.0Sep-15 MW-09-091515 < 15.0 < 15.0 49.0 50.9 50.5 49.4 < 10.0 < 10.0 97.1 91.3 < 10.0 < 15.0 < 15.0 < 5.00 < 5.00 < 10.0 < 10.0 16.8 18.1
6.0 6.0 10 10 1,000 1,000 1,300 1,300 nl nl 100 50 50 nl nl nl nl nl nlNotes:
Groundwater samples were analyzed for CAM 17 Metals by Eurofins Calscience Enviromental Laboratories, in Garden Grove, California. Samples were analyzed using EPA Methods 6010B and 7470A. Only detected metals shown in this table. Other metals were not detected above the laboratory Minimum Reporting Limit. Shaded cells represent an exceedence of the listed maximum contaminant level.
<x.xx: Indicates sample result was less than laboratory minimum reporting limit. ft bgs: Feet below ground surface
µg/l: micrograms per literRSL: United States Environmental Protection Agency Regional Screening Level.
nl: not listedJ: Estimated concentration.
J+: Estimated concentration based on data validation## Concentration is above the Maximum Contaminant Level (MCL)
MW-03
Location Date Sampled Sample ID
MW-01
MW-02
2015 Cal EPA MCL
MW-04
MW-05
MW-06
MW-07
MW-08
MW-09
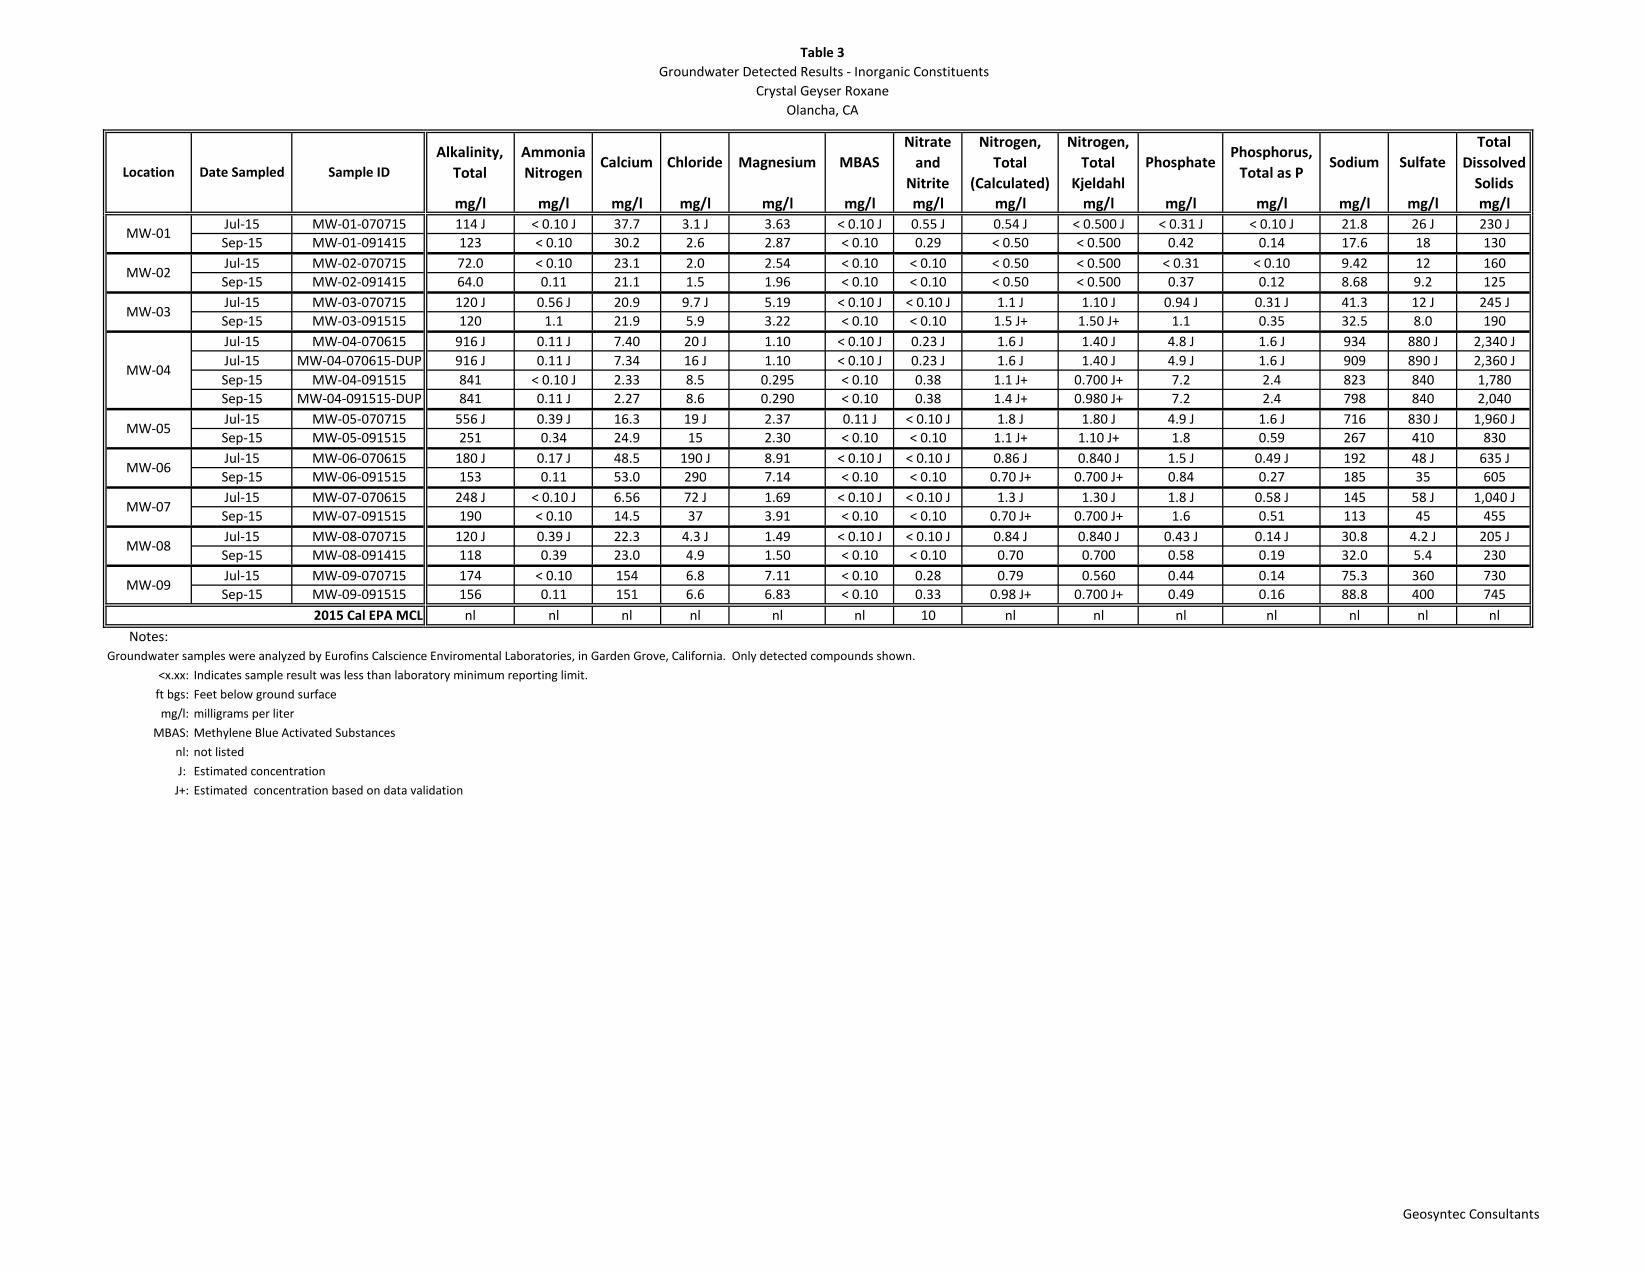
Table 3 Groundwater Detected Results - Inorganic Constituents
Crystal Geyser RoxaneOlancha, CA
Geosyntec Consultants
Alkalinity, Total
Ammonia Nitrogen
Calcium Chloride Magnesium MBASNitrate
and Nitrite
Nitrogen, Total
(Calculated)
Nitrogen, Total
KjeldahlPhosphate
Phosphorus, Total as P
Sodium SulfateTotal
Dissolved Solids
mg/l mg/l mg/l mg/l mg/l mg/l mg/l mg/l mg/l mg/l mg/l mg/l mg/l mg/lJul-15 MW-01-070715 114 J < 0.10 J 37.7 3.1 J 3.63 < 0.10 J 0.55 J 0.54 J < 0.500 J < 0.31 J < 0.10 J 21.8 26 J 230 JSep-15 MW-01-091415 123 < 0.10 30.2 2.6 2.87 < 0.10 0.29 < 0.50 < 0.500 0.42 0.14 17.6 18 130Jul-15 MW-02-070715 72.0 < 0.10 23.1 2.0 2.54 < 0.10 < 0.10 < 0.50 < 0.500 < 0.31 < 0.10 9.42 12 160Sep-15 MW-02-091415 64.0 0.11 21.1 1.5 1.96 < 0.10 < 0.10 < 0.50 < 0.500 0.37 0.12 8.68 9.2 125Jul-15 MW-03-070715 120 J 0.56 J 20.9 9.7 J 5.19 < 0.10 J < 0.10 J 1.1 J 1.10 J 0.94 J 0.31 J 41.3 12 J 245 JSep-15 MW-03-091515 120 1.1 21.9 5.9 3.22 < 0.10 < 0.10 1.5 J+ 1.50 J+ 1.1 0.35 32.5 8.0 190Jul-15 MW-04-070615 916 J 0.11 J 7.40 20 J 1.10 < 0.10 J 0.23 J 1.6 J 1.40 J 4.8 J 1.6 J 934 880 J 2,340 JJul-15 MW-04-070615-DUP 916 J 0.11 J 7.34 16 J 1.10 < 0.10 J 0.23 J 1.6 J 1.40 J 4.9 J 1.6 J 909 890 J 2,360 JSep-15 MW-04-091515 841 < 0.10 J 2.33 8.5 0.295 < 0.10 0.38 1.1 J+ 0.700 J+ 7.2 2.4 823 840 1,780Sep-15 MW-04-091515-DUP 841 0.11 J 2.27 8.6 0.290 < 0.10 0.38 1.4 J+ 0.980 J+ 7.2 2.4 798 840 2,040Jul-15 MW-05-070715 556 J 0.39 J 16.3 19 J 2.37 0.11 J < 0.10 J 1.8 J 1.80 J 4.9 J 1.6 J 716 830 J 1,960 JSep-15 MW-05-091515 251 0.34 24.9 15 2.30 < 0.10 < 0.10 1.1 J+ 1.10 J+ 1.8 0.59 267 410 830Jul-15 MW-06-070615 180 J 0.17 J 48.5 190 J 8.91 < 0.10 J < 0.10 J 0.86 J 0.840 J 1.5 J 0.49 J 192 48 J 635 JSep-15 MW-06-091515 153 0.11 53.0 290 7.14 < 0.10 < 0.10 0.70 J+ 0.700 J+ 0.84 0.27 185 35 605Jul-15 MW-07-070615 248 J < 0.10 J 6.56 72 J 1.69 < 0.10 J < 0.10 J 1.3 J 1.30 J 1.8 J 0.58 J 145 58 J 1,040 JSep-15 MW-07-091515 190 < 0.10 14.5 37 3.91 < 0.10 < 0.10 0.70 J+ 0.700 J+ 1.6 0.51 113 45 455Jul-15 MW-08-070715 120 J 0.39 J 22.3 4.3 J 1.49 < 0.10 J < 0.10 J 0.84 J 0.840 J 0.43 J 0.14 J 30.8 4.2 J 205 JSep-15 MW-08-091415 118 0.39 23.0 4.9 1.50 < 0.10 < 0.10 0.70 0.700 0.58 0.19 32.0 5.4 230Jul-15 MW-09-070715 174 < 0.10 154 6.8 7.11 < 0.10 0.28 0.79 0.560 0.44 0.14 75.3 360 730Sep-15 MW-09-091515 156 0.11 151 6.6 6.83 < 0.10 0.33 0.98 J+ 0.700 J+ 0.49 0.16 88.8 400 745
nl nl nl nl nl nl 10 nl nl nl nl nl nl nlNotes:
Groundwater samples were analyzed by Eurofins Calscience Enviromental Laboratories, in Garden Grove, California. Only detected compounds shown.<x.xx: Indicates sample result was less than laboratory minimum reporting limit.
ft bgs: Feet below ground surfacemg/l: milligrams per liter
MBAS: Methylene Blue Activated Substancesnl: not listedJ: Estimated concentration
J+: Estimated concentration based on data validation
MW-03
Location Date Sampled Sample ID
MW-01
MW-02
2015 Cal EPA MCL
MW-04
MW-05
MW-06
MW-07
MW-08
MW-09

Table 4 Groundwater Detected Results - Total and Fecal Coliform
Crystal Geyser RoxaneOlancha, CA
Geosyntec Consultants
Fecal Coliform Total ColiformMPN/100 ml MPN/100 ml
Jul-15 MW-01-070715 < 2.0 R 2.0 JSep-15 MW-01-091415 < 2.0 < 2.0Jul-15 MW-02-070715 < 2.0 R < 2.0 RSep-15 MW-02-091415 < 2.0 30Jul-15 MW-03-070715 < 2.0 R 2.0 JSep-15 MW-03-091515 < 2.0 23Jul-15 MW-04-070715 < 2.0 R < 2.0 RSep-15 MW-04-091515 < 2.0 < 2.0Sep-15 MW-04-091515-DUP < 2.0 < 2.0Jul-15 MW-05-070715 < 2.0 R 2.0 JSep-15 MW-05-091515 < 2.0 < 2.0Jul-15 MW-06-070715 < 2.0 R < 2.0 RSep-15 MW-06-091515 < 2.0 < 2.0Jul-15 MW-07-070615 2.0 J 2.0 JSep-15 MW-07-091515 < 2.0 23Jul-15 MW-08-070715 < 2.0 R 2.0 JSep-15 MW-08-091415 < 2.0 2.0Jul-15 MW-09-070715 < 2.0 R < 2.0 RSep-15 MW-09-091515 8.0 8.0
Notes:Samples analyzed by BC Laboratories, Inc.
<x.xx: Indicates sample result was less than laboratory minimum reporting limit. MPN/100ml: Most probable number per 100 milliliters.
J: Estimated concentrationR: Data rejected due to data quality issues.
MW-09
Location Date Sampled Sample ID
MW-01
MW-02
MW-03
MW-04
MW-05
MW-06
MW-07
MW-08

Table 5 Waste Water Sample Results - Detected Metals
Crystal Geyser RoxaneOlancha, CA
Geosyntec Consultants
Olancha North Waste Water During Production 2014-08-18 OL3P 1.6 1.8 2.8 3.6 5.4 6.3 ND < 0.50 ND < 0.50 ND < 1.0 ND < 1.0 ND < 2.0 ND < 2.0 ND < 0.50 7.1 6.8 ND < 5.0 ND < 3.0 ND < 3.0 ND < 20 ND < 20
Olancha North Waste Water during Sanitation 2014-12-15 East Pond San ND < 1.0 ND < 1.0 12 17 9.3 10 ND < 0.50 ND < 0.50 ND < 1.0 2.0 14 16 ND < 0.50 3.7 J 5.2 ND < 5.0 ND < 3.0 ND < 3.0 33 41
East Pond, Point of Discharge during Production 2014-08-27 PP INLET 1.0 1.1 18 17 7.4 7.3 ND < 0.50 ND < 0.50 ND < 1.0 ND < 1.0 16 20 ND < 0.50 6.3 7.5 ND < 5.0 3.0 J ND < 3.0 J ND < 20 22
East Pond, Standing Water 2014-12-11 East Pond ND < 1.0 ND < 1.0 9.9 10 9.6 10 ND < 0.50 ND < 0.50 ND < 1.0 ND < 1.0 6.8 8.1 ND < 0.50 4.5 J 4.9 ND < 5.0 ND < 3.0 ND < 3.0 20 25
Olancha South Waste Water during Sanitation 2014-12-17 Fire Pond Sanit. ND < 1.0 1.1 ND < 1.0 3.0 ND < 2.0 55 ND < 0.50 ND < 0.50 ND < 1.0 1.4 ND < 2.0 21 ND < 0.50 ND < 2.0 ND < 2.0 ND < 5.0 ND < 3.0 4.0 ND < 20 41
Fire Pond, Standing Water 2014-12-11 Fire Pond ND < 1.0 ND < 1.0 2.6 J 1.4 J 17 15 ND < 0.50 ND < 0.50 ND < 1.0 ND < 1.0 ND < 2.0 ND < 2.0 ND < 0.50 ND < 2.0 R ND < 2.0 ND < 5.0 ND < 3.0 ND < 3.0 ND < 20 ND < 20
Fire Pond, Overflow 2014-09-03 FP Outlet ND < 1.0 ND < 1.0 ND < 1.0 ND < 1.0 8.0 8.2 ND < 0.50 ND < 0.50 ND < 1.0 ND < 1.0 ND < 2.0 ND < 2.0 ND < 0.50 ND < 2.0 ND < 2.0 ND < 5.0 ND < 3.0 ND < 3.0 ND < 20 ND < 20
6.0 6.0 10 10 1,000 1,000 5.0 5.0 50 50 1,300 1,300 15 NE NE 100 NE NE NE NE
Notes:Samples analyzed by Eurofins Eaton Analytical in Monrovia, CA. Shaded cells indicate detection exceeds the primary California Environmental Protection Agency's Maximum Contaminant Level. NE: A Maximum Contaminant Level has not been estabilished for this element. µg/l: micrograms per litermg/l: milligrams per literJ: Estimated concentration. The analyte was positively identified; the associated numerical value is the approximate concentration of the analyte in the sample.J+: Estimated concentration. The analyte was positively identified; however, the associated numerical value is likely to be higher than the concentration of the analyte in the sample due to positive bias of associated QC or calibration data or attributable to matrix interference. ND < : Analyte not detected above the laboratory minimum reporting limit shown.
Vanadium (total)µg/l
Zinc (dissolved)
µg/l
Zinc (total)µg/l
Sample Location Date Sampled Sample IDMolybdenum
(total)µg/l
Nickel (total)µg/l
Vanadium (dissolved)
µg/l
Copper(dissolved)
µg/l
Copper (total)µg/l
Molybdenum (dissolved)
µg/l
Barium (total)µg/l
Cadmium (dissolved)
µg/l
Cadmium (total)µg/l
Chromium (dissolved)
µg/l
Lead (total)µg/l
Chromium (total)µg/l
Barium (dissolved)
µg/l
Screening Level - 2015 Cal EPA MCL
Antimony(dissolved)
µg/l
Antimony (total)µg/l
Arsenic (dissolved)
µg/l
Arsenic (total)µg/l

Table 6 Waste Water Sample Results - Detected Inorganic Constituents
Crystal Geyser RoxaneOlancha, CA
1 of 2 Geosyntec Consultants
Location Date Sampled Sample IDAlkalinity,
Bicarbonatemg/l
Biochemical Oxygen Demand
mg/l
Calcium Carbonate
mg/l
Calciummg/l
Chemical Oxygen Demand
mg/l
Chloridemg/l
Chlorine, Free Residual
mg/l
Chlorine, Total Residual
mg/l
Dissolved Oxygenmg/l
Magnesiummg/l
Nitrate (as N)mg/l
Nitrogen, Total (Calculated)
mg/l
Nitrogen, Total
Kjeldahlmg/l
Olancha North Waste Water During Production 2014-08-18 OL3P 62 3.5 51 19 7.0 3.0 ND < 0.10 R ND < 0.10 R NA 2.0 0.83 NA ND < 0.20
Olancha North Waste Water during Sanitation 2014-12-15 East Pond San 98 12 J 80 20 57 4.9 ND < 0.10 R ND < 0.10 R 9.0 J 1.9 0.58 1.7 1.1
East Pond Point of Discharge during Production 2014-08-27 PP INLET 120 5.0 J 98 19 15 13 ND < 0.10 R ND < 0.10 R NA 1.7 ND < 0.10 NA 0.26
East Pond, Standing Water 2014-12-11 East Pond 98 7.8 J 80 22 12 4.5 ND < 0.10 R ND < 0.10 R 6.9 J 2.2 0.16 0.50 0.34
Olancha South Waste Water during Sanitation 2014-12-17 Fire Pond Sanit. 34 ND < 3.0 J 28 19 18 2.9 ND < 0.10 R ND < 0.10 R 8.3 J 1.4 4.0 4.0 ND < 0.20
Fire Pond, Standing Water 2014-12-11 Fire Pond 74 ND < 3.0 66 20 ND < 5.0 3.0 ND < 0.10 R ND < 0.10 R 11 J 1.6 ND < 0.10 0.33 0.33
Fire Pond, Overflow 2014-09-03 FP Outlet 62 ND < 3.0 65 18 10 3.2 ND < 0.10 R ND < 0.10 R NA 1.3 ND < 0.10 NA 0.31
Table 6 Waste Water Sample Results - Detected Inorganic Constituents
Crystal Geyser RoxaneOlancha, CA
2 of 2 Geosyntec Consultants
Location Date Sampled Sample IDOrthophosphate
as Pmg/l
pHPhosphorus,
Total as Pmg/l
Sodiummg/l
Specific Conductance
µS/cm
Sulfatemg/l
Surfactantsmg/l
Total Dissolved Solidsmg/l
Total Organic Halides (Average)
µg/l
Total Organic Halides (Rep 1)
µg/l
Total Organic Halides (Rep 2)
µg/l
Total Suspended Solidsmg/l
Olancha North Waste Water During Production 2014-08-18 OL3P 1.7 7.5 2.0 20 210 29 NA NA ND < 10 J ND < 10 J ND < 10 J ND < 10
Olancha North Waste Water during Sanitation 2014-12-15 East Pond San 1.2 7.4 1.9 30 250 34 ND < 0.050 180 12 12 11 ND < 10
East Pond Point of Discharge during Production 2014-08-27 PP INLET 0.15 7.6 0.34 45 330 36 NA NA ND < 10 ND < 10 ND < 10 ND < 10
East Pond, Standing Water 2014-12-11 East Pond 0.50 7.6 0.57 29 250 29 0.18 200 14 15 13 ND < 10
Olancha South Waste Water during Sanitation 2014-12-17 Fire Pond Sanit. 14 6.6 14 24 220 37 3.7 J 170 14 13 15 ND < 10
Fire Pond, Standing Water 2014-12-11 Fire Pond 0.94 9.2 1.1 23 210 28 0.092 140 ND < 10 ND < 10 10 ND < 10
Fire Pond, Overflow 2014-09-03 FP Outlet 0.23 9.9 0.27 25 220 28 NA NA ND < 10 ND < 10 ND < 10 ND < 10
Notes:Samples analyzed by Eurofins Eaton Analytical in Monrovia, CA. µg/l: micrograms per litermg/l: milligrams per literµS/cm: microsiemens per centimeterNA: Not analyzed for this compoundND < 0.10: Data not detected above minimum reporting limit shown. "R" : The sample results are rejected due to serious deficiencies in the ability to analyze the sample and meet quality control criteria. The presence or absence of the analyte cannot be verified.J: Estimated concentration. The analyte was positively identified; the associated numerical value is the approximate concentration of the analyte in the sample.
Table 7Waste Water Results - Total Coliform Bacteria
Crystal Geyser RoxaneOlancha, CA
Geosyntec Consultants
Olancha North Waste Water During Production 2014-08-27 OL3P NAOlancha North Waste Water during Sanitation 2014-12-15 East Pond San 2,420 J
East Pond, Point of Discharge, Production 2014-08-27 PP INLET NAEast Pond, Standing Water 2014-12-11 East Pond 2,420 J
Olancha South Waste Water during Sanitation 2014-12-17 Fire Pond Sanit. 2,400 JFire Pond, Standing Water 2014-12-11 Fire Pond 120 J
Fire Pond, Overflow 2014-09-03 FP Outlet NA
Notes:Samples analyzed by Eurofins Eaton Analytical in Monrovia, CA. MPN/100 ml: Most probable number of colony forming units per 100 milliliters.
NA: Not analyzed for this compound
"R" : The sample results are rejected due to serious deficiencies in the ability to analyze the sample and meet quality control criteria. The presence or absence of the analyte cannot be verified.
J: Estimated concentration. The analyte was positively identified; the associated numerical value is the approximate
Total ColiformMPN/100 ml
Location Date Sampled Sample ID
Table 8 Waste Water Sample Results - Detected Volatile Oganic Compounds
Crystal Geyser Roxane, Olancha, CA
Geosyntec Consultants
Olancha North Waste Water During Production 2014-08-18 OL3P NA ND < 1.0 NA NA
Olancha North Waste Water during Sanitation 2014-12-15 East Pond San 5.6 ND < 1.0 ND < 10 ND < 0.50
East Pond, Point of Discharge, Production 2014-08-27 PP INLET NA ND < 1.0 NA NA
East Pond, Standing Water 2014-12-11 East Pond ND < 5.0 ND < 1.0 ND < 10 ND < 0.50
Olancha South Waste Water during Sanitation 2014-12-17 Fire Pond Sanit. 5.3 ND < 1.0 ND < 10 ND < 0.50
Fire Pond, Standing Water 2014-12-11 Fire Pond ND < 5.0 ND < 1.0 ND < 10 ND < 0.50
Fire Pond, Overflow 2014-09-03 FP Outlet NA ND < 1.0 NA NA
NE NE NE NE
Notes:Samples analyzed by Eurofins Eaton Analytical in Monrovia, CA. NE: A Maximum Contaminant Level has not been estabilished for this element. NA: Not analyzed for this compoundµg/l: micrograms per literJ: Estimated concentration. The analyte was positively identified; the associated numerical value is the approximate concentration of the analyte in the sample.
ND < : Analyte not detected above the laboratory minimum reporting limit shown.
J+: Estimated concentration. The analyte was positively identified; however, the associated numerical value is likely to be higher than the concentration of the analyte in the sample due to positive bias of associated QC or calibration data or attributable to matrix interference.
Acetoneµg/l
cis-1,3-Dichloropropeneµg/l
Acetic acid, dichloro-µg/l
Screening Level - 2015 Cal EPA MCL (µg/l)
Sample Location Date Sampled Sample ID2-butanone (MEK)
µg/l

Oct -15
FIGURES
Site Location MapCrystal Geyser Roxane, Spring Water Bottling Facility
Olancha, California
Figure
1Santa Barbara October 2015
1 0 1 Miles
P:\G
IS\C
ryst
al G
eyse
r\SB0
746\
Pro
ject
s\Fi
g01_
Site
_Loc
atio
n_M
ap.m
xd S
TM 2
0150
804
Sierra NevadaMountains Owens Dry Lake
The Site
Los Angelese Aqueduct
Olancha
Creek
Cartago CreekLosAnge lese Aqueduct
Property Boundary
Legend

Bottling Facility
Fire Pond
Fire Pond Outlet
East Pond
MW-01
MW-02
MW-03
MW-04
MW-05
MW-06
MW-07
MW-08
MW-09
Groundwater Monitoring Well Locations
Crystal Geyser Roxane, Spring Water Bottling Facility Olancha, California
Figure
2Santa Barbara October 2015
400 0 400 Feet
P:\G
IS\C
ryst
al G
eyse
r\SB0
746\
Pro
ject
s\Fi
g03_
Pha
se2_
Bor
ing_
GW
_Wel
l_Lo
catio
ns.m
xd S
TM 2
0150
814
Notes:Notes:
Monitoring Well
Vapor Probe Location
Parcel Boundaries
Legend
NAD_1983_StatePlane_California_IV_FIPS_0404_FeetProjection: Lambert_Conformal_ConicGCS_North_American_1983
Bottling Facility
Fire Pond
Fire Pond Outlet
East Pond
MW-013621.09
MW-023619.78
MW-033603.24
MW-043603.28
MW-053599.86
MW-063602.29
MW-073602.18
MW-083603.33
MW-093602.70
i = 0.006
3,601 3,600
3,6023,603
P:\G
IS\C
ryst
al G
eyse
r\SB
0746
\Pro
ject
s\Fi
g03_
Gro
undw
ater
_Ele
vatio
ns_a
nd_G
radi
ent_
Sep
tem
ber_
2015
.mxd
TC
B 2
0151
015
Notes:Notes:
Monitoring Well
Groundwater Contour
Inferred Groundwater Contour
Approximate Location of SpringLine Fault
Groundwater Gradient
Parcel Boundaries
Groundwater Elevations are feet above mean sea level (ft amsl)NAD_1983_StatePlane_California_IV_FIPS_0404_FeetProjection: Lambert_Conformal_ConicGCS_North_American_1983
3QGWM (September 14-15, 2015) Groundwater Elevations and Gradient
Crystal Geyser Roxane, Spring Water Bottling Facility Olancha, California
Figure
3Santa Barbara October 2015
0 400 800 Feet
Legend

Oct -15
APPENDIX A
TABLE OF WASTE WATER FLOW ESTIMATES

Table X - Summary of Facility Discharges
Location
Flow in gpd Flow in gpy (260 days) Nature of waste water
Concentration in the waste water flow
Frequency Destination
Bag filters / x7 121
31500 Spring water - Every two months
East pond
Imeca filter Purge / x3 18,000 4,680,000 Ozonated water 0.02 to 0.07 ppm
Every hour East pond
Cleaning/sanitation / x3
119 31,000 Ozonated water + (phosphoric acid 2% + caustic soda 3% neutralized)
Both products are mixed and
neutralized
Up to 6 times per year
East pond
Storage tanks Olancha South
5,000 to 25,000 6,500,000 Ozonated water 0.02 to 0.07 ppm
Every week to every day
East pond
Storage tank Olancha North
3,500 to 17,500 4,550,000 Ozonated water 0.02 to 0.07 ppm
Every week to every day
East pond
Ozone generator (#2) 1,440 374,400 Spring water - Every day East pond
Cooling towers (# 12)
23,000 6,000,000 Softened spring water - Every day East pond
Filler # 1 (0.5)
3,000 780,000 Ozonated water 0.02 to 0.07 ppm
Every day East pond
Filler # 3 (1.5 l)
18,000 4,680,000 Ozonated water 0.02 to 0.07 ppm
Every day East pond
Filler # 4 (0.24 l)
12,000 3,120,000 Ozonated water 0.02 to 0.07 ppm
Every day East pond
Filler # 5 (Gallon)
18,000 4,680,000 Ozonated water 0.02 to 0.07 ppm
Every day East pond
Filler # 6 (0.5 l) 6,000 1,560,000 Ozonated water
0.02 to 0.07 ppm
Every day East pond
Filler / x5
Cleaning 100/500 26,000/130,000 Chlorinated water + acidic solution 0.1 g/l of phosphoric acid
Every day East pond
Sanitation 100/500 26,000/130,000 Chlorinated water + quaternary ammonium solution
0.3 mg/l of quaternary ammonium
Every day East pond
Restroom Olancha South - 70,800 Chlorinated water 0.2 to 0.8 ppm Every day Septic tank 1 Restroom Olancha South - 59,400 Chlorinated water 0.2 to 0.8 ppm Every day Septic tank 2
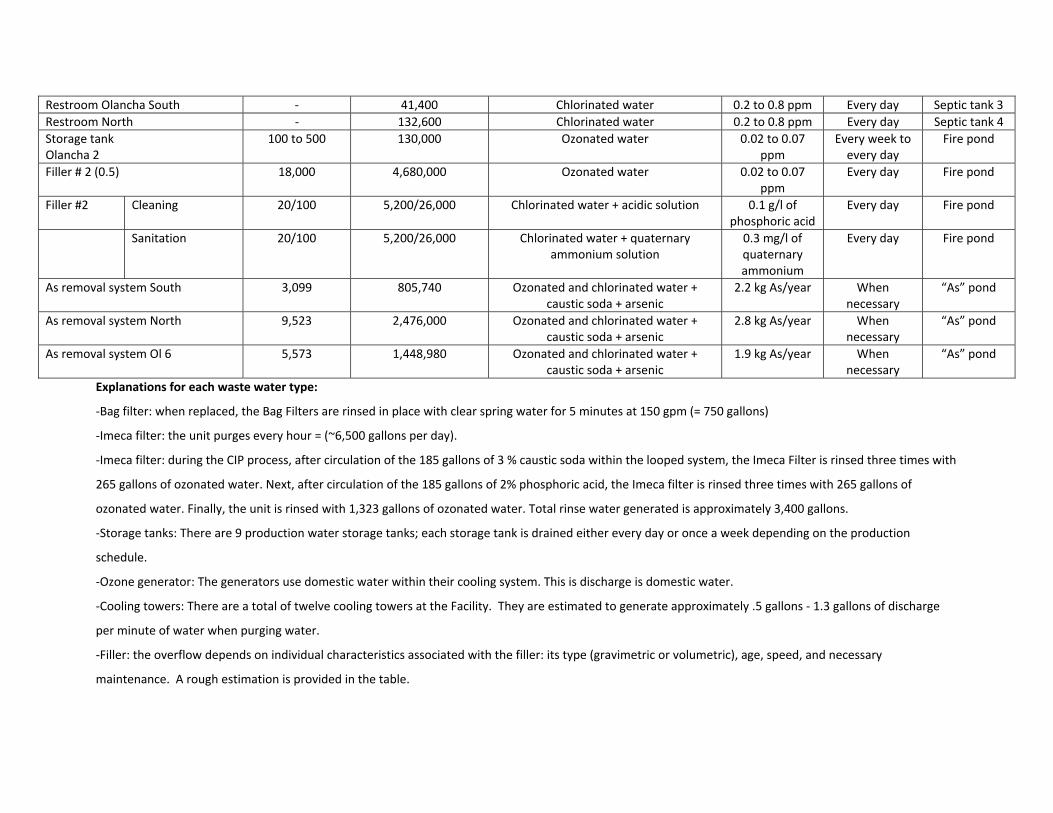
Restroom Olancha South - 41,400 Chlorinated water 0.2 to 0.8 ppm Every day Septic tank 3 Restroom North - 132,600 Chlorinated water 0.2 to 0.8 ppm Every day Septic tank 4 Storage tank Olancha 2
100 to 500 130,000 Ozonated water 0.02 to 0.07 ppm
Every week to every day
Fire pond
Filler # 2 (0.5) 18,000 4,680,000 Ozonated water 0.02 to 0.07 ppm
Every day Fire pond
Filler #2 Cleaning 20/100 5,200/26,000 Chlorinated water + acidic solution 0.1 g/l of phosphoric acid
Every day Fire pond
Sanitation 20/100 5,200/26,000 Chlorinated water + quaternary ammonium solution
0.3 mg/l of quaternary ammonium
Every day Fire pond
As removal system South 3,099 805,740 Ozonated and chlorinated water + caustic soda + arsenic
2.2 kg As/year When necessary
“As” pond
As removal system North 9,523 2,476,000 Ozonated and chlorinated water + caustic soda + arsenic
2.8 kg As/year When necessary
“As” pond
As removal system Ol 6 5,573 1,448,980 Ozonated and chlorinated water + caustic soda + arsenic
1.9 kg As/year When necessary
“As” pond
Explanations for each waste water type:
-Bag filter: when replaced, the Bag Filters are rinsed in place with clear spring water for 5 minutes at 150 gpm (= 750 gallons)
-Imeca filter: the unit purges every hour = (~6,500 gallons per day).
-Imeca filter: during the CIP process, after circulation of the 185 gallons of 3 % caustic soda within the looped system, the Imeca Filter is rinsed three times with
265 gallons of ozonated water. Next, after circulation of the 185 gallons of 2% phosphoric acid, the Imeca filter is rinsed three times with 265 gallons of
ozonated water. Finally, the unit is rinsed with 1,323 gallons of ozonated water. Total rinse water generated is approximately 3,400 gallons.
-Storage tanks: There are 9 production water storage tanks; each storage tank is drained either every day or once a week depending on the production
schedule.
-Ozone generator: The generators use domestic water within their cooling system. This is discharge is domestic water.
-Cooling towers: There are a total of twelve cooling towers at the Facility. They are estimated to generate approximately .5 gallons - 1.3 gallons of discharge
per minute of water when purging water.
-Filler: the overflow depends on individual characteristics associated with the filler: its type (gravimetric or volumetric), age, speed, and necessary
maintenance. A rough estimation is provided in the table.
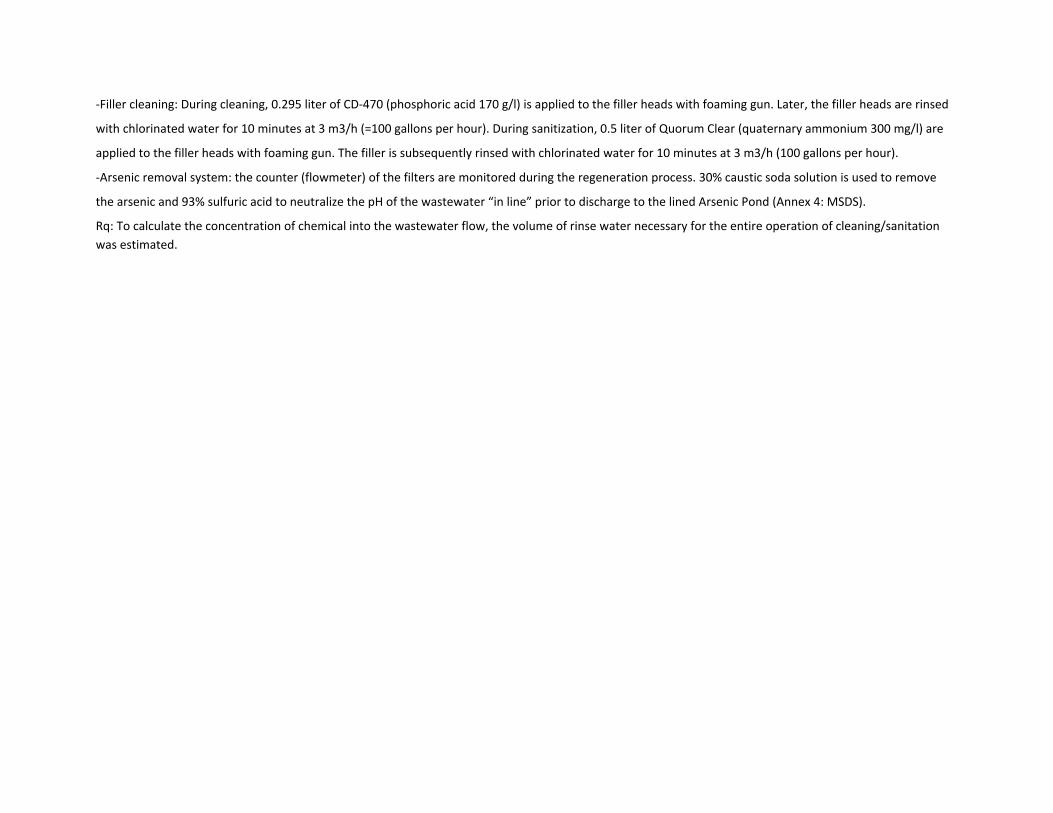
-Filler cleaning: During cleaning, 0.295 liter of CD-470 (phosphoric acid 170 g/l) is applied to the filler heads with foaming gun. Later, the filler heads are rinsed
with chlorinated water for 10 minutes at 3 m3/h (=100 gallons per hour). During sanitization, 0.5 liter of Quorum Clear (quaternary ammonium 300 mg/l) are
applied to the filler heads with foaming gun. The filler is subsequently rinsed with chlorinated water for 10 minutes at 3 m3/h (100 gallons per hour).
-Arsenic removal system: the counter (flowmeter) of the filters are monitored during the regeneration process. 30% caustic soda solution is used to remove
the arsenic and 93% sulfuric acid to neutralize the pH of the wastewater “in line” prior to discharge to the lined Arsenic Pond (Annex 4: MSDS).
Rq: To calculate the concentration of chemical into the wastewater flow, the volume of rinse water necessary for the entire operation of cleaning/sanitation was estimated.
Oct -15
APPENDIX B
PROCESS FLOW DIAGRAMS
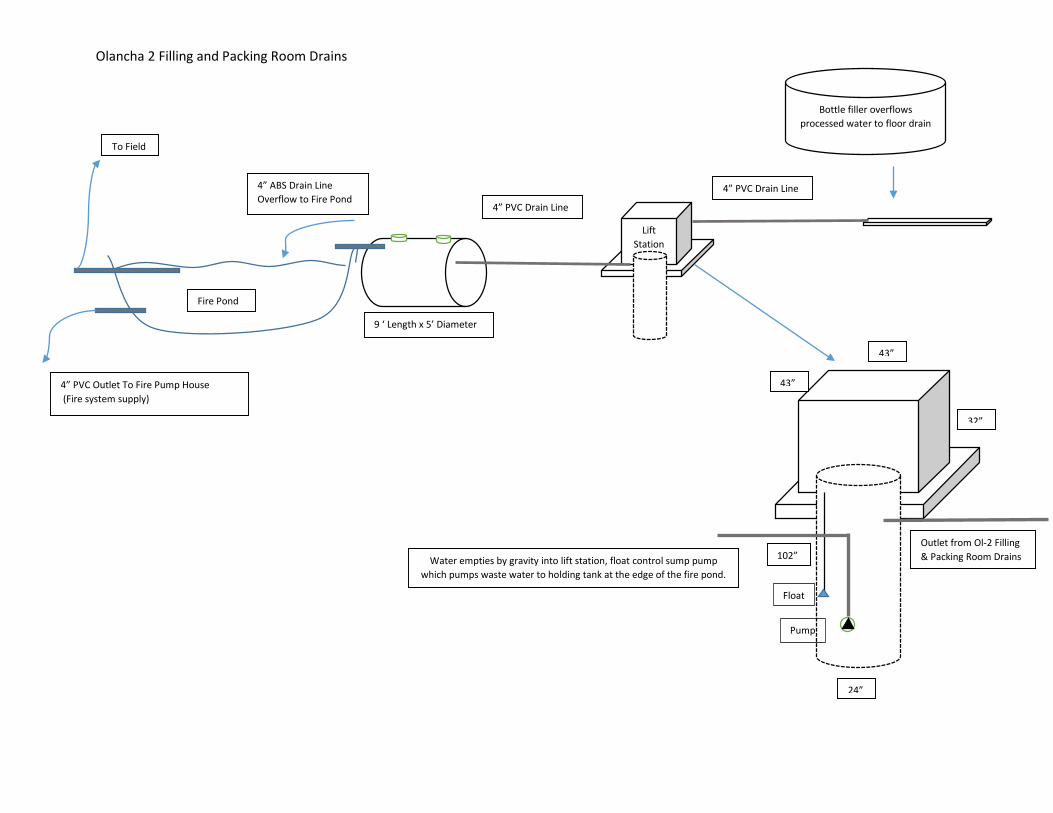
Olancha 2 Filling and Packing Room Drains
Lift Station
Bottle filler overflows processed water to floor drain
Fire Pond
To Field
4” PVC Outlet To Fire Pump House (Fire system supply)
4” ABS Drain Line Overflow to Fire Pond
4” PVC Drain Line
4” PVC Drain Line
Water empties by gravity into lift station, float control sump pump which pumps waste water to holding tank at the edge of the fire pond.
43”
43”
32”
102”
24”
Outlet from Ol-2 Filling & Packing Room Drains
Float Pump
9 ‘ Length x 5’ Diameter

Fire Pump House Drain
Fire Pump House South
1 ½” Fire Pump House Drain Line
Cement Drain Box
24”
24”
24” 8” PVC Drain Line
Empties to 12” Main Drain to East Pond
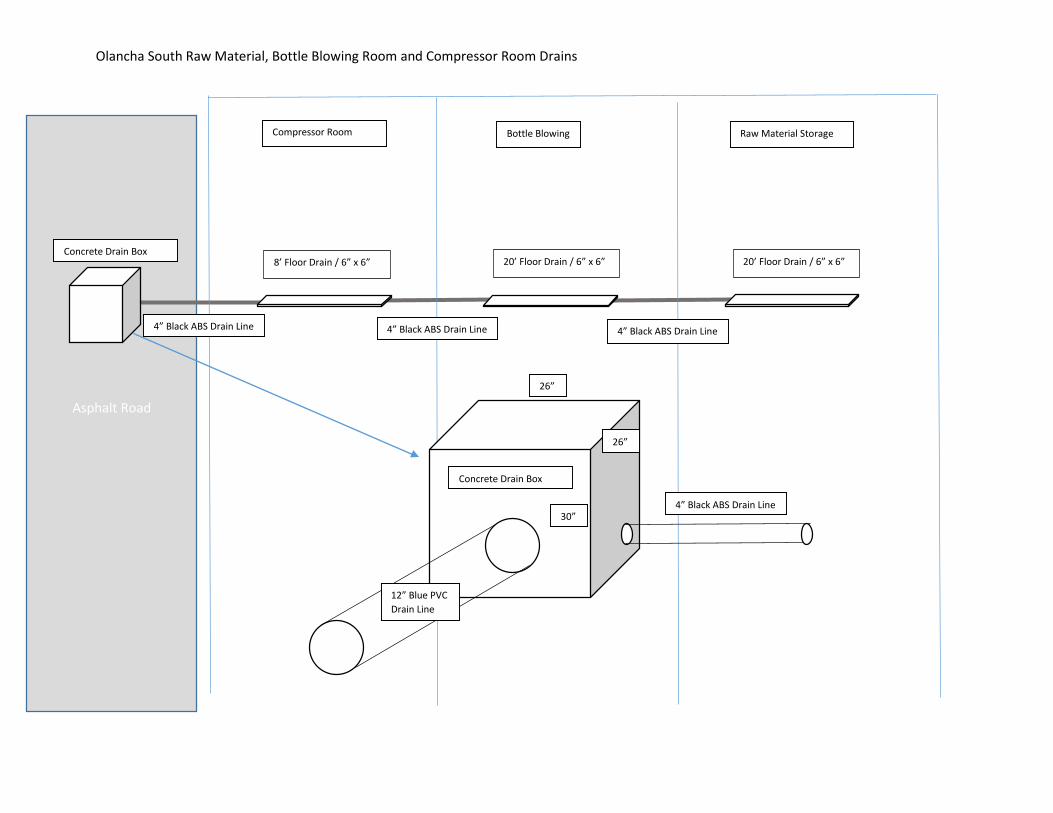
Olancha South Raw Material, Bottle Blowing Room and Compressor Room Drains
Asphalt Road
Raw Material Storage Bottle Blowing Compressor Room
Concrete Drain Box 8’ Floor Drain / 6” x 6” 20’ Floor Drain / 6” x 6” 20’ Floor Drain / 6” x 6”
26”
26”
30”
12” Blue PVC Drain Line
Concrete Drain Box
4” Black ABS Drain Line
4” Black ABS Drain Line 4” Black ABS Drain Line 4” Black ABS Drain Line
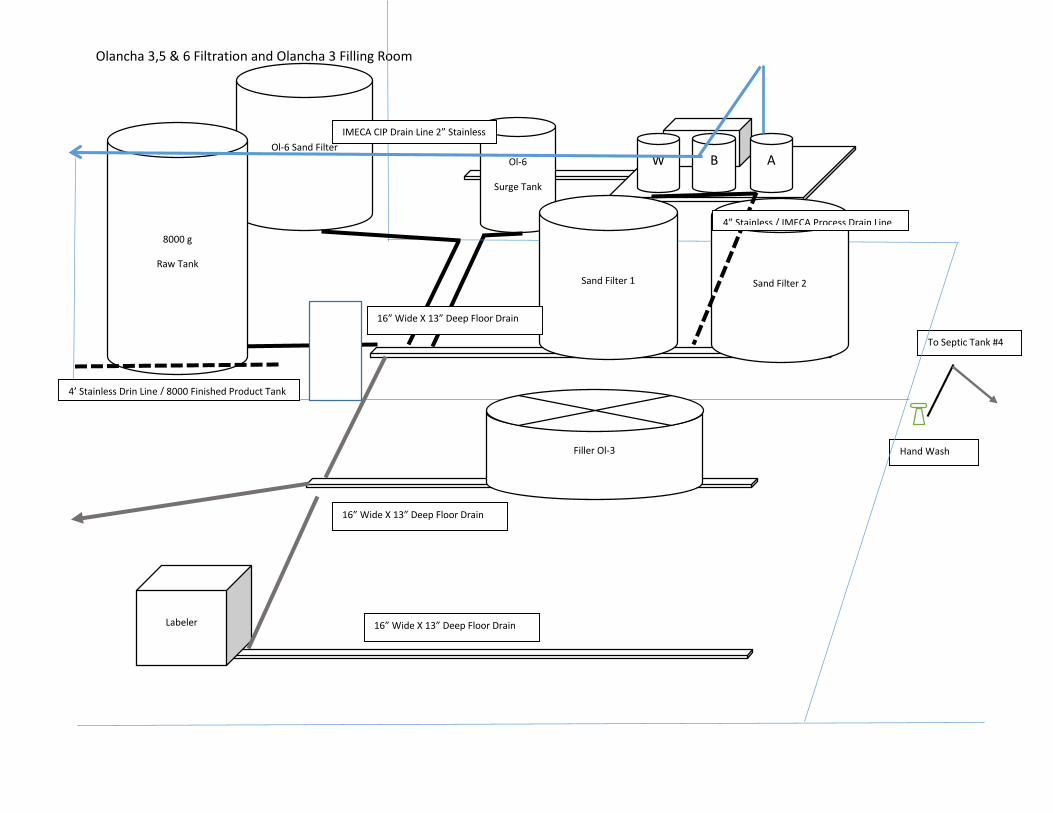
Olancha 3,5 & 6 Filtration and Olancha 3 Filling Room
Hand Wash
To Septic Tank #4
Ol-6 Sand Filter Ol-6
Surge Tank
W B A
Sand Filter 1 Sand Filter 2
Filler Ol-3
Labeler
8000 g
Raw Tank
16” Wide X 13” Deep Floor Drain
16” Wide X 13” Deep Floor Drain
16” Wide X 13” Deep Floor Drain
IMECA CIP Drain Line 2” Stainless
4’ Stainless Drin Line / 8000 Finished Product Tank
4” Stainless / IMECA Process Drain Line

Olancha 1 Production Area Restrooms and Office Restrooms including Laboratory Sink
Men’s Restroom
Olancha 1
Women’s Restroom
Olancha 1 Toilet, Hand Wash Sink & Floor Drain, add urinal for Men’s
Men’s Restroom
Main Office
Women’s Restroom
Main Office
Toilet, Hand Wash Sink & Floor Drain, add urinal for Men’s Restroom
Laboratory Sink
Septic Tank #1
Septic Tank #2
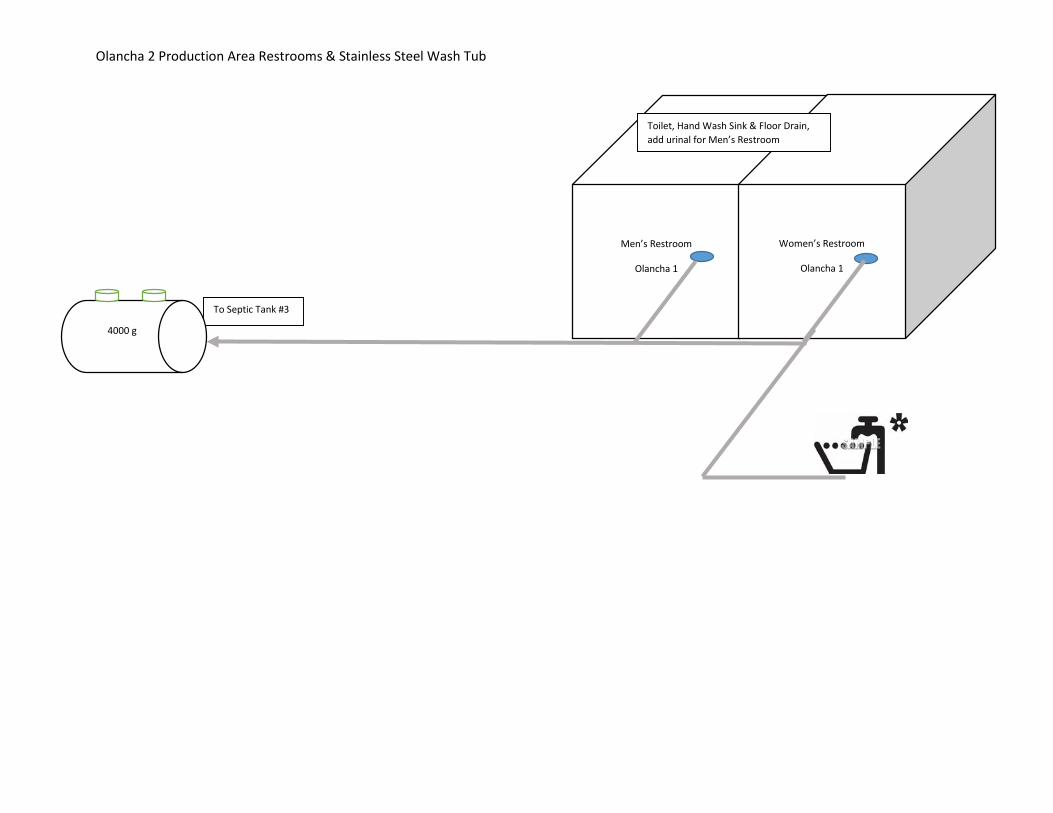
Olancha 2 Production Area Restrooms & Stainless Steel Wash Tub
Men’s Restroom
Olancha 1
Women’s Restroom
Olancha 1
To Septic Tank #3
Toilet, Hand Wash Sink & Floor Drain, add urinal for Men’s Restroom
4000 g

Oct -15
APPENDIX C
SCALED PLOT PLANS