Report No. 48233-BJ Benin Constraints to Growth and ...
207
June 18, 2009 Document of the World Bank Report No. 48233-BJ Benin Constraints to Growth and Potential for Diversification and Innovation Country Economic Memorandum PREM 4 Africa Region Public Disclosure Authorized Public Disclosure Authorized Public Disclosure Authorized Public Disclosure Authorized
Transcript of Report No. 48233-BJ Benin Constraints to Growth and ...

June 18, 2009
Document of the World Bank
Report N
o. 48233-BJ
Benin C
onstraints to Grow
th and Potential for Diversifi cation and Innovation
Report No. 48233-BJ
BeninConstraints to Growth and Potential for Diversifi cation and InnovationCountry Economic Memorandum
PREM 4Africa Region
Pub
lic D
iscl
osur
e A
utho
rized
Pub
lic D
iscl
osur
e A
utho
rized
Pub
lic D
iscl
osur
e A
utho
rized
Pub
lic D
iscl
osur
e A
utho
rized


iii
GPDIA Groupement Professionnel des Distributeurs d’Intrants Agricoles HI Herfindahl Index HIPC Heavily Indebted Poor Countries HIV/AIDS Human Immunodeficiency Virus/Acquired Immune Deficiency Syndrome ICA Investment Climate Assessment IITA International Institue of Tropical Agriculture IMF International Monetary Fund ISRA Senegalese Agriculltural Research Institute ITA Food Technologie Institute KAM Knowledge Assessment Methodology KAM Knowledge Assessment Methodology KEI Knowledge Economy Index LARES Laboratoire d’Analyse Régionale et d’Expertise Sociale LICs Low Income Countries MSTQ Metrology, Standardization, Testing, Quality NERICA New Rice for Africa OPT Office des Postes et Télécommunications PCS Prélèvement Compensatoire de Solidarité PER Public Expenditure Review PPP Public-Private Partnership PREM Poverty Reduction Economic Management PSAOP Programmes des Services Agricoles et appui aux Organisation Paysannes PSO Plan Stratégique Opérationnel RB Renaissance du Bénin RCA Revealed Comparative Advantage REER Real Effective Exchange Rate RS Redevance Statistique SATEC Société d’Assistance Technique et de Coopération SBEE Societé Béninoise de l’Energie Electrique SITEX Société des Industries Textiles du Bénin SMEs Small and Medium Enterprises SOE State Owned Enterprises SONAPRA Société Nationale pour la Promotion Agricole (National Cotton Company) SSA Sub Saharian Countries SSPR Social Structural Policy Review TEC Tarif Extérieur Commun TFP Total Factor Productivity Growth TOF Terms-of-Trade UBF Union pour le Bénin du Futur UDP Union Départementale UNDP United Nations Development Programme VAT Value Added Tax WAEMU West African Economic and Monetary Union WBI World Bank Institute WCA West and Central Africa WTO World Trade Organisation
Vice President : Obiageli K. Ezekwesili
Acting Country Director : Antonella Bassani Sector Director : Sudhir Shetty Sector Manager : Antonella Bassani
Task Team Leader : Bruno Boccara


iv
ACKNOWLEDGEMENTS
This Country Economic Memorandum (CEM) was prepared by a team of World Bank Staff and counterparts in Benin. The structure of the report and topics selected were discussed with the Government of Benin and donor representatives. The World Bank team was composed of Bruno Boccara (Lead Economist, AFTP4 and Task Team Leader), Elena Ianchovichina (Senior Economist, PREMED and lead researcher and author of Chapter 1), Xiao Ye (Economist, AFRCE, Chapter 1), Conrado Garcia Corado (LCRCE, Chapter 1), Steve Golub (Professor Swarthmore and lead researcher and author of Chapter 2), Christophe Yebe Semako (consultant on cotton), Soule Bio Goura (consultant on transit trade), Vandana Chandra (Senior Economist, PREMED and lead researcher and author of Chapter 3, diversification component), Jean-Eric Aubert (Lead Specialist, WBI and lead researcher and author for Chapter 3, innovation component), Jessica Boccardo (consultant on diversification), Justine White (consultant on innovation), Abdou Hanzize Oceni (consultant on diversification and innovation), Philip Keefer (Lead Economist, DEC and lead researcher and author of Chapter 4), and Elisee Soumonni (consultant on political economy).
The report has benefited from the overall guidance of Antonella Bassani (Sector Manager, AFTP4 and Acting Country Director Benin) and of Joseph Baah-Dwomoh (Country Manager Benin), and from comments of peer reviewers Marcelo Giugale (PREM Sector Director, LCR), Dino Merotto (Senior Economist, AFTP2), and Leonard Wantchekon (Professor, New York University). Elianne Tchapda (AFTP4) provided editorial and logistical assistance.


v
Table of Contents
EXECUTIVE SUMMARY ....................................................................................................................ix
1. WHAT ARE THE BINDING CROSS-SECTORAL CONSTRAINTS TO GROWTH IN BENIN?.....................................................................................................................................................1
Economic Overview and Past Trends ...............................................................................1
The Diagnostic Approach .................................................................................................6
Concluding Remarks.......................................................................................................34
2. SPECIFIC CONSTRAINTS IN THE COTTON AND TRANSIT TRADE SECTORS....38
Cotton..............................................................................................................................38
Conclusion and Recommendations .................................................................................54
Benin’s Transit Trade .....................................................................................................55
Conclusion and Recommendations .................................................................................76
3. DIVERSIFICATION AND INNOVATION OPPORTUNITIES IN BENIN......................78
Why Benin Needs to Diversify its Exports ......................................................................79
Structural Transformation – Can Benin Become an Emerging Market by Exporting Unprocessed Cotton?......................................................................................................83
Growth Opportunities Through Agricultural and Natural Resource-Based Diversification.................................................................................................................87
The Product Space Methodology ....................................................................................92
How Far is the Next Tree and How Many are There? ...................................................94
Benin’s Export Potential.................................................................................................97
An Export Diversification Strategy...............................................................................101
Innovation in Benin.......................................................................................................107
Improving the Diversification and Innovation Climate in Benin..................................109
Conclusion and Recommendations ...............................................................................119
4. THE POLITICAL ECONOMY OF GROWTH AND DIVERSIFICATION IN BENIN 121
Voting, Institutions and Growth....................................................................................122
Citizen Information and Growth...................................................................................134
Trust and Attitudes Towards Growth............................................................................136
The Policy Consequences of Political Market Imperfections in Benin.........................138
Conclusion and Recommendations ...............................................................................144
REFERENCES.....................................................................................................................................173

vi
List of Appendices Appendix 1: Methodological Note.............................................................................................. 147
Appendix 2: Growth Accounting Technique ............................................................................. 149
Appendix 3: Product Space Definitions...................................................................................... 150
Appendix 4: Detailed Product Matrix......................................................................................... 155
Appendix 5: Overview of Selected Production Activities.......................................................... 159
Appendix 6: Benchmarking Benin’s Innovation Potential ......................................................... 169
List of Tables Table 1.1: Industry Composition of Total Value Added in Benin at Constant, Producer Prices (Factor Cost) ................................................................................................................................... 2
Table 1.2: Real, Annual GDP Growth Rates .................................................................................. 6
Table 1.3: Gross Capital Formation, National and Foreign Savings .............................................. 8
Table 1.4: Foreign Aid, FDI, and Private Investment..................................................................... 9
Table 1.5: External Debt, Concessional Debt and Short-Term Debt............................................ 10
Table 1.6: Real Cost of Capital in Benin ...................................................................................... 11
Table 1.7: Benin Microfinance Institutions – Selected Statistics, 1998-2002.............................. 14
Table 1.8: Sensitivity Analysis of TP Growth in 2006................................................................. 16
Table 1.9: Industries’ Contribution to Real Growth in Benin (Percentage Points) ...................... 16
Table 1.10: Export Composition (percent of Gross Exports) ....................................................... 17
Table 1.11: Composition of Raw Material Exports (% of Raw Material Exports) ...................... 18
Table 1.12: School Indicators, most Recent Data for the Period 2000-06 ................................... 20
Table 1.13: School and Health Indicator Trends .......................................................................... 20
Table 1.14: Agricultural Production and Yields ........................................................................... 22
Table 1.15: Pressure on Land by Region, 1990-2005................................................................... 22
Table 1.16: Share of Firms Reporting Loss Due to Limited Supply of Electricity and Water..... 23
Table 1.17: Infrastructure Indicators............................................................................................. 24
Table 1.18: Paying Taxes, 2008.................................................................................................... 28
Table 1.19: Benin Paying Taxes ................................................................................................... 28
Table 1.20: Nominal and Applied Tariffs Rates, 2004................................................................. 29
Table 1.21: Governance Indicators, Benin, 2006 ......................................................................... 30
Table 1.22: Governance Indicators, benin .................................................................................... 31
Table 1.23: Enforcing Contracts, 2008 ......................................................................................... 32
Table 1.24: Measuring “Innovation” Effort in Benin ................................................................... 33
Table 2.1: Benin’s Official Trade: Imports, Exports, Re-exports and Transit (Percentage of GDP)....................................................................................................................................................... 57
Table 2.2: Selected Import Barriers in Nigeria, 1995-2007 (Tariff rates in percent or bans) ...... 65
Table 2.3: Nigerian Import Prohibition List (2007)...................................................................... 66
Table 2.4: Imports and Duties Paid by Selected Re-Export Items (Billion CFA Francs) ........... 71
Table 3.1: Export Concentration in Top 5 Products ..................................................................... 82
Table 3.2: PRODY’s for Exports of Selected Countries .............................................................. 91
Table 3.3: RCA of Benin’s Exports by Categories....................................................................... 97
Table 3.4: Sample Matrix of Benin Exports Organized by RCA in 1980-04 and 2001-05.......... 98
Table 3.5: Partial Matrix of Possible Key Constraints in High Priority Sub-Sectors................. 101

vii
Table 3.6a – c: Teething Problems – Benin’s Densities in Emerging Champion and Classics are Low and have Risen Sluggishly.................................................................................................. 104
Table 3.7a – b: Unlike Benin, Tanzania’s Higher and Rapidly Rising Densities in Many Products have Made Diversification Easier............................................................................................... 105
Table 3.8: Role of Innovation and Related Policies in the Diversification of the Beninese Economy ..................................................................................................................................... 109
List of Figures Figure 1.1: Benin’s GDP Per Capita and Annual Growth, 1972-2006........................................... 1
Figure 1.2: GDP and Employment Sectors Shares, Benin.............................................................. 2
Figure 1.3: Non-Oil Herfindahl Index for Countries in SSA.......................................................... 3
Figure 1.4: Degree of Export Diversification ................................................................................. 4
Figure 1.5: Growth Record, a Comparison of Benin, SSA and LICS ............................................ 5
Figure 1.6: Growth Diagnostic Tree ............................................................................................... 7
Figure 1.7: Real Cost of Capital ................................................................................................... 12
Figure 1.8: Annual Inflation and Average risk Premiums in Benin ............................................. 12
Figure 1.9: Access to Capital in Benin, 2004 ............................................................................... 13
Figure 1.10: Growth Accounting, Benin....................................................................................... 15
Figure 1.11: TFP and Factor Accumulation Trends, Benin.......................................................... 15
Figure 1.12: Benin’s Terms of Trade............................................................................................ 16
Figure 1.13: Metals and Minerals Index, 2000=100..................................................................... 17
Figure 1.14: Volume of Transactions in the Port of Cotonou (1000 Tons).................................. 19
Figure 1.15: Average Annual Inflation Rates, Benin ................................................................... 25
Figure 1.16: Benin Monetary Developments, 2000-06 (Billion of CFA Francs)......................... 26
Figure 1.17: Real Effective Exchange Rate, Benin (2000=100) .................................................. 27
Figure 2.1: Benin Cotton Production, Acreage, and Yield (1961-62 crop year = 1 ..................... 41
Figure 2.2: World Real Cotton Price, in US Dollars (Deflated by US Manufacturing Deflator .. 41
Figure 2.3: Export Prices and Producer Prices in Benin, in CFA francs ...................................... 42
Figure 2.4: Producer Price as a Percent of Export Price for Benin’s Cotton................................ 42
Figure 2.5: Organization of Cotton Production in Benin.............................................................. 48
Figure 2.6: Exports and Imports of Goods and Services, as a Percent of GDP, 2005.................. 56
Figure 3.1: Benin - Richer Until the Mid -1980s, Among the Poorest Now ................................ 79
Figure 3.2: In most Low Income Developing Countries, the Ratio of Exports to GDP and Per Capita Incomes grow in Tandem .................................................................................................. 80
Figure 3.3: The Levels of Export Concentration (Measured with the Herfindahl Index) Continue to be High in SSA’s Leading Cotton Exporters............................................................................ 84
Figure 3.4: The Relationship between Diversification and Economic Development is not straightforward.............................................................................................................................. 85
Figure 3.5: Between 1990-95 and 2000-04, most Regions Diversified from Primary or Natural Resource-based Exports towards Low, Medium or High Tech Manufactures – SSA without South Africa was an Exception..................................................................................................... 86
Figure 3.6: Bangladesh and Vietnam are Far more Diversified and Export more Sophisticated Products Compared to most SSA Exporters Including Benin ...................................................... 86
Figure 3.7: The PRODY of Primary and Natural Resource-Based Products can also be High ... 88

viii
Figure 3.8: The Number of Products in Which Benin Has a RCA has barely Changed Since the 1980s ............................................................................................................................................. 89
Figure 3.9: EXPY Trends in Benin and its Regional and International Comparators.................. 90
Figure 3.10: Modified Illustration of the Product Space .............................................................. 92
Figure 3.11a – c: From Classic Trees, Beninese Exporters Jumped to Several Emerging Champions with a Decade Future Options Include Several other Unoccupied Trees with Higher PRODYs ....................................................................................................................................... 96
Figure 3.12: A Diagram on Benin’s National Agricultural Innovation Infrastructure ............... 113
List of Boxes Box 2.1: Typology of Cotton Sectors in Africa............................................................................ 44
Box 2.2: The Emergence of Private Cotton-Sector Entrepreneurs: The Case of Patrice Tallon .. 49
Box 2.3: Trade in Used Cars ........................................................................................................ 72
Box 2.4: Petroleum Product Imports from Nigeria....................................................................... 74
Box 2.5: Transitioning from Re-exports to Local Production: The Case of Agrisatch ................ 76
Box 3.1: Benin’s Professional Qualification Certificates («Certificats de Qualification Professionnelle – CQP »)............................................................................................................ 113
Box 3.2: Enhancing the Capacities of Rural Producer Organization – The Case of the PSAOP Project in Senegal ....................................................................................................................... 116
IBRD Map No.
ix
EXECUTIVE SUMMARY
Motivation and objectives
With favorable geographical location, macroeconomic stability, debt reduction, progress on structural reforms, and political stability, Benin would seem to have the foundations for a dynamic, diversified economy. Yet the country’s economic structure has not evolved, remaining highly dependent on cotton and transit trade, and per-capita growth has slowed down in recent years.
The government has requested the World Bank’s assistance in understanding the constraints to growth and evaluating the country’s potential for diversification and innovation as it seeks to lead the country to emerging market status by 2020. The government is well aware that the vulnerabilities associated with the country’s dependence on cotton and transit trade impede the attainment of this goal.
In response to the government’s request, the objective of the Benin Country Economic Memorandum (CEM) is therefore to identify and analyze the key economic and institutional constraints to growth, including through diversification and innovation. The CEM contains four main chapters, each providing theoretical or empirical analyses of Benin’s economic situation and prospects:
1) Cross-Sectoral Binding Constraints to Growth. A growth diagnostic analysis following the Hausmann, Rodrik, Velasco (HRV) (2005) methodology identifies the most binding cross-sectoral constraints to growth. The HRV framework can help policymakers prioritize and sequence reforms to promote growth.
2) Analysis of Specific Constraints in the Cotton and Transit Trade Sectors. In addition to the above cross-sectoral constraints, the CEM points to the need to address sector specific constraints to support more dynamic economic growth. Specifically, the report features a new in-depth analysis of the performance of the economy’s two main sectors, cotton and transit trade, as a way to understand the obstacles to a more sustainable and diversified economy. In the case of cotton, the focus is on explaining the difficulties following market reforms, whereas in the case of transit trade, the chapter sheds new light on these poorly understood parallel trading circuits.
3) Diversification and Innovation Potential. The scope for diversification is assessed with the analytical methods developed by Hausmann, Hwang and Rodrik (2008) (HHR) and Hausmann and Klinger (2007) (HK) for identifying promising new exports and their spillover effects on further diversification and growth. The chapter also analyzes the innovation potential in Benin, since it is a foundation for diversification.

x
4) Political economy of growth. The political economy chapter combines novel analytic approaches (Keefer 2007a, 2007b, 2007c) with recently-available survey data to analyze why Benin’s seemingly well-functioning democracy has yet to provide the political foundations for growth-promoting policies.
Background on Benin
Located in West Africa, next to Nigeria, Benin is a small low-income country with a population of approximately 8.5 million and a per capita income of US$540 in 2006. Benin is a member of the West African Economic and Monetary Union (WAEMU), a group of seven Francophone countries and Guinea Bissau, sharing a common currency, the CFA Franc, and of the Economic Community of West African States (ECOWAS). Benin is heavily influenced by its large neighbor Nigeria.
Benin has achieved a successful transition since 1989 from a Marxist-Leninist state towards a pluralist democracy and a market economy. Following the 1989 fundamental political change, the country has enjoyed relative political stability. Democracy has been strengthened with presidential elections and peaceful transfers of power regularly taking place. Important economic reforms were also undertaken, including macroeconomic stabilization, trade liberalization, and divestiture of state-owned enterprises. As a result, economic performance improved markedly following the end of the Marxist regime, with real GDP growth rising by an annual average of 4.4 percent during 1990-2006 compared to 3.0 percent in 1972-1989 and becoming much less volatile. Real per capita GDP growth correspondingly also rose by more than 1 percent annually during this period after having stagnated during the Marxist regime.
Despite this progress, significant challenges remain:
• Benin’s economic growth in 1990-2006 does not compare favorably to that of the better performers in Sub-Saharan Africa and total factor productivity has sharply decreased in recent years. Furthermore, economic growth has slowed in recent years (3.3 percent in 2002-2006 from 4.3 percent in 1991-1996 and 4.9 percent during 1997-2001).
• The economy remains dependent on two sectors, cotton and transit trade, which suffer from serious vulnerabilities. In 2004, the 5 largest exports accounted for 87 percent of Benin’s merchandise exports, with cotton alone representing 59 percent. Moreover, export diversification has declined over the years.
• The business environment is unfavorable in important respects for formal production and trade. Outside of cotton and transit trade, export-oriented enterprises are scarce despite preferential access to developed-country markets and likely comparative advantages in various raw and processed agricultural products.
The deceleration of growth largely due to the difficulties of the cotton and re-export sectors in the last few years have underlined the urgency of deepening reforms but corruption remains endemic and reforms are opposed by powerful special interest groups. Implementation of structural reforms slowed in recent years and in some cases even

xi
reversed. Even in areas where reforms seemed to succeed, the political economy environment allowed special interests to undermine such reforms.
Economic constraints: Growth Diagnostics
This chapter investigates the key constraints holding back Benin’s economic development following the Hausmann, Rodrik, Velasco (HRV) (2005) methodology. An exercise in growth diagnostics consists of reviewing and analyzing factors identified along the branches of the growth diagnostic tree in order to ascertain which of these factors are most binding for growth (see the Growth Diagnostics tree below). In applying the growth diagnostic methodology to the case of Benin both direct and indirect evidence and international comparisons are employed to identify “bottlenecks” to economic growth. It should be noted that the fact that a constraint is not considered to be binding does not imply that there is no unfinished reform agenda in the corresponding area. Constraints that are not binding today are likely to become binding in the future as the economy expands and hits successive bottlenecks.
Growth Diagnostic Tree for Benin
Low levels of private investment and entrepreneurship
Low return to economic activity
High cost of finance
Bad international
financeBad local finance
Low social returns Low appropriability
Governmentfailures
Micro risks: property rights,
corruption, taxesMacro risks:
financial monetary, fiscal
instability
Marketfailure
Information externalities
“self-discovery”
Coordination externalities
Low domestic
saving
Poor intermediation
Bad infrastructure
Poor geography
Low human capital
Gross domestic investment in Benin has been low by international standards at about 18 percent of GDP. The average investment-to-GDP ratio in the past ten years was comparable to the average investment ratio in WEAMU, ECOWAS and other HIPCs but was lower than in LICs, and the well performing economies in Africa and elsewhere. The lack of diversification and innovation analyzed in Chapter 3 also testify to problems of entrepreneurship.
As the growth diagnostic tree illustrates, Benin’s low private-sector dynamism is not due primarily to lack of access to or high cost of finance (this eliminates the bad international finance’, ‘low domestic saving’, and ‘poor intermediation’ nodes as current

xii
binding constraints). Net bank credit to the government has declined while growth of credit to the private sector has remained at nearly 10 percent per year, with some shift towards longer term credit and lending to non-trade services, especially telecommunications. Benin’s external debt burden is much lower than the averages for WAEMU, ECOWAS and LICs as the country benefited from the debt relief under the HIPC Initiative and MDRI. A large share of Benin’s external debt is concessional and only a negligible share of Benin’s external debt is short term. The real cost of credit has been low at about 3-5 percent recently.
Thus, low returns to economic activities appear to be the main reason for the low private investment in Benin. In recent years total factor productivity declined suggesting that Benin uses its human and physical capital inefficiently. Low returns are not due to macroeconomic instability, given that fiscal and monetary policies have been prudent. Monetary policy is constrained by the WAEMU regional central bank’s policy of pegging the CFAF to the Euro, fiscal deficits are sustainable, and inflation has been under 5 percent. Likewise, the analysis rules out geography and human capital as binding constraints. Benin has a well-situated coastal location near Nigeria and a favorable climate for tropical agriculture. Shortage of skilled labor is not rated as a severe obstacle by business surveys and educational indicators have shown significant improvements since 1991.
The conclusions of the analysis are that lack of growth and diversification is instead, using the HRV terminology, a result of four currently most binding cross-sectoral constraints: two reflecting government failures at the microeconomic level, a third one reflecting low social returns because of bad infrastructure, and the fourth reflecting a market failure related to information externalities. These constraints are:
(i) a distortionary and poorly administered tax system, complex and lengthy customs and trade procedures;
(ii) poor government effectiveness, including contract enforcement, weak institutions and corruption;
(iii) costly and unreliable infrastructure services especially electricity, domestic rail and road transport, and communication.
(iv) firms’ failure to adapt technologies available internationally to local conditions and innovate to produce at low enough cost to be profitable and competitive in foreign markets.
In addition, this CEM shows, through the analysis of the cotton and transit trade sectors and the analysis of the political economy of growth and diversification in Benin, how behavioral responses to the existing set of incentives are not conducive to strong growth and that key sectoral specific constraints also affect the growth potential. This does not imply that the cross-sectoral constraints must not be addressed but rather that the behavioral and key sector specific constraints must be addressed simultaneously with the cross-sectoral ones.

xiii
Evaluation of specific constraints in the cotton and transit trade sectors
The cross-sectoral constraints highlighted in the previous chapter have played out in the functioning of the two dominant export sectors, cotton and transit trade. However, sectoral specific constraints are also present that limit these sectors’ potential for growth. In addition, both of these sectors, in different ways, illustrate the country’s political economy weaknesses (elaborated further in Chapter 4) and institutional constraints as well as the opportunities for development that exist if these constraints were to be addressed.
Cotton. The CEM provides an assessment of the cotton sector’s difficulties, drawing on the analytical framework proposed by Labaste et al (2007). Cotton dominates Benin’s formal sector, in agriculture, industry, and foreign trade, accounting for about 50-80 percent of merchandise exports and 10 to 15 percent of GDP. The farming, transport and processing of cotton contributes directly and indirectly to the livelihoods of some 60 percent of the population. Benin and other West African producers have a strong overall comparative advantage in cotton production due to favorable climate and soils, and the manual harvesting techniques prevalent in Africa yield higher quality cotton than machine-harvested cotton in developed countries. Costs of production are considerably below those of the United States.
The cotton sector in Benin faces grave difficulties, however. At the international level, cotton export prices have been depressed by cotton subsidies in developed countries and the appreciation of the CFA franc vis-à-vis the dollar. However, the more significant cause of the downturn in Benin’s cotton production and exports has been the unexpected difficulties associated with domestic reforms. An understanding of these reforms is illuminating not only for the cotton sector but as a way to understand the broader obstacles confronting Benin’s economic development.
Benin’s cotton reforms began in the early 1990s. The reforms were intended to gradually reduce the role of the parastatal marketing board SONAPRA and increase private-sector participation. An alternative set of private-sector oversight institutions was established through a collaborative effort by the government, the private sector and donors. Prices, entry, and market shares remained administered, with the goal of eventually moving towards a greater role for market forces.
The reforms succeeded in spurring the entry of domestic entrepreneurs in ginning and input supply. Some of these entrepreneurs have proved dynamic, while others have been ineffective and failed to respect their obligations, relying on political connections to remain in business. Agreements on prices and market shares have been subject to acrimonious conflicts and delays. The government has often failed to enforce market discipline. Instead, it has sometimes intervened in support of special interests and disrupted the functioning of the system. Consequently, the system has been under acute stress, and partly as a result, output dropped dramatically in the 2004/05 and 2005/06 seasons.

xiv
A partial recovery occurred in 2006/07 and 2007/08. Much of the improvement is apparently due to the private sector’s own efforts to re-establish order, and is a testimony to the rising strength and capability of the private-sector organizations.
Clearly, effective functioning of the system requires a government that enforces the rules of the system and does not intervene arbitrarily. Nevertheless, the problems in recent years also suggest that further advances in the reforms are necessary. The present structure does not optimize the tradeoff between competition and coordination and requires excessive institutional oversight rather than market-based incentives. By moving towards a more concentrated but market-driven system, the system could become more self-enforcing. With some consolidation occurring among private ginners, Benin is already naturally transitioning towards greater concentration. The long-delayed privatization of the SONAPRA is the crucial next step.
Transit trade. The CEM provides a new in-depth analysis of Benin’s poorly understood but crucial informal regional transit trade commerce with other countries of the region, notably Nigeria. A very large fraction of Benin’s imports are diverted illegally to Nigeria and most of Benin’s petroleum products are smuggled in from Nigeria.
Price differences resulting from highly distorted policies in Nigeria and Benin’s deliberately low import barriers are the main drivers of informal trade. Benin’s re-exports to Nigeria consist mainly of bulk food items such as rice, sugar and wheat, frozen poultry, processed foods, textiles and clothing, and second-hand items, especially used cars. All of these products are subject to outright import bans or very high customs duties in Nigeria, designed to protect Nigeria’s extensive but often inefficient manufacturing and farming sectors. Benin imports these products officially and then re-exports them unofficially, generating very large fiscal revenues in the process. On the other hand, Nigeria heavily subsidizes petroleum products and fertilizers such that prices in Nigeria are well below Benin’s official prices, providing a huge incentive for smuggling.
The re-export trade has ambiguous effects on Benin’s economic development. Informal trading activities are of great significance to Benin’s economy, accounting for around 25 percent of government revenues and 20 percent of GDP. These benefits are very fragile, however, dependent as they are on the vagaries of economic policy in Nigeria. The repeated closures of the border are ominous demonstrations of Nigeria’s ability to shut down the re-export trade if it chooses to do so. Harmonization of trade policies within ECOWAS, either through liberalization in Nigeria, or increases in trade barriers in Benin, would also undermine the re-export trade. So far, Nigeria has refused to fully implement the ECOWAS common external tariff aligning ECOWAS tariffs with those of WAEMU, and has conditioned its participation on the institution of a 50 percent tariff band, far above the current maximum rate of 20 percent.
The large fiscal windfalls from re-exporting have crowded out productive economic activities in Benin. The lure of the rents in Nigeria’s distorted markets exacerbates a culture of corruption and tax evasion that is not conducive to a productive

xv
economy. It is doubtful that a development strategy based on smuggling and fraud is a viable long-run path to emerging market status.
On the other hand, the re-export trade displays a dynamism, organizational sophistication and ingenuity indicating impressive entrepreneurial talents. Large enterprises straddling the formal and informal sectors dominate the importation and distribution of re-exported goods. In some respects, infrastructure such as border storage depots operate far more efficiently in the re-export trade than the formal economy and agents display remarkable flexibility and resourcefulness in adapting to changing market conditions and government policies.
The challenge for Benin is to channel this creativity in more sustainable directions. To reach emerging market status, Benin will have to develop its capacity to produce goods and services for regional and international markets, notably for the large neighboring market of Nigeria, rather than merely trans-shipping goods produced elsewhere. A more concerted effort to address the political and economic constraints identified in the CEM is a necessary condition for such a transformation.
Evaluation of potential new economic activities: Diversification and Innovation
Although a revival of the cotton industry and the development of Benin into a legitimate regional trading center are viable objectives, as argued in Chapter 2, Benin must also diversify its productive base. This chapter focuses on identifying the range of export possibilities and evaluates the role that innovation can play in Benin’s economic transformation.
Diversification. In a concerted endeavor to pursue its vision to transform Benin into an emerging market economy in the next decade and diminish its dependence on cotton and transit trade, the government of Benin has announced and is implementing an industrial policy as a part of its Plan Stratégique Opérationnel (PSO). The PSO targets growth in six strategic sectors: rice, cashew nut, pineapples, market-gardening (fruits and vegetables), palm oil and manioc. Although all analysts concur that Benin needs to diversify, the PSO product choices warrant careful analysis.
The chapter uses innovative concepts from HHR and HK and applies them to study the range of export possibilities for Benin. The value added of the approach is to assess objectively Benin’s diversification options given that it has a revealed comparative advantage (RCA) in raw cotton. By treating similarity in the products a country exports as a rough proxy for the similarity in inputs required to produce them, this approach associates products that countries export with factors of production, including skills and endowments that they possess. With the use of trade data from all countries for about 800 products, the HK methodology demonstrates, for instance, that there is a strong likelihood that countries that export unprocessed cotton also have a RCA in exporting cotton waste, and products made from palm oil, animals and seafood. Another interesting HHR concept, PRODY, assigns a value to the income potential of a product and is a useful substitute for ad hoc judgments of why one product contributes more to income than another. For instance, the PRODY of fresh or dried fruit is quite high. The HK

xvi
concept of “density” gauges the difficulty for a country like Benin to scale up or diversify into non-traditional products that it does not presently export. For instance, Benin’s density in exporting fresh crustaceans, a traditional product, is lower than that of Tanzania, because Tanzania produces a larger number of products that are “close” to crustaceans than Benin does. This suggests that it will be more difficult for Benin to scale up exports of fresh crustaceans than for Tanzania.
The appeal of this approach lies in its rigorous use of actual international trade statistics to delineate the feasible set of income-enhancing export diversification possibilities for Benin. Many believe that exports of manufactured products are a prerequisite for development but more recently, it has become clear that natural resources are neither curse nor a destiny. The CEM framework reveals a large set of nontraditional export possibilities across agro- and natural resource-based products that can serve as a starting point for diversification for Benin. The analysis classifies products into four categories: Classics, Emerging Champions, Disappearances, and Marginals, based on the time path of RCA between 1980-84 and 2001-05.
Classics are goods in which Benin has a longstanding comparative advantage, of which the largest by far is cotton. Unfortunately, cotton has low PRODY, explaining in part why Benin has remained poor. Cotton and related products will remain important for Benin’s growth, but it also needs to start exporting other products.
Emerging Champions are promising new products in which Benin acquired a RCA only in the 2000s. Among them are four new sectors- wood, cement, food (nuts, prepared crustaceans and fruit) and animal products. They either have high PRODYs or have the potential for high PRODYs through processing. Some like ‘processed crustaceans,’ reflect a natural transition from a Classic such as fresh crustaceans into an Emerging Champion.
Disappearances are products formerly but no longer exported, including primary products such as cocoa, palm oil and palm kernel oils etc. and nontraditional products (fabrics, sheep and lambskins, goat and kid skins, a special kind of leather).
Marginals are products in which Benin never had a revealed comparative advantage.
The analysis shows that the government of Benin’s preferred products in the PSO are a mixed set. Some, like high PRODY cashew nuts and fruits are also Emerging Champions, but other PSO products and several Diagnostic Trade Integration Study products are either Disappearances or Marginals.
The CEM proposes an intermediate strategy of promoting Emerging Champions, that lies between an activist industrial policy that would identify winners among the Marginals—usually focusing on manufacturing— and a laissez-faire policy that is likely to lead to continued dependence on Classics, namely cotton. Promoting Emerging Champions is less risky than doing so for Marginals, because the former have already demonstrated some potential. Scaling up exports of fresh and processed products in the

xvii
short term will likely spawn linkages and the emergence of ancillary activities. In the longer term, this experience and learning will nurture the capabilities to produce higher-PRODY complex manufactures of wood, animal products and chemicals in which Benin presently has a RCA but extremely weak densities. A natural resource-based diversification strategy that maximizes domestic value addition through processing is more viable for Benin than Asian-style large scale manufacturing that is dependent on imported intermediate inputs, low transport costs and relatively low wage-high skill labor that is scarce in Benin. The embryonic state of the emerging champions, however, implies that diversification will be neither easy nor rapid for Benin.
In line with the spirit of the CEM, the purpose of Chapter 3 is not to recommend a specific list of products for an export diversification strategy for Benin but rather to present for public debate a menu of diversification possibilities that can lead Benin to a higher and sustainable growth trajectory. The objective is merely to illustrate that the vision of an emerging market economy is achievable through gradual diversification. The discussion on the Classics and Emerging Champions points to the considerable export possibilities that lie buried in Benin’s agricultural and natural resource base. However, the HHR/HK framework has some limitations. It does not cover the potential of tourism or IT services’ exports due to the lack of detailed and consistent cross-country data, which is problematic given Benin’s current status as a transit hub for Nigeria.
This chapter clearly demonstrates that there is room for optimism for Benin on two counts. First, Benin has a number of high PRODY Emerging Champions it can nurture. Second, countries as diverse as Malaysia and Uganda have demonstrated that it is possible for poor countries specializing in primary products to transition towards a more diversified and dynamic export structure and thereby promote growth and poverty reduction.
Innovation. There are promising diversification opportunities for the Beninese economy and even genuine innovative capabilities in various sectors, including agriculture, agro-processing, and health care. These include examples such as farine mickelange (a yam-based flour) and grasscutter (agoutis) breeding. However, these creative initiatives are too isolated or insufficiently exploited for the country to embark on a dynamic new development path.
The government can facilitate efforts by the private sector to organize itself by providing incentives to stimulate cooperation in various domains. For example, agricultural producers can benefit from coordination in efforts to increase exports through raising norms and dissemination of information about market opportunities. Benin has had some success in developing joint efforts by universities and the business sector to develop new products, and more such initiatives can be encouraged. Moreover, the government should invest in basic public goods including Metrology, Standardization, Testing & Quality infrastructure which are virtually nonexistent in Benin, and technology diffusion support mechanisms (such as agricultural extension services). Another suggestion is to publicize success stories of entrepreneurship and innovation, through the popular media, such as radio and television programs.

xviii
Political and Institutional constraints
Chapter 1 establishes that some of Benin’s most binding cross-sectoral constraints are related to institutional weaknesses and poor governance while Chapter 2 identifies key sector specific constraints and Chapter 3 issues related to diversification and innovation. This chapter examines the political economy of economic policy-making in Benin in detail in an effort to understand how the political incentive structure negatively impacts the adoption of growth policies.
Political decision makers often fail to promote the broad public interest, usually out of concern that to do so will damage the interests of a privileged insider group that, for example, is a significant source of campaign finance – a source that can switch its support to other challengers if it feels its interests are jeopardized. However, a focus on the influence of special interests misses the important underlying reasons that explain why political decision makers pay a low electoral price for neglecting the public interest.
This chapter identifies four reasons why Benin’s political economy hampers the adoption of growth policies: (i) the lack of broad policy-based parties that can make credible commitments to voters prior to elections about their intentions regarding the growth agenda; (ii) institutional arrangements that significantly reduce the incentives of deputies in the National Assembly to pay attention to broad policy issues, oversee the executive branch, or group themselves into policy-based parties; (iii) voters who generally have little information about economic decisions and their effects on their welfare; and (iv) high levels of generalized mistrust among citizens, similar to what is found in other African countries.
The fact that political parties cannot make policy-based promises to voters in Benin is not surprising. Although in many democracies, including African democracies, policy-based parties are absent, in Benin the phenomenon is significant: the fractionalization of political parties is among the greatest, the extent of programmatic orientation is among the lowest, and political parties are among the youngest, compared to most other democracies or democracies in Africa. Similarly, while Benin is not alone among other African democracies, such as Ghana, in exhibiting no correspondence between voters’ policy preferences and their party identification, Benin is at the extreme in the fraction of voters who express no attachment to any party whatsoever.
A number of democracies endow the Office of the President of the country with significant authority over the budget, as in Benin. This authority significantly raises the costs to legislators of overseeing the executive, since critical oversight can be followed by sharp reductions in the budgetary allocations to the deputy’s supporters. In other countries, like Chile, strong political parties offset the power of the executive, but these are absent in Benin. In addition, Benin has an institutional arrangement for governing the National Assembly that undermines deputy influence on legislation. This arrangement gives the president of the National Assembly nearly complete authority over the legislative agenda and, as such dissent by a deputy can be followed by a legislative agenda that does not promote the deputy’s interests. And, again, there are no strong parties to offset the institutional authority of the Assembly president.

xix
Information is essential to accountability, but voters in Benin are poorly informed and, as before, more poorly informed than in comparator countries. They are less likely to answer accurately policy questions about school and health clinic fees than their counterparts in other African countries; they are far less likely to read newspapers; and media markets are significantly less developed. At the same time, relevant information is not released to the public regularly. It is a sign of the weak political incentives of legislators to examine broad policy issues that the National Assembly does not insist on better information.
The effects of these political market imperfections and institutional arrangements on the incentives of political decision makers to pursue growth are evident in numerous policies. The cotton sector has exhibited volatility in both output and the policy environment, and striking unevenness in the enforcement of the rules of the game. All of these can be traced to the significant influence of narrow interests in the sector. Efforts to introduce a greater private sector presence in areas controlled by the government have foundered on tensions between special interests and between special interests and decision makers.
While some of the political obstacles to growth are deep-seated, there are still important steps that a government can take, particularly in the area of information. A more aggressive program to collect and release information (about government decisions, their pace of implementation, and their impact) would mark a sea change from current practice, when even the decisions of government, much less their implementation and impact, are often unknown to voters (and even close observers). A supportive attitude towards the media and the lifting of legal and regulatory proceedings of media for assessment of government performance is a second important step: media are the channel through which the public finds out about the information that government must make greater efforts to provide. Finally, education is crucial, not only to lay the groundwork for economic growth, but also to create a citizenry prepared to make judgments about government performance. These reforms are all within the grasp of the government, even if the development of policy-based political parties may be a more distant goal.
Conclusions and Recommendations
Benin benefits from favorable geography, macroeconomic and political stability, but economic performance has been disappointing. The CEM has identified four binding cross-sectoral constraints which impede Benin’s capitalizing on its considerable strengths. The conclusions of the growth diagnostics provide policy makers with suggestions to decide on policy sequencing. It is recommended that addressing these constraints, which are currently the most binding, be the priority.
In addition to the above cross-sectoral constraints, the authorities will need to address sector-specific constraints to support sustainable economic growth. Specifically, priority interventions for the government are: (i) organization of the cotton sector; (ii) improvements at the port; and (iii) restructuring of the telecommunications, energy and water sectors.

xx
The CEM has identified specific constraints in Benin’s two leading sectors of cotton and transit-trade. Benin has a strong comparative advantage in cotton, and if the political distortions that have impeded the reforms can be overcome, cotton could contribute significantly to growth and poverty reduction. To this end the CEM makes three main recommendations: (i) revise the regulatory framework without delay, notably by clarifying the role of the government; (ii) avoid interference in support of special interests and allow the institutional mechanisms to operate as intended; and (iii) re-start and complete the long-delayed privatization of the SONAPRA, which is the crucial next step towards a more concentrated, market-driven system.
Benin benefits substantially from unofficial or semi-official trade with Nigeria in the form of income, employment and fiscal revenues. In important respects, however, the transit trade has retarded Benin’s development by crowding out productive economic activities and exacerbating a culture of corruption and tax evasion. The challenge for Benin is to channel this entrepreneurial energy and creativity in a more sustainable direction. The CEM recommends Benin to follow a two-fold strategy: (i) transition to a legal regional trading and service center, benefiting from proximity to Nigeria, through (a) continued efforts to harmonize trade policies within ECOWAS, thereby removing the distortions that foster illegal trade, and (b) improvements in the business environment and notably infrastructure such as electricity, transport and communications to improve competitiveness as a service hub; and (ii) foster productive activities through diversification and innovation, the focus of the third chapter of the CEM.
On diversification and innovation, the CEM recommends a middle ground between “picking winners” and laissez faire. Using a novel methodology based on changes in revealed comparative advantage, the CEM identifies several agricultural and other natural-resource-based products in which Benin has shown promise. To develop these industries, the CEM recommends again a two-fold strategy: (i) overall improvements in the business environment, as just noted for traditional sectors, in particular improvements in electricity supply; and (ii) targeted assistance from the government through alleviation of sector-specific manifestations of the economy-wide constraints identified in the first chapter of the CEM. Government and donor assistance for attainment of quality control and sanitary norms are recommended for all products. For agricultural products in particular, government support also must involve research and extension, support to farmer organizations, promotion of outgrower schemes and improving access to land.
Despite having one of the most successful democratic transitions in Africa, Benin’s political system provides limited incentives to develop and implement policies that promote growth. Politicians have weak electoral incentives to pursue the public interest and correspondingly strong incentives to retain their ability to allocate rents and to mediate disputes between vested interests. Although this is difficult to modify, a more informed electorate is a key pre-requisite for greater accountability and hence improved policies. To this end, the CEM recommends that the government: (i) improve the collection and dissemination of information, about what decisions are made, what problems they respond to, how they are implemented and what effect they have; (ii)

xxi
encourage the media to report on government performance, even if those reports are critical; and (iii) continue to boost the availability and quality of education


1
1. WHAT ARE THE BINDING CROSS-SECTORAL CONSTRAINTS TO GROWTH IN BENIN?
ECONOMIC OVERVIEW AND PAST TRENDS
1.1 Benin is a small West African country, with a population of 8.7 million, which despite a period of recovery starting in the early 1990s (Figure 1.1), remains a low income country with a per capita income of just US$ 327 in 2006. Services and agriculture are two core economic activities which in 2005 accounted for 46 and 40 percent of total value added, respectively. Agriculture employs approximately half of Benin’s active labor force (Figure 1.2). Agricultural crops include cereals, starchy roots and cotton – Benin’s main export commodity. The large share of services reflects Benin’s role as a transit trade hub, for Nigeria and the landlocked countries to the north including Burkina Faso and Niger.
Figure 1.1: Benin’s GDP Per Capita and Annual Growth, 1972-2006
-10.0
-8.0
-6.0
-4.0
-2.0
0.0
2.0
4.0
6.0
8.0
10.0
12.0
1972
1974
1976
1978
1980
1982
1984
1986
1988
1990
1992
1994
1996
1998
2000
2002
2004
2006
Gro
wth
rat
e (a
nnua
l % c
hang
e)
0
20000
40000
60000
80000
100000
120000
Con
stan
t LC
U
GDP per capita growth GDP growth GDP per capita (constant LCU)
Source: World Bank (DDP)

2
1.2 Despite a strong growth performance in the period from 1997 to 2005, there was little structural transformation (Table 1.1).1 Agriculture accounted for nearly 40 percent of value added at constant prices both in 1997 and 2005. The expansion in the service’s share was offset by a contraction of industry’s share which represented a minor share of output and employment (Table 1.1 and Figure 1.2). Within industry, manufacturing contributes less than 10 percent of output, and consists of a small number of large enterprises including cement factories, textile plants and food processing companies, and a large number of small-scale firms producing basic consumer goods for the local market.
Figure 1.2: GDP and Employment Sectors Shares, Benin
Source: World Bank DDP and Government of Benin.
Table 1.1: Industry Composition of Total Value Added in Benin at Constant, Producer Prices (Factor Cost)
Shares 1997 1998 1999 2000 2001 2002 2003 2004 2005 Agriculture 39.8 40.5 40.3 40.6 39.8 40.3 39.6 39.9 39.5 Industry 15.6 15.0 14.6 15.0 15.6 15.6 15.4 14.6 14.5 Manufacturing 10.2 9.9 9.8 10.1 10.5 10.5 10.1 9.4 9.4 Mining 0.8 0.6 0.1 0.1 0.1 0.1 0.1 0.1 0.1 Construction 3.5 3.4 3.4 3.5 3.5 3.5 3.6 3.6 3.7 Services 44.6 44.5 45.1 44.4 44.6 44.1 45.0 45.5 46.0 Utilities 1.1 1.1 1.2 1.3 1.5 1.5 1.6 1.7 1.7 Transport 5.8 5.9 6.0 5.9 5.9 5.9 6.1 6.2 6.3 Trade 15.0 14.7 14.9 14.7 14.8 14.6 14.8 15.0 15.2 Other services 10.3 10.3 10.3 10.2 10.3 10.3 10.6 10.9 11.1
Source: World Bank, LDB
1 These data come from the World Bank databases and are adjusted to reflect a growing discrepancy in the period from 2001 to 2005. Although the discrepancy was reconciled as a downward adjustment of the services sector, we felt that this adjustment does not represent developments in Benin, where services, especially transit trade, have grown substantially in this period. While official exports and re-exports declined in the period before 2003, estimated total unofficial re-exports grew from 23% of GDP in 2003 to 31% of GDP in 2007. The adjustment was therefore made by distributing the discrepancy equally among the primary, secondary and tertiary sectors. This adjustment may still lead to bias so the data in Table 1.1 and in Table 1.13, which uses data from Table 1.1, should be interpreted with caution.
Employment, 2006
Primary Sector54%
Secondary Sector10%
Tertiary Sector36%


4
second most important agricultural export commodity after cotton. Fruit exports, e.g. pineapples, have grown as well in response to strong demand from Nigeria. Fishing – a sector with potential for expansion – is primarily an artisanal activity accounting for only 4 percent of GDP, but supporting directly some 90,000 people and indirectly 350,000 more.
1.7 Official statistics greatly underestimate the importance of Benin’s re-export trade as a very large proportion of Benin’s trade is unrecorded, as discussed in Chapter 3. Transit trade and transport, especially with Nigeria, most likely generate a higher share of GDP and incomes than the cotton sector. Informal trade with Nigeria accounts for more than half of Benin’s total trade. Benin imports consumer goods and farm products and re-exports them to Nigeria where these products are or have been banned or subjected to high customs duties in an attempt to protect Nigeria’s domestic manufacturing and agricultural industries. Benin’s imports from Nigeria include gasoline and other petroleum products that are heavily subsidized in Nigeria, cement and a range of manufactured goods.
Figure 1.4: Degree of Export Diversification
0.00
0.10
0.20
0.30
0.40
0.50
0.60
0.70
1965 1970 1975 1980 1985 1990 1995 2000 2004
Ind
ex
0%
10%
20%
30%
40%
50%
60%
70%
80%
90%
100%
% o
f ex
po
rts
Herfindahl Index Export share of five largest exports
Expon. (Herfindahl Index)
Source: Export diversification database, PRMED.
1.8 The income gap between Benin and other LICs has widened significantly after 1989, despite a long period of recovery from the all-time low level of real per capita income at the end of the 1980s (Figure 1.5). Benin has been left behind other low income countries largely because its growth rate was low and when coupled with high fertility rates implied small improvements in per capita incomes. Table 1.2 shows that while Benin’s real growth rate averaged only 3.7 percent per year since 1987, the average annual growth for the group of LICs was 5.3 percent.

5
1.9 Benin grew on average at a slightly higher rate than the average for SSA during the period 1987-2006 (Table 1.2). Benin did much better than other SSA countries in the period 1990-99 due to political and macroeconomic stability, improvements in health and human capital, and structural reform. Following the strategic policy reversal of 1990, the role of the state declined rapidly during the first half of 1990s, and more slowly afterwards. The wage bill for the civil service fell rapidly, state-owned enterprises (SOEs) were limited to public utilities and their relations with the state were transformed. Agriculture and transport were liberalized and some limited improvements in infrastructure occurred. The role of private and joint public-private provision of public services, including by non-profit organizations, expanded dramatically, especially in education, health, agriculture and road maintenance.
1.10 Since 2000, however, growth in Benin decelerated relative to its neighbors Nigeria and Burkina Faso and the good performers in Africa, and this deceleration increased in the period 2003-06. In this period average real annual GDP growth fell down from 4.5 percent in the 1990s to 3.5 percent – a growth rate similar to that in Niger, and much below that for SSA. Real economic growth strengthened to 4.2 percent in 2007 from 3.8 percent in 2006 but this reflected a rebound in cotton and services sectors rather than a broader pick up in economic activities. This chapter investigates the reasons behind Benin’s falling behind other Sub-Saharan and low income countries.2
Figure 1.5: Growth Record, a Comparison of Benin, SSA and LICS
500
700
900
1100
1300
1500
1700
1900
2100
2300
2500
1976
1978
1980
1982
1984
1986
1988
1990
1992
1994
1996
1998
2000
2002
2004
2006
GD
P pe
r cap
ita
in $
PPP
2000
Low incomecountries
Sub-SaharanAfrica
Benin
Source: World Bank, DDP
2 The last Country Economic Memorandum for Benin was completed in 1984. Another relevant document reviewing economy-wide issues in Benin is the Social and Structural Policy Review (SSPR) for Benin, completed in early 2000s. This SSPR identified Benin’s dependence on aid related to low savings, narrow tax base, corruption, weak administrative procedures, institutions and regulatory frameworks as the major constraints.

6
Table 1.2: Real, Annual GDP Growth Rates
Average 87-06 Average 90-99 Average 00-06 Average 03-06 Benin 3.7 4.5 4.2 3.5 Nigeria 4.3 3.1 5.5 7.2 Burkina Faso 4.0 3.8 5.1 6.0 Niger 2.5 1.9 3.2 3.5 Togo 2.5 2.6 1.7 2.1 Ghana 4.7 4.3 5.0 5.7 Uganda 6.3 6.9 5.6 5.5 Sub-Saharan Africa 3.1 2.0 4.5 5.2 Low income countries 5.3 4.6 6.1 7.6
Source: World Bank, DDP
THE DIAGNOSTIC APPROACH
1.11 The approach adopted in this chapter relies on a growth diagnostic tree that is used to organize the thinking about the binding constraints to private sector growth in Benin in the short to medium run (Figure 1.6). The methodology is based on a growth diagnostic approach à la Hausmann, Rodrik and Velasco (2005) and has been used in a number of Country Economic Memorandums (CEMs).3 The main question posed in the beginning of the analysis is whether the level of private investment in a country is low. Investment could be low because returns to capital are low or because the cost of finance is high.
1.12 Returns to capital may be low due to low social returns or low private returns to capital. Social returns may be low because of insufficient investment in complementary factors of production, such as infrastructure and human capital or low land productivity due to poor natural resource management. Private returns to capital may be low due to high taxes, poor property rights, corruption, labor-capital conflicts, macro instability, and market failures, such as coordination externalities and learning externalities negatively affecting the country’s ability to adopt new technologies.
1.13 The cost of finance may be high because the country has limited access to external capital markets or because of problems in the domestic financial market. A country may have difficulties accessing external capital markets for a variety of reasons including high country risk, barriers to foreign direct investment (FDI), vulnerabilities in the debt maturity structure, and excessive regulations of the capital account. Difficulty in accessing local finance may be due to low domestic saving and/or poor domestic financial intermediation.
1.14 An exercise in growth diagnostics consists of reviewing and analyzing the factors found along the branches of the growth diagnostic tree in order to ascertain which of these factors are most binding constraints to growth. Although all factors are likely to matter for growth and welfare, the ones that are most binding are likely to 3 Mongolia CEM (World Bank 2007) and Bolivia CEM (World Bank 2005c) are good examples.

7
provide the largest positive direct effect, so that even after taking into account second-best interactions, the net impact of a policy change is positive and sizable.
1.15 Recent economic growth literature suggests that when constraints are “binding”, they result in activities that are designed to get around them.4 Symptoms that one sees under these circumstances include: high taxes; high degree of informality in economic activities; poor legal institutions; high demand for informal mechanisms of conflict resolution and enforcement; poor financial intermediation; and internationalization of finance through business groups/connected lending operations.
1.16 In applying the growth diagnostic methodology to the case of Benin both direct and indirect evidence is employed to identify “bottlenecks” to economic growth. In addition, since the aggregate picture typically hides important details at the industry level, aggregate as well as industry and firm-level data are used to benchmark the performance of the economy, specific sectors and types of firms. A thorough growth diagnostics exercise necessitates other analytical methods including analyses based on macroeconomic, investment climate and trade data, industry studies, and other sources. This growth diagnostic analysis will rely on all these methods to identify bottlenecks to growth in the short to medium run.
Figure 1.6: Growth Diagnostic Tree
Source: Hausmann, Rodrik, Velasco (2005)
Is private investment in Benin low?
1.17 Gross domestic investment in Benin has been low by international standards. In the past ten years gross domestic investment in Benin averaged 18.2 percent of GDP 4 See Hausmann, Rodrik, Velasco (2005) and Rodrik (2004a and 2004b).
Low levels of private investment and entrepreneurship
Low return to economic activity
High cost of finance
Bad international
financeBad local finance
Low social returns Low appropriability
Governmentfailures
Micro risks: property rights,
corruption, taxesMacro risks:
financial monetary, fiscal
instability
Marketfailure
Information externalities
“self-discovery”
Coordination externalities
Low domestic
saving
Poor intermediation
Bad infrastructure
Poor geography
Low human capital

8
(Table 1.3). This average investment-to-GDP ratio was comparable to the average investment ratio in other HIPC countries, WAEMU, and ECOWAS but was lower than that in LICs, and developing East Asia, and much lower than investment in well performing and some resource-rich economies in Africa and elsewhere. For instance, in the last 5 years private investment was lower in Benin than in CEMAC5 (Communaute Economic des Etats d’Afrique Centrale).6 High returns in the oil sector which attracted private investment helped the CEMAC countries enjoy relatively high real GDP growth.
1.18 The pace of real private investment growth decelerated sharply after 1994. Real private investment growth slowed down from an average of 14 percent during the period 1980-93 to just 6.1 percent in 1994-2006. In the key cotton sector, the stock of foreign direct investment (FDI) declined from US$441 million in 1998 to US$ 291 million in 2004, and investment was insufficient to cover capital depreciation.7
Table 1.3: Gross Capital Formation, National and Foreign Savings
1997 1998 1999 2000 2001 2002 2003 2004 2005 2006 Average Foreign savings in Benin 12.8 10.4 12.7 12.9 12.7 14.4 12.1 12.0 12.0 - 12.5 National Savings in Benin 5.6 6.6 4.8 6.0 6.5 3.7 6.0 5.5 6.9 - 5.7 Gross capital formation (% of GDP)
Benin 18.4 17.0 17.5 18.9 19.2 18.1 18.1 17.5 18.9 - 18.2 WAEMU 17.7 16.5 17.1 16.7 18.6 15.3 17.4 17.5 18.4 18.5 17.4 ECOWAS other than WAEMU 17.1 18.0 17.8 18.0 16.1 16.6 16.9 18.4 19.1 20.3 17.8 HIPC 15.9 16.6 17.3 17.3 17.9 17.9 19.1 20.1 20.5 20.5 18.3 Developing EAS 28.3 22.5 20.6 22.2 21.6 21.8 22.8 23.8 24.0 21.1 22.9 LICs 16.8 17.7 18.0 18.4 19.0 19.0 20.5 20.9 20.8 20.0 19.1 MICs 24.1 24.8 22.9 22.4 22.9 22.0 22.8 23.5 22.9 23.3 23.2 HICs 22.8 23.2 22.1 21.6 21.5 21.0 21.0 21.6 22.1 26.6 22.4
Source: World Bank (SIMA)
1.19 Nearly all of private foreign investment in Benin was in the form of foreign direct investment which averaged just 1.7 percent of GDP in the past decade (Table 4). This average is at par with the average FDI to GDP ratio over the same period for the WAEMU member group, but much below the averages for SSA, HIPCs, LICs and other members of ECOWAS that are not WAEMU members.
1.20 Private domestic investment is also a smaller share of domestic investment than the average in WAEMU, HIPC, and LICs and other countries (Table 1.4). Private domestic investment accounted for 67 percent of domestic investment in the last 10 years as compared to72, 69 and 73 percent in WAEMU HIPC and LIC countries. It should however be noted that Benin’s share at 85 percent in 2005 was higher that in these countries.
5 CEMAC includes Cameroon, Central African Republic, Chad, Congo, Republic of, Equatorial Guinea, Gabon. 6 Source: IMF Selected Issues and Statistical Appendix 2007. 7 Source: IMF (2008).

9
1.21 As in other HIPCs a large share of investment in Benin was funded by foreign aid. The share of foreign aid in gross domestic investment averaged 51 percent in the past ten years (Table 1.4). Although declining, in 2005 the share of foreign aid in gross domestic investment stood at 43 percent, more than 4 times the share in LICs.
1.22 What are the reasons for the low level of private investment in Benin? Is private investment low because of high cost of capital or low rates of return? We turn first to the question about the cost of capital, and then explore issues related to the rate of return.
Table 1.4: Foreign Aid, FDI, and Private Investment
1997 1998 1999 2000 2001 2002 2003 2004 2005 Average Foreign aid (% of gross capital formation) Benin 55.6 51.7 50.5 55.9 59.8 42.4 45.9 54.2 43.0 51.0 WAEMU 56.3 66.8 46.9 53.0 43.2 73.5 44.9 50.8 42.4 53.1 ECOWAS other than WAEMU 13.7 13.4 10.8 10.0 11.7 12.3 12.9 13.3 24.9 13.7 HIPC 57.0 53.1 48.6 48.6 53.8 63.9 68.3 59.2 49.6 55.8 Developing EAS 1.7 4.4 5.5 4.9 4.3 3.7 3.2 2.3 3.3 3.7 LICs 10.3 10.9 9.2 9.4 10.1 11.8 11.2 9.5 9.1 10.2 MICs 1.6 1.8 2.2 1.7 1.7 1.7 1.6 1.5 1.8 1.7 HICs 0.1 0.1 0.1 0.1 0.0 0.1 0.0 0.1 0.0 0.1 FDI (% of GDP) Benin 1.3 1.6 1.7 3.0 2.1 0.6 1.4 2.7 0.5 1.7 WAEMU 2.3 1.3 1.4 1.9 2.1 2.2 1.4 1.5 1.2 1.7 ECOWAS other than WAEMU 11.9 9.5 12.4 4.7 2.4 3.1 15.3 10.5 9.2 8.8 HIPC 4.3 3.8 5.4 3.4 3.6 4.5 6.2 4.0 4.2 4.4 Developing EAS 4.4 4.3 3.6 2.5 1.6 2.1 1.5 1.9 2.8 2.7 LICs 3.6 3.5 3.8 2.4 2.5 3.2 4.8 3.5 3.2 3.4 MICs 4.6 5.9 5.4 4.4 4.9 4.4 5.4 4.9 4.6 4.9 HICs 3.4 4.4 7.6 9.9 5.1 18.7 12.3 9.8 13.3 9.4 Private investment (% of domestic investment) Benin 63.0 55.4 77.1 56.4 87.4 49.6 72.8 78.9 85.4 67.2 WAEMU 60.1 63.9 53.1 85.9 - - - 80.9 61.5 71.7 ECOWAS other than WAEMU 59.6 64.0 55.7 82.8 - 65.6 - 81.9 64.5 71.5 HIPC 60.0 64.3 52.7 84.6 - 56.9 - 80.6 57.6 69.2 Developing EAS 58.3 64.0 42.7 100.0 - 55.4 - 77.3 65.5 69.8 LICs 65.6 74.4 61.8 89.2 - 62.8 - 81.6 54.0 72.8 MICs 63.1 84.6 59.6 90.0 - 66.4 73.6 83.6 58.5 69.9 HICs 51.5 76.5 59.1 90.8 - 69.6 80.9 84.2 47.4 70.0
Source: World Bank (SIMA)
Is the cost of capital in Benin high?
1.23 Benin does not appear to be a liquidity constrained economy. Broad money rose by more than 22 percent in 2005, considerably higher than nominal GDP, and there was a 20 percent expansion of credit to the private sector. As net bank credit to the government has declined, growth of credit to the private sector has remained at nearly 10

10
percent, with some shift towards longer term credit and lending to non-trade services, especially telecommunications.
1.24 Benin’s external debt burden has declined and is low relative to the averages of WAEMU, ECOWAS and LICs.8 About 85 percent of Benin’s external debt is concessional, which is much higher than the regional averages of 62 to 75 percent (Table1.5). Only a negligible share of Benin’s external debt is short-term (Table 1.5). Benin’s stock of debt fell to just US$824 million at the end of 2006, from US$1.9 billion at the end of 2005. This was a result of debt relief received under the HIPC Initiative and MDRI and improved debt management.
Table 1.5: External Debt, Concessional Debt and Short-Term Debt
1997 1998 1999 2000 2001 2002 2003 2004 2005 Average External debt (% of GNI) Benin 76.5 71.1 71.1 70.9 70.7 66.0 52.0 47.8 43.5 63.3 WAEMU 128.4 142.2 134.7 132.4 124.4 119.1 104.5 92.9 79.2 117.5 ECOWAS other than WAEMU 188.8 188.0 181.5 174.6 170.7 172.0 199.3 187.8 162.0 180.5 HIPC 163.1 175.3 173.5 165.8 156.8 154.2 152.5 140.2 117.3 155.4 Developing EAS 76.8 109.5 94.3 78.5 75.3 74.6 63.0 58.9 54.1 76.1 LICs 121.2 132.9 133.5 129.2 122.2 121.4 121.6 113.0 95.1 121.1 MICs 54.9 61.2 61.8 59.5 59.2 62.9 62.6 59.1 52.1 59.3 Concessional debt (% of total external debt) Benin 77.7 80.7 80.6 84.3 84.9 86.2 90.1 90.8 91.9 85.2 WAEMU 68.8 70.7 70.5 72.4 74.4 76.4 78.9 81.6 82.4 75.1 ECOWAS other than WAEMU 57.2 57.9 58.2 59.5 60.0 60.2 66.8 67.5 68.4 61.8 HIPC 66.2 67.5 67.9 68.5 69.7 71.0 73.2 74.6 74.8 70.4 Developing EAS 35.8 37.2 38.9 44.1 44.8 45.6 46.5 45.6 42.8 42.4 LICs 65.0 66.8 67.3 68.7 69.9 71.2 73.4 74.8 75.1 70.2 MICs 30.8 30.2 31.1 30.1 29.2 29.3 29.0 29.1 28.1 29.7 Short-term debt (% of total external debt) Benin 8.4 5.2 7.2 4.1 4.7 4.0 1.6 1.3 2.1 4.3 WAEMU 7.7 6.0 7.6 6.1 5.4 5.1 3.4 2.8 3.5 5.3 ECOWAS other than WAEMU 11.7 11.7 12.9 10.1 10.8 11.3 11.5 12.6 12.2 11.6 HIPC 9.0 8.7 9.6 9.0 8.7 8.3 7.2 7.2 7.6 8.4 Developing EAS 18.5 12.5 10.9 10.1 10.8 11.0 11.5 12.8 14.9 12.6 LICs 8.5 7.9 8.7 7.9 7.9 7.4 7.3 7.1 7.4 7.8 MICs 16.9 15.6 14.6 14.9 16.1 16.1 17.7 18.1 19.8 16.6
Source: World Bank (SIMA)
8 Benin’s external debt nearly halved in the past 10 years, reducing from 77% of GNI in 1997 to 44% of GNI in 2005.

11
Table 1.6: Real Cost of Capital in Benin
Nature of borrower Credit Deposit Credit Deposit Credit Deposit 2005 2006 2007 State or para-state organizations 1.5 -1.1 0.3 0.5 1.7 2.1 Private individuals 5.8 -1.5 6.9 0.6 8.3 1.7 Financial customers 2.4 -0.3 8.6 1.8 2.7 3.3 State companies and EPIC 2.3 -0.2 4.1 1.4 5.7 3.2 Retirement Insurance fund 4.1 -0.4 7.0 1.5 4.4 2.7 Private companies in productive sector 3.5 -0.6 5.9 1.2 8.1 2.5 Small enterprises 7.5 -1.5 8.1 -0.1 9.8 0.8 Village cooperatives and groups 5.9 -1.2 6.2 1.5 6.7 1.1 Other (NGO, Friends, Unions, etc.) 5.3 -1.3 5.1 -0.1 4.4 1.3 Personnel of banks -2.6 -5.4 -1.0 0.2 0.5 1.3 Total 3.7 -0.7 5.8 1.1 7.6 2.2
Source: SIMA and Government of Benin.
1.25 The average real cost of capital has been low compared to that in other developing countries, but has risen during the past 3 years (Figure 1.7 and Table 1.6). The rise can be attributed mostly to declining inflation rates, but also to a modest rise in risk premiums (Figure 1.8). Still, in 2007 real lending rates remained lower in Benin compared to those in other countries. Even the cost of capital for small enterprises was close to 8 percent – much lower that the rates faced by SMEs in many developing countries.
1.26 Despite low lending rates only a quarter of all Beninese firms have a loan and the vast majority of firms with loans have short- to medium-term loans rather than long-term financing for large scale investment projects. A number of factors discourage firms from applying for a loan or getting a loan (Figure 1.9). According to the Benin Investment Climate Assessment (ICA) (World Bank 2005b) only a small share of firms (15 percent) state they do not need a loan, but more than a third of all firms in Benin do not have loans because they are discouraged from applying due to complex application procedures (12 percent), the high cost of capital (10 percent), collateral requirements (4.2 percent) and other reasons (8.4 percent) (Figure 1.9).

12
Figure 1.7: Real Cost of Capital
-5
0
5
10
15
20
Ben
in
Uga
nda
Mad
agas
car
Ken
ya
Nig
eria
Tan
zani
a
Sou
th A
fric
a
Mau
riti
us
Indi
a
Ban
glad
esh
Chi
na
Indo
nesi
a
Mal
aysi
a
Tha
ilan
d
Hon
dura
s
Egy
pt
EC
OW
AS
othe
r tha
n
WA
EM
U
HIP
C
Dev
elop
ing
EA
S
2005 2006
Source: SIMA and Government of Benin.
Figure 1.8: Annual Inflation and Average risk Premiums in Benin
0
1
2
3
4
5
6
2005 2006 2007
%
Inflation Risk premiums
Source: SIMA and Government of Benin.

13
Figure 1.9: Access to Capital in Benin, 2004
1.27 Perceptions about the cost and access to capital as an obstacle to business growth do not match with the reality. According to the 2005 ICA 78 percent of the firms in the survey complained that the cost of capital was a severe obstacle to business growth, but only 10 percent of the firms in the survey were discouraged and did not apply for a loan because of the high cost of capital (Figure 1.9). Similarly, the survey results on access to capital suggest that while approximately 70 percent of firms9 claimed that access to credit was a severe obstacle, 60 percent of the firms either obtained a loan (26 percent of firms), were approved for a loan (18 percent) or did not need a loan (15 percent) (Figure 1.9). This suggests that lack of profitable investment opportunities, rather than high cost of capital, is the likely reason for the large number of firms without loans.
1.28 Access to capital is not as poor as it appears based on these perceptions. Microfinance, defined as the provision of small financial services to relatively low-income clients who lack access to normal commercial bank products, is a very dynamic sector that has grown tremendously in the last decade (Table 1.7).10 The country has the largest number of microfinance institutions in the WAEMU region. In October 2002, there were more than 600 retail microfinance organizations belonging to about 85 programs or networks reaching about 500,000 people, i.e. a penetration rate of about 15 percent of the total active population. However, access to long term capital that can fund productive investment, not short term trade-related activities, is very limited – a situation that disadvantages especially SMEs, and micro-enterprises.
9 In 2004 access to credit was considered a major obstacle to business operations and growth by 73 percent of manufacturing firms, 76 percent of construction companies, 59 percent of tourism businesses, and 68 percent of retailers. 10 Source: World Bank (2004a).
142 (74.3%)
49 (25.7%)
With a loan Without a loan
All firms 191 (100%)
49 (25.7%)
93 (48.7%)
Applied Did not apply
65 (34%) 28 (14.7%)
Did not need a loan
Discouraged Why?
Rejected 15
(7.9%)
Not rejected 34 (17.8%)
Loan Maturity of
1 year or less 16 (8.4%)
Loan Maturity >
5 years 7 (3.7%)
Source: Benin Investment Climate Survey 2004.
Loan 1<Maturity <=
5 years 26 (13.6%)
Project not feasible: 2 (1.1%)
Other: 5 (2.6%)
Lack of collateral: 8 (4.2%)
High cost of
Capital 19 (9.9%)
Collateral/ Insufficient guarantee 8 (4.2%)
Process too Difficult
22 (11.5%)
Other 16
(8.4%)

14
Table 1.7: Benin Microfinance Institutions – Selected Statistics, 1998-2002
1998 1999 2000 2001 2002 Number of retail institutions 104 104 163 219 219 Number of active clients (thousand) 84 83 70 98 147 Total Savings deposits (billion CFAF) 19 20 22 26 32 Total Loans outstanding (billion CFAF) 18 16 14 23 46 Average deposit/client (thousand CFAF) 230 246 312 269 220 Average deposit/client (US$) 410 376 442 362 352 Average loan balance (thousand CFAF) 218 198 202 239 315 Average loan balance (US$) 388 303 287 321 504 Average deposit, % of GNP per capita 108 99 116 95 93 Average loan balance, % of GNP per capita 102 80 75 84 133 MFI Deposits/Bank Deposits (%) 9 9 8 9 10 MFI Loans/Bank Loans (%) 7 16 12 19 29 Source: Cellule Microfinance, Ministry of Finance and Economy.
Is the rate of return to economic activity in Benin low?
1.29 Benin’s per capita income stagnated between the early 1970s and the mid 1990s, but in the late 1990s real per capita income started rising albeit modestly at about 1.3 percent per year on average. Real GDP growth was offset to a large extent by rapid population growth, but growth volatility decreased after 1990 reflecting marked improvements in political and macroeconomic stability (Figure 1.1).
1.30 Over the years the economy grew primarily through accumulation of factors rather than efficiency improvements (Figure 1.10). In the 1990s, total factor productivity growth (TFP) was positive reflecting the dividends from structural reforms, but since the end of the 1990s productivity growth has turned negative (Figure 1.10).11 TFP growth has been following a declining trend (Figure 1.11) and, in 2006 productivity growth was negative under all plausible sensitivity scenarios (Table 1.8).12 What are the main reasons behind the inefficient use of capital in Benin?
1.31 Agriculture, trade and transport, and other services were the main sources of growth, while industry output stagnated in the last ten years (Table 1.9). Agricultural output growth added on average a little less than 2 percentage points to annual real growth, while growth in services added a little more than 2 percentage points. By contrast, industrial production including manufacturing and construction stagnated, and returns in these sectors were low.
11 TFP growth is difficult to estimate. Small differences in assumptions can lead to very different estimates of TFP growth and growth in TFP reflects factors other than pure technical change such as increasing returns to scale, markups due to imperfect competition, and sectoral reallocations. The growth accounting method for estimating TFP growth is discussed in PREM Note 42 by Ghosh and Kraay and was used in Korea Economic Report (World Bank 1999) and Mongolia CEM (World Bank 2007). Appendix 2 presents details on the data and the methodology. 12 We rule out the possibility that the negative productivity growth in the past few years since 2003 was an outcome of terms-of-trade (TOT) deterioration. Benin’s terms of trade slightly improved in the period from 2003 to 2006 (Figure 17), although the barter-adjusted terms-of-trade did decline.

15
Figure 1.10: Growth Accounting, Benin
Sources of growth
-4
-2
0
2
4
6
8
10
12
1972-1979 1980-1989 1990-1999 2000-2006
Ann
ual %
gro
wth
GDP growth Caital Storck Growth Labor (quality adjusted Growth) TFP Growth
Source: Staff estimates based on the following assumptions: Cobb-Douglas production function with CRTS and capital share α=0.3 to 0.5.
Figure 1.11: TFP and Factor Accumulation Trends, Benin13
y = -0.0884x + 0.9491
R2 = 0.0726
-10
-8
-6
-4
-2
0
2
4
6
8
10
12
1972
1974
1976
1978
1980
1982
1984
1986
1988
1990
1992
1994
1996
1998
2000
2002
2004
2006
Ann
ual %
cha
nge
Output TFP Factor growth Linear (TFP)
t
Source: Staff estimates based on the following assumptions: Cobb-Douglas production function with CRTS and capital share α=0.4.
13 IMF’s estimates of TFP growth (Sources of Economic Growth in Benin, selected issues 2004) in Benin differ from these ones because of difference in the time periods, but most importantly because of differences in the methodology. IMF’s model did not adjust the labor force for quality. This is an important omission since Benin experienced major improvements in education in the period 1991-2005 (Table 1.13). In addition, the IMF used year-on-year annual growth rates while the model used in this CEM and developed by DEC uses linear regressed growth rates.

16
Table 1.8: Sensitivity Analysis of TP Growth in 2006
TFP growth estimates in 2006 (%) (Cobb-Douglas)
α=0.3 α=0.4 α=0.5 γ=1 (CRTS) -3.3 -3.6 -3.9 γ=1.2 (IRTS) -4.7 -5.1 -5.5 γ=0.8 (DRTS) -1.9 -2.1 -2.4
TFP growth estimates in 2004 (%) (CRTS CES)
σ=0.8 σ=1 σ=1.2 α=0.5 -2.7 -3.9 -4.9
Source: Staff estimates Note: Growth rates are in log form.
Figure 1.12: Benin’s Terms of Trade
Terms of Trade (Export prices/ Import prices)
70
80
90
100
110
1991
1993
1995
1997
1999
2001
2003
2005
Ind
ex 2
000
=10
0
Source: World Bank DDP.
Table 1.9: Industries’ Contribution to Real Growth in Benin (Percentage Points)
1997 1998 1999 2000 2001 2002 2003 2004 2005 Average
GDP 6.1 4.5 4.7 5.8 5.0 4.5 3.9 3.1 2.9 4.5 Agriculture 2.3 2.6 1.7 2.6 1.2 2.6 0.6 1.5 0.8 1.8 Industry 0.6 0.1 0.3 1.3 1.4 0.8 0.3 -0.4 0.3 0.5 Manufacturing 0.2 0.1 0.2 0.2 0.2 0.2 0.2 0.1 0.1 0.2 Utilities 0.1 0.0 0.2 0.2 0.2 0.1 0.2 0.1 0.1 0.1 Mining -0.2 -0.1 -0.5 0.0 0.0 0.0 -0.1 0.0 0.0 -0.1 Construction 0.5 0.1 0.4 0.9 0.9 0.5 0.0 -0.6 0.1 0.3 Services 3.3 1.9 2.7 1.9 2.4 1.1 3.0 2.0 1.8 2.2 Transport 0.5 0.4 0.5 0.3 0.4 0.2 0.5 0.4 0.4 0.4 Trade 1.5 0.5 1.3 0.8 0.9 0.4 1.1 0.8 0.7 0.9 Public Administration
0.5 0.4 0.3 0.3 0.3 0.1 0.4 0.1 0.1 0.3
Other services 0.9 0.6 0.7 0.5 0.7 0.5 1.0 0.7 0.6 0.7
Source: Staff estimates based on data from World Bank (LDB).

17
1.32 The decline in real GDP growth after 2002 reflected a decline in the contribution to value added of agriculture and industry. The sharp slowdown in agricultural growth was due to a drop in cotton prices and a disruption in cotton production while the slowdown in industrial growth reflected problems with international competitiveness, and a contraction of construction activity.
1.33 The composition of exports changed to reflect the dramatic erosion of Beninese firms’ international competitiveness. The share of nonfood primary commodities in total merchandise exports grew from 55 percent in 2002 to 69 percent in 2006, while the share of manufactured exports dropped from 22 percent to 1 percent (Table 1.10). Within crude materials, cotton exports declined while exports of scrap metals and ores skyrocketed (Table 1.11) as prices of metals rose (Figure 1.13) against the price of cotton. This increase in the share of metal exports reflects transit trade rather than production of metals in Benin, and therefore has limited effect on value added (Table 1.9).
Table 1.10: Export Composition (percent of Gross Exports)
2002 2003 2004 2005 2006 Non food primary commodities 54.9 41.9 55.9 65.4 68.5 Primary and processed food 17.2 13.3 14.4 22.6 21.9 Manufactured goods 21.6 12.2 6.9 8.9 1.1 Fuels 6.2 32.7 22.8 3.1 8.5
Source: WITS
Figure 1.13: Metals and Minerals Index, 2000=100
0
50
100
150
200
250
300
1997 1999 2001 2003 2005 2007
Source: The World Bank Group, DECPG.
1.34 The informal economy, which accounts for nearly 90 percent of employment, is especially vulnerable as micro-enterprises are struggling to survive international competition and rapidly changing markets. As these firms lack investment resources, technical skills and modern means of production, they are hardly in a position to make significant gains in productivity. The most significant difficulties confronting small producers appear to be their isolation, wide dispersion and lack of organization.
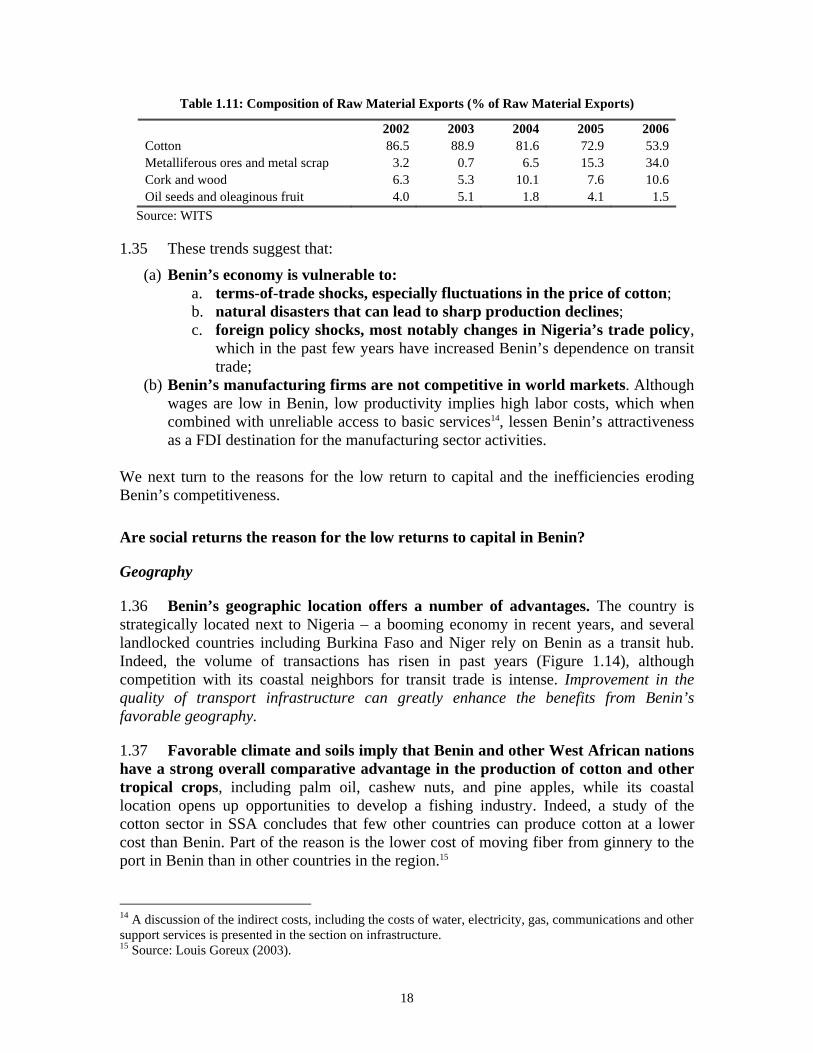
18
Table 1.11: Composition of Raw Material Exports (% of Raw Material Exports)
2002 2003 2004 2005 2006 Cotton 86.5 88.9 81.6 72.9 53.9 Metalliferous ores and metal scrap 3.2 0.7 6.5 15.3 34.0 Cork and wood 6.3 5.3 10.1 7.6 10.6 Oil seeds and oleaginous fruit 4.0 5.1 1.8 4.1 1.5
Source: WITS
1.35 These trends suggest that:
(a) Benin’s economy is vulnerable to: a. terms-of-trade shocks, especially fluctuations in the price of cotton; b. natural disasters that can lead to sharp production declines; c. foreign policy shocks, most notably changes in Nigeria’s trade policy,
which in the past few years have increased Benin’s dependence on transit trade;
(b) Benin’s manufacturing firms are not competitive in world markets. Although wages are low in Benin, low productivity implies high labor costs, which when combined with unreliable access to basic services14, lessen Benin’s attractiveness as a FDI destination for the manufacturing sector activities.
We next turn to the reasons for the low return to capital and the inefficiencies eroding Benin’s competitiveness.
Are social returns the reason for the low returns to capital in Benin?
Geography
1.36 Benin’s geographic location offers a number of advantages. The country is strategically located next to Nigeria – a booming economy in recent years, and several landlocked countries including Burkina Faso and Niger rely on Benin as a transit hub. Indeed, the volume of transactions has risen in past years (Figure 1.14), although competition with its coastal neighbors for transit trade is intense. Improvement in the quality of transport infrastructure can greatly enhance the benefits from Benin’s favorable geography.
1.37 Favorable climate and soils imply that Benin and other West African nations have a strong overall comparative advantage in the production of cotton and other tropical crops, including palm oil, cashew nuts, and pine apples, while its coastal location opens up opportunities to develop a fishing industry. Indeed, a study of the cotton sector in SSA concludes that few other countries can produce cotton at a lower cost than Benin. Part of the reason is the lower cost of moving fiber from ginnery to the port in Benin than in other countries in the region.15
14 A discussion of the indirect costs, including the costs of water, electricity, gas, communications and other support services is presented in the section on infrastructure. 15 Source: Louis Goreux (2003).

19
Figure 1.14: Volume of Transactions in the Port of Cotonou (1000 Tons)
Source: Benin DTIS based on data from Port of Cotonou.
Human capital
1.38 Shortage of skilled labor is not perceived as a major short run constraint to business growth by most firms in Benin who participated in the Investment Climate Assessment (World Bank 2005b). Only 26 percent of firms surveyed identified lack of skilled labor as a “major or very severe constraint”. The fact that other countries in the region including Burkina Faso have been able to grow at higher growth rates than Benin even though their combined primary, secondary and tertiary gross enrollment rates16 are below or equal to those in Benin (Table 1.12) suggests that human capital may not be constraining private sector growth in the short run.
1.39 Another indication that human capital may not be a constraint to growth in Benin is the fact that its indicators have posted major improvements in the period from 1991 to 2005. Primary school enrollment rates nearly doubled, while the primary completion rates and secondary school enrollment rates tripled during this period (Table 1.13). Female enrollment also increased rapidly during this period. However, the quality of education, especially primary education, has remained low and presents an obstacle to improving secondary and tertiary education indicators.
1.40 However, shortage of skilled labor is a significant constraint to large firms. Secondary and tertiary school enrollment rates although at par with other HIPCs and countries in SSA have remained below those in LICs limiting the supply of professional and technical staff. Expanding enrollment and quality of post-primary education is critical if Benin is to scale up its small scale processing, manufacturing and service sectors, and improve productivity. Indeed, nearly 80 percent of large firms in Benin cite shortage of skilled labor as a major constraint to business operation.
16 Source: Human Development Reports (UNDP).

20
Table 1.12: School Indicators, most Recent Data for the Period 2000-06
Secondary school enrollment rates
(gross) (%)
Tertiary school enrollment rates
(gross) (%)
Primary enrollment rates (gross)
(%)
Benin 32.5 3.0 96.2 Burkina Faso 14.0 2.4 57.7 Mali 23.5 2.6 66.4 Senegal 21.3 5.4 78.4 Uganda 18.7 3.4 118.7 Madagascar - 2.6 138.5 Kenya 48.8 2.8 112.2 Togo 40.4 3.1 100.2 Niger 8.7 0.9 46.7 Cote d’Ivoire 24.9 - - Nigeria 34.2 10.2 102.9 Ghana 43.6 5.2 93.7 Tanzania - 1.4 110.5 Cameroon 44.3 6.1 116.7 South Africa 93.4 15.3 Mauritius 88.4 16.9 102.2 WAEMU 23.4 2.8 74.3 ECOWAS other than WAEMU 41.2 5.0 107.1 HIPC 33.6 3.5 98.4 Developing EAS 68.2 19.2 111.9 LICs 41.4 4.7 98.3 MICs 86.8 42.7 105.3 HICs 95.7 91.0 101.9
Source: World Bank, SIMA.
Table 1.13: School and Health Indicator Trends
1991* 1999 2000 2001 2002 2005 2006 School enrollment, primary (% gross) 53.7 74.3 77.3 85.2 90.7 95.7 .. Primary completion rate, total (% of relevant age group) 20.7 .. 34.9 38.8 40.9 64.7 .. Girls to boys ratio in primary and secondary education (%) 49.5 62.3 64.2 65.4 67.0 73.5 .. School enrollment, secondary (% gross) 10.1 19.1 19.8 21.5 23.3 32.5 .. Ratio of female to male secondary enrollment 41.6 46.9 46.5 47.9 47.9 56.7 .. Fertility rate (births per 1,000 women ages 15-19) .. .. 142 .. 136 127 123 Mortality rate, under-5 (per 1,000) 185 .. 160 .. .. 150 148 Mortality rate, infant (per 1,000 live births) 111 .. 95 .. .. 89 88 Births attended by skilled health staff (% of total) .. .. .. 66 .. 75 79 Immunization, measles (% of children ages 12-23 months) 79 75 68 65 78 85 89
Source: World Bank, DDP, * Note: In the case of health indicators, the data is from 1990.
1.41 The health condition of the labor force - another important determinant of the quantity and quality of labor – is not viewed as a constraint to growth in Benin. Most health indicators have improved more rapidly in Benin than in other countries of the region over the last decade. Infant and child mortality rates in Benin have declined substantially in the period from 1991 to 2006 suggesting improved health service

21
provision (Table 1.13). Unlike Southern Africa where HIV/AIDS prevalence rates are the highest in the world, only 1.8 percent of Benin’s adult population is HIV positive. However, other diseases, such as malaria and tuberculosis, are still widespread, limiting life expectancy in Benin, and placing the country at 147th place out of 177 countries ranked in the UNDP’s human development report 2007.
1.42 Nominal public spending on education and health doubled and its share in GDP rose in the period from 1997 to 2003.17 The share of education in total government expenditure increased while that of health initially increased but in 2002 and 2003 it declined substantially. The budget execution rate has improved in the health sector, but varies from year to year in education and rural water supply, mainly on account of shortfalls in capital spending. The share of expenditures on five major public health programs is driven by the availability of foreign funds rather than by national health priorities.
1.43 The aggregate outcomes hide large disparities in key health indicators between the poorest and the wealthiest households, and these disparities worsened between 1996 and 2001, as a result of more rapid progress among households in the top quintiles, and despite an apparently narrowing gap in utilization rates of health care services. Disparities between rural and urban areas and across regions exit, but they are not as large as the disparities between the poor and rich.18 It is worth noting that in Benin more than 80 percent of the rural population lacks any form of sanitation.
Land
1.44 There is no evidence that the current land tenure system is a binding constraint to the growth of the Beninese economy, and specifically to the growth of the agricultural sector, although access to agricultural land may become a constraint in the future. In general, access to land seems to be a moderate barrier to the growth of manufacturing and service firms surveyed in Benin. Out of about 200 firms surveyed in 2004/05, 34 percent indicated “land use” as a constraint to their firms.
1.45 The land tenure system is quite flexible.19 There are two major types of access modes – access with permanent ownership and access on temporary terms with no land ownership. Within each mode there are a number of options ensuring access to farmland for poor landless people. The first type includes free access to land; and access through inheritance, gifts, or purchase. Free access to land acquired by clearing and occupying land on a first come fist serve basis is almost non-existent in the south of Benin, but still relatively important in the north of the country, representing about 8 percent of available land. Access through purchase, formally forbidden, has become increasingly common. The second type of access confers only temporary rights of land use with obligatory payments of rent (renting, pledging, sharecropping) or none (borrowing or customary attribution).
17 Source: Benin PER (World Bank 2004b). 18 Source: Benin PER (World Bank 2004b). 19 Source: Honlonkou (2002).

22
1.46 However, farmers have identified scarcity of fertile land as a major cause of poverty. This is not surprising given the problems presented by high population growth combined with low yields (Table 1.14), although yields have risen dramatically between 1979-81 and 1999-2001.20 Access to land varies considerably regionally, but arable land cultivation in large parts of Benin has been stretched to its limits (Table 1.15), while the demand for fuelwood and grazing areas has resulted in a rapid degradation of the quality of available land resources. This degradation has important adverse consequences for the poor, who are being confronted with lower yields as well as rising costs.
Table 1.14: Agricultural Production and Yields
Benin SSA World Cereal, 1999-2001 Average crop yield (kg per hectare) 1047 1221 3096 Percentage change since 1979-81 50% 9% 41% Agricultural land Hectares of cropland per 1,000 population, 1999 303 274 251 Percent of cropland that is irrigated 0.6% 3.8% 18.3% Agricultural inputs Average annual fertilizer use, 1999 (kg per ha) 31 12 94 Food security Volatility in domestic cereal production, 1992-2001 14.1% 6.5% 3.5% (average percent variation from mean) Net cereal imports and food aid as a percent of total 14.9% 13.5% n.a. Consumption, 1998-2000
Source: World Resource Institute (http://earthtrends.wri.org)
Table 1.15: Pressure on Land by Region, 1990-2005
Cultivable Area (km2)
Sustainably cultivable (%
of area)
Cultivated in 1990 (% of
area)
Cultivated in 1999 (% of
area)
Cultivated in 2005 (% of
area) Atacora 13410 40 13 17 23 Borgou 27500 40 13 20 29 Zou 12300 47 27 25 49 Atlantique 2350 57 52 74 80 Mono 2810 57 48 67 88 Oueme 3480 57 60 96 96 Source: Benin Poverty Assessment (World Bank 2003)
Infrastructure
1.47 Although the state of infrastructure in Benin is poor, some types of infrastructure services are more binding for growth than others. Among a set of 30 African countries Benin stands outs as a strong performer on access to piped water, though its performance on other services is less favorable.21,22 Overall, however, limited, poor quality, and in some cases expensive, infrastructure services constrain the potential for high and sustainable growth in the long-run. 20 Source: Benin Poverty Assessment (World Bank 2003). 21 Source: Banerjee et al. (2008) 22 Benin also stands out as a strong performer in terms of water and sanitation service expansion showing growth rates in the provision of water and sanitation services of 4-8 percent per year.

23
1.48 Several distinct types of infrastructure services in Benin are considered low quality by the surveyed manufacturing firms, with electricity supply topping the list. Sixty-two percent of firms consider it a major constraint, and 68 percent of firms report losses due to limited supply of electricity (Table 1.16). Unlike the average WAEMU country, Benin is a net importer of electricity, and the main problem is reliability of supply rather than cost of electricity. The average output loss due to electricity supply problems is about 6.5 percent, a number slightly above the average for SSA of 5.9 percent. Electricity rates are similar to those in most other countries in the WAEMU region, and in theory, SBEE (Societe Beninoise de l’Energie Electrique) offers preferential rates to manufacturing firms, but the definition of manufacturing is unclear. Consequently, most enterprises operating in Benin, such as fruit juice producers and hotels, do not qualify for these preferential rates.
Table 1.16: Share of Firms Reporting Loss Due to Limited Supply of Electricity and Water
Electricity Water No loss 32.5 81.6 5% or less 27.1 11.2 5%<=loss<10% 20.5 3.2 10%<=loss<15% 7.2 2.4 15%<loss<25% 6.6 1.6 25%<=loss<50% 6.0 0 Greater than 50% 0.0 0 Total 100.0 100.0
Source: Staff estimates based on ICA.
1.49 There is a pressing need for greater investment to increase the reliability, coverage, and efficiency of the electricity sector. Heavy reliance on one source for electricity – Ghana’s Akosomo dam – produced severe electricity shortages in Benin during the 1998 Ghanaian drought. Since then there have been attempts to diversify electricity production facilities and a move to import generators. A second 104 mw dam under construction on the Mono River is expected to relax electricity shortages.23 The transmission efficiency of the state monopoly SBEE is lower than that of most other countries, and the coverage of much of the country is minimal.
1.50 Telecommunication services, provided by the state telecomm monopoly “Office des Postes et Telecommunications” (OPT), are more than twice as expensive in Benin than in other LICs (Table 1.17). Differentials are even larger when Benin is compared to Burkina Faso, Ghana, and Nigeria. Also, coverage for telecommunications is low, and the quality of services is rated as poor. OPT is responsible for both mail and phone services, but since 2002 there has been partial privatization of the telecom side of OPT. Mobile telephony has been opened to private providers and the number of mobile phone subscribers tripled since 2003 to 89 per 1000 people – higher than the average for LICs, and HIPCs. Access to internet is very limited, one per 100 inhabitants with very limited use, similar to other countries in the region. 40 percent of firms identify 23 Most of the country’s energy for domestic use comes from wood fuel. (Source: http://www.nationsencyclopedia.com/economies/Africa/Benin-INFRASTRUCTURE-POWER-AND-COMMUNICATIONS.html).

24
telecommunications and transport infrastructure and services as a severe constraint to their business operations.
1.51 The quality of road and rail infrastructure is very poor. The rail line connecting Cotonou to the North ends at Parakou, where merchandise must be transferred to trucks. Paved roads account for only 10 percent of all roads in Benin (Table 1.17), but even along the paved roads the burden of fees and taxes levied on road transport, and numerous police, customs, and municipal checkpoints raise costs and exacerbate delays. As a result Burkina-based truckers prefer to ship merchandise through Lome, Accra or Tema rather than Cotonou. This increases delays and the costs of goods delivered to and from this region.
Table 1.17: Infrastructure Indicators
Average cost of a call to US (US$ per 3 mins)
Telephone mainlines (per 1,000
people)
Paved roads (% of all
roads)
Broadband Subscribers (per 1,000
people)
Mobile phone subscribers (per 1,000
people) 2004 2005 2004 2005 2005 Benin 4.8 9.0 9.5 0.0 89 Burkina Faso 1.1 7.4 31.2 0.0 43 Uganda 3.2♦ 3.5 23.0♦ .. 53 Ghana 0.4 14.5 17.9♦ 0.1 129 Nigeria 1.5 8.7 15.0 0.0 132 South Africa 0.8 100.9 .. 3.5 724 HIPC 2.2 12.9 .. .. 61 Sub-Saharan Africa 2.4 16.8 .. .. 123 Low income 2.0 36.7 .. 0.9 77 Lower middle income 2.1 204.8 .. 23.7 290 Middle income 1.6 210.1 .. 22.5 377 High income 0.8 499.6 100.0♦ 161.7 838
Source: DDP, World Bank; ♦Data refer to 2003.
1.52 The international airport in Benin is underutilized and air transport costs are high. Although the airport has the capacity to increase the number of flights, there are few flights at high prices because of the near monopoly on flights to Europe by Air France. The airport is also underutilized for the purpose of transporting agricultural and other products to developed countries by air. It lacks equipment and storage facilities for goods destined for export, notably refrigeration for perishable goods.
Is the macroeconomic environment a constraint to growth?
1.53 Monetary and fiscal policies have insured macroeconomic stability in recent years and are not a binding constraint to growth. Benin is a member of the West African Economic and Monetary Union (WAEMU) and the regional central bank (BCEAO) that controls its monetary policy has been prudent. Inflation has been low since the mid-1990s despite increases in international prices of oil (Figure 1.15). Inflation was contained under the WAEMU convergence criterion of 3 percent through strong fiscal discipline and prudent monetary policy at the regional level.

25
1.54 A narrowly defined primary fiscal deficit points to a broadly sustainable fiscal position in 2007. In mid-March the IMF’s fourth review of Benin’s PRGF commended the government’s performance in improving fiscal management, while Standard and Poor’s Sovereign Ratings Service confirmed Benin’s B-rating for both long-term and short-term credit in mid-December 2007. Lower net bank credit to the government has facilitated private sector borrowing (Figure 1.16). According to the DSA conducted by IDA and IMF teams in 2007, Benin’s external debt is expected to remain sustainable over the medium run and the risk of debt distress is moderate.
Figure 1.15: Average Annual Inflation Rates, Benin
0
5
10
15
20
25
30
35
40
45
1989 1990 1991 1992 1993 1994 1995 1996 1997 1998 1999 2000 2001 2002 2003 2004 2005 2006
CPI
ann
ual %
cha
nge
Source: World Bank DDP.
1.55 Benin’s fiscal position strengthened in 2007 as revenue reached a record high (19 percent of GDP) due to improved governance in revenue agencies and improved expenditure procedures. The government allocated about 47 percent of the total budget to priority sectors which included infrastructure, education, and health.24 The government continued to clear domestic payment arrears. Creating fiscal space for more pro-growth public investment and pro-poor spending will require continued efforts to broaden the tax base. Limiting spending on wages will also be key to meeting expenditure outcomes.
24 Public expenditures on infrastructure, education, and health represented 5.2 percent, 4.9 percent and 2.3 percent of GDP, respectively.

26
Figure 1.16: Benin Monetary Developments, 2000-06 (Billion of CFA Francs)
Source: International Monetary Fund, Article IV Consultation, January 2007.
1.56 The overall balance of payments and reserve position improved between 2004 and 2007. The external current account was broadly in line with the IMF-supported program target of 6.7 percent of GDP in 2007 as a decrease in export volume and higher oil prices were more than fully offset by lower oil imports and weaker capital goods imports.
1.57 The macroeconomic situation remains vulnerable to exogenous shocks due to Benin’s dependence on cotton and transit trade with Nigeria and to exchange rate shocks. The real effective exchange rate has appreciated by 20 percent between 1999 and 2006 (Figure 1.17). In some years, the appreciation was quite strong, especially during 2002-2003, where the appreciation reached close to 10 percent. The strength of the Euro, to which the CFA franc is pegged, in recent years, has been a source of the real appreciation.
1.58 The real exchange rate appreciation is higher than the one for the average WAEMU country, but lower than the appreciation in Nigeria. Some of the appreciation has been driven by higher inflation in Benin than its trading partners. In spite of prudent monetary policies at the BCEAO, inflation in Benin has frequently been above the regional average. Even by WAEMU standards, Benin is one of the economies with the highest REER appreciation over the medium term. Also, since most of Benin’s trade is with Europe, it is the difference between inflation in Benin and in Europe which also explains some of the exchange rate appreciation.

27
1.59 Benin’s competitiveness has weakened due to the real appreciation, and increased factor costs. Benin may be losing export share in third country markets because of an overvalued exchange rate, especially compared to countries with currencies pegged to the dollar or with lower inflation than Benin. In the case of cotton, the sharp appreciation has mostly offset the rise of the dollar prices of cotton in 2007 and early 2008.25 A possible dollar rebound could reduce the REER appreciation and make Benin more competitive, but if this does not happen there may be a need to think about the policy implications of a real exchange rate misalignment. Since there is a well-recognized negative relationship between exchange rate overvaluation and economic growth, more analysis will need to be devoted to this issue.
Figure 1.17: Real Effective Exchange Rate, Benin (2000=100)
Source: World Bank and IMF Working Paper 07/212, Competitiveness in the Franc Zone 2007.
Is the tax code a binding constraint to private sector growth?
1.60 Most of the firms in Benin perceive taxes and tax administration as the top two most binding constraints to business growth. Nearly 90 percent of firms in Benin thought that taxes and tax administration are severe obstacles to their operations, compared to just 68 percent in Kenya, 36 percent in Mali, 48 percent in Uganda, 50 percent in Senegal.26
25 The rise in the US dollar denominated price of cotton was part of an overall rising trend in US dollar denominated prices of commodities. 26 Source: Benin ICA
CHART: BENIN REAL EFFECTIVE EXCHANGE RATE 1999-2006 (2000=100)
80
85
90
95
100
105
110
115
120
125
1999 2000 2001 2002 2003 2004 2005 2006

28
1.61 Domestic taxes remain high and tax rules are complex27 despite the fact that taxation has been simplified considerably and rationalized as part of WAEMU harmonization. Entrepreneurs in Benin must make a greater number of tax payments than in other countries of the region, and the total tax burden is a much higher share of profits than the average for SSA and rest of the world (Table 1.18). The tax burden, measured by the total tax rate indicator that represents the amount of all taxes and mandatory contributions born by the business, expressed as a percentage of commercial profit, has increased between 2006 and 2008 (Table 1.19). It should be noted that labor taxes are significantly higher than in SSA and in the OECD countries. And despite a decline in the number of tax payments, the time to comply with the tax regulations in Benin remains unchanged. According to data for 2008 Benin belongs to the group of 10 economies in the African Union with the highest total tax rates.28
Table 1.18: Paying Taxes, 2008
Benin SSA OECD Payments (number) 55 38.7 15.1 Time (hours) 270 321.2 183.3 Profit tax (%) 16.7 21.4 20.0 Labor tax (%) 32.7 13.3 22.8 Other taxes (%) 23.9 33.3 3.4 Total tax rate 73.3 68.0 46.2 (% of profit)
Source: Doing Business 2008 and PricewaterhouseCoopers.
Table 1.19: Benin Paying Taxes
2006 2008 Payments (number) 72 55 Time (hours) 270 270 Corporate income tax (%) 19.7 16.7 Labor tax (%) 33.6 32.7 Other taxes (%) 15.3 23.9 Total tax rate 68.5 73.3 (% of profit)
Source: Doing Business 2008 and 2006 and PricewaterhouseCoopers
1.62 The large size of the informal economy is another indication that tax rates and procedures distort incentives and create activities designed to avoid paying taxes. Benin is characterized by an unusually large informal sector even by African standards.29 Informal employment is estimated to account for two-thirds of employment in Benin, excluding agriculture and trade.30,31 If the latter are taken into account the
27 Enterprises operating in Benin are subject to a number of taxes including a corporate tax, payroll tax, property tax, business license tax, insurance tax, tax on interest, fuel tax, value added tax, advertising tax, and stamp duty tax. 28 According to Doing Business 2008, only Liberia, Eritrea, Mauritania, Central African Republic, Congo, Dem. Rep., Sierra Leone, Burundi, Gambia have higher total tax rates. 29 Source: Benin Diagnostic Trade Integration Study (World Bank 2005a). 30 Source: Maldonado (1993).

29
formal sector employs only about 10 percent of the workforce. As discussed in Chapter 3, unofficial re-exports are much larger than official exports. Many people in Benin are involved or benefit from the large informal and semi-formal trade flows.
1.63 Benin’s government revenues depend heavily on taxation of international trade but trade taxes are lower and less variable in Benin than in other African countries.32,33 Benin’s tariffs are set by WAEMU and under WAEMU’s Common External Tariff (CET), external tariffs are harmonized to a structure with only four possible rates: 0 percent for social and cultural necessities and including medicines and educational materials; 5 percent for primary inputs and capital goods, 10 percent for inputs and intermediate products, and 20 percent for final consumer goods. The CET raised nominal tariffs rates in Benin on average by 0.8 percentage points and on consumer goods by 4.7 percentage points as prior to adopting the CET Benin maintained low tariffs – especially on consumer goods in an effort to promote re-exports to Nigeria. As a result the structure of both nominal and actual applied rates have changed reflecting increases in tariff on final products and a decline in tariffs on unprocessed and semi-processed goods.
Table 1.20: Nominal and Applied Tariffs Rates, 2004
Nominal Actually applied All goods 12.2 13.1 Agriculture* 15.2 17.7 Non-agriculture* 11.6 14.1 Capital goods 7.8 9.2 Intermediate products 10.5 11.5 Consumer goods 18.1 19.1 Source: World Bank (2005a). *Data on average tariffs for agriculture and non-agriculture are for 2003.
1.64 The large informal transit trade sector is linked to the differentials between trade and taxation policies in Benin and Nigeria, as discussed in Chapter 3, raising the question of the sustainability of this trade and fostered corruption.
1.65 The tax base is very narrow partly due to the high tax burden which encourages informality but also because of poor tax administration that allows many large companies to avoid paying taxes. About 70 percent of large enterprises, including some in the formal sector, pay little or no taxes, with many of them claiming that they have no tax liability or are owed refunds. The fiscal authorities have been lenient with the monitoring and enforcing of tax payment obligations, and some influential companies in the informal and semi-formal economy have been granted special tax advantages in a
31 The growth of the informal economy in the mid 1990s is closely related to the recession in the formal sector in the early part of the decade. 32 Still the government is dependent on trade taxes as a source of revenue. Trade taxes account for more than half of total tax receipts and about half of government revenue. 33 The dispersion of actually applied rates in Benin in 2003 was relatively small, ranging from a minimum of 1.5 percent to a maximum of 22.5 percent.

30
nontransparent fashion. As a result taxation falls disproportionately on a few enterprises in the formal sector.34
1.66 Poor tax administration of the export promotion system implies that many companies do not benefit from various tax incentive promoting exports because rebates are either not received or received only after long delays. This situation hurts efforts to promote export diversification and the ability of Benin to develop and grow its manufacturing sector.
Is government effectiveness an obstacle to growth?
1.67 Corruption was cited as the third most binding constraint to business growth in Benin, according to Benin’s 2005 Investment Climate Assessment (ICA) report. Nearly 85 percent of firms in Benin identify corruption as a severe obstacle to their operations. These perceptions correspond to other measures of governance including World Bank’s governance indicators.
1.68 Benin’s score on corruption is low compared to other countries in the region35 and has declined substantially in the past decade. While Benin scores higher than other SSA countries in terms of voice and accountability, political stability, government effectiveness, regulatory quality, and rule of law (Table 1.21), Benin’s rank on all these indicators has declined significantly during the period 1998-2006 (Table 1.22). There has been a particularly big drop in the past few years in Benin’s score on rule of law, control of corruption and political stability.36
Table 1.21: Governance Indicators, Benin, 2006
Percentile Rank
Governance Score Governance Indicators
(0-100)
Regional Average, Percentile (-2.5 to +2.5)
Standard Error
Voice and Accountability 57.2 32.7 0.33 0.16 Political Stability 59.1 35.6 0.38 0.26 Government Effectiveness 35.1 27.2 -0.50 0.17 Regulatory Quality 40.0 27.4 -0.37 0.18 Rule of Law 36.7 28.8 -0.54 0.15 Control of Corruption 21.8 30.3 -0.81 0.18
Source: Kaufmann D., A. Kraay, and M. Mastruzzi (2007)
34 Source: Benin Diagnostic Trade Integration Study (World Bank 2005a). 35 According to Transparency International in 2007 Benin ranked below Africa’s good performers – Ghana and Uganda. While its regional rank is mid-range, its global ranking is lower with two third of countries performing better than Benin. 36 Note a decline in a country’s score may occur for two reasons: (i) the country’s governance may deteriorate; (ii) other countries improve their governance; (iii) a combination of both may occur. Regardless of the reason deterioration implies that the country is less attractive as a business location compared to other countries.

31
Table 1.22: Governance Indicators, benin
Percentile Rank Governance Score Governance Indicators Year (0-100) (-2.5 to +2.5)
Standard Error
2006 57.2 0.33 0.16 2002 50.5 0.10 0.21
Voice and Accountability
1998 59.6 0.39 0.30 2006 59.1 0.38 0.26 2002 71.6 0.71 0.42
Political Stability
1998 65.4 0.61 0.41 2006 35.1 -0.50 0.17 2002 34.6 -0.53 0.23
Government Effectiveness
1998 44.1 -0.34 0.18 2006 40 -0.37 0.18 2002 38.5 -0.39 0.24
Regulatory Quality
1998 56.1 0.26 0.43 2006 36.7 -0.54 0.15 2002 41.9 -0.37 0.21
Rule of Law
1998 51.4 -0.13 0.26 2006 21.8 -0.81 0.18 2002 30.1 -0.74 0.3
Control of Corruption
1998 28.2 -0.69 0.29
Source: Kaufmann D., A. Kraay, and M. Mastruzzi 2007: Governance Matters VI: Governance Indicators for 1996-2006
1.69 Courts – the cornerstone of contract enforcement – are perceived as not operating in a transparent and independent fashion. The political influence on the judiciary is pervasive, especially in making decisions regarding magistrate promotions. The court focus on economic crimes has not been successful largely because vested interests have been able to make calls to powerful figures to influence its judges. The process of disputing a claim is much lengthier and costlier in Benin than the average for other countries in the region and developing countries in all other regions. In South Asia the process is lengthy but much less costly than in Benin where the cost of enforcing a contract is nearly 60 percent of the claim (Table 1.23). Only Benin’s labor regulations strongly favor entrepreneurs as the costs of firing workers and of closing businesses are significantly lower in Benin than in the average of other countries.
1.70 Weak contract enforcement distorts incentives and raises transaction costs. Lack of respect of contractual obligations has undermined the cotton sector reforms, as explained in Chapter 3. There is sluggish implementation and backsliding in reforms that would deregulate and attract investors to promising sectors. The main reason for this is the reluctance of key interest groups to give up rents and control. The weakness of the legislature also undermines the political checks and balances that contribute to the security of property and contractual rights of investors, as discussed in chapter 2.
1.71 Corruption is reported to exist in the public sector. Corruption related to the purchase and sale of drugs is a serious problem in the public health sector. The long

32
porous border with Nigeria permits substitution of imported low-priced and low-quality drugs for the higher quality drugs supplied by the center supplying essential medication (CAME). The Communal Management Committees (COGECs) tend to hoard funds, sometimes not releasing them even for the purchase of minor equipments. Apart from raising the cost of health services for the poor, these practices undermine the effectiveness of public spending by reducing utilization of public services.
Table 1.23: Enforcing Contracts, 2008
Region or Economy Procedures (number)
Duration (days)
Cost (% of claim)
Benin 42.0 720.0 58.7 East Asia & Pacific 37.3 549.8 47.8 Eastern Europe & Central Asia 35.9 443.0 22.7 Latin America & Caribbean 39.3 699.9 30.7 Middle East & North Africa 43.5 699.0 24.0 OECD 31.3 443.3 17.7 South Asia 43.5 1047.1 27.2 Sub-Saharan Africa 39.4 643.0 48.7
Source: Doing Business Database.
1.72 The financial accountability of public higher education institutions is weak. Public higher education institutions are financed through a mixture of public funding and student fees, but budget documents do not present a complete picture of the financing of higher education. There are arrears in payments of salaries and allowances to researchers, as well as debts to suppliers running into tens of millions of CFAF.
Do Beninese Firms “Innovate”?
1.73 The small size of Benin’s domestic market implies that in order to grow rapidly and efficiently Benin must expand the volume of its existing exports, find new markets for its exports, and start exporting new and better quality products. The latter depends on the ability of Benin to “discover” products new to Benin. According to Hausmann and Rodrik (2003) diversification of the productive structure requires “discovery” of an economy’s cost structure. Firms must experiment with new product lines, adapt new technologies from abroad to local conditions, and “discover” which products they can produce at low enough cost to be profitable and competitive. The data suggest that Beninese firms have not been able to “innovate” compared to other countries in the region and the rest of the world.
1.74 As a way to assess the level of entrepreneurial effort of “self discovery” in Benin, one can look at the number of exported goods, new exports, and discontinued exports measured at the 4 digit level of the Harmonized system in the period 2002-2006. The numbers presented in Table 1.24 are consistent with a decline in the rate of growth since 2003 (Table 1.2). While the number of exported goods more than doubled between 2002 and 2003, and peaked in 2004, it nearly halved between 2005 and 2006.

33
1.75 The decline in the number of new exports in the period 2003-06 is steep. Every year since 2003, when Benin exported 245 new products, the number of new exports decreased and the rate at which this number declined increased each year (Table 1.24). By 2006 Benin exported just 68 new products compared to 124 in the previous year. Another troubling sign is the fact that the number of discontinued exports has grown at a phenomenal pace. While only 35 exports were discontinued in 2003, this number reached 211 in 2006. A decline was observed also in the number of export destinations for products made in Benin (Table 1.24).
1.76 These statistics indicate that the entrepreneurial effort has weakened in the past few years. Since re-exports are included in these statistics – the effective “innovation” effort in Benin is much weaker than these statistics suggest and is therefore inadequate to ensure high and sustainable growth record.
Table 1.24: Measuring “Innovation” Effort in Benin
Number of: 2002 2003 2004 2005 2006 Exported goods 164 374 414 419 276 New exports 245 178 124 68 Discontinued exports 35 138 119 211 New exports discontinued next year 124 78 85 68 Export partners 87 85 79 81
Source: Staff estimates using UN COMTRADE data, HS 4 digits.
Are coordination externalities the most binding constraint to growth?
1.77 Firms need services, which require simultaneous, large scale investments, in order to “innovate”, make profits and market their products successfully (Rodrik, 2004b). These services are taken for granted by entrepreneurs in developed countries. In developing countries, however, lack of such services is a serious obstacle to output expansion of existing products, improving the quality of existing goods, and new product development (“self-discovery”). Examples of such services include access to electricity, water, telecommunications, logistics transport networks, marketing, research and product quality information, health and quarantine measures to protect and improve the quality of agricultural output. In a global economy entrepreneurs need also access to information on international industry standards, and international trade agreements in order to compete in world markets and understand the implications of these agreements for their operations.
1.78 Benin has turned to regional integration as a stepping stone to global integration. At the regional level, Benin has taken an active role in coordinating its policies, laws and regulations with the member countries of the WAEMU and ECOWAS, which are setup to boost economic integration in Western Africa. Despite impressive progress of coordination and institutional integration within WAEMU, intra-WEAMU trade is low and Benin’s official exports to WAEMU amounted to about 4 percent of total exports in 2000-02. The low level of intra-WAEMU trade reflects high transport costs and other barriers to trade including lengthy and multiple customs and other trade procedures. Unofficial trade with Nigeria, however, is very large.

34
1.79 There are many examples of coordination failures in Benin, some of which have received attention and policies have been implemented to address them. In the agricultural sector, there has been under-provision of public goods such as rural roads, storage depots, inputs, and research and extension services. The government is aware of some of these issues and in 2006 it reduced the shortfall in extension agents by hiring 2,000 additional extension agents.
1.80 Coordination issues are less of a constraint for Benin than for countries that are landlocked, with large territory and low population density; they are also less of a pressing issue for Benin than in countries where “non-traditional exports” have emerged. In Benin other constraints hamper the emergence of new sources of growth including poor government effectiveness, low quality basic services, notably infrastructure, and weak “innovation” effort.
1.81 Very few small producers in the informal sector can afford the equipment they need to ply their trade in satisfactory conditions. Since they operate in the informal economy which is under-capitalized, they are seldom able to borrow investment capital through official channels. Mutual saving and loan associations have been established to remedy this deficiency. For some types of equipment beyond the extremely limited investment capacity of individual entrepreneurs, common facilities workshops have been established to provide production services on a fee-paying basis. The dynamism of the re-export trade described in Chapter 3 testifies to the entrepreneurial potential in Benin.
CONCLUDING REMARKS
1.82 This chapter looked at recent growth trends and identified key cross-sectoral constraints holding back Benin’s economic development and private investment. From this analysis we learn that although Benin is not a liquidity constrained economy, private investment in Benin is low because of low return to economic activity – a result of (1) costly and unreliable infrastructure services including electricity, domestic rail and road transport, and communication; (2) weak “innovation” effort; and (3) failures related to a distortionary and poorly administered tax system, including customs and trade procedures; corruption and weak contract enforcement.
1.83 This exercise in growth diagnostics is intended to help the government sequence its actions to address those constraints which are most binding. Recommendations here are provided for addressing infrastructure deficiencies and failures related to taxation, trade facilitation, corruption and weak contract enforcement. Constraints specific to Benin’s too leading sectors, cotton and transit trade, are examined in detail in chapter 2. Diversification and innovation issues are discussed in chapter 3. The recommendations presented below are focused on the constraints diagnosed in this chapter. Once these constraints have been addressed, other currently les binding constraints, such as access to credit, education, and land titling issues could move to forefront of policymakers’ attention. These recommendations are in line with those of the PRSC-5 and DTIS action matrixes.

35
Infrastructure
1.84 Electricity. Lack of reliable electric power is by many accounts ranked as the most adverse factor affecting the investment climate in Benin. The CEM supports the following recommendations:
1. Begin implementation of the rehabilitation plan of the state electricity company SBEE to set the stage for greater private sector participation, including (i) decision on management structure incorporating vision on private sector, and (ii) monitoring performance indicators. After this is done, establish (iii) a new managerial structure and private sector principles for SBEE and then (iv) launch bids for private sector energy generating capacity and (v) establish a regulatory framework operational for the electric power sector.
2. Implement a new tariff adjustment formula for electricity tariffs.
1.85 Telecommunications. Poor quality and high costs of telecommunications are also a problem in Benin. The CEM endorses the following measures:
1. New legislative and regulatory texts for the Telecom sector should be adopted by the Council of Ministers.
2. Put in place effective regulation by the regulatory authority, including
a. Annual evaluation of the obligations of the operators;
b. Bidding process to acquire spectrum management and monitoring equipments launched;
c. Market analysis to define dominant position in identified markets;
d. All dominant operators have an approved interconnection catalogue;
e. Cost of scare resources in line with international average (frequencies and numbering)
1.86 Roads. Continue to upgrade the road network, especially roads linking Benin with other countries of the region ad ensure adequate road maintenance.
Governance and Policy Failures
1.87 Port of Cotonou. The port plays a crucial role in Benin’s competitiveness as a regional transport hub, but the port suffers from considerable delays due to corruption and weak administration. The CEM recommends:
1. Decision on management structure to improve the efficiency of harbor services (concession is implemented).

36
2. Reduce processing time of commercial disputes and complaints between the operators, the customers and the State.
1.88 Customs Administration. To reduce corruption and increase efficiency of customs, the CEM presents the following recommendations:
1. Complete implementation of SYDONIA + + system and eliminate all manual date entry.
2. Eliminate all cash payments above a certain threshold and develop electronic funds transfers.
3. Reduced number of inspections based on carefully articulated criteria, development of an analytical database on smuggling patterns and perpetrators.
4. Initiate discussion and set up consultations system, coordination of data collection and sharing of information with other agencies and countries.
5. New system of remuneration and punishment of corrupt agents, and increased budget for customs salaries.
6. Increase budget of customs to cover costs of equipment and personnel.
7. Monitor transit shipments through more accurate and complete record-keeping, preferably electronically rather than through multiple checkpoints and customs escorts.
8. Respect BIVAC valuations and increase coverage of its operations to food products.
1.89 Judiciary. Weaknesses in the judiciary system have been identified as an important impediment to speedy and impartial resolution of business disputes in Benin by a number of studies. The CEM recommends:
1. Additional training of judges
2. Greater use of arbitration
3. Greater use of institutions such as OHADA.
1.90 Corruption. Lack of transparency and corruption has been identified as a binding constraint. The CEM supports the creation of the National Governance and Anti-Corruption Strategy through:
1. Dissemination of information about corruption through participatory consultative workshops using recent survey results on the extent of corruption in Benin.
2. Design the strategy in consultation with civil society.

37
3. Create an institutional framework for implementation of the strategy.
4. Increase the capacity of the media to support the anti-corruption efforts.
1.91 Taxation. This chapter has identified the tax system in Benin as unsupportive of entrepreneurship and innovation. The CEM recommends:
1. Consideration of lowering corporate tax rates in line with WAEMU.
2. Enlargement of the tax base through taxation of large firms that currently fail to pay taxes and collection of tax arrears.
3. Improved application of export promotion measure such as payment of VAT rebates to exporters on a timely basis.

38
2. SPECIFIC CONSTRAINTS IN THE COTTON AND TRANSIT TRADE SECTORS
2.1 As noted earlier, even by African standards Benin’s economy is undiversified and depends heavily on two sectors, cotton and transit trade with Nigeria. Both of these sectors are facing serious vulnerabilities. Cotton has accounted for the bulk of formal exports in recent decades and an important part of income generation. Even more significant in terms of GDP and government revenue is the largely informal and little understood but thriving informal commerce with Nigeria and other countries of the region. This chapter assesses the significance, vulnerabilities, and potential for Benin’s economic development of each of these two complex and crucial sectors.
2.2 The analysis of these two mainstays of Benin’s economy is important in itself and also as a way to understand the obstacles to a more sustainable and diversified economy. In the case of the cotton, the focus is on explaining the unexpected difficulties following market reforms, whereas in the case of transit trade, the chapter seeks to shed some new light on these poorly understood parallel trading circuits. There have been no recent systematic studies of the re-export trade with Nigeria, despite its importance for Benin. The few existing studies on this subject are out of date and underestimate the volume of this trade and its significance.
COTTON
The Evolution and Significance of Cotton in Benin’s Economy
2.3 Since the early 1990s, cotton has dominated Benin’s formal sector, in agriculture, industry, and foreign trade, but now faces serious difficulties. Until recently cotton accounted for about 50-80 percent of merchandise exports, 10 to 15 percent of GDP, and close to half of non-customs fiscal revenues, depending on world prices and the size of the crop. The farming, transport and processing of cotton contributes directly and indirectly to the livelihoods of some 60 percent of the population. Of Benin’s 77 communes, about 60 are involved in cotton production. Cotton is particularly important in the north of the country, where plots and yields are somewhat higher than they are in the center and south.
2.4 The cotton sector in Benin consists of smallholding farmers with plots of 1-2 hectares, 18 ginning factories, of which 8 are privately owned, a dozen importers of inputs (mainly fertilizer and pesticides), and two private cotton-oil producers. In addition a number of ancillary services such as transport and finance revolve around cotton.
2.5 In Benin as in other WCA countries, cotton emerged as a cash crop in the 1940s and 1950s, under the direction of the French parastatals, Compagnie Française pour le Développement des Fibres Textiles (CFDT) and Société d’Assistance Technique et de

39
Coopération (SATEC), but remained marginal until 1960 (Figure 2.1). Between 1960 and 1972, cotton production grew strongly under CFDT’s control, with substantial support provided to farmers by the CFDT and other French aid agencies (CIPB 2008). In 1972, with the advent of a Marxist regime, the CFDT gave way to a national state monopoly SONACO, which in turn was split into two agencies SONAGRI and the SONACEB. These two agencies did not focus on supporting cotton in particular, and from 1973 to 1982, production declined.
2.6 In 1982, the SONAPRA (Societé Nationale Pour la Promotion Agricole) was established. The SONAPRA set a single price for seed cotton and inputs each year prior to the growing season. Input credits were reimbursed via a deduction from the purchase price of cotton. Under the SONAPRA’s guidance, production expanded sharply, with major government investments in the sector. While the organization and stability of the state-run system were strengths in Benin and elsewhere, there were significant weaknesses too. Prices paid to farmers were well below world prices, and while production increased due to expanding acreage, productivity stagnated. The SONAPRA functioned quite effectively until around 1997. With the arrival of the Kerekou administration in 1997, however, the SONAPRA became increasingly politicized and inefficient, with hiring increasingly reflecting political rather than economic considerations.
2.7 Starting in the early 1990s, as in a number of African countries, Benin gradually opened up its cotton sector to the private sector, as part of the shift away from the Marxist regime towards a more market-oriented economic system. The reforms and their effects are discussed in detail below.
2.8 Production and exports have plummeted in the last few years due to adverse global and domestic developments. At the international level, cotton export prices have been depressed by cotton subsidies in developed countries and the appreciation of the CFA franc vis-à-vis the dollar. World cotton prices in real US dollar terms, deflated by manufacturing prices, fell sharply in the 1970s, but have shown no clear trend since the mid-1980s (Figure 2.2). Figure 2.3 shows that export prices and producer prices in Benin rose sharply in CFA francs in 1994-95 due mainly to the 1994 devaluation along with an increase in the dollar price. Since then prices in CFA francs have edged back down, due mostly to the appreciation of the euro against the dollar since 2001. In 2007 and early 2008 dollar prices of cotton have risen along with other commodity prices, but these have been mostly offset in CFA franc terms by a sharp further appreciation of the euro against the dollar. Figures 2.3 and 2.4 also show that the share of the export price accruing to producers has tended to rise over time, with producer prices also smoothing fluctuations in export prices. Producer prices in Benin have recently exceeded those of neighboring countries.
2.9 Cotton subsidies have been a major flashpoint in the Doha Round of trade negotiations and featured prominently in the press, with West African producers, including Benin, and other developing country producers, notably Brazil, leading the efforts to reduce developed country cotton subsidies. While an agreement was reached in principle at the WTO in 2005 to eliminate developed country cotton export subsidies and
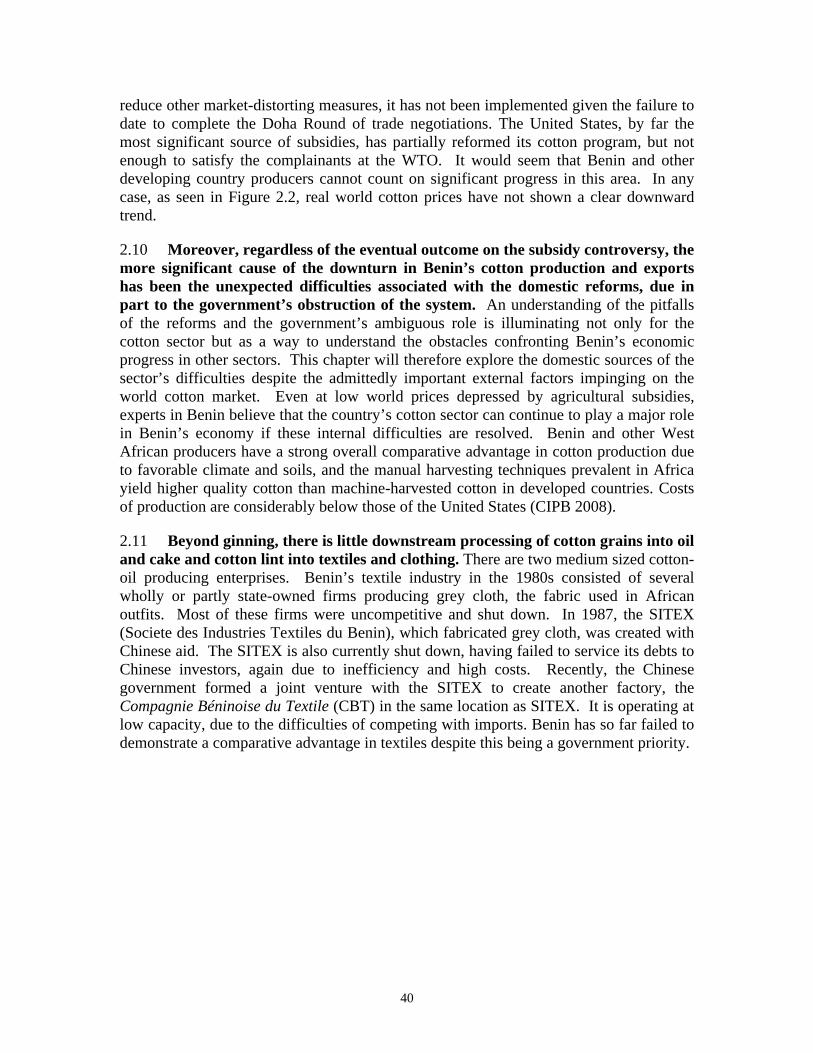
40
reduce other market-distorting measures, it has not been implemented given the failure to date to complete the Doha Round of trade negotiations. The United States, by far the most significant source of subsidies, has partially reformed its cotton program, but not enough to satisfy the complainants at the WTO. It would seem that Benin and other developing country producers cannot count on significant progress in this area. In any case, as seen in Figure 2.2, real world cotton prices have not shown a clear downward trend.
2.10 Moreover, regardless of the eventual outcome on the subsidy controversy, the more significant cause of the downturn in Benin’s cotton production and exports has been the unexpected difficulties associated with the domestic reforms, due in part to the government’s obstruction of the system. An understanding of the pitfalls of the reforms and the government’s ambiguous role is illuminating not only for the cotton sector but as a way to understand the obstacles confronting Benin’s economic progress in other sectors. This chapter will therefore explore the domestic sources of the sector’s difficulties despite the admittedly important external factors impinging on the world cotton market. Even at low world prices depressed by agricultural subsidies, experts in Benin believe that the country’s cotton sector can continue to play a major role in Benin’s economy if these internal difficulties are resolved. Benin and other West African producers have a strong overall comparative advantage in cotton production due to favorable climate and soils, and the manual harvesting techniques prevalent in Africa yield higher quality cotton than machine-harvested cotton in developed countries. Costs of production are considerably below those of the United States (CIPB 2008).
2.11 Beyond ginning, there is little downstream processing of cotton grains into oil and cake and cotton lint into textiles and clothing. There are two medium sized cotton-oil producing enterprises. Benin’s textile industry in the 1980s consisted of several wholly or partly state-owned firms producing grey cloth, the fabric used in African outfits. Most of these firms were uncompetitive and shut down. In 1987, the SITEX (Societe des Industries Textiles du Benin), which fabricated grey cloth, was created with Chinese aid. The SITEX is also currently shut down, having failed to service its debts to Chinese investors, again due to inefficiency and high costs. Recently, the Chinese government formed a joint venture with the SITEX to create another factory, the Compagnie Béninoise du Textile (CBT) in the same location as SITEX. It is operating at low capacity, due to the difficulties of competing with imports. Benin has so far failed to demonstrate a comparative advantage in textiles despite this being a government priority.

41
Figure 2.1: Benin Cotton Production, Acreage, and Yield (1961-62 crop year = 1
0
50
100
150
200
250
300
350
1961-62
1962-63
1963-64
1964-65
1965-66
1966-67
1967-68
1968-69
1969-70
1970-71
1971-72
1972-73
1973-74
1974-75
1975-76
1976-77
1977-78
1978-79
1979-80
1980-81
1981-82
1982-83
1983-84
1984-85
1985-86
1986-87
1987-88
1988-89
1989-90
1990-91
1991-92
1992-93
1993-94
1994-95
1995-96
1996-97
1997-98
1998-99
1999-00
2000-01
2001-02
2002-03
2003-04
2004-05
2005-06
2006-07
2007-08P
rod
uct
ion
an
d a
crea
ge
0
1
1
2
2
3
Yie
ld
Area
Production
Yield
Source: AIC (Benin)
Figure 2.2: World Real Cotton Price, in US Dollars (Deflated by US Manufacturing Deflator
0
0.2
0.4
0.6
0.8
1
1.2
1.4
1.6
1.8
2
1970
1972
1974
1976
1978
1980
1982
1984
1986
1988
1990
1992
1994
1996
1998
2000
2002
2004
2006
2008
(M1)
Source: IMF International Financial Statistics and author’s calculations.

42
Figure 2.3: Export Prices and Producer Prices in Benin, in CFA francs
0
50
100
150
200
250
300
350
400
1980
-81
1981
-82
1982
-83
1983
-84
1984
-85
1985
-86
1986
-87
1987
-88
1988
-89
1989
-90
1990
-91
1991
-92
1992
-93
1993
-94
1994
-95
1995
-96
1996
-97
1997
-98
1998
-99
1999
-00
2000
-01
2000
1-02
2002
-03
2003
-04
2004
-05
2005
-06
2006
-07
2007
-08
export price
producer price
Source: AIC data and author’s calculations.
Figure 2.4: Producer Price as a Percent of Export Price for Benin’s Cotton
0%
10%
20%
30%
40%
50%
60%
70%
80%
90%
100%
1980
-81
1981
-82
1982
-83
1983
-84
1984
-85
1985
-86
1986
-87
1987
-88
1988
-89
1989
-90
1990
-91
1991
-92
1992
-93
1993
-94
1994
-95
1995
-96
1996
-97
1997
-98
1998
-99
1999
-00
2000
-01
2000
1-02
2002
-03
2003
-04
2004
-05
2005
-06
2006
-07
2007
-08
Source: AIC and author’s calculations based on IMF International Financial Statistics.

43
Market and Government Failure in African Cotton Systems
2.12 Benin’s reforms can be better understood in the context of the market and government failures confronting African small-holder cotton producers across the continent. Labaste et al (2008) have recently completed a comprehensive study of African countries’ experience with reforming their cotton sectors, drawing on Poulton et al (2004). Until the 1990s, cotton production, as for other cash crops, was controlled by government marketing boards which imported and distributed inputs, extended credit for farmer input purchases, provided extension services and infrastructure, set producer prices, processed the raw cotton into lint (ginning), and marketed the crop. Starting in the 1990s, under the aegis of structural adjustment problems, African countries opened up their cotton sectors to market forces to varying extents and in different ways. Labaste et al (2008) describe the country experiences with reform in detail and draw important lessons from comparative analysis.37 In no cases have reforms been entirely successful, and there is no single approach which dominates, but much can be learned from cross-country comparisons. Benin is discussed only peripherally in Labaste et al, which is based mostly on case studies of Burkina Faso, Mali, and Cameroon in francophone West and Central Africa (WCA), and Mozambique, Zambia, Zimbabwe, Tanzania, and Uganda in anglophone and lusophone East and Southern Africa (ESA). Overall, Labaste et al (2008) provides an extremely useful framework for analyzing Benin’s reforms. See box 2.1 for a typology of cotton sector systems.
2.13 Cotton-sector liberalization has had ambiguous effects in Africa. While producer prices have generally risen and payments to farmers have become more reliable, productivity and quality failed to increase as expected.
2.14 Why have cotton sector reforms proved problematic in Africa? Poulton et al (2004) and Labaste et al (2008) suggest that there is a fundamental tradeoff between competition and coordination in cotton production in Africa. Elementary economic theory would suggest that since cotton production is not characterized by significant economies of scale, competition is desirable, and opening up to market forces should be relatively straightforward. Well-functioning markets, however, presuppose property rights, contract enforcement, access to credit, and provision of public goods that are typically weak or non-existent in Africa. North (1989) has pointed out that market-supporting codes of conduct and legal and judicial institutions have evolved over centuries in developed countries, limiting opportunistic behavior that undermine arms-length market transactions, whereas in developing countries lacking these institutions, corruption and fraud is pervasive.38
2.15 The problem of input supply for agriculture, and for cotton in particular, is particularly acute. Cotton production requires timely and high-quality provision of seeds, fertilizer, and pesticides. Furthermore, since the inputs must be applied well before harvest and sale of the crop, and given the limited financial resources of smallholders, credit is also necessary. The problem is that banks are understandably
37 See also Badiane (et al) 2002 and Baffes (2005). 38 Fafchamps (2004) discusses the role of institutional arrangements and markets in Africa in detail.

44
reluctant to lend to small-holders directly due to high transactions costs, and more importantly, the possibility of default in the context of weak enforcement of contracts. Therefore, some institutional arrangements are necessary to provide inputs and ensure repayments of credits. In the past, government marketing boards performed these functions, deducting input credits from the producer price paid when the cotton crop is delivered. Private ginners can also operate in this fashion: borrow from banks to purchase inputs, provide the inputs to farmers at the beginning of the season, and deduct the cost of inputs and interest from the producer price. The more competitive the market, however, the greater the difficulties ginners are likely to experience in recouping input credits. With many independent ginners, farmers can relatively easily default on their input loans, while selling their cotton at a higher net price to another ginner or on the black market, expecting to re-contract with a different ginner the following year. Ginners also have a short-term incentive to cheat, by poaching cotton from other ginners, while sharing some of the gains with the producer. A private monopoly or highly-concentrated market structure for ginning, however, can substantially lessen this problem, insofar as farmers have fewer options for evading their contracts profitably, and ginners have less incentive to poach the cotton of other ginners. Input supply dysfunctions and government interference have been at the heart of the problems in Benin’s cotton sector.
Box 2.1: Typology of Cotton Sectors in Africa
Labaste et al (2008) classify African cotton sectors into 5 types, depending on a) whether the industry has regulated entry or not and b) the number of firms operating in the market. The table below summarizes the 5 types and provides examples of countries in each category.
A national monopoly is characterized by a single state-owned or private firm with exclusive rights to market cotton. A local monopoly system is similar except that monopolies are granted at the regional level. Regional monopolies reduce dependence on a single firm but do not increase competition. In a concentrated system, one or a few firms dominate the market, but entry or exit is not ruled out. Under competitive systems, there are a large number of ginners who compete for market share. A hybrid system can involve a large number of firms but they are allocated market shares and competition is not permitted. In this sense, a hybrid system is like a local monopoly but market shares are not allocated by region but in some other fashion. Benin is classified as a hybrid system. Monopoly and concentrated systems tend to perform relatively well in coordinating input supply, credit, and public good provision, but competitive systems are more effective in stimulating technical efficiency and higher producer prices.
Some of the countries are in transition from one type to another. For example Mali is moving towards local monopoly, while Uganda is transitioning from competitive to hybrid. Overall, there is considerable flux as countries struggle to find systems that function best for their particular circumstances given the tradeoff between coordination and competition.
Type Characteristics Countries National Monopoly State-owned or regulated private
monopoly Cameroon, Mali, Chad, Senegal
Local Monopoly Monopoly at the regional level Mozambique, Burkina Faso, Cote D'Ivoire, Ghana
Concentrated Market-Based Limited number of private firms Zambia, Zimbabwe
Competitive Large number of private firms Tanzania
Hybrid Several firms but with regulated market
Benin, Uganda

45
2.16 A competitive sector is also likely to under-provide public goods such as rural roads, storage depots, and research and extension services, which were also the purview of the former government marketing boards. A dominant public or private producer, however, could largely obviate the free-rider problem of provision of public goods. More generally, a monopoly or concentrated sector is conducive to investment in the industry-specific assets required for the functioning of the sector as a whole.
2.17 On the other hand, concentrated systems and monopolies would be expected to provide less favorable prices to producers than a competitive market. Also, competition increases the pressures to improve efficiency of ginning and other operations. Overall, there is a theoretical tradeoff between the coordination benefits of a concentrated system versus the pricing advantage of a competitive system. Labaste et al’s (2008) comparison of country experiences largely supports these hypotheses. Their conclusion is that none of the systems are ideal, but that on balance concentrated systems have generally functioned better than competitive systems and monopolies in the African context. Moreover, it can be argued that the extent to which concentrated ginners abuse their market power is constrained since farmers can switch to food crops for the local market if the prices offered by the ginner are not attractive. All in all, the critical problem of input credit militates in favor of a concentrated system.
Summary of the Reforms of Benin’s Cotton Sector
2.18 As part of the structural reform programs aimed at restoring macroeconomic stability, Benin undertook far-reaching cotton reforms starting in the early 1990s, but with the most significant reforms taking place in 1999-2000. The reforms were intended to transition gradually to reduce the dominance of the SONAPRA and increase private-sector participation, with the ultimate goal of greater reliance on market forces. The reforms fostered empowerment of private-sector organizations and entry of private firms in the supply of inputs and ginning. More specifically, the reforms feature:
• Greater responsibility for private organizations in running the sector as a whole, with the development of professional organizations for farmers, ginners and input suppliers:
� For farmers : the Fédération des Unions de Producteurs du Bénin (FUFRO)39
� For ginners : The Association Professionnelle des Egreneurs du Bénin (APEB).
� For input suppliers : The Groupement Professionnel des Distributeurs d’Intrants Agricoles (GPDIA).
39 FUPRO and the various other producer organizations have recently been reconfigured and renamed, as discussed below.
46
� Opening of the input market in 1992, with full transfer in November 1999 to the private sector of the organization of calls for bids and distribution of inputs.
� Opening of ginning to private entrants in 1994, with SONAPRA retaining control of its 10 ginning factories, resulting in the entry of 8 new private ginners between 1994 and 1999.
� In June 2000, elimination of the SONAPRA’s monopoly on marketing of raw cotton, turning over the operation of the system to the private sector.
2.19 Nevertheless, liberalization was far from complete, reflecting the understanding that institution-building is a precondition for effective market functioning, and that transition from a state-controlled to a decentralized market system is difficult and must be phased in. An alternative set of private-sector oversight institutions, to replace the role played by the SONAPRA in this regard, was established through a collaborative effort by the government, the private sector and donors. The new system is quite elaborate and was intended to retain the integrated characteristics of the previous system while nonetheless allowing private participation at all levels. Prices, entry, and market shares have remained administered, ruling out all competition, at least overtly. The goal is to eventually move towards greater market determination of prices and quantities, but the specifics of this transition have not been spelled out. A schematic structure of the system is shown in Figure 2.5.
2.20 The Association Interprofessionelle du Coton (AIC) brings together representatives of farmers, input suppliers and ginners as a steering group for the private sector as a whole. The AIC serves as a forum for negotiations between ginners and producers to set the annual pre-determined fixed price for cotton. It has dispute settlement mechanisms and acts as the representative of the private sector as a whole vis-à-vis the government. It has taken over the SONAPRA’s role in the organization of “marketing” of cotton, i.e., the collection and distribution of seed cotton, with each of the ginners receiving an annual quota. The AIC is also responsible for contracting out the provision of “critical functions”, i.e., public services such as seed provision, research, extension, grading of cotton and quality control, and rural infrastructure. In all these respects, it replicates the SONAPRA’s functions. The AIC’s budget for critical functions and its own operations and those of the other institutions is funded by a portion of producer prices set aside for this purpose, also negotiated annually.
2.21 The Cooperative d’Approvisionnement et de Gestion des Intrants (CAGIA) was created to select the input suppliers and allocate market shares following a call for bids each season. CAGIA sets a uniform price for inputs for the country as a whole, based on a markup of the pre-established price of inputs. This price is set by the lowest bidder which is then applied to all accepted input suppliers. The allowed markup over the import price is about 3 per cent. The CAGIA was replaced by the Commission Intrants Coton (CIC) in 2006, and placed under the AIC umbrella.

47
2.22 Finally, the Centrale de Sécurisation des Paiements et des Recouvrements (CSPR) plays the crucial role of payments clearinghouse. The CSPR handles the financing of the campaign for the input suppliers, ginners, and farmers, implementing the agreements reached by the AIC and the CIC (formerly CAGIA), and then following a very specific routine. The proper sequencing and execution of each step is crucial for a successful season. Input suppliers must be accredited by the CIC in time for inputs to be ordered by November/December so that they can be delivered in January/February and to obtain credits from commercial banks to finance their purchases of fertilizer and pesticides in Europe. It is important for the inputs to be ordered on time for two reasons: first, so that the producers complete planting before the start of the rainy season in March; and second because arrival of imported inputs at the beginning of the calendar year at the Port of Cotonou coincides approximately with the time at which cotton lint produced by ginners from the previous year’s crop is delivered to the port for export. Early ordering of inputs enables reduction of transport costs, since the same trucks that deliver the cotton lint for export to the port can pick up the imported fertilizer and pesticides arriving on ships. This system in effect provides input credit to farmers, since the latter do not have to pay for their inputs until the harvest is sold, just as was the case under the SONAPRA.
2.23 Meanwhile, the ginners, who are allocated their market shares by the AIC, must deposit 40 per cent of their anticipated purchases of raw cotton at the CSPR, which are known since both prices and quantities are predetermined. This 40 per cent deposit is then used to pay the input suppliers who can then reimburse the banks for their loans, and also to provide the CSPR with some cash to pay for distribution and other ongoing functions. When the farmers deliver their crop to the ginners, the ginners disburse the remaining 60 per cent of their liabilities to the CSPR, which in turn remits these funds to farmers.
2.24 The CSPR has no capital or stabilization funds and depends entirely on the input suppliers, ginners and farmer cooperatives to fulfill their responsibilities through timely decisions and prompt fulfillment of contracts.
2.25 A further dimension of the new system, as noted above, was to empower producer organizations. Cotton farmers have been organized since the late 1960s into Groupements Villageois (GV). There can be several GV in a village, with each GV consisting of about ten households. Starting in the late 1980s, a system of hierarchical geographical groupings was gradually developed, with the GV federating into Unions Sous-Préfectorales des Producteurs (USPP), then into Union Départementales (UDP), which are each members of the above-mentioned over-arching organization FUPRO, created in 1995, charged with representing the farmers at the AIC negotiations and planning. The FUPRO is headed by an elected President and several other executives.
2.26 The cotton sector reforms have been supported by the World Bank’s Projet d’Appui a la Reforme de la Filière Coton and the Agence Française de Développement’s (AFD) Projet d’Appui à la Réforme du Secteur Coton as well as by a number of other bilateral donors, including the Swiss and German governments. The AFD’s project is

48
completed, but has been extended for an additional year, and the World Bank’s is coming to an end.
Figure 2.5: Organization of Cotton Production in Benin
3.1.4. Outcome of the Reforms
2.27 As seen above, the new institutional apparatus appears to be an elaborate attempt to introduce market forces while retaining an integrated system. Some significant successes can be credited to the reforms. Private agents have increasingly participated at all levels, some of them very successfully (see Box 2.2 on the emergence of Patrice Tallon as one of these entrants). In the first few years following the end of the SONAPRA’s monopsony purchasing of seed cotton in 1999-2000, production remained over 300,000 tons, increasing to a record of over 400,000 tons in 2004-05, although it never attained the new higher ginning capacity of about 550,000 tons, following the establishment of the 8 private ginneries.
Banks
Input Suppliers
AIC (Private-Sector
Coordinating Grouping)
CSPR (Payments Clearinghouse)
Farmers
Ginners (SONAPRA + Private)

49
Box 2.2: The Emergence of Private Cotton-Sector Entrepreneurs: The Case of Patrice Tallon
An interesting and apparently highly positive result of the cotton reforms has been the emergence of domestic private entrepreneurs in the cotton industry. Patrice Tallon is one of these new entrants. Tallon started as a small-scale trader of cotton supplies such as jute bags, using his savings to enter the cotton business in the early 1990s. In 1994-95 he put up 65 per cent of the equity for 3 of the 8 new private ginneries, with the SONAPRA holding the other 35 per cent of the capital. Subsequently he purchased the SONAPRA’s shares in these 3 ginneries. In 2008, he acquired another ginnery SODICOT, such that he now controls 4 of the 7 operational private ginneries (the 8th is currently not operating). He has sought to purchase others, including SONAPRA, but was unable to do so. His bid in the recent 2007 tender for the 45 percent private sector share of the SONAPRA was initially accepted by the government, but the privatization was abruptly annulled. Mr Tallon also controls the largest input supplier and one of the two cotton oil factories operating in the country.
Mr. Tallon has also recently proposed a plan to revive cotton production in the center and south of the country where it has declined sharply in recent years, but the government has not supported his initiative. By all accounts received during the mission, Tallon’s operations are run with a high degree of professionalism and integrity, and he is widely admired as a “self-made man”.
2.28 Nevertheless, despite the care with which the reforms were evidently designed, serious dysfunctions have emerged with the system threatening to unravel. These difficulties are largely due to the non-respect of the rules by some actors and the failure of the government to enforce the rules, and worse, its interventions in favor of special interest groups.
2.29 In 2005-06 production plummeted to 190,000 tons with a gradual recovery in 2006/07 to 240,000 tons and an estimated 285,000 tons in 2007/08, with the latter benefiting from restructuring within the private sector and some positive actions from the new government. Cotton production has declined sharply in the southern and central regions in recent years. Low output of cotton is also adversely affecting the few downstream cotton oil producing firms. Certainly, low world prices of cotton along with high world prices of oil—which raise fertilizer costs—have created a challenging environment for the new system to contend with. Adverse weather conditions, with too much rain in some regions and too little in others, also contributed to the recent difficulties. Nevertheless, the main problems reflect the failure of some players to abide by the rules, and the government’s interventions.
2.30 The entry of private ginners led to a near doubling in ginning capacity in the late 1990s to about 550,000 tons, resulting in chronic excess capacity in view of the stagnation and then decline of farm output, as just noted. Consequently, the ginners operate at high costs and have a strong incentive to raise market share. They are precluded from competing, however, by the administered nature of the system. Some of the private ginners have resorted to purchasing cotton from farmers outside of the official circuit, circumventing the CSPR mechanisms. The firm MCI in particular is widely alleged to have failed to pay for its cotton allocations, and yet it was not prevented from participating in subsequent seasons due to its political connections, with the Kerekou government intervening in the allocation of quotas in MCI’s favor.
2.31 Conflicts between input suppliers over market share have also been a recurrent feature. Input suppliers have a virtually guaranteed profit since the prices at which they sell are set in advance as a markup over world prices of fertilizer and pesticides, and they all consequently wish to expand market share. Some input suppliers

50
have at times supplied deficient products leading to pest infestation. The government has here too unilaterally forced a reopening of the allocation of market shares when the results of the allocations were contested by dissident input suppliers.
2.32 Furthermore, ginners and producers have found it difficult to agree on the producer price, resulting in long and unfruitful negotiations within the AIC. With falling export prices in recent years, the government stepped in 2007/08 to resolve deadlocked negotiations, and decreed relatively high producer prices, well above those of other countries in the region, so as not to displease the farmers (see Figures 2.3 and 2.4 above). At any rate, low profitability due to excess capacity remains a significant concern. In 2003/2004, in the aftermath of a sharp and sudden fall in world prices, the government provided a subsidy of 43 CFA francs per kg.
2.33 All of these conflicts and government interventions have resulted in delays at the level of the AIC and CAGIA on market shares and pricing, which in turn has delayed the start of the cotton season. Only under extreme duress have the difficulties been resolved, resulting in input orders and planting being delayed by about 3 months in the 2005/06 and 2006/07 seasons. Also, research and extension services have declined since the government has taken over from AIC the financing of these services.
2.34 Some farmer cooperatives, for their part, have also engaged in opportunistic behavior, in both input and output markets. Some GVs request more inputs than needed and sell the excess on the black market or use it for other crops. Since input markets are non-existent for other agricultural commodities, there are clear advantages of over-estimating cotton input needs. These GV might simultaneously sell some of their cotton crop on the black market or to non-accredited ginners such as MCI, as they did in the past but have not in the last two seasons. They can benefit from doing so, since they receive only 60 per cent of the value of the crop from the CSPR, with the other 40 per cent being retained by CSPR to cover input credits and costs of public services, as described above. These GV are typically not sanctioned in the following season, as the composition of GVs is quite fluid so they can dissolve and recreate themselves. All of this entails a loss of revenue for the CSPR, which then is unable to fully pay honest GVs, further undermining the incentive to play by the rules. The extent of farmer sales outside the official circuit and consequent default on repayment on input credit has varied considerably in recent years, going from 1.6 per cent of credits in 2000-2001 to 15-20 per cent in 2005-06, but then falling again sharply in 2006-07 following the interventions of the new government and efforts by the AIC to re-establish order.
2.35 The farmer organizations have also proved to be unresponsive to their members’ concerns. The dissatisfaction with the leadership and above dysfunctions of the system have in turn led to the proliferation of dissident organizations in recent years, starting in 2002 with AGROPE splitting off from FUPRO. In 2003, the fissures increased, with AGROPE itself splintering into 3 parts: AGROP, FENAPRA, and FENAPROP. By 2007, the FUPRO had splintered into no less than 12 separate networks of producers. Although 90 percent of the farmers remained members of FUPRO, the new organizations sowed considerable chaos in the system. Many of the dissident farmer organizations and

51
input suppliers are linked to the ginner MCI and two allied input distributors, forming a parallel circuit operating outside the AIC/CSPR circuit.
2.36 Critical public services have faltered, with AIC agreements shortsightedly cutting funding, with the allocation falling from 20 CFA per kg of cotton produced in 2001 to 5 CFA in 2007, with the government having promised and failed to chip in another 15 CFA per kg last year. All of these problems are self-reinforcing, eroding confidence in the system and cumulatively lowering the attractiveness of growing cotton. The government has failed to enforce the rules of the system or even exacerbated these problems by intervening in favor of dissident groupings.
2.37 The SONAPRA has retained an important presence in the sector despite the government’s stated commitment to privatizing it since 2002. Privatization has been repeatedly planned, initiated, and postponed in the face of political pressure from unions and the government’s desire to retain an important lever in the cotton sector. The SONAPRA retains control of 10 of the 18 ginneries.
3.1.5. Recent Developments
2.38 The election of President Yayi marks an opportunity to tackle the crisis in the cotton sector, which all the actors recognize calls for urgent measures. Since taking office in April 2006, President Yayi has engaged vigorously in the sector, taking a number of measures to restore order, while encouraging private sector reorganizations. Some progress has resulted but not all the new initiatives have been constructive, as some of new government’s most recent actions appear to have been taken hastily and without sufficient consultation with the private sector. The new measures include:
• Payments of arrears to farmers. The Yayi government started by settling the outstanding payments due to farmers with a payment of 14 billion CFA francs, including 4.5 billion representing promised but unpaid subsidies dating from 2003/04 (CIPB, p. 22).
• Extension services. The government and AIC have hired 2,000 additional extension agents, reducing the shortfall. However, many of the new hires were not well qualified while more qualified existing agents were let go.
• Reorganization of Private Sector Organizations. In 2006, the professional groupings of farmers, ginners and input suppliers, formerly FUPRO, APEB and GPDIA, respectively, were reorganized and renamed, Conseil National des Producteurs de Coton (CNPC), the Conseil National des Distributeurs d’Intrants Coton (CNDIC), and Conseil National des Egreneurs du Coton (CNEC). At the local level, the producer organizations were also restructured and renamed, with GVs becoming GPCs and USPPs becoming GVPC. Local committees called Comités de Crédits Intrants (CCI) were instituted to deal with the escalating fraud and defaults involving input use and credit, described above. This

52
reorganization was led by the AIC rather than the government. The Yayi government did not seek to block these changes, however, unlike the previous Kerekou government.
• Status of the SONAPRA. The government jettisoned the previous plan for splitting the SONAPRA into three lots and on July 14, 2007, abruptly announced a new scheme consisting of a single new mixed public-private entity, with a private strategic partner holding 45 per cent of the capital, the government retaining 35 per cent and the remaining 20 per cent distributed among various stakeholders. On August 27, 2007 the call for bids was announced. On October 6, 2007, the government announced the selection of the Société Commune de Participation, controlled by Patrice Tallon, the largest private investor discussed above. However, on November 1, 2007, the government abruptly annulled the privatization.
• Dissolution of the “Accord Cadre”. In May 2007, President Yayi unilaterally dissolved the “accord-cadre” which had been officially adopted in 2004 after a long delay, specifying the structure of the system, and re-asserted greater government control, in the face of vehement opposition from the AIC. The annulment of the accord-cadre appears to be an arbitrary and unwarranted action to the private sector, given that some progress had been observed in the distribution of inputs and payments to farmers under AIC stewardship, as noted above. The government’s rationale is that fundamental reflections on the system are in order, but the private sector fears that the government wants to maintain control. In place of the accord-cadre, a transitional committee Comité National de Gestion de la filière Coton (CNTC) was instituted to oversee the sector. The CNTC is dominated by government representatives and is apparently not really operational. Nevertheless, despite the absence of a regulatory framework, the system is continuing to operate as if under the previous accord-cadre—i.e., following the AIC-CSPR circuit discussed above.
• Distribution of inputs. The government has intervened arbitrarily in the selection of input distributors, twice annulling the selections for the 2007/08 season, and finally reasserting the role of the SONAPRA as the main distributor, in complete contravention of the reformed system.
2.39 Overall, some improvements have occurred in the last two campaigns, and output recovered partially. Parallel sales diminished in 2006/07 and delays in delivering in inputs and planting fell to about 45 days in 2007/08 compared to 90 days in previous years. Most of the credit for the improvement must go to the AIC’s efforts. President Yayi’s sanctioning of cheaters and exhortations appear to have led to some restoration of order in the 2007/08 campaign but dissolution of the accord-cadre and the erratic handling of the privatization and input ordering have been disruptive. The AIC’s vigorous opposition to the government’s actions have been a positive development. Also, the new village-level Comités de Credits Intrants (CCI) appear to have more credibility

53
than their predecessors in deterring cheating, at least so far. Ginners such as MCI have been either sidelined or agreed to operate within the rules of the system. The failure to follow through on the privatization of the SONAPRA is a step backwards, however.
Assessment and Possible Alternatives
2.40 The crisis in Benin’s cotton sector has eased somewhat, but it remains to be seen if the fundamental problems have been addressed, and how to transition to a more-market based system. The Beninese stakeholders are acutely aware of the weaknesses of their system and intense debates are occurring in Benin about the way forward.
2.41 Some argue that the reforms can work if the state plays its role of enforcing the rules and sanctioning offenders. In this regard, it is essential that the government refrain from arbitrary interventions in favor of special interests and enforce the rules of the system.
2.42 There is a widespread belief in Benin, however, that the current structure is unstable and creates inappropriate incentives. It was always envisioned as a transition to a more market-based system. The above analysis supports the necessity of further evolution towards a system that aligns incentives through market forces. The reforms of the 1990s were intricately designed and set the stage for further progress, but in their current configuration, do not satisfactorily resolve the tradeoff between competition and coordination. By allowing entry into ginning and input supply, the coordination of the system previously assured by the SONAPRA was undermined. At the same time, competition is not permitted since prices and market shares remain totally administered. The AIC and the CSPR have proved unable in the past to curb the incentives to cheat by purchasing excess inputs and side-selling inputs and cotton, and it is probable that these problems, temporarily suppressed, will resurface.
2.43 It is therefore not surprising that stakeholders are urgently considering alternative systems used in other countries, such as those discussed above. The consensus is that greater concentration would be desirable. CIPB (2008) advocates a shift to a system of regional monopolies as in Burkina Faso given that Burkina’s reforms have been more successful than those in Benin. The Ministry of Agriculture (2007) notes, however, that there is no easy way to divide Benin into regions, with most of the ginneries concentrated in the center-south while most of the cotton is grown in the north. It would be costly and arbitrary to divide Benin up into regions. Moreover, Benin is a small country and division into regions seems unwarranted. Instead the Ministry of Agriculture (2007) advocates a concentrated system with one or two dominant firms. This view accords well with the conclusions of Labaste et al (2008).
2.44 The danger of a concentrated system is the dependence on a single firm and the resulting risks of inefficiencies and abuses of market power due to lack of competition. On the other hand, as noted above in the comparisons between systems, even in the absence of competition from other ginners, the dominant firm would still be motivated to

54
provide a fair price to farmers since they can switch to other crops if cotton is not remunerative. The competence of the dominant firm is crucial for such a system to work.
2.45 It appears that Benin is moving naturally towards a concentrated system. Progress is blocked, however, by the failure to privatize the SONAPRA. The government’s reluctance to follow through on this privatization is the main immediate obstacle to a further consolidation and rationalization of Benin’s cotton industry. If this consolidation can occur, the government could eventually move to dismantle the complexity of the institutional apparatus created in the reforms. Instead of going through the CSPR and the CIC, the dominant firm could directly order inputs, provide them on credit to farmers, negotiate prices, and establish contracts and long-term working relationships with producers. In the face of a credible interlocutor, the producer associations might also become more responsive to the needs of their constituencies. The incentive to order excess inputs would diminish. Producers would also have much less incentive to default because the dominant firm would sanction any such opportunistic behavior by denying input credit in the next season. Unlike the weak CSPR, a dominant ginner could credibly enforce contracts with a much lesser role required for the government. A dominant firm would also have an incentive to internalize the supply of critical services such as research, extension and quality control, with the government role limited to providing basic public goods such as roads. The AIC would retain an important role as a forum for all the stakeholders in the sector and would need to work closely with the government in providing oversight of the system.
CONCLUSION AND RECOMMENDATIONS
2.46 Benin has demonstrated a comparative advantage in cotton, with the sector growing until recently even in the face of low world prices, misguided government interventions, and often unfavorable weather conditions. Costs of production are low compared to those in the United States and other regions. Prices paid to producers have been among the highest in West Africa, and, although these high prices have come partly at the expense of low profitability in ginning, private ginners have shown no inclination to exit. Cotton can and should remain an important part in Benin’s economy.
2.47 The reforms of the 1990s created an elaborate and carefully-considered alternative to the state marketing board SONAPRA. The reforms were phased in gradually, with an effort to maintain the coordination role of the SONAPRA while allowing private-sector participation. Prices and market shares remain administered, with the goal of eventually transitioning to a greater role for market forces. The reforms have succeeded in spurring the entry and development of domestic entrepreneurs. Some of these entrepreneurs have proved very able and honest, while others have been ineffective and opportunistic, relying on political connections to remain in business. Indeed, the government has often failed to enforce the rules and regulations in the sector. Instead, it has sometimes intervened in support of special interests and disrupted the functioning of the system. Consequently, the system has been under acute stress, and partly as a result, output dropped dramatically in 2005/06.

55
2.48 A partial recovery occurred in 2006/07 and 2007/08, coinciding with the advent of the Yayi administration. Some of the new government’s actions have been helpful, but many of their recent actions have been counterproductive. Much of the improvement is apparently due to the private sector’s own efforts to re-establish order in the face of the government’s disruptions, and is a testimony to the rising strength and capability of the private-sector umbrella organization AIC.
2.49 Clearly, effective functioning of the system requires a government that does not intervene arbitrarily and enforces the rules of the system. Nevertheless, the problems in recent years also suggest that further advances in the reforms are necessary. The present structure does not optimize the tradeoff between competition and coordination. On the contrary, Benin now suffers in some respects from the worst of both worlds: limited coordination, due to the weakness of the institutions in enforcing compliance, and limited competition. It depends too heavily on institutional oversight rather than incentives. By moving towards a more concentrated but market-driven system, the system could become more self-enforcing, obviating the need for the elaborate institutional structure created by the reforms. With some consolidation occurring among private ginners, Benin is already naturally transitioning towards greater concentration. The long-delayed privatization of the SONAPRA is the crucial next step. The revision of the regulatory framework to oversee an increasingly concentrated system will require cooperation between the AIC and the government.
BENIN’S TRANSIT TRADE40
Benin’s Misleading Official Trade Statistics
2.50 According to standard export and import statistics, Benin is a relatively closed economy, notwithstanding its participation in two regional trade blocs in West Africa, and its reputation as a regional trading hub. In fact, usually-cited trade statistics provide a highly misleading picture of Benin’s actual trading patterns as they ignore a very large volume of transit trade and unofficial regional trade flows. There are no available data or recent studies documenting these unofficial trade flows and the figures often cited greatly underestimate their magnitude and importance for Benin. This section of the CEM aims to fill this gap in information, through inferences from available trade data, interviews in the field with knowledgeable analysts and actors, and the few previous studies.
2.51 Figure 2.6 presents World Bank trade statistics, indicating that Benin’s exports and imports of goods and services are far below those of other small coastal economies in West Africa.
40 This section builds on Chapter 4 of the Benin DTIS (2005) as well as a mission to Benin on March 10-15 2008. Soulé Goura assisted in obtaining information.

56
Figure 2.6: Exports and Imports of Goods and Services, as a Percent of GDP, 2005
0%
10%
20%
30%
40%
50%
60%
70%
Benin Ghana Senegal Togo
Exports
Imports
Source: World Development Indicators online.
2.52 Moreover, Benin engages in very little officially-recorded trade with its neighbors, despite membership in WAEMU (West African Economic and Monetary Union) and ECOWAS (Economic Community of West African States). WAEMU comprises the francophone countries of West Africa and Guinea Bissau, including Benin’s neighbors Togo, Niger and Burkina Faso, and involves substantial integration including a common currency, the CFA franc, a customs union, and harmonization of a wide range of other policies. ECOWAS is a larger group, covering the WAEMU countries plus the Anglophone countries of the region, including most importantly Benin’s other neighbor Nigeria, the dominant economy of the region. Integration within ECOWAS has proceeded much more slowly than within WAEMU, and its agreements on harmonization of policies, notably on the long-delayed customs union, have not been fully implemented, especially in Nigeria. Official data indicate that only about 15 per cent of Benin’s exports and imports in recent years are with WAEMU and ECOWAS. Benin’s recorded exports to Nigeria are very low, averaging about 5 percent of its total official exports and imports over 2000-2005.
2.53 These puzzles are resolved by the fact that a very large proportion of Benin’s trade involves various forms of trans-shipment. Usually-reported imports are confined to goods intended for domestic consumption, whereas exports refer to domestically-produced goods, but by all accounts, Benin is involved in a thriving informal regional “re-export” commerce with other countries of the region, notably Nigeria. Informal trading activities are of great significance to Benin’s economy, probably surpassing the role of cotton as a share of GDP, incomes and government

57
revenues. Total imports into Benin are in the range of 2 to 3 times as large as official imports, counting goods imported under transit status and estimated parallel imports.
2.54 Informal trade with Nigeria operates in both directions, accounting for more than half of Benin’s total trade. As discussed in more detail below, Benin’s re-exports to Nigeria consist mainly of bulk food items such as rice, sugar and wheat, frozen poultry, processed foods such as tomato paste and palm oil, some manufactured products such as textiles and clothing, and second-hand clothes, tires, and especially used cars. All of these products are or have been subject to periodic import bans in Nigeria or high customs duties, designed to protect Nigeria’s extensive but inefficient manufacturing and farming sectors. Benin imports these goods officially from Europe, Asia and North America and then re-exports them unofficially to Nigeria. Benin’s imports from Nigeria consist above all of gasoline and other petroleum products, heavily subsidized in Nigeria, cement, and a variety of manufactured goods, such as auto parts, that are either produced in Nigeria or face low import barriers there.
2.55 Table 2.1 displays Benin’s officially-recorded imports, exports, re-exports, and transit trade, explained more fully below. Transit trade is considerably higher than official imports and has risen sharply in the last few years, primarily reflecting the resurgence of the used car trade. Official imports and goods imported under transit status combined add up to 50-80 percent of GDP in recent years, still an underestimate of total imports because it does not include goods smuggled in from Nigeria and other neighbors. If the latter are assumed conservatively to be about 10 percent of GDP, based on estimated imports of petroleum products (see box 2.4 below), Benin’s import to GDP ratio rises to close to 100 percent of GDP in 2007. Unofficial exports, including goods in transit not declared for but redirected to Nigeria, are about 25 percent of GDP, according to new estimates presented below in more detail, in Table 2.4.
Table 2.1: Benin’s Official Trade: Imports, Exports, Re-exports and Transit (Percentage of GDP)
2004 2005 2006 2007
Official Exports 7.4% 5.1% 5.0% 6.0%
Official Re-exports 0.3% 0.5% 0.4% 0.6%
Goods in Transit 26.0% 30.9% 44.3% 49.3%
Official Imports 22.0% 20.6% 21.3% 26.2%
Estimated Unofficial Re-exports 22.4% 23.6% 26.6% 32.4% Source: INSAE, Customs data and author’s calculations.
2.56 The remainder of this section provides an analysis of the history, nature and significance of the poorly-understood but vitally important informal trading relations between Benin and Nigeria.
Historical evolution of the re-export trade
2.57 Benin and Nigeria have deep historical and economic ties reflecting their geographical and cultural proximity. The two countries share several languages and

58
ethnicities. Trade within the region predates the colonial period, was shaped by colonial economic and political relations, and further altered by post-colonial political and social developments, most importantly divergent trade and other economic policies.41
2.58 Yoruba, Haussa and Ibo trading networks existed before the arrival of European colonists, but expanded in response to the arrival of European traders in the 17th century (Igué and Soulé 1992, 56-57, Hashim and Meagher 1999, 22-24). Long-distance cavaran trade routes linking coastal West Africa with the Sahara and the interior was based on artisanal and ecological comparative advantages, but even in pre-colonial times, patterns of taxation and tolls impinged on trading routes. The kingdom of Dahomé, corresponding geographically to contemporary Benin, had highly developed institutions that facilitated economic ties with Europe, notably the slave trade centered around the town of Ouidah. English, Portuguese, Dutch and French ships arrived in Ouidah loaded with tobacco, liquor, guns, and miscellaneous items requested by the local population, in exchange for large numbers of slaves. The slave trade was a major source of revenue for the kings of Abome, who designated a special representative (“Yovogan” or “chief of whites”) to administer the trading relationships between leading local merchants with European slave traders (Igué and Soulé 1992, 29).
2.59 In the second half of the 19th century, the slave trade petered out due to abolition of slavery in the United States and elsewhere. Local traders switched from slaves to palm oil, transacting with French trading firms from Marseille, which created trading posts in Danhomé exporting palm nuts and oil in exchange for tobacco, guns, cloth and vegetables. The labor in the palm oil factories consisted substantially of slaves, and like the slave trade, was highly lucrative for both local rulers as well as the French companies.
2.60 The official colonization of Dahomey in 1894 by the French altered trading relationships for several reasons. The French colonial government granted a monopoly to French trading companies, spurring the creation of unofficial networks by displaced local businessmen. The geographic situation of the new colony of Dahomey, sandwiched between German-controlled Togo and English-controlled Nigeria, provided a corridor for French trade with their land-locked colonies Niger and Upper Volta (now Burkina Faso), creating a precursor for Benin’s role as an entrepot. Furthermore, Dahomey’s relatively advanced educational system reinforced its advantage as a commercial hub. The Yoruba group’s spread across the region provided a network along the Gulf of Guinea.
2.61 The political instability and erratic trade policies in Nigeria, along with Benin’s small size and lack of natural resources, have stimulated unofficial trade since Benin’s independence in 1960. The decline of the palm oil industry in the face of cheaper imports of industrially-produced oil led to the search for new avenues. The parallel circuit between the two countries was given a major impetus by the dislocation in Nigeria following the Biafra war in 1967, with an influx of Ibo refugee traders into Benin, and Benin supplying goods to sections of Nigeria cut off from supplies. During the war, Benin became a major cocoa exporter, despite non-existent production of this product, as Nigerian cocoa was diverted through Benin.
41 The following historical overview is based on Igué and Soulé (1992).

59
2.62 Starting in 1973, Benin adopted low-tariff policies to facilitate an entrepot role of Cotonou to take advantage of the oil boom in Nigeria following the first oil shock. Benin also took steps to expand access to credit to importers by opening up the banking system, and deregulated the importation of key products, such as rice, formerly monopolized by state-owned firms. The Marxist government of Benin deployed the nationalized banking system in favor of the re-export trade. The Banque Commerciale du Benin (BCB) provided over 25 billion CFA francs for the importation of rice and wheat alone. These credits were limited to Beninese nationals, with defaults on these loans contributing to the banking crisis of the late 1980s (Hashim and Meagher 1999, 101).
2.63 The differential trade barriers between Nigeria and Benin have become the primary determinant of re-exports from Benin to Nigeria, as discussed in more detail below.
The Modalities of the Re-export Trade
2.64 Customs in Benin classifies imports into four categories: imports for domestic consumption (“mise à la consommation”), transit, re-exports, and “others” which covers temporary admission, bonded warehousing, etc. The “other” category is important for some developing countries but is insignificant in Benin and will be ignored here. For most developed and many developing countries, the bulk of imports are for domestic consumption. In the case of Benin, transit and re-exports are unusually important in the ways explained below.
2.65 Under internationally agreed customs ruled, any import other than entry for domestic consumption (fully dutiable) is not final. Each entry procedure has a corresponding exit procedure. This applies to transit. As neither the importer nor the customs official can be trusted with faithfully recording the exit of the merchandise, in most other countries the importer or the customs clearing agent acting on his behalf has to post a bond (bonded warehousing, transit under bond). The open procedure can only be closed upon presentation of the document certifying the “prise en charge” by the customs administration of the final destination. Benin, however, does not require “prise en charge” enabling diversion of goods.
2.66 Modes of Cross Border Trade. There are at present four main modes of transshipment of goods across the border to Nigeria and other bordering countries: official transit, official re-exports, unofficial transit and unofficial re-exports of goods officially imported into Benin.
2.67 Official Transit. Goods can be imported into Benin and shipped to neighboring countries under official transit status. Goods in transit status are subject to lower duties than if intended for domestic consumption, with a total tax rate of 6.05 percent (mainly a 5 percent statistical tax) rather than import duties. Goods destined for land-locked countries are further exempt from the statistical tax and pay only 0.85 percent in taxes. Of the volume of goods entering the Port of Cotonou in transit status in 2004-2007, about

60
70 percent was declared for the land-locked countries to the North, with most of the remainder declared for Nigeria.42
2.68 Unofficial Transit. In theory, Benin does not grant transit status to Nigeria for products banned in the latter. In practice, however, used cars and some other goods enter Benin under transit status, with stated destinations of the land-locked countries of the interior—usually Niger—, and are then semi-officially diverted to Nigeria. In the case of used cars, by far the largest transit item, an elaborate official system of permissions is in place for reclassifying the transit destination of used cars from Niger to Nigeria once they enter Benin. In the process, re-export taxes and fees are levied amounting to about 15 percent of the declared value of the imported cars. In the end, taxes on used car imports represent two thirds of all revenue earned from goods in transit and are the largest single source of total customs revenue. Goods imported into Benin in transit status are greater than officially-recorded imports, as noted earlier. The share of goods in transit that are re-routed after entry into Benin is not known, but is manifestly very high for used cars, and likely also for batteries, the second-largest transit item.
2.69 Official Re-exports of goods after warehousing. Some imported goods originally intended for Benin can be sold under customs control to foreign markets. Prior approval of the Director of Customs is required and the goods must have a customs escort to the border to ensure that they are not diverted to the domestic market. These re-exports are taxed at a rate of 14.37 percent (Taxe Speciale de Reexportation 8 percent, plus the taxes that apply to transit)—a rate that exceeds that on transit but below that of ordinary imports, including those that are unofficially forwarded to Nigeria. This regime applies to a number of products, including alcoholic drinks other than beer, rice, sugar, milk, tomato concentrate, textiles, used clothes, new tires, insecticides, and steel products. Official re-exports are miniscule, however, as seen in Table 2.1 above. The vast majority of re-exports are unofficial.
2.70 Unofficial Exports of Official Imports. Goods destined for Nigeria are often imported legally into Benin as if intended for domestic consumption and then re-exported unofficially. Nigerian traders purchase the merchandise in Cotonou, stock it along the border, and then illegally slip it across the border through remote roads or by bribing border guards, as described more fully below. Such goods imports are imported formally through the port of Cotonou and subject to normal import duties as they enter Benin but in practice are sometimes discounted, as discussed further below. The re-export trade therefore straddles the formal and informal sectors: goods are imported formally by registered wholesalers, but re-exported informally.
2.71 The modalities of importation of products intended for re-export to Nigeria vary by the nature of the commodity.43 Cross-border trade is largely controlled by sophisticated and well-organized networks, with many small operators involved on the 42 Data from the Port of Cotonou differs somewhat from customs data. Table 3.1 is based on customs data. According to port data, goods imported in transit status rose from 1.2 million tons in 2004 to 2.6 million tons in 2007. 43 This description is based on Igué and Soulé (1992) as well as interviews during the mission.

61
margins. The trust and connections provided by these informal networks, often ethnic or religious in nature, facilitate market transactions spanning the continents and enable provision of credit and transfers of funds.
2.72 For bulk items such as rice, wheat and sugar, importers purchase directly from international brokers with whom they are in regular contact. For some products such as cigarettes, the foreign companies have local representatives in Benin. Importers of second-hand goods such as used cars often travel abroad or have foreign correspondents, providing information about sourcing opportunities. A few large wholesalers dominate the imports of frozen poultry; COMON has about 60 percent of the market, employing 470 full time workers, and CDPA has some 20 percent of the market, with 150 full time workers and another 300 part-time workers. Overall, traders display a remarkable flexibility in adapting to changing market opportunities.
2.73 A variety of trading networks linked by cultural, ethnic or commercial ties, operate in the re-export trade. These include the Yoruba ethnic group, centered on Porto Novo, which operates with a high degree of cohesion thanks to ethnic and religious affinities, groups of women importers, and middlemen operating in the markets, again mostly women. Foreigners are also engaged. Most of the descendants of the European trading houses have exited the scene, replaced by Lebanese and other Arabs some of whom came from Nigeria during the Biafra war, Indians arriving from Ghana and Nigeria starting around 1970, and Ibo refugees from the Biafra War.
2.74 The re-export trade has developed a sophisticated infrastructure, in some respects organized much more efficiently than public infrastructure. Unofficial re-exports can cross the border by land or water. By land, there are numerous and ever-changing tracks used by traders along the long border with Nigeria. A complex network of canals is also used, with new canals being dug when customs agents patrol existing routes. Specialized warehouses for various goods destined for re-export are located in Cotonou and along the border. For example, there are warehouses specializing in wheat, rice, etc. These warehouses are built and operated by brokers or private traders operating individually or in groups for their own use or are rented out to other traders. A network of markets dots both sides of the Benin-Nigeria border, with sister markets on either side of the frontier.
2.75 Likewise, reverse smuggling from Nigeria into Benin is intricately organized. Transport of goods by truck convoy is permitted under agreements between Beninese importers and high customs officials in Nigeria, with a pre-arranged lump-sum payment per truck estimated to be equivalent to an ad valorem rate of 9-24 percent prior to 1997—well below the statutory import duties and other import taxes (Le Faou, 2001). Goods are also shipped to Benin illegally using the same complex system of canals described above, as well as by taxis hired for this purpose on both sides of the border. In February 1997, however, the Beninese authorities abruptly raised the lump-sum charge on trucks by 50 percent, resulting in a sharp reduction in legal entry of goods in favor of illegal modes.

62
2.76 An important dimension of the unofficial trade involves currency transactions. A sophisticated parallel currency market has developed involving exchanges of CFA francs and Naira, described in detail in Hashim and Meagher (1999).
2.77 Some observers claim that the unofficial re-export trade operates in thinly-disguised collusion with high government officials in Nigeria. The highly lucrative re-export trade in cigarettes, for example, has been carried out by Nigerian trading groups under the protection of the Nigerian secret service (Hashim and Meagher 1999, 104). In fact, in the case of used clothing and cigarettes, the dominant trading groups can deploy the authorities to crack down on new entrants, preserving their control. Nigerian government involvement is also alleged to be profound in the all-important smuggling of petroleum products out of Nigeria (see Box 2.4).
Determinants of the Re-export Trade: Trade Policies in Benin and Nigeria
2.78 Differential trade and taxation policies and practices are the main cause of re-exports between Benin and Nigeria, according to the available literature (Igué and Soulé 1992, Soulé 2004, Perret 2002, Morillon and Afouda 2005) and our interviews in the field.
2.79 Benin’s trade policies. Even more than in other least developed countries, Benin’s government revenues still depend heavily on taxation of international trade. Trade taxes account for more than half of tax receipts and about half of all government revenue. In 1973, as noted above, Benin officially adopted trade policies to foster the re-export trade, with the goal of maintaining lower import barriers than those in Nigeria.
2.80 Under the WAEMU Tarif Exterieur Commun (TEC) internal tariffs on intra-WAEMU trade were eliminated in 2000 and external tariffs harmonized to a simplified structure with four rates:
0 percent: Social necessities 5 percent: Primary inputs and capital goods 10 percent: Inputs and intermediate products 20 percent: Final consumer goods.
2.81 In addition to the TEC tariff, all non-WAEMU-originating imports are subject to the redevance stastistique (RS) and the prelevement compensatoire de solidarité (PCS), both at 1 percent and a prelevement communautaire of 0.5 percent.
2.82 Unlike in other WAEMU countries, the TEC actually raised tariff rates on average in Benin. Prior to the TEC, Benin’s tariffs on consumer goods averaged 13.4 percent, far below the 30-percent plus rates of most other WAEMU countries, with only Togo somewhat closer to Benin at 19 percent. With the implementation of the TEC, Benin’s overall average tariffs rose slightly from 11.4 to 12.2 percent, whereas average tariffs fell substantially for all other WAEMU countries (Benin DTIS, Ch. 3). The TEC did little to diminish Benin’s re-exports, however, given the continued very large differential with Nigeria and discretionary tariff discounting.
63
2.83 The TEC particularly reduced Benin’s competitive advantage vis-à-vis Togo, and a source of consternation in Benin. To counter the disincentive effects of this tariff increase, Benin customs officials have at times endeavored to offset the rate increases through tariff discounting, in particular lowering the declared taxable value of some merchandise. After the introduction of the TEC, the ASYCUDA system was reprogrammed for a number of tariff lines to calculate automatically an “abatement” of 30 percent on the declared value, thereby circumventing the official TEC and bringing the rates down to their previous levels. In effect, a preferential regime is in effect for re-exports relative to goods for local use. These de facto reductions in duties are sometimes justified by Togo’s tariff discounting, but both countries engage in this practice. In any event, this two-track system for imports has become increasingly institutionalized within customs.
2.84 The value added tax (VAT) is also harmonized among WAEMU member countries, applies at a flat 18 percent rate on all products, including imports44. There are also special excise taxes on a few products such as cigarettes, alcohol, other drinks, and cosmetics.
2.85 Nigeria’s trade policies. Nigeria heavily protects some products, particularly those facing strong import competition, while subsidizing others, notably gasoline and other petroleum products.
2.86 Nigeria’s import barriers are currently among the highest in the world, as shown in Tables 2.2 and 2.3, with average applied tariffs averaging nearly 30 per cent in 2003 and a significant number of import prohibitions (IMF 2005, WTO 2005). On the other hand, other taxes on imports are relatively low: a port development levy of 7 percent of customs duties (equivalent to an average of about 2 percent of import value), value-added taxes of 5 percent and the ECOWAS community level of 0.5 percent. A few imported goods are subject to additional excise taxes (2 percent on vehicles, 10 percent on sugar, and 10 percent on rice).
2.87 The Nigerian government has sought to protect its struggling domestic industrial and agricultural industries behind high import barriers. The Nigerian manufacturing sector is unusually diversified for Africa, with domestic firms producing textiles, steel, vehicles, and consumer appliances. These industries remain highly inefficient, however, with capacity utilization rates usually well below 50 percent (IMF 2005). Many Nigerian factories have closed over time due to high costs and lack of competitiveness against Asian imports. Agriculture also faces import competition from Asia.
2.88 Nigeria’s trade policies have varied widely over time. In the decade following independence, Nigeria sharply raised import barriers, with tariffs on consumer goods reaching 100 percent or more (Hashim and Meagher 1999, Table 4.2). In the early 1970s, coinciding with the oil boom, Nigeria greatly liberalized its trade policies, resulting in a massive import surge. In the mid 1970s, Nigeria established higher tariffs, a
44 Except Niger where it is 19 percent.

64
system of import licensing, and outright import bans on selected products, in response to balance of payments difficulties, increasing competition from low-cost Asian bulk agricultural products and manufactured goods, and high costs and very low capacity utilization in much of the domestic manufacturing industry. In the mid-1980s, following further balance of payments difficulties and increasing bankruptcies of local manufacturing firms, trade policy became even more protectionist, with tariffs rising further and an increasingly large number of goods subject to import prohibitions. (Igué and Soulé 1992).
2.89 ECOWAS has been moving toward the adoption of a common external tariff with the same 4-category structure of rates as WAEMU, but Nigeria has so far refused to fully accept this regime. In 2005, the Nigerian tariff schedule was simplified and partially aligned with the ECOWAS Common External Tariff (CET), with the maximum rate lowered, but only to 50 percent, well above the ECOWAS proposed ceiling of 20 percent. Nigeria has recently demanded that ECOWAS institute a 5th tariff band with a rate of 50 per cent as a condition for participating in the CET. Subsequently it has been suggested that the maximum rate could be as low as 30-35%. A number of Nigerian imports including rice, sugar, cigarettes, plastics, tires, steel, household appliances, and vehicles are currently subject to 50 percent tariffs, and there is also a long list of items facing outright bans (see Table 2.3). Indeed, although tariffs have declined somewhat since 2005, the number of products subject to import bans has gone up significantly, with increases in 2001, 2003 and 2004 (IMF 2005). The WTO concluded that Nigeria had on balance become more protectionist between its 1998 and 2005 Trade Policy Reviews.
2.90 Nigeria also violates ECOWAS’s provisions on free trade within West Africa. All imports from West Africa are required to enter Nigeria through the Port of Calabar, and there are numerous checkpoints on the roads between Krake, the main entry point from Benin into Southern Nigeria, and the Nigerian capital Lagos, 120 km from the border. Nigeria’s import bans are applied to imports from Benin even if the products are produced in Benin.
2.91 Table 2.2 presents the evolution of Nigeria’s trade barriers on some of the key products involved in the re-export trade over the last 12 years, illustrating the very high levels and variability of restrictions on imports. For example, wheat was banned from 1986-1992, liberalized in 1992, and then banned again since 1995 (Soulé 2004). Table 2.3 provides the complete list of officially banned items as of 2007. The list is long and covers a wide range of goods, whose only common trait is that they compete with domestic Nigerian manufacturing or agricultural industries. The extent to which these bans are enforced, however, has also varied and exemptions can be granted with the approval of the President. In short, Nigerian trade policy operates with an enormous complexity and opacity over and beyond the very high import barriers.

65
Table 2.2: Selected Import Barriers in Nigeria, 1995-2007 (Tariff rates in percent or bans)
1995 1997 1999 2001 2003 2005 2007
Edible oil Banned Banned 55 40 Banned Banned Banned
Poultry meat Banned Banned 55 75 Banned Banned Banned
Beer Banned Banned 100 100 100 Banned Banned
Wine 100 100 100 100 100 20 20
Milk Products 55 55 50 50 100 20 20
Tomato preserves 45 45 45 45 45 20 20
Used Clothes Banned Banned Banned Banned Banned Banned Banned
Tires Banned Banned Banned Banned Banned Banned Banned
Wheat dough Banned Banned Banned Banned Banned Banned Banned
Used Cars* Banned Banned Banned Banned Banned Banned Banned
Sugar 10 10 10 40 100 50 50
Cloth and Apparel Banned 50 65 55 100 Banned Banned
Tobacco and cigarettes 90 90 80 80 100 50 50
Rice 100 50 50 75 110 50 50 *Defined as more than 8 years old in 1994-2002, and more than 5 years in 2002-2004, and 8 years since 2004. Source: LARES-IRAM (2004) and Nigerian customs data provided by the World Bank.

66
Table 2.3: Nigerian Import Prohibition List (2007)
1. Frozen Poultry 2. Meat (Beef, Pork, Lamb, etc). 3. Eggs 4. Flowers [Plastic and Fresh] 5. Cassava/Cassava Products 6. Fresh and Dried Fruits 7. Maize and Millet 8. Wheat and Maize Flour. 9. Vegetable Oils and Fats. 10. Sugar Confectionaries [Other than Chocolate]. 11. Cocoa Butter, Powder and Cakes 12. Spaghetti/Noodles. 13. Biscuits. 14. Fruit Juice in Retail Packs. 15. Waters without added Sugar 16. Waters with added Sugar 17. Beer 18. Bentonites and Barytes. 19. Bagged Cement. 20. Medicaments (various ones) 21. Waste Pharmaceuticals 22. Toothpaste 23. Finished Soaps 24. Mosquito Repellant Coils. 25. Plastics – 26. Polypropylene Woven/Laminated Sacks and Bags 27. Tooth Picks 28. Used tires. 29. Corrugated Paper, Paper Boards, and Boxes. 30. Envelopes, Greeting Cards and Calendars 31. Toilet Paper and Facial Tissues 32. Textile Fabrics of all types and articles 33. Yarn* 34. Exercise Books* 35. Footwear and Bags of Leather and Plastic 36. Hollow Glass Bottles for beverages. 37. Cutlasses, Axes, Pick Axes, Spades, Shovels etc. 38. Used Air Conditioners and Compressors. 39. Used Motor Vehicles above eight (8) years old 40. Bicycles Frames, Forks and Mudguards 41. Furniture 42. Electric generators sound proof casings 43. Gaming Machines 44. Ball Point Pens 45. Telephone Re-charge Cards* *Added to the list between 2005 and 2007. No items were removed during this time but some partial exceptions are stipulated. Source: Nigerian customs, provided by The World Bank.

67
2.92 On the other hand, some products in Nigeria are highly subsidized such as petroleum products and fertilizer, spurring large-scale unofficial imports into Benin from Nigeria, some of which are in turn re-exported to other countries.
2.93 Trade Policies in Togo. Togo, like Benin, has oriented its trade policies towards capturing rents from re-export and transit, including to Nigeria. Like Benin, in 1973 Togo adopted a national strategy to promote re-exports (Hashim and Meagher 1999). Although Togo does not have a border with Nigeria, it can supply the Nigerian market by smuggling goods through Benin or through Niger. Like Benin, Togo sometimes lowers actually applied duties of imported goods below WAEMU levels. In addition to maintaining low tariffs, Togo has established a free trade zone in which goods in transit enter with very low taxation and minimal regulation. In order to offset its competitive disadvantage due to higher transport costs, Togo charges lower fees on used cars in transit than Benin. Numerous transit companies operate in Togo. Togolese and Beninese customs officials carefully observe and respond to each other’s practices.
Other Determinants of the Re-Export Trade
2.94 Exchange Rates and Convertibility of the CFA franc. Exchange rate changes themselves should not much alter the relative prices of importable goods from Asia or Europe in Benin versus Nigeria since these prices are set in world markets and a change in the CFA franc/naira exchange rate should be reflected in corresponding movements of local currency prices in Benin and Nigeria. It can, however, affect the competitiveness of locally-produced goods. In any event, the devaluation of the CFA franc in 1994 had little effect on the re-export trade beyond the short run disruptions it entailed. For a few months immediately following the 1994 devaluation re-exports dropped, but they recovered rapidly and no clear change in the volume of re-exports occurred between 1993 and 1994 (Galtier and Tassou 1998, p. 129, Hashim and Meagher 1999). The effect of the CFA franc devaluation may also have been obscured by the subsequent sharp depreciation of the naira in the parallel market and the rapid increase of Nigerian inflation.
2.95 The greater stability and liquidity of the CFA franc relative to the Nigerian naira has played a role in boosting Benin’s role as a trading center. Unlike the CFA franc which is pegged to the Euro, and freely convertible into foreign currency within the CFA zone, the naira is highly volatile and subject to strict exchange controls, with a large black market. In 1993, however, when the CFA franc was made temporarily inconvertible outside of the franc zone, it had no lasting negative effect on the re-export trade.
2.96 Relations with Nigeria. Benin has long had complex economic and political ties to Nigeria. Both countries are members of ECOWAS, and in 2007, Benin, Togo, Ghana and Nigeria announced the creation of a “Co-prosperity zone.” Some cooperative regional efforts in energy have advanced, but Nigeria is large enough that it has little need to coordinate with its much-smaller neighbors. As noted above, Benin for its part has focused its economic policies on taking advantage of Nigerian policy distortions.

68
President Obasanjo declared to Beninese traders on April 22, 2004: “We will not permit our economy to be destroyed by illicit trade…We will never allow entry of goods imported from third countries. But whatever you produce yourselves here in Benin, we will welcome for sale in Nigeria.”45 Contrary to this pledge, however, Nigeria continues to impede legitimate inter-regional trade through import bans on goods produced in Benin while failing to block large-scale smuggling efforts.
2.97 Nigeria has made sporadic efforts and threats to close down this trade, and has occasionally done so. The borders have sometimes been closed due to other political tensions between the two countries. From February 1984 to February 1986, Nigeria shut down the border with Benin in an effort to curb smuggling of petroleum products out of Nigeria. During this time, Nigeria closed down all service stations within 10 kg of the border with Benin in a futile attempt to curb smuggling.
2.98 In 1996, President Abacha of Nigeria closed the border in a political dispute with Benin’s President Soglo, related to the latter’s military cooperation with the United States which Abacha viewed as a threat. The resulting dislocations in Benin, notably gasoline shortages, contributed to the Soglo’s loss in the 1996 presidential elections.
2.99 In August 2003, the border was closed for a week following a confrontation between the Nigerian and Beninese government precipitated by the harboring of a Nigerian suspected criminal in Cotonou.46 Only when he was turned over to the Nigerian authorities following a meeting between Obasanjo and President Kerekou of Benin at Badagry, Nigeria, was the border re-opened. Following the meeting, the two presidents issued the “Memorandum of Badagry”, which commits the Benin and Nigerian government to foster formal trade relations while curtailing smuggling and criminality. To facilitate trade in accord with ECOWAS objectives, two border crossings have been identified for expeditious transfer of merchandise: Krake-Seme in the South and Chikanda/Nikki in the North. Nigeria nevertheless simultaneously made public a list of 29 goods covering both re-exports and goods made in Benin, that are not permitted into Nigeria from Benin to be imported notwithstanding ECOWAS agreements on free movement of goods within the region. In November 2003, Nigeria further banned all container traffic through land crossings. The products manufactured in Benin affected by these bans include various food products such as manioc dough and edible oils, mineral water, textiles, and cement.
2.100 Another brief but disruptive border closing occurred in 2005. Very recently, in March 2008, Nigeria reportedly initiated a crackdown on imports of used cars, holding up car convoys at the usual crossing points such a Krake and Igolo.47
45 (Quoted in Le Rocher Douanier, No. 094, 26 April 2004, p.2.) 46 The case involved the assassination of one of then Nigerian President Obasanjo’s nieces in a carjacking in Lagos. The carjacking ring stole cars in Nigeria and took them to Cotonou. The head of the carjacking ring, Tidjani Hamani, a Niger national, was based in Cotonou, where he was released by the Benin judiciary after having been arrested. 47 “Difficultés commerciales entre le Bénin et Le Nigeria: Embargo sur les véhicules d’occasion venues de Cotonou,” Le Matinal (Benin), March 14, 2008.

69
2.101 Notwithstanding these occasional border closings and frequent threats from Nigeria, the re-export trade has always recovered as the enforcement of border controls reverts to its normal laxity. Nevertheless, it is clear is that Benin is highly vulnerable to the vagaries of economic policy in Nigeria and could face serious difficulties if Nigeria adopts less restrictive trade barriers and/or makes a serious effort to crack down on parallel trade.
2.102 Overall Business Climate. Benin, although far from perfect, offers a much friendlier climate for business and trade than Nigeria. Insecurity and crime are rampant in Nigeria, including at the ports. The port of Cotonou suffers from significant problems of corruption and weakness of infrastructure, but is superior to the ports in Nigeria. Clearance of goods is much faster, cheaper and easier in Cotonou compared to Nigerian ports. According to shippers, however, ports in Nigeria are improving, so this factor may become less significant. In any case, the dominant factor remains differential trade and pricing policies.
The Composition and Magnitude of Unofficial Re-exports
2.103 The shadowy and complex nature of transit and re-export trade by its very nature makes it difficult to measure it. The estimates presented here are therefore necessarily subject to wide margins of error, and are intended to provide rough dimensions only.
2.104 Re-exports from Benin to Nigeria. Re-exports are dominated by a limited number of products which are highly protected or banned in Nigeria, including those listed in Table 2.2 above: bulk food items (rice, wheat, sugar), processed foods (tomato paste, condensed milk), cigarettes, textiles and clothing, and used goods (cars, tires and clothes). Most of these products have been mainstays of the re-export trade since at least the 1970s, although variations have occurred in their relative importance in response to fluctuations in the severity of Nigeria’s import restrictions.
2.105 Imports of frozen poultry and fish illustrate these issues. About 90 percent of Benin’s poultry imports wind up in Nigeria, while almost all of the frozen fish imports are intended for the domestic market. Fish is not re-exported to Nigeria due to the absence of restrictions on fish imports into Nigeria whereas frozen poultry is banned in the latter and therefore sourced in Benin illegally. In other words, Benin tends to export whatever goods are most protected in Nigeria. Most of the imports of poultry (consisting 60 percent of chicken and 40 percent of turkey) come from Europe, with some also from Brazil. Imports of poultry are dominated by a few large firms that obtain their products from trading companies with contacts with producers in Europe.
2.106 Previous studies have substantially underestimated the magnitude and significance of re-exports for Benin. The Benin DTIS (World Bank 2005, Chapter 4) reports data from LARES (Soulé 2004) indicating that re-exports represented about 70 percent of official trade over the 1995-2002 period. The LARES data greatly underestimate unofficial trade, however. This is because the LARES estimates are based solely on official imports of “key” re-export products, i.e. goods imported as if for domestic consumption, but ignore official “transit” trade in these same products. Goods

70
declared in transit to land-locked countries (mainly Niger), however, are in fact also mostly diverted and smuggled into Nigeria, as mentioned previously. In the notable case of used cars, the vast majority is imported under transit status declared for Niger rather than for local consumption, but 90 percent of them end in Nigeria, as explained in detail in box 2.3. Although the taxes on goods in transit are lower than those on normal imports, Benin also charges various fees for authorization to re-declare the cars to Nigeria once they enter Benin. In all respects, therefore, the distinction between official imports of used cars and used cars imported in transit is in fact minimal. Both categories are smuggled into Nigeria and yield large revenues for the Benin government. Other goods imported in transit as well as if for domestic consumption are also among the leading sources of customs revenues (rice, used clothes, and cigarettes among others).
2.107 Table 2.4 presents the values of imports and duties collected over 2004-2007 on 14 of the most important goods of the re-export trade, all of which are either banned or heavily taxed in Nigeria. Importers in Benin estimate that 70-90 percent of these goods are re-exported illegally to Nigeria. These 14 goods include the most important but by no means the only re-exported items. If one assumes that the items not included in this calculation represent 20 percent of all re-exports, but on the other hand that perhaps 20 percent of all such imports are for domestic consumption, the figures in Table 2.4 can be taken as rough measures of the total re-export trade and its contribution to government revenues. As just noted, used cars are the largest import item and the greatest single source of import tax revenue. The other most important re-export items in value terms include rice, cotton and synthetic textiles, used clothing, and frozen poultry. In terms of government revenue, used cars and rice have been by far the largest in recent years, accounting for half the subtotal revenues.
2.108 Overall, Table 2.4 suggests that the re-export trade is very significant relative to recorded imports, GDP and government revenues. Imports of these 14 goods alone are greater than all officially recorded imports reported in IMF and World Bank databases, largely because these databases exclude goods imported in transit status. Imports of goods intended for re-export account for approximately half of total recorded imports, inclusive of transit. Duties collected on these 14 goods alone amount to about 30 percent of total government tax revenues over 2004-2007. These figures are considerably above those suggested in the previous literature such Galtier and Tassou (1998). According to Igué and Soulé (1992), however, re-exports have at various earlier times amounted to more than half of recorded imports, e.g. in the late 1970s and early 1980s, so the high level of re-exports as a share of recorded trade is not unprecedented for Benin. Estimates by LARES for the 1990s indicate a lower share of re-exports as a ratio of recorded imports, but this is due to the omission of transit, as noted above.

71
Table 2.4: Imports and Duties Paid by Selected Re-Export Items (Billion CFA Francs)
Imports 2004 2005 2006 2007
Used Cars 150.5 178.7 264.2 327.7 Rice 50.4 90.9 104.4 151.7 Textiles 44.7 60.1 57.0 82.9 Used Clothes 27.8 32.7 41.9 48.9 Palm oil 9.1 9.0 27.1 44.4 Frozen Poultry 29.7 26.0 23.6 38.5 Batteries 20.4 23.5 29.6 34.5 Furniture 4.7 6.6 14.5 28.6 Sugar 8.0 9.8 13.2 13.4 Clothing 4.1 10.7 2.3 8.8 Cigarettes 1.9 3.8 5.7 8.8 Prepared Tomatoes 0.7 0.7 2.4 4.6 Used Tires 3.5 4.2 4.2 4.5 Cardboard 4.3 4.2 3.7 3.1 Sub-Total 359.7 460.9 593.9 800.2 Share of GDP 22.4% 23.6% 26.6% 32.4%
Duties Paid 2004 2005 2006 2007
Used Cars 21.1 23.8 31.4 47.6 Rice 11.4 22.3 23.5 34.6 Textiles 13.8 11.9 10.6 17.4 Used Clothes 2.0 2.5 7.4 13.5 Palm oil 7.9 9.0 10.2 11.5 Frozen Poultry 11.2 10.6 10.1 10.3 Batteries 0.4 1.5 2.9 5.3 Furniture 2.2 2.4 3.1 2.2 Sugar 1.6 2.0 2.3 2.1 Clothing 1.2 1.5 1.7 2.0 Cigarettes 1.0 1.5 0.3 2.0 Prepared Tomatoes 0.6 0.7 1.1 1.6 Used Tires 1.8 1.8 1.7 1.3 Cardboard 2.3 6.9 1.0 1.1 Sub-Total 80.4 100.2 109.2 161.1 Share of GDP 3.8% 4.4% 4.4% 6.1% Share of Tax Revenue 25.1% 29.5% 29.2% 36.1%
aIncludes goods imported in transit status. Source: Benin customs data and author’s calculations.

72
Box 2.3: Trade in Used Cars 48
Used cars have been the most significant re-export since about 2000. Imports of vehicles have risen steeply from 50,000 in 1996 to 200,000 in 2000, 250,000 in 2002 and 2003, and after a dip in 2004-2005 to about 150,000, rose again in 2006 to 200,000 and to all-time high of 300,000 in 2007. Perret (2002) estimated that used cars accounted for as much as 43 percent of all trade flows in 2001, up from 37 percent in 1999. This is confirmed by the fact that in 2001 used cars represented an astounding 45 percent of revenues (fees and taxes) for the Port of Cotonou. Indeed the used car trade has become one of Benin’s major industries. Huge car parks can be seen in the outskirts of Cotonou. This business is estimated to employ 10,000 to 15,000 people directly, in importing, selling, storing and driving etc, and several thousand more indirectly. The value added generated by the distribution and handling of used cars was estimated at 9 percent of Benin’s GDP in 2001, i.e., roughly the same as cotton.
About 90 percent of used cars imported into Benin are destined for Nigeria, with 5 percent for Niger and 5 percent for the domestic market. The bulk of used cars enter Benin in transit status, officially manifested for Niger or other land-locked countries. For instance of 230,000 cars declared for shipment to Niger in 2001, only 15,000 in fact ended up there. Almost all the rest wound up in Nigeria. The fact that cars manifested for Niger and other land-locked countries are diverted to Nigeria is not concealed in Benin. There is a well-established set of procedures for obtaining documents from customs authorizing diversion of the cars to Nigeria. The fees and taxes for obtaining the authorizations amount to about 400,000 CFA francs per car. This includes a fee for a customs escort to accompany the car to the Nigeria border. With the average CIF value of a used car of about 1 to 1.5 million CFA francs, the taxes and fees at the level of customs clearance alone amount to about 30 per cent of the value of the car.
Used car imports follow an elaborate and well organized circuit. Importers with connections in developed countries locate, purchase, and arrange for the transportation of the cars. Germany was the origin of about 65 percent of the cars imported in 2001, with most of the rest also coming from Europe. The location of Beninese correspondents and the ease of port operations affect the preferred port of embarkation. The North American share has increased recently but Europe remains the main source. Some of the importers are affiliated with international shipping companies such as Grimaldi, owning their own boats. Others rent the boats. Freight forwarders (“transitaires”) handle all the paperwork and authorizations. Other intermediaries play a role in matching buyers and sellers of cars. After the cars clear the port, they are stored in car parks in Cotonou, before being driven to their destination by companies specializing in delivery of cars to the border, under escort from customs and with police permission. The cars are driven at night in convoys of about 100 cars. They cross the border to Nigeria after paying bribes to both Beninese and Nigerian customs inspectors. The magnitude of the bribes is routine and the amount largely set by precedent, according to the transitaires interviewed. They then receive valid license plates in Nigeria. In short, government officials on both sides of the border facilitate and benefit from this trade.
Competition from Togo is increasing, with Togo charging lower fees for speedier service, to offset Benin’s geographical advantage. In Togo, the paperwork takes only one day and the fees charged by Togolese customs are 200,000-300,000 CFA francs per car. Competition from Togo was particularly acute around 2003-2004, due to problems at the port of Cotonou. Nevertheless, these problems appear to have lessened, Beninese traders do not seem overly worried about Togo, as the imports of used cars into Benin have picked up strongly since 2005.
The ample supply of aging vehicles in Europe, and low incomes in West Africa provide a natural basis for trade in used cars. Imported cars averaged about 16 years of use upon arrival in Benin in 2001, with 95 percent more than 10 years old. Toyota, Mercedes, and Peugeot cars have predominated but other Japanese and European companies are increasingly prevalent. An accompanying market in spare parts has also flourished.
Nigeria’s ineffective attempts to protect its own struggling car industry have diverted this trade to the parallel market. At the end of the 1970s, Nigeria assembled 100,000 cars against a mere 10,000 today. In 1994, Nigeria banned imports of vehicles more than 8 years old. In 2002, the law was further tightened to a ban of all cars more than 5 years old. In 2004, the ban was eased to apply again to cars more than 8 years old. Moreover, any imports of cars by land routes, notably from Benin, are banned altogether. These bans, however, have until recently proved impervious to the porous border between the two countries, the strong demand for cheap vehicles, and the ambiguous attitudes of the authorities in Nigeria. If Nigeria were either to liberalize its car market or effectively enforce the ban, as it sporadically does, most recently in March 2008, this lucrative trade could suffer greatly or even collapse.
48 This discussion of the used car market is based on Perret (2002) and interviews during the mission with traders and businesses involved in the import and sale of used cars.

73
2.109 From Nigeria to Benin. The parallel trade also runs from Nigeria to Benin. Nigeria has long been a supplier to its francophone neighbors of a large variety of agricultural and manufactured goods, imported from Asia, in the case of items facing low import barriers in Nigeria49, or produced locally in Nigeria. The largest unofficial Nigerian export from Nigeria to Benin item by far consists of petroleum products, which are heavily subsidized in Nigeria (box 2.4). Imports from Nigeria have also been an important source of capital and consumer goods in Benin and other CFA franc zone countries in the region. Products include fertilizer, machinery of various kinds, foodstuffs (corn and millet), plastic goods, spare parts, miscellaneous consumer goods such as dishes, cookware, soaps, school supplies, cosmetics, hardware, toys, scooters, and medicines (Galtier and Tassou 1998). Generic and low-cost pharmaceuticals are produced in Nigeria with minimal regulation, so parallel imports from Nigeria are the source of cheap generic medicines in Benin for people who cannot afford to go to a licensed pharmacy. Some goods move in both directions at different times and places, including bulk food items and textiles, depending on market conditions and Nigeria’s trade barriers.
2.110 In recent years, imports of manufactured products into Benin from Nigeria have declined, supplanted by direct imports into Benin from China or via Dubai. Petroleum imports are also down somewhat (Box 2.4).
49 Nigeria enjoys volume discounts. In some cases, Chinese companies won’t even bother with a small Benin order.

74
Box 2.4: Petroleum Product Imports from Nigeria
Like the re-export trade from Benin to Nigeria, smuggling of petroleum products into Benin reflects differential policies combined with the ease of slipping goods across the border and the complicity of the two countries’ officials. In this case, however, the main factor are the very large subsidies in Nigeria, along with partial deregulation of pricing in Benin, that together result in much lower consumer prices in Nigeria compared to Benin. (Morillon and Afouda 2005) Smuggling of oil products into Benin began around 1980 and increased dramatically in 2000. High level officials in both Nigeria and Benin are said to be intimately involved.
Nigeria, of course, is one of the world’s largest producers of crude oil, with export revenues highly dependent on world market prices, but its domestic consumer prices are largely delinked from world market trends. Nigerian refineries are provided with crude oil at prices far below those of world market, amounting to a subsidy of 20-30 percent. Due to the poor condition of its refineries, Nigeria imports gasoline, which is also sold at controlled prices. Moreover, Nigeria’s taxation of gasoline and diesel fuel is far below that of Benin and other countries in the region. In 2005, the cumulative taxation of gasoline in Benin approached 100 percent, counting import duties, excise taxes, and value added taxes, while taxes on oil products in Nigeria are low.
Benin partially liberalized its petrol sector in 1995 as part of its reform policies. In 2000, retail prices of gasoline, diesel fuel and kerosene were raised by about 75 percent and have subsequently been adjusted in line with world oil prices. The 2000 price dramatically widened the gap between the official prices of these products in Benin and Nigeria, with prices in Benin more than double those of Nigeria between August 2000 and May 2004, measured at the parallel exchange rate. In the last few years, Nigeria has raised its domestic prices, narrowing the differential between the official prices in Benin and Nigeria. In April 2008, Benin’s official price for unleaded gasoline was 470 CFA francs per liter compared, about 50 percent above the price of 80 Naira in Nigeria, or about 300 CFA francs at the parallel exchange rate. The black market price of gasoline in Cotonou dropped sharply relative to the official price of gasoline following the June 2000 official price increases, whereas in 1997-1999 the black market price tended to exceed the official price, reflecting the scarcity of the product in the face of the controlled price. The black market prices of gasoline in Nigeria and Benin are nearly identical, at about 30 percent above to the Nigeria official price. In short, the black market price in Benin appears to be determined by a markup on the Nigerian official price and have little connection to Benin’s official price. Thus, the 2000 official price increases in Benin had no sustained effect on black market prices (Morillon and Afouda 2005, Figures 2.11 and 2.12).
Not coincidentally, official imports of gasoline and other petroleum products dropped dramatically in Benin since 2000 despite continuing increases in the stock of vehicles in use in the country. Morillon and Afounda (2005) consequently estimate that the share of gasoline supplied by informal imports from Nigeria rose from about 10 percent in 1998 and 1999 to about 50 percent in 2000 and 83 percent in 2001 and 2002, increasing in 2003-2004 to 72 percent. In recent years, the share of smuggled petroleum products has declined slightly due to price increases in Nigeria. The share of smuggled gasoline has remained around 60-70 percent of Benin’s domestic consumption but parallel imports of diesel and kerosene have dropped sharply.
Although well above Nigeria’s official prices, Benin’s official retail petroleum prices are nonetheless considerably below those of other francophone countries of the region. For example, in March 2005, Benin’s price for regular gasoline was 360 CFA francs per liter, compared to 415 in Togo, 470 in Niger, 522 in Burkina Faso and 580 in Mali. Benin consequently also re-exports a considerable portion of the gasoline and other petroleum products it imports from Nigeria, with unofficial imports exceeding domestic usage by an undetermined magnitude.
The burgeoning informal market in Benin has been further boosted by the lack of official gas stations, and the lack of stations in turn reflects the dominance of the informal market, with the zones bordering Nigeria in particular witnessing a decline in the number of operating service stations. In contrast, there is a very dense network of service stations in Nigeria, which readily supply the informal traders who smuggle the gasoline into Benin.
The distribution network in Nigeria includes large wholesalers who have storage depots along the border holding up to 1,000 liters of gasoline. These wholesalers have close political ties to high-level officials in Nigeria. Wholesalers sell to various intermediary distributors of various sizes who sneak the gasoline through the border by pirogue, cars whose gas tanks have been expanded, in small quantities on scooters, or on foot.
The net effect of this massive trade in petroleum products on Benin’s economy is complex. It entails a large loss of fiscal revenues but also is a source of employment and income for traders and distributors, accounting in 2005 for 1-2 percent of GDP and 15,000-40,000 jobs, depending on the method of estimation.

75
Significance of the Re-export Trade for Benin
2.111 The contribution of the re-export trade is difficult to measure, but Perret’s (2002) estimates suggest that trade in used cars alone contributes 9 percent of Benin’s GDP, i.e. the same magnitude as cotton. Given that used cars account for about half of total unofficial re-exports, one can estimate that unofficial trade generates perhaps 20 percent of Benin’s GDP. Its contribution to employment is less than its contribution to GDP given that much of the latter consists of profits of importers and tax revenues, but is still substantial, involving perhaps 50,000 people directly, of which up to 15,000 are in the used car market.
2.112 The most important contribution of the re-export trade is to government revenues, accounting for about 30 percent of total tax receipts. Indeed, as noted earlier, Benin’s entire system of import taxation has revolved around maximizing the income from re-exports, by taxing goods when they enter Benin at a rate well below that in Nigeria, or taking advantage of Nigeria’s import prohibitions. Taxes on international trade represent half of Benin’s government revenues. In the 1990s some authors (Igué and Soulé 1992, Galtier and Tassou 1998) estimated that about 25 percent of customs revenues and 13 percent of total revenues derived from re-export trade to Nigeria. These previous estimates appear not to have recognized the important role of so-called transit trade in generating fiscal revenues. Used cars, which are mainly imported under transit status, were the largest single source of customs revenue in the last 4 years, followed by rice.
2.113 In effect, through this re-export scheme, Benin is diverting fiscal revenue from Nigeria to itself. Nigeria’s efforts to prevent this re-export trade have been ambivalent, however, reflecting the considerable gains that accrue to Nigerian interests engaged in smuggling. Nigeria’s efforts to crack down have resulted in damage not only to the re-export trade, but also to exports of goods originating in Benin. In fact, the Benin government on occasion has seemed willing to sacrifice domestically-produced exports to preserve the unofficial re-export trade, because of the bountiful revenue it yields. The tariff discounting for re-exports inevitably is also partially extended to goods for domestic use, thereby undermining the protection for domestic industry provided by the TEC. Moreover, those in the formal sector who accede to the official tariff rates find themselves in competition with products ostensibly intended for Nigeria and therefore receiving unofficial discounts. In this way and others, there is a tradeoff between domestic production and the re-export trade.
2.114 While Benin reaps substantial revenue gains from re-exports, there is also a lot of smuggling that almost completely escapes taxation. Moreover, these benefits are fragile since Benin’s re-exports are subject to the vagaries of Nigerian trade policy and the effectiveness of border controls. Should Nigeria ever dismantle its import prohibitions and reduce its tariffs to the agreed ECOWAS bands, the re-export trade would collapse. Alternatively, Nigeria could decide to crack down on smuggling in the country.

76
2.115 The ingenuity of the traders in taking advantage of policy differences between Benin and Nigeria suggests that there is no shortage of entrepreneurial spirit. Can these entrepreneurial talents and Benin’s favorable geographical position be transformed into a more sustainable productive economy? Some of the entrepreneurs in the re-export trade are well positioned to do so. Many of the importers are large formal enterprises, and at least some of them are diversifying into local production in view of the vulnerability of this trade to Nigerian policies (see box 2.5).
Box 2.5: Transitioning from Re-exports to Local Production: The Case of Agrisatch
CDPA (Comptoir de Distribution de Produits Alimentaires) is the second largest importer of frozen poultry into Benin and the largest importer of frozen fish, with a 20 percent share of the frozen poultry import market and 50 percent share of the frozen fish market.
The director of CDPA, Jean-Baptiste Satchivi, is university educated and is currently pursuing a Ph.D. in agricultural economics while managing his firm. He is well aware of the vulnerability of his poultry import business to unpredictable conditions in Nigeria, and is actively pursuing diversification. He recently set up another company Agrisatch, of which he is also the director, which produces eggs in Benin. He began by importing eggs but has now built two chicken farms in Benin. He commissioned studies of tropical chicken farming, hired a French technician, and contracted with a German firm to build the chicken coops. One of the farms is now operational and the other is under construction. He also hopes to transition from producing eggs to producing chicken meat, but this may be more difficult given that chicken producers across West Africa have been unable to compete with imported brown chicken parts which are exported after the white meat is used in the EU or elsewhere. The financing of Agrisatch is 40 percent his own equity and 60 percent from a bank loan at 8 percent.
Mr. Satchivi is concerned by the lack of local managerial capabilities, lack of reliable electricity supplies, and high taxation. The strong Euro (and therefore CFA franc) is also a concern. He is hoping the new government will improve the institutional and fiscal environment for business. He feels that the government can help turn around the culture of corruption and fraud in which the re-export trade takes place, but it is a difficult task.
CONCLUSION AND RECOMMENDATIONS
2.116 The re-export trade grows out of the combination of historical trading relationships, artificial national borders separating groups with close ethnic ties, and most importantly large differences in trade and pricing policies between Benin and Nigeria. Benin benefits substantially from unofficial or semi-official trade with Nigeria in the form of income, employment and fiscal revenues. But these benefits are very fragile, dependent as they are on the vagaries of economic policy in Nigeria. The repeated closures of the border are ominous demonstrations of Nigeria’s ability to shut down the re-export trade if it chooses to do so. Likewise, Nigeria’s adherence to tariff harmonization within ECOWAS would remove the foundation of the re-export trade. The sharp drop in used car sales in 2004-05 is indicative of the fragility of the re-export trade.
2.117 In important respects, the re-export trade has retarded Benin’s development. The large fiscal benefits of re-exporting have crowded out productive economic activities. The lure of the rents in Nigeria’s distorted markets exacerbates a culture of corruption and tax evasion that is not conducive to a productive economy. It is doubtful that a development strategy based on smuggling and fraud is a viable long-run path to emerging market status.

77
2.118 On the other hand, the re-export trade displays a dynamism, organizational sophistication and ingenuity that indicate a high potential for a thriving market economy. In some respects, infrastructure such as border storage depots and institutions such as import value chains operate far more efficiently in the re-export trade than the formal economy.
2.119 The challenge for Benin is to channel this energy and creativity in a more sustainable direction. Benin is well placed to continue to serve as a regional trading and service center, benefiting from its proximity to Nigeria. Competitive advantage as a regional trading hub will require an improvement in the business environment. In Benin, infrastructure and governance are better than in Nigeria, but nonetheless poor, as chapters 1 and 4 indicate. The low quality of public services extends to the port and customs administration, which are critical for a country with ambitions to serve as a trading center.
2.120 To reach emerging market status, Benin will also have to develop its capacity to produce goods and services for regional and international markets rather than merely trans-shipping goods produced elsewhere. Improvements in infrastructure and governance are important for diversification and innovation, as chapters 1 and 3 of this CEM show. Modest upgrading in infrastructure such as in the road network and increased hotel construction are small positive signs. A more concerted effort to improve the business environment is a necessary condition for such a transformation.

78
3. DIVERSIFICATION AND INNOVATION OPPORTUNITIES IN BENIN
3.1 Although a revival of the cotton sector and the development of Benin into a legitimate regional trading center are viable objectives, discussed in the previous chapter, it is also the case that Benin must diversify its productive base. This chapter focuses on identifying the range of export possibilities and evaluates the role that innovation can play in Benin’s economic transformation.
3.2 Benin’s government envisions Benin as an emerging market in the not too distant future. It is pursuing its vision by implementing the Plan Stratégique Opérationnel (PSO) which will facilitate growth in six strategic sectors: rice, cashew nut, pineapples, market-gardening, palm oil and maniocs. In a separate study, the obstacles facing new export products such as nuts, processed fruit products, crustaceans, cocoa butter and cocoa paste, peppers and pimento have also been investigated (DTIS 2005).
3.3 As low income levels limit domestic demand, exports are the only source of fast and sustainable growth in Benin. The conundrum is that unprocessed cotton is the predominant export but the volatility of cotton prices and production shocks dampens long term growth in Benin. Most policy analysts concur that Benin needs to diversify from cotton, but they are less certain about what are good options. Evidently, the PSO is the only proposal on the table but it seems ad hoc. This chapter explores Benin’s options for income-enhancing export diversification.
3.4 This chapter uses some innovative concepts designed by Hausmann, Hwang, and Rodrik (2008), Barabasi et al. (2007) and Hausmann and Klinger’s (2006) to study the range of export possibilities for Benin. Using trade data for all countries, Hausmann and Klinger construct a network of products they call the product space. The connections between products show the probabilities that a country exports a product given the other products it currently exports. This finding has implications for growth because what parts of the products space countries can reach depends on the overall proximity of goods within the product space and the country’s original positioning and this influences a country’s overall economic wealth and growth. In reality, the original position of the country depends on the inputs - natural and human resources complemented with its capabilities – required to produce what it exports. However, as information on inputs is not easily available, Hausmann and Klinger use information on outputs as a substitute. While imperfect, the substitution provides a tool for analyzing the feasible set of export possibilities in a country. It marks a major contribution that enables a statistically rigorous analysis of export diversification possibilities for a country.
3.5 The framework illustrates many export possibilities that are buried in Benin’s agricultural and natural resource base. We do not explain why Benin exported or ceased to export certain products or what specifically it will need to do to implement a different diversification strategy. These issues need to be analyzed properly

79
and are beyond the scope of this paper. Of course, like most approaches, this framework has its limitations. It does not cover transit trade, and tourism or IT services’ exports due to the lack of detailed and consistent cross-country data. This is an important consideration since Benin has considerable potential in several service sectors, notably as a regional service hub, benefiting from its favorable location next to Nigeria, as discussed in Chapter 3. Benin also has cultural and geographic advantages that are conducive to expansion of tourism. Tourism and health services are discussed in Appendix 5.
3.6 This chapter also examines the conditions of development and diffusion of improved and new technologies, notably in the agricultural and agro-food sectors. The innovation work builds on the approach developed by the Knowledge for Development group of WBI. Key factors affecting the innovation climate will be identified (technological competences, financial resources, regulatory frameworks, etc.) as well as important actors and groups (producers, universities, foreign enterprises, etc.) involved in innovation processes. Appropriate policy reforms will be identified.
WHY BENIN NEEDS TO DIVERSIFY ITS EXPORTS
3.7 Between 1990 and 2006, Benin’s real per capita income grew by about 1 percent annually. By 2006, it was catching up with the average for SSA (excluding South Africa and small states, figure 3.1). However, an out-of-Africa comparison shows that Benin’s growth record has been disappointing. At $357 (2000 constant US dollars), its per capita income in 2000 was only marginally higher than $300 in the early 1980s. Today, Benin is one of the poorest countries in the world. In contrast, between 1980 and 2007, countries such as Vietnam, India, China, Sri Lanka and Pakistan had lower income levels in the early 1980s but have become significantly richer than Benin. China leapfrogged to a middle income status, India’s income increased by 100 percent and Vietnam’s by 125 percent.
Figure 3.1: Benin - Richer Until the Mid -1980s, Among the Poorest Now
GDP per capita (constant US 2000 $)
0
200
400
600
800
1000
1200
1400
1965 1969 1973 1977 1981 1985 1989 1993 1997 2001
Benin Sri Lanka Pakistan Bangladesh India China Vietnam
Source: World Development Indicators. Averages are not weighted and were calculated by authors

80
3.8 The hallmark of growth in most countries in East and South Asia was a rising share of exports50 in GDP (figure 3.2) and a significant shift from traditional toward non-traditional high value export products. While the share of exports in GDP increased in Benin, the transformation from traditional to non-traditional products did not occur (figure 3.2).
Figure 3.2: In most Low Income Developing Countries, the Ratio of Exports to GDP and Per Capita Incomes grow in Tandem
3.9 Among other countries, export sophistication51 also played a fundamental role in fast growers such as China, Malaysia and Vietnam that once exported primary commodities. For instance, between the 1980s and 2005, China’s top exports changed from petroleum, auto parts and outer garments to electronics-related parts and machines. In Malaysia, the transformation was from natural rubber and timber to electronic microcircuits and machinery, and, in Vietnam, from coal and natural rubber to footwear and furniture (table 3.1). In comparison, in spite of the shift to a market economy, a structural transformation of Benin’s exports has not occurred.
3.10 According to the DTIS (2005), export diversification in Benin has been minimal. Benin’s natural comparative advantage and export concentration in unprocessed cotton have preserved the structure of its economy.52 In 2005, the cumulative export share of the
50 Excluding South Africa, relative to other regions, the large share of exports in GDP in Sub-Saharan Africa is due to oil and other commodity exporters. 51 Used first by Lall (2005) and later Hausmann, Hwang and Rodrik (2008), export sophistication implies superior quality with higher technological content and value. 52 Non-cotton agriculture is oriented mostly towards domestic consumption. The manufacturing sector contributes only about 8-10 percent to GDP and is comprised of a few large enterprises that date back to the Marxist era. They include cement factories, textile plants and a few agricultural and food industries that were privatized in the midst of the economic liberalization process in the 1990s. The rest of the industrial sector is composed of small firms that process food, beverages, paper items, etc. and are not very competitive. More than 90 percent of these production units are located in the coastal areas near Cotonou.
01,0002,0003,000GDP per capita in US$
LAC
Second_EA
SA
SSAnooil
BEN
BFA
MLI
Data: WDI, GDP per capita in $2000 constant terms
Average GDP per capita
1985-89 2000-04
0 .2 .4 .6Total exports/GDP, (%)
Data: WDI and COMTRADE
Regional average Total exports/GDP
1985-89 2000-04

81
top five export products totaled 81 percent.53. The export experience of commodity exporters in Sub-Saharan Africa suggests that because of weak capabilities, it will probably be insufficient to scale up nascent export sectors for a structural transformation of the Beninese economy and sustainable growth.
53 Note that, while the share of Benin’s leading exports has consistently been high, the export mix has altered in favor of a larger share of cotton products.

82
Table 3.1: Export Concentration in Top 5 Products
Country Top 5 products 1976 1980 1990 2000 2005Cocoa beans,whole or broken 35.6%
Cotton (other than linters),not carded 48.9% 14.0% 60.1% 54.2% 51.1%
Cotton fabrics,woven,bleach. 2.4%
Cotton seeds 11.1% 12.4% 5.2%
Cotton,carded or combed 4.9%
Edible nuts 8.6% 14.2%
Leather of other hides or skins 6.9%
Oil seeds and oleaginous fruit. n.e.s. 15.1% 6.3% 1.6%
Other non-ferrous base metal waste 7.4%
Palm kernel oil 14.0% 12.1%
Palm oil 2.7% 8.8% 2.6%
Sawlogs and veneer logs,of non conif. 3.7%
Be
nin
Waste and scrap metal of iron or steel 4.9%
Export shares of Top 5 products 91.8% 76.7% 82.8% 79.8% 81.3%
Animals of the bovine species 2.9%
Cotton (other than linters),not car 38.0% 35.0% 51.4% 47.2% 76.0%
Cotton seeds 2.5%
Fruit,fresh or dried, n.e.s. 2.5%
Goat & kid skins,raw 3.8% 3.5%
Gold,non-monetary 25.3%
Household type refrigerators & food 4.0%
Motor vehicles for transport of goods 2.7%
Oil seeds and oleaginous fruit. n.e 24.3% 31.7%
Oil-cake & other residues 5.0%
Other fresh or chilled vegetables 5.6%
Refined sugars 6.3%
Sesame (sesamum)seeds 14.4% 3.0% 3.3%
Sheep & lamb skins with wool on,raw 2.9%
Sugars,beet and cane,raw,solid 3.6% 3.1%
Bu
rk
ina
Fa
so
Tyres,pneum.new.of a kind used on m 5.9%
Export shares of Top 5 products 87.7% 79.7% 88.7% 60.5% 87.5%
Art.of apparel & clothing accessori 5.2% 4.9% 4.4%
Bed linen,table linen,toilet & kitc 5.8% 9.8% 15.3%
Carpets,carpeting and rugs,knotted 5.3% 14.2%
Cotton (other than linters),not carded 10.8% 15.5% 10.0%
Cotton fabrics,woven,unbleached 6.9% 5.3% 6.8% 5.4%
Cotton yarn 12.8% 10.8% 19.0% 14.3% 9.3%
Crustaceans and molluscs,fresh 9.6%
Fabrics,woven,of discontinuous synth. 4.5% 4.6%
Rice in the husk or husked 15.6%
Pa
kis
ta
n
Rice semi-milled or wholly milled 6.7%
Export shares of Top 5 products 21.9% 15.1% 19.1%

83
STRUCTURAL TRANSFORMATION – CAN BENIN BECOME AN EMERGING MARKET BY EXPORTING UNPROCESSED COTTON?
3.11 In the longer term, the brunt of income enhancing structural transformation will hinge on the income potential of what Benin exports. As an example, diversification from cotton to tobacco or coffee is unlikely to be growth-enhancing whereas diversification into products with more stable prices has more potential. What are some of the products that Benin can diversify into and achieve a higher and more sustainable level of development? As disaggregated data to measure structural transformation is unavailable, in line with conventional practice, we have made use of import data reported by Benin’s trade partners to analyze this issue.54
Links Between ‘What it Exports’ and its Income-Levels
3.12 The value share of leading exports and the Herfindahl Index (HI)55 are two popular measures of export concentration but both are neutral with respect to the type of products exported.
3.13 As noted earlier, in 2005, the share of the top 5 Beninese export products was over 81 percent. The share of cotton and related products alone was over 64 percent. These statistics were not too different from 25 years ago. In 1980 for example, the corresponding statistic was 77 percent. This is not inconsistent with the fact that several non-cotton products (palm oil, kernel oils, cocoa) that Benin exported in the 1980s have disappeared in recent times.
3.14 Table 3.1 lists the top 5 exports of Benin, Pakistan and Burkina Faso. Relative to Benin, in the 1980s, Pakistan (and India, not shown in table 3.1) had lower income levels in the 1980s but was able to graduate from exports of unprocessed cotton to light cotton manufactures and other product categories. A comparison of Pakistan’s top 5 exports with those of Benin and Burkina Faso is glaring. Pakistan (like India) diversified from raw cotton into yarn, fabrics and garments, whereas Benin made no progress. Carded cotton was recorded among its top 5 exports in the late 1990s but disappeared recently. What happened?
3.15 Over the past thirty years, most developing countries diversified their exports as evident from the decline in their HI levels (figure 3.3). First and Second East Asia56 and
54 Data on what Benin produces would be the ideal measure of but, as in the case of most developing countries, it is not available at the level of disaggregation necessary for this analysis. As a substitute and in line with conventional practice, we use export data reported by Benin’s trade partners. This presumes that most commercially produced goods in Benin, such as cotton and cashew nuts are exported. Ideally, trade in services, especially tourism, is also important but an international classification of services exports is not available. 55 A common measure of diversification is the Herfindahl Index (HI), which simply computes the sum of squared shares of the variable in question, in this case export shares. The Herfindahl Index ranges from 0 to 1, where 1 means extremely concentrated (only 1 product is exported) and close to 0 very diversified. 56 The first set of fast growers in East Asia are : Hong Kong, Singapore, South Korea and Taiwan. The set of Second East Asian countries includes Malaysia, Indonesia and Thailand.

84
China are outliers as their economies were well diversified even in the early 1980s. China’s large domestic market facilitated economic diversification. Excluding these outliers, most developing countries benefited from diversification. Empirically too, lower HI levels are associated with higher per capita income levels (Imbs and Wacziarg, 2003).57
Figure 3.3: The Levels of Export Concentration (Measured with the Herfindahl Index) Continue to be High in SSA’s Leading Cotton Exporters
0
0.1
0.2
0.3
0.4
0.5
0.6
0.7
0.8
0.9
1
Her
find
ahl I
ndex
Level of Export Concentration in SSA 's cotton exporters
Benin Burkina FasoChad Mali
3.16 Shifts in the HI of Benin and other SSA cotton exporters in the last 16 years confirm that diversification, however small, has conferred income gains although cotton exporters such as Uganda, Tanzania, and Togo, Benin, Burkina Faso and Mali continue to have very high HI levels (figure 3.4). Will similar marginal declines on the HI lead Benin closer to an emerging market economy? In the next section we contend that while desirable, a declining HI is an insufficient indicator of how much an individual country can potentially gain from further diversification. What it exports is a superior metric for this purpose.
3.17 It is useful to look outside of Africa to appreciate that a key reason for poverty in Benin and in other countries in Sub-Saharan Africa is their failure to diversify. In comparison to low income countries in Asia or the Caribbean, Sub-Saharan Africa is not uniquely disadvantaged. Pakistan, Vietnam, and Sri Lanka are examples of agricultural exporters that had relatively concentrated export baskets but were successful in diversifying their exports. That export diversification is not beyond Benin’s reach is
57 Imbs and Wacziarg (2003) showed a U-shaped relationship between domestic sectoral concentration (measured with the HI using labor data) and per capita income across countries. A similar relationship emerges when domestic sectoral concentration data is replaced with export concentration.

85
gradually becoming clear closer to home in Uganda and Tanzania that have benefited from non-trivial increases in per capita income for starting to diversify away from coffee and cotton.
Figure 3.4: The Relationship between Diversification and Economic Development is not straightforward
3.18 While most economists agree that Benin needs to diversify its exports to grow faster, there is no consensus on the type of products that can facilitate the process. Over the past five decades, development economists have grappled with different ways of showing that commodity exports have non-trivial implications for the exporter’s income levels, particularly in Sub-Saharan Africa. In addition to Imbs and Wacziarg (2003), there are at least 5 hypotheses at different levels of product disaggregation.
3.19 It is often argued that dependence on natural resource-based exports is not conducive to development. In the 1960s, Prebisch and Singer58 argued that the overwhelming dominance of a natural resource such as cotton was a curse for developing countries as it hindered technological change and thwarted export growth. Sachs and Warner (1995) found support for this hypothesis.
Collier, (1998, 2002, 2006), Collier and Gunning, 1999; Wood and Mayer, (1998) Habiyaremye and Ziesemer( 2006 (Eifert, Gelb and Ramachandran, 2005) analyze the reasons for Africa’s failure to emulate the Asian example of manufacturing export-led growth.
58 In their natural resource hypothesis in the 1960s, Prebisch and Singer predicted that declining terms of trade for natural resource-based products would be the bane of future economic development. The main reason for this was that natural resource-based products are not very amenable to technological progress and are vulnerable to terms of trade shocks which dampen income growth.
BEN
BFATGO
UGA
MLI
TZA
BEN
TGOTZA
UGAMLI
BFA
SSAnoZAFnoSmallstateSSAnoZAFnoSmallstateSSAnoZAFnoSmallstateSSAnoZAFnoSmallstateSSAnoZAFnoSmallstateSSAnoZAFnoSmallstateSSAnoZAFnoSmallstateSSAnoZAFnoSmallstateSSAnoZAFnoSmallstateSSAnoZAFnoSmallstateSSAnoZAFnoSmallstateSSAnoZAFnoSmallstateSSAnoZAFnoSmallstateSSAnoZAFnoSmallstateSSAnoZAFnoSmallstateSSAnoZAFnoSmallstateSSAnoZAFnoSmallstateSSAnoZAFnoSmallstateSSAnoZAFnoSmallstateSSAnoZAFnoSmallstateSSAnoZAFnoSmallstateSSAnoZAFnoSmallstateSSAnoZAFnoSmallstateSSAnoZAFnoSmallstateSSAnoZAFnoSmallstateSSAnoZAFnoSmallstateSSAnoZAFnoSmallstateSSAnoZAFnoSmallstateSSAnoZAFnoSmallstateSSAnoZAFnoSmallstateSSAnoZAFnoSmallstateSSAnoZAFnoSmallstateSSAnoZAFnoSmallstateSSAnoZAFnoSmallstate
SSAnoZAFnoSmallstateSSAnoZAFnoSmallstateSSAnoZAFnoSmallstateSSAnoZAFnoSmallstateSSAnoZAFnoSmallstateSSAnoZAFnoSmallstateSSAnoZAFnoSmallstateSSAnoZAFnoSmallstateSSAnoZAFnoSmallstateSSAnoZAFnoSmallstateSSAnoZAFnoSmallstateSSAnoZAFnoSmallstateSSAnoZAFnoSmallstateSSAnoZAFnoSmallstateSSAnoZAFnoSmallstateSSAnoZAFnoSmallstateSSAnoZAFnoSmallstateSSAnoZAFnoSmallstateSSAnoZAFnoSmallstateSSAnoZAFnoSmallstateSSAnoZAFnoSmallstateSSAnoZAFnoSmallstateSSAnoZAFnoSmallstateSSAnoZAFnoSmallstateSSAnoZAFnoSmallstateSSAnoZAFnoSmallstateSSAnoZAFnoSmallstateSSAnoZAFnoSmallstateSSAnoZAFnoSmallstateSSAnoZAFnoSmallstateSSAnoZAFnoSmallstate
150
200
250
300
350
GD
P p
er c
apita
, in
cons
tant
US$2
000
0 .2 .4 .6Herfindahl Index
2001-2005 1991-1995SSA 2001-2005 SSA 1991-1995
Diversification and development in SSA cotton exporters

86
Figure 3.5: Between 1990-95 and 2000-04, most Regions Diversified from Primary or Natural Resource-based Exports towards Low, Medium or High Tech Manufactures – SSA without South
Africa was an Exception
3.20 Lall (2005) classifies goods into into low, medium and hi tech manufactures (LT, MT, and HT) natural resource-based (RB) and primary products (PP) The implication of Lall’s approach is also discouraging and suggests that for exporters of PP or RB-based products such as Benin, manufactured exports are the only route to economic development.
Figure 3.6: Bangladesh and Vietnam are Far more Diversified and Export more Sophisticated Products Compared to most SSA Exporters Including Benin
0 .2 .4 .6 .8 1
TCD
BFA
BEN
TGO
MLI
VNM
BGD
Export composition( 1990-95)
PP RB LT MT HT
0 .2 .4 .6 .8 1
TCD
BFA
BEN
TGO
MLI
VNM
BGD
Export composition (2001-05)
PP RB LT MT HT
3.21 This emphasis on manufacturing is misplaced and inappropriate for Africa. The distinction between manufactures and non-manufactures or primary and non-primary products is also too aggregated and deflects attention from income-enhancing export possibilities in agriculture that may be reachable in the short term. India’s success in penetrating the global market with tables grapes, shrimp, flowers, Vietnam’s with chilled and prepared crustaceans and fish fillet, Uganda, Tanzania and Kenya’s with fish, fruits
0.2
.4.6
.81
First_EA OECD SA LAC SSAnoZAF
First EA: HKG, TWN, KOR and SGP
Tech categories, 1990-95
HT MT LT RB PP
0.2
.4.6
.81
First_EA OECD SA LAC SSAnoZAF
First EA: HKG, TWN, KOR and SGP
Tech categories 2000-04
HT MT LT RB PP
Regional export Composition

87
and flowers are cases in point. Lederman and Maloney (2006) show that cotton or other natural resource products need not be a curse for a country and Benin is no exception. Cotton can be what its exporters want it to be. This implies that the probability that some cotton producers can transform into exporters of sophisticated cotton and non-cotton products is not too different from those cotton exporters who could not graduate from unprocessed cotton exports to either processed or non-cotton ones. In fact, as noted earlier, this phenomenon is reflected in the diversification experiences of cotton exporters outside Sub-Saharan Africa.
3.22 Leamer’s classification of products into 10 sectors based59 on their relative factor intensities is another important step forward in indirectly relating a product to the income level of its exporters. According to this classification, richer countries export more capital intensive products. Unfortunately, from Benin’s perspective, Leamer’s classification is still too aggregated. As an example, unprocessed cotton does not fall explicitly into any of the 10 categories. Within-sector diversification is difficult to analyze when in fact, it may offer the greatest opportunities for income-enhancing export diversification in Benin.
GROWTH OPPORTUNITIES THROUGH AGRICULTURAL AND NATURAL RESOURCE-BASED DIVERSIFICATION
3.23 The methodology proposed here overcomes some of the limitations of the previous studies and is based on the assumption that products of higher quality and sophistication are exported from advanced economies with higher GDP per capita, and that low-quality products are exported from less developed economies with lower GDP per capita. Hausmann, Hwang and Rodrik (2007), hereafter HHR, construct a measure called PRODY, which is by far the most precise.60 This section summarizes the method with more details in Appendix 3. For low income countries like Benin, it allows a closer scrutiny of diversification possibilities within the agricultural sector. Without directly assigning a numeric income value to a product, the HK methodology uses the relationship between products to test hypotheses related with how difficult it is for a low income country to diversify into a higher income product. As the HHR and HK methodologies are more appropriate for our purpose, in the next two sections in particular, we use each to explore the scope for export diversification in Benin.
59 Leamer categories : Petroleum, Raw Materials, Forest Products, Tropical Agriculture, Animal Products, Cereals., Labor Intensive, Capital Intensive, Machinery, Chemical. 60 This measure is related with to the sophsitication measure of Kwan (2002) and Lall, Weiss and Zhang (2005).

88
Figure 3.7: The PRODY of Primary and Natural Resource-Based Products can also be High
3.24 Since the ultimate objective is income-enhancing export diversification, HHR’s concept of PRODY is apt for ranking such agricultural products. PRODY directly links a product to the per capita income levels of its exporters. Seemingly, in addition to exporting more cotton, Benin may be able to export other high PRODY agricultural products to grow even faster.
3.25 The PRODY of a product is the sum of the revealed comparative advantage (RCA61) of each country which exports the product weighted by its per capita GDP (Annex 1). The PRODY of quality cotton fabrics is high because high income countries such as the U.S., Japan, Italy and Germany export it and it comprises a significantly larger share of the exports of these countries compared to low income countries. Similarly, the PRODY of unprocessed cotton is low because many low income countries such as Uganda, Benin, Burkina Faso export it and it also comprises a relatively large share of their total exports. For similar reasons, the PRODY of fishery products or fruits or wood products is quite high relative to some low tech products. It is important to note that as the PRODY of a product is identical for all countries, it implies that for catch up with middle income countries, Benin would gain from exporting some higher PRODY products which they also export.62
3.26 An attractive feature of HHR’s PRODY concept is that manufactured products are not a prerequisite for growth in Benin, at least not in the short to medium term. The PRODYs of agricultural products are not necessarily lower than
61 Benin would have a RCA in cotton if the share of cotton in Benin’s total exports is larger than the world export share of cotton in total world exports. 62 In this sense, the concept of PRODY is close to that of Lall’s technology classification which also shows that high and middle income countries export a larger proportion of low, medium and high tech products, as well as to the diversification literature for Sub-Saharan Africa which argues that manufactured products are the pathway out of a low growth equilibrium in Benin (Wood and Mayer (1998), Mayer (2003), and Habiyaremye and Ziesemer (2006)).
0
5
10
15
20
25
Ele
ctro
nic
mic
roci
rcui
tsIn
tern
alco
mbu
stio
nW
ood
and
resi
n ba
sed
Tel
evis
ion
rece
iver
s,A
rtic
les
ofle
athe
rK
nitte
d/cr
och.
Fab
ricF
ish,
pre
pare
dor
pre
serv
edP
rintin
g an
dw
rittin
g pa
per
Bac
on, h
am &
othe
r dr
ied
Pot
atoe
s, fr
esh
or c
hille
dC
otto
n, n
orco
rded
Ses
ame
seed
s
Oth
er C
itrus
Fru
it, fr
esh
orF
ruit,
fres
h or
drie
d
Milk
and
cre
am
Oliv
e O
il
Ref
ined
Sug
ars
Mai
ze(c
orn)
,unm
illed
PR
OD
Y (
'000
)
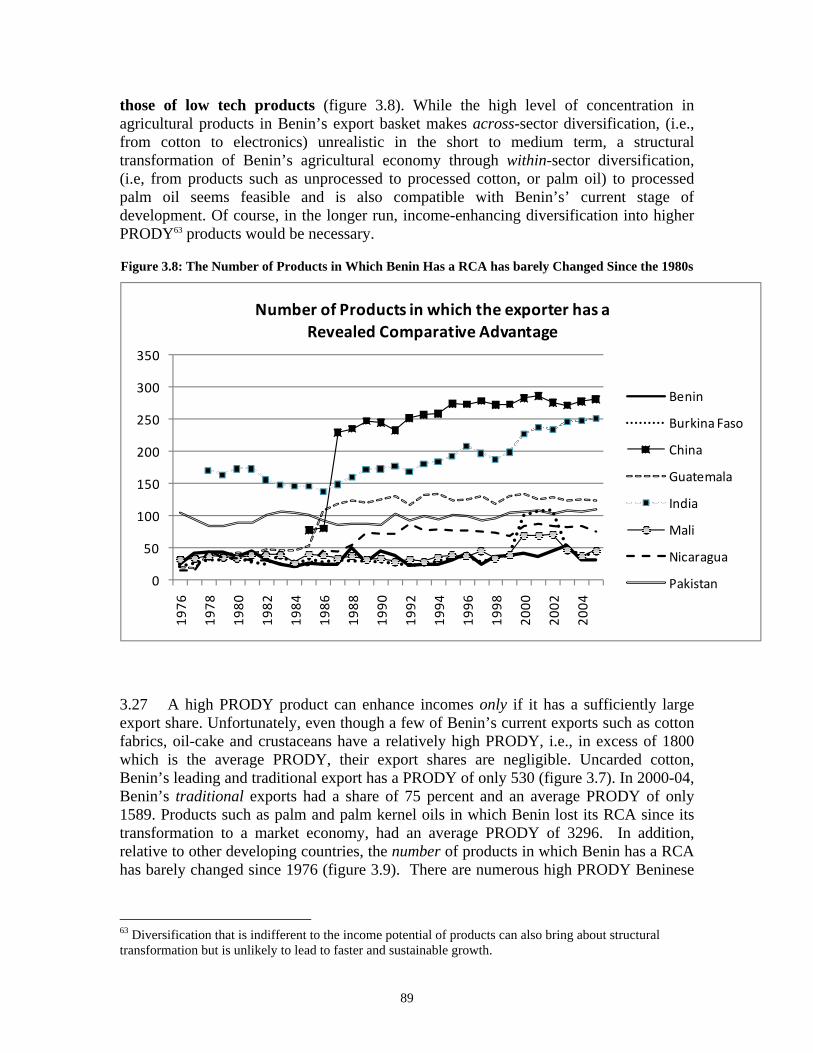
89
those of low tech products (figure 3.8). While the high level of concentration in agricultural products in Benin’s export basket makes across-sector diversification, (i.e., from cotton to electronics) unrealistic in the short to medium term, a structural transformation of Benin’s agricultural economy through within-sector diversification, (i.e, from products such as unprocessed to processed cotton, or palm oil) to processed palm oil seems feasible and is also compatible with Benin’s’ current stage of development. Of course, in the longer run, income-enhancing diversification into higher PRODY63 products would be necessary.
Figure 3.8: The Number of Products in Which Benin Has a RCA has barely Changed Since the 1980s
0
50
100
150
200
250
300
350
1976
1978
1980
1982
1984
1986
1988
1990
1992
1994
1996
1998
2000
2002
2004
Number of Products in which the exporter has a
Revealed Comparative Advantage
Benin
Burkina Faso
China
Guatemala
India
Mali
Nicaragua
Pakistan
3.27 A high PRODY product can enhance incomes only if it has a sufficiently large export share. Unfortunately, even though a few of Benin’s current exports such as cotton fabrics, oil-cake and crustaceans have a relatively high PRODY, i.e., in excess of 1800 which is the average PRODY, their export shares are negligible. Uncarded cotton, Benin’s leading and traditional export has a PRODY of only 530 (figure 3.7). In 2000-04, Benin’s traditional exports had a share of 75 percent and an average PRODY of only 1589. Products such as palm and palm kernel oils in which Benin lost its RCA since its transformation to a market economy, had an average PRODY of 3296. In addition, relative to other developing countries, the number of products in which Benin has a RCA has barely changed since 1976 (figure 3.9). There are numerous high PRODY Beninese
63 Diversification that is indifferent to the income potential of products can also bring about structural transformation but is unlikely to lead to faster and sustainable growth.

90
exports in which the country does not have a comparative advantage. Their PRODYs are listed in text tables 1a – 1d.
Figure 3.9: EXPY Trends in Benin and its Regional and International Comparators
0
2000
4000
6000
8000
10000
12000
EXPY trends in Benin and its regional and international comparators
LAC Benin SSAnoZAF China First_EA
OECD Malaysia Vietnam Bangladesh
3.28 The notional income level of a country’s total exports can be measured by EXPY, which is the weighted sum of the PRODYs of all products that it exports. EXPY links the total value of the export basket of a country to its income level. The weights are the export value shares of the products.64
3.29 Between the mid-1970s and 2004, progress in transforming the export basket into higher PRODY products in Benin and its SSA comparators was lackluster. Benin’s EXPY was $1,627 in 2005 and about the same as in 1980 (figure 3.9). It is consistent with the negligible change in its income level and is explained by the large share (60 percent) of low PRODY cotton. Several other non-SSA cotton exporters diversified impressively from low PRODY products between the 1980s and 2002. In particular, Bangladesh and China, both exporters of low PRODY exports made impressive progress during these two decades. Even Vietnam, another commodity (coffee) exporter, made impressive progress (table 3.2).
64 HHR (2006) demonstrate that in general, there is a strong and positive correlation between EXPY (denominated in dollar values - US $2,000 constant or PPP) and the exporter’s per capita GDP.

91
Table 3.2: PRODY’s for Exports of Selected Countries
Period 1985-1990
% total
exports PRODY Period 2001-2005
% total
exports PRO
Benin
Cotton (other than linters),not
carded 49.3% 530 Benin
Cotton (other than linters),not
carded 58.8%
Cocoa beans,whole or broken 20.4% 582 Edible nuts 9.8%
Cotton seeds 5.9% 945
Sawlogs and veneer logs,of non
coniferous 3.1%
Coffee,whether or not roasted 5.8% 637 Oil-cake & other residues 2.2%Diamonds,unwork.cut/otherwis
e work. 4.2% 3088 Cigarettes 2.0%
Burkina Faso
Cotton (other than linters),not
carded 38.7% 530 Burkina Faso
Cotton (other than linters),not
carded 58.7%
Gold,non-monetary 31.4% 3009 Sugars,beet and cane,raw,solid 4.3%
Other fresh or chilled
vegetables 6.6% 3514 Sesame (sesamum)seeds 4.1%
Goat & kid skins,raw 4.3% 1168 Cigarettes 3.7%
Sheep & lamb skins with wool 3.2% 3578 Sheep and lamb skin leather 1.9%
Bangladesh Crustaceans and molluscs,fresh 12.5% 1856 Bangladesh Jerseys,pull-overs,twinsets,cardiga 16.9%
Shirts,men's,of textile fabrics 11.1% 2019 Under garments,knitted of cotton 15.7%
Fabrics,woven,of jute 10.5% 683
Other outer garments of textile
fabrics 11.2%
Jute & other textile bast fibres 6.5% 426
Trousers,breeches etc.of textile
fabrics 10.6%Other outer garments of textile
fabrics 6.5% 2426 Shirts,men's,of textile fabrics 9.0%
China Petrol.oils & crude oils 9.6% 5261 China Peripheral units,incl.control & ada 4.5%
Other outer garments &
clothing,knitted 4.2% 3158 Parts of and accessories suitable for 3.8%
Other parts & accessories of
motor 3.2% 12538 Footwear 3.0%
Cotton (other than linters),not
carded 2.8% 530 Parts of apparatus of division 76-- 2.9%
Fabrics,woven,of silk,of noil 2.4% 5735
Complete digital data processing
mach. 2.6%
Ghana
Cocoa beans,whole or
broken,raw 39.5% 582 Ghana Cocoa beans,whole or broken,raw 41.5%
Aluminium and aluminium
alloys,unwrought 21.0% 9833
Wood of non-coniferous
species,sawn 7.2%
Diamonds,unwork.cut/otherwis
e work. 7.5% 3088
Aluminium and aluminium
alloys,unwrought 6.4%
Wood of non-coniferous
species,sawn 6.2% 1674 Cocoa butter and cocoa paste 5.4%
Cocoa butter and cocoa paste 5.4% 1418 Fish,prepared or preserved,n.e.s. 4.9%
Nigeria Petrol.oils & crude oils 93.4% 5261 Nigeria Petrol.oils & crude oils obt.from b 88.7%
Cocoa beans,whole or
broken,raw 1.9% 582 Petroleum gases 5.7%
Fuel oils,n.e.s. 1.0% 5761 Cocoa beans,whole or broken,raw 1.6%
Natural rubber latex; nat.rubber 0.6% 910 Fuel oils,n.e.s. 0.5%
Cocoa butter and cocoa paste 0.3% 1418 Leather of other hides or skins 0.4%
Vietnam Crustaceans and molluscs,fresh 33.4% 1856 Vietnam Petrol.oils & crude oils 18.6%
Petrol.oils & crude oils 16.2% 5261 Footwear 18.1%
Rice semi-milled or wholly
milled 4.9% 2601 Crustaceans and molluscs,fresh 5.3%
Plants,seeds,fruit used in
perfumery 4.5% 1544
Other outer garments of textile
fabrics 3.1%
Coffee,whether or not roasted 4.1% 637 Other furniture and parts 3.1%

92
3.30 For rapid growth, every product exported by Benin need not be high PRODY, nor must it be a manufactured good. In most experiences of rapid export-driven economic growth, competitiveness in a few high PRODY natural resource-based products was sufficient to trigger leapfrogging but persistence was necessary for sustained growth. As an example, while Malaysia continues to export palm oil, rubber and oil products, to leapfrog to a middle income status, it developed the capability to export some medium tech, higher PRODY electronics and scale them up. Brazil’s leading exports remain soy beans, oil cake and iron ore, but it also developed the capability to export high PRODY passenger cars and aircraft parts. The leap in China’s EXPY is an example of a country whose leading exports virtually transformed the economy in a period of less than 25 years.
THE PRODUCT SPACE METHODOLOGY
3.31 What are Benin’s high-PRODY export options? Would it be easier to diversify into some in the short term? In this section, we have combined the concept of PRODY with Hausmann and Klinger’s product space methodology in a framework that allows us to explore the scope for across and within sector income-enhancing export diversification in Benin (see Annex 1 for a technical discussion).
Figure 3.10: Modified Illustration of the Product Space
3.32 Hausmann and Klinger construct a product space of possibilities for export diversification by mapping all products that countries export onto a set or products they call a product space or forest. At the SITC2 – 4 digit level of disaggregation, this forest has about 800 products or trees, and in Hausmann and Klinger’s terminology, each tree in the forest is occupied by the firms (countries) (figure 3.10).

93
Income-enhancing diversification occurs when the firms (countries) jump to fruitier trees. In practice this entails re-allocating the resources from the production of products they currently produce towards those required by fruitier trees relatively close by. Exporting new products is neither smooth nor automatic. It requires jumps but if the jumps are too long, the firms (countries) may not reach the fruitier trees. Hence, being in a dense part of the forest such as its core is advantageous for catch up as the firms (countries) are able to jump more easily and more rapidly than the firms (countries) on trees that are in a sparse part of the forest.
3.33 The distance between two trees depends upon the relatedness or similarity in the inputs, no matter how imperfect, needed to produce both products. Inputs include endowments, technological capabilities, and institutions that a country needs to export a product. As an example, a country that has the economic environment to produce fruits is more likely to produce vegetables than countries that produce cotton. The distance between fruits and vegetables will be shorter or the proximity greater than that between fruits and cotton. The concept of distance or proximity between products is not an arbitrary number. It uses the wealth of information available from actual trade data for all countries and is rigorous in the sense that any one country’s export mix is unlikely to make a significant difference to its value (Annex 1). More formally, the proximity between two trees is measured by the conditional probability that exporters that have a revealed comparative advantage (RCA) in product X also have a revealed comparative advantage in product Y. If a country’s RCA in a product lies between 0 and 1, Hausmann and Klinger assign it a value of 0; if it is larger than 1, it is assigned a value of 1. In our discussion, if a country has a RCA of 1, it is assumed to have a RCA in that product.
3.34 In their visual network representation of the 800x800 matrix, the unevenly forested product space displays a core comprised of metals, machinery and chemicals tree clusters occupied by high income countries. In contrast, closer to the periphery are clusters of trees such as garments, animal products, cereals, coffee and cocoa trees that are typically occupied by low income countries (Barabasi et al, 2006). It is important to note that the distances between trees or products are the same for all countries. It is no surprise that the trees at the core are higher PRODY. As Benin presently occupies low PRODY trees, it is at the periphery and its challenge is to jump from cotton and other traditional export trees towards the core.
3.35 Which high PRODY trees Benin can jump to from its present location will depend on its capability and the inputs required to produce that product. Hausmann and Klinger call this capability or ease of diversification density. Hausmann and Klinger use the concept of distance to calculate density. For each product, density measures how close one specific product is to the country’s current exports by considering all pair wise distances from that product to the other products exported by the country. It varies from 0 to 1. A high density value for cotton in Benin, for example, indicates that Beninese exporters occupy many nearby trees so that they are more likely to export cotton. In other words, a higher density in a product makes it easy to jump to and develop a RCA in that product. Density basically measures the ease with which the current capabilities in the economy can be adapted to a new product. Unlike other product space concepts, density is both a product and country specific concept. Two countries are likely to have similar

94
densities for a product if their capabilities are approximately similar, which implies that there is similarity between their exports. As Benin and Burkina Faso export similar products, their densities in related products are likely to be similar.
3.36 To transform itself into an emerging market country, Benin needs to jump to trees with higher PRODYs and in which it also has a relatively high density. In our framework, in addition to difficulty, we extend the notion of density to apply to the time it may take for a country to learn or apply its present capabilities to produce another product. In this sense, we assume that higher densities imply that the country can diversify into the product relatively easily and in the short term while lower ones imply longer learning and planning horizons. In the case of Benin for instance, its inability to diversify out of cotton even after 15 years of reform indicates that catch-up with richer countries requires finding ways to reach higher-PRODY trees. We can reasonably assume that if its densities for such products are low, it will need to make longer term investments in the factors necessary to produce those products.
HOW FAR IS THE NEXT TREE AND HOW MANY ARE THERE?
3.37 How many trees are within reach of Beninese exporters? And, which ones are easier to reach? We explore these questions by looking at the 1990s, to confirm whether the products that were predicted by our framework are indeed Beninese exports today. As diversification from one tree to another entails jumps, how far the neighboring trees are65 would depend upon distances between products. The matrix of proximity (distances) between products exported by all countries is useful for ascertaining whether products in which a country has a RCA today are indeed prudent choices for tomorrow, whether it is likely to develop an RCA in them tomorrow.
3.38 The analysis classifies products into four categories: Classics, Emerging Champions, Disappearances, and Marginals, based on the time path of RCA between 1980-84 and 2001-05. 66 Classics are goods in which Benin has a longstanding comparative advantage. Emerging Champions are promising new products in which Benin acquired a RCA only in the 1990s. Disappearances are products formerly but no longer exported. Marginals are products in which Benin never had a revealed comparative advantage.
3.39 The illustrations show that the matrix of proximities approximates very well the location of products that Benin can diversify into (figure 3.11 a – c). Readers will note that there are several possibilities around each of the three products selected to illustrate this point. Some are already being produced, others are potential products. Which ones Beninese exporters can diversify into will depend on Benin’s density in those products.
65 The distances’ matrix is based on the conditional probabilities that countries that have a RCA in one product also have it in the other. It mimics the similarity in any two products (and hence the inputs) exported by all countries with a RCA in both products. It is the formalization of the intuitive idea that the ability of a country to produce a product depends on its ability to produce other products. 66 These periods were chosen to allow for a large period of time to see some changes in export patterns. However, similar results were obtained when considering the 1985-89 period and the 2000-04 period.

95
3.40 The proximity to the closest product is 1, i.e., the product itself. As an example, consider the location of vacant trees in the neighborhood of three traditional Beninese exports - fresh crustaceans, uncarded cotton, and cotton seeds. Figure 3.11a illustrates that in the vicinity of Fresh Crustaceans and Cotton seed, there are numerous equidistant trees and Beninese exporters were able to jump and occupy several of them. Around the ‘fresh crustaceans’ tree, the products within easy reach are live animals, fresh and dried fruits, and cement. Beninese exporters were also able to jump to these trees. Several vacant or unoccupied trees within approximately the same distance – fish frozen, dried and salted, fillet, fish preserves, and some cotton garments signal the potential for future jumps.
3.41 Exporters of uncarded cotton are in a relatively sparse part of the forest space since the closest product to it is ‘cotton waste not carded or combed’ at proximity of 0.52 (figure 3.11b). This may explain why many cotton exporters find it difficult to diversify. Several traditional (yellow bars) and new Beninese exports (red bars) are in the neighborhood of trees closest to cotton (other than linters). Edible nuts, cotton fabrics, fruits fresh or dried and leather and other animal skins are a few examples of successful jumps.
3.42 Around the ‘Cotton Seeds’ tree, the nearest trees that are already occupied are oilcake, carded cotton and hides and skins. Within the same distance, there are unoccupied groundnuts, clay and other refractory minerals, animal products, tobacco trees. Interestingly, Beninese exporters have also jumped to cotton seed oil and cotton waste trees which are significantly farther away from the Classic Cotton Seed tree (figure 3.11c).
3.43 Readers may wish to note that the existence of several trees around a product presently exported by Benin does not imply that it can diversify into all. Its densities which represent it ability to adapt its current resources and capabilities to produce the potential products will play an important role in determining the scope of diversification. Consider the example of tea in figures 3.11b and 3.11c. Its presence in the vicinity of cotton does not mean that Benin can start exporting tea. In fact, as we know, it does not have the natural conditions to do so. However, this also does not mean that tea is an anomaly. It indicates that some cotton exporters such as India, China, Nigeria and Uganda also export tea.

96
Figure 3.11a – c: From Classic Trees, Beninese Exporters Jumped to Several Emerging Champions with a Decade Future Options Include Several other Unoccupied Trees with Higher PRODYs
0
0.1
0.2
0.3
0.4
0.5
0.6
0.7
0.8
Distance of Classic: Fresh crustaceans
0
0.1
0.2
0.3
0.4
0.5
0.6
Distance of classic: Cotton other than linters
DisappearancesChampionsClassics
00.050.1
0.150.2
0.250.3
0.350.4
0.450.5
Distance of classic: Cotton seeds

97
BENIN’S EXPORT POTENTIAL
3.44 A combination of the concept of PRODY and densities is useful in exploring what is an income-enhancing export diversification strategy for Benin. Some clusters such as those of coffee, cocoa,67 and cotton are relatively far from the core of the product space that contains mostly manufactures. Unprocessed cotton exports with a PRODY of only 530 locate Benin far from most other products but fish or wood products would take it closer to related natural resource based products such as other types of fish, fruits and vegetable, and wood products which, in turn, would take it even closer to wood manufactures. To diversify and increase its EXPY of 1627 in 2005, Benin would want to leapfrog from a sparse to a dense part of the forest and from low to higher PRODY products.
3.45 In a simple matrix framework, we have organized Beninese exports by their RCA in 1980-84 and 2001-05.6869 Their relative export values for the key export categories are presented in Table 3.3.
Table 3.3: RCA of Benin’s Exports by Categories
1980-84 2000-04Total exports ( in US$'000) 50423.1 299927.52
Export value of Champions 1095.58 48085
Export value of Classics 14044 199720.91
Export value of Disappearances 29121.9 1143.62
3.46 Table 3.4 presents some of the key components of each category. Appendix 4 presents a fuller sample matrix of Beninese exports and displays the PRODY, density, values and shares of the product as well as growth in export values included in this information set. For ease of presentation, each quadrant of the export product matrix is presented separately.
67 Cocoa bean is an example of a product in the sparse area of the forest from where it is not easy for firms to move to too many high PRODY products. 68 These periods were chosen to allow for a large period of time to see some changes in export patterns. However, similar results were obtained when considering the 1985-89 period and the 2000-04 period. 69 A champion is defined as a product in which the country has a comparative advantage at present but did not have a comparative advantage before. We define comparative advantage in the past as having an RCA=1 in at least 3 years during the 1980-84 period. Current comparative advantage is defined as having an RCA=1 in at least 3 years between 2000 and 2004. Some exceptions are considered and they are detailed in the product matrix.

98
Table 3.4: Sample Matrix of Benin Exports Organized by RCA in 1980-04 and 2001-05
(a) The Classics (b) Disappearances
RCA_'80-84 =1 RCA_'01-05 = 1
Ease of diversificatio
n (density) PRODY RCA_'80-84 =1 RCA_'01-05 = 0
Ease of diversification (density)
PRODY
Cotton uncarded Palm oil Cotton seeds Palm kernel oil Edible nuts (DTIS,PSO) Cocoa Oil seeds (DTIS) etc Goat and kid skins
(d) The Marginals (c) Emerging champions!
RCA_'80-84 =0 RCA_'01-05 = 0
Ease of diversificatio
n (density) PRODY RCA_'80-84 =0 RCA_'01-05 = 1
Ease of diversificat
ion (density)
PRODY
Paper Fruit (DTIS,PSO)
Bulbs, tubers (PSO) Palm nuts
Fish frozen Palm kernel Rice (PSO) Saw logs
Furniture etc. Leather etc.
3.47 Classics. In the early 1980s, Benin had a RCA in 21 products but by the end of the period, there were only 7 products in which Benin had maintained a comparative advantage. During this period, the share of uncarded cotton increased from 18 to about 60 percent and the share of the classics to about 75 percent of total exports. Today, on average, the classics have a lower PRODY (1089) relative to the average PRODY of 1607. The low PRODY of uncarded cotton (530) and cotton seed (945) suggest that ceteris paribus, the contribution of these two products to Benin’s growth in the past 25 years was lower than what it would have been if it exported higher PRODY products such as palm kernel or vegetable oil or combed cotton. This is not to say that cotton exports are not desirable for Benin. It simply implies that ceteris paribus, the low value added to unprocessed cotton generates less national income than some other raw or processed products. The Classics raise two issues. Why is it that uncarded cotton and cotton seed that are indigenous to Benin survived while other indigenous products such as cocoa disappeared completely by 2000-04? And, if the scaling up of nascent classics has not transpired in 15 years since the transition to a market economy, how realistic is it to expect it to happen in the next 15 years?
3.48 Disappearances: In 1980-84, Benin had an RCA of 1 in a set of products that accounted for over 60 percent of its exports, but by 2001-05, it had lost competitiveness in them (RCA=0) and their export values were infinitesimal. It is curious that indigenous products such as coffee, cocoa, palm oil and palm kernel oils with shares similar to uncarded cotton’s (18 percent) disappeared while the latter became Benin’s leading export in the 2000-05. Perhaps the socialist regime had simply propped up products such

99
as fabrics, sheep and lambskins, goat and kid skins. Even so, the conundrum at this time is their lingering presence in the form of related products - either emerging champions or marginals - which have surfaced in negligible amount in recent years. Benin’s densities in these products are no smaller than in many classics.
3.49 Emerging champions are the most promising set of Beninese exports in which the country acquired a RCA = 1 only in the 1990s. They are also distinct from pure export discoveries which are many but in which Benin does not yet have a RCA. Trends in the RCA of Benin’s emerging champions illustrate some interesting patterns. Most new products in which Benin has a RCA today emerged in its export basket after the mid-1990s and picked up around 2000. They are small in number and their RCA levels display large variations triggered mainly by volatility in the shares of unprocessed cotton exports. Benin has the highest RCA in cotton waste, leather, cotton seed oil, and palm nuts and palm kernels. Its RCA statistics are the lowest in minerals, Portland cement and wood of non-coniferous species. In spite of their small export values, Benin’s RCA in these products suggests that they are ripe for scaling up, and their rising trends, especially in recent years reinforce this case.
3.50 While their emergence in a fiercely competitive global market is encouraging, the emerging champions are conspicuous by their small number (only 15) and low export values which suggest that something in the economic environment is constraining them from scaling up. Out of a total of 14 products across 7 sectors, only 9 have values of at least $1 million. However, several have a relatively high income potential (PRODY) which makes them attractive candidates for diversification through scaling up. This would be the equivalent of supporting emerging champions as opposed to picking them.
3.51 Within the set of emerging champions, there are four new sectors- wood, animal products, food and chemicals. Within these, Portland cement, soaps in the chemicals sector on the one hand and flours of potatoes and fruits, on the other hand have a high PRODY. The other three products in the wood and animal-products sectors are unprocessed but have the potential for high value-addition in the future. Some of the emerging champions are related with the Classics and reflect the transition to more sophisticated forms. ‘Processed crustaceans’ is a rare high- PRODY Beninese champion that marks the successful transition of the sector from a low-PRODY fresh product (a Classic) to a high-PRODY processed one. Similarly, carded instead of uncarded cotton, cotton seed oil instead of cotton seeds and bleached woven cotton fabrics instead of unbleached ones illustrate the slow but sure shift towards sophisticated export diversification.
3.52 The story of oil palm products that are native to Benin is different. Although palm and palm kernel oil are disappearing products, palm nuts and palm kernels have appeared as emerging champions. Perhaps, they reflect Benin’s traditional comparative advantage in oil palm products even though it only exports less sophisticated palm kernels (not oil) now. One could question why palm oil whose prices have picked in the past year is not classified as a lucrative Emerging Champion. Our finding is based on Benin’s lack of

100
comparative advantage in exporting palm oil during 2000-04. This is not to say that it may not change in the future in favor of palm oil.
3.53 Marginal Exports: Interestingly, Benin has a large number of marginal products in which it has never had a comparative advantage. They comprise a mixed bag – some like fishery and cotton products are export discoveries associated with the classics and in which Benin may eventually develop a competitive advantage. Others products have been lingering in Benin’s export basket and in which it may never be competitive. The list contains high and low PRODY, and agricultural and manufactured products. Some small but very high-PRODY food, cotton and paper products indicate export discoveries whose sophistication levels may be too high for Benin and may not be sustained. Beninese export discoveries are prolific but their appearance in the list of products with a critical minimum value is sparse. In the absence of a systematic pattern, export discoveries can be attributed to serendipity, but to achieve and exceed a critical minimum value would require competitiveness.
3.54 If it has had difficulties in scaling up even lower PRODY Classics or Emerging Champions in the sectors in which it is competitive, efforts to scale up the marginal products could be risky and is discouraged.
3.55 Appendix 5 discusses some of the candidates for diversification in a more qualitative fashion. Table 3.5 presents some of the key constraints in impeding the growth of emerging champions identified above.

101
Table 3.5: Partial Matrix of Possible Key Constraints in High Priority Sub-Sectors
Sub-sector FDI Public research
Standards Certifica-tion
Land Access
Extension services
Electri-city
Out-grower schemes
Organi- zation of farmers
Other
x
x
x
x
Cotton - fiber - products
x x
Need to consider genetically modified varieties
Oilseeds x x x x x
x
x
x Crustaceans
- fresh - processed
x x x
Need to manage fish resources, prevent over-fishing
Fresh fruit x x x x x x x Cold storage
x Cashew
- fresh - shelled x Sufficient
volumes to achieve minimum efficient scale
Cassava x x Rice x x
Nigerian import bans must be lifted
x
x
x
x
x
x
Oil palm - palm oil - nuts/kernels
Careful management of relations between estates and communities
Sawlogs and veneer
x
x
Other wood products
x
x
Sustainable management of forests; incentives for processing
Leather x Appropriate slaughtering techniques
AN EXPORT DIVERSIFICATION STRATEGY
3.56 Will GoB’s targeted products (PSOs) lead Benin closer to an emerging market? Our framework indicates that GoB’s choice consists of a mixed set of products - six strategic sectors: rice, cashew nut, pineapples, market-gardening, palm oil and maniocs. Not all are high PRODY, i.e., income-enhancing but some are necessary to maintain the present level of exports.
3.57 Cashew nuts are a Classic product and an efficient choice: their export share is 8 percent and if scaled up, they would contribute to more stable growth in the short to medium term. Relative to unprocessed cotton exports which have a PRODY of 530, cashew nuts have a PRODY of 1301, albeit the level is lower than average of 1607 for all Beninese exports.

102
3.58 Pineapples and market gardening (fruits and vegetables) are higher PRODY Emerging Champions, relatively easy to scale up in the short to medium term, and a part of our recommended export diversification strategy. One could contend that scaling up these sectors is constrained by Benin’s weak capacity to impose and comply with the phystosanitary standards of its trading partners, the EU in this case. However, when one considers the example of Uganda, Tanzania or Kenya that also faced teething problems in the early years but were able to overcome them with appropriate public intervention, there is little reason to doubt that regulations to establish these standards would be an impossible task. It is after all a public good that was established with the assistance of external firms in Uganda (case of fish). Facilitating policies that fostered farmers’ ability to comply with standards have been implemented successfully in East Africa.
3.59 In our framework, GoB’s other PSO choices are not efficient because Benin does not have a RCA in them. Palm oil is a Disappearing indigenous product in which Benin is no longer competitive, while rice is a Marginal product in which it has yet to achieve competitiveness. Facilitating exports of either would be a relatively risky strategy.
3.60 The DTIS (2005) has evaluated the constraints facing several products, but stopped short of recommending these products as candidates for promotion. When screened through our framework, not all are income-enhancing. Their categorization is shown in tables 1a – 1d. The efficient ones are nuts (Classics), fruits and crustaceans (fresh are Classics and prepared are Emerging Champions) - Benin is competitive in them and they are high PRODY. Even though several processed fruit products – jams, juices etc. are Marginals, their facilitation would be reasonable as a part of the larger fruits sector in the recommended strategy. Over the longer term, Benin should be able to move into agro-industry and its related light manufactures. Others like peppers/pimento are Disappearing products. Cocoa butter and cocoa paste are low PRODY Marginal products in which Benin is not competitive.
3.61 If the objective is income-enhancing export diversification, policymakers in Benin have at least three strategic options. The first option involves sector-neutral export promotion policies that allow the market forces to drive the export sector. Since 1989, this policy has not automatically fostered a structurally transformed Beninese economy. If the status quo is preserved, the more probable outcome could be minimal progress towards an emerging market economy in the future.
3.62 A second strategy is to abandon sector-neutrality and implement an industrial policy which targets select sectors. Several governments are treading down this path but the risks are enormous and probably exceed those related with a “do nothing” approach. If the preferred sectors are low PRODY and/or Benin does not have a RCA or high density in them, the ex post outcome could be worse than the ex ante. The PSO products marked in yellow in the Marginals list indicate risky products.
3.63 A third approach is to use the matrix framework to illustrate an informed income-enhancing diversification strategy for Benin. The Classics and Emerging Champions comprise the set of income enhancing export possibilities. They are not our specific recommendations for GoB’s intervention. A thorough analysis of factors

103
that constrain these exports is essential to determine their feasibility as candidates for diversification. That analysis is beyond the scope of this paper.
3.64 Through the product space and PRODY concepts we demonstrate that there is more than one path that Benin can tread to transform into ‘an emerging market.’ Through a rigorous analysis of trade data we have shown that contrary to the conclusions in much of the received literature, manufactured exports are not the panacea for all poor agrarian commodity exporters. Our framework can be used to explore at least three options.
• Benin can continue to export cotton and other traditional agricultural exports. To boost export growth, it could improve further the economic environment and use new technologies to raise cotton yields. However, the income potential of this growth path is limited and far from what is required for an emerging market economy.
• Benin can strive to become an exporter of manufactured products but our framework indicates that from its present location, the distance to reach them is long. They are attractive because of their high PRODYs but Benin’s capabilities or densities are too low to jump to manufactured export trees successfully anytime soon, though this would eventually be needed. As an example, compare the trends in Beninese densities in figure 3.7a – c with those of Tanzania and Kenya (figures 3.8a – b). Benin’s densities have barely changed over the longer term and reflect slow learning in contrast to Tanzania and Kenya whose densities have increased steadily and reflect fast improvement in capabilities. Benin would have to strive hard to compete with Tanzania and Kenya. In the short term, efforts to export manufactures are likely to result in wasted resources and lost opportunities.
• Benin can exploit a range of high PRODY agricultural and natural resource-based sectors that are presently small but in which Benin presently has a comparative advantage. This path has several attractive features. It offers a middle ground for a poor agricultural economy to eventually transition to an industrial one by gradually learning to export select, mostly processed and high PRODY agricultural products. Our framework shows that there is a fairly large number of such products. The Emerging Champions such as nuts/food products, oil and products, and crustaceans are good examples and their high densities suggest that they can be scaled up fairly fast. The agro-processing experience would guide Beninese exporters to acquire the capabilities required for diversification into other complex Emerging Champions such as wood, animal products and chemicals. These too are supported by Benin’s natural resource base but are presently infeasible because of its low densities. These are longer term options.
3.65 In a nutshell, the good news is that there are some Emerging Champions in Benin’s set of export possibilities. Some are easier to reach; others will require significant effort but all offer cause for optimism.

104
Table 3.6a – c: Teething Problems – Benin’s Densities in Emerging Champion and Classics are Low and have Risen Sluggishly
Densities of emerging champions
0
0.05
0.1
0.15
0.2
0.25
1980
1981
1982
1983
1984
1985
1986
1987
1988
1989
1990
1991
1992
1993
1994
1995
1996
1997
1998
1999
2000
2001
2002
2003
Animals,live,n.e.s.,incl. zoo-anima Sawlogs and veneer logs,of non coni
Sheep and lamb skin leather Cotton waste (including pulled or g
Cotton seed oil Palm nuts and palm kernels
Wood of non-coniferous species,sawn Leather of other hides or skins
Fertilizers,n.e.s.
Densities of emerging champions
0
0.02
0.04
0.06
0.08
0.1
0.12
0.14
1980
1981
1982
1983
1984
1985
1986
1987
1988
1989
1990
1991
1992
1993
1994
1995
1996
1997
1998
1999
2000
2001
2002
200
Hides and skins,n.e.s waste and use Manufactures of wood for domestic/d
Flours,meals & flakes of potatoes.f Mineral or chemical fertilizers,nit
Crustaceans and molluscs,prepared o Cigarettes
Organic chemicals,n.e.s Fabrics,woven of discontinuous rege
0
0.05
0.1
0.15
0.2
0.25
Density of classics with sum of RCA>=20
Cotton (other than linters),not car Cotton seedsOil-cake & other residues (except d Edible nuts(excl.nuts usedOil seeds and oleaginous fruit. n.e Palm oil

105
Table 3.7a – b: Unlike Benin, Tanzania’s Higher and Rapidly Rising Densities in Many Products have Made Diversification Easier
Densities of selected champions in Tanzania
0
0.05
0.1
0.15
0.2
0.25
0.3
1980
1981
1982
1983
1984
1985
1986
1987
1988
1989
1990
1991
1992
1993
1994
1995
1996
1997
1998
1999
2000
2001
2002
2003
2004
Fish,fresh(live/dead)or chilled,exc Fish,frozen (excluding fillets) Fish fillets,fresh or chilled
Fish fillets,frozen Crustaceans and molluscs,fresh,chil Calf skins,raw (fresh,salted,dried,
Sheep & lamb skins with wool on,raw Sawlogs and veneer logs,of non coni Bulbs,tubers & rhizomes of flowerin
Cut flowers and foliage Palm oil Portland cement,ciment fondu,slag c
Densities of Champions in Cotton sector in Tanzania
0
0.05
0.1
0.15
0.2
0.25
0.3
1980
1981
1982
1983
1984
1985
1986
1987
1988
1989
1990
1991
1992
1993
1994
1995
1996
1997
1998
1999
2000
2001
2002
2003
200
Cotton waste (including pulled or g Cotton,carded or combed Jute & other textile bast fibres,n
Yarn of text.fibres,n.e.s.,incl.yar Cotton fabrics,woven,unbleached,not Fabrics,woven,of discontinuous
Fabrics,woven contain.85% of discon Fabrics,woven,of jute or of other t Sacks and bags,of textile materia
Bed linen,table linen,toilet & kitc Other made-up articles of textile m Under garments,knitted of cotto

106
Densities of selected champions in KENYA
0
0.05
0.1
0.15
0.2
0.25
0.3
1980
1981
1982
1983
1984
1985
1986
1987
1988
1989
1990
1991
1992
1993
1994
1995
1996
1997
1998
1999
2000
2001
2002
2003
20
Fish,frozen (excluding fillets) Fish fillets,fresh or chilled Fish fillets,frozen
Fish,dried,salted or in brine ; smo Crustaceans and molluscs,fresh,chil Fish,prepared or preserved,n.e.
Vegetables,frozen or in temporary p Other sugars;sugar syrups;artificia Sugar confectionery and other su
Bulbs,tubers & rhizomes of flowerin Soya bean oil Palm oil
Fixed vegetable oils,n.e.s Other sheets and plates,of iron or Tubes and pipes,of cast iron
Printed matter,n.e.s.
Densi�es of Champion in Co�on sector in Kenya
0
0.05
0.1
0.15
0.2
0.25
0.3
1980
1981
1982
1983
1984
1985
1986
1987
1988
1989
1990
1991
1992
1993
1994
1995
1996
1997
1998
1999
2000
2001
2002
2003
200
Cotton waste (including pulled or g Cotton,carded or combed Synth.fibres,carded,combed or ot
Cotton yarn Yarn contain.85% by wgt.of synth.fi Yarn of regenerated fibres,put up
Trousers,breeches etc.of textile fa Dresses,women's,of textile fabrics Skirts,women's,of textile fabrics
Blouses of textile fabrics Other outer garments of textile fab Shirts,men's,of textile fabrics
Under garments,excl.shirts,of texti Under garments,women,s,of textile f Jerseys,pull-overs,twinsets,card
Other outer garments & clothing,kni

107
INNOVATION IN BENIN
3.66 Innovation in a small very poor country like Benin should be interpreted in a broad sense not primarily as the creation of new knowledge and technology but also the adaptation of existing products, processes and practices. Innovation policy is challenging insofar as pervasive market failures call for government intervention, but at the same time low government capacity and corruption mean that these interventions are less likely to be successful. In Benin, the environment for innovation is rather unfavorable, as it is in many Sub-Saharan Countries. Benin’s potential for innovation based on the World Bank’s Knowledge Assessment Methodology (KAM) is described in Appendix 6.
Three Examples Illustrate the Potential for Innovation in Benin
3.67 Farine Mickelange is an example of the success of a local firm collaborating with a local university (Faculté des Sciences Agronomiques) to develop a new product based on locally available inputs. Farine mickelange is a mixture of different flours which is treated at the firm so that it can be simply mixed with hot water to make a pleasant tasting hot broth. No extra cooking is necessary to make this product “edible”. It contains yam flour, soy flour, maize and coconut. The product has been certified by the WHO to help combat malnutrition, particularly in the context of HIV infected patients. Farine mickelange is distributed throughout the Beninese territory by local pharmacies and health dispensaries. Interest has been shown to import the product into other countries, and the firm is regularly unable to meet the growing demand at the local and international level. The firm directly employs approximately 20 person (including 6 commercial staff), and around 500 agricultural producers indirectly, through input supply. This case also illustrates the lengthy but rich firm-industry collaboration. The company has been collaborating with the Faculty for over 10 years, which has helped the company perfect the product, as well as given support and advice on quality control.
3.68 An example of practical training initiatives emerging in South Benin comes from the Agouti school-farm, which specifically targets producers that intend to develop grasscutter production. This school farm is specialized in training the producers of the big rodents, known also as Aulacodes or Agoutis locally. The director of the school, a young professional himself, learnt the technique needed to raise grasscutters via a GTZ training project. Through small seed-funding, he was able to start his own farm. Gradually implementing different innovations, he was able to scale up his farm from a few dozen animals to over 5,000. He implemented many different basic or more complex innovations: construction of appropriate breeding grounds; conception and elaboration of different types of low-cost cages; development of adapted feeding systems; as well as new cross-breeding techniques development. In view of growing success, this young entrepreneur also is in the expansion phase for a school attached to his farm which trains, in a very practical manner, professionals and young early school leavers.70
70 Source: WBI Knowledge for Development and Sustainable Development project on Agricultural innovation in Francophone Africa

108
3.69 Mr. Toundé is the son of tobacco and legume producers in the East of the country. He moved to Cotonou when young, for his studies. He finished a first diploma at the University, and was surprised that no color photocopy service was available for students to print the cover pages of their thesis. He therefore started a photocopying business in 1987 in Cotonou, and was the first to import color photocopiers to Benin. As this was a very seasonal job, he looked for other opportunities. He noticed that there were not enough notebooks for local schools. With his experience in photocopying he set up a print shop for school note books, putting a strong accent on quality. His “papillon” brand is indeed the only ISO certified producer of school note books in West Africa. From this it was only a short step to production of paper agendas, which he even exports to the US. Looking for new opportunities, and always relying on a systematic and long market analysis preparation, he launched a Volkswagen concession. Only a short step away from this, he is currently in the process of launching the first private minibus system in Cotonou, which has received the approval of the zemidjan drivers, and is importing approximately 100 minibuses from China. The system he is instituting will give the property of the buses over to the driver after a 5-year lease. Another initiative he is currently launching, after having by chance discovered its existence on a TV show, is the production of NERICA (New rice for Africa). This is a cross-breed of Asian and African rice, which is particularly adapted to the African context as its yields are very high, and it doesn’t require as much water as do traditional strands.
Promoting Diversification and Innovation
3.70 As seen from above, exploiting and expanding the diversification potential of Benin depends primarily of a number of generic policy actions addressing the framework conditions affecting the functioning of the economy: the upgrading of infrastructure (roads), the land policy, the overall business environment, basic education, etc. But there is also a need for a series of measures which concern more directly innovative efforts understood in a broad and extensive sense.
3.71 In this perspective two complementary approaches can be observed: the first consists in exploiting or improving an existing potential (such as pineapples, palm oil, etc.), the other in creating new potential diversification candidates (as seen by the examples given on local swine, agouti, and “mickelange” flour).
3.72 Conceptually, the table below can summarize the two-pronged role of innovation described above. Different strands of policy actions respond to these concerns.

109
Table 3.8: Role of Innovation and Related Policies in the Diversification of the Beninese Economy
Functions Commercialization and management Finance
Technology diffusion and adaptation
RD infrastructure
Education and training
Exploiting / improving the
existing
Financing, banking
Extension services (agriculture)
Metrology, standards, quality control
Creating new potentialities
Support to entrepreneurs, Logistics, packaging, trade, export networks,
Innovation funding agencies
Innovation workshops/ technology transfer offices
Research base (university, INRAB)
Education in various forms
3.73 Building on this framework, the following sections are structured as follows. A first section will briefly discuss key elements of this table from a general viewpoint in Benin. A second section will further detail the agriculture and agro-food innovation systems in view of importance in the economy. And finally a third section will offer some considerations on their “how” to implement recommended actions and reforms.
IMPROVING THE DIVERSIFICATION AND INNOVATION CLIMATE IN BENIN
Support to Entrepreneurs
3.74 In addition to generic measures such as those facilitating enterprise creation (recently reduced to a one month procedure), support to entrepreneurs is the first and primary instrument to facilitate diversification in the economy. Such support is quasi-inexistent in Benin with the marked exception of the artisan and craft sector. Six “bases d’appui” have been built with UNDP’s support and guidance: three in Cotonou, one in Parakou, one in Porto Novo and one in Abomey-Calavi. They offer collective equipment platforms (e.g. for storage), logistics support, mutual saving/credit systems and training (see below). They seem to work relatively well. If confirmed by appropriate evaluation, it would be worthwhile exploring how to replicate such mechanisms in other sectors of the economy.
3.75 The organizational infrastructure that facilitates taking advantage of the globalization process through foreign trade, investment and export commercialization is mediocre in Benin. Several organizations have been created which have difficulties of coordination. This issue will be addressed with the support of the forthcoming World Bank’s Competitiveness and Integrated Growth Project (CIGOP), notably through the creation of the Agency for the Promotion of investment and exports, APIEX71, which will encompass the existing Centre de enterprise formalization, the centre for the promotion of investment, and the centre for trade promotion, as well as the establishment and strengthening of the Secretariat of the President Investor’s Council.
3.76 FDI can play a decisive role for facilitating the exports of products such pineapples, processed cashew nuts, palm oil, etc. In fact foreign firms, often
71 Agence de Promotion des investissements et des exportations

110
subsidiaries of multinationals, will offer the most efficient short cuts for encouraging the creation import of new knowledge and technology as well as its adaptation. A systematic action should be undertaken to attract such foreign investors, removing identified obstacles and providing incentives while respecting the conditions of domestic competition.
3.77 Packaging problems encountered by Beninese firms are considerable. One may wonder whether attracting foreign firms for help in this matter might facilitate a solution. Infrastructure basic investments and government support for the development of an endogenous packaging firm, or at least less import duties on this product to facilitate imports which in turn could boost exports could be interesting to explore.
Financing
3.78 Financing business development is another major issue. The banking system does not respond to demands from entrepreneurs. One segment experienced an encouraging development: microfinance. The system seems to have been destabilized by a populist action proposed by the new administration which consisted in giving 30.000 FCFA to all women on request to launch a new activity72. A more productive approach would be to design microfinance mechanisms to encourage diversification and innovation efforts of a modest nature, but when accumulated, would make a tangible economic impact.
3.79 Microfinance development is often associated with alleviating traditional credit constraints. An interesting strand of microfinance, value chain finance (see box below), could be interesting to explore further (CGAP, 2008), and examine how it could be applied in Benin, at least on a pilot basis.
3.80 Financial and related support of innovation begins to take shape with the proposed establishment of an innovation agency – entitled “Agence Béninoise pour la valorisation de l’innovation”. Initial plans were unclear on the modalities of intervention. Beninese policy makers will find in the experience of high and medium income countries examples of the diversified scope of measures needed for such an agency. The scope of instruments can include in particular incentives to business-university cooperation in various forms; small grants for the development of new projects; placement of researchers in firms, etc. Such support, which is specific to innovation efforts, cannot be provided by more traditional bodies such as development banks and therefore are necessary to facilitate the emergence of innovative projects. Further down the track, when projects are mature enough, they could then be supported by more traditional agencies such as the proposed APIEX. Another important point, neglected in the initial plans of the proposed innovation agency, is the necessity to have local antennas that are close to entrepreneurs and intending
72 Note that a similar destabilization occurred in the 1980s with massive support provided by donors, including the World Bank, to the system of “Tontines”. It used to work well with a modest stimulus of a few million FCFA, but when funding support increased to several billion it disintegrated, due to the major distortions created among potential beneficiaries.
111
innovators. Such antennas should be localized in major towns of the country, with some flexibility of interventions and ability to link quickly with source of expertise.
Technology and Research Infrastructure
3.81 MSTQ (Metrology, Standardization, Testing, Quality) services are quasi inexistent in Benin. The only noticeable structure is CEBENOR. It employs 8 persons. The poor state of Benin’s Metrology, standards and quality control (MSTQ) infrastructure, a vital public infrastructure to support innovative activity, was at the origin of the “voluntary suspension” of shrimp exports to the EU market. Since that time, EU has supported the government in carrying out a detailed action plan aimed at strengthening the MSTQ system. The World Bank’s forthcoming CIGOP project is funding, under its second component, the reinforcement of Benin’s MSTQ. This being said, support on MSTQ is needed throughout the Beninese territory, and should not be only concentrated in Cotonou. Indeed, this vital government support mechanism needs to be close enough to beneficiaries for these to be effective.
3.82 Mechanisms of technology diffusion and adaptation at the interface between the producers and the research/knowledge base used to be relatively well developed in the agriculture sector with a network of extension services — but major budget cuts in the last decade had dilapidated these efforts, before benefiting of a renewed support in recent years with a major plan for agriculture mechanization. Mechanisms of technology diffusion and adaptation are quasi inexistent in most parts of the economy – with the exception of the artisan and craft bases mentioned above.
3.83 The research base in Benin is constituted principally by the Institut National de la Recherche Agricole du Benin, which takes the lion’s share of the R&D effort, and research units of universities (principally of Abomey-Calavi). According to the estimations gathered for this study, the INRAB’s budget for this year amounts to some 800 million of FCFA (of which 600 million FCFA related to the Programme d’Investissement Public). Meanwhile, the budget of the Abomey-Calavi University is around 100 million, and the budget of Parakou’s university of 40 million FCFA. Of these sums the share going to research is unknown, but rather small. The imbalance in budgets affecting the whole research system is clear.
3.84 Moreover in total there are approximately 300 full-time researchers in Benin. The average size of a research unit is of 3 researchers, proof of an extreme fragmentation. Efforts to give more strategic thrusts to the R&D base are nascent. The problems of the R&D system will be further discussed in the next section since it is very largely focused on agriculture and agro-food.
Education and Training
3.85 Overall the education system presents serious weaknesses, as can be witnessed by the high degree of illiteracy among the population including the youth. There are, however, some segments which work relatively well for integrating education and training with economic and social realities. At the tertiary level, some

112
of the success stories evoked above, such as innovations from the University of Abomey-Calavi, are not fruits of chance. They derive from a systematic insertion of students into the local context, including into the poorest communities. Technical and vocational training for apprenticeship is another segment which seems to have functioned relatively well as far as the craft sector is concerned (see box 3.1).
3.86 In terms of education at the tertiary-level, Benin university’s development of pragmatic, operation-oriented diplomas (of note the Health diploma at Université de Parakou and the agronomy diplomas at the Faculté des Sciences Agronomique of the Université d’Abomey-Calavi) are quite remarkable in their integration of on-the-field work (service in local-level dispensaries for the health graduates, 6 months or more work at the village level for future agricultural researchers) and intellectual training. At the university level, this interesting field-based education approach, quite remarkable in the African context, seems to have been taken at the initiative of the universities themselves.
3.87 It would be worthwhile to establish a scheme to further support and expand these outreach efforts of Beninese universities. The scheme may consist in providing subsidies/grants to universities on the condition that an equivalent sum is funded by a partner from the business sector (local firm or foreign one, agriculture producer organization or trade association). Such a scheme, very largely used in developed economies, could be administered by the newly proposed innovation agency (if appropriately funded, staffed and managed).
3.88 The development of the Université de Parakou, established a decade ago, is confronted with serious difficulties mainly due to a lack of resources and the reluctance of the professorial corps to commute regularly from the Université d’Abomey-Calavi, located close to Cotonou, to Parakou located 450km to the North. A solution would be to develop extensive distance-learning curricula in Parakou, twinning it with Abomey-Calavi, using the telecom infrastructure which already exists, in the form of a fiber-optic cable which follows the main road, and which is unused.
3.89 Vocational and technical education and training is primordial, as it conditions the diffusion and proper use of technology. As the majority of the workforce is in the informal sector, professional and vocational training has been particularly well adapted to this situation in Benin, as compared to other Sub-Saharan African countries (see box below as an example). An AFD (2006) study on the information vocational education sector notes a self-organization capacity and pragmatism on the governmental side in their approach to informal sector training, which makes Benin a leader in this field, particularly with regards the handicraft and craftsmanship sectors (plumbing, bricklayers, seamstresses, etc.).

113
Box 3.1: Benin’s Professional Qualification Certificates («Certificats de Qualification Professionnelle – CQP »)
The CQP mainly targets young apprentices over 14 years of age that have completed primary school. They combine training with a skilled tradesman with school training (either in a « Maison des métiers » or a « Maison de l’outil ») managed by the Chamber of Trade and/or a producer or professional organization. The training is carried out over 3 levels of 200 hours each. The apprentice goes to school once a week and remains with the skilled tradesman 5 other days a week. Training lasts 2 to 3 years and is co-managed by the producer or professional organization to which the skilled tradesman belongs to. Following the 3 levels of training, the apprentice sits the national CQP exams that recognize him or her as a skilled worker. What is interesting and original in this training is less the CQP in itself (which is inspired by similar formulas instituted in France) than the original training centered both on competence building and local know-how as well as on the nomenclature of skilled trades. There are currently around 1,500 apprentices in training and the challenge is to train 3,000 apprentices per year with around 20 different CQPs, going from seamstress to air-conditioning. Other CQPs are being elaborated in mechanics or TV/radio repair for example. Several aspects however remain to be strengthened: strategic creation of skilled workers for Benin’s development in value-added or relevant sectors; linkages between training and employment (work done by Swisscontact in this field with microcredit are of note); and durable financing mechanisms including an important implication for the national education budget.
Source: A. Kircheberger(2007) and AFD (2006)
Strengthening the Agriculture and Agro Food Sectors
3.90 The agriculture sector, in view of its importance for the Beninese economy, deserves more detailed comments. One can sketch out as follows the agriculture innovation system in Benin:
Figure 3.12: A Diagram on Benin’s National Agricultural Innovation Infrastructure
Source: Based on World Bank, 2007

114
3.91 Benin’s R&D base in agriculture, the network of higher education (Abomey-Calavi, Parakou) and research institutions (INRAB), is relatively developed. New potential diversification candidates have been nurtured and hatched through, in particular, the work of the public universities, and notably the Agronomy Faculty and the Polytechnic Faculty of the University of Abomey-Calavi, although both of these receive very little means in comparison to the national agricultural research institution. This work has been carried out over a 15 to 20 year period, underscoring the need, when thinking of the research base, of adopting a long-term perspective.
3.92 It is recommended to undertake a serious in-depth audit of the Beninese R&D infrastructure for agriculture and agro-food development in order to identify existing strengths and gaps, as well as to point out possible reallocation of funds towards the most useful and efficient research structures. Such an audit requires an in-depth and rigorous approach following well established international practices. Teams of international experts should investigate systematically the existing infrastructure in both the government and academic sectors (laboratories, equipment, staff, etc) and outputs (publications, knowledge transfer, etc) in the different disciplines to gauge the quality of the research as well as its relevance for the local context.
3.93 Linkages and mechanisms in Benin mainly include the following: CERPA (State rural extension agencies – “Centres Régionaux pour la Promotion Agricole”) and agriculture producer organizations. Benin has been involved in a decentralization process since 2002. With this territorial reform, local communities have been given great responsibility to develop their own district. The Regional Centres for Agricultural Promotion (CeRPA) are the public extension organizations representing the State at department level. They are under the supervision of the Ministry of Agriculture and they supervise district level Centers for Agricultural Promotion (CeCPA73). The CeRPA has long experience on agricultural extension. Since its creation in 1975, an integrated rural development approach has been implemented. Until 1992, this public extension organization was the only agricultural services provider. CeRPA, previously known as CARDER74, was in charge of the extension, agricultural input provision and marketing of agricultural products.
3.94 Since the liberalization of agricultural services in 1992, the role of CeRPA is limited to extension. A National Agricultural Extension System was set up. It involves farmer organizations, Non-Governmental Organizations and private stakeholders in delivering and funding extension. This system works to a certain extent for cotton, where producer organizations are strong, and therefore are able to pay for extension. However, this is not the case of any of the nascent diversification candidates, and there have been repeated problems with the provision of inputs, producers asking for much more inputs than required and selling the surplus to Nigeria.
3.95 Well structured and representative agricultural producer organizations are an essential channel: (i) for reaching out to agricultural producers, in particular for different
73 Centre Communale pour la Promotion Agricole 74 Centre d’Action Régionale pour le Développement Rural

115
training/demonstration projects, particularly important in remote rural areas; (ii) as an interface for the dialogue on different agricultural policies at the national and regional level; (iii) as lobby groups to defend the interests of agricultural producers; and (iv) and ideally, as paying clients of research services provided by research institutes and universities, as well as extension services provided by the State.
3.96 Benin’s agricultural producers organizations are truly organized in one sector only, that of cotton, albeit weaknesses exist also here. In all the other sectors of the economy, these organizations are embryonic or, worse, numerous and in competition. Local representatives stated that this was due to lack of trust, training and capacity, policies, and financing, and was particularly exacerbated in the South of the country.
3.97 In view of its importance for the Beninese economy, it could be interesting , in view of strengthening the agricultural producer organizations, finding durable funding mechanisms and strengthening governance (see box below).

116
Box 3.2: Enhancing the Capacities of Rural Producer Organization – The Case of the PSAOP Project in Senegal
This World Bank project (“Programmes des Services Agricoles et appui aux Organisations Paysannes” – PSAOP ) was the first phase of a 3-phase Adaptable Program Loan. US$31.8 million financed the first phase running from 2000-2005. The development objective of the program was the substantial increase of small-holder agricultural productivity, production and incomes through technological change. The objective of the first phase was to set in place institutional reforms to achieve autonomy and accountability of public agencies and empower producer organizations. Impact on the ground: - The Senegalese Agricultural Research Institute (ISRA), and the Food Technology Institute(ITA), have improved their scientific and managerial capacities, and a competitive funding mechanism National Fund for Agricultural and Agro-food Research is fully operational for the selection and funding of research programs. This financing is accessible, beyond the traditional research centers, to various institutions such as the University of Dakar ( 4 projects financed ), SODEFITEX – the Cotton Company ( 2 projects ), the Veterinarian University ( 1 project ), the Geomantic laboratory ( 1 project ), etc. Also, eligibility criteria have successfully promoted partnership among research institutions: though all projects were required to involve a minimum of 2 institutions, most had at least 3 partners. Producer organizations ( POs ) participation has been encouraged at all stages of the process – applied research and research/development proposals were endorsed by POs. Since its creation in 2000, FNRAA has received 92 proposals and has financed 30 programs for a total of CFAF1.7 billion (US$3.4 million). Based on first results, other donors such as the African Development Bank and the European Union have participated in and expressed their interest in contributing to the fund. - The ISRA has been reorganized and consolidated in 5 regional research centers. Scientific partnerships have been established at the national, regional and international levels. Twenty-six MoUs and 15 collaborative projects have been signed with partners from the private sector, the international research community, development projects and regional agencies. - The ITA has also developed similar strategic partnerships with private firms, World Vision, UNIDO, FAO, etc. ITA has developed and demonstrated 17 new technologies to users; 50 training modules benefiting approximately 700 private entrepreneurs were organized to demonstrate innovative technologies in the field of post-harvest operations for fruits and vegetables, meat, milk, fish produce and cereals.· - The National Agency for Agricultural and Rural Counsel (ANCAR), is being used by the PSAOP to carry out extension using demand-driven technical training. State participation in ANCAR has been reduced and the private sector has become the majority shareholder with POs holding 38 percent and private agribusiness enterprises 13 percent.· ANCR has assisted POs and communities through 2,817 contracts for a total cost of CFAF 365 million, including a producer participation of CFAF 131 million (13%).· - The financing mechanism dedicated to POs “Demand-driven Rural Services Fund” (FSRRD) has been successfully implemented by the private Senegalese Agency for the Promotion of Grassroots Development, ASPRODEB. At the local level, 152 Producer Organizations Local Council (CLCOPS) have been set up. These cover 67 percent of the rural communities and represent almost 50,000 producers. By project closure, the FSRRD had financed 1,235 projects (against an initial objective of 852) for a total amount of CFAF 885 million. In the 11 regions, regional POs have accessed the fund through 49 projects for a value of CFAF 104 million. All these projects have benefited approximately 62,000 producers. The CLCOPS have now been acknowledged by public services, programs and local governments as their entry-point for dialogue and collaboration with producers and their organizations. - The Ministry of Agriculture and the Ministry of Livestock have disengaged from production and marketing activities and have refocused on their core functions of policy formulation and monitoring and evaluation

117
How to
3.98 Of course, as for all policies in any country, the difficult issue is not so much what to do, but how to do it. A few major issues are discussed below: the self organization of key actors, decentralization processes, the absolute need for prioritization, monitoring and evaluation mechanisms, and the promotion of success stories.
3.99 Self-organization: There is a widespread tendency in Benin to expect that top government leads the move: "It is just a matter of political will” (volonté politique) is often repeated. This viewpoint is erroneous. The first and major obstacle to a proper exploitation of the diversification and innovation potential in Benin is the inability of actors to organize them selves. Examples abound of such inability: in the various agro-food value-chains, in tourism in the government itself, which can be illustrated by the overlap and lack of coordination of agencies in charge of export promotion, FDI attraction, etc. There are however, some interesting exceptions: artisans for organizing training, medical professions for building a sub-regional center of competences, etc. One would note that these “success stories” are in the service sectors and in trade which can have a financial reward of their collective investment in a relatively short time, while benefiting from low cost infrastructure or State and donor supported ones (hospitals). Do these factors explain this facility of self-organization more developed than elsewhere? If so, it would be worthwhile for the government to invest in a minimum of collective infrastructure (logistics and export networks for food producers, roads for tourism, etc). At the same time it is essential that the government does not intervene excessively with monetary and financial instruments. Several examples (including the microcredit mentioned above) show that such interventions can be quite unproductive. A key point would be to establish investment in infrastructure of common use, including in intangibles such as training, software, export networks, etc. as demonstrated by success stories.
3.100 Decentralization: Benin is not a very large country, but it is made of territories with significant differences in geomorphology and climate, and therefore of resource bases. As a consequence there is a certain sense of identity in each of the regions of the country. On the top of this is that decentralization is taking shape with the first election of mayors five years ago and the second election a few months ago. As observed everywhere innovation takes shape at the local level among communities which decide to join their forces and exploit their strengths while drawing upon outside and foreign experiences. This is why it is important to mobilize such communities around specific projects. A proper decentralization of the antennas’ network of the planned innovation agency can be a useful tool in this perspective. At the same time it is essential to prevent an excessive decentralization of funding and allocation of resources in a context known to be strongly affected by corruption.
3.101 Prioritization: the Beninese economy – at least the Beninese government – does not have the resources to act in many sectors at once. Moreover being efficient whatever sector is considered requires actions in several policy areas together (norms and standards, funding of infrastructure, support of innovators, entrepreneurs or exporters, financing and banking regulations, etc). Therefore it is essential to be selective in

118
focusing on those sectors or sub-sectors which have a greater chance of success or where the cost/benefit ratio would be the most profitable for the economy. Ways and means for arriving at such a consensus need to be sought. In fact Benin is flooded with sector strategies and analysis, but there are no prioritization exercises. Moreover there are insufficient precise market studies, systematic investments and cost estimations. How best to improve the documentation and the information basis for building a consensus on priorities and get the actors, the government, the business circles, academics, etc – moving together? A key element in this prioritization effort would be to act with the needed package of actions which conditions successful attempts (trade, finance, training, etc with the necessary attention to details). To begin with, a comprehensive and sustained approach could be initiated by the government in a few selected products identified above with good export potential such as pineapple and grasscutters. This would encourage the many different actors involved to come and move together with the catalytic action of the government.
3.102 Success Stories: There is no better boost to action than the experience of success. Countries which have in recent decades taken off vigorously have built on some forms of success stories after experiencing some crisis. Such success stories can be the development of export industries, the building up of an innovative site, etc… In the case of Benin, there are some success stories which can be exploited and promoted. They generally concern some specific individuals or entrepreneurial projects. We have pointed out some of those. But one, not mentioned yet, demonstrates the considerable resource of creativity that exists in the Beninese population. This is the case of Mr. Toundé. To diffuse these different success stories, radio could be a good means: there is a very famous radio talk-show every morning, listened to by large segments of the population and the government, entitled “La grogne matinale”. A new program entitled – on the same model, perhaps “Succès Matinaux -- Morning Successes” could diffuse success stories?
3.103 Monitoring and evaluation: The development of indicators is an essential element, both to offer international benchmarking possibilities as well as to strengthen monitoring and evaluation to refine policy elaboration and implementation. In this respect, the World Bank is currently carrying out research to refine the conceptual and analytical tools used to identify how policies and investments can best promote innovative behavior and practices in the agricultural sector. These cover four different domains: (a) knowledge and education; (b) business and enterprise; (c) the bridging institutions; (d) policies institutions and framework conditions. A prototype set of agricultural innovation indicators is proposed on these four domains in a recent report (World Bank, 2007), and is being experimentally implemented in the African context by CGIAR. A major methodological and statistical effort is also needed to build more appropriate indicators to measure the real benefit of sustainable activities in looking more carefully at their impact on the population, independently from monetary performances. Many informal activities allow families to develop, although not growing financially speaking, in poor communities. This should be considered within an overall approach of economic diversification, into which all is not necessarily financially profitable and measurable.

119
3.104 To conclude, one might say that Benin in searching to become an emerging economy is in fact trying to catch a general trend known as “knowledge economy” in the international community. This trend and related development strategies are being systematically studied in the World Bank, and notably at the World Bank Institute75. A data base, including 130 countries and 80 variables, positions Benin in this general trend. Elements of comparison with Sub Saharan Africa and neighbor countries, such as Ghana, shows that Benin has still a long way to go (See Annex).
CONCLUSION AND RECOMMENDATIONS
3.105 Export diversification requires innovation in a broad sense, including adapting existing knowledge to conditions in Benin. In promoting export diversification and innovation, the CEM recommends a middle ground between “picking winners” and “laissez faire”. Using a novel methodology based on changes in revealed comparative advantage, this chapter identifies several agriculture and other natural-resources-based products such as crustaceans in which Benin has shown promise. To develop these industries, the CEM recommends a two-fold strategy of:
1. Overall improvements in the business environment, as just noted for traditional sectors, in particular improvements in electricity supply.
2. Targeted assistance from the government through alleviation of sector-specific dimensions of the economy-wide constraints identified in the first chapter of the CEM. These include:
a. Government and donor assistance for attainment of quality control and sanitary norms through MSTQ (Metrology, Standardization, Testing, Quality) services.
b. Support producer organizations notably in agriculture.
c. For agricultural products in particular, government support also must involve research and extension, promotion of outgrower schemes and improving access to land.
d. Support to entrepreneurs in ancillary services and information related to logistics, packaging, trade, export networks.
e. Foster collaboration between the universities and entrepreneurs, and expand funding for research.
f. Develop innovation workshops/ technology transfer offices.
g. Publicize success stories of innovation in the popular media (radio, television, newspapers).
75 See Building Knowledge Economy: Advanced Strategies for Development, 2007

120
h. Consider the development of an innovation agency that would provide some seed funding for new projects.

121
4. THE POLITICAL ECONOMY OF GROWTH AND DIVERSIFICATION IN BENIN
4.1 The 1991 elections marked the beginning of Benin’s democratic transition, the success of which has been demonstrated by the fact that two sitting presidents have, since 1991, constitutionally vacated their office. The success of the transition is even more remarkable when compared to the experience of other French-speaking countries of the region. Benin’s transition to democracy has been more sustained and free of ethnic or other conflicts than in most other African countries. Benin’s achievement is also remarkable in light of Benin’s history since its independence. In the 12 years following independence, from 1960-72, Benin experienced six coups. The military regime headed by Mathieu Kérekou was in power from 1972 until 1990. Although President Kérekou returned to serve two terms as an elected president, he also ultimately deferred to a civil society movement aimed at preventing him from changing two constitutional provisions (on the age of presidential candidates and a two term limit) that would have permitted him to run for a third term.
4.2 Benin’s economic growth has not matched the vibrancy of its elections. This chapter explains the political economy of this puzzle – why competitive elections have not catalyzed growth – finding one explanation for it in historical legacies from the pre-democratic period. Benin entered democracy without broad-based, policy centered political parties that could effectively represent the interests of large numbers of Béninois; with a constitution that vested unusually significant authority in a few officials; and with a high degree of mistrust even among elites. In addition, citizen information about government contributions to their welfare is essential to electoral accountability. However, as in many poor, young democracies, citizens in Benin have limited knowledge and information on what government policy can do, how it affects economic growth, and how economic growth affects their own welfare.
4.3 The starting point of the analysis that follows is that Benin has been slow to embrace policies that favor economic growth and diversification, a key theme of this entire report. The political economy analysis begins in the second section with a discussion of the difficulties that voters have in holding politicians accountable for the rate of growth in the country, including the impact of unstable and fragmented political parties and how these influence political incentives. The third section discusses how political institutions in Benin may contribute to the low growth. The fourth section explores the extent to which the Beninese are informed about government decision making relative to citizens in comparable countries and the effects this has on policy making oriented towards growth. The fifth section does the same, examining the effects of generalized trust and attitudes towards markets. Specific issues related to reforms and growth in Benin are then briefly explored, including the cotton sector, and government transparency. In all cases, the effects of weak political incentives to push for growth are clear. The concluding section emphasizes, however, that the political

122
obstacles to growth are not immutable. On the contrary, the conclusion points to a number of policy implications that emerge from the analysis.
VOTING, INSTITUTIONS AND GROWTH
4.4 The policy environment for growth depends on the incentives of government decision makers that, in democracies, are shaped by the relationship of elected officials to voters. If citizens base their electoral choices on the degree to which candidates promise economic policies that promote growth, elected politicians are more likely to pursue those policies. If the electoral relationship is rooted in clientelist promises to narrow groups of citizens, however, growth-promoting policies are less likely. As Van de Walle (2001) argues, in many African countries “democratization has had little impact on economic decision making, because the new democratic regimes remain governed by neopatrimonial logic (p. 18, see also van de Walle, 2003).” This logic compels political competitors to rely disproportionately on transfers to narrow groups and particular individuals in order to get elected.
4.5 In Benin, there is little dispute that the competition for votes is more closely rooted in clientelism than in the policy promises of parties. However, while the clientelist nature of electoral competition in Benin is well-known, the underlying reasons for it and its specific consequences for growth are less often articulated. The discussion that follows reviews two main sources of clientelism and how they undermine political incentives to pursue growth. The first is the inability of political competitors to make credible pre-electoral promises regarding growth-related policies. The second is the inability and lack of authority of candidates, once elected, to implement the policies they have promised.
Political pre-conditions for growth: The credibility of political promises to pursue growth
4.6 Clientelist promises displace growth-promoting policies as the currency of electoral competition when political competitors are unable to make credible growth-oriented promises prior to the elections (see, for example, Keefer and Vlaicu, forthcoming; the lack of credibility is also one of the key political market imperfections discussed in Keefer and Khemani, 2005). Moreover, it is not enough for individual candidates to be able to make credible promises. A single candidate for the legislature, or a single small party, or a president who must seek the approval of a strong legislature, cannot promise to enact policies that many politicians must approve and implement.
4.7 In contrast, many politicians, joined together under the banner of a larger organization – a political party –that has a reputation for favoring growth, can credibly claim that they can implement the policies that they promise. That is, reform-minded politicians grouped in broad, policy-based political parties can collectively make credible policy promises prior to elections that individually they cannot. If politicians cannot make credible pre-electoral promises related to growth, the electoral relevance of growth

123
fades, since no party can promise to do a better job, or to pursue different growth-oriented policies, than any other.
4.8 For close observers of Beninese politics, it is well-understood that voters care little about broad policies; that they and the politicians they elect are caught in a dynamic in which clientelist promises are expected and offered and where little account is taken about policy choices and promises. Supplementing the qualitative evidence that underlies this understanding with more systematic, quantitative evidence is nevertheless useful. First, it provides a basis for assessing under what conditions Benin politics would not be regarded as clientelist. Second, it permits some assessment of cross-country comparisons and an answer to the question, “How clientelist is politics in Benin compared to other places?”
4.9 Two measures of political credibility exist in cross-country data (the Database of Political Institutions, Beck et al.); both are associated with economic growth and Benin scores highly on neither. One variable asks whether political parties can be categorized as left, right, or center, or none of these. The measure is not stringent – most parties in most democracies are, at least superficially, left-wing, right-wing or centrist, and are recorded in this way in the database. Parties that cannot be categorized as left, right or center are less likely to be able to make broadly credible promises to the electorate regarding economic policy. The second variable captures how many consecutive years countries have been governed by competitively elected leaders, since more years of electoral experience offers greater opportunity to build their credibility.
4.10 While the strongest evidence linking political credibility to growth comes from the intermediate channels--political credibility is strongly and robustly associated with better growth-relevant policies, as in Keefer (2007a)--there are also indications of a reduced-form credibility-growth link. Controlling or not for initial per capita income, real per capita economic growth in democracies that exhibited programmatic political parties either in 1975 or in 1985 was approximately 2.5 percentage points per year faster from 1975-2006 or 1985-2006 than in other democracies. Similarly, countries that had enjoyed more consecutive years of competitive elections in 1975 or 1985 grew faster over the same periods (.15 to .4 percent faster for every additional ten consecutive years).
4.11 Benin is at a disadvantage with respect to both indicators of political credibility. In 2006, among the top four parties of all countries with competitive elections, 60 percent of parties are scored as programmatic in the Database of Political Institutions; in Benin, none are. Similarly, the average years of competitive elections for this group of countries is 26, while Benin’s competitive elections first took place 14 years ago (still considerably better than the average African democracy in 2006, which had been governed by competitively elected leaders for only eight consecutive years).
4.12 These broad, highly approximate cross-country indicators of political credibility in Benin could be considered surprising. After all, a party labeled by all observers as “military-Marxist” (Magnuson 2001) ruled Benin for almost a generation prior to the transition. Despite this, the legacy of the pre-democratic period did not include the well-organized left-wing political party or bureaucratic apparatus that the Marxist label

124
implies, nor did it include a tradition of applying the rules of central planning through a disciplined public administration. On the contrary, as Magnuson (2001) writes, the “military-Marxist regime provided the ideological cover to dismantle and recentralize the powerful regional patronage networks at the heart of the country’s political paralysis and to increase state employment through the creation of hundreds of state-owned enterprises.” Lacking institutions that could restrain pervasive patronage and corruption, Benin was particularly vulnerable to adverse economic shocks. By the late 1980s, the government was bankrupt, precipitating an economic and political crisis. However, there were no credible organizations, either political or bureaucratic, to assist in the democratic transition.
4.13 A closer look at Benin’s parties, and at voters’ relationship to them, reveals how far they are from being able to make credible pre-electoral promises about growth. The parties that emerged after the introduction of democracy were ephemeral and organized around individual personalities. Their number fluctuated widely, going from 129 to 27 in 2005 (after legislation in 2003 to tighten the number of parties) and rising to over 100 prior to the 2007 legislative elections. The 26 coalitions that emerged from these parties competed for the 83 seats in the National Assembly in 2007. The newest of the coalitions, the FCBE (Force Cauris pour un Bénin Emergent, less than one year old), won the most seats (35). The oldest party (the PRD, Parti du Renouveau Démocratique, approximately 14 years old), lost a seat, going from 11 in the previous legislature to 10 (according to the Economist Intelligence Unit).
4.14 Party fractionalization is correspondingly higher in Benin than in other democracies. Fractionalization is the probability that two randomly selected legislators do not belong to the same party. In 2006, that probability was 80 percent in Benin, compared to 52 percent in Ghana, 60 percent in all African democracies and 67 percent across all other democracies.
4.15 Politicians have no strong incentive to exhibit strong party loyalty in such a setting. The experience of a dedicated legislator, the chairperson of the Justice Commission of the National Assembly, is typical. She was first an active member of the Renaissance du Bénin (RB) party of President Soglo, then switched to a second party until the leader of that party died, and then became an independent, running eventually on the list of President Yayi Boni in the last legislative elections. Likewise, the deputy mayor of Parakou indicated that neither the mayor nor the members of the communal council have decided what their party affiliation will be for the next communal elections; they will not decide until the last possible moment. Even labor union members and their leaders, in contrast to all mature democracies, lack strong party connections (except when the union itself is behind the party). Pascal Todjinou, President of the Electoral Commission and the leader of a major union federation, indicated that unions and their officials have no party affiliation, as a rule.
4.16 The phenomena of numerous and unstable parties, of new parties emerging to capture a plurality of legislative seats, of an independent capturing the presidency, and of significant fluctuation in seat shares of older parties, are closely associated with the absence of parties able to make broadly credible policy promises to the electorate. One

125
can see this same problem more directly, in survey evidence that reveals an almost complete lack of association between voters’ policy and partisan preferences.
4.17 If candidates were able to make credible competing promises regarding their approach to growth, and were grouped into like-minded political parties, then voters would express support for those parties that most reflected their preferences regarding how to pursue growth – for example, a state-led or market-led approach. Consistent with the observation that union leaders in Benin have no particular party affiliations, the Afrobarometer survey of 1200 respondents, which was carried out in Benin in 2005, offers little evidence of this (for one application of the survey by one of its founders, see Bratton 2007).76
4.18 The survey asks whether individuals agreed that “people should look after themselves and be responsible for their own success” or rather, in contrast, agreed that “the government should bear the main responsibility for well-being.” Of those who expressed an opinion, 113 were respondents who indicated that they felt closest to the party of former President Kérekou, the Union pour le Bénin du Futur (UBF). Of these, 42 percent agreed strongly or somewhat that people should be responsible for their own success and 58 percent believed the responsibility for well-being rests with government. Eighty-two respondents indicated that they felt closest to the party Renaissance du Bénin, of President Soglo. Of these, 30 percent agreed that people were responsible for their own success and 70 percent that well-being is the government’s responsibility. Finally, 59 respondents indicated support for the PRD, and of these 44 percent favored individual responsibility and 56 percent assigned greater responsibility to the government.
4.19 These survey responses indicate that voters do not prefer parties on the basis of party commitments to different growth strategies, and therefore that electoral choices are not made on the basis of growth policies. First, the philosophical differences across supporters of the different parties are modest: there is at most a 14 percentage point difference across supporters of the three parties in the degree to which they assign responsibility for well-being to individuals or the government. This is slightly less than the Afrobarometer results in Ghana, where 61 percent of supporters of the governing party (the NPP), versus 44 percent of the main opposition party (the NDC) agreed that responsibility was individual.77
4.20 However, a more telling comparison is to a country in which parties are better able than in Benin or Ghana to make policy commitments to voters. In the United States, for example, in a survey of 2,369 voters in February 2002, 55 percent of Republican-leaning respondents said tax cuts should be made permanent compared to 12 percent of Democratic-leaning respondents, a difference of 43 percentage points, compared to at most 14 percentage points in the analogous Benin question. Similarly, although less dramatically, 70 percent of Republican-leaning voters described themselves as pro-
76 There is no more recent survey that would reflect the emergence of the Force Cauris pour un Bénin Emergent (FCBE). 77 The 2005 wave of the Afrobarometer survey was carried out across 18 African countries.

126
business and 30 percent as not being pro-business while Democratic-leaning voters split 50-50.78
4.21 The second notable feature of the responses to the Benin Afrobarometer survey is that the differences across parties do not correspond to any obvious policy stances of the respective parties, and in some cases they even contradict them. For example, supporters of the UBF were among those least likely to agree that responsibility for well-being rests with the government. However, the UBF has not articulated nor campaigned on a pro-market policy stance. On the contrary, the UBF is descended from the apparently Marxist, anti-market party that ruled the country before democracy.
4.22 The third piece of evidence that the broad policy stances of parties either do not exist or are not taken into account by voters comes from the answer to the Afrobarometer question on democracy. Respondents were asked to indicate whether they believed democracy is preferable to any other kind of government, whether in some circumstances a non-democratic government can be preferable, or whether, for people like the respondents, the type of government does not matter. Naturally, support for democracy is high: more than 75 percent of respondents indicate that democracy is preferable to any other kind of government. However, there is no difference in support for democracy between the supporters of the party of President Kérekou, the ruler of the pre-democratic era, and the supporters of the party of President Soglo, the first president after democracy. This reflects the personality-based appeal of these parties and contrasts with Ghana, where support for democracy was 12 percentage points less among supporters of the party that ruled in the pre-democratic period (the NDC) than among supporters of the other large party (the NPP).
4.23 The most important feature of the Afrobarometer results for Benin is the unusually large fraction of respondents who did not express a party preference at all. Of 1200 respondents, 793 – 66 percent – did not feel close to any party. This is twice as many as in the corresponding Ghana survey, where only 393 – 32 percent – did not express a preference. That is, twice as many voters in Benin as in Ghana, and a large majority of voters overall, believe that no single party is more likely to improve their welfare than any other. This is an immediate consequence of a party system in which parties cannot make credible promises to voters even about narrowly targeted transfers, much less broad public policies.79
4.24 Respondents who are most likely to declare themselves without partisan attachment are also those for whom it is most costly for parties to reach with broad-based messages: poor, rural and less educated households. The Afrobarometer survey has questions about household assets, educational attainment, and whether households read or
78 Pew Research Center for the People and the Press. Survey of February 2002. http://people-press.org/dataarchive/ 79 One alternative explanation for the large number of unattached or disaffected voters could be that respondents simply do not believe that government has a role in improving their welfare. However, 64 percent of disaffected voters agreed with the statement that government has primary responsibility for people’s welfare.

127
listen to the news frequently in newspapers or on radio. The probability that a respondent expressed support for a party, rather than disaffection, was significantly higher for richer, more educated citizens (both of which are highly correlated with listening to or reading the news, which are themselves statistically insignificant).
4.25 It is, then, not surprising that Béninois respondents to the Afrobarometer survey were most likely, across 25,000 African respondents in 18 countries, to say that their politicians made promises to get elected, and did not keep their promises once they were elected. 62 percent of all 25,000 respondents said that their politicians always make promises to get elected, including 64 percent of Ghanaian respondents. In contrast, 75 percent of Béninois respondents said that they make promises. The survey also asks whether respondents believe that politicians keep their promises. Skepticism in Benin was much higher than in other African countries: 95 percent in Benin said that politicians rarely or never keep their promises, compared to 82 percent in Ghana and Africa as a whole.
4.26 It is common for parties that are unable to make credible policy appeals to resort to appeals based on social identity, such as ethnicity. To the extent that this occurs, members of small ethnic groups are likely to feel disenfranchised. One MP in Benin, a Muslim from the northern region of the country, indicated that his small party and a few others had joined in a declaration that, among many other issues, expressed concern about the predominance of evangelical Christians in the president’s cabinet. However, there were no other examples of such concern. In fact, respondents who indicated they supported a party in the Afrobarometer survey were not likely to say that their ethnic group was treated fairly or had little influence in politics, even though the support base of two parties had a strong ethnic cast. It was disaffected voters who were most likely to say that their ethnic group has little influence in politics; these respondents were most often from small ethnic groups.
4.27 Perhaps as a consequence of significant party fragmentation, the ethnic basis of electoral competition is significantly more muted even than, for example, in Ghana, where the ethnic basis for political decision making is significantly more muted than in other African countries. Although 90 percent of the respondents who expressed support for the PRD and RB (Renaissance du Bénin) identified themselves as Fon in the Afrobarometer survey, supporters of the UBF exhibited an ethnic distribution much closer to the sample distribution of ethnicity in the survey. Moreover, in contrast to Ghana, all major ethnic groups split their support across several parties, reducing the ethnic polarization of politics.80 Most importantly, while those who indicate no partisan attachment are more likely to indicate ethnic resentment or powerlessness, this is not the case with those who do express attachment to some party. In Benin, adherents of one of the major parties were not likely to express feelings of ethnic resentment.
80 This might be because no party in Benin is able to credibly promise that it will improve the welfare of a particular ethnic group, leading to the fragmentation of ethnically-based parties; it might also be because Ghana has first-past-the-post voting rules and single member districts, which discourage small parties from forming, in contrast to Benin’s proportional representation rules.

128
4.28 Since ethnic loyalties are fragmented across parties in Benin, ethnic appeals alone are insufficient to win elections. Even candidates from ethnically homogeneous parties must do more than promise to prefer one ethnic group over another. Unfortunately, the same party fragmentation that limits the role of ethnicity in elections also limits political incentives to pursue growth. Instead, representatives of ethnically homogeneous parties simply make promises that are even more narrowly targeted to the small group that supports them.
4.29 One result of the absence of policy-oriented parties in Benin is a significant disincentive of politicians to join the parties of others. One former education minister, Rafiatou Karimou, indicated that individuals are reluctant to join larger parties where they have no guarantee of a leadership position. She herself, rather than join a party, even the party of the former president with whom she had worked, preferred to start her own party.81 Another consequence, she indicated, is that the president of the country cannot count on his own putative supporters in the legislature. Every presidential initiative requires a fresh round of lobbying, including of members of his own coalition.
Political pre-conditions for growth: Political institutions and incentives to pursue growth in Benin
4.30 The second condition that must be met if elections are to spur growth-promotion is straightforward: the candidates who are elected must have influence over the enactment and implementation of growth-promoting policies. If political institutions grant them little formal authority over policy, growth is hindered in two ways. First, voters have no incentive to pay attention to the growth promises of candidates, who can in any case do nothing about growth once they are elected. These candidates, consequently, focus their promises on issues where they do have influence. However, these promises may not accelerate, and may even hinder growth, such as targeting spending programs to particular constituencies.
4.31 Second, when most elected officials have limited authority, there are fewer checks and balances in government decision making. The absence of checks and balances creates greater uncertainty about the legal environment and gives greater scope for opportunistic behavior, since there are few or no actors who can block policy reversals or expropriatory decisions.
4.32 Cross-country measures of checks and balances exhibit an association with growth. Using data on checks and balances from the Database of Political Institutions, and controlling for initial income per capita and the measures of credibility referred to previously (the fraction of parties that are programmatic), there is a significant association between the initial number of checks and subsequent growth of income per capita, with one additional check associated with about a 0.3-0.4 percentage point
81 The fragmentation of organizations is pervasive throughout Benin society. For example, there are more than 20 trade unions for education alone, which the Minister of Labor Emmanuel Tiando similarly attributed to the pursuit of leadership roles.

129
increase in annual growth per capita.82 Benin has fewer checks than the average democracy – the minimum number for a democracy, two, compared to an average of 3.8.83
4.33 As with cross-country measures of credibility, however, the cross-country checks measures offer only a partial view of the allocation of checks and balances in Benin. One of the key institutional characteristics of countries that they do not take into account is the way in which budgets are prepared. In Benin, the Office of the President has extraordinary authority over the budget process. This includes the sole authority to propose budgets and de facto authority to declare amendments by deputies to be invalid, because the deputies have insufficiently documented their cost implications.
4.34 The Office of the President’s budget authority has a striking effect on legislators’ incentives to challenge the Office of the President on other matters. On the one hand, legislators cannot use the threat of reducing spending on presidential initiatives when they are unhappy with the implementation of the budget. On the other, without the independent ability to include spending proposals that benefit their own constituents, legislators are dependent on the Office of the President’s good will to ensure that its proposed budget includes such benefits. Strict oversight of the executive branch is unlikely to give rise to such good will. In fact, a former president of the Assembly, Adrien Houngbédji, indicated that deputies who vote against the budget are stigmatized.84
4.35 Other presidential systems, such as Chile, though not the United States, also vest strong budget proposal power in the Office of the President. However, in Chile the legislature is composed of cohesive political parties that can coordinate opposition to presidential initiatives and oversight of legislative implementation. This is not the case in Benin.
4.36 In addition, the internal governance of the legislature is itself much different in Benin than in other presidential democracies. The main, striking difference is the significant authority of the president of the National Assembly. Once elected, the president of the Assembly decides which committees will review legislation, which legislation will be voted upon, and when the vote will be held; the agenda submitted by the Assembly President to the Assembly can only be changed by a majority vote of the Assembly.
4.37 The power of the Assembly president and the fractionalization of political parties in Benin are the subject of perenial debates. The discussion here points to one potential advantage of shifting some authority over the Assembly agenda to deputies 82 The checks variable in the Database of Political Institutions makes a count of the number of actors that can block legislation in a political system. In a presidential system it is two if the president is competitively elected, and increments further when the legislature meets different conditions (e.g., is controlled by the opposition). 83 However, this likely understates the difference, since the DPI checks measure takes no account of the incentives of the actors to exert oversight on each other, nor on the agenda-setting power (e.g., with respect to the government budget) that tilts power notably away from the legislature. 84 The National Assembly did vote down the last budget of President Kérekou. This, however, was after it was clear that he would leave office.

130
since it provides voters with greater incentive to hold deputies responsible for Assembly actions and, ultimately, increases legislator incentives to act collectively within more stable, policy-based parties. In the short run, however, such a reform would have a limited effect on policy outcomes: as long as legislators are not associated with stable, policy-based political parties, they have limited incentives to exercise increased influence to improve broad public policies.
4.38 These influences on party fractionalization may explain why, even taking electoral rules into account, party fractionalization in the Beninese legislature is 25 percentage points greater than in the other 24 African countries with competitive or nearly competitive elections. More generally, differences in electoral institutions across Africa seem not to be associated with significant differences in party fractionalization: whether among countries that use proportional or plurality voting rules, party fractionalization is about the same.
Legislator incentives to pursue growth
4.39 The fact that legislators are neither elected based on their growth-related promises, nor able to exercise significant influence on growth once they are in the National Assembly, have two significant effects on growth. First, the weakness of legislators undermines the political checks and balances that contribute to the security of property and contractual rights of investors. The President of the National Assembly and all seven members of the Bureau of the National Assembly are from the president’s coalition, four from his party and three from allied parties. The National Assembly may generally provide insufficient oversight of executive decisions as seen, for example, in the apparently selective enforcement of tax laws or the assignment of commercial privileges to some business interests and not others.
4.40 Second, legislator weakness reduces voter incentives to hold legislators accountable for growth. Voters have no reason to reward or punish legislators for the country’s growth performance.85 Since they are not held directly responsible for broad policy successes and failure, legislators have few incentives to coalesce into broad-based political parties, undermining the emergence of broad policy-based political parties.
4.41 Interviews with deputies, their advisors and outside observers offer ample evidence of these incentives. For example, if they are present, one would expect to see legislators spend little time on growth-related matters. In fact, numerous deputies interviewed for this study agreed that the main focus of their legislative activity in the first year of the Assembly session was the election of the president of the Assembly and, secondarily, the heads of Assembly commissions. In contrast, they
85 Their indifference to candidates means that deputies are vulnerable to replacement, but for reasons that have more to do with presidential politics than with their own actions. The following dilemma illustrates the political difficulties that confront deputies. On the one hand, deputies who do not align with the president are unlikely to be able to deliver benefits to their constituencies, and are vulnerable to replacement. On the other hand, deputies who are aligned with the president are vulnerable to replacement if presidential performance is sufficiently poor that it is generally expected that he will not be re-elected, devaluing the electoral value of proximity to him.

131
indicated that few deputies engaged in other legislative activity, neither participating in the review of presidential initiatives nor in the drafting of legislation.
4.42 The director of the Assembly’s technical secretariat, the Centre d’Analyse Politique du Développement Nacional (CAPAN), indicated that deputies are most interested in their ability to deliver goods to constituents. They are the “social security policies” of their supporters; he even argued that some deputies are poorer when they leave office than when they entered, as a result of the contributions they made in office for burials, school fees, town meetings, etc. Deputies themselves made this point. One indicated that they are not much interested even in the effects of policies on their constituencies as a whole, much less in policies affecting the country. Instead, they are focused on devising ways to meet the constant flow of individual requests that they receive from constituents (marriages, naming ceremonies, health bills). Constituents rarely or never make collective demands on deputies, he claimed. In their hierarchy of concerns, deputies appeared to be first worried about private constituent demands for assistance, then about projects (school buildings, for example) in their constituencies, and then, perhaps, in whether constituency education or health facilities were properly staffed, and only very rarely in policies of national importance.
4.43 The essential disinterest in large budget issues was reflected in interviews with deputies. For example, none mentioned that primary school spending had increased by ten percentage points of the budget, nor that either they or other deputies were debating how to spend it. There was no legislative intervention or debate regarding a months-long work slowdown by teachers. Similarly, the largest export industry of Benin, cotton, has confronted great production volatility, large cash injections by the government, and significant conflict within the private sector and between the private sector and the government. Here again, however, there was no evidence of significant legislative activity.
4.44 On the contrary, there were indications that deputies could be persuaded to devote time and effort to broader policy issues only if they were paid. The president of the Justice Commission of the Assembly indicated that she needs grants from donors to finance work on legislative proposals, including paying experts and, even, paying deputies to develop new laws. Many observers from outside the Assembly suggested that governments have paid legislators to support the initiatives of the president. These statements are difficult to verify, but to the extent that they are accurate they indicate that the policy interests of legislators are slight.
4.45 One would not expect close oversight of the executive branch in this environment. In fact, the Director of CAPAN indicated that, advised by CAPAN, the deputies asked 2,000 questions of the government related to this year’s budget submission relative to only 300 the year before. He judged the government’s answers to these questions to be non-responsive; CAPAN appeared to be more concerned about non-responsiveness than the government, however, and the National Assembly unanimously supported the budget.

132
4.46 All deputies, and their advisors, explained their lack of insistence on budget amendments was due to institutional obstacles, pointing especially at the constitutional provision that says that deputies are not allowed to make proposals for new spending without clarifying the financial costs of their proposal. In general, they have neither the data nor the expertise to make these analyses. Even after setting up an expert group, CAPAN, the limited access of advisors to government data (or the absence of government data) made these analyses difficult. Finally, regardless of the quality of the legislative analysis, deputies and their advisors indicated that the government itself makes the final judgment about whether a cost estimate is adequate.
4.47 Lack of data also hinders parliamentary oversight. CAPAN attempted to put together an information base on schools, health centers and roads that had been built over the last five years, but found that this was impossible. They simply could not inventory such projects nor monitor the flow of money budgeted for them. In this case, the problem was not ministerial refusal to supply CAPAN with the information; it was rather that ministries simply did not collect this essential information in the first place. Of course, a legislature that exercised closer oversight of the executive branch would demand that such information be collected and retained, or threaten budget cuts. This does not occur in Benin.
4.48 The lack of influence of deputies puts them in a vulnerable position. They are easily replaced, for example, by any challenger who can credibly claim greater proximity to the president than they themselves have. In fact, most MPs were replaced in the last elections. The threat of replacement does not strengthen legislative accountability; on the contrary, because this threat is independent of their own efforts on behalf of their constituents, and related instead to their proximity to presidential candidates, the threat actually reduces their incentives to exert effort when they are in office.
4.49 One effect of the weakness of the Assembly is that ad hoc institutional fora are sometimes used to give legitimacy to broad policy debates. For example, the government has convened two États Généraux – conferences that bring together the major actors in a particular policy area – to discuss problems and ways forward in both health and education. The president of the National Assembly’s Commission on Education, Employment and Social Affairs, said that no deputies, including those from his commission, were invited to these.
Presidential incentives to pursue growth
4.50 National Assembly elections fulfill neither of the conditions described above that are necessary for them to pursue policies to accelerate economic growth: deputies are neither affiliated with broad, policy-based parties, nor do they exercise significant influence on policy after they are elected. The president of the country, however, fulfills the second condition: it is undisputed that he has ample authority to pursue a growth agenda. One might expect then, that at least in presidential elections (in Benin or in many other countries where legislators are comparatively weak), voters could base their electoral choices on the growth policies promised by the candidates. Unfortunately, the failure of the first condition – the absence of policy-based political parties – still

133
undercuts the electoral incentives of even presidential candidates to make policy-oriented pre-electoral promises. Because party labels are uninformative and party affiliation conveys no credible stances regarding economic reform, voters cannot easily discern which presidential candidate will best promote growth.
4.51 Like legislative candidates, presidential candidates must therefore leverage their own personal characteristics, accomplishments and sources of campaign finance to convince voters that they will do a better job running the country than their competitors. One of those characteristics is always the regional and clan roots of the candidate: in a non-credible setting, voters will always care much more about a candidates’ regional or ethnic identity than about the candidates’ policy promises. Voting is not only regional and ethnic, though, since co-ethnics often compete against each other. In the last presidential election in Benin, an additional key characteristic of the ultimately successful candidate was the ability to take credit for infrastructure projects. These tangible achievements did not provide voters with credible information on his growth agenda, but they did add credibility to his promises to deliver targeted benefits.
4.52 Under these circumstances, the promises presidential candidates make in order to get elected are more often tangible and easily evaluated by voters (e.g., public works projects); focused on regions of the country where they are most likely to be believed (e.g., where they were born, where their home language is spoken, etc.); and constrained by the promises they have made to contributors to their campaigns – contributions that play a large role precisely in environments where voter attachment to political parties is weak. Growth could, but generally does not emerge from these policies, since it is not the main objective of policy decisions.
4.53 Moreover, presidents who pursue growth initiatives unilaterally take a significant risk. A side effect of most growth initiatives (e.g., port reform or a modernized investment code) is to trim the privileges of narrow interests. These interests finance presidential campaigns. The gamble pays off if growth initiatives yield large and visible results before presidents have to run again for office. In this case, the loss of support from special interests can be offset by the president’s broadened popular appeal. If, however, the growth payoff is not large or widely felt, the gamble fails and the loss of special interest support is sufficient to cost a president his re-election chances.
4.54 One final effect of personality-based presidential elections is to further impede the development of policy-based political parties. One way in which policy-based parties can emerge is when the president establishes a reputation for preferring particular policy choices and links his party to those choices. The credibility of those policy choices leads legislators to seek to affiliate with the president’s party, to attract the votes not only of the citizens to whom the legislators can make credible promises of transfers, but also to attract the votes of citizens who approve of these policy choices. However, when presidents face significant constraints in taking strong policy stands, they can only build parties around their personal characteristics. This explains why every president of Benin has attempted to form a governing coalition not by investing in a policy reputation with the electorate, to which legislators will flock, but by promising

134
private benefits to those who join (or denying benefits to those who remain outside the coalition).
4.55 In sum, the inability of broad groups of candidates to make credible policy promises to the electorate prior to elections and the institutional weakness of deputies in the National Assembly provide weak incentives to all political decision makers to pursue policies in the broad public interest. While this does not imply that voters are entirely powerless to demand accountability from them, it does mean that their influence is substantially attenuated. For example, in the event of extreme policy failures, voters still turn failed incumbents out of office. Unfortunately, unlike electoral systems in which candidates can make credible promises and, once elected, can exert influence over public policies, the best that voters can do is hold incumbents accountable for particularly bad performance. (Ferejohn, 1984; see Keefer, 2007b, for an example from banking crises).
CITIZEN INFORMATION AND GROWTH
4.56 The characteristics of electoral competition and political institutions are central to the incentives of politicians to pursue growth-oriented policies. So also is citizen information. If citizens are uninformed about what governments do for or to them, the instruments they have available to hold governments accountable are limited. Unfortunately, lack of information is a significant issue in Benin. The president of the National Assembly’s Commission on Education, Employment and Social Affairs indicated that representatives of the student unions called on him to argue for more teaching in both French and English. They had not realized, until going to a conference outside of Benin, in Abidjan, that a law in Benin makes French and English teaching mandatory.
4.57 The influence of policies to promote growth are among the most difficult for citizens to discern. Consumers who pay lower prices or producers who earn higher prices because of reforms inside the Port of Cotonou are, even in the best of circumstances, hard-pressed to attribute these improvements to government action. Farmers, for example, could be hundreds of kilometers and many intermediaries away from the port. The economic benefits of reforms that reduce the costs of contracting, or of more predictable government treatment of private companies, are similarly diffuse and difficult to track. Elected officials have little political incentive to pursue policies for which citizens cannot easily give them credit. Many growth-oriented policies have this character.
4.58 Some data are available assessing citizen information about policies in Benin. These do not refer to growth policies, but rather policy areas where the connection between policy and citizen is immediate and concrete. If voters are uninformed about these, it is unlikely that they are informed about broader growth policies. In fact, knowledge of policies seems much lower in Benin than in comparator countries.
4.59 Afrobarometer asks if respondents know whether parents have to pay fees for primary education, and whether patients have to pay fees for health services received at

135
public clinics. In the 17 countries other than Benin, 75 percent correctly answered the education question, and 65 percent of respondents correctly answered the health question. In contrast, in Benin, 51 percent correctly answered the education question and 31 percent the health question.
4.60 Benin responses could be less accurate because the Beninois care less about social services – that is, that citizen attitudes may be responsible for these results. This appears not to be the case, however. Afrobarometer respondents were asked to assess the extent to which they agreed with one or the other of the following statements: “It is better to have free schooling for our children, even if the quality of education is low”, versus, “It is better to raise educational standards, even if we have to pay school fees.” 21 percent of Benin respondents, compared to 24 percent of respondents in all other countries, strongly agreed with the first and 44 percent, compared to 32 percent in all other countries, with the second. That is, the Beninois appear to place a higher value on education than respondents in other countries.
4.61 A more likely reason for the low accuracy of Benin respondents’ answers to the questions about health and education fees is that policies regarding each of these have changed in Benin in the last five years. Even in this case, though, it is noteworthy and potentially troubling that one-half or fewer of respondents could identify what the new policies were.
4.62 It is not surprising that information is a problem in Benin. Radio stations are the most important source of information, given that several times more Beninois get their news from the radio than from newspapers. There are about 60 commercial and non-commercial radios and nearly every Beninois can listen to at least one of them. However, the financial situation of radio stations is often precarious. One station visited for this report was inoperative because the station owner could not afford to replace the station antenna, which high winds had toppled. They do not have the resources to undertake their own news-gathering efforts. Radio Traite d’Union in Bohicon, for example, with a broadcast radius of approximately 130 kilometers, airs three hours of news per day, in French and Fon. However, this news is not based on first hand reporting by the station, but is a compilation of print media and international radio broadcasts. Radio Liberté in Parakou, another commercial station, similarly transmits French language BBC broadcasts, and compiles news from French-language Beninese dailies. Since international radio does not give significant airtime to events in Benin, and since the local press is not in a position to undertake significant reporting, this news strategy is unlikely to provide citizens with information needed to hold the national government accountable for performance.
4.63 This is not to say that radio stations have no information value. On the contrary, most stations have call-in programs, in which citizens within the broadcast area can express concerns; these often relate to local breakdowns in public services. Some stations have self-produced news programs, using material collected by station staff, often unpaid, but the issues are local and the material is from local government offices. Radio FM Idadou, in Save, has nine staff members who spend time every week looking for commune-level news. All stations, commercial and non-commercial, accept contracts

136
from NGOs and government ministries to broadcast programs related to such issues as public health and health practices. In the case of national news, however, any stations that broadcast it rely on reports from Beninese newspapers and state-owned radio, assembled by station staff.
4.64 In the end, then, the average Beninois’ knowledge of the policy choices of the government, and the consequences of those policies, depends on newspapers. Unfortunately, most Beninois do not read them. Across all African countries, with the exception of Benin, 42 percent of Afrobarometer respondents said that they got their news from the newspaper every day or a few times a week; 46 percent said this in Ghana.86 However, only 25 percent of Beninois respondents indicated that they got their news from a newspaper. Even this is likely an exaggeration. There are about 40 daily or weekly newspapers in the country. The circulation of most is less than 1,000; circulation at the top three or four does not exceed 2,000. Although newspapers are expensive, each costing around CFA 300, they are not profitable and are even more fragile economic enterprises than the radios. Gedeon Dassounde, a Conseiller at the media regulator HAAC, claims that nearly all newspapers exist because politicians and businessmen subsidize them for their own purposes. This does not mean that newspapers do not collect and disseminate important information about government performance; only that the market for objective, thoroughly investigated news is thin.
TRUST AND ATTITUDES TOWARDS GROWTH
4.65 In addition to the absence of electoral credibility, the low institutional authority of the National Assembly, and inadequate citizen information about the contributions of government officials to economic growth, two somewhat more elusive issues also affect the political economy of growth. One is the degree of inter-personal trust, which hinders transactions between economic actors, directly reducing growth, but also makes it difficult even for elites to make credible agreements among themselves, reducing the investment response of elites even to legislation that favors their interests and further obstructing the emergence of broad-based political parties. The second issue is the effect of attitudes on growth. If citizens are predisposed to favor growth-oriented policies, these are easier for politicians to adopt. The Beninois appear to be no less trusting than their counterparts across Africa. Africans exhibit substantially less trust than the citizens of many other countries. Even compared to their counterparts across Africa, however, the Beninois seem less supportive of growth-oriented policies.
86 These numbers are high, implying that in some African countries, the fraction of citizens getting information from newspapers exceeds the fraction of citizens who are literate. One possibility is that the survey samples are biased towards the more literate population, which is not a problem for the comparison as long as the bias is consistent. However, at least as likely is the possibility that illiterate respondents heard others read the newspaper aloud.

137
Trust
4.66 Research has found both direct and indirect effects of trust on growth. Directly, mistrust in government or in business partners indicates a fear of opportunistic behavior – that government or business partners will take advantage of fixed investments by entrepreneurs and attempt to extract rents from them. Mistrust suppresses even investment by elites and insiders to the extent that they cannot rely on agreements they make with each other or with politicians. Under these circumstances, entrepreneurs invest less and growth slows.
4.67 Indirectly, mistrust has significant political effects. Politicians must make larger investments to persuade voters of the credibility of their promises. In addition, politicians cannot easily make agreements among themselves, which can exacerbate party fragmentation as politicians prefer to start their own, small parties, surrounded by people whom they trust, rather than join a larger party, led by people whom they mistrust.
4.68 The responses to the Afrobarometer survey undertaken in Benin in 2005 indicate slightly higher levels of trust than in almost all other 17 African countries surveyed. Around 70 percent of Benin respondents indicated that, in general, “you must be very careful in dealing with people”, compared to 82 percent of all other African respondents and 83 percent of Ghanaians. However, levels of trust in Africa are markedly lower than in some other countries. The World Values Survey reports results for the same question for countries outside of Africa. Respondents in some of these countries indicate significantly more trusting behavior. For example, a far lower fraction of Indian and Indonesian respondents, 56 and 43 percent, respectively, answer that one must be very careful in dealing with people.87
4.69 These attitudes spill over into the political arena. Although generalized social trust in Benin is greater than the Africa average, trust in the legislature is much lower. 37 percent of all African respondents to the Afrobarometer survey, other than the Beninois, indicated that they had no trust, or only a little trust, in their parliament or National Assembly. Only 25 percent of Ghanaian respondents said this. However, 46 percent, of Beninois, respondents answered that they had little or no trust in the National Assembly. The many structural reasons identified earlier, related to the dynamics of electoral competition and the design of political institutions, explain why it is difficult for the Beninois to trust the promises of deputies in the National Assembly.
4.70 The impact of trust and mistrust is felt most keenly in relationships among elites in Benin. As the discussion of cotton below illustrates, it is difficult for private elites to make credible commitments to each other, for political elites to make credible promises to private elites, and for political elites to make credible promises to each other. Among private actors, fundamental agreements regarding the allocation of cotton quotas are not followed. Among political actors, one constraint to the formation of larger political
87 The Afrobarometer surveys can be found at http://www.afrobarometer.org/. The World Values Surveys can be found at http://www.worldvaluessurvey.org/.

138
parties, including the president’s efforts to form a Liste Unique (a single party) out of the many small parties of his coalition, is the difficulty of making credible commitments to members of the small parties on issues such as their placement on the party’s list in the next Assembly elections. Between private and political actors, commitments to adhere to particular regulatory schemes in cotton or to make promised concessions in telephony are regularly violated.
Attitudes towards growth
4.71 The earlier discussion of political parties in Benin emphasized that citizens’ beliefs about the role of government are unrelated to parties’ own policy platforms, to the extent that they have any. However, citizen beliefs or attitudes about policy are also directly relevant to what politicians can achieve. If they are implacably opposed to a market-oriented approach to growth, for example, it is much more difficult for even credible politicians to push through market-oriented policies.
4.72 Compared to Afrobarometer respondents in other African countries, the Beninois were much more likely to favor a large role for government. 43 percent of them agreed strongly with the statement, “The government should bear the main responsibility for the well-being of people”, and only 24 percent agreed strongly with the statement, “People should look after themselves and be responsible for their own success in life.” In contrast, in the other 16 African countries where this question was asked, slightly more (27 percent) strongly agreed with the second statement, but many fewer (only 28 percent) strongly agreed that responsibility for people’s welfare rested largely with the government. In Ghana, only 21 percent agreed with this statement, while 32 percent strongly agreed that well-being is a personal responsibility.
4.73 Of course, as with trust, such attitudes are themselves at least in part the product of the political and economic environment in which citizens live and the historical and social circumstances of a country. However, the obvious historical explanation for Beninese responses to this question – that they are the legacy of a long-time Marxist regime – does not seem likely. In Tanzania, which experienced a long period of even more thorough state control of the economy, only 20 percent of respondents strongly agreed that people’s welfare was the government’s responsibility and 48 percent strongly agreed that it was people’s own.
THE POLICY CONSEQUENCES OF POLITICAL MARKET IMPERFECTIONS IN BENIN
4.74 Chapter 1 and the beginning of this chapter outlined a number of policy areas that are important for growth and in which Benin under-performs relative to other democracies. That discussion took advantage of cross-country indicators that permit clear benchmarking. However, these indicators do not give deep insight into specific policy difficulties that confront Benin. A more detailed review of some policy areas more clearly reveals the strong distortionary effects of such features of the political economy as the absence of pre-electoral credibility, institutional arrangements that leave

139
deputies in the National Assembly with little authority, poorly informed citizens, and high levels of mistrust.
4.75 These political factors, according to the preceding analysis, imply two significant effects on public policy. First, policy changes should preserve the ability of political decision makers to allocate rents to narrow interests, even at the expense of the broad public interest. Special interest influence is present in all countries, of course, but is most extreme when politicians have few electoral incentives to pursue the public interest. So we should see a systematic pattern of policy outcomes tilted towards the interests of narrow groups at the expense of society as a whole. Second, intra-elite agreements should be particularly difficult to enforce, because political institutions to enforce them are missing, and because societal trust is in general low. This implies that policies, which in general favor special interests, will frequently change. Evidence from the cotton sector and from government policies towards information all exhibit these two characteristics.
Cotton
4.76 Although it is the export engine of Benin, cotton has long been plagued by difficulties. Some of these are the product of economic market failures that are inherent in cotton cultivation when ancilliary markets and institutions (e.g., credit markets) are weak. Others, though, are the consequence of government action to address these economic market failures in the face of significant distortions in electoral markets and political institutions. The policy challenges of the cotton sector are described in detail in the next chapter. The discussion here is confined to illustrating the link between the political market imperfections in Benin and distortions in economic policy.
4.77 Cotton cultivation depends much more than alternative crops (maize, yams) on purchased inputs (fertilizer, seeds), which in turn are accessible to farmers only if they can get credit. However, the transaction costs of getting credit to small farmers in Benin are high, for reasons that include under-developed financial institutions and inefficiencies in land markets that make it difficult for farmers to use land as collateral. These are difficulties that countries throughout Africa are struggling to address.
4.78 One obvious response to these transaction costs is to reduce them directly, by improving financial markets and the rules governing the registration of land and its use as collateral. This solution has been elusive throughout the continent. Benin has nevertheless endeavored to vest more responsibility for the cotton sector with the private actors in the system. In the current, transitional organization of the cotton sector in Benin, the formal governance of the system rests with the private sector (the AIC). However, government officials retain substantial de facto decision making authority.
4.79 For example, government approval is, de facto, necessary to open a new ginning facility, and every government has taken advantage of this. The centralized price-setting system, though officially non-governmental and conducted under the auspices of the AIC, has frequently reached an impasse: producers and ginners often do not come to agreement about the price that will be paid for cotton. When an impasse occurs, the

140
government fixes the price. The government can selectively enforce obligations between parties in the system, including its own obligation to satisfy arrears to producers. At least in the past, some ginners have been allowed to take cotton from farmers without paying for it.
4.80 The current system has shifted the costs of inefficiencies to citizens and farmers broadly, away from ginners, input distributors, and favored farmers. The depth of involvement of cotton actors in the electoral campaigns highlights the degree to which narrow interests can benefit from government intervention in the sector. The financial support of ginners and distributors is also well-known to be essential for serious presidential candidates. Producer associations are also politically active; one MP from the Parakou area observed that some producer associations exert significant control, sometimes financing political parties, particularly in the northern part of the country.
4.81 This shift is also evident when one unpacks the complicated set of transactions through which farmers procure inputs and sell their cotton. These rules favor cotton sector insiders; however, their ability to evade the rules has, at least in the recent past, favored them even more. Before the season, input distributors provide farmers inputs corresponding to their anticipated cotton cultivation. The “Centrale de Sécurisation des Paiements et des Recouvrements” (CSPR) pays the distributors a regulated, cost-plus price for the inputs; distributors do not compete with each other for farmer business and bear no credit risk. CSPR finances these payments with an advance from the cotton ginners, who remit to CSPR, before the season, 40 percent of the amount of their anticipated obligation to farmers, based on farmers’ estimates of how much cotton they plan to cultivate. At harvest time, the ginners then receive this cotton. For every ton that comes in, the ginners are obligated to remit 60 percent of the amount they agreed to pay the farmers to the CSPR, retaining 40 percent until their advance to the CSPR is paid off, at which point they begin to remit the remainder of the amount they agreed to pay the farmers.
4.82 This system works only if farmer cooperatives harvest at least the planned amount of cotton, if they sell it to the ginner that has been allocated their cotton at the beginning of the season, and if the ginner pays the CSPR for the cotton that they receive. The system has been notable for breakdowns at each of these junctures. The most important breakdown, according to close observers, has been the failure of at least some ginners to pay the CSPR all that they owe for the cotton they have received. In some cases, these ginners may have made side arrangements with farmers, offering them a higher price for selling outside of the system. However, some, apparently notorious ginners have also reneged on their commitments to pay these farmers. Farmers also may fail to cultivate sufficient cotton (either because of authentic negative shocks or because they have diverted cotton inputs to maize); or they have not sold their cotton to the ginner to which their cotton was allocated.
4.83 Some farmers and, especially, Beninese citizens generally have borne the cost of the failure to abide by the rules, while ginners and input suppliers seem to have been held harmless, consistent with the conclusion that political decision makers do not have strong incentives to protect broader public interests. Some farmers have received less than the

141
contracted price (those who sold to ginners who subsequently did not pay the CSPR and presumably did not report to the CSPR that these farmers had delivered cotton). The government recently made a cash injection into CSPR to satisfy arrears (e.g., CFA 2.8 billion in 2005/06), an injection financed by citizens generally. However, even if the arrears due them are ultimately paid, farmers still bore the costs of uncertainty and delay.
4.84 In contrast, the official rules of the cotton sector entirely insulate input distributors from these risks of market failure. They are paid without delay, at the beginning of the season. In addition, distributors can charge regulated, cost-plus prices that appear to be quite profitable.88 The formal rules do place ginners at risk when insufficient quantities are delivered to them by farmers, because the 60 percent they are required to remit to farmers for every ton of cotton that is delivered to them is precisely the amount owed to farmers, after deducting the 40 percent needed to pay for the earlier delivery of inputs. This rule, if adhered to, implies that ginners bear the entire risk of cotton deliveries falling short of plan.
4.85 Compliance with the formal rules is clearly imperfect, however, since CSPR has had large arrears to farmers, implying that some ginners have been able to remit less than the 60 percent of the amount owed to farmers on delivered cotton.89 Ginners are insulated from losses in other ways, as well. Ginners and input distributors are owned by the same economic groups, so group losses from ginning are offset by profits in the lucrative input distribution market. In addition, controls over how ginners source their supplies of cotton are not strong. To the extent that they participate in the parallel market into which non-compliant farmers sell their cotton crop, they again profit from the system.
4.86 The rules of the cotton sector have both equity and growth effects. The equity effects are direct consequences of policies that shift costs onto citizens and away from sector insiders. Growth consequences are less direct. Policies that restrict competition in distribution and ginning and that reduce benefits to farmers reduce investment and innovation in a sector that, given the natural growing advantages that Benin enjoys, should make a major contribution to rural incomes.
4.87 The most significant growth effects, though, are likely to flow not from the rules themselves, but from the lack of enforcement of the rules and their instability. Even given the distortions in the rules, one would expect to see more investment, innovation and cotton cultivation. These are not forthcoming because the rules are not enforced and are unstable. Market participants, whether farmers or ginners and distributors, have no confidence that agreements entered into at the beginning of the season will be adhered to at the end. Unfortunately, where political market imperfections and mistrust are severe, both private and government incentives to renege on agreements and to refrain from enforcing them are high. The electoral rewards to governments of forcing compliance
88 Distributors do not have to compete for farmer business, in part, because the allocation rules on which the system is based cannot operate when multiple distributors sell in the same commune. 89 As the cotton chapter makes clear, some ginners believe they would have a competitive advantage and earn greater profits in a system in which contractual and legal obligations were enforced; the lack of enforcement, however, allows less competitive ginners, intent on exploiting the gaps in the system, to thrive.

142
with the rules and maintaining a stable regulatory system appear to be low relative to the benefits of striking one-off deals with key interests.
4.88 The difficulties that even insiders have in enforcing agreements with each other surfaced in interviews with numerous insiders. Private ginners accuse the state-run ginner, SONAPRA, of recruiting the military to collect cotton from areas outside of its allocation zone; SONAPRA accuses private ginners of doing the same with private truckers. Even the formal allocation of the harvest among ginners is uncertain: as one ginner said, every government wants “its” ginners; hence, it favors the entry of new ginners into a system that already exhibits overcapacity, reducing payoffs to ginners who entered earlier.
4.89 The lack of enforcement of the formal rules in the sector also undermines the key informal enforcement institutions upon which the system rests. If a cooperative does not deliver enough cotton to cover the inputs it purchased prior to the season, it is denied access to inputs in the next season. All farmers in the cooperative are therefore held collectively liable for the failure of any cooperative members to deliver sufficient cotton. This is a characteristic of microfinance schemes everywhere, which depends for its efficacy, first, on all farmers seeing it as being in their collective interest not to renege on the group commitment and, second, on farmers being willing to impose informal sanctions on non-compliant farmers. Both of these are driven by the expected benefits to farmers of access to cotton inputs in later years. Unfortunately, the expected value of those benefits drop when they perceive that the rules are unstable and when they do not expect price commitments to be honored.90
4.90 The fragility of farmers’ commitment to cotton, and therefore of their commitments to repay credits associated with cotton cultivation, is easily documented. For example, in the village of Baka, outside of Parakou, there were more than 100 farmers farming cotton in 1998-99, dropping to 41 currently. Villagers attribute the attrition to the expense of fertilizer and labor inputs (they claim, for example, that it used to cost 25,000 CFA to pay laborers to harvest cotton, and now it is 40,000), to suspect inputs, and to non-payment/arrears. Given these disadvantages, the shift to maize is frequently attractive: maize costs 10,000 – 12,000 to harvest, and they can pay laborers in maize instead of cash, as with cotton. Most are not certain that they want to farm cotton again.
4.91 It is most usual to attribute the difficulties of the cotton sector to the economic market failures that block producer access to critical inputs. While these failures are real and significant, the policy response to these market failures has created a number of distortions of its own. Those distortions seem to flow directly from the imperfections that characterize political and electoral markets in Benin and their interaction with the technical choices made in setting up the institutions of the cotton sector.
90 Group responsibility also works less well when it is easy for non-compliant cooperatives to re-form under new names, an apparent danger in Benin.

143
Government policies towards information and transparency
4.92 Education is one determinant of a critical political market imperfection, the lack of citizen information about government performance. Not surprisingly, the low rates of newspaper readership in Benin relative to other countries in Africa, documented earlier using the Afrobarometer surveys, are partially explained by significantly lower education levels among Beninese respondents (however, even taking into account education and wealth differences across respondents, Benin respondents still read the newspaper significantly less than respondents in other countries).
4.93 Like education, information access itself is also significantly affected by government policy. Here again, there is substantial evidence of political disinterest in ensuring that citizens are fully informed about government performance. On the contrary, some evidence suggests that, unusually among democracies, Benin’s political decision makers are willing to restrict access to information. Freedom House rates countries on the freedom of the press and gives Benin an overall evaluation of Free, with a score of 30. This is not surprising; most democracies score well in the Freedom House assessment. However, a score of 30 is the threshold between countries assessed as Free and Partly Free. Countries that score 31 are assigned a rating of Partly Free.
4.94 The reasons why Benin does not have a more robust rating can be found in government rules and oversight of the media, and in the attitudes towards the media of regulators and politicians. The constitutionally-mandated media regulator is the HAAC. In interviews, the conseillers of the HAAC indicated real concern with the lack of professionalism in the media and media’s often destructive effect on the reputations of citizens.
4.95 A skeptical attitude about the contribution of the media to government accountability in Benin is reinforced by the legal environment governing the media. Liability laws permit journalists to be sued for making false reports about individuals, including public officials. Moreover, the government has apparently taken an expansive view of its litigation rights under the press laws. The head of a newspaper, the one most known for its investigative reporting, said that the government is bringing it to court for reporting critical of the government, but says that the law does not allow newspapers to be sued, only journalists. These liability laws appear to be stricter than in most other democracies; they were enacted into law prior to the introduction of democracy in the country.
4.96 The HAAC also has plans to issue press cards, essentially serving as a licensing body for journalists. The stated purpose of this effort is to improve journalistic quality, since false reporting will be sanctioned by cancellation of the card. However, the government has a significant influence on whether press cards are granted or withdrawn, making it likely, at least in the view of Freedom House, that press cards will be an instrument to limit the scope of reporting on government decision making. The real impact of the introduction of press cards may matter more for how journalists will perceive the attitude of government rather than for its direct effects, since

144
government officials already have the discretion to talk, or not, to any journalist (or citizen) they want, whether or not they hold a press card.
4.97 HAAC’s evolution as a regulator of the media and a defender of limits on journalistic freedom stand in contrast to the constitutional provisions that gave rise to the creation of HAAC. These explicitly state that the task of the commission is to guarantee the freedom of the press. HAAC officials indicate that they endorse this objective, but believe that the potential for an irresponsible press to inflame public opinion in a poorly educated population requires them to pursue this goal gradually. They therefore support a law that regulates newspapers similar to the law regulating radio and television. The latter law requires HAAC to approve new radio and television stations, laying out economic and other criteria that should guide such approval.
4.98 In other democracies, the legislature is the chief guarantor of the media, since it also relies on it to gather information about the actions of the executive branch. As the earlier discussion makes clear, however, the National Assembly has little incentive to oversee the executive. This manifests itself explicitly in an unwillingness to demand information from the executive or to insist that the executive collect and disseminate information about its activities.
4.99 The earlier discussion concluded that inadequately informed citizens weaken political incentives to pursue growth-oriented policies. However, government policy has a significant effect on information, affecting both education and access to information. One conclusion that could be drawn from this is that there is a vicious circle: unaccountable governments pursue policies that keep citizens uninformed, perpetuating the lack of accountability. However, more optimistically, the existence of policy levers to boost citizen information suggests that information is one political obstacle to growth-oriented policies that can be lifted.
CONCLUSION AND RECOMMENDATIONS
4.100 Despite having one of the most successful democratic transitions in Africa, Benin’s political system does not provide incentives to develop and implement policies that promote growth. Politicians have weak electoral incentives to pursue the public interest and correspondingly strong incentives to retain their ability to allocate rents and to mediate disputes between vested interests. Although this is difficult to modify, a more informed electorate is a key pre-requisite for greater accountability and hence improved policies. To this end, it is recommended that the government:
1. Improve the collection and dissemination of information, about what decisions are made, what problems they respond to, how they are implemented and what effect they have.
2. Encourage the media to report on government performance, even if those reports are critical.

145
3. Continue to boost the availability and quality of education.
4.101 In addition, the new government needs to take decisive and visible actions even if opposed by strong interest groups.
4.102 Across a range of governance and business environment indicators, Benin lags other democracies. These difficulties are rooted in the relatively weak electoral incentives of politicians to pursue the public interest and correspondingly strong incentives to retain their ability to allocate rents and to mediate disputes between vested interests. The reasons for these persistent political incentives have been the focus of this chapter. Some of these, such as the credibility of political competitors and information, were also found to be important in an earlier analysis of the political economy of growth in Ghana (see Keefer 2007c). However, they appear to be more pronounced in Benin, consistent with the fact that the policy environment seems also to be less favorable to private sector activity.
4.103 Policy-oriented political parties that can make credible pre-electoral promises to voters about growth-related reforms are absent. In contrast to other democracies in which this is also true, political actors in Benin seem particularly unable to attract a large set of electoral supporters, even on some basis other than policy. Ethnicity, for example, is not a source of cohesive, stable party formation. The underlying reasons for the absence of policy-based parties are not well-understood, but include generalized mistrust that makes politicians reluctant to accept assurances that if they leave their small party to join a larger one, they will be correspondingly rewarded by the leaders of the larger party.
4.104 Institutions also contribute to the lack of policy-based parties and the difficult investment climate. Constitutional rules give the Office of the President enormous influence over deputies, particularly the near impossibility for deputies of amending the budget proposed by the Office of the President. The constitutionally-prescribed internal governance of the Assembly also limits the influence of deputies.
4.105 Finally, citizens in Benin have limited information about political decision making and how political decisions affect their well-being. This is true for many African democracies, but is a particularly acute problem in Benin. This difference is not entirely explained by lower levels of education in Benin relative to African comparators. Limited efforts by the government to make information widely available are also responsible. An underdeveloped media market, both with respect to radio and newspapers, further limits citizen access to information.
4.106 Some of these underlying political obstacles to reform are difficult to address. For example, societal mistrust or the inability of political entrepreneurs to forge a policy-based party are not susceptible to easy remedies. Changing constitutional provisions to increase legislative incentives to pursue and oversee the implementation of growth-related policies would, but as always needsaa to be approached cautiously and is, in any case, more contentious than modifications of lower level laws. Only the Beninese authorities can decide whether this venue is recommended.

146
4.107 Information, however, offers three entry points where government action can catalyze voter demand for growth. The first is in the collection and dissemination of information, about what decisions are made, what problems they respond to, how they are implemented and what effect they have. Some of these (measuring impact) are more ambitious than others (announcing the policy). Even this last is missing in Benin, however, since it is often unclear to Beninese citizens in general, and even close observers, what decisions governments have made. The ten percentage point increase in primary school funding is relatively unknown; the status of concessions in different areas where government is seeking to encourage greater private sector participation is opaque; the government’s specific legislative plans are unclear. At the same time, there is no regular collection of data regarding implementation – where resources are flowing, what is being built, etc. These types of information are the foundation of government accountability.
4.108 Encouraging media to report on government performance, even (or especially) if those reports are critical, is another way in which government policy can shift in the direction of encouraging public support for growth. Current media coverage of government is criticized for its focus on personalities and their personal misdeeds, well-founded or not. Media everywhere devote space to such issues. However, weak government transparency regarding government commitments and performance and legal and regulatory responses to critical coverage, can be additional factors discouraging media coverage of government performance that transcends the focus on personalities.
4.109 Finally, a serious commitment to education is essential. Uneducated citizens have less access to information and less training in how to process it. Resources are obviously an issue in education, since little learning occurs in classrooms with 100 children. So also is increased attention to quality, ranging from school management reforms that ensure teacher attendance to greater investment and attention to teacher quality.

147
Appendix 1: Methodological Note
Haussman, Rodrik and Velasco (2005) turn to the simplest type of optimal growth model in order to help economists organize their thinking about the binding constraints to economic growth.91 The model assumes that households have perfect foresight and decide how much labor and capital to rent to firms, and how much to save or consume by maximizing utility subject to their budget constraint, i.e.:
∫∞
−−=s
ts dtstzcuU ))(exp()( (1)
subject to:
),,,( tttttt
t kxafnkdt
dkc θ=++ ,92 (2)
where c is consumption per capita, n is population growth, k is capital per worker, a is technological progress, θ is index of externality, x is availability of complementary factors of productions, such as infrastructure or human capital, z is the rate of time preference. Firms maximize profits at each point in time and use the production function f(.) in (2) to produce a single good. In their production function, technology is exogenous, and so are the complementary factors of production and the index of externality. First-order conditions for profit maximization imply that:
)1(),,,( tttttt rkxaf τθ −=′ , (3)
tttttttttt wkxafkkxaf =′− ),,,(),,,( θθ . (4)
The government spending requirements are assumed to be fixed exogenously, the government imposes a tax on the rental price of capital, so the after-tax return to capital is r(1-τ). Maximization of (1), subject to (2), (3) and (4), and carried out by setting up a Hamiltonian results in the following condition:
))1)(,,()(( ρτθσ −−== ttttttt
t
t
t xarcc
c
k
k &
&
, (5)
which holds in the case of balanced growth equilibrium. In this equation, σ is the inverse of the negative of the elasticity of marginal utility, and ρ=z+n is the real interest rate. Equation (5), also known as the Euler equation or Keynes-Ramsey rule, is the starting point for our analysis of binding constraints to growth as it captures many of the most important factors affecting growth of an economy. If ρ is high, for any return on 91 The simplest form of the optimal growth model was developed by Ramsey (1928) to determine optimal level of saving. 92 Although in principle we could allow households to borrow from each other in the aggregate private debt must always be equal to zero, and wealth accumulation is equivalent to capital accumulation.

148 148
investment, investment is low and the economy is considered liquidity constrained. If r is low, for any cost of capital, investment is low and the economy is considered inefficient.

149
Appendix 2: Growth Accounting Technique 93
We assume that aggregate output can be expressed as a function of physical and human capital: Y = AF (K, H),
where Y is gross domestic product in constant 2000 purchasing power parity (PPP) prices; A is an index of total factor productivity; K is gross domestic capital stock in constant 2000 PPP prices; H is human-capital-adjusted labor input, defined as: H = L D P e (фS), where L is population; D is share of population age 15-64; P is labor force participation rate; S is number of years of education per worker; ф is a parameter that measures the returns to education. We consider two types of production functions. The first one is a Cobb-Douglas production function with possibly non-constant returns to scale:
F (K, H) = [Kα x H(1 - α)] γ
where α is a parameter between 0 and 1 that measures the relative importance of capital, and γ is a parameter that measures the extent of returns to scale. Reasonable values of α range from 0.3 to 0.5. If γ=1 (γ > 1) (γ < 1) there are constant (increasing) (decreasing) returns to scale. Reasonable values of γ range from 0.8 to 1.2. The second one is a constant-returns-to-scale constant elasticity of substitution production function:
F (K, H) = [αKρ + (1 - α)H (1 - ρ)] (1/ρ) where ρ = (σ-1)/σ is the elasticity of substitution between K and H. When σ = 1 this reduces to the Cobb-Douglas case above with γ= 1. Reasonable values of σ range from 0.8 to 1.2. To estimate the level and growth rate of A, we require data on Y, K, L, D, P, and S. These are drawn from the following standard sources. Real GDP and gross domestic investment in constant 2000 U.S. dollars adjusted for differences in PPP come from World Bank’s World Development Indicators. Data on population, the share of population aged 15-64, and the labor force participation rate are computed based on data from the World Bank’s SIMA. We assume that the labor force participation rate is an average of the labor force participation rates for females and males. Data on the stock of years of education in 1989 and 1998 are obtained from …. Numbers for the other years were estimated assuming a constant annual growth rate in the human capital stock. The parameter ф, which measures the returns to education (i.e. the percentage increase in worker productivity due to an additional year of education) is assumed to be 10 percent. Capital stocks are constructed using the perpetual inventory method in this worksheet. This requires information on the initial capital-output ratio in 1992, depreciation rates (δ), and gross domestic investment in constant U.S. dollars adjusted for differences in PPP (I). For most developing countries, reasonable values for the initial capital-output ratio range between 1 and 2, and for the depreciation rate are between 0.04 and 0.08. We use initial capital-output ratio of 1 and δ = 0.06 in all calculations. The capital stock is calculated using the following formula:
93 Based on PREMnote 42: Measuring growth in total factor productivity by Swati R. Ghosh and Aart Kraay, August 2000.

150
K (t) = (1 - δ) K (t - 1) + I (t).
Appendix 3: Product Space Definitions
Revealed Comparative Advantage (1)
Uganda has a RCA in coffee when the share of coffee in its total exports is larger than the share of coffee in global exports.
Share of coffee in Uganda’s total exports
Share of coffee in total World Exports
In 2000-04: •Share of coffee in Uganda’s exports=36% RCA in Coffee >1•Share of coffee in World exports= 0.001%
•Uganda’s Share of Fresh Fish Fillet=12% RCA in Fresh Fillet >1•Share of Fresh Fish Fillet in World exports= 0.0004%.
•Share of Fresh Potatoes in Uganda’s exports = 0.0001%•Share of Fresh Potatoes in World exports = 0.0002%. RCA in Potatoes <1

151
Box 1: Defining PRODY – the Income-level of a Product Hausmann, Hwang and Rodrik (2005) define the sophistication of each product in terms of the per capita incomes of the countries that export it. They construct this in steps. First, for each product exported, they calculate the weighted average of the GDP per capita of countries that export that product. The weights denote the revealed comparative advantage of each country that exports that product. In this way, they determine an “income level” for each product, which they call PRODY. “Rich countries export rich country products.” In this sense, the PRODY reflects the incomes of the type of countries that export the product, i.e. their capabilities embodied in all the factors that make them rich countries – technological sophistication, access to markets and capital, human capital etc..
The productivity level associated with product k:
*GDP_j
� Where xjk=Xj , is the value-share of the commodity in the country’s overall export basket. � The denominator aggregates the value-shares across all countries exporting the good � The index represents a weighted average of per-capita GDPs, � Weights are the revealed comparative advantage of each country in good k
Products and their Prody values over time
SITC 2 CODE
Product Description Prody 1980 84
371 Fish,prepared or preserved,n.e.s. i 3035
589 Fruit otherwise prepared or preserv 5869
711 Coffee,whether or not roasted or fr 637
721 Cocoa beans,whole or broken,raw or 582
2320 Natural rubber latex; nat.rubber & 910
2631 Cotton (other than linters),not car 530
2876 Tin ores and concentrates 736
2927 Cut flowers and foliage 2286
3414 Petroleum gases and other gaseous h 4830
6116 Leather of other hides or skins 1063
6672 Diamonds,unwork.cut/otherwise work. 3088
6872 Tin and tin alloys,worked 11974
7764 Electronic microcircuits 11907
8451 Jerseys,pull-overs,twinsets,cardiga 2402
8510 Footwear 4202

152
Box 1A: Defining EXPY – Summation of the PRODYs (weighted) The productivity level associated with a country’s i’s export basket, EXPY, is in turn defined by
This is a weighted average of the PRODY for that country, where the weights are simply the value shares of the products in the country’s total exports. Source: Hausmann, Hwang and Rodrik (2005)
Product Space
Box B: Product Space and Product Densities The construction of our set of tools is based on Hausmann and Klinger (2006) and it has been developed in five steps. The first step is to identify the products on which each country experiences a revealed comparative advantage (RCA). For this, we have calculated the Balassa-RCA Index for each country, commodity and year in our sample. In a given year (t), a country (c) has a revealed comparative advantage in a certain product (i) if the RCA Index is greater than 1. For example, Ghana has a revealed comparative advantage in cocoa because Ghana’s cocoa share in world cocoa exports is greater than Ghana’s share in total world exports.
The second step is quite simple, and it consists in the creation of a categorical variable that identifies those products that have a revealed comparative advantage in each country’s export basket.
In the third step, we construct a measure that can identify revealed distance between products that can avoid any priors we might have as to the root cause of that similarity. Hausmann and Klinger (2006) call it product distance. Product distances (φ) for each pair of products (i,j) are calculated using the minimum of two conditional probabilities: the probability of having RCA in product j, given that countries experience RCA in product i; and the probability of having RCA in product i, given that countries experience RCA in product j.
Distance between a pair of products
With these calculations we can construct a matrix with all the minimum conditional probabilities for each pair of products. This matrix is a representation of the product space. It contains a numerical measure of revealed distance between each pair of products in the classification. In the fourth step we simply add all distances in a matrix-row to obtain a very straightforward measure called Product Path.

153
Product Paths are a fixed measure for every product and they allow us to rank products according to their RCA potential. Because the RCA potential was constructed using conditional probabilities given the condition of having RCA, product path ranks products according to its potential to generate RCA in more products. This is an Export Diversification Potential. For example, the path of cocoa is one of the lowest in all the product classification, meaning that cocoa is not a good product from which a country can diversify and generate RCA in many other products. In the final step, we develop the concept of product density. It is obtained using previously calculated product distances and categorical variables.
The concept of density recognizes that the more one pair of exporting products are related, the stronger the force to create RCA in one, given that the other had already attained it. The figure below presented by Hausmann and Klinger (2006) exemplifies this case. Using all goods without comparative advantage in initial period t, the density around goods also without RCA in t +1 is shown in brown, and those with comparative advantage in t +1 in green. This means that products with higher densities tend more to have revealed comparative advantage in the future. Finally, product densities vary for each year and country.
Density for Jumps into RCA, vs Non-Jumps
Source: Hausmann and Klinger (2006) We must decide which measure of probability to use. Calculating the joint probability that the two goods are exported (i.e ( ) B A P ∩) may appear to be an option, but this measure combines the similarity between two products with the products’ overall presence in global trade. That is, if every single country that

154
exports ostrich eggs also exports ostrich meat, these two goods seem extremely similar to one another. Yet if only three countries in the world export these two goods, then the joint probability for any single country exporting the two would be small, instead of large. We therefore need a measure of the distance that isolates the degree of similarity between the two goods from their overall prevalence in the different countries. The conditional probability P(A|B) would have this characteristic. However, the conditional probability is not a symmetric measure: P(A|B) is not equal to P(B|A). Yet our notion of distance between two goods is symmetric. More importantly, as the number of exporters of any good A falls, the conditional probability of exporting another good given you export A becomes a dummy variable, equal to 1 for every other good exported by that particular country, and 0 otherwise, thus reflecting the peculiarity of the country and not the similarity of the goods. Suppose Australia is the only country in the world that exports ostrich meet. Then all other goods exported by Australia, like minerals or wine would appear to be very close to ostrich meat, when in fact they may be quite different. Hence, for these two reasons we focus on the minimum of the pairs of conditional probabilities going in both directions as an inverse measure of distance: min{P(A|B), P(B|A)}. This formulation would imply that the probability of exporting metal ores given that you export ostrich meat is large, but the probability that you export ostrich meat given that you export metal ores is very low, since Chile, Peru and Zambia do not export ostrich meat but do export metals. If the products were really close together, all countries exporting metal ores would also export ostrich meat, but this is not the case, and our measure captures it. In the robustness checks section of the Appendix we take the directional conditional probabilities, allowing for asymmetric distance, and all results continue to hold.

155
Appendix 4: Detailed Product Matrix
1a: The Classics
RCA_'80-84 =1
Ease of diversification
(density) PATH PRODY
exports 80_84
(in $000s)
shares 80_84
(in 000s)
exports 00_04
(in $000s)
shares 00_04
growth 80-05
RCA_'00-04 =1
Total 0.08 125.4 1072 14044 28.9%
199720 66.5%
Cotton industry
Cotton
fabrics,woven,unbleached 0.08 130.9 2095 367 0.69% 1660.9 0.55% 610%
Cotton seeds * (Sum of
RCA=3) 0.11 85.4 945 629 1.00% 7976.31 2.66% 71%
Cotton (other than linters),not carded 0.13 79.9 530 9195 18.36% 179035.7 59.69% 34%
Oil industry
Oil-cake & other residues 0.08 105.2 3324 1923 5.01% 5873 1.96% 156%
Oil seeds and oleaginous
fruit. n.e.s. 0.08 125.4 1072 1369 2.28% 2914 0.97% 362%
Fishery industry
DT
IS
Crustaceans and molluscs,fresh 0.1 96.1 1856 561 1.57% 2261 0.75% 567%
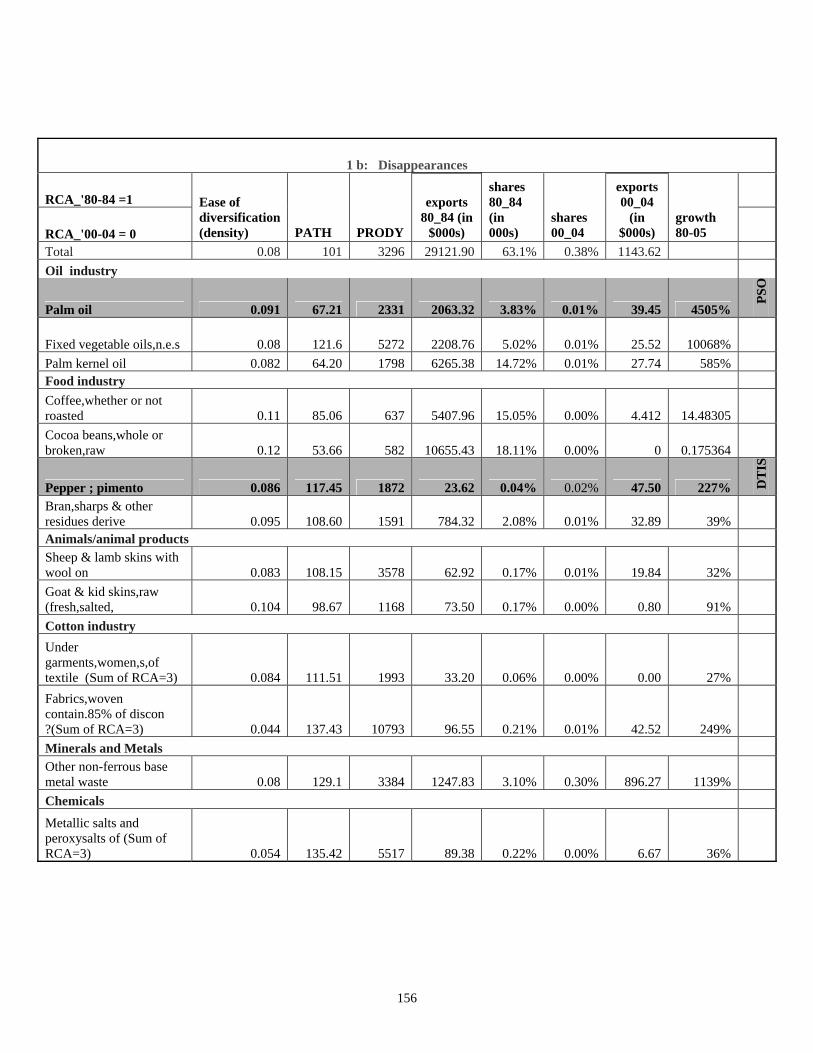
156
1 b: Disappearances
RCA_'80-84 =1
RCA_'00-04 = 0
Ease of diversification (density) PATH PRODY
exports 80_84 (in
$000s)
shares 80_84 (in 000s)
shares 00_04
exports 00_04
(in $000s)
growth 80-05
Total 0.08 101 3296 29121.90 63.1% 0.38% 1143.62
Oil industry
Palm oil 0.091 67.21 2331 2063.32 3.83% 0.01% 39.45 4505%
PSO
Fixed vegetable oils,n.e.s 0.08 121.6 5272 2208.76 5.02% 0.01% 25.52 10068%
Palm kernel oil 0.082 64.20 1798 6265.38 14.72% 0.01% 27.74 585% Food industry
Coffee,whether or not roasted 0.11 85.06 637 5407.96 15.05% 0.00% 4.412 14.48305
Cocoa beans,whole or broken,raw 0.12 53.66 582 10655.43 18.11% 0.00% 0 0.175364
Pepper ; pimento 0.086 117.45 1872 23.62 0.04% 0.02% 47.50 227% DT
IS
Bran,sharps & other residues derive 0.095 108.60 1591 784.32 2.08% 0.01% 32.89 39% Animals/animal products Sheep & lamb skins with wool on 0.083 108.15 3578 62.92 0.17% 0.01% 19.84 32%
Goat & kid skins,raw (fresh,salted, 0.104 98.67 1168 73.50 0.17% 0.00% 0.80 91%
Cotton industry
Under garments,women,s,of textile (Sum of RCA=3) 0.084 111.51 1993 33.20 0.06% 0.00% 0.00 27%
Fabrics,woven contain.85% of discon ?(Sum of RCA=3) 0.044 137.43 10793 96.55 0.21% 0.01% 42.52 249%
Minerals and Metals Other non-ferrous base metal waste 0.08 129.1 3384 1247.83 3.10% 0.30% 896.27 1139%
Chemicals
Metallic salts and peroxysalts of (Sum of RCA=3) 0.054 135.42 5517 89.38 0.22% 0.00% 6.67 36%

157
1 c: Emerging Champions
RCA_'80-84 =0
Ease of diversification (density) PATH PRODY
exports 80_84
(in $000s)
shares 80_84 (in 000s)
exports 00_04
(in $000s)
shares 00_02
growth 80-05
RCA_'01-04 =1 (all years, RCA=1)
Total 0.086 117 3506 1095.58 2.25% 48085 15.8% Food industry
Flours,meals & flakes of potatoes 0.072 134.61 5906 1.66 0.00% 62.87 0.02% 105%
Fruit,fresh or dried, n.e.s. 0.1 116.7 3367 34.78 0.07% 1965.23 0.66% 234%
Edible nuts 0.1 106.5 1301 300 0.79% 24224 8.08% 567%
DT
IS a
nd
PSO
Palm nuts and palm kernels 0.098 82.5 1984 494.38 0.16% 177% Cotton industry
Cotton fabrics,woven,bleach. (Sum of RCA=4) 0.07 140.2 6750 166.42 0.40% 1162.86 0.39% 91%
Cotton seed oil (Sum of RCA 4)
0.082 88.14 1061 11.38 0.04% 1979.83 0.66% 196% Cotton,carded or combed (Sum of RCA=4) 0.08 108.7 1084 2.1 0.01% 2812.54 0.94% 1010%
Cotton waste 0.092 125.39 2057 821.06 0.07% 183%
Chemicals
Soap;organic surface-active product 0.09 129.4 3480 14.11 0.03% 210.138 0.07% 2.186724
Portland cement,ciment fondu (Sum of RCA=4) 0.09 124.1 3676 551.72 0.87% 2574.04 0.86% 219%
Wood industrySawlogs and veneer logs,of non coniferous 0.098 95.65 1092 13.41 0.04% 6808.383 2.27% 202.40%
Other manufactures
Cigarettes 0.068 142.41 9599 4969.683 1.66% 242% Animals/animal products
Leather of other hides or skins 0.091 116.34 1063 8958.92 2.99% 801% Animals,live,n.e.s.,incl. zoo-anima 0.098 104.76 1213 2.18 0.01% 682.013 0.23% 172%
Fishery industry Crustaceans and molluscs,prepared (Sum of RCA=4) 0.07 105.08 17560 17.94 0.04% 510.16 0.26% 1816%
DT
IS

158
(c) The Marginals
RCA_'80-84 =0
Ease of diversification (density) PATH PRODY
exports 80_84
(in $000s)
shares 80_84 (in 000s)
exports 00_04
(in $000s)
shares 00_02
growth 80-05
RCA_'00-04 =0
Total 0.06 141 8758 650 1.87% 10167 3.39%
Metals and aluminum manufactures
Angles,shapes & sections 0.05 167.8 24960 152 0.05% -6.69%
Casks,drums,boxes of iron/steel 0.06 172.2 8501 17 0.02% 128 0.04% 524.18%
Miscellaneous articles of base metals 0.05 189.8 9088 0.89 0.00% 95 0.03% 112.19%
Other manufactures_Machineries
Taps,cocks,valves etc.for pipes 0.03 188.2 15863 3 0.01% 143 0.05% 63%
Other sheets and plates,of iron or 0.06 157.2 14486 0.7 0.00% 54 0.02% 72%
Metal cutting machine-tools 0.03 139.6 13046 0.59 0.00% 130 0.04% 56%
Construction and mining machinery,n 0.04 152.3 9392 499 1.46% 755 0.25% 484%
Paper/Pulp industry
Paper & paperboard,corrugated,crepe 0.06 173.6 11885 93 0.03% 154%
Registers,exercise books,note books 0.07 151.8 5841 0.86 0.00% 122 0.04% 166%
Kraft paper and paperboard,in rolls 0.04 153.9 14123 71 0.02% 288%
Books,pamphlets,maps and globes,pri 0.05 154.6 10495 2 0.01% 476 0.16% 307%
Printed matter,n.e.s. 0.04 167.8 13622 2 0.00% 626 0.21% 607%
Chemicals
Organic chemicals,n.e.s 0.04 123.8 14802 240 0.08% 246%
Albuminoidal substances;glues 0.04 166.9 11789 247 0.08% 154%
Varnishes and lacquers;distempers,w 0.05 167 9791 8 0.02% 326 0.11% 102.75%

159
Appendix 5: Overview of Selected Production Activities
Crops, tubers and their manufactured derivatives
Cashews
1. Cashew nut production in Benin is estimated at around 45 000 tons in 200694, which accounts for approximately 2% of world production95. The main production area is in central Benin. Rising world demand for this product suggests substantial potential gains from this sector as a “cash crop”. The exports of cashew nuts have risen over the last few years, making it the second most important export after cotton96. The majority of the cashew nut production is exported untreated to India for processing. Other main importers of raw or treated produce include North America, Germany, Benelux, and the UK.
Table 1 – Cashew Nut Production and Transformation
2001 2002 2003 2004 2005 2006 Production (‘000 tons) 40 40 40 40 47 41 Treatment (‘000 tons) 0.025 (?)
Source: Faostat for production; Adex for transformation
2. However, despite recent growth in quantitative terms, production capacity remains significantly under potential. Several different factors have undermined this potential. Although the cashew sector has been identified as a priority by the government, innovation-related impediments are significant: these include lack of specific inputs (fertilizers), unavailability of improved seeds, weak or non-existent training of producers in productivity enhancing production techniques, very weak or no quality control of the product. The significantly lower yield for cashew nuts in Benin than in other African countries or the world average (see Figure below), can at least in part be explained by the lack of innovation in the sector.
94 ADEX – Informations brèves sur l’Anacarde 95 FAOSTAT, 2008 96 DTIS p100

160
Figure 6 – Cashew Nut Yield- Benin, Africa, World97
0
0.2
0.4
0.6
0.8
1
1.2
2001 2002 2003 2004 2005 2006
Yield Benin
Yield Africa
Yield World
Source: FAOSTAT, 2008
3. The sector also suffers from institutional and regulatory burdens such as virtually inexistent producer groups, which makes any training difficult but also puts the producers at the disadvantage to negotiate prices with wholesalers; regulation of selling period, which is a serious constraint for transformation as it can lead to problems in supply, but can also lead to increased loss of harvest98; benchmarking of minimum selling price by government authorities, which can also disadvantage transformation companies, as it distorts the selling price. To increase prices received by producers, the government could instead usefully reinforce agriculture producer organizations. 4. Finally, logistics issues also inhibit this sector’s development. There are few storage depots for the nuts at the local level, transport to Cotonou is subject to erratic road controls by officials (which also often ask for payment) 5. In terms of treatment of the raw product, two or three treatment plants exist, aiming at locally treating the nuts and exporting them as a semi-finished or finished product, but comparison to production amount is negligible (see table above). One such example is the treatment plant in Tchaourou99 which opened one year ago as a joint venture between Beninese entrepreneurs and a Dutch firm. This treatment plant has a production chain that enables it to export a semi-finished product mainly to the Netherlands. However, although this is a potential source of added value, there is no action by the government to remove the impediments stated above which adversely adversely affect transformation, to the detriment of exporting the raw product. It would be important for the government support to these nascent firms, as well as to provide sufficient incentives and attractive conditions for the Indo-Pakistani traders to set up shop and also transform the product locally. Reasons for the current reluctance of these firms to embark in such transformation activities need to be further investigated.
97 Caution must be employed when reading yield data, as this can be due to many different factors, natural (climate problems, soil fertility …), logistical (serious post-harvest loss due to lack of adequate storage/transport). 98 A benchmark date for selling is set by the government – transformation industries therefore can have problems securing supplies when they need them. 99 Visited by the mission in Jan 08

161
6. There is also no valorization of the “other” products from the tree: these potentially could include juice from the nut, alcohol, as well as use of the shell for other by-products (including animal feed, as the Indians do). The Tchaourou firm is hoping to upgrade technical production shortly to be able to treat the residue shell, but, as transformation in general, this activity remains completely marginal. 7. To conclude, this sector also suffers from the lack of knowledge of the international market that characterizes many potential diversification candidates. In the case of cashew nuts, this could potentially have quite devastating effects. Indeed, India and Brazil, which combined represent 45% of the world market, are both increasing their production capacity of the nut significantly. It is difficult to imagine that this will not have a strong impact on world prices of the product, which could potentially jeopardize Benin’s production of the raw product. This pleads for an increase in Benin’s capacity to transform the raw product, targeting not only the international market, but also the local and regional market.
Pineapple
8. Benin’s pineapples are exceptional in terms of taste and juiciness, and have gained a certain reputation on the European market. Production for official exports however has been far from satisfying, in view of potential. Informal exports destined mainly to the Nigerian market are where the bulk of production ends up. These informal exports to Nigeria has positive aspects, such as increasing the income of producers and making sure they are able to sell their entire production in a timely manner, without too much post-harvest loss. This rapid export market also overcomes one of the most severe constraints to this product, which is transport. 9. Indeed, for the moment, the only way to export Benin’s pineapples is by air, a costly means. The port of Cotonou is not equipped with sufficient fresh produce storage, and Benin has no capacity to export pineapples by boat, as do other regional competitors, Ghana and Cote d’Ivoire. The informal trade with Nigeria therefore has another “advantage”: it effectively decreases the pressure on the government to look into such infrastructure issues as are raised by the further development of this sector.
Table 2 – Pineapple production and transformation
2001 2002 2003 2004 2005 2006 Production (‘000 tons) 57 87 106 111 121 80
Transformation 1.21 Source: FAOSTAT, 2008
10. Innovation-related constraints are significant for the development of the sector: specific pineapple sector research is quasi inexistent (increasing yields, selecting proper soil fertilizers, better conserving the fresh product, controlling quality, training producers, etc). On a more positive note, the sector’s producers, contrarily to that of cashew nut sector, have organized themselves. This structure would merit reinforcement, along the

162
lines of what has been done in Senegal (PSAOP – see following innovation policy section). 11. The transformation of the product into juice could be a significant source of value-added. Furthermore, were the juice factories to be located close to production sites, this could significantly reduce transport issues, insomuch as juice can be conserved for a longer period of time than can the fresh product. However, pineapple juice production is at a nascent stage. There are a few small transformers, but there are no actions to encourage transformation, such as support in terms of training, fiscal incentives, marketing and export facilitation or encouraging the national fruit juice market through quality control and standards. Packaging, including bottles for the product itself, and boxes to put these into for shipping, also remains a particular handicap for all manufacturing enterprises in Benin.
Palm Oil
12. The palm oil plant is native to the wetlands of Western Africa, and South Benin already hosts many palm plantations. It was the main export crop of country up until the start of the 1970s, but since that time, the production has significantly decreased. Benin currently only produces 40% of its own needs in terms of vegetable oil100. However, the government's is currently planning to identify many thousands of hectares of land as suitable for new palm oil plantations to be grown as an export crop. 3 – 400,000 hectares of land in the humid Southern Benin areas of Ouemé, Plateau, Atlantic, Mono, Couffo and Zou are to be found for extra palm oil plantations. Although strong cultural and cult aspect of palm oil have notably maintained this plant as an important part of Beninese culture,101 it is the race for biofuels that has reached Benin, and is pushing for this significant increase in cultivation. 13. This new “cash crop” could be a significant boon for the economy. It is a sector that could typically attract foreign investors, and indeed, the government has already been approached by Italian, Malaysian, and Brazilian entrepreneurs. However, for the moment nothing has come about of these different contacts. 14. Nonetheless, yields in Benin remain significantly under world or even African average and productivity is clearly a problem. Although the climate in Benin in terms of rainfall is definitely less favorable than in South-East Asia, gains could be most likely be made if irrigation infrastructure investments were made, selection of seedlings and right fertilizers made available, and training of producers reinforced. INRAB, the National Institute for Agriculture Research, has developed and indeed sells palm oil seedlings to South-East Asia. However, this advanced research and technology does not seem to benefit the Beninese economy to a significant extent up to now. 15. It is also regrettable, and contrary to other African countries, that the discussion about biofuels has not sufficiently touched on the idea of meeting national energy 100 MAEP 101 King Gbézo had, in his time, outlawed chopping down of any palm oil tree, and the tree itself is known locally as the “tree of life” and is used notably in many voodoo ceremonies
163
security needs102. This is contrary to Tanzania for example which is currently experimentally using biofuels (jatropha-based) to alleviate rural energy constraints. Also, worryingly, the zones put aside for new plantations host 50% of the country’s population on only 7.7% of the national territory. There seems to be very little discussion or concern for the impacts that this will have on the Beninese and the local food production, particular in view of recent food price increases. Indeed, the plan suggests that agrofuels will be competing with food production in the prime agricultural lands of Benin. This could lead to an increase in food insecurity.
Yams
16. Benin is the world’s fourth yam producer, after Nigeria, Ghana and Cote d’Ivoire103. Yams are Benin’s 2nd crop after cassava in terms of annual tonnage. Even though cotton culture is, in the rural economy of the region, the main source of cash, yam also generates monetary incomes and plays a prominent role in the family diet. Yam is indeed a preferred food and a food security crop in the country. To the contrary of cassava, and sweet potato, one can store yams for periods of up to 4 or even 6 months at ambient temperatures. This characteristic contributes to sustaining the food supply, especially in the difficult (food scarce) period at the start of the wet season.104 The strong regional demand for this product as well as its importance in the staple diet of the Beninese makes it an interesting candidate for diversification. 17. Benin’s yam production has been dynamic in the last decades, with an annual growth rate of around 3%105 and has increased from 530,000 tons in 1961-63 to almost 2,5 million tons in 2006. This expansion is however mainly due to land clearance. Indeed, the cleared areas used for yam culture have increased over the same period, from 61,000 to 196,000 hectares, the average yield varying very little, and even decreasing over the last years. 18. This can point out to a deficit in innovation-related measures. Specific fertilizers and improved seeds are unavailable to local producers, even if the International Institute of Tropical Agriculture (IITA), in Ibadan, Nigeria, has the global research mandate for yams (IITA also have a branch in Benin). 19. Elaborated products such as “farine mickelange” (illustrated above) provide one example of possible transformation. Yams are also often pounded into a thick paste which, after boiling, is eaten with soup as a “poor man’s meal”. They are also processed into flour that is used in the preparation of the paste. There are small enterprises in Benin that have created specific machinery to facilitate this task and increase productivity. This machinery is operated manually, therefore by-passing energy problems. However, the production and diffusion of such simple technology, created locally, is little known and valorized by authorities.
102 Bodjrenou, Nature tropicale. 103 2005. Source : FAOSTAT, http://faostat.fao.org/ 104 http://www.cgiar.org/impact/research/yam.html 105 Faostat, 2008

164
Cotton Processing and Textiles
20. Cotton is Benin’s main export crop. Indeed, cotton represents approximately 40% of Benin’s foreign exchange, 12-13% of GDP, and over 60% of the industrial sector of Benin is cotton treatment106. Also, approximately 37% of fiscal revenue comes from cotton107. In view of its importance in the Beninese economy, this sector is treated in depth in another section of this report. This section would like to rapidly shed light on the potentials and constraints that inhibit the treatment and particularly the processing of the product in Benin. 21. Industrial production mainly consists of cotton ginning and transformation industries. In 2005, the secondary sector108 made a negative contribution to GDP growth. The reasons for the timid and difficult development of the downstream end of the value chain, and notably cotton clothing, mainly arise from the difficulties being experienced upstream. However, some small successes are worth noting. The COTEB Company, although in very serious financial difficulty, has been experimenting with the production of military clothing production, which has encountered success, thanks to a national procurement policy. The company believes this product could have an important regional market. 22. Seeing the difficulties induced by the industrial development of the sector, the government seems to be taking artisanal transformation of cotton as an interesting and viable alternative that it should support109. Indeed, the ethnic textiles niche, in particular targeting the US market through the preferential AGOA agreement, the EU market, and the fair-trade market could be a potential outlet. To support this, locally developed ginning and weaving machines, developed by a laid-off engineer from the COTEB, have been developed and tested. These “machines” could be produced and diffused widely at a local level. They have the added advantage of not needing electricity to function, being driven by mechanical movement. However, as in other sectors, these developments are little known by the authorities and not supported by measures to facilitate contacts with export networks, mobilizing bank credits, etc…
Animal Products
Fish and Fish-Related Products
Fish
23. Fishing represents around 4% of GDP110, but remains a mainly artisanal (self-employment and small-scale) sector that does not cover the country’s own needs. Total fish catch has been stagnating at around 40 000 tons per annum, whereas demand has 106 p18, Plan stratégique de relance du secteur agricole du Bénin – Orientations stratégiques et Plan d’action 107 IMF 108 representing 14.8 % of GDP and 10 per cent of the active population (African Economic outlook) AfDB/OECD 2007 109 Plan stratégique de relance du secteur agricole 110 EIU – Benin Country Profile 2007, page 25
165
increased to over 87 000 tons. Therefore, Benin imports around 45 000 tons of frozen fish per annum111. Some 90,000 people are involved directly in the fishing industry in Benin and it has been estimated that indirectly 350,000 livelihoods depend on the fish industry112. 24. Several specific factors inhibit the development of the fish sector. Among those for maritime fishing can be cited lack of credit guarantees for fishers to buy equipment. Maritime fishing for example is limited to short distances out to sea, most fishing being undertaken on pirogues imported from Ghana. Trawlers, and hence industrial fishing, are quasi inexistent. There is an insufficient government control of maritime boundaries, leading to suspected illegal fishing in Benin’s waters and consequent depletion of fish stocks. Storage facilities for fresh or frozen produce are clearly insufficient. Water pollution of inland waters is also a problem. Refrigerated trucks transporting merchandise are on an erratic and unjustified basis, opened, posing obvious hygiene issues. 25. Aquaculture of Tilapia or other fish, for which research has been undertaken locally and which could be promising, has not been sufficiently exploited on a national level. Also, Benin has over 300km2 of brackish water to be exploited, but research on fish adapted to this context has yet to be developed. For the development of aquaculture, some local initiatives do exist, including training for local potential entrepreneurs provided by the SAIN school farm. However, these remain relatively isolated and small-scale initiatives. 26. The transformation (treatment, packaging) of fish products remains problematic. Fishermen are insufficiently organized in groups, making training particularly difficult. As a consequence, there is a very low level of quality and technical knowledge. Hygiene (quality control) is a serious issue for fish transportation.
Shrimps
27. The shrimp sub-sector is an interesting potential candidate for export diversification that has been identified by the government for priority investments. Shrimp fishing employs approximately 45 000 self-employed fishermen, with around 10 000 persons employed in shrimp-processing plants113. This sector has strong export potential, in particular to the EU114. Indeed, Benin’s shelled shrimp are highly prized in Europe for their juicy taste. Furthermore, Benin is on the list of countries authorized to export shrimps to the EU. 28. However, the country’s exports came to a halt for eighteen months from July 2003 to January 2005 due to hygiene and sanitation reasons. The exports have since
111 P.33 Plan stratégique de relance du secteur agricole 112 http://www.unido.org/en/doc/36765 113 ADEX, September 2007 114 Main export clients are: Belgium, Spain, France, and the Netherlands, as well as Sierra-Leone and Nigeria

166
timidly been re-launched, but a recent survey115 reported that the sub-sector recorded a deficit of 1.6 billion CFA (Euro 2.4 million) following this temporary suspension. 29. This problem directly points out the weakness of government quality control mechanisms: this “voluntary” moratorium was due to lack of government supporting mechanisms, necessary for the development of the private sector on export markets. For shrimps, as well as for many other produce, these included no accreditation body, and the precarious situation of quality and conformity assessment infrastructure that did exist. Testing laboratories did and in part still do not comply with international standards and health and safety regulations. Furthermore, for the regional export market, the premises of a regional harmonization of standards have been launched, but this harmonization project unfortunately does not include Nigeria for the moment, a major importer of Beninese produce. Although different projects from donors such as UNIDO have sought to overcome these issues, a significant further effort is required.
Meat and Meat Products
30. The expansion of domestic meat production is in great part due to local innovations in breeding and feeding techniques. There is significant potential in meat, meat processing and treatment in Benin, not only to satisfy the domestic market, but the potentially large regional market, including Nigeria.
Local Swine
31. This is typically the case of local swine. Benin’s endemic swine is black in color, and has a taste and consistency (marbled meat) that is particularly sought after, not only in Benin but in the whole of West Africa. Following the dilapidation of the region’s non-native swine herds following the African swine fever virus that swept through the region between 1997 and 2000, swine herders, grouped under an association of producers, approached the Faculty of Agronomy of the University of Abomey-Calavi to improve the local swine’s productivity, as well as its resistance to industrial pig-breeding. Indeed, pig breeding techniques had to change radically to adapt to new conditions. Traditionally, local swine were free-run, but because of the now endemic virus, swine should be bred in pens. 32. University was able to respond positively to the demands of producers, and new techniques which significantly increase productivity have been perfected. However, training of producers remains insufficient, and insufficient regulatory mechanisms mean that many producers continue to let the swine run freely, which can increase the spread or render more difficult the eradication of the virus.
Grasscutters
33. The grasscutter is the second biggest wild rodent in Africa. About 40,000 tons grasscutter meat per year is consumed in West Africa of which only 0.2% is provided by domesticated grasscutters. Its meat is greatly appreciated and highly favored in West and Central Africa. In fact, its meat is preferred to the meat of any other kind of domestic 115 http://www.unido.org/en/doc/36765

167
animal or commercially available game. The prices of live-weight grasscutters and meat per kilogram in Benin and in the region are 2 to 4 times higher than that of beef, poultry or other meat. The economic potential of grasscutter meat is high within the region and has an extensive market due to its high demand116. 34. First attempts to domesticate and grow grass cutters began in 1983. These initiatives rapidly received support from German and French cooperation. It took a decade to reach conditions of sustainable production. However, for obscure reasons, the research team and its leader (Prof. Mensah who initiated the firts attempts) was disbanded and the project was disrupted. It took almost a decade before a new impetus was given with the reinstatement of the team into a research and training centre located near the university of Abomey Calavi.. 35. Their domestication, which is a locally developed, researched and tested innovation, is documented, and breeding sites have sprung up in many places over the country (see box below). Due to lack of protection, this knowledge has been transferred at no benefit for Benin, to other countries in the region. However, a significant potential remains for the further development and industrialization of production, transformation and conservation of the meat, for export to the region.
Services
36. Outside agriculture and agro-food diversification, services, which make up over half of Benin’s GDP, are worth further exploring for diversification opportunities. Tourism and health could potentially be good candidates.
Tourism and Culture
37. Tourism is still quite under-developed in Benin, and this albeit some potential which remains to be exploited. Existing cultural, architectural, and natural sites, many a stone’s throw away from the capital, are rife, and are all the more surprising for such a “small” country: Ganvié, named the Venice of Africa, Ouidah with its past deeply rooted in the slave trade, Porto-Novo, Abomey, pristine beaches such as those on “La route des Peches”, voodoo culture... Further a-field, the North of the country also has its own treasures, among which the W Park. 38. Although the current government has made many announcements to develop this sector, which is potentially very intensive in human resources, very little has actually been done to date. The previous government’s initiatives to develop tourism in the mid-90s were confined mostly to the North of the country. However, access to the North of the country remains a serious issue. The only possible way, apart from a very long bus-ride, to get to the North being to hire a military plane, if you are not coming from one of the neighboring countries. 39. Owing to the relatively heavy infrastructure investments necessary, the government should concentrate its effort on the sites close to the capital. For example, the 116 This has been the subject of significant research by CGIAR, in particular by G.A. Mensah

168
landing and road to get to Ganvié from Cotonou are in seriously degraded state. Also problematic to the development of tourism is the erratic energy supply, although this is said to be in course of improvement. 40. Apart from infrastructure, there are other specific factors that inhibit tourism development. The inexistence of fiscal other adapted incentives for tourism promoters or hotels leads to the situation that almost all hotels in Cotonou are in the informal sector. This is a strong disincentive to attract potential FDI in the sector, as most other countries in the region are making efforts to develop the sector and attract foreigners to invest. Another strong binding constraint is land tenure problems, which is a real brake on the development of hotels along the coast. 41. Weak institutional support insomuch as concerns both historical preservation or upgrading of sites is deficient, and efforts would need to be made to remedy this, to prevent degradation of sites, and capacity building of both staff and local population and equal sharing with these populations of the potential gains from tourism. 42. Also, business travel to Cotonou could potentially be scaled-up, in particular for the regional market (UEMOA, Nigeria). Indeed, there are at least two well-placed international conference facilities that are insufficiently exploited, and this is something that could be done relatively rapidly, at relatively little cost. Finally, liberalization of the air transport sector could be a great boost to tourism development.
Health
A pole of competence in health-related activities has developed over time in Benin, notably with the active support of the Belgian cooperation. A school of physiotherapy has taken shape, with diplomas twinned with Belgian faculties, leading to several hundred practitioners, exerting in hospitals as well with a private clientele. Similarly a nursing and midwife school, with certified qualification, has acquired a high reputation with several dozen graduates per year. Support structures to heavily handicapped persons and notably youth have been established in several points on the Beninese territory, and this is an example being emulated in other parts of West Africa. This whole set of health-related competences constitutes an attractive feature of which Benin could usefully build on to host a clientele from the sub-region, including from the rich communities of Nigeria.

169
Appendix 6: Benchmarking Benin’s Innovation Potential
43. This section utilizes the World Bank Institute’s Knowledge Assessment Methodology (KAM). The KAM dataset includes 83 qualitative and quantitative variables and 140 economies that help to benchmark how an economy compares with its neighbors, competitors, or other countries. The KAM helps identify at a glance problems and opportunities that a country faces in making effective use of knowledge and technology for development and where it may need to focus policy attention or future investments and reforms on the 4 Knowledge Economy (KE) pillars: Economic Incentive and Institutional Regime, Education, Innovation, and Information and Communications Technologies. Interestingly, the composite measure of the KAM, called the knowledge economy index (KEI) is a robust indicator of future economic growth117. 44. Using the KAM, the first benchmarking exercise compares Benin with the Africa region (comprising 25 countries118). This first chart (Figure 1) uses the whole world as the yardstick for comparison. The second spider chart, Figure 2, compares Benin with Senegal and Ghana, this time using the 25 African countries as yardstick. Thirdly an over-time comparison measures Benin against other countries in the region and throughout the world over a ten-year period (Figure 3). Finally, Figures 4 and 5 disaggregate Benin’s performance on two of the knowledge economy pillars, innovation and education, comparing it with Ghana, and using the 25 African countries as a yardstick.
Figure 1 - Basic Scorecard for Benin and Africa
Source: KAM 2007
117 Please see numerous empirical publications on this subject, available on the website: www.worldbank.org/wbi/knowledgefordevelopment 118 The following 25 countries from Sub-Saharan Africa are included in the KAM database: Angola, Benin, Botswana, Burkina Faso, Cameroon, Cote d’Ivoire, Eritrea, Ethiopia, Ghana, Kenya, Madagascar, Malawi, Mauritania, Mauritius, Mozambique, Namibia, Nigeria, Senegal, Sierra Leone, South Africa, Sudan, Tanzania, Uganda, Zambia, Zimbabwe.

170
45. Figure 1 paints a preliminary picture of Benin’s strengths and weaknesses in using and applying knowledge with regards to neighbors and regional competitors, using the rest of the world as benchmark. The closer a country is to the outer ring (10), the better that country is doing, relative to other countries. We can therefore see that Benin is on African average for most variables, with the exception of those concerning innovation and education, where Benin is lagging. 46. Figure 2 shows Benin in comparison to Senegal and Ghana, this time benchmarked against the 25 African countries included in the KAM. This second figure shows that Benin is on average doing relatively worse in comparison to both Ghana and Senegal, a notable exception being internet users per 1000 people.
Figure 2. Basic Scorecard for Benin, Ghana and Senegal
Source: KAM 2007
47. Figure 3 shows Benin’s over-time shift on the composite knowledge economy index, which is the average of the performance scores as shown on the basic scorecard. This figure shows that many African countries are clustered at the bottom third of the distribution on the global knowledge economy map, suggesting that these countries could do much more to harness knowledge and innovation for their overall economic and social development. In figure 3, Benin is placed in this bottom third, and is on the line, which means that its position, relative to that of other countries, has not moved over the period. So even if Benin has been making efforts to harness innovation for its development, other countries have been equally doing so.

171
Figure 3 – Benin in an over-time comparison (1995 and most recent)
Source: KAM 2007
48. Figure 4 below disaggregates the composite data to detail different KAM innovation system indicators. As innovation is a very difficult activity to measure/capture, the spider chart below needs to be taken with a grain of salt. It compares Benin with Ghana, benchmarked against Africa as a whole (as Figure 2). As can be seen from the comparison, both countries have very different strengths and weaknesses when it comes to innovation. It would seem that Ghana is much stronger at commercializing its research, whereas Benin remains very “academic”: many royalties from research, but comparatively lower university company collaboration, private sector research, and high-tech/manufactured exports. It would seem, from the data shown, that compared to Ghana in particular, Benin has more difficulty bringing products and ideas to the market.

172
Figure 4 – Benin and Ghana: Innovation Indicators (Africa benchmark)
Source: KAM 2007
49. Finally, Figure 5 below details Benin’s different education system indicators. These point to a very low adult literacy rate, as well as different other indicators which are weak, in comparison to other African countries. This is particularly worrying for the future of the country, as education and training are the basis for creating a population receptive to new technologies. Training statistics included may however not entirely reflect the reality on the field, as much of professional and vocational training is undertaken in the informal sector (see details in policy section below), which is, by definition, not captured in official statistics. This can be seen as in strong comparison to Ghana, which has an overall much stronger education system, as measured by these indicators, as compared to Benin.
Figure 5 – Benin and Ghana: Education Indicators (Africa Benchmark)
Source: KAM 2007

173
REFERENCES
A. D. Ex. (Association de développement des exportations). 2005. Etude de la compétitivité de l’économie béninoise – Rapport provisoire.
AFD. 2006. La formation professionnelle en secteur informel – Rapport sur l’enquête terrain au Bénin.
AfDB/OECD. 2007. African Economic Outlook.
Agence Française de Développement (AFD) « Etude sur la Situation de la Filière Cotonnière, Rapport Définitif », March 2004.
AIC, « Rapport d’Evaluation de l’Accord Cadre entre l’Etat et l’Interprofession, » March, 2007.
Aubert, Jean-Eric, André Kircheberger, Bruno Poisson, Justine White. Forthcoming. « Le Sénégal et l’économie de la connaissance - Eléments pour un nouveau modèle de développement.” World Bank Institute Working Paper. Washington, DC: World Bank.
Aubert, Jean-Eric. 2005. “Promoting Innovation in Developing Countries – A Conceptual Framework.” World Bank Policy Research Working Paper 3554. Washington, DC: World Bank.
Badiane, Ousmane, Dhaneshwar Ghura, Louis Goreux, and Paul Masson, “Cotton Sector Strategies in West and Central Africa,” World Bank Policy Research Working Paper 2867, July 2002.
Baffes, John, « The Cotton Problem, » World Bank Research Observer 20, 2004.
Banerjee, S., Wodon, Q., Diallo, A., Pushak, T. Uddin, H., Tsimpo, C. and Foster, V., 2008 Access Affordability and Alternatives: Modern Infrastructure Services in Sub-Saharan Africa, Africa Infrastructure Country Diagnostic.
Banque de France. 2006. Rapports annuels de la Zone franc.
Barabási A.-L., R. Hausmann, C. Hidalgo C and B. Klinger. (2007). The Product Space Conditions the Development of Nations. Science 317 (5837):482-487.
Barro, Robert J. and Jong-Wha Lee. (2001) “International Data on Educational Attainment: Updates and Implications.” Oxford Economic Papers 2001; 53: 541-563.
Beck, Thorsten, George Clarke, Alberto Groff, Philip Keefer and Patrick Walsh (2001). “New Tools in Comparative Political Economy: The Database of Political Institutions." World Bank Economic Review, 15: 1, 165-176.
Bénin Development Strategic Orientations (2007-2011).

174
Bleaney and Greenaway (2001). "The impact of terms of trade and real exchange rate volatility on investment and growth in sub-Saharan Africa," Journal of Development Economics, vol. 65(2).
Bodjrenou, Josea Doussou. “Biofuel case study: BENIN,” in Agrofuels in Africa –The impacts on land, food and forests, African Biodiversity Network, July 2007.
Bratton, Michael (2007). “Are You Being Served? Popular Satisfaction with Health and Education Services in Africa.” Afrobarometer Working Paper No. 65 (January).
Chen, Derek H. C., Carl J. Dahlman. 2005. “The Knowledge Economy, the KAM Methodology and World Bank Operations. World Bank Institute Working Paper. Washington, DC.
Chen, Derek H. C., Hiau Looi Kee. 2005. “A Model on Knowledge and Endogenous Growth” World Bank Policy Research Working Paper 3539. Washington, DC: World Bank.
Chen, Derek H. C., Kishore Gawande. 2007. “Underlying Dimensions of Knowledge Assessment: Factor Analysis of the Knowledge Assessment Methodology Data.” World Bank Policy Research Working Paper 4216. Washington, DC: World Bank.
Chen, Derek H.C., Carl J. Dahlman. 2004. “Knowledge and Development: A cross section approach.” World Bank Policy Research Working Paper 3366. Washington, DC.
Collier, P. (1998). “Globalization: Implications for Africa,” in Iqbal, Z. and Khan, M. (eds), Trade Reform and Regional Integration in Africa, IMF, Washington, D.C.
Collier, P. (2002). “Primary Commodity Dependence and Africa’s Future.” World Bank, April.
Collier, P. and A. J. Venables (January 2007). “Trade preferences and manufacturing export response: lessons from theory and policy,” Mimeo.
Collier, P. and J. Gunning (1999). “Explaining African Economic Performance,” Journal of Economic Literature, vol. XXXVII, pp. 62-111.
Comparative Advantage in the Product Space,” Center for International Development, Harvard University.
Conseil des Investisseurs Privés du Bénin (CIPB), « Etude Monographique sur le Coton, » February 2008.
Dollar D. (1992) “Outward Oriented Developing Countries Really Do Grow More Rapidly:
Dunn, Elizabeth et al. Upgrading in Value Chains: A Synthesis Paper. MicroReport # 71. 2007 www.microlinks.org.
Economic and Social Commission for Asia and the Pacific (2004). “Export diversification and economic growth: the experience of selected least developed countries,” United Nations, New York, Development Papers, No. 24.

175
Economist Intelligence Unit. 2007. Country Profile: Bénin. London: Economist Intelligence Unit http://www.eiu.com/schedule.
Eifert, B., A. Gelb and V. Ramachandran.(2005).“Business Environment and Comparative Advantage in Africa: Evidence from the Investment Climate Data,” CGD Working Paper 56.
Evidence from 95 LDCs, 1976-85 Economic Development and Cultural Change 40 (3): 523-44.
Fafchamps, Marcel, Market Institutions in Sub-Saharan Africa (Cambridge: MIT Press), 2004.
FAOSTAT, www.faostat.fao.org
Ferejohn, John (1986). “Incumbent performance and electoral control.” Public Choice 50: 5-26.
Galtier, Franck and Zakari Tassou, « La Re-exportation : Vice ou Vertu ? Le Commerce du Bénin vers le Nigeria, » in Echanges Transfrontaliers et Intégration en Afrique Subsaharienne, edited by Johnny Egg and Javier Herrera (Orstrom), 1998.
Gautier, J.-F. 2000. Reformes douanières au Bénin et libéralisation commerciale du Nigeria – Un modèle ECG avec concurrence imparfaite appliquée au commerce transfrontalier .” Document de travail DIAL
Ghosh, Atish R. and Jonathan D. Ostry (1994), "Export Instability and the External Balance in Developing Countries,” IMF Staff Papers 41 no. 2. .
Ghosh, S., and Kraay A. (2000) “Measuring Growth in Total Factor Productivity,” PREM Note No.42, Economic Policy Unit, September.
Habiyaremye, A. and T. Ziesemer (2006). “Absorptive Capacity and export diversification in SSA countries,” UNU – UNU MERIT, Working Paper Series, No. 2006-030.
Hashim, Yahaya and Kate Meagher, Cross-Border Trade and the Parallel Currency Market—Trade and Finance in the Context of Structural Adjustment, Nordiska Afrikainstitutet Research Report No. 113 (Uppsala), 1999.
Hausmann, R. and B. Klinger (2007), “Structural Transformation and Patterns of Comparative Advantage in the Product Space,
Hausmann, R. and D. Rodrik. (2003). “Economic development as self-discovery.” Journal of Development Economics. 72: 603-633.
Hausmann, R. and Rodrik D. (2003) ‘Economic Development as Self-Discovery,’ Journal of Development Economics 72, December.
Hausmann, R., D. Rodrik, and A. Velasco (2005) “Growth Diagnostics,” mimeo.
Hausmann, R., J. Hwang and D. Rodrik. (2007). “What you export matters,”Journal of Economic Growth, Vol. 12 (1), pp 1- 25.
Hausmann, R., Rodrik, D. and Velasco, A. (2005) “Growth Diagnostics,” mimeo.

176
Hesse, H. (2006) “Export Diversification and Economic Growth,” background paper for the Growth Commission.
Honlonkou, A. (2002) “Evaluation de la performance de remboursement dans les institutions de micro-finance au Bénin,” Mondes en développement No. 199 : la microfinance et l’evolution des sustemes financiers. Tome 30.
Ianchovichina, E. and Kacker P. (2005) “Growth Trends in the Developing World: Country Forecasts and Determinants,” Policy Research Working Paper No. 3775, World Bank, Washington DC.
ICAC – Cotton World Statistics – Bulletin of the International Cotton Advisory Committee.
Igué, J. and Soulé, B. (1992) L’etat-entrepôt au Bénin: commerce informel ou solution résponse a la crise? Karthala, Paris, France.
Igué, John O. and Biou Goura Soulé, L’Etat Entrepôt au Bénin: Commerce Informel ou Réponse à la Crise? (Karthala : Paris), 1992.
Imbs, J. and R. Wacziarg. (2003) Stages of Diversification. American Economic Review, Vol. 93 (1), pp. 63-86.
International Monetary Fund (2004) Bénin: Selected Issues and Statistical Appendix.
International Monetary Fund (2005) Nigeria: Selected Issues and Statistical Appendix, Country Report 05/203, August.
International Monetary Fund (2008) Bénin: Selected Issues and Statistical Appendix.
Kaufmann, D., Kraay, A. and Mastruzzi, M. (2007) Governance Matters VI: Governance Indicators for 1996-2006.
Keefer, Philip (2007a). “Clientelism, credibility and the policy choices of young democracies.” American Journal of Political Science 51:4, 804-821 (October).
Keefer, Philip (2007b). “Elections, special interests and financial crisis.” International Organization 61(3): 607-642 (Summer).
(2003). “Presidentialism and clientelism in Africa’s emerging market systems.” Journal of Modern African Studies 41:2, 297-321.
Keefer, Philip (2007c). "The resilience of clientelism and the political economy of growth-supporting policies in Ghana." Background paper for the 2007 Ghana Country Economic Memorandum.
Keefer, Philip and Razvan Vlaicu (2006). “Democracy, Credibility and Clientelism.” World Bank Policy Research Working Paper 3594.
Keefer, Philip and Stuti Khemani (2005). “Democracy, Public Expenditures, and the Poor: Understanding Political Incentives for Providing Public Services.” The World Bank Research Observer 20:1 (Spring), 1-28.
Knowledge Assessment Methodology: http://www.worldbank.org/kam
Knowledge for Development program: www.worldbank. http://www.worldbank.org/ wbi/knowledgefordevelopment

177
Labaste, Patrick, David Tchirley, Julie Dana, Colin Poulton, John Baffes, Duncan Boughton, Nicolas Gergely, Gerald Estur, Christophe Ravry, “Comparative Analysis of Organization and Performance of African Cotton Sectors,” World Bank, unpublished draft , September 2007.
Lall, S. (1992). "Technological capabilities and Industrialization.” World Development, 20(2): 165-186.
Lall, S. (1998). “Exports of manufactures by developing countries: Emerging patterns of trade and location.” Oxford Review of Economic Policy. 14(2): 54-73.
Lall, S. (2000). “The technological structure and performance of developing country manufactured exports, 1985-1998.” Oxford Development Studies. 28(3): 337-369.
Lall, Sanjaya, John Weiss, and Jinkang Zhang. 2006. “The ‘Sophistication’ of Exports: A New Measure of Product Characteristics,” LARES, 1997.
Leamer, E.E. (1984). Sources of Comparative Advantage: Theory and Evidence. Cambridge MA: MIT Press.
Lederman, D. and W. F. Maloney (2007) ‘Trade Structure and Growth,’ in Natural Resources: Neither Curse Nor Destiny (eds.) D. Lederman and T.N. Srinivasan, Stanford University Press, Palo Alto.
Louis Goreux (2003) “Reforming the Cotton Sector in Sub-Saharan Africa,” Africa Region Working Paper Series, No. 62, World Bank.
Maldonado, C. (1993) “Building networks: An experiment in support to small urban producers in Bénin” International Labour Review 132(2).
Mayer (2003). “The fallacy of composition: a review of the literature.” Institute of Development Studies and United Nations Conference on Trade and Development, study No.166.
Mensah, G.A., A.M. Okeyo. Continued harvest of the diverse African Animal Genetic Resources from the wild through domestication as a strategy for sustainable use: A case of the larger Grass cutter (Thryonomys swinderianus).
Ministère de l’Agriculture, de l’Elevage et de la Peche, “Evaluation des Reformes Opérées dans le Secteur Agricole au Cours des 25 Dernieres Années: Cas de la Reforme de la Filière Coton, » Novembre 2007.
Morillon, V. and S. Afouda (2005). ‘Le Trafic Illicite des Produits Pétroliers Entre le Bénin et Nigeria,’ Economie Régionale (LARES), September.
Morillon, Virginie and Servais Afouda, « Le Trafic Illicite des Produits Pétroliers Entre le Bénin et Nigeria, » Economie Régionale (LARES), September 2005.
Mytelka, Lynn K. 2000. “Local Systems of Innovation in a Globalized World Economy.” Industry and Innovation 7 (1): 15-32.
Ng and A. Yeats (2002), “What can Africa expect from its traditional exports?” Africa Region Working Paper Series, No 26, The World Bank.

178
North, Douglass, “Institutions and Economic Growth: An Historical Introduction,” World Development 17, 1989.
Oyelaran-Oyeyinka, Banji, Padmashree Gehl Sampath. 2007. “Innovation in African Development – Case studies of Uganda, Tanzania, and Kenya.” Unpublished paper. http://info.worldbank.org/etools/docs/library/239730/InnovationInAfrica FinalPaper.pdf
Partenariat pour le développement municipal. 2007. Etude ECOLOC dans six communes du département du Borgou : Nikki, Kalale, N’Dali, Perere, Tchaourou et Parakou.
Perret, C. (2002) ‘Le Commerce de Véhicules d’Occasion au Bénin : Problématique Régionale et Aspects Nationaux,’ Economie Régionale (LARES), October.
Perret, C., « Le Commerce de Véhicules d’Occasion au Bénin : Problématique Régionale et Aspects Nationaux, » Economie Régionale (LARES), October 2002.
Poulton, Colin, Peter Gibbon, Benjamine Hanyani-Mlambo, Jonathan Kydd, Wilbald Maro, Marianne Nyulansted Larsen, Afonso Osorio, David Tschirley and Balard Zulu, “Competition and Coordination in Liberalized African Cotton Market Systems,” World Development 32 (3), 2004.
Ramsey, F. (1928) “A Mathematical Theory of Saving” Economic Journal 38, No. 152, 543-559. Reprinted in Stiglitz and Uzawa, eds., Readings in Modern Theory of Economic Growth, MIT Press, 1969.
Rodríguez, Francisco, and Dani Rodrik. (1999). “Trade Policy and Economic Growth: A Skeptic's Guide to the Cross-National Literature.” NBER Working Paper 7081.
Rodrik, D. (2004). “Industrial Policy for the Twenty-First Century.” CEPR Discussion Papers 4767, C.E.P.R. Discussion Papers.
Rodrik, D. (2004a) “Why We Learn Nothing from Regressing Economic Growth on Policies?” Cambridge MA: Harvard Univesity, pp. 1-14.
Rodrik, D. (2004b) “Industrial Policy for the Twenty-first Century,” manuscript, Harvard University.
Rodrik, D. (2006). “What’s So Special About China’s Exports,” NBER Working Paper Series, No. 11947.
S. Le Faou, « Les Exportations de Produits Manufacturés du Nigeria Vers le Bénin, » Economie Régionale (LARES), 2001.
Sachs, J., and A.Warner, (1995). “Natural Resource Abundance and Economic Growth.”, in G. Meier and J. Rauch (eds), Leading Issues in Economic Development, New York: Oxford University Press.
SAIN (Solidarités Agricoles Intégrées): www.sain.edu.tf
Schéma Directeur du Développement Agricole Rural (SDDR),
Soulé, B. (2004) “La Dynamique Régionale” Economie Régionale (LARES).
Soulé, Bio Goura, « La Dynamique Régionale » Economie Régionale (LARES), April 2004.

179
Spielman, David J., Regina Birner. 2007. “How innovative is your agriculture? Using innovation indicators and benchmarks to strengthen national agricultural research systems.” World Bank trade measure. World Development (U.K.) 34, No. 2:222-37.
United Nations (?) Human Development Report, UNDP.
USAID, Mali value chain finance study. 2007.
Utz, Anuja. 2006. “Fostering innovation, productivity, and technological change – Tanzania in the Knowledge Economy.” World Bank Institute Working Paper. Washington, DC.
Van de Walle, Nicolas (2001). African Economies and the Politics of Permanent Crisis, 1979-1999. New York: Cambridge University Press.
Wangwe, S. (ed.), (1995). Exporting Africa: Trade, Industrialisation and Technology in Africa. UNU-INTECH, Routledge Publications.
Wood, Adrian, Jörg Mayer, African Development in a Comparative Perspective (Project), and United Nations Conference on Trade and Development. 1998. Africa's export structure in a comparative perspective. Geneva: United Nations.
World Bank (1999). Korea Economic Memorandum, East Asia and Pacific Region, the World Bank.
World Bank (2003). Bénin Poverty Assessment, Report No. 28447-BEN., Africa Region, the World Bank.
World Bank (2003). Country Assistance Strategy for the Republic of Bénin, World Bank, Washington DC.
World Bank (2004). Benin Poverty and Social Impact Analysis, World Bank, Washington DC.
World Bank (2004). Benin Financial Sector Review, Report No. 33440-BJ, Financial Sector Unit, the World Bank.
World Bank (2004). Benin Public Expenditure Review, the World Bank.
World Bank (2005). Benin Poverty Reduction Strategy Credit, World Bank, Washington DC.
World Bank (2005). Benin: Une évaluation du Climat des Investissements, World Bank, Washington DC.
World Bank (2005a). Benin Diagnostic Trade Integration Study, the World Bank, December 18.
World Bank (2005b) Benin Investment Climate Assessment, Africa Region, the World Bank, November.
World Bank (2005c) Bolivia Country Economic Memorandum, Latin America and the Caribbean Region, the World Bank.
World Bank (2006). Evaluation du Climat des Investissements dans les Zones Rurales du Bénin – Note conceptuelle.

180
World Bank (2007) Mongolia Country Economic Memorandum, East Asia and Pacific Region, the World Bank.
World Bank (2007). Bénin Concept Note, World Bank, Washington DC.
World Bank (2008) Doing Business 2008, the World Bank.
World Bank (2008). Africa Development Indicators 2007.
World Trade Organization (2005) Nigeria Trade Policy Review.


ZouZou
CouffoCouffo
Ouémé
OuéméM
onoM
ono
SotaSota
Tassi
néTa
ssiné
Okp
ara
Okp
ara
Alp
ouro
Alp
ouro
Mék
rou
Mék
rou
AliboriAlibori
Mékro
u
Mékro
u
Panja
riPa
njari
NIGER RIVER
NIGER RIVER
BIGHT OF BENINBIGHT OF BENIN
LakeLakeVoltaVolta
LakeLakeKainjiKainji
OOuuéémm
éé
M O N OM O N O
COUFFOCOUFFO
B O R G O UB O R G O U
A L I B O R IA L I B O R I
ATA K O R AATA K O R A
C O L L I N E SC O L L I N E S
D O N G AD O N G A
Z O UZ O U
ATLANTIQUEATLANTIQUE
LITTORALLITTORAL
OU
EME
OU
EME
PLATEAUPLATEAU
PobéPobé
BohiconBohicon
AplahouéAplahoué
CovéCové
MalanvilleMalanville
Dassa-Dassa-ZouméZoumé
BembérékéBembéréké
AbomeyAbomey
CotonouCotonou
SakétéSakété
LokossaLokossa
DogboDogbo
ParakouParakou
NatitingouNatitingou
KandiKandi
OuidahOuidah
SavalouSavalou
DjougouDjougou
PORTO NOVOPORTO NOVO
AAtt aa kk oo rr aa MM
oo uu nn tt aa ii nn ss
M O N O
COUFFO
B O R G O U
A L I B O R I
ATA K O R A
C O L L I N E S
D O N G A
Z O U
ATLANTIQUE
LITTORAL
OU
EME
PLATEAU
Pobé
Bohicon
Aplahoué
Cové
Malanville
Dassa-Zoumé
Bembéréké
Abomey
Cotonou
Sakété
Lokossa
Dogbo
Parakou
Natitingou
Kandi
Ouidah
Savalou
Djougou
PORTO NOVO
TOGO
GHANA
NIGERIA
NIGER
BURKINAFASO
Zou
CouffoOuémé
Mono
Sota
Tassi
né
Okp
ara
Alp
ouro
Pendjari
Mék
rou
Alibori
Mékro
u
Panja
ri
NIGER RIVER
BIGHT OF BENIN
LakeVolta
LakeKainji
Koumongou Oué
mé
Gulf of Guinea
At a k o r a M
o u n t a i n s
To Dapaong
To Sokoto
To Dosso
To Kaiama
To Kabou
To Lomé
To Notsé
To Ibadan
0
0
1E
1E
2E
2E
3E
1E
3E 4E
7N
8N 8N
7N
9N 9N
10N 10N
11N 11N
12N
BENIN
This map was produced by the Map Design Unit of The World Bank. The boundaries, colors, denominations and any other informationshown on this map do not imply, on the part of The World BankGroup, any judgment on the legal status of any territory, or anyendorsement or acceptance of such boundaries.
0 604020 80
0 20 40 60 Miles
100 Kilometers
IBRD 33372
DECEMBER 2005
BENINSELECTED CITIES AND TOWNS
DEPARTMENT CAPITALS
NATIONAL CAPITAL
RIVERS
MAIN ROADS
RAILROADS
DEPARTMENT BOUNDARIES
INTERNATIONAL BOUNDARIES