Report Card on British Columbia's Secondary Schools 2018 · 2018-06-18 · 3 The Report Card on...
44
Education Policy Studies in Report Card on British Columbia’s Secondary Schools 2018 by Peter Cowley and Stephen Easton COMPARESchoolRankings.ORG FRASER INSTITUTE
Transcript of Report Card on British Columbia's Secondary Schools 2018 · 2018-06-18 · 3 The Report Card on...

Education PolicyStudies in
Report Card on British Columbia’s
Secondary Schools 2018
by Peter Cowley and Stephen Easton
COMPARESchoolRankings.ORG
FRASERINST I TUTE


Report Card on British Columbia’s Secondary Schools 2018
By Peter Cowley and Stephen Easton
2
Contents
Introduction / 3
Key academic indicators of school performance / 5
Other indicators of school performance / 9
Detailed school reports / 10
How does your school stack up? / 32
Appendix: Calculating the Overall rating out of 10 / 36
About the Authors / 38
Publishing information / 39
Supporting the Fraser Institute / 40
Purpose, funding, & independence / 40
About the Fraser Institute / 41
Editorial Board / 42
3
The Report Card on British Columbia’s Secondary Schools collects a variety of relevant, objective indica-tors of school performance into one easily accessible, public document so that all interested parties—par-ents, school administrators, teachers, students, and taxpayers—can analyze and compare the perfor-mance of individual schools. Parents use the Report Card ’s indicator values, ratings, and rankings to com-pare schools when they choose an education provider for their children. Parents and school administrators use the results to identify areas of academic perfor-mance in which improvement can be made.
The Report Card helps parents choose
Where parents can choose among several schools for their children, the Report Card provides a valu-able tool for making a decision. Because it makes comparisons easy, the Report Card alerts parents to those nearby schools that appear to have more effec-tive academic programs. Parents can also determine whether schools of interest are improving over time. By first studying the Report Card, parents will be better prepared to ask relevant questions when they interview the principal and teachers at the schools under consideration.
Of course, the choice of a school should not be made solely on the basis of any one source of infor-mation. Families choosing a school for their students should seek to confirm the Report Card ’s findings by visiting the school and interviewing teachers and school administrators. Parents who already have a child enrolled at the school can provide another point of view. Useful information may also be found on the
web sites of the ministry of education, local school boards, and individual schools. In addition, a sound academic program should be complemented by effec-tive programs in areas of school activity not measured by the Report Card. Nevertheless, the Report Card provides a detailed picture of each school that is not easily available elsewhere.
The Report Card facilitates school improvement
Certainly, the act of publicly rating and ranking schools attracts attention; attention can provide motivation. Schools that perform well or show consis-tent improvement are applauded. Poorly performing schools generate concern, as do those whose per-formance is deteriorating. This inevitable attention provides an incentive for all those connected with a school to focus on student results.
However, the Report Card offers more than moti-vation; it also offers opportunity. The Report Card includes a variety of indicators, each of which reports results for an aspect of school performance that might be improved. School administrators who are dedicat-ed to improvement accept the Report Card as another source of opportunities for improvement.
Some schools do better than othersTo improve a school, one must believe that improve-ment is achievable. This Report Card provides evidence about what can be accomplished. It demonstrates clearly that, even when we take into account students’ characteristics, which some believe dictate the degree of academic success that students will have in school, some schools do better than others. This finding
Introduction

Report Card on British Columbia’s Secondary Schools 20184
confirms the results of research carried out in other countries.1 Indeed, it will come as no great surprise to experienced parents and educators that the data consistently suggest that what goes on in the schools makes a difference to academic results and that some schools make more of a difference than others.
Comparisons are at the heart of the improvement processComparative and historical data enable parents and school administrators to gauge their school’s effec-tiveness more accurately. By comparing a school’s latest results with those of earlier years, they can see if the school is improving. By comparing a school’s results with those of neighbouring schools and of schools with similar student characteristics, they can identify more successful schools and learn from them. Reference to overall provincial results places an individual school’s level of achievement in a broader context.
There is great benefit in identifying schools that are particularly effective. By studying the techniques used in schools where students are successful, less effective schools may find ways to improve.
Comparisons are at the heart of improvement: making comparisons among schools is made simpler and more meaningful by the Report Card ’s indicators, ratings, and rankings.
You can contribute to the Report Card’s development
The Report Card program benefits from the input of interested parties. We welcome your suggestions, comments, and criticisms.
Please contact Peter Cowley, Director of School Performance Studies, at [email protected].
Notes
1 See, for instance, Michael Rutter et al., Fifteen Thousand Hours: Secondary Schools and Their Effects on Children (Harvard University Press, 1979); Peter Mortimore et al., School Matters: The Junior Years (Open Books, 1988).
5
Key academic indicators of school performance
The foundation of the Report Card is an overall rating of each school’s academic performance. Building on data about student results provided by the Ministry of Education,1 we rate each school on a scale from zero to 10. We base our overall rating of each school’s academic performance on seven indicators:
(1) the average exam mark in the grade-12 language arts courses that include a mandatory provincial exam;
(2) the percentage of grade-12 language arts mandatory provincial examinations failed;
(3) the average difference between the school mark and the examination mark in the courses considered in (1) and (2) above;
(4) the average difference between male and female students in their exam mark in in the school’s most popular grade-12 language arts course;
(5) the graduation rate;
(6) the delayed advancement rate.
We have selected this set of indicators because they provide systematic insight into a school’s performance. Because they are based on annually generated data, we can assess not only each school’s performance in a year but also its improvement or deterioration over time.
Three indicators of effective teaching
1 Average mandatory examination marksThis indicator (in the tables Average exam mark) is
the average mark achieved by a school’s students on the grade-12 final examinations in language arts.2 For each school, the indicator is the average of the mean scores achieved by the school’s students in each of these mandatory examinations at all sittings during the year, weighted by the relative number of students who wrote the examination.
Examinations are designed to achieve a distribu-tion of results reflecting the differences in students’ mastery of the course work. Differences among students in interests, abilities, motivation, and work-habits will inevitably have some impact upon the final results. There are, however, recognizable differences from school to school within a district in the average results on the provincial examinations. Such differ-ences in outcomes cannot be wholly explained by the individual and family characteristics of the school’s students. It seems reasonable, therefore, to include the average examination mark for each school as one indicator of effective teaching.
2 Percentage of provincial examinations failed
For each school, this indicator (in the tables Percentage of exams failed) provides the rate of failure (as a per-centage) in the grade-12 language arts mandatory provincial examinations. It was derived by dividing the sum, for each school, of all the mandatory provin-cial examinations written where a failing grade was awarded by the total number of such examinations written by the students of that school.
In part, effective teaching can be measured by the ability of the students to pass any uniform examina-tion that is a requirement for successful completion of a course. Schools have the responsibility of preparing their students to pass these final examinations.
Report Card on British Columbia’s Secondary Schools 20186
3 Difference between school mark and examination mark
For each school, this indicator (in the tables School vs exam mark difference) gives the average amount (for all grade-12 language arts courses with a mandatory provincial exam) by which the “school” mark—the assessment of each student’s learning that is made by the school—exceeds the exam mark in that course.3
Effective teaching includes regular testing so that students may be aware of their progress. For such assessment to be useful, it must accurately reflect the student’s understanding of the course. As a system-atic policy, inflation of school-awarded grades will be counterproductive. Students who believe they are already successful when they are not will be less likely to invest the extra effort needed to master the course material. In the end, they will be poorer for not hav-ing achieved the level of understanding that they could have gained through additional study.
The effectiveness of school-based assessments can be determined by a comparison to external assessments of the students. In each course that includes a mandatory provincial examination, the Ministry of Education, the same authority that designed the course, administers a uniform examination. This examination will test the students’ knowledge of the material contained in the course. If the marks assigned by the school are a reason-ably accurate reflection of students’ understanding, they should be roughly the same as the mark gained on the provincial examination. Thus, if a school has accurately assessed a student as consistently working at a C+ level, the student’s examination result will be at a similar level. If, however, a school is consistently granting marks sub-stantially higher than those achieved by its students on the final examinations, then the school is not providing an accurate indicator of the extent to which knowledge of the course material is being acquired.
An indicator of consistency in teaching and assessment
The Gender gap indicatorsResearch4 has shown systematic sex-based differences
in academic results in British Columbia’s secondary schools. However, the same research found that “there appears to be no compelling evidence that girls and boys should, given effective teaching and counsel-ling, experience differential rates of success.” 5 Further,
“[t]he differences described by each indicator vary from school to school over a considerable range of values.” 6
The Gender gap indicator measures the difference, if any, in that grade-12 language arts exam most writ-ten at the school. The indicator reports the size of the difference and the more successful sex.
Two indicators of practical, well-informed counselling
While they are attending secondary school, students must make a number of decisions of considerable significance about their education. Once they have reached the age of 16, for instance, they are at liberty to continue or end their educational program.7 Before grade 10, they are required to choose between dif-ferent streams in Mathematics. They will annually decide whether to begin or continue the study of a second language.
Will these young people make good decisions? It is unrealistic to presume that they can do so without advice. What practical, well-informed counselling can they call upon? While parents, in the main, are willing to help, many lack the information they need to be able to provide good advice. It falls, therefore, to the schools to shoulder some responsibility for advising students and their parents about educational choices.
The final two indicators used in the calculation of the Overall rating out of 10 assess the counsel given by the schools by measuring the quality of the decisions taken by the students about their educa-tion. Of course, wise students will seek guidance not only from the counsellors designated by the schools but also from teachers and administrators, parents, and other relatives. Where students have strong support from family and community, the school’s responsibility for counselling may be lighter; where

Fraser Institute Studies in Education Policy 7
students do not have such strong support, the school’s role may be more challenging. These indica-tors measure the school’s success in using the tools at its disposal to help students make good decisions about their education.
Of the decisions that senior students must make, perhaps the most important is the decision to remain in school, do the work, and graduate with their class. Effective counselling will encourage students to make appropriate choices.
1 Delayed advancement rate This indicator measures the extent to which schools keep their students in school and progressing in a timely manner toward completion of their gradua-tion program. It uses data that report the educational status of students one year after they have enrolled in a given grade at a school in British Columbia. For example, we can determine from these data how many of a school’s grade-10 students re-enroll in the following year in grade 11; are enrolled in grade 10 for a second time; or fail to re-enroll. With these raw data, following a technique that we introduced to Canada in the Report Card on Quebec’s Secondary Schools, 2001 Edition,8 we calculate a statistic that will answer the question, “Based on this single year’s school results, what is the likelihood that a student entering grade 10 at the school will graduate in the normal three-year period?”
The indicator is calculated as follows. For each school, for each of grades 10, 11, and 12, a rate of suc-cessful transition is determined by first summing the number of students who either graduate in the current school year or re-enroll in a higher grade in the follow-ing year and then dividing that sum by the number of students enrolled in the grade in the current year. Then, for each grade, a dropout rate is determined by subtracting the rate of successful transition from 1. Each of the three dropout rates is then reduced by the grade-8 dropout rate at the school to produce a net dropout rate for each grade. We have adopted the grade-8 drop-out rate as an estimate of the “involun-tary” drop-out rate caused by events such as emigration or death that lead to the disappearance of students
from the school system.The Delayed advancement rate indicator can now
be calculated. The complement of the net dropout rates (1 – net drop-out rate) for grades 10 through 12 is determined and their product is calculated. This three-year composite successful transition rate is then subtracted from 1 to produce the Delayed advance-ment rate indicator that appears in the detailed tables.
Where a school does not enroll grade-8 students, the net dropout rate is calculated using the weighted average grade-8 dropout rate for all the schools in the relevant school district. Where a school does not enroll grade-10 or grade-11 students, no Delayed advance-ment rate can be calculated. The relative weighting in the calculation of the Overall rating out of 10 that is given to this and the other indicators is explained in the Appendix.
2 Graduation rateThis indicator, related to the Delayed advancement rate, compares the number of students eligible to graduate who were enrolled in the school on September 30 with the number of students who actually graduate by the end of the same school year. Only those enrollees who are capable of graduating with their class within the current school year are included in the count of eligible graduates.
Graduation from secondary school retains con-siderable value since it increases options for post-secondary education. Further, graduates from sec-ondary school who decide to enter the work force immediately will likely find more job opportunities than those who have not graduated. By completing the 11 years of schooling in preparation for the final secondary school year, students have already demon-strated a reasonable ability to handle the basic courses offered by the school. Moreover, for the majority of students, the minimum requirements for graduation are not onerous. The chance that students will not graduate solely because they are unable to meet the intellectual demands of the curriculum is, therefore, relatively small.
Nevertheless, the graduation rate varies quite widely

Report Card on British Columbia’s Secondary Schools 20188
from school to school throughout the province. While there are factors not related to education—emigration from the province, sickness, death, and the like—that can affect the data, there is no reason to expect these factors to influence particular schools systematically. Accordingly, we take variations in the graduation rate to be an indicator of the extent to which students are being well coached in their educational choices.
In general, how is the school doing academically? The Overall rating out of 10
While each of the indicators is important, it is almost always the case that a school does better on some indicators than on others. So, just as a teacher must make a decision about a student’s overall performance, we need an overall indicator of school performance (in the tables Overall rating out of 10). Just as teachers combine test scores, homework, and class participa-tion to rate a student, we have combined all the indi-cators to produce an overall school rating. The overall rating of school performance answers the question,
“In general, how is the school doing academically compared to others in the Report Card?”
To derive this rating, the results for each of the indicators for each school year were first standardized. Standardization is a statistical procedure whereby sets of raw data with different characteristics are con-verted into sets of values with “standard” statistical properties. Standardized values can readily be com-bined and compared.
The standardized data were then combined as required to produce seven standardized scores— one for each indicator—for each school, for each year. The standardized scores were weighted and combined to produce an overall standardized score. Finally, this score was converted into an overall rating out of 10. It is from this Overall rating out of 10 that the school’s provincial rank is determined. For schools enrolling only one sex, there are, of course, no results for the Gender gap indicators. In these cases, the Overall rat-ing is derived using the remaining five indicators. (See
the Appendix for an explanation of the calculation of the Overall rating out of 10.)
Finally, note that the Overall rating out of 10, based as it is on standardized scores, is a relative rat-ing. That is, in order for a school to show improve-ment in its overall rating, it must improve more than the average. If it improves, but at a rate less than the average, it will show a decline in its rating.
Notes
1 The data from which these indicators are derived is provided by British Columbia’s Ministry of Education.
2 In the 2016/2017 school year, mandatory pro-vincial examinations were administered in the following grade-12 subjects: Communications 12; English 12; English 12 First Peoples; and Français langue première 12.
3 A student’s final mark for all courses that include a mandatory provincial examination is derived from both the mark received on the course’s pro-vincial examination and the mark provided by the school.
4 Peter Cowley and Stephen Easton, Boys, Girls, and Grades: Academic Gender Balance in British Columbia’s Secondary Schools, Public Policy Sources 22 (Fraser Institute, 1999).
5 Cowley and Easton, Boys, Girls, and Grades,p. 7.
6 Cowley and Easton, Boys, Girls, and Grades,p. 17.
7 See School Act, BC, Part II, Section 3, Sub-section 1b.
8 Richard Marceau and Peter Cowley, Report Card on Quebec’s Secondary Schools: 2001 Edition, Studies in Education Policy (Fraser Institute, 2001), pages 8–9.
9
Other indicators of school performance
Since the inception of the Report Card, we have added other indicators that, while they are not used to derive the Overall rating out of 10, add more informa-tion about a school’s effectiveness.
The Trend indicator
Is the school improving academically? For most schools, the Report Card includes five years of results. Unlike a simple snapshot of one year’s results, this historical record provides evidence of change (or lack thereof) over time.
In order to detect trends in the performance indicators, we developed the Trend indicator. This indicator uses statistical analysis to identify those dimensions of school performance in which there has been real change rather than a fluctuation in results caused by random occurrences.
To calculate the trends, the standardized scores rather than raw data are used. Standardizing makes historical data more comparable and the trend mea-
surement more reliable. Because calculation of trends is uncertain when only a small number of data points is available, a trend is indicated only in those circumstances where five years of data are available and where a trend is determined to be statistically sig-nificant. For this indicator we have defined the term
“statistically significant” to mean that, nine times out of 10, the trend that is noted is real, that is, it did not happen just by chance.
The Student characteristics indicators
For each public school, the Report Card notes the percentage of its students who are enrolled in ESL programs, in French Immersion programs, or who have identified special needs. As was noted in the introduction, it is sometimes useful to compare a school’s results to those of similar schools. These three indicators can be used to identify schools with similar student-body characteristics.

10
How to read the tables
Use the sample table and the explanation of each line below to help you interpret the detailed results for individual schools. Families choosing a school for their students should seek to confirm the Report Card’s findings by visiting the school and interview-ing teachers, school administrators, and other parents. And, of course, a sound academic program should be complemented by effective programs in areas of school activity not measured by the Report Card.
More information regarding schools may be found on the Ministry of Education’s web site and on the web sites of local school districts and individual schools.
In order to get the most from the Report Card, readers should consult the complete table of results for each school of interest. By considering several years of results rather than just a school’s rank in the most recent year readers can get a better idea of how the school is likely to perform in the future.
Detailed school reports
A—Gr 12 EnrollmentThe grade-12 enrollment in the fall of 2016. Indicator results for small schools tend to be more variable than do those for larger schools and caution should be used in interpreting the results for smaller schools.
B—ESL (%); Special needs (%); French Imm (%)These statistics report the percentage of students for whom English is a second-language; the percentage of students with special needs; and the percentage of stu-dents registered in French Immersion programs at the school. When you want to compare academic results, these statistics can be used to find other schools where
the student body has similar characteristics.Please note that the “special needs (%)”
indicator in this edition includes the count of “gifted” students at the school.
C (left)—Actual rating vs predicted based on average parental employment income (This indicator could not be calculated for this edition.)
C (right)—Academic rankingThe school’s overall academic rank in the province for 2016/2017 and for the most recent five years. These
SCHOOL DISTRICTSchool name [Affiliation] Location Gr 12 Enrollment: 110ESL (%): 2.5 Special needs (%): 19.3 French Imm (%): 19.1Actual rating vs predicted based 2016-17 Last 5 Yearson parents’ avg. inc. of $ n/a: n/a Rank: 169/253 209/246Academic Performance 2013 2014 2015 2016 2017 TrendAverage exam mark 68.7 69.3 68.5 66.6 69.5 —Percentage of exams failed 11.6 13.2 11.5 18.0 10.9 —School vs exam mark difference 5.4 5.0 6.4 3.9 4.8 pEnglish gender gap F 5.7 F 9.6 F 3.0 F 6.6 F 0.1 —Math gender gap M 5.8 F 5.8 F 2.4 F 4.5 n/a n/aGraduation rate 94.2 91.7 93.5 89.5 86.1 qDelayed advancement rate 34.0 39.1 29.3 41.8 35.4 —Overall rating out of 10 4.6 4.4 5.1 3.7 5.3 —
B –
C –
D –E –F –G –H –I –J –K –
– A
–
– L
–

Fraser Institute Studies in Education Policy 11
rankings show how the school has done academically compared to the other schools in the Report Card. A high ranking over five years indicates consistently strong results at the school.
D—Average exam markThe average provincial mark (%) achieved by the school’s students in all the grade-12 language arts courses in which a provincial examination is mandatory.
E—Percentage of exams failedThe percentage of all the mandatory grade-12 provin-cial examinations written by students at the school that received a failing grade.
F—School vs exam mark differenceThe average difference (in percentage points) between the mark awarded by the school and the provincial examination mark in all the courses in which a pro-vincial exam is mandatory. A large difference usually indicates that the school has been “inflating” grades.
G—Grade-12 language arts gender gapH—Math gender gap*The difference (in percentage points) between boys’ and girls’ average exam marks in the most written grade 12 language arts exam. Where the difference favours girls, the value is preceded by an F; where the differ-ence favours boys, the value is preceded by an M. An E means that there is no difference between the girls and the boys on this measure. Small differences indicate that the school is doing a good job for all its students.
*Please note: The Math gender gap indicator could not be calculated this year.
I—Graduation rateThe percentage of eligible graduates enrolled in the fall who actually graduate in the same school year. Higher rates of graduation indicate that the school is doing a good job of keeping students on track and focused on their work during their final year.
J—Delayed advancement rateThe estimated percentage of the school’s grade-10
students who will not complete grade 12 within three years. Low Delayed advancement rates indicate that the school’s students are likely to complete the last three grades of secondary school in the normal time.
K—Overall rating out of 10The Overall rating out of 10 takes into account the school’s performance on all of these indicators and answers the question, “In general, how is the school doing in academics compared to other schools in the Report Card?”
Note that the Overall rating out of 10, based as it is on standardized scores, is a relative rating. That is, in order for a school to show improvement in its overall rating, it must improve at a greater rate than the aver-age. If it improves, but at a rate less than the average, it will show a decline in its rating.
L—TrendsAn upward-pointing arrow at the end of an indicator row means that the school is probably improving on that indicator. A downward-pointing arrow means that the school is probably getting worse. The researchers had to be at least 90% sure that the changes were not just random before indicating a trend. A dash indicates that there is no significant change. Where insufficient data were available, “n/a” appears in the column. Note that for the two Gender gap indicators, Percentage of exams failed, School vs exam mark difference and Delayed advancement rate a downward trend in the data will lead to an upward-pointing arrow in the trend column. For example, decreasing Percentage of exams failed indicates improvement and so an upward-pointing arrow is displayed.
Other notes
Note 1The tables showing the detailed school results are organized by four geographic regions as follows: (1) Lower Mainland, (2) Vancouver Island and the Coast, (3) Fraser Valley and Southern British Columbia and (4) Interior and Northern British
Report Card on British Columbia’s Secondary Schools 201812
Columbia. Within each geographic region, school districts are grouped alphabetically. Finally, within each school district, both public and independent schools are listed alphabetically.
Note 2 Not all the province’s secondary schools are included in the tables or the ranking. Of all the schools for which any mandatory provincial examination results were reported, this Report Card rated 253. Excluded are schools at which fewer than 10 students were enrolled in grade 12 and schools that did not generate a sufficiently large set of student data to enable the cal-culation of an Overall rating out of 10. Also excluded from the ratings and rankings are: distributed learning schools, centres for adult education and continuing education and certain alternative schools that do not offer a full program of courses.
The exclusion of a school from the Report Card should not be construed as a judgement of the school’s effectiveness.
Note 3Where there were insufficient data available with which to calculate an indicator or where a school was not in operation during a specific year, “n/a” appears in the tables.
Note 4The complete Report Card on British Columbia’s Secondary Schools may be downloaded from the Fraser Institute’s web site at <http://www.compareschoolrankings.org/>.
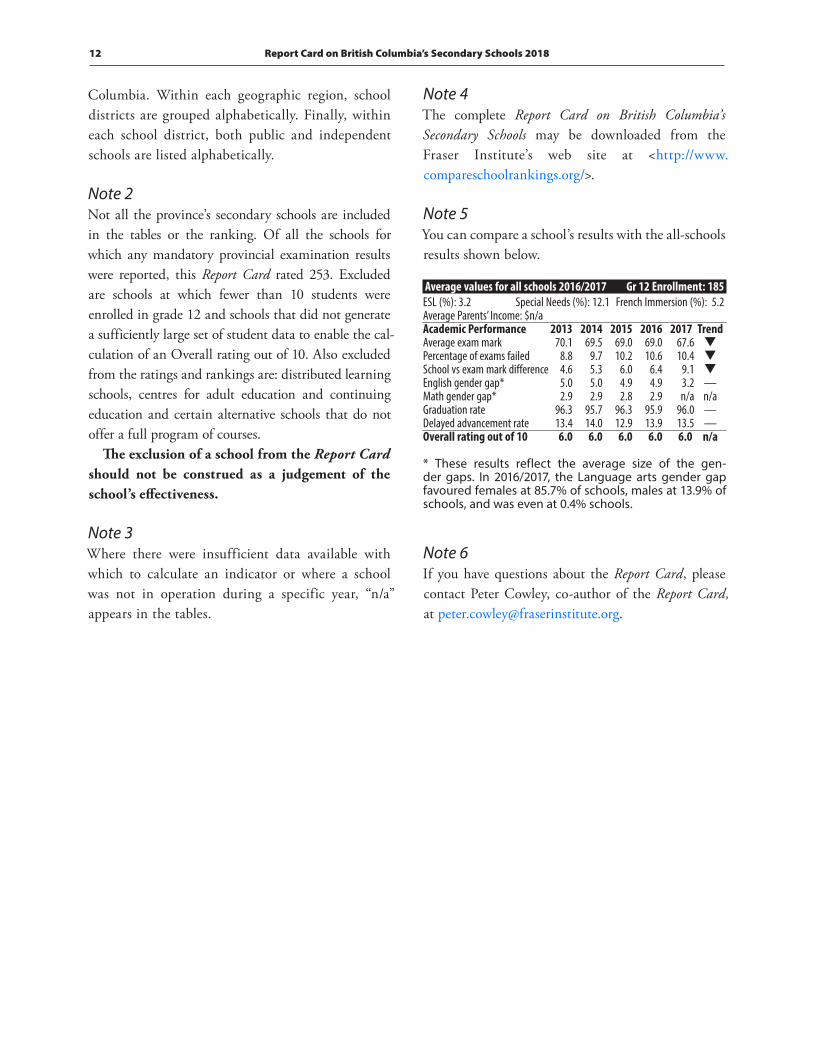
Note 5You can compare a school’s results with the all-schools results shown below.
Note 6If you have questions about the Report Card, please contact Peter Cowley, co-author of the Report Card, at [email protected].
Average values for all schools 2016/2017 Gr 12 Enrollment: 185ESL (%): 3.2 Special Needs (%): 12.1 French Immersion (%): 5.2Average Parents’ Income: $n/aAcademic Performance 2013 2014 2015 2016 2017 TrendAverage exam mark 70.1 69.5 69.0 69.0 67.6 qPercentage of exams failed 8.8 9.7 10.2 10.6 10.4 qSchool vs exam mark difference 4.6 5.3 6.0 6.4 9.1 qEnglish gender gap* 5.0 5.0 4.9 4.9 3.2 —Math gender gap* 2.9 2.9 2.8 2.9 n/a n/aGraduation rate 96.3 95.7 96.3 95.9 96.0 —Delayed advancement rate 13.4 14.0 12.9 13.9 13.5 —Overall rating out of 10 6.0 6.0 6.0 6.0 6.0 n/a
* These results reflect the average size of the gen-der gaps. In 2016/2017, the Language arts gender gap favoured females at 85.7% of schools, males at 13.9% of schools, and was even at 0.4% schools.

Fraser Institute Studies in Education Policy 13
List of cities and school districtsCity School district City School district
100 Mile House Cariboo-ChilcotinAbbotsford AbbotsfordAgassiz Fraser-CascadeAldergrove LangleyArmstrong North Okanagan-ShuswapBurnaby BurnabyBurns Lake Nechako LakesCampbell River Campbell RiverCastlegar Kootenay-ColumbiaChemainus Cowichan ValleyChetwynd Peace River SouthChilliwack ChilliwackComox Comox ValleyCoquitlam CoquitlamCourtenay Comox ValleyCranbrook Southeast KootenayCreston Kootenay LakeDawson Creek Peace River SouthDelta DeltaDuncan Cowichan ValleyEnderby North Okanagan-ShuswapFernie Southeast KootenayFort Langley LangleyFort Nelson Fort NelsonFort St James Nechako LakesFort St John Peace River NorthGibsons Sunshine CoastGolden Rocky MountainGrand Forks BoundaryHazelton Coast MountainsHope Fraser-CascadeHouston Bulkley ValleyInvermere Rocky MountainKamloops Kamloops/ThompsonKelowna Central OkanaganKeremeos Okanagan SimilkameenKimberley Rocky MountainKitimat Coast MountainsLadysmith Nanaimo-LadysmithLake Cowichan Cowichan ValleyLangley LangleyLillooet Gold TrailLumby VernonMaple Ridge Maple Ridge-Pitt MeadowsMerritt Nicola-SimilkameenMill Bay Cowichan ValleyMission MissionNakusp Arrow Lakes
Nanaimo Nanaimo-LadysmithNelson Kootenay LakeNew Westminster New WestminsterNorth Saanich SaanichNorth Vancouver North VancouverOliver Okanagan SimilkameenOsoyoos Okanagan SimilkameenParksville QualicumPemberton Sea to SkyPenticton Okanagan SkahaPitt Meadows Maple Ridge-Pitt MeadowsPort Alberni AlberniPort Coquitlam CoquitlamPort Hardy Vancouver Island NorthPort McNeill Vancouver Island NorthPort Moody CoquitlamPowell River Powell RiverPrince George Prince GeorgePrince Rupert Prince RupertPrinceton Nicola-SimilkameenQualicum Beach QualicumQuesnel QuesnelRevelstoke RevelstokeRichmond RichmondSaanichton SaanichSalmon Arm North Okanagan-ShuswapSalt Spring Island Gulf IslandsSechelt Sunshine CoastShawnigan Lake Cowichan ValleySmithers Bulkley ValleySooke SookeSouth Slocan Kootenay LakeSparwood Southeast KootenaySquamish Sea to SkySummerland Okanagan SkahaSurrey SurreyTerrace Coast MountainsTrail Kootenay-ColumbiaVancouver VancouverVanderhoof Nechako LakesVernon VernonVictoria Greater VictoriaWest Kelowna Central OkanaganWest Vancouver West VancouverWhistler Sea to SkyWilliams Lake Cariboo-ChilcotinWinfield Central Okanagan
Report Card on British Columbia’s Secondary Schools 201814
Abbotsford . . . . . . . . . . . . . . . . . . . . . . . . . . . . . . . . . 26
Alberni . . . . . . . . . . . . . . . . . . . . . . . . . . . . . . . . . . . 22
Arrow Lakes . . . . . . . . . . . . . . . . . . . . . . . . . . . . . . . . 26
Boundary . . . . . . . . . . . . . . . . . . . . . . . . . . . . . . . . . . 26
Bulkley Valley . . . . . . . . . . . . . . . . . . . . . . . . . . . . . . . 30
Burnaby . . . . . . . . . . . . . . . . . . . . . . . . . . . . . . . . . . 15
Campbell River . . . . . . . . . . . . . . . . . . . . . . . . . . . . . . 22
Cariboo-Chilcotin . . . . . . . . . . . . . . . . . . . . . . . . . . . . . 30
Central Okanagan . . . . . . . . . . . . . . . . . . . . . . . . . . . . . 26
Chilliwack . . . . . . . . . . . . . . . . . . . . . . . . . . . . . . . . . 27
Coast Mountains . . . . . . . . . . . . . . . . . . . . . . . . . . . . . 22
Comox Valley . . . . . . . . . . . . . . . . . . . . . . . . . . . . . . . . 22
Coquitlam . . . . . . . . . . . . . . . . . . . . . . . . . . . . . . . . . 15
Cowichan Valley . . . . . . . . . . . . . . . . . . . . . . . . . . . . . . 22
Delta . . . . . . . . . . . . . . . . . . . . . . . . . . . . . . . . . . . . 16
Fort Nelson . . . . . . . . . . . . . . . . . . . . . . . . . . . . . . . . . 30
Fraser-Cascade. . . . . . . . . . . . . . . . . . . . . . . . . . . . . . . 27
Gold Trail . . . . . . . . . . . . . . . . . . . . . . . . . . . . . . . . . . 30
Greater Victoria . . . . . . . . . . . . . . . . . . . . . . . . . . . . . . 23
Gulf Islands. . . . . . . . . . . . . . . . . . . . . . . . . . . . . . . . . 23
Kamloops/Thompson . . . . . . . . . . . . . . . . . . . . . . . . . . . 30
Kootenay-Columbia . . . . . . . . . . . . . . . . . . . . . . . . . . . . 27
Kootenay Lake . . . . . . . . . . . . . . . . . . . . . . . . . . . . . . . 27
Langley . . . . . . . . . . . . . . . . . . . . . . . . . . . . . . . . . . . 27
Maple Ridge-Pitt Meadows . . . . . . . . . . . . . . . . . . . . . . . 16
Mission . . . . . . . . . . . . . . . . . . . . . . . . . . . . . . . . . . . 28
Nanaimo-Ladysmith . . . . . . . . . . . . . . . . . . . . . . . . . . . 23
Nechako Lakes . . . . . . . . . . . . . . . . . . . . . . . . . . . . . . . 30
New Westminster . . . . . . . . . . . . . . . . . . . . . . . . . . . . . 17
Nicola-Similkameen . . . . . . . . . . . . . . . . . . . . . . . . . . . 28
North Okanagan-Shuswap . . . . . . . . . . . . . . . . . . . . . . . . 31
North Vancouver. . . . . . . . . . . . . . . . . . . . . . . . . . . . . . 17
Okanagan Similkameen . . . . . . . . . . . . . . . . . . . . . . . . . 28
Okanagan Skaha . . . . . . . . . . . . . . . . . . . . . . . . . . . . . 28
Peace River North . . . . . . . . . . . . . . . . . . . . . . . . . . . . . 31
Peace River South . . . . . . . . . . . . . . . . . . . . . . . . . . . . . 31
Powell River . . . . . . . . . . . . . . . . . . . . . . . . . . . . . . . . 24
Prince George . . . . . . . . . . . . . . . . . . . . . . . . . . . . . . . 31
Prince Rupert . . . . . . . . . . . . . . . . . . . . . . . . . . . . . . . 24
Qualicum . . . . . . . . . . . . . . . . . . . . . . . . . . . . . . . . . . 24
Quesnel . . . . . . . . . . . . . . . . . . . . . . . . . . . . . . . . . . . 31
Revelstoke . . . . . . . . . . . . . . . . . . . . . . . . . . . . . . . . . 31
Richmond . . . . . . . . . . . . . . . . . . . . . . . . . . . . . . . . . 17
Rocky Mountain . . . . . . . . . . . . . . . . . . . . . . . . . . . . . . 31
Saanich . . . . . . . . . . . . . . . . . . . . . . . . . . . . . . . . . . . 24
Sea To Sky . . . . . . . . . . . . . . . . . . . . . . . . . . . . . . . . . 24
Sooke . . . . . . . . . . . . . . . . . . . . . . . . . . . . . . . . . . . . 24
Southeast Kootenay . . . . . . . . . . . . . . . . . . . . . . . . . . . 28
Sunshine Coast . . . . . . . . . . . . . . . . . . . . . . . . . . . . . . 24
Surrey . . . . . . . . . . . . . . . . . . . . . . . . . . . . . . . . . . . . 18
Vancouver . . . . . . . . . . . . . . . . . . . . . . . . . . . . . . . . . 19
Vancouver Island North . . . . . . . . . . . . . . . . . . . . . . . . . 24
Vernon . . . . . . . . . . . . . . . . . . . . . . . . . . . . . . . . . . . 29
West Vancouver . . . . . . . . . . . . . . . . . . . . . . . . . . . . . . 21
Index of school districtsSchool district Page School district Page

Fraser Institute Studies in Education Policy 15
BuRnaByAlpha [Public] Burnaby Gr 12 Enrollment: 191ESL (%): 3.4 Special needs (%): 12.4 French Imm (%): 12.8Actual rating vs predicted based 2016-17 Last 5 Yearson parents’ avg. inc. of $ n/a: n/a Rank: 227/253 206/246Academic Performance 2013 2014 2015 2016 2017 TrendAverage exam mark 68.3 69.0 68.3 67.6 65.1 —Percentage of exams failed 12.6 9.8 11.5 11.7 16.2 —School vs exam mark difference 6.8 7.6 6.4 8.8 11.1 —English gender gap F 5.8 F 4.2 F 6.7 F 4.3 F 6.8 —Math gender gap F 3.7 M 4.4 F 1.1 F 0.4 n/a n/aGraduation rate 92.7 92.4 94.8 91.4 87.7 —Delayed advancement rate 31.8 24.3 15.0 13.6 17.7 pOverall rating out of 10 4.3 5.0 5.5 5.3 3.6 —
Burnaby Central [Public] Burnaby Gr 12 Enrollment: 332ESL (%): 3.6 Special needs (%): 6.1 French Imm (%): 0.0Actual rating vs predicted based 2016-17 Last 5 Yearson parents’ avg. inc. of $ n/a: n/a Rank: 199/253 140/246Academic Performance 2013 2014 2015 2016 2017 TrendAverage exam mark 70.7 72.2 68.4 69.4 65.4 —Percentage of exams failed 8.6 5.5 12.2 11.2 15.1 —School vs exam mark difference 4.8 3.6 5.4 6.2 8.0 —English gender gap F 4.8 F 5.0 F 6.9 F 2.6 F 0.6 —Math gender gap F 1.0 M 1.9 F 4.8 F 0.2 n/a n/aGraduation rate 94.7 93.6 96.3 91.2 86.9 —Delayed advancement rate 9.9 13.2 14.2 13.6 18.5 qOverall rating out of 10 6.1 6.7 5.5 5.8 4.7 —
Burnaby Mountain [Public] Burnaby Gr 12 Enrollment: 276ESL (%): 4.1 Special needs (%): 12.1 French Imm (%): 0.0Actual rating vs predicted based 2016-17 Last 5 Yearson parents’ avg. inc. of $ n/a: n/a Rank: 77/253 112/246Academic Performance 2013 2014 2015 2016 2017 TrendAverage exam mark 72.4 71.9 70.7 71.3 70.8 —Percentage of exams failed 7.7 8.9 9.7 8.8 6.8 —School vs exam mark difference 4.4 5.1 7.2 8.1 6.4 —English gender gap F 3.1 F 5.8 F 4.7 F 5.9 F 0.6 —Math gender gap F 0.6 F 3.2 M 2.4 F 3.3 n/a n/aGraduation rate 97.2 94.0 96.3 91.3 92.3 qDelayed advancement rate 10.3 15.8 11.9 15.9 16.9 —Overall rating out of 10 6.6 5.9 6.0 5.5 6.8 —
Burnaby North [Public] Burnaby Gr 12 Enrollment: 434ESL (%): 4.9 Special needs (%): 7.2 French Imm (%): 0.0Actual rating vs predicted based 2016-17 Last 5 Yearson parents’ avg. inc. of $ n/a: n/a Rank: 219/253 140/246Academic Performance 2013 2014 2015 2016 2017 TrendAverage exam mark 72.2 73.1 70.4 71.2 65.2 —Percentage of exams failed 8.0 7.3 11.2 10.2 17.9 qSchool vs exam mark difference 5.9 4.9 8.3 8.1 14.4 —English gender gap F 3.8 F 4.3 F 3.1 F 2.2 F 3.3 —Math gender gap F 0.9 M 2.0 F 0.6 F 0.6 n/a n/aGraduation rate 97.3 94.2 95.6 94.0 90.7 qDelayed advancement rate 10.7 14.6 10.6 9.9 15.2 —Overall rating out of 10 6.4 6.5 5.9 6.1 3.9 —
Burnaby South [Public] Burnaby Gr 12 Enrollment: 368ESL (%): 9.6 Special needs (%): 7.4 French Imm (%): 0.1Actual rating vs predicted based 2016-17 Last 5 Yearson parents’ avg. inc. of $ n/a: n/a Rank: 210/253 196/246Academic Performance 2013 2014 2015 2016 2017 TrendAverage exam mark 68.8 69.5 67.7 67.7 64.5 —Percentage of exams failed 11.9 11.9 13.6 12.0 15.2 —School vs exam mark difference 6.0 5.1 7.7 7.4 10.9 —English gender gap F 4.1 F 5.3 F 3.8 F 2.9 F 1.7 —Math gender gap F 0.1 M 3.5 E M 2.3 n/a n/aGraduation rate 94.7 90.2 94.8 84.8 88.8 —Delayed advancement rate 13.1 15.4 18.3 22.8 15.5 —Overall rating out of 10 5.3 5.1 5.2 4.5 4.4 q
Byrne Creek [Public] Burnaby Gr 12 Enrollment: 241ESL (%): 10.7 Special needs (%): 12.9 French Imm (%): 0.0Actual rating vs predicted based 2016-17 Last 5 Yearson parents’ avg. inc. of $ n/a: n/a Rank: 237/253 238/246Academic Performance 2013 2014 2015 2016 2017 TrendAverage exam mark 65.7 64.7 63.4 61.8 62.1 —Percentage of exams failed 15.6 18.3 19.6 21.4 18.3 —School vs exam mark difference 6.7 8.1 7.7 9.3 9.0 —English gender gap F 3.9 M 0.3 F 2.8 F 1.7 F 2.0 —Math gender gap F 0.5 M 1.8 F 3.7 M 3.1 n/a n/aGraduation rate 93.2 91.5 90.0 84.3 84.1 qDelayed advancement rate 21.3 19.0 25.0 26.0 33.8 qOverall rating out of 10 4.2 4.1 3.4 2.6 2.9 q
Cariboo Hill [Public] Burnaby Gr 12 Enrollment: 134ESL (%): 3.3 Special needs (%): 8.5 French Imm (%): 20.6Actual rating vs predicted based 2016-17 Last 5 Yearson parents’ avg. inc. of $ n/a: n/a Rank: 159/253 181/246Academic Performance 2013 2014 2015 2016 2017 TrendAverage exam mark 67.3 67.8 66.9 69.4 67.0 —Percentage of exams failed 14.8 12.5 13.7 10.0 10.4 pSchool vs exam mark difference 5.0 5.3 5.7 4.8 7.3 pEnglish gender gap F 7.2 F 4.5 F 5.3 F 6.3 F 2.8 —Math gender gap F 8.6 F 0.1 F 0.4 F 0.2 n/a n/aGraduation rate 94.1 93.3 91.5 87.0 92.0 —Delayed advancement rate 17.3 18.4 17.5 17.5 21.7 —Overall rating out of 10 4.1 5.4 5.2 5.6 5.5 —
Carver Christian [Independent] Burnaby Gr 12 Enrollment: 49ESL (%): 0.0 Special needs (%): 9.3 French Imm (%): 0.0Actual rating vs predicted based 2016-17 Last 5 Yearson parents’ avg. inc. of $ n/a: n/a Rank: 30/253 38/246Academic Performance 2013 2014 2015 2016 2017 TrendAverage exam mark 75.1 75.5 77.3 74.2 73.6 —Percentage of exams failed 4.3 5.8 2.0 6.2 8.5 —School vs exam mark difference 6.2 6.6 4.4 5.8 6.9 pEnglish gender gap F 9.4 F 0.6 F 4.3 F 4.6 F 2.9 —Math gender gap F 6.5 F 1.1 F 4.3 M 14.4 n/a n/aGraduation rate 97.1 100.0 100.0 100.0 97.9 —Delayed advancement rate 4.4 5.0 0.0 2.1 0.6 pOverall rating out of 10 6.5 7.7 8.4 7.1 7.7 —
Moscrop [Public] Burnaby Gr 12 Enrollment: 256ESL (%): 6.4 Special needs (%): 7.0 French Imm (%): 25.1Actual rating vs predicted based 2016-17 Last 5 Yearson parents’ avg. inc. of $ n/a: n/a Rank: 77/253 76/246Academic Performance 2013 2014 2015 2016 2017 TrendAverage exam mark 73.3 73.6 74.2 73.6 72.2 pPercentage of exams failed 6.9 6.8 6.0 6.5 7.3 —School vs exam mark difference 3.6 3.4 4.1 3.5 7.8 —English gender gap F 2.2 F 10.6 F 1.8 F 2.0 F 1.8 —Math gender gap F 3.7 F 2.8 M 2.8 F 2.8 n/a n/aGraduation rate 97.5 93.5 96.8 91.7 92.9 —Delayed advancement rate 14.2 19.5 16.3 14.1 13.3 —Overall rating out of 10 6.7 6.2 7.2 6.8 6.8 —
St Thomas More [Independent] Burnaby Gr 12 Enrollment: 126ESL (%): 0.0 Special needs (%): 4.7 French Imm (%): 0.0Actual rating vs predicted based 2016-17 Last 5 Yearson parents’ avg. inc. of $ n/a: n/a Rank: 18/253 17/246Academic Performance 2013 2014 2015 2016 2017 TrendAverage exam mark 78.2 77.2 76.4 75.2 75.1 —Percentage of exams failed 1.5 0.9 2.4 3.6 1.7 —School vs exam mark difference 2.7 2.7 3.6 3.4 8.6 —English gender gap F 3.1 F 5.3 F 0.4 F 6.1 F 2.5 —Math gender gap F 2.9 F 4.2 F 2.3 F 2.7 n/a n/aGraduation rate 99.3 100.0 99.2 100.0 99.2 —Delayed advancement rate 0.7 0.5 1.3 0.1 0.0 —Overall rating out of 10 8.5 8.4 8.6 8.2 8.6 —
COquITLamArchbishop Carney [Independent] Port Coquitlam Gr 12 Enrollment: 101ESL (%): 6.1 Special needs (%): 5.9 French Imm (%): 0.0Actual rating vs predicted based 2016-17 Last 5 Yearson parents’ avg. inc. of $ n/a: n/a Rank: 77/253 28/246Academic Performance 2013 2014 2015 2016 2017 TrendAverage exam mark 76.3 75.7 73.6 73.9 70.2 qPercentage of exams failed 3.5 2.1 4.6 5.7 10.2 —School vs exam mark difference 3.5 4.4 3.5 4.0 9.4 —English gender gap F 5.5 F 5.9 F 6.3 F 2.1 F 5.4 —Math gender gap F 4.5 F 1.6 F 0.6 M 2.7 n/a n/aGraduation rate 100.0 100.0 100.0 96.7 100.0 —Delayed advancement rate 0.0 0.0 0.0 2.9 0.0 —Overall rating out of 10 7.9 8.1 8.0 7.7 6.8 —
Centennial [Public] Coquitlam Gr 12 Enrollment: 354ESL (%): 6.1 Special needs (%): 19.7 French Imm (%): 0.0Actual rating vs predicted based 2016-17 Last 5 Yearson parents’ avg. inc. of $ n/a: n/a Rank: 204/253 181/246Academic Performance 2013 2014 2015 2016 2017 TrendAverage exam mark 67.4 66.0 65.9 66.5 62.6 —Percentage of exams failed 12.5 15.1 11.8 14.1 17.6 —School vs exam mark difference 7.2 7.2 6.5 6.4 11.6 —English gender gap F 3.9 F 7.1 F 4.0 F 2.6 F 1.3 —Math gender gap F 3.0 F 4.9 F 0.6 F 3.4 n/a n/aGraduation rate 94.7 98.8 95.8 93.8 95.4 —Delayed advancement rate 6.2 5.7 7.9 18.0 14.3 qOverall rating out of 10 5.1 5.2 5.8 5.3 4.6 —
Dr. Charles Best [Public] Coquitlam Gr 12 Enrollment: 354ESL (%): 1.7 Special needs (%): 18.1 French Imm (%): 42.9Actual rating vs predicted based 2016-17 Last 5 Yearson parents’ avg. inc. of $ n/a: n/a Rank: 37/253 34/246Academic Performance 2013 2014 2015 2016 2017 TrendAverage exam mark 74.6 74.1 72.2 72.9 71.2 —Percentage of exams failed 3.2 4.4 5.1 5.6 4.4 —School vs exam mark difference 1.1 2.0 3.2 2.3 3.4 —English gender gap F 4.9 F 4.0 F 4.5 F 5.2 F 5.1 —Math gender gap F 1.8 F 0.1 F 1.1 F 2.7 n/a n/aGraduation rate 97.5 97.8 97.0 96.2 97.2 —Delayed advancement rate 4.3 4.7 6.2 8.2 7.5 qOverall rating out of 10 7.9 7.9 7.4 7.4 7.5 —
Gleneagle [Public] Coquitlam Gr 12 Enrollment: 379ESL (%): 3.4 Special needs (%): 22.3 French Imm (%): 0.0Actual rating vs predicted based 2016-17 Last 5 Yearson parents’ avg. inc. of $ n/a: n/a Rank: 131/253 70/246Academic Performance 2013 2014 2015 2016 2017 TrendAverage exam mark 75.5 73.6 72.6 72.9 67.8 qPercentage of exams failed 4.8 5.6 8.3 7.8 12.1 qSchool vs exam mark difference 2.2 4.0 3.4 4.8 11.0 —English gender gap F 2.8 F 4.9 F 4.2 F 2.6 F 1.5 —Math gender gap F 1.7 F 4.3 M 1.1 F 5.1 n/a n/aGraduation rate 97.0 96.9 92.3 93.9 95.3 —Delayed advancement rate 6.1 6.7 9.9 10.4 7.9 —Overall rating out of 10 7.7 7.1 6.6 6.6 6.0 q
Heritage Woods [Public] Port Moody Gr 12 Enrollment: 350ESL (%): 6.3 Special needs (%): 15.8 French Imm (%): 0.0Actual rating vs predicted based 2016-17 Last 5 Yearson parents’ avg. inc. of $ n/a: n/a Rank: 65/253 38/246Academic Performance 2013 2014 2015 2016 2017 TrendAverage exam mark 75.0 74.5 74.0 73.8 69.0 —Percentage of exams failed 3.8 3.6 3.8 4.8 9.4 —School vs exam mark difference 2.5 3.2 4.6 5.2 8.8 qEnglish gender gap F 1.4 F 2.9 M 0.5 F 2.7 F 1.1 —Math gender gap F 0.8 F 1.2 F 4.4 F 2.3 n/a n/aGraduation rate 96.9 97.8 97.6 96.8 98.2 —Delayed advancement rate 5.6 7.0 6.7 4.8 4.7 —Overall rating out of 10 7.9 7.7 7.6 7.5 7.0 q
Lower Mainland

Report Card on British Columbia’s Secondary Schools 201816
Pinetree [Public] Coquitlam Gr 12 Enrollment: 360ESL (%): 8.2 Special needs (%): 12.5 French Imm (%): 0.0Actual rating vs predicted based 2016-17 Last 5 Yearson parents’ avg. inc. of $ n/a: n/a Rank: 149/253 70/246Academic Performance 2013 2014 2015 2016 2017 TrendAverage exam mark 74.8 74.4 73.6 73.5 67.7 qPercentage of exams failed 6.4 6.8 7.5 7.6 12.6 —School vs exam mark difference 2.8 2.3 3.9 3.6 10.6 —English gender gap F 5.2 F 3.9 F 5.5 F 3.1 F 2.3 —Math gender gap F 0.4 M 0.2 F 1.1 F 0.6 n/a n/aGraduation rate 97.1 95.6 96.6 95.1 95.1 qDelayed advancement rate 9.5 12.6 15.2 11.5 13.4 —Overall rating out of 10 7.2 7.3 6.8 7.1 5.7 —
Port Moody [Public] Port Moody Gr 12 Enrollment: 333ESL (%): 4.9 Special needs (%): 24.0 French Imm (%): 0.0Actual rating vs predicted based 2016-17 Last 5 Yearson parents’ avg. inc. of $ n/a: n/a Rank: 164/253 121/246Academic Performance 2013 2014 2015 2016 2017 TrendAverage exam mark 73.2 72.3 73.2 72.6 68.8 —Percentage of exams failed 9.5 11.0 9.4 12.0 14.6 —School vs exam mark difference 2.7 3.9 3.8 4.7 9.8 —English gender gap F 7.5 F 7.6 F 5.7 F 3.5 F 1.0 pMath gender gap F 5.9 F 5.4 E F 2.5 n/a n/aGraduation rate 94.3 96.2 95.8 93.9 90.4 —Delayed advancement rate 12.7 11.5 4.8 12.0 13.3 —Overall rating out of 10 5.9 6.1 7.0 6.2 5.4 —
Riverside [Public] Port Coquitlam Gr 12 Enrollment: 395ESL (%): 4.1 Special needs (%): 19.0 French Imm (%): 22.7Actual rating vs predicted based 2016-17 Last 5 Yearson parents’ avg. inc. of $ n/a: n/a Rank: 187/253 112/246Academic Performance 2013 2014 2015 2016 2017 TrendAverage exam mark 70.0 69.6 68.2 68.1 64.8 qPercentage of exams failed 6.5 7.9 9.6 10.5 13.8 qSchool vs exam mark difference 2.8 2.7 3.6 4.9 9.5 —English gender gap F 5.8 F 6.4 F 6.0 F 4.8 F 4.2 —Math gender gap M 1.1 M 0.9 F 3.2 F 2.1 n/a n/aGraduation rate 99.1 96.4 97.3 95.9 94.3 qDelayed advancement rate 5.0 7.5 7.1 5.6 9.9 —Overall rating out of 10 6.9 6.6 6.4 6.2 5.0 q
Terry Fox [Public] Port Coquitlam Gr 12 Enrollment: 431ESL (%): 3.0 Special needs (%): 20.7 French Imm (%): 0.0Actual rating vs predicted based 2016-17 Last 5 Yearson parents’ avg. inc. of $ n/a: n/a Rank: 187/253 155/246Academic Performance 2013 2014 2015 2016 2017 TrendAverage exam mark 68.2 67.7 67.9 65.5 64.4 —Percentage of exams failed 8.9 11.0 9.6 14.3 14.5 —School vs exam mark difference 4.0 5.4 5.8 6.0 8.6 —English gender gap F 4.8 F 4.2 F 4.1 F 2.8 F 2.4 —Math gender gap F 0.9 F 3.5 M 1.1 M 0.5 n/a n/aGraduation rate 96.7 96.1 97.8 91.8 92.7 —Delayed advancement rate 10.2 11.3 10.3 19.6 15.6 —Overall rating out of 10 6.0 5.8 6.3 4.9 5.0 —
DeLTaBurnsview [Public] Delta Gr 12 Enrollment: 175ESL (%): 3.4 Special needs (%): 14.0 French Imm (%): 42.0Actual rating vs predicted based 2016-17 Last 5 Yearson parents’ avg. inc. of $ n/a: n/a Rank: 46/253 70/246Academic Performance 2013 2014 2015 2016 2017 TrendAverage exam mark 70.4 70.0 68.1 68.3 69.4 —Percentage of exams failed 6.1 7.4 9.5 9.9 6.4 —School vs exam mark difference 2.2 3.4 3.7 3.1 8.6 —English gender gap F 5.3 F 3.5 F 2.4 F 6.6 M 0.1 —Math gender gap F 2.1 F 0.3 F 2.7 F 0.7 n/a n/aGraduation rate 98.7 94.9 98.1 97.1 97.0 —Delayed advancement rate 10.7 7.7 13.8 7.2 8.5 —Overall rating out of 10 6.9 6.7 6.5 6.7 7.3 —
Delta [Public] Delta Gr 12 Enrollment: 264ESL (%): 1.7 Special needs (%): 20.7 French Imm (%): 0.0Actual rating vs predicted based 2016-17 Last 5 Yearson parents’ avg. inc. of $ n/a: n/a Rank: 46/253 92/246Academic Performance 2013 2014 2015 2016 2017 TrendAverage exam mark 69.6 68.2 67.1 67.6 68.6 —Percentage of exams failed 8.4 7.9 10.5 10.4 6.4 —School vs exam mark difference 3.6 3.9 5.9 5.1 2.7 —English gender gap F 5.8 F 3.7 F 4.3 F 2.0 F 2.3 —Math gender gap M 5.5 M 1.2 F 2.1 F 0.3 n/a n/aGraduation rate 98.3 93.7 96.8 96.3 97.5 —Delayed advancement rate 8.7 11.2 12.6 8.0 12.5 —Overall rating out of 10 6.4 6.3 5.9 6.5 7.3 —
Delview [Public] Delta Gr 12 Enrollment: 148ESL (%): 4.3 Special needs (%): 17.2 French Imm (%): 0.0Actual rating vs predicted based 2016-17 Last 5 Yearson parents’ avg. inc. of $ n/a: n/a Rank: 65/253 144/246Academic Performance 2013 2014 2015 2016 2017 TrendAverage exam mark 67.8 64.7 65.0 65.3 66.3 —Percentage of exams failed 10.3 13.1 12.0 16.0 6.5 —School vs exam mark difference 3.4 5.0 5.7 6.1 5.9 —English gender gap F 1.4 F 6.7 F 7.4 F 8.1 F 1.0 —Math gender gap M 2.3 M 4.0 F 1.6 F 5.9 n/a n/aGraduation rate 97.3 93.8 95.7 98.6 97.1 —Delayed advancement rate 9.7 10.0 12.2 6.8 8.6 —Overall rating out of 10 6.0 5.0 5.3 5.2 7.0 —
North Delta [Public] Delta Gr 12 Enrollment: 219ESL (%): 5.7 Special needs (%): 12.5 French Imm (%): 0.0Actual rating vs predicted based 2016-17 Last 5 Yearson parents’ avg. inc. of $ n/a: n/a Rank: 71/253 140/246Academic Performance 2013 2014 2015 2016 2017 TrendAverage exam mark 65.1 65.9 67.7 66.4 68.6 pPercentage of exams failed 14.4 12.9 11.1 13.6 6.9 pSchool vs exam mark difference 6.0 5.6 4.2 6.4 4.5 pEnglish gender gap F 0.5 F 4.2 F 3.8 F 6.9 F 0.2 —Math gender gap M 2.2 M 0.2 F 1.0 F 3.7 n/a n/aGraduation rate 97.5 95.0 96.0 96.7 94.2 —Delayed advancement rate 18.0 16.7 13.3 9.1 16.5 —Overall rating out of 10 4.9 5.4 6.2 5.7 6.9 p
Sands [Public] Delta Gr 12 Enrollment: 143ESL (%): 2.2 Special needs (%): 15.9 French Imm (%): 0.0Actual rating vs predicted based 2016-17 Last 5 Yearson parents’ avg. inc. of $ n/a: n/a Rank: 159/253 121/246Academic Performance 2013 2014 2015 2016 2017 TrendAverage exam mark 67.6 66.2 66.7 67.5 63.5 —Percentage of exams failed 9.9 12.3 9.7 9.5 14.8 —School vs exam mark difference 1.4 3.6 4.6 3.9 10.0 —English gender gap F 5.5 F 2.7 F 3.9 F 5.1 F 2.0 —Math gender gap M 0.8 F 4.9 F 5.6 F 2.7 n/a n/aGraduation rate 98.5 97.7 96.9 97.1 97.7 —Delayed advancement rate 7.7 11.9 8.2 9.7 4.8 —Overall rating out of 10 6.6 5.7 6.1 6.4 5.5 —
Seaquam [Public] Delta Gr 12 Enrollment: 251ESL (%): 1.3 Special needs (%): 11.3 French Imm (%): 0.0Actual rating vs predicted based 2016-17 Last 5 Yearson parents’ avg. inc. of $ n/a: n/a Rank: 19/253 65/246Academic Performance 2013 2014 2015 2016 2017 TrendAverage exam mark 71.5 70.3 70.6 70.4 73.5 —Percentage of exams failed 7.8 8.9 8.1 7.5 3.4 pSchool vs exam mark difference 3.3 2.9 5.2 6.0 4.9 —English gender gap F 7.1 F 4.8 F 5.3 F 3.0 F 2.2 pMath gender gap M 3.4 M 2.2 F 2.1 F 3.0 n/a n/aGraduation rate 95.9 94.5 97.5 97.7 98.7 pDelayed advancement rate 9.5 14.7 10.9 10.4 3.5 —Overall rating out of 10 6.2 6.3 6.6 6.8 8.4 p
South Delta [Public] Delta Gr 12 Enrollment: 305ESL (%): 1.2 Special needs (%): 15.0 French Imm (%): 25.0Actual rating vs predicted based 2016-17 Last 5 Yearson parents’ avg. inc. of $ n/a: n/a Rank: 120/253 98/246Academic Performance 2013 2014 2015 2016 2017 TrendAverage exam mark 70.2 69.0 68.4 69.4 67.4 —Percentage of exams failed 7.7 7.7 8.4 7.3 8.3 —School vs exam mark difference 5.0 5.6 7.6 7.6 14.4 qEnglish gender gap F 4.5 F 6.0 F 2.8 F 0.7 F 3.2 —Math gender gap F 3.3 M 3.7 M 0.9 F 0.4 n/a n/aGraduation rate 97.5 95.8 99.2 97.8 98.9 —Delayed advancement rate 7.1 10.4 8.4 11.9 11.2 qOverall rating out of 10 6.4 6.1 6.5 6.8 6.1 —
Southpointe [Independent] Delta Gr 12 Enrollment: 45ESL (%): 0.0 Special needs (%): 2.6 French Imm (%): 0.0Actual rating vs predicted based 2016-17 Last 5 Yearson parents’ avg. inc. of $ n/a: n/a Rank: 57/253 17/246Academic Performance 2013 2014 2015 2016 2017 TrendAverage exam mark 79.9 79.6 79.0 82.1 71.3 —Percentage of exams failed 1.7 1.4 0.4 0.0 6.1 —School vs exam mark difference 1.3 4.4 4.3 1.3 13.8 —English gender gap F 1.6 F 0.6 F 1.9 M 2.0 F 2.9 qMath gender gap M 6.8 M 1.7 F 4.1 M 1.6 n/a n/aGraduation rate 95.2 100.0 100.0 100.0 97.8 —Delayed advancement rate 2.2 0.0 1.7 1.8 0.7 —Overall rating out of 10 8.3 8.8 8.8 9.7 7.1 —
mapLe RIDge-pITT meaDOwSGaribaldi [Public] Maple Ridge Gr 12 Enrollment: 149ESL (%): 0.7 Special needs (%): 15.4 French Imm (%): 0.0Actual rating vs predicted based 2016-17 Last 5 Yearson parents’ avg. inc. of $ n/a: n/a Rank: 210/253 235/246Academic Performance 2013 2014 2015 2016 2017 TrendAverage exam mark 64.2 61.3 60.2 62.1 63.3 —Percentage of exams failed 16.1 22.1 24.3 19.2 15.8 —School vs exam mark difference 9.1 10.6 9.9 7.0 6.3 pEnglish gender gap F 4.5 F 8.2 F 10.2 F 2.4 F 0.1 —Math gender gap F 2.1 M 0.6 F 1.7 F 1.7 n/a n/aGraduation rate 95.5 88.6 97.1 93.1 88.3 —Delayed advancement rate 20.2 16.3 24.2 16.7 27.4 —Overall rating out of 10 3.7 2.8 2.8 4.3 4.4 —
Maple Ridge [Public] Maple Ridge Gr 12 Enrollment: 213ESL (%): 0.9 Special needs (%): 11.9 French Imm (%): 21.9Actual rating vs predicted based 2016-17 Last 5 Yearson parents’ avg. inc. of $ n/a: n/a Rank: 57/253 112/246Academic Performance 2013 2014 2015 2016 2017 TrendAverage exam mark 69.1 67.0 66.4 67.1 68.7 —Percentage of exams failed 7.3 12.1 11.7 11.5 9.0 —School vs exam mark difference 4.0 5.7 3.8 5.7 5.8 —English gender gap F 1.7 F 7.5 F 9.7 F 4.3 M 0.2 —Math gender gap M 2.6 M 1.3 M 0.7 F 0.5 n/a n/aGraduation rate 96.9 95.7 98.6 96.6 95.7 —Delayed advancement rate 14.5 12.9 10.6 12.1 6.2 pOverall rating out of 10 6.3 5.4 5.9 6.1 7.1 —
Meadowridge [Independent] Maple Ridge Gr 12 Enrollment: 34ESL (%): 0.0 Special needs (%): 0.2 French Imm (%): 0.0Actual rating vs predicted based 2016-17 Last 5 Yearson parents’ avg. inc. of $ n/a: n/a Rank: 16/253 15/246Academic Performance 2013 2014 2015 2016 2017 TrendAverage exam mark 82.7 81.5 78.9 80.0 76.9 qPercentage of exams failed 0.6 0.0 1.3 0.9 0.0 pSchool vs exam mark difference 2.2 3.1 6.5 7.5 13.7 qEnglish gender gap F 4.8 F 3.2 F 0.5 F 6.6 F 1.7 —Math gender gap F 6.0 M 7.2 M 9.5 M 3.2 n/a n/aGraduation rate 100.0 100.0 100.0 97.7 100.0 —Delayed advancement rate 0.0 0.0 0.0 3.9 0.0 —Overall rating out of 10 9.1 8.9 8.4 8.2 8.8 —
Pitt Meadows [Public] Pitt Meadows Gr 12 Enrollment: 137ESL (%): 1.3 Special needs (%): 16.0 French Imm (%): 12.6Actual rating vs predicted based 2016-17 Last 5 Yearson parents’ avg. inc. of $ n/a: n/a Rank: 21/253 163/246Academic Performance 2013 2014 2015 2016 2017 TrendAverage exam mark 67.0 62.9 65.1 63.8 69.7 —Percentage of exams failed 12.7 17.9 16.0 18.4 2.7 —School vs exam mark difference 7.4 7.5 7.9 9.3 3.3 —English gender gap F 3.1 F 0.6 F 4.0 F 3.0 M 0.1 —Math gender gap M 4.0 M 6.6 M 4.8 F 1.3 n/a n/aGraduation rate 98.7 93.9 98.2 96.3 97.2 —Delayed advancement rate 6.2 15.1 13.3 24.7 7.6 —Overall rating out of 10 5.5 4.3 5.0 4.6 8.2 —
Samuel Robertson Tech [Public] Maple Ridge Gr 12 Enrollment: 182ESL (%): 0.3 Special needs (%): 13.8 French Imm (%): 0.0Actual rating vs predicted based 2016-17 Last 5 Yearson parents’ avg. inc. of $ n/a: n/a Rank: 169/253 217/246Academic Performance 2013 2014 2015 2016 2017 TrendAverage exam mark 63.8 62.2 61.4 63.4 63.9 —Percentage of exams failed 17.0 16.5 17.7 15.8 10.9 pSchool vs exam mark difference 8.7 11.4 12.9 10.4 15.9 —English gender gap F 7.3 F 9.0 F 6.1 F 4.9 F 0.6 pMath gender gap M 1.4 M 1.1 E F 0.9 n/a n/aGraduation rate 96.7 96.2 93.4 94.8 96.3 —Delayed advancement rate 9.6 6.9 18.4 14.4 10.0 —Overall rating out of 10 4.2 3.9 3.5 4.6 5.3 —
Thomas Haney [Public] Maple Ridge Gr 12 Enrollment: 264ESL (%): 1.0 Special needs (%): 15.0 French Imm (%): 0.0Actual rating vs predicted based 2016-17 Last 5 Yearson parents’ avg. inc. of $ n/a: n/a Rank: 120/253 133/246Academic Performance 2013 2014 2015 2016 2017 TrendAverage exam mark 68.3 66.1 68.1 69.8 68.7 pPercentage of exams failed 10.8 13.3 8.9 9.0 8.8 —School vs exam mark difference 5.1 5.9 4.2 3.3 11.6 —English gender gap F 4.2 F 4.9 F 2.4 F 6.4 F 4.0 —Math gender gap M 3.1 M 3.3 M 0.3 M 0.8 n/a n/aGraduation rate 95.8 92.8 95.1 97.1 96.6 —Delayed advancement rate 15.9 19.4 17.0 14.1 12.5 —Overall rating out of 10 5.5 4.9 6.3 6.8 6.1 —
Fraser Institute Studies in Education Policy 17
Westview [Public] Maple Ridge Gr 12 Enrollment: 133ESL (%): 0.8 Special needs (%): 18.0 French Imm (%): 0.0Actual rating vs predicted based 2016-17 Last 5 Yearson parents’ avg. inc. of $ n/a: n/a Rank: 219/253 206/246Academic Performance 2013 2014 2015 2016 2017 TrendAverage exam mark 65.4 63.3 64.7 61.8 62.8 —Percentage of exams failed 12.0 16.2 14.9 16.8 14.9 —School vs exam mark difference 2.9 5.3 5.3 7.8 10.7 qEnglish gender gap F 3.8 F 6.3 F 0.3 M 4.6 F 3.9 —Math gender gap M 1.1 M 2.2 M 3.9 M 7.5 n/a n/aGraduation rate 98.0 95.3 97.4 90.8 92.0 qDelayed advancement rate 15.9 22.5 18.7 25.8 26.8 qOverall rating out of 10 5.9 4.7 5.2 3.6 3.9 q
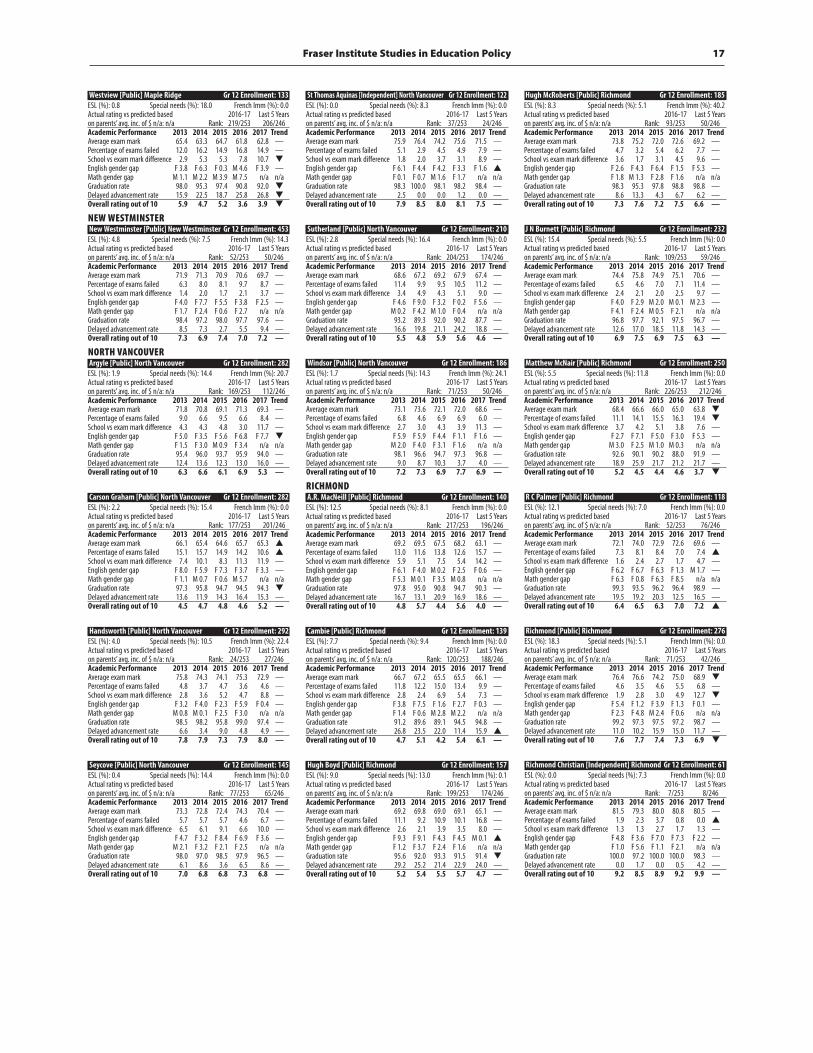
new weSTmInSTeRNew Westminster [Public] New Westminster Gr 12 Enrollment: 453ESL (%): 4.8 Special needs (%): 7.5 French Imm (%): 14.3Actual rating vs predicted based 2016-17 Last 5 Yearson parents’ avg. inc. of $ n/a: n/a Rank: 52/253 50/246Academic Performance 2013 2014 2015 2016 2017 TrendAverage exam mark 71.9 71.3 70.9 70.6 69.7 —Percentage of exams failed 6.3 8.0 8.1 9.7 8.7 —School vs exam mark difference 1.4 2.0 1.7 2.1 3.7 —English gender gap F 4.0 F 7.7 F 5.5 F 3.8 F 2.5 —Math gender gap F 1.7 F 2.4 F 0.6 F 2.7 n/a n/aGraduation rate 98.4 97.2 98.0 97.7 97.6 —Delayed advancement rate 8.5 7.3 2.7 5.5 9.4 —Overall rating out of 10 7.3 6.9 7.4 7.0 7.2 —
nORTH VanCOuVeRArgyle [Public] North Vancouver Gr 12 Enrollment: 282ESL (%): 1.9 Special needs (%): 14.4 French Imm (%): 20.7Actual rating vs predicted based 2016-17 Last 5 Yearson parents’ avg. inc. of $ n/a: n/a Rank: 169/253 112/246Academic Performance 2013 2014 2015 2016 2017 TrendAverage exam mark 71.8 70.8 69.1 71.3 69.3 —Percentage of exams failed 9.0 6.6 9.5 6.6 8.4 —School vs exam mark difference 4.3 4.3 4.8 3.0 11.7 —English gender gap F 5.0 F 3.5 F 5.6 F 6.8 F 7.7 qMath gender gap F 1.5 F 3.0 M 0.9 F 3.4 n/a n/aGraduation rate 95.4 96.0 93.7 95.9 94.0 —Delayed advancement rate 12.4 13.6 12.3 13.0 16.0 —Overall rating out of 10 6.3 6.6 6.1 6.9 5.3 —
Carson Graham [Public] North Vancouver Gr 12 Enrollment: 282ESL (%): 2.2 Special needs (%): 15.4 French Imm (%): 0.0Actual rating vs predicted based 2016-17 Last 5 Yearson parents’ avg. inc. of $ n/a: n/a Rank: 177/253 201/246Academic Performance 2013 2014 2015 2016 2017 TrendAverage exam mark 66.1 65.4 64.6 65.7 65.3 pPercentage of exams failed 15.1 15.7 14.9 14.2 10.6 pSchool vs exam mark difference 7.4 10.1 8.3 11.3 11.9 —English gender gap F 8.0 F 5.9 F 7.3 F 3.7 F 3.3 —Math gender gap F 1.1 M 0.7 F 0.6 M 5.7 n/a n/aGraduation rate 97.3 95.8 94.7 94.5 94.3 qDelayed advancement rate 13.6 11.9 14.3 16.4 15.3 —Overall rating out of 10 4.5 4.7 4.8 4.6 5.2 —
Handsworth [Public] North Vancouver Gr 12 Enrollment: 292ESL (%): 4.0 Special needs (%): 10.5 French Imm (%): 22.4Actual rating vs predicted based 2016-17 Last 5 Yearson parents’ avg. inc. of $ n/a: n/a Rank: 24/253 27/246Academic Performance 2013 2014 2015 2016 2017 TrendAverage exam mark 75.8 74.3 74.1 75.3 72.9 —Percentage of exams failed 4.8 3.7 4.7 3.6 4.6 —School vs exam mark difference 2.8 3.6 5.2 4.7 8.8 —English gender gap F 3.2 F 4.0 F 2.3 F 5.9 F 0.4 —Math gender gap M 0.8 M 0.1 F 2.5 F 3.0 n/a n/aGraduation rate 98.5 98.2 95.8 99.0 97.4 —Delayed advancement rate 6.6 3.4 9.0 4.8 4.9 —Overall rating out of 10 7.8 7.9 7.3 7.9 8.0 —
Seycove [Public] North Vancouver Gr 12 Enrollment: 145ESL (%): 0.4 Special needs (%): 14.4 French Imm (%): 0.0Actual rating vs predicted based 2016-17 Last 5 Yearson parents’ avg. inc. of $ n/a: n/a Rank: 77/253 65/246Academic Performance 2013 2014 2015 2016 2017 TrendAverage exam mark 73.3 72.8 72.4 74.3 70.4 —Percentage of exams failed 5.7 5.7 5.7 4.6 6.7 —School vs exam mark difference 6.5 6.1 9.1 6.6 10.0 —English gender gap F 4.7 F 3.2 F 8.4 F 6.9 F 3.6 —Math gender gap M 2.1 F 3.2 F 2.1 F 2.5 n/a n/aGraduation rate 98.0 97.0 98.5 97.9 96.5 —Delayed advancement rate 6.1 8.6 3.6 6.5 8.6 —Overall rating out of 10 7.0 6.8 6.8 7.3 6.8 —
St Thomas Aquinas [Independent] North Vancouver Gr 12 Enrollment: 122ESL (%): 0.0 Special needs (%): 8.3 French Imm (%): 0.0Actual rating vs predicted based 2016-17 Last 5 Yearson parents’ avg. inc. of $ n/a: n/a Rank: 37/253 24/246Academic Performance 2013 2014 2015 2016 2017 TrendAverage exam mark 75.9 76.4 74.2 75.6 71.5 —Percentage of exams failed 5.1 2.9 4.5 4.9 7.9 —School vs exam mark difference 1.8 2.0 3.7 3.1 8.9 —English gender gap F 6.1 F 4.4 F 4.2 F 3.3 F 1.6 pMath gender gap F 0.1 F 0.7 M 1.6 F 1.7 n/a n/aGraduation rate 98.3 100.0 98.1 98.2 98.4 —Delayed advancement rate 2.5 0.0 0.0 1.2 0.0 —Overall rating out of 10 7.9 8.5 8.0 8.1 7.5 —
Sutherland [Public] North Vancouver Gr 12 Enrollment: 210ESL (%): 2.8 Special needs (%): 16.4 French Imm (%): 0.0Actual rating vs predicted based 2016-17 Last 5 Yearson parents’ avg. inc. of $ n/a: n/a Rank: 204/253 174/246Academic Performance 2013 2014 2015 2016 2017 TrendAverage exam mark 68.6 67.2 69.2 67.9 67.4 —Percentage of exams failed 11.4 9.9 9.5 10.5 11.2 —School vs exam mark difference 3.4 4.9 4.3 5.1 9.0 —English gender gap F 4.6 F 9.0 F 3.2 F 0.2 F 5.6 —Math gender gap M 0.2 F 4.2 M 1.0 F 0.4 n/a n/aGraduation rate 93.2 89.3 92.0 90.2 87.7 —Delayed advancement rate 16.6 19.8 21.1 24.2 18.8 —Overall rating out of 10 5.5 4.8 5.9 5.6 4.6 —
Windsor [Public] North Vancouver Gr 12 Enrollment: 186ESL (%): 1.7 Special needs (%): 14.3 French Imm (%): 24.1Actual rating vs predicted based 2016-17 Last 5 Yearson parents’ avg. inc. of $ n/a: n/a Rank: 71/253 50/246Academic Performance 2013 2014 2015 2016 2017 TrendAverage exam mark 73.1 73.6 72.1 72.0 68.6 —Percentage of exams failed 6.8 4.6 6.9 6.9 6.0 —School vs exam mark difference 2.7 3.0 4.3 3.9 11.3 —English gender gap F 5.9 F 5.9 F 4.4 F 1.1 F 1.6 —Math gender gap M 2.0 F 4.0 F 3.1 F 1.6 n/a n/aGraduation rate 98.1 96.6 94.7 97.3 96.8 —Delayed advancement rate 9.0 8.7 10.3 3.7 4.0 —Overall rating out of 10 7.2 7.3 6.9 7.7 6.9 —
RICHmOnDA.R. MacNeill [Public] Richmond Gr 12 Enrollment: 140ESL (%): 12.5 Special needs (%): 8.1 French Imm (%): 0.0Actual rating vs predicted based 2016-17 Last 5 Yearson parents’ avg. inc. of $ n/a: n/a Rank: 217/253 196/246Academic Performance 2013 2014 2015 2016 2017 TrendAverage exam mark 69.2 69.5 67.5 68.2 63.1 —Percentage of exams failed 13.0 11.6 13.8 12.6 15.7 —School vs exam mark difference 5.9 5.1 7.5 5.4 14.2 —English gender gap F 6.1 F 4.0 M 0.2 F 2.5 F 0.6 —Math gender gap F 5.3 M 0.1 F 3.5 M 0.8 n/a n/aGraduation rate 97.8 95.0 90.8 94.7 90.3 —Delayed advancement rate 16.7 13.1 20.9 16.9 18.6 —Overall rating out of 10 4.8 5.7 4.4 5.6 4.0 —
Cambie [Public] Richmond Gr 12 Enrollment: 139ESL (%): 7.7 Special needs (%): 9.4 French Imm (%): 0.0Actual rating vs predicted based 2016-17 Last 5 Yearson parents’ avg. inc. of $ n/a: n/a Rank: 120/253 188/246Academic Performance 2013 2014 2015 2016 2017 TrendAverage exam mark 66.7 67.2 65.5 65.5 66.1 —Percentage of exams failed 11.8 12.2 15.0 13.4 9.9 —School vs exam mark difference 2.8 2.4 6.9 5.4 7.3 —English gender gap F 3.8 F 7.5 F 1.6 F 2.7 F 0.3 —Math gender gap F 1.4 F 0.6 M 2.8 M 2.2 n/a n/aGraduation rate 91.2 89.6 89.1 94.5 94.8 —Delayed advancement rate 26.8 23.5 22.0 11.4 15.9 pOverall rating out of 10 4.7 5.1 4.2 5.4 6.1 —
Hugh Boyd [Public] Richmond Gr 12 Enrollment: 157ESL (%): 9.0 Special needs (%): 13.0 French Imm (%): 0.1Actual rating vs predicted based 2016-17 Last 5 Yearson parents’ avg. inc. of $ n/a: n/a Rank: 199/253 174/246Academic Performance 2013 2014 2015 2016 2017 TrendAverage exam mark 69.2 69.8 69.0 69.1 65.1 —Percentage of exams failed 11.1 9.2 10.9 10.1 16.8 —School vs exam mark difference 2.6 2.1 3.9 3.5 8.0 —English gender gap F 9.3 F 9.1 F 4.3 F 4.5 M 0.1 pMath gender gap F 1.2 F 3.7 F 2.4 F 1.6 n/a n/aGraduation rate 95.6 92.0 93.3 91.5 91.4 qDelayed advancement rate 29.2 25.2 21.4 22.9 24.0 —Overall rating out of 10 5.2 5.4 5.5 5.7 4.7 —
Hugh McRoberts [Public] Richmond Gr 12 Enrollment: 185ESL (%): 8.3 Special needs (%): 5.1 French Imm (%): 40.2Actual rating vs predicted based 2016-17 Last 5 Yearson parents’ avg. inc. of $ n/a: n/a Rank: 93/253 50/246Academic Performance 2013 2014 2015 2016 2017 TrendAverage exam mark 73.8 75.2 72.0 72.6 69.2 —Percentage of exams failed 4.7 3.2 5.4 6.2 7.7 —School vs exam mark difference 3.6 1.7 3.1 4.5 9.6 —English gender gap F 2.6 F 4.3 F 6.4 F 1.5 F 5.3 —Math gender gap F 1.8 M 1.3 F 2.8 F 1.6 n/a n/aGraduation rate 98.3 95.3 97.8 98.8 98.8 —Delayed advancement rate 8.6 13.3 4.3 6.7 6.2 —Overall rating out of 10 7.3 7.6 7.2 7.5 6.6 —
J N Burnett [Public] Richmond Gr 12 Enrollment: 232ESL (%): 15.4 Special needs (%): 5.5 French Imm (%): 0.0Actual rating vs predicted based 2016-17 Last 5 Yearson parents’ avg. inc. of $ n/a: n/a Rank: 109/253 59/246Academic Performance 2013 2014 2015 2016 2017 TrendAverage exam mark 74.4 75.8 74.9 75.1 70.6 —Percentage of exams failed 6.5 4.6 7.0 7.1 11.4 —School vs exam mark difference 2.4 2.1 2.0 2.5 9.7 —English gender gap F 4.0 F 2.9 M 2.0 M 0.1 M 2.3 —Math gender gap F 4.1 F 2.4 M 0.5 F 2.1 n/a n/aGraduation rate 96.8 97.7 92.1 97.5 96.7 —Delayed advancement rate 12.6 17.0 18.5 11.8 14.3 —Overall rating out of 10 6.9 7.5 6.9 7.5 6.3 —
Matthew McNair [Public] Richmond Gr 12 Enrollment: 250ESL (%): 5.5 Special needs (%): 11.8 French Imm (%): 0.0Actual rating vs predicted based 2016-17 Last 5 Yearson parents’ avg. inc. of $ n/a: n/a Rank: 226/253 212/246Academic Performance 2013 2014 2015 2016 2017 TrendAverage exam mark 68.4 66.6 66.0 65.0 63.8 qPercentage of exams failed 11.1 14.1 15.5 16.3 19.4 qSchool vs exam mark difference 3.7 4.2 5.1 3.8 7.6 —English gender gap F 2.7 F 7.1 F 5.0 F 3.0 F 5.3 —Math gender gap M 3.0 F 2.5 M 1.0 M 0.3 n/a n/aGraduation rate 92.6 90.1 90.2 88.0 91.9 —Delayed advancement rate 18.9 25.9 21.7 21.2 21.7 —Overall rating out of 10 5.2 4.5 4.4 4.6 3.7 q
R C Palmer [Public] Richmond Gr 12 Enrollment: 118ESL (%): 12.1 Special needs (%): 7.0 French Imm (%): 0.0Actual rating vs predicted based 2016-17 Last 5 Yearson parents’ avg. inc. of $ n/a: n/a Rank: 52/253 76/246Academic Performance 2013 2014 2015 2016 2017 TrendAverage exam mark 72.1 74.0 72.9 72.6 69.6 —Percentage of exams failed 7.3 8.1 8.4 7.0 7.4 pSchool vs exam mark difference 1.6 2.4 2.7 1.7 4.7 —English gender gap F 6.2 F 6.7 F 6.3 F 1.3 M 1.7 —Math gender gap F 6.3 F 0.8 F 6.3 F 8.5 n/a n/aGraduation rate 99.3 93.5 96.2 96.4 98.9 —Delayed advancement rate 19.5 19.2 20.3 12.5 16.5 —Overall rating out of 10 6.4 6.5 6.3 7.0 7.2 p
Richmond [Public] Richmond Gr 12 Enrollment: 276ESL (%): 18.3 Special needs (%): 5.1 French Imm (%): 0.0Actual rating vs predicted based 2016-17 Last 5 Yearson parents’ avg. inc. of $ n/a: n/a Rank: 71/253 42/246Academic Performance 2013 2014 2015 2016 2017 TrendAverage exam mark 76.4 76.6 74.2 75.0 68.9 qPercentage of exams failed 4.6 3.5 4.6 5.5 6.8 —School vs exam mark difference 1.9 2.8 3.0 4.9 12.7 qEnglish gender gap F 5.4 F 1.2 F 3.9 F 1.3 F 0.1 —Math gender gap F 2.3 F 4.8 M 2.4 F 0.6 n/a n/aGraduation rate 99.2 97.3 97.5 97.2 98.7 —Delayed advancement rate 11.0 10.2 15.9 15.0 11.7 —Overall rating out of 10 7.6 7.7 7.4 7.3 6.9 q
Richmond Christian [Independent] Richmond Gr 12 Enrollment: 61ESL (%): 0.0 Special needs (%): 7.3 French Imm (%): 0.0Actual rating vs predicted based 2016-17 Last 5 Yearson parents’ avg. inc. of $ n/a: n/a Rank: 7/253 8/246Academic Performance 2013 2014 2015 2016 2017 TrendAverage exam mark 81.5 79.3 80.0 80.8 80.5 —Percentage of exams failed 1.9 2.3 3.7 0.8 0.0 pSchool vs exam mark difference 1.3 1.3 2.7 1.7 1.3 —English gender gap F 4.8 F 3.6 F 7.0 F 7.3 F 2.2 —Math gender gap F 1.0 F 5.6 F 1.1 F 2.1 n/a n/aGraduation rate 100.0 97.2 100.0 100.0 98.3 —Delayed advancement rate 0.0 1.7 0.0 0.5 4.2 —Overall rating out of 10 9.2 8.5 8.9 9.2 9.9 —

Report Card on British Columbia’s Secondary Schools 201818
Robert Alexander McMath [Public] Richmond Gr 12 Enrollment: 263ESL (%): 4.0 Special needs (%): 7.7 French Imm (%): 33.8Actual rating vs predicted based 2016-17 Last 5 Yearson parents’ avg. inc. of $ n/a: n/a Rank: 87/253 42/246Academic Performance 2013 2014 2015 2016 2017 TrendAverage exam mark 74.2 74.5 73.6 73.5 71.9 —Percentage of exams failed 2.3 2.9 3.8 3.6 7.3 —School vs exam mark difference 2.4 2.9 3.0 3.4 7.7 —English gender gap F 7.3 F 6.4 F 4.0 F 3.3 F 7.3 —Math gender gap M 1.7 F 1.7 F 0.2 M 0.4 n/a n/aGraduation rate 96.5 95.3 96.3 95.9 96.7 —Delayed advancement rate 10.1 9.1 9.9 13.3 7.4 —Overall rating out of 10 7.4 7.4 7.7 7.6 6.7 —
Steveston-London [Public] Richmond Gr 12 Enrollment: 296ESL (%): 15.2 Special needs (%): 4.8 French Imm (%): 0.0Actual rating vs predicted based 2016-17 Last 5 Yearson parents’ avg. inc. of $ n/a: n/a Rank: 113/253 46/246Academic Performance 2013 2014 2015 2016 2017 TrendAverage exam mark 76.8 76.4 74.5 74.3 68.9 qPercentage of exams failed 3.3 4.9 5.7 7.5 11.5 qSchool vs exam mark difference 1.5 1.6 3.2 4.2 10.8 qEnglish gender gap F 1.4 F 4.3 F 2.1 F 3.4 M 0.5 —Math gender gap F 1.7 F 3.5 F 1.6 F 3.4 n/a n/aGraduation rate 96.3 97.3 97.8 96.2 96.0 —Delayed advancement rate 8.1 11.9 10.8 11.1 11.7 —Overall rating out of 10 8.0 7.6 7.6 7.0 6.2 q
SuRReyClayton Heights [Public] Surrey Gr 12 Enrollment: 255ESL (%): 4.3 Special needs (%): 13.4 French Imm (%): 0.0Actual rating vs predicted based 2016-17 Last 5 Yearson parents’ avg. inc. of $ n/a: n/a Rank: 113/253 155/246Academic Performance 2013 2014 2015 2016 2017 TrendAverage exam mark 68.3 66.3 66.9 66.2 67.9 —Percentage of exams failed 9.1 12.1 11.1 11.8 8.2 —School vs exam mark difference 3.7 4.7 3.6 4.7 4.4 pEnglish gender gap F 3.7 F 7.4 F 6.9 F 6.3 F 3.7 —Math gender gap M 4.7 F 1.0 F 2.6 M 2.0 n/a n/aGraduation rate 96.5 88.2 93.3 91.4 93.2 —Delayed advancement rate 7.6 15.2 18.5 12.5 15.4 —Overall rating out of 10 6.1 5.0 5.5 5.4 6.2 —
Earl Marriott [Public] Surrey Gr 12 Enrollment: 381ESL (%): 2.9 Special needs (%): 12.1 French Imm (%): 25.0Actual rating vs predicted based 2016-17 Last 5 Yearson parents’ avg. inc. of $ n/a: n/a Rank: 52/253 87/246Academic Performance 2013 2014 2015 2016 2017 TrendAverage exam mark 70.9 70.4 70.3 70.6 71.1 pPercentage of exams failed 7.0 7.5 7.2 7.5 5.6 pSchool vs exam mark difference 4.2 4.7 4.5 6.0 6.7 —English gender gap F 4.4 F 6.6 F 3.5 F 6.1 F 3.1 —Math gender gap F 1.2 M 1.6 F 3.9 F 0.5 n/a n/aGraduation rate 94.9 92.1 95.1 96.8 96.0 —Delayed advancement rate 12.7 11.2 10.4 9.9 11.2 —Overall rating out of 10 6.4 6.2 6.6 6.8 7.2 p
Elgin Park [Public] Surrey Gr 12 Enrollment: 272ESL (%): 13.3 Special needs (%): 9.9 French Imm (%): 0.0Actual rating vs predicted based 2016-17 Last 5 Yearson parents’ avg. inc. of $ n/a: n/a Rank: 57/253 42/246Academic Performance 2013 2014 2015 2016 2017 TrendAverage exam mark 75.6 74.4 73.5 73.6 70.2 qPercentage of exams failed 3.4 5.3 6.9 6.6 10.7 qSchool vs exam mark difference 3.9 4.6 4.5 4.4 9.2 —English gender gap F 5.3 F 3.8 F 2.4 F 4.3 F 0.4 —Math gender gap M 1.4 F 1.2 F 2.9 M 0.7 n/a n/aGraduation rate 98.8 97.6 97.0 98.3 98.8 —Delayed advancement rate 3.3 6.6 5.1 3.8 4.2 —Overall rating out of 10 7.7 7.4 7.2 7.5 7.1 —
Enver Creek [Public] Surrey Gr 12 Enrollment: 252ESL (%): 4.5 Special needs (%): 10.9 French Imm (%): 0.0Actual rating vs predicted based 2016-17 Last 5 Yearson parents’ avg. inc. of $ n/a: n/a Rank: 182/253 133/246Academic Performance 2013 2014 2015 2016 2017 TrendAverage exam mark 69.5 68.2 68.8 67.5 64.8 —Percentage of exams failed 9.1 10.8 10.4 12.7 12.4 —School vs exam mark difference 4.5 6.2 4.3 5.1 8.9 —English gender gap F 3.3 F 5.7 F 5.4 F 5.1 F 6.5 qMath gender gap F 0.1 F 1.5 F 5.2 F 4.2 n/a n/aGraduation rate 95.6 95.6 97.1 97.4 95.3 —Delayed advancement rate 8.4 9.4 9.1 6.4 10.2 —Overall rating out of 10 6.3 5.8 6.2 6.1 5.1 —
Fleetwood Park [Public] Surrey Gr 12 Enrollment: 277ESL (%): 9.4 Special needs (%): 10.9 French Imm (%): 0.0Actual rating vs predicted based 2016-17 Last 5 Yearson parents’ avg. inc. of $ n/a: n/a Rank: 77/253 59/246Academic Performance 2013 2014 2015 2016 2017 TrendAverage exam mark 72.7 72.1 71.0 70.3 69.6 —Percentage of exams failed 5.3 6.3 7.9 10.3 7.0 —School vs exam mark difference 1.7 2.3 2.8 4.8 5.4 —English gender gap F 2.7 F 6.1 F 5.1 F 3.9 F 2.9 —Math gender gap F 1.4 M 1.4 F 1.6 M 0.8 n/a n/aGraduation rate 97.2 97.4 96.8 94.6 94.6 qDelayed advancement rate 5.5 5.8 8.4 8.3 10.2 qOverall rating out of 10 7.6 7.2 7.0 6.5 6.8 q
Frank Hurt [Public] Surrey Gr 12 Enrollment: 258ESL (%): 10.8 Special needs (%): 17.5 French Imm (%): 0.0Actual rating vs predicted based 2016-17 Last 5 Yearson parents’ avg. inc. of $ n/a: n/a Rank: 113/253 188/246Academic Performance 2013 2014 2015 2016 2017 TrendAverage exam mark 65.6 66.2 65.9 65.3 66.8 pPercentage of exams failed 14.2 13.1 12.7 14.1 8.6 pSchool vs exam mark difference 5.3 5.1 5.7 5.2 4.6 pEnglish gender gap F 1.5 F 1.8 F 4.8 F 4.4 M 1.1 —Math gender gap M 5.1 M 2.1 M 1.8 M 5.6 n/a n/aGraduation rate 91.2 87.7 92.1 91.7 93.2 —Delayed advancement rate 15.8 22.0 21.9 20.3 19.7 —Overall rating out of 10 4.5 4.8 5.2 4.9 6.2 p
Fraser Heights [Public] Surrey Gr 12 Enrollment: 307ESL (%): 6.8 Special needs (%): 9.7 French Imm (%): 0.0Actual rating vs predicted based 2016-17 Last 5 Yearson parents’ avg. inc. of $ n/a: n/a Rank: 87/253 92/246Academic Performance 2013 2014 2015 2016 2017 TrendAverage exam mark 73.3 72.7 72.5 70.4 69.1 —Percentage of exams failed 7.3 7.0 7.3 10.5 8.9 —School vs exam mark difference 4.2 5.3 4.7 6.5 9.4 —English gender gap F 5.6 F 4.9 F 3.5 F 5.2 F 1.3 —Math gender gap F 0.4 M 2.6 E F 3.6 n/a n/aGraduation rate 91.7 95.0 96.0 96.9 98.5 pDelayed advancement rate 15.1 12.3 17.0 11.8 13.6 —Overall rating out of 10 6.1 6.5 6.9 6.2 6.7 —
Guildford Park [Public] Surrey Gr 12 Enrollment: 271ESL (%): 18.3 Special needs (%): 19.8 French Imm (%): 0.0Actual rating vs predicted based 2016-17 Last 5 Yearson parents’ avg. inc. of $ n/a: n/a Rank: 149/253 174/246Academic Performance 2013 2014 2015 2016 2017 TrendAverage exam mark 66.6 64.6 66.1 64.2 64.6 —Percentage of exams failed 12.0 16.4 13.3 15.7 9.5 —School vs exam mark difference 4.1 5.1 3.8 6.6 7.1 —English gender gap F 5.0 F 8.3 M 0.1 F 2.0 F 1.7 —Math gender gap F 1.6 M 3.6 F 0.7 F 1.2 n/a n/aGraduation rate 92.9 93.8 98.2 97.3 94.8 —Delayed advancement rate 15.2 25.3 16.6 19.6 20.2 —Overall rating out of 10 5.1 4.3 6.1 5.3 5.7 —
Holy Cross [Independent] Surrey Gr 12 Enrollment: 168ESL (%): 0.0 Special needs (%): 6.9 French Imm (%): 0.0Actual rating vs predicted based 2016-17 Last 5 Yearson parents’ avg. inc. of $ n/a: n/a Rank: 30/253 34/246Academic Performance 2013 2014 2015 2016 2017 TrendAverage exam mark 72.7 73.1 74.1 73.4 71.2 —Percentage of exams failed 4.2 3.0 4.4 2.9 3.7 —School vs exam mark difference 4.3 4.4 5.7 5.6 8.6 —English gender gap F 6.4 F 3.1 F 5.3 F 3.7 F 4.2 —Math gender gap F 6.1 M 1.1 F 4.3 F 2.8 n/a n/aGraduation rate 97.3 98.7 100.0 97.8 99.4 —Delayed advancement rate 4.7 0.7 0.5 3.7 1.0 —Overall rating out of 10 6.8 7.8 7.7 7.8 7.7 —
Johnston Heights [Public] Surrey Gr 12 Enrollment: 297ESL (%): 10.3 Special needs (%): 13.8 French Imm (%): 0.0Actual rating vs predicted based 2016-17 Last 5 Yearson parents’ avg. inc. of $ n/a: n/a Rank: 43/253 121/246Academic Performance 2013 2014 2015 2016 2017 TrendAverage exam mark 68.5 67.9 69.1 67.9 69.1 pPercentage of exams failed 12.7 12.4 10.4 13.4 6.7 pSchool vs exam mark difference 5.6 5.2 4.4 6.7 4.5 —English gender gap F 3.7 F 1.9 F 3.5 F 3.4 F 0.7 —Math gender gap F 1.0 F 0.6 M 1.2 F 3.1 n/a n/aGraduation rate 92.6 92.4 95.3 96.5 97.0 pDelayed advancement rate 12.1 13.7 11.5 9.5 10.3 —Overall rating out of 10 5.2 5.8 6.3 5.9 7.4 p
Kwantlen Park [Public] Surrey Gr 12 Enrollment: 248ESL (%): 7.2 Special needs (%): 12.8 French Imm (%): 14.7Actual rating vs predicted based 2016-17 Last 5 Yearson parents’ avg. inc. of $ n/a: n/a Rank: 139/253 167/246Academic Performance 2013 2014 2015 2016 2017 TrendAverage exam mark 67.7 67.1 67.4 65.9 66.7 —Percentage of exams failed 12.4 13.2 11.9 14.8 11.3 —School vs exam mark difference 4.9 6.3 6.9 6.7 8.0 —English gender gap F 3.3 F 9.4 F 5.4 F 2.3 F 3.0 —Math gender gap F 1.2 F 3.2 F 4.0 F 2.0 n/a n/aGraduation rate 96.3 96.7 96.6 93.2 97.2 —Delayed advancement rate 10.3 11.7 16.7 17.3 15.3 —Overall rating out of 10 5.5 5.1 5.4 5.2 5.9 —
L A Matheson [Public] Surrey Gr 12 Enrollment: 263ESL (%): 11.4 Special needs (%): 13.0 French Imm (%): 0.0Actual rating vs predicted based 2016-17 Last 5 Yearson parents’ avg. inc. of $ n/a: n/a Rank: 217/253 238/246Academic Performance 2013 2014 2015 2016 2017 TrendAverage exam mark 63.9 61.5 62.2 61.4 62.4 —Percentage of exams failed 18.7 24.0 20.1 22.6 16.3 —School vs exam mark difference 7.0 7.8 8.5 10.3 15.4 qEnglish gender gap F 6.5 F 3.7 F 0.8 F 4.5 F 2.6 —Math gender gap F 3.6 M 0.6 M 1.1 F 0.8 n/a n/aGraduation rate 92.9 84.9 90.7 93.0 94.5 —Delayed advancement rate 12.8 25.7 18.3 21.3 18.7 —Overall rating out of 10 3.4 2.6 3.8 3.3 4.0 —
Lord Tweedsmuir [Public] Surrey Gr 12 Enrollment: 405ESL (%): 1.5 Special needs (%): 13.8 French Imm (%): 11.0Actual rating vs predicted based 2016-17 Last 5 Yearson parents’ avg. inc. of $ n/a: n/a Rank: 33/253 87/246Academic Performance 2013 2014 2015 2016 2017 TrendAverage exam mark 69.0 69.1 67.9 68.6 71.3 —Percentage of exams failed 6.7 7.5 8.8 9.0 3.7 —School vs exam mark difference 2.4 3.9 3.9 4.8 1.5 —English gender gap F 3.5 F 6.5 F 4.7 F 4.1 F 3.6 —Math gender gap F 1.1 F 1.5 F 2.4 F 2.2 n/a n/aGraduation rate 94.2 94.2 94.1 95.7 96.2 pDelayed advancement rate 9.4 12.4 17.1 13.4 16.5 —Overall rating out of 10 6.6 6.2 6.1 6.4 7.6 —
North Surrey [Public] Surrey Gr 12 Enrollment: 271ESL (%): 6.7 Special needs (%): 14.0 French Imm (%): 0.0Actual rating vs predicted based 2016-17 Last 5 Yearson parents’ avg. inc. of $ n/a: n/a Rank: 104/253 87/246Academic Performance 2013 2014 2015 2016 2017 TrendAverage exam mark 71.4 71.4 71.0 69.1 68.4 —Percentage of exams failed 6.1 6.7 6.1 9.5 10.7 —School vs exam mark difference 2.3 3.9 5.0 4.4 4.8 —English gender gap F 5.4 F 5.0 F 5.1 F 4.3 F 2.7 pMath gender gap F 5.4 F 2.8 F 1.9 M 1.6 n/a n/aGraduation rate 93.6 96.0 97.4 95.4 95.6 —Delayed advancement rate 7.0 5.7 6.6 9.0 13.3 qOverall rating out of 10 6.3 6.8 7.0 6.5 6.4 —
Pacific Academy [Independent] Surrey Gr 12 Enrollment: 119ESL (%): 1.6 Special needs (%): 7.6 French Imm (%): 0.0Actual rating vs predicted based 2016-17 Last 5 Yearson parents’ avg. inc. of $ n/a: n/a Rank: 17/253 22/246Academic Performance 2013 2014 2015 2016 2017 TrendAverage exam mark 76.0 77.3 74.3 74.4 77.3 —Percentage of exams failed 3.0 1.6 3.5 2.7 3.3 —School vs exam mark difference 4.0 3.6 5.9 7.3 3.8 —English gender gap F 4.6 F 1.8 F 3.4 F 1.9 F 6.4 —Math gender gap M 0.3 M 4.2 F 2.2 M 1.7 n/a n/aGraduation rate 100.0 99.0 99.1 99.2 100.0 —Delayed advancement rate 2.8 0.0 0.0 0.0 0.0 —Overall rating out of 10 8.1 8.4 7.9 8.0 8.7 —
Panorama Ridge [Public] Surrey Gr 12 Enrollment: 325ESL (%): 6.2 Special needs (%): 7.7 French Imm (%): 13.2Actual rating vs predicted based 2016-17 Last 5 Yearson parents’ avg. inc. of $ n/a: n/a Rank: 93/253 121/246Academic Performance 2013 2014 2015 2016 2017 TrendAverage exam mark 68.4 68.2 67.7 67.6 68.1 pPercentage of exams failed 10.9 10.6 9.7 10.6 5.5 pSchool vs exam mark difference 4.1 6.3 5.9 6.2 5.9 —English gender gap F 2.7 F 5.1 F 6.7 F 4.0 F 4.7 —Math gender gap F 0.8 F 4.0 F 0.8 M 1.0 n/a n/aGraduation rate 96.2 97.9 95.1 95.2 95.7 —Delayed advancement rate 6.8 6.1 9.7 7.3 10.6 —Overall rating out of 10 6.0 5.9 5.9 6.1 6.6 —

Fraser Institute Studies in Education Policy 19
Princess Margaret [Public] Surrey Gr 12 Enrollment: 267ESL (%): 12.2 Special needs (%): 10.7 French Imm (%): 0.0Actual rating vs predicted based 2016-17 Last 5 Yearson parents’ avg. inc. of $ n/a: n/a Rank: 109/253 103/246Academic Performance 2013 2014 2015 2016 2017 TrendAverage exam mark 68.5 68.7 69.5 66.6 65.8 —Percentage of exams failed 10.5 9.3 8.3 11.6 9.4 —School vs exam mark difference 3.8 2.8 2.0 3.9 9.2 —English gender gap F 3.9 F 4.9 F 2.5 F 4.3 F 2.1 —Math gender gap F 3.4 M 0.4 M 1.6 F 3.4 n/a n/aGraduation rate 93.8 93.4 96.4 98.3 99.1 pDelayed advancement rate 9.6 15.3 13.8 11.0 12.4 —Overall rating out of 10 5.7 6.2 6.9 6.2 6.3 —
Queen Elizabeth [Public] Surrey Gr 12 Enrollment: 262ESL (%): 7.2 Special needs (%): 11.7 French Imm (%): 0.0Actual rating vs predicted based 2016-17 Last 5 Yearson parents’ avg. inc. of $ n/a: n/a Rank: 227/253 220/246Academic Performance 2013 2014 2015 2016 2017 TrendAverage exam mark 65.5 64.2 64.0 64.0 61.7 —Percentage of exams failed 15.2 17.2 18.5 17.2 18.7 —School vs exam mark difference 4.6 6.1 7.2 6.2 7.3 —English gender gap F 5.7 F 6.0 F 5.9 F 5.4 F 1.7 —Math gender gap F 3.0 F 2.6 F 3.7 E n/a n/aGraduation rate 94.0 93.5 94.2 93.1 87.4 —Delayed advancement rate 16.5 18.5 21.1 20.0 24.0 qOverall rating out of 10 4.3 4.3 4.1 4.5 3.6 —
Regent Christian [Independent] Surrey Gr 12 Enrollment: 57ESL (%): 0.8 Special needs (%): 4.0 French Imm (%): 0.0Actual rating vs predicted based 2016-17 Last 5 Yearson parents’ avg. inc. of $ n/a: n/a Rank: 224/253 103/246Academic Performance 2013 2014 2015 2016 2017 TrendAverage exam mark 75.0 78.1 68.3 69.5 59.7 qPercentage of exams failed 2.7 1.9 13.7 8.6 18.5 qSchool vs exam mark difference 1.7 2.6 6.4 5.4 18.8 qEnglish gender gap F 6.6 F 0.1 M 1.0 F 8.5 M 1.6 —Math gender gap F 3.2 M 0.8 M 3.2 F 1.9 n/a n/aGraduation rate 93.3 97.9 96.5 96.0 94.5 —Delayed advancement rate 7.4 1.0 5.8 3.9 2.3 —Overall rating out of 10 7.2 8.6 5.8 6.1 3.8 q
Semiahmoo [Public] Surrey Gr 12 Enrollment: 352ESL (%): 8.6 Special needs (%): 12.3 French Imm (%): 0.0Actual rating vs predicted based 2016-17 Last 5 Yearson parents’ avg. inc. of $ n/a: n/a Rank: 37/253 34/246Academic Performance 2013 2014 2015 2016 2017 TrendAverage exam mark 75.8 76.5 74.6 75.5 72.1 —Percentage of exams failed 4.5 3.9 5.2 5.2 7.8 —School vs exam mark difference 1.3 1.9 3.0 3.0 7.1 qEnglish gender gap F 5.3 F 7.9 F 3.2 F 3.5 F 3.5 —Math gender gap F 4.0 F 3.2 F 0.1 F 2.3 n/a n/aGraduation rate 94.5 96.7 97.1 97.7 99.1 pDelayed advancement rate 10.9 7.3 4.6 5.8 4.1 pOverall rating out of 10 7.2 7.6 7.8 7.9 7.5 —
Southridge [Independent] Surrey Gr 12 Enrollment: 72ESL (%): 0.0 Special needs (%): 4.3 French Imm (%): 0.0Actual rating vs predicted based 2016-17 Last 5 Yearson parents’ avg. inc. of $ n/a: n/a Rank: 1/253 4/246Academic Performance 2013 2014 2015 2016 2017 TrendAverage exam mark 84.3 84.0 86.2 87.4 82.5 —Percentage of exams failed 0.0 0.0 0.3 0.0 0.0 pSchool vs exam mark difference 0.7 1.0 1.3 1.6 5.9 —English gender gap F 6.5 F 2.0 F 7.9 F 5.9 F 1.5 —Math gender gap F 0.2 F 0.2 F 3.5 F 4.7 n/a n/aGraduation rate 100.0 100.0 98.6 100.0 100.0 —Delayed advancement rate 0.0 0.0 2.2 1.5 2.0 —Overall rating out of 10 9.7 9.8 9.6 9.9 10.0 —
Sullivan Heights [Public] Surrey Gr 12 Enrollment: 286ESL (%): 4.8 Special needs (%): 9.5 French Imm (%): 0.0Actual rating vs predicted based 2016-17 Last 5 Yearson parents’ avg. inc. of $ n/a: n/a Rank: 139/253 133/246Academic Performance 2013 2014 2015 2016 2017 TrendAverage exam mark 68.8 67.1 68.4 67.3 68.1 —Percentage of exams failed 10.1 12.5 8.3 12.1 8.2 —School vs exam mark difference 3.2 2.7 4.0 3.4 4.1 pEnglish gender gap F 7.3 F 1.8 F 5.6 F 6.6 F 6.9 —Math gender gap F 4.6 M 1.3 M 0.5 F 3.2 n/a n/aGraduation rate 92.2 91.8 96.5 95.9 91.9 —Delayed advancement rate 10.5 16.9 9.1 11.4 12.5 —Overall rating out of 10 5.3 5.7 6.6 5.9 5.9 —
Surrey Christian [Independent] Surrey Gr 12 Enrollment: 98ESL (%): 1.5 Special needs (%): 8.5 French Imm (%): 0.0Actual rating vs predicted based 2016-17 Last 5 Yearson parents’ avg. inc. of $ n/a: n/a Rank: 192/253 103/246Academic Performance 2013 2014 2015 2016 2017 TrendAverage exam mark 72.2 72.0 71.9 70.5 62.4 —Percentage of exams failed 6.2 6.1 7.0 7.7 14.3 qSchool vs exam mark difference 6.1 4.5 7.1 8.8 16.1 —English gender gap F 8.2 F 0.7 F 6.8 F 1.2 F 3.3 —Math gender gap M 5.4 M 5.2 F 2.8 M 6.4 n/a n/aGraduation rate 98.9 100.0 99.1 97.8 99.0 —Delayed advancement rate 6.8 10.7 6.0 2.3 4.2 —Overall rating out of 10 6.5 7.2 6.7 6.4 4.9 —
Tamanawis [Public] Surrey Gr 12 Enrollment: 308ESL (%): 8.8 Special needs (%): 8.2 French Imm (%): 0.0Actual rating vs predicted based 2016-17 Last 5 Yearson parents’ avg. inc. of $ n/a: n/a Rank: 109/253 127/246Academic Performance 2013 2014 2015 2016 2017 TrendAverage exam mark 67.5 68.2 68.9 67.1 66.9 —Percentage of exams failed 11.6 11.1 9.8 11.6 8.2 pSchool vs exam mark difference 3.4 6.0 6.0 4.5 7.5 —English gender gap F 2.6 F 3.8 F 3.2 F 4.5 F 2.7 qMath gender gap M 0.2 F 1.7 F 3.1 F 2.1 n/a n/aGraduation rate 93.8 94.7 96.5 96.6 95.2 —Delayed advancement rate 13.7 13.5 9.3 9.7 10.8 —Overall rating out of 10 5.6 5.7 6.2 6.2 6.3 p
VanCOuVeRBritannia [Public] Vancouver Gr 12 Enrollment: 141ESL (%): 2.1 Special needs (%): 26.5 French Imm (%): 0.0Actual rating vs predicted based 2016-17 Last 5 Yearson parents’ avg. inc. of $ n/a: n/a Rank: 246/253 233/246Academic Performance 2013 2014 2015 2016 2017 TrendAverage exam mark 65.2 65.1 61.1 62.8 62.5 —Percentage of exams failed 15.5 17.3 23.8 19.3 18.9 —School vs exam mark difference 3.2 4.1 10.6 8.2 12.3 —English gender gap F 0.9 F 2.3 M 1.1 F 3.0 M 4.1 qMath gender gap F 4.3 M 3.2 E M 5.5 n/a n/aGraduation rate 91.4 92.3 92.3 96.5 85.1 —Delayed advancement rate 26.0 24.3 16.5 21.7 35.2 —Overall rating out of 10 4.4 4.7 3.6 4.1 2.4 q
Crofton House [Independent] Vancouver Gr 12 Enrollment: 92ESL (%): 0.0 Special needs (%): 3.5 French Imm (%): 0.0Actual rating vs predicted based 2016-17 Last 5 Yearson parents’ avg. inc. of $ n/a: n/a Rank: 1/253 2/246Academic Performance 2013 2014 2015 2016 2017 TrendAverage exam mark 85.5 85.1 84.9 86.3 82.9 —Percentage of exams failed 0.2 0.8 0.2 0.8 0.0 pSchool vs exam mark difference 1.2 2.6 2.1 1.0 2.5 —English gender gap n/a n/a n/a n/a n/a n/aMath gender gap n/a n/a n/a n/a n/a n/aGraduation rate 100.0 100.0 100.0 100.0 100.0 —Delayed advancement rate 4.6 0.0 1.5 2.0 0.0 —Overall rating out of 10 10.0 9.7 10.0 10.0 10.0 p
David Thompson [Public] Vancouver Gr 12 Enrollment: 310ESL (%): 4.9 Special needs (%): 9.5 French Imm (%): 0.0Actual rating vs predicted based 2016-17 Last 5 Yearson parents’ avg. inc. of $ n/a: n/a Rank: 145/253 98/246Academic Performance 2013 2014 2015 2016 2017 TrendAverage exam mark 70.6 72.0 71.2 70.7 66.7 —Percentage of exams failed 8.4 8.1 7.3 7.3 10.2 —School vs exam mark difference 1.8 1.8 4.6 3.5 10.2 —English gender gap F 4.6 F 1.7 F 3.2 F 1.3 M 1.2 —Math gender gap M 0.4 M 0.7 F 3.7 M 2.3 n/a n/aGraduation rate 92.7 93.9 94.7 95.5 93.8 —Delayed advancement rate 19.4 15.1 17.2 17.9 14.9 —Overall rating out of 10 6.0 6.9 6.4 6.9 5.8 —
Eric Hamber [Public] Vancouver Gr 12 Enrollment: 350ESL (%): 3.2 Special needs (%): 15.1 French Imm (%): 0.0Actual rating vs predicted based 2016-17 Last 5 Yearson parents’ avg. inc. of $ n/a: n/a Rank: 113/253 65/246Academic Performance 2013 2014 2015 2016 2017 TrendAverage exam mark 73.9 73.3 74.3 73.7 70.1 —Percentage of exams failed 6.4 6.0 3.8 5.9 10.3 —School vs exam mark difference 2.2 1.7 1.8 2.3 7.2 —English gender gap F 2.4 F 2.4 F 7.2 F 1.4 F 3.1 —Math gender gap M 2.1 M 1.0 M 1.0 F 2.1 n/a n/aGraduation rate 94.1 97.4 95.6 96.4 94.7 —Delayed advancement rate 28.0 23.1 19.4 23.8 18.6 —Overall rating out of 10 6.5 7.3 7.4 7.3 6.2 —
Gladstone [Public] Vancouver Gr 12 Enrollment: 275ESL (%): 4.5 Special needs (%): 16.0 French Imm (%): 0.0Actual rating vs predicted based 2016-17 Last 5 Yearson parents’ avg. inc. of $ n/a: n/a Rank: 199/253 163/246Academic Performance 2013 2014 2015 2016 2017 TrendAverage exam mark 69.1 68.3 66.9 66.0 63.8 qPercentage of exams failed 10.2 9.4 13.1 11.7 15.5 —School vs exam mark difference 4.0 5.8 6.6 7.9 10.1 —English gender gap F 5.2 F 6.6 F 2.8 F 3.0 F 0.2 pMath gender gap F 2.3 F 2.8 M 0.5 M 0.7 n/a n/aGraduation rate 94.7 96.2 97.9 96.5 91.2 —Delayed advancement rate 22.3 25.2 11.6 17.9 22.4 —Overall rating out of 10 5.5 5.5 6.0 5.6 4.7 —
John Oliver [Public] Vancouver Gr 12 Enrollment: 222ESL (%): 14.9 Special needs (%): 15.5 French Imm (%): 0.0Actual rating vs predicted based 2016-17 Last 5 Yearson parents’ avg. inc. of $ n/a: n/a Rank: 239/253 212/246Academic Performance 2013 2014 2015 2016 2017 TrendAverage exam mark 65.6 65.9 67.1 64.0 60.2 —Percentage of exams failed 12.9 13.6 9.6 16.0 20.6 —School vs exam mark difference 3.5 2.8 2.9 4.2 12.1 —English gender gap F 1.5 F 0.3 F 4.2 F 2.9 F 2.0 —Math gender gap F 2.0 M 6.5 M 3.1 F 4.9 n/a n/aGraduation rate 87.6 94.7 93.8 90.7 91.0 —Delayed advancement rate 26.5 25.0 25.7 23.4 33.4 —Overall rating out of 10 4.4 5.2 5.8 4.6 2.7 —
Killarney [Public] Vancouver Gr 12 Enrollment: 434ESL (%): 6.5 Special needs (%): 13.0 French Imm (%): 0.0Actual rating vs predicted based 2016-17 Last 5 Yearson parents’ avg. inc. of $ n/a: n/a Rank: 177/253 163/246Academic Performance 2013 2014 2015 2016 2017 TrendAverage exam mark 71.3 69.4 69.2 69.2 67.8 —Percentage of exams failed 9.2 10.0 9.1 9.8 10.6 —School vs exam mark difference 3.0 5.1 4.7 4.5 8.3 —English gender gap F 4.3 F 7.8 F 5.1 F 2.8 F 3.6 —Math gender gap F 0.8 F 2.0 F 2.2 M 0.5 n/a n/aGraduation rate 92.8 88.9 94.1 95.3 93.5 —Delayed advancement rate 25.4 32.6 27.4 26.8 30.0 —Overall rating out of 10 5.7 4.8 5.7 6.1 5.2 —
King David [Independent] Vancouver Gr 12 Enrollment: 48ESL (%): 0.0 Special needs (%): 19.2 French Imm (%): 0.0Actual rating vs predicted based 2016-17 Last 5 Yearson parents’ avg. inc. of $ n/a: n/a Rank: 15/253 17/246Academic Performance 2013 2014 2015 2016 2017 TrendAverage exam mark 79.0 78.0 75.9 76.4 75.8 —Percentage of exams failed 0.7 1.7 0.6 1.4 0.0 —School vs exam mark difference 3.5 3.2 4.3 4.8 7.7 —English gender gap n/a M 5.2 F 2.2 M 4.4 M 0.9 n/aMath gender gap n/a M 8.5 F 2.3 M 0.1 n/a n/aGraduation rate 95.5 100.0 100.0 100.0 100.0 —Delayed advancement rate 9.3 0.0 0.5 1.7 3.4 —Overall rating out of 10 8.1 8.1 8.5 8.6 9.1 p
King George [Public] Vancouver Gr 12 Enrollment: 109ESL (%): 9.2 Special needs (%): 11.1 French Imm (%): 0.0Actual rating vs predicted based 2016-17 Last 5 Yearson parents’ avg. inc. of $ n/a: n/a Rank: 120/253 194/246Academic Performance 2013 2014 2015 2016 2017 TrendAverage exam mark 67.0 66.6 67.5 68.5 67.1 pPercentage of exams failed 12.1 13.9 11.7 9.0 5.6 pSchool vs exam mark difference 5.7 7.7 5.0 5.2 7.5 —English gender gap F 3.0 F 6.0 F 3.1 F 0.7 F 0.9 —Math gender gap M 8.3 F 2.1 F 3.0 F 0.9 n/a n/aGraduation rate 93.2 85.9 97.3 85.9 91.8 —Delayed advancement rate 24.2 36.7 16.2 24.7 25.1 —Overall rating out of 10 4.2 3.4 6.0 5.4 6.1 —
Kitsilano [Public] Vancouver Gr 12 Enrollment: 282ESL (%): 2.0 Special needs (%): 12.0 French Imm (%): 33.9Actual rating vs predicted based 2016-17 Last 5 Yearson parents’ avg. inc. of $ n/a: n/a Rank: 77/253 59/246Academic Performance 2013 2014 2015 2016 2017 TrendAverage exam mark 74.4 73.9 71.1 71.9 71.8 —Percentage of exams failed 6.1 6.0 6.8 5.5 6.5 —School vs exam mark difference 1.3 1.4 3.1 3.5 9.1 qEnglish gender gap F 1.9 F 5.2 F 6.5 F 5.2 F 3.6 —Math gender gap F 2.0 F 0.4 F 3.9 F 1.0 n/a n/aGraduation rate 97.7 93.3 96.9 94.1 96.4 —Delayed advancement rate 16.8 19.8 11.8 12.9 14.5 —Overall rating out of 10 7.4 7.0 6.8 7.1 6.8 —
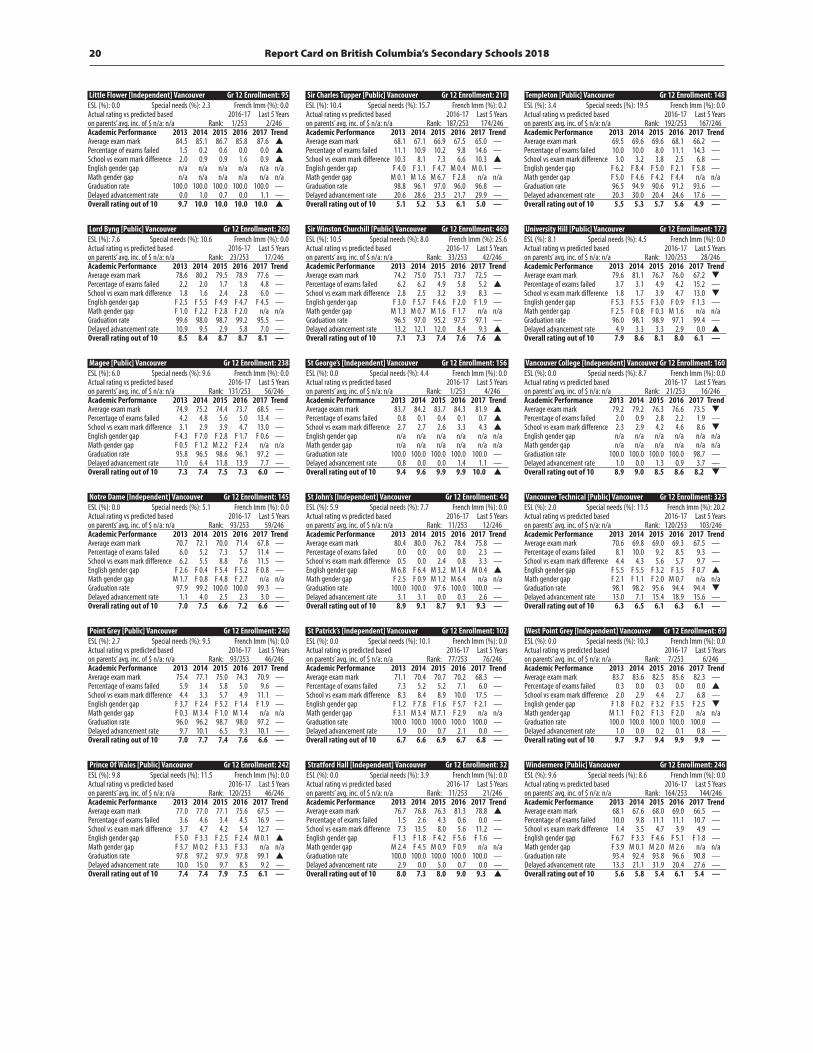
Report Card on British Columbia’s Secondary Schools 201820
Little Flower [Independent] Vancouver Gr 12 Enrollment: 95ESL (%): 0.0 Special needs (%): 2.3 French Imm (%): 0.0Actual rating vs predicted based 2016-17 Last 5 Yearson parents’ avg. inc. of $ n/a: n/a Rank: 1/253 2/246Academic Performance 2013 2014 2015 2016 2017 TrendAverage exam mark 84.5 85.1 86.7 85.8 87.6 pPercentage of exams failed 1.5 0.2 0.6 0.0 0.0 pSchool vs exam mark difference 2.0 0.9 0.9 1.6 0.9 pEnglish gender gap n/a n/a n/a n/a n/a n/aMath gender gap n/a n/a n/a n/a n/a n/aGraduation rate 100.0 100.0 100.0 100.0 100.0 —Delayed advancement rate 0.0 1.0 0.7 0.0 1.1 —Overall rating out of 10 9.7 10.0 10.0 10.0 10.0 p
Lord Byng [Public] Vancouver Gr 12 Enrollment: 260ESL (%): 7.6 Special needs (%): 10.6 French Imm (%): 0.0Actual rating vs predicted based 2016-17 Last 5 Yearson parents’ avg. inc. of $ n/a: n/a Rank: 23/253 17/246Academic Performance 2013 2014 2015 2016 2017 TrendAverage exam mark 78.6 80.2 79.5 78.9 77.6 —Percentage of exams failed 2.2 2.0 1.7 1.8 4.8 —School vs exam mark difference 1.8 1.6 2.4 2.8 6.0 —English gender gap F 2.5 F 5.5 F 4.9 F 4.7 F 4.5 —Math gender gap F 1.0 F 2.2 F 2.8 F 2.0 n/a n/aGraduation rate 99.6 98.0 98.7 99.2 95.5 —Delayed advancement rate 10.9 9.5 2.9 5.8 7.0 —Overall rating out of 10 8.5 8.4 8.7 8.7 8.1 —
Magee [Public] Vancouver Gr 12 Enrollment: 238ESL (%): 6.0 Special needs (%): 9.6 French Imm (%): 0.0Actual rating vs predicted based 2016-17 Last 5 Yearson parents’ avg. inc. of $ n/a: n/a Rank: 131/253 56/246Academic Performance 2013 2014 2015 2016 2017 TrendAverage exam mark 74.9 75.2 74.4 73.7 68.5 —Percentage of exams failed 4.2 4.8 5.6 5.0 13.4 —School vs exam mark difference 3.1 2.9 3.9 4.7 13.0 —English gender gap F 4.3 F 7.0 F 2.8 F 1.7 F 0.6 —Math gender gap F 0.5 F 1.2 M 2.2 F 2.4 n/a n/aGraduation rate 95.8 96.5 98.6 96.1 97.2 —Delayed advancement rate 11.0 6.4 11.8 13.9 7.7 —Overall rating out of 10 7.3 7.4 7.5 7.3 6.0 —
Notre Dame [Independent] Vancouver Gr 12 Enrollment: 145ESL (%): 0.0 Special needs (%): 5.1 French Imm (%): 0.0Actual rating vs predicted based 2016-17 Last 5 Yearson parents’ avg. inc. of $ n/a: n/a Rank: 93/253 59/246Academic Performance 2013 2014 2015 2016 2017 TrendAverage exam mark 70.7 72.1 70.0 71.4 67.8 —Percentage of exams failed 6.0 5.2 7.3 5.7 11.4 —School vs exam mark difference 6.2 5.5 8.8 7.6 11.5 —English gender gap F 2.6 F 0.4 F 5.4 F 5.2 F 0.8 —Math gender gap M 1.7 F 0.8 F 4.8 F 2.7 n/a n/aGraduation rate 97.9 99.2 100.0 100.0 99.3 —Delayed advancement rate 1.1 4.0 2.5 2.3 3.0 —Overall rating out of 10 7.0 7.5 6.6 7.2 6.6 —
Point Grey [Public] Vancouver Gr 12 Enrollment: 240ESL (%): 2.7 Special needs (%): 9.5 French Imm (%): 0.0Actual rating vs predicted based 2016-17 Last 5 Yearson parents’ avg. inc. of $ n/a: n/a Rank: 93/253 46/246Academic Performance 2013 2014 2015 2016 2017 TrendAverage exam mark 75.4 77.1 75.0 74.3 70.9 —Percentage of exams failed 5.9 3.4 5.8 5.0 9.6 —School vs exam mark difference 4.4 3.3 5.7 4.9 11.1 —English gender gap F 3.7 F 2.4 F 5.2 F 1.4 F 1.9 —Math gender gap F 0.3 M 3.4 F 1.0 M 1.4 n/a n/aGraduation rate 96.0 96.2 98.7 98.0 97.2 —Delayed advancement rate 9.7 10.1 6.5 9.3 10.1 —Overall rating out of 10 7.0 7.7 7.4 7.6 6.6 —
Prince Of Wales [Public] Vancouver Gr 12 Enrollment: 242ESL (%): 9.8 Special needs (%): 11.5 French Imm (%): 0.0Actual rating vs predicted based 2016-17 Last 5 Yearson parents’ avg. inc. of $ n/a: n/a Rank: 120/253 46/246Academic Performance 2013 2014 2015 2016 2017 TrendAverage exam mark 77.0 77.0 77.1 75.6 67.5 —Percentage of exams failed 3.6 4.6 3.4 4.5 16.9 —School vs exam mark difference 3.7 4.7 4.2 5.4 12.7 —English gender gap F 5.0 F 3.3 F 2.5 F 2.4 M 0.1 pMath gender gap F 3.7 M 0.2 F 3.3 F 3.3 n/a n/aGraduation rate 97.8 97.2 97.9 97.8 99.1 pDelayed advancement rate 10.0 15.0 9.7 8.5 9.2 —Overall rating out of 10 7.4 7.4 7.9 7.5 6.1 —
Sir Charles Tupper [Public] Vancouver Gr 12 Enrollment: 210ESL (%): 10.4 Special needs (%): 15.7 French Imm (%): 0.2Actual rating vs predicted based 2016-17 Last 5 Yearson parents’ avg. inc. of $ n/a: n/a Rank: 187/253 174/246Academic Performance 2013 2014 2015 2016 2017 TrendAverage exam mark 68.1 67.1 66.9 67.5 65.0 —Percentage of exams failed 11.1 10.9 10.2 9.8 14.6 —School vs exam mark difference 10.3 8.1 7.3 6.6 10.3 pEnglish gender gap F 4.0 F 3.1 F 4.7 M 0.4 M 0.1 —Math gender gap M 0.1 M 1.6 M 6.7 F 2.8 n/a n/aGraduation rate 98.8 96.1 97.0 96.0 96.8 —Delayed advancement rate 20.6 28.6 23.5 21.7 29.9 —Overall rating out of 10 5.1 5.2 5.3 6.1 5.0 —
Sir Winston Churchill [Public] Vancouver Gr 12 Enrollment: 460ESL (%): 10.5 Special needs (%): 8.0 French Imm (%): 25.6Actual rating vs predicted based 2016-17 Last 5 Yearson parents’ avg. inc. of $ n/a: n/a Rank: 33/253 42/246Academic Performance 2013 2014 2015 2016 2017 TrendAverage exam mark 74.2 75.0 75.1 73.7 72.5 —Percentage of exams failed 6.2 6.2 4.9 5.8 5.2 pSchool vs exam mark difference 2.8 2.5 3.2 3.9 8.3 —English gender gap F 3.0 F 5.7 F 4.6 F 2.0 F 1.9 —Math gender gap M 1.3 M 0.7 M 1.6 F 1.7 n/a n/aGraduation rate 96.5 97.0 95.2 97.5 97.1 —Delayed advancement rate 13.2 12.1 12.0 8.4 9.3 pOverall rating out of 10 7.1 7.3 7.4 7.6 7.6 p
St George’s [Independent] Vancouver Gr 12 Enrollment: 156ESL (%): 0.0 Special needs (%): 4.4 French Imm (%): 0.0Actual rating vs predicted based 2016-17 Last 5 Yearson parents’ avg. inc. of $ n/a: n/a Rank: 1/253 4/246Academic Performance 2013 2014 2015 2016 2017 TrendAverage exam mark 83.7 84.2 83.7 84.3 81.9 pPercentage of exams failed 0.8 0.1 0.4 0.1 0.7 pSchool vs exam mark difference 2.7 2.7 2.6 3.3 4.3 pEnglish gender gap n/a n/a n/a n/a n/a n/aMath gender gap n/a n/a n/a n/a n/a n/aGraduation rate 100.0 100.0 100.0 100.0 100.0 —Delayed advancement rate 0.8 0.0 0.0 1.4 1.1 —Overall rating out of 10 9.4 9.6 9.9 9.9 10.0 p
St John’s [Independent] Vancouver Gr 12 Enrollment: 44ESL (%): 5.9 Special needs (%): 7.7 French Imm (%): 0.0Actual rating vs predicted based 2016-17 Last 5 Yearson parents’ avg. inc. of $ n/a: n/a Rank: 11/253 12/246Academic Performance 2013 2014 2015 2016 2017 TrendAverage exam mark 80.4 80.0 76.2 78.4 75.8 —Percentage of exams failed 0.0 0.0 0.0 0.0 2.3 —School vs exam mark difference 0.5 0.0 2.4 0.8 3.3 —English gender gap M 6.8 F 6.4 M 3.2 M 1.4 M 0.4 pMath gender gap F 2.5 F 0.9 M 1.2 M 6.4 n/a n/aGraduation rate 100.0 100.0 97.6 100.0 100.0 —Delayed advancement rate 3.1 3.1 0.0 0.3 2.6 —Overall rating out of 10 8.9 9.1 8.7 9.1 9.3 —
St Patrick’s [Independent] Vancouver Gr 12 Enrollment: 102ESL (%): 0.0 Special needs (%): 10.1 French Imm (%): 0.0Actual rating vs predicted based 2016-17 Last 5 Yearson parents’ avg. inc. of $ n/a: n/a Rank: 77/253 76/246Academic Performance 2013 2014 2015 2016 2017 TrendAverage exam mark 71.1 70.4 70.7 70.2 68.3 —Percentage of exams failed 7.3 5.2 5.2 7.1 6.0 —School vs exam mark difference 8.3 8.4 8.9 10.0 17.5 —English gender gap F 1.2 F 7.8 F 1.6 F 5.7 F 2.1 —Math gender gap F 3.1 M 3.4 M 7.1 F 2.9 n/a n/aGraduation rate 100.0 100.0 100.0 100.0 100.0 —Delayed advancement rate 1.9 0.0 0.7 2.1 0.0 —Overall rating out of 10 6.7 6.6 6.9 6.7 6.8 —
Stratford Hall [Independent] Vancouver Gr 12 Enrollment: 32ESL (%): 0.0 Special needs (%): 3.9 French Imm (%): 0.0Actual rating vs predicted based 2016-17 Last 5 Yearson parents’ avg. inc. of $ n/a: n/a Rank: 11/253 21/246Academic Performance 2013 2014 2015 2016 2017 TrendAverage exam mark 76.7 76.8 76.3 81.3 78.8 pPercentage of exams failed 1.5 2.6 4.3 0.6 0.0 —School vs exam mark difference 7.3 13.5 8.0 5.6 11.2 —English gender gap F 1.3 F 1.8 F 4.2 F 5.6 F 1.6 —Math gender gap M 2.4 F 4.5 M 0.9 F 0.9 n/a n/aGraduation rate 100.0 100.0 100.0 100.0 100.0 —Delayed advancement rate 2.9 0.0 5.0 0.7 0.0 —Overall rating out of 10 8.0 7.3 8.0 9.0 9.3 p
Templeton [Public] Vancouver Gr 12 Enrollment: 148ESL (%): 3.4 Special needs (%): 19.5 French Imm (%): 0.0Actual rating vs predicted based 2016-17 Last 5 Yearson parents’ avg. inc. of $ n/a: n/a Rank: 192/253 167/246Academic Performance 2013 2014 2015 2016 2017 TrendAverage exam mark 69.5 69.6 69.6 68.1 66.2 —Percentage of exams failed 10.0 10.0 8.0 11.1 14.3 —School vs exam mark difference 3.0 3.2 3.8 2.5 6.8 —English gender gap F 6.2 F 8.4 F 5.0 F 2.1 F 5.8 —Math gender gap F 5.0 F 4.6 F 4.2 F 4.4 n/a n/aGraduation rate 96.5 94.9 90.6 91.2 93.6 —Delayed advancement rate 20.3 30.0 20.4 24.6 17.6 —Overall rating out of 10 5.5 5.3 5.7 5.6 4.9 —
University Hill [Public] Vancouver Gr 12 Enrollment: 172ESL (%): 8.1 Special needs (%): 4.5 French Imm (%): 0.0Actual rating vs predicted based 2016-17 Last 5 Yearson parents’ avg. inc. of $ n/a: n/a Rank: 120/253 28/246Academic Performance 2013 2014 2015 2016 2017 TrendAverage exam mark 79.6 81.1 76.7 76.0 67.2 qPercentage of exams failed 3.7 3.1 4.9 4.2 15.2 —School vs exam mark difference 1.8 1.7 3.9 4.7 13.0 qEnglish gender gap F 5.3 F 5.5 F 3.0 F 0.9 F 1.3 —Math gender gap F 2.5 F 0.8 F 0.3 M 1.6 n/a n/aGraduation rate 96.0 98.1 98.9 97.1 99.4 —Delayed advancement rate 4.9 3.3 3.3 2.9 0.0 pOverall rating out of 10 7.9 8.6 8.1 8.0 6.1 —
Vancouver College [Independent] Vancouver Gr 12 Enrollment: 160ESL (%): 0.0 Special needs (%): 8.7 French Imm (%): 0.0Actual rating vs predicted based 2016-17 Last 5 Yearson parents’ avg. inc. of $ n/a: n/a Rank: 21/253 16/246Academic Performance 2013 2014 2015 2016 2017 TrendAverage exam mark 79.2 79.2 76.3 76.6 73.5 qPercentage of exams failed 2.0 0.9 2.8 2.2 1.9 —School vs exam mark difference 2.3 2.9 4.2 4.6 8.6 qEnglish gender gap n/a n/a n/a n/a n/a n/aMath gender gap n/a n/a n/a n/a n/a n/aGraduation rate 100.0 100.0 100.0 100.0 98.7 —Delayed advancement rate 1.0 0.0 1.3 0.9 3.7 —Overall rating out of 10 8.9 9.0 8.5 8.6 8.2 q
Vancouver Technical [Public] Vancouver Gr 12 Enrollment: 325ESL (%): 2.0 Special needs (%): 11.5 French Imm (%): 20.2Actual rating vs predicted based 2016-17 Last 5 Yearson parents’ avg. inc. of $ n/a: n/a Rank: 120/253 103/246Academic Performance 2013 2014 2015 2016 2017 TrendAverage exam mark 70.6 69.8 69.0 69.3 67.5 —Percentage of exams failed 8.1 10.0 9.2 8.5 9.3 —School vs exam mark difference 4.4 4.3 5.6 5.7 9.7 —English gender gap F 5.5 F 5.5 F 3.2 F 3.5 F 0.7 pMath gender gap F 2.1 F 1.1 F 2.0 M 0.7 n/a n/aGraduation rate 98.1 98.2 95.6 94.4 94.4 qDelayed advancement rate 13.0 7.1 15.4 18.9 15.6 —Overall rating out of 10 6.3 6.5 6.1 6.3 6.1 —
West Point Grey [Independent] Vancouver Gr 12 Enrollment: 69ESL (%): 0.0 Special needs (%): 10.3 French Imm (%): 0.0Actual rating vs predicted based 2016-17 Last 5 Yearson parents’ avg. inc. of $ n/a: n/a Rank: 7/253 6/246Academic Performance 2013 2014 2015 2016 2017 TrendAverage exam mark 83.7 83.6 82.5 85.6 82.3 —Percentage of exams failed 0.3 0.0 0.3 0.0 0.0 pSchool vs exam mark difference 2.0 2.9 4.4 2.7 6.8 —English gender gap F 1.8 F 0.2 F 3.2 F 3.5 F 2.5 qMath gender gap M 1.1 F 0.2 F 1.3 F 2.0 n/a n/aGraduation rate 100.0 100.0 100.0 100.0 100.0 —Delayed advancement rate 1.0 0.0 0.2 0.1 0.8 —Overall rating out of 10 9.7 9.7 9.4 9.9 9.9 —
Windermere [Public] Vancouver Gr 12 Enrollment: 246ESL (%): 9.6 Special needs (%): 8.6 French Imm (%): 0.0Actual rating vs predicted based 2016-17 Last 5 Yearson parents’ avg. inc. of $ n/a: n/a Rank: 164/253 144/246Academic Performance 2013 2014 2015 2016 2017 TrendAverage exam mark 68.1 67.6 68.0 69.0 66.5 —Percentage of exams failed 10.0 9.8 11.1 11.1 10.7 —School vs exam mark difference 1.4 3.5 4.7 3.9 4.9 —English gender gap F 6.7 F 3.3 F 4.6 F 5.1 F 1.8 —Math gender gap F 3.9 M 0.1 M 2.0 M 2.6 n/a n/aGraduation rate 93.4 92.4 93.8 96.6 90.8 —Delayed advancement rate 13.3 21.1 31.9 20.4 27.6 —Overall rating out of 10 5.6 5.8 5.4 6.1 5.4 —

Fraser Institute Studies in Education Policy 21
York House [Independent] Vancouver Gr 12 Enrollment: 63ESL (%): 0.0 Special needs (%): 13.0 French Imm (%): 0.0Actual rating vs predicted based 2016-17 Last 5 Yearson parents’ avg. inc. of $ n/a: n/a Rank: 1/253 1/246Academic Performance 2013 2014 2015 2016 2017 TrendAverage exam mark 87.8 86.1 86.6 86.2 87.2 —Percentage of exams failed 0.3 0.0 0.0 0.6 0.0 pSchool vs exam mark difference 0.6 1.8 2.8 2.0 3.1 —English gender gap n/a n/a n/a n/a n/a n/aMath gender gap n/a n/a n/a n/a n/a n/aGraduation rate 100.0 100.0 100.0 100.0 100.0 —Delayed advancement rate 2.3 0.0 3.1 1.5 0.6 —Overall rating out of 10 10.0 10.0 10.0 10.0 10.0 —
weST VanCOuVeRCollingwood [Independent] West Vancouver Gr 12 Enrollment: 120ESL (%): 0.0 Special needs (%): 2.8 French Imm (%): 0.0Actual rating vs predicted based 2016-17 Last 5 Yearson parents’ avg. inc. of $ n/a: n/a Rank: 1/253 6/246Academic Performance 2013 2014 2015 2016 2017 TrendAverage exam mark 81.8 82.4 82.4 83.3 81.6 pPercentage of exams failed 2.1 1.1 1.0 0.2 0.0 pSchool vs exam mark difference 1.4 1.6 1.5 1.8 4.9 —English gender gap F 2.4 F 0.7 M 1.1 F 5.3 F 0.2 —Math gender gap M 1.5 M 0.4 M 0.9 F 0.2 n/a n/aGraduation rate 100.0 100.0 100.0 100.0 100.0 —Delayed advancement rate 0.0 0.0 0.0 0.0 0.0 —Overall rating out of 10 9.3 9.6 9.8 9.8 10.0 p
Mulgrave [Independent] West Vancouver Gr 12 Enrollment: 70ESL (%): 0.0 Special needs (%): 0.3 French Imm (%): 0.0Actual rating vs predicted based 2016-17 Last 5 Yearson parents’ avg. inc. of $ n/a: n/a Rank: 10/253 12/246Academic Performance 2013 2014 2015 2016 2017 TrendAverage exam mark 80.2 80.1 79.1 78.3 78.2 —Percentage of exams failed 0.4 1.0 1.7 2.5 0.0 —School vs exam mark difference 4.8 3.9 4.2 4.9 4.6 pEnglish gender gap F 2.0 F 3.3 M 0.1 n/a F 1.6 n/aMath gender gap F 4.9 M 1.7 M 1.3 n/a n/a n/aGraduation rate 100.0 98.6 100.0 100.0 100.0 —Delayed advancement rate 0.0 0.5 0.0 2.1 0.0 —Overall rating out of 10 8.7 8.7 9.1 8.7 9.7 —
Rockridge [Public] West Vancouver Gr 12 Enrollment: 172ESL (%): 2.0 Special needs (%): 12.2 French Imm (%): 0.0Actual rating vs predicted based 2016-17 Last 5 Yearson parents’ avg. inc. of $ n/a: n/a Rank: 37/253 34/246Academic Performance 2013 2014 2015 2016 2017 TrendAverage exam mark 75.1 75.7 73.2 73.5 70.1 —Percentage of exams failed 5.4 4.1 5.2 5.0 6.3 —School vs exam mark difference 3.6 3.2 2.7 2.2 3.2 pEnglish gender gap F 5.0 F 6.9 F 4.7 F 4.5 F 3.5 —Math gender gap F 1.8 F 2.7 M 0.1 F 1.2 n/a n/aGraduation rate 100.0 98.4 99.4 97.3 97.6 qDelayed advancement rate 2.9 7.4 4.4 7.4 6.9 —Overall rating out of 10 7.5 7.6 7.8 7.7 7.5 —
Sentinel [Public] West Vancouver Gr 12 Enrollment: 267ESL (%): 7.8 Special needs (%): 5.3 French Imm (%): 29.7Actual rating vs predicted based 2016-17 Last 5 Yearson parents’ avg. inc. of $ n/a: n/a Rank: 46/253 26/246Academic Performance 2013 2014 2015 2016 2017 TrendAverage exam mark 76.2 76.5 76.3 76.2 70.9 —Percentage of exams failed 4.4 4.0 3.6 3.6 9.2 —School vs exam mark difference 1.9 2.8 2.7 2.7 8.8 —English gender gap F 3.1 F 2.7 F 3.4 F 3.2 E —Math gender gap F 2.2 M 1.4 F 1.4 F 4.5 n/a n/aGraduation rate 96.6 99.0 98.6 97.3 96.9 —Delayed advancement rate 3.0 3.8 6.0 5.5 4.8 —Overall rating out of 10 7.9 8.1 8.2 8.0 7.3 —
West Vancouver [Public] West Vancouver Gr 12 Enrollment: 272ESL (%): 7.8 Special needs (%): 9.4 French Imm (%): 0.0Actual rating vs predicted based 2016-17 Last 5 Yearson parents’ avg. inc. of $ n/a: n/a Rank: 113/253 76/246Academic Performance 2013 2014 2015 2016 2017 TrendAverage exam mark 74.5 73.0 70.8 71.3 67.2 qPercentage of exams failed 7.1 7.1 9.9 8.4 12.1 —School vs exam mark difference 3.4 3.6 4.7 5.4 13.0 —English gender gap F 5.9 F 4.8 F 4.7 F 1.5 F 1.8 —Math gender gap F 1.5 F 5.7 F 2.1 M 4.3 n/a n/aGraduation rate 98.9 97.5 97.3 98.2 99.2 —Delayed advancement rate 7.2 3.5 8.5 8.9 3.2 —Overall rating out of 10 7.0 6.9 6.4 6.8 6.2 —
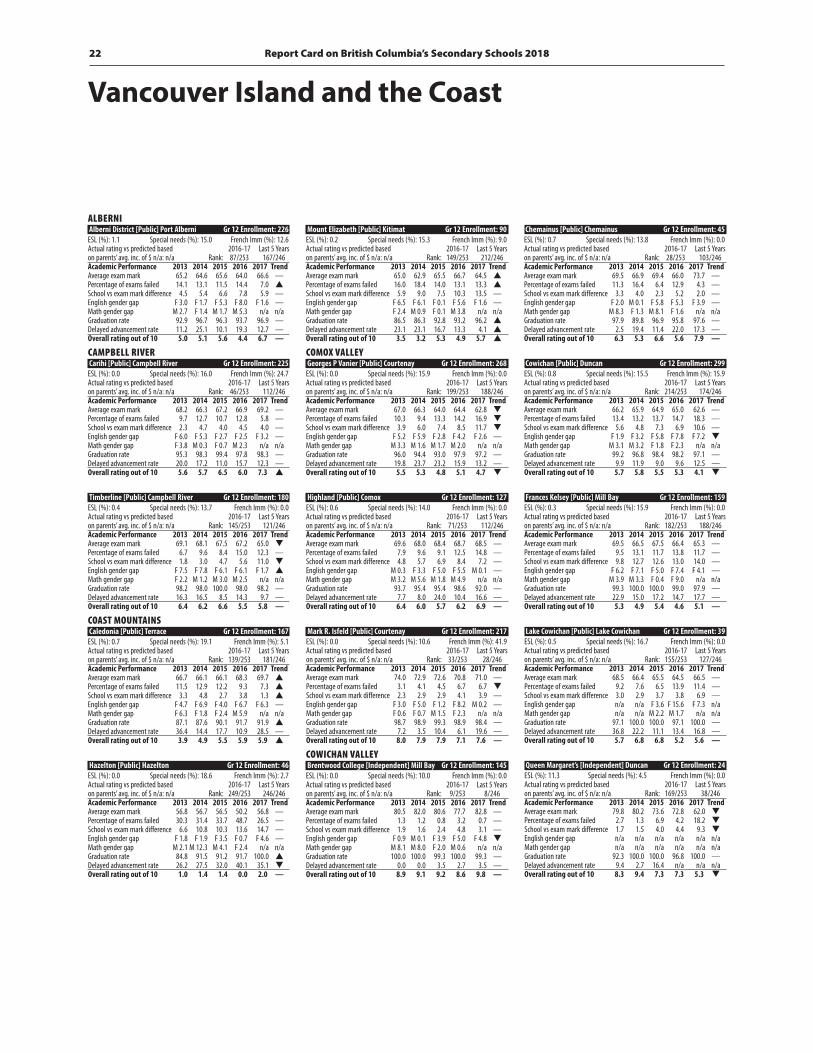
Report Card on British Columbia’s Secondary Schools 201822
aLBeRnIAlberni District [Public] Port Alberni Gr 12 Enrollment: 226ESL (%): 1.1 Special needs (%): 15.0 French Imm (%): 12.6Actual rating vs predicted based 2016-17 Last 5 Yearson parents’ avg. inc. of $ n/a: n/a Rank: 87/253 167/246Academic Performance 2013 2014 2015 2016 2017 TrendAverage exam mark 65.2 64.6 65.6 64.0 66.6 —Percentage of exams failed 14.1 13.1 11.5 14.4 7.0 pSchool vs exam mark difference 4.5 5.4 6.6 7.8 5.9 —English gender gap F 3.0 F 1.7 F 5.3 F 8.0 F 1.6 —Math gender gap M 2.7 F 1.4 M 1.7 M 5.3 n/a n/aGraduation rate 92.9 96.7 96.3 93.7 96.9 —Delayed advancement rate 11.2 25.1 10.1 19.3 12.7 —Overall rating out of 10 5.0 5.1 5.6 4.4 6.7 —
CampBeLL RIVeRCarihi [Public] Campbell River Gr 12 Enrollment: 225ESL (%): 0.0 Special needs (%): 16.0 French Imm (%): 24.7Actual rating vs predicted based 2016-17 Last 5 Yearson parents’ avg. inc. of $ n/a: n/a Rank: 46/253 112/246Academic Performance 2013 2014 2015 2016 2017 TrendAverage exam mark 68.2 66.3 67.2 66.9 69.2 —Percentage of exams failed 9.7 12.7 10.7 12.8 5.8 —School vs exam mark difference 2.3 4.7 4.0 4.5 4.0 —English gender gap F 6.0 F 5.3 F 2.7 F 2.5 F 3.2 —Math gender gap F 3.8 M 0.3 F 0.7 M 2.3 n/a n/aGraduation rate 95.3 98.3 99.4 97.8 98.3 —Delayed advancement rate 20.0 17.2 11.0 15.7 12.3 —Overall rating out of 10 5.6 5.7 6.5 6.0 7.3 p
Timberline [Public] Campbell River Gr 12 Enrollment: 180ESL (%): 0.4 Special needs (%): 13.7 French Imm (%): 0.0Actual rating vs predicted based 2016-17 Last 5 Yearson parents’ avg. inc. of $ n/a: n/a Rank: 145/253 121/246Academic Performance 2013 2014 2015 2016 2017 TrendAverage exam mark 69.1 68.1 67.5 67.2 65.0 qPercentage of exams failed 6.7 9.6 8.4 15.0 12.3 —School vs exam mark difference 1.8 3.0 4.7 5.6 11.0 qEnglish gender gap F 7.5 F 7.8 F 6.1 F 6.1 F 1.7 pMath gender gap F 2.2 M 1.2 M 3.0 M 2.5 n/a n/aGraduation rate 98.2 98.0 100.0 98.0 98.2 —Delayed advancement rate 16.3 16.5 8.5 14.3 9.7 —Overall rating out of 10 6.4 6.2 6.6 5.5 5.8 —
COaST mOunTaInSCaledonia [Public] Terrace Gr 12 Enrollment: 167ESL (%): 0.7 Special needs (%): 19.1 French Imm (%): 5.1Actual rating vs predicted based 2016-17 Last 5 Yearson parents’ avg. inc. of $ n/a: n/a Rank: 139/253 181/246Academic Performance 2013 2014 2015 2016 2017 TrendAverage exam mark 66.7 66.1 66.1 68.3 69.7 pPercentage of exams failed 11.5 12.9 12.2 9.3 7.3 pSchool vs exam mark difference 3.3 4.8 2.7 3.8 1.3 pEnglish gender gap F 4.7 F 6.9 F 4.0 F 6.7 F 6.3 —Math gender gap F 6.3 F 1.8 F 2.4 M 5.9 n/a n/aGraduation rate 87.1 87.6 90.1 91.7 91.9 pDelayed advancement rate 36.4 14.4 17.7 10.9 28.5 —Overall rating out of 10 3.9 4.9 5.5 5.9 5.9 p
Hazelton [Public] Hazelton Gr 12 Enrollment: 46ESL (%): 0.0 Special needs (%): 18.6 French Imm (%): 2.7Actual rating vs predicted based 2016-17 Last 5 Yearson parents’ avg. inc. of $ n/a: n/a Rank: 249/253 246/246Academic Performance 2013 2014 2015 2016 2017 TrendAverage exam mark 56.8 56.7 56.5 50.2 56.8 —Percentage of exams failed 30.3 31.4 33.7 48.7 26.5 —School vs exam mark difference 6.6 10.8 10.3 13.6 14.7 —English gender gap F 1.8 F 1.9 F 3.5 F 0.7 F 4.6 —Math gender gap M 2.1 M 12.3 M 4.1 F 2.4 n/a n/aGraduation rate 84.8 91.5 91.2 91.7 100.0 pDelayed advancement rate 26.2 27.5 32.0 40.1 35.1 qOverall rating out of 10 1.0 1.4 1.4 0.0 2.0 —
Mount Elizabeth [Public] Kitimat Gr 12 Enrollment: 90ESL (%): 0.2 Special needs (%): 15.3 French Imm (%): 9.0Actual rating vs predicted based 2016-17 Last 5 Yearson parents’ avg. inc. of $ n/a: n/a Rank: 149/253 212/246Academic Performance 2013 2014 2015 2016 2017 TrendAverage exam mark 65.0 62.9 65.5 66.7 64.5 pPercentage of exams failed 16.0 18.4 14.0 13.1 13.3 pSchool vs exam mark difference 5.9 9.0 7.5 10.3 13.5 —English gender gap F 6.5 F 6.1 F 0.1 F 5.6 F 1.6 —Math gender gap F 2.4 M 0.9 F 0.1 M 3.8 n/a n/aGraduation rate 86.5 86.3 92.8 93.2 96.2 pDelayed advancement rate 23.1 23.1 16.7 13.3 4.1 pOverall rating out of 10 3.5 3.2 5.3 4.9 5.7 p
COmOx VaLLeyGeorges P Vanier [Public] Courtenay Gr 12 Enrollment: 268ESL (%): 0.0 Special needs (%): 15.9 French Imm (%): 0.0Actual rating vs predicted based 2016-17 Last 5 Yearson parents’ avg. inc. of $ n/a: n/a Rank: 199/253 188/246Academic Performance 2013 2014 2015 2016 2017 TrendAverage exam mark 67.0 66.3 64.0 64.4 62.8 qPercentage of exams failed 10.3 9.4 13.3 14.2 16.9 qSchool vs exam mark difference 3.9 6.0 7.4 8.5 11.7 qEnglish gender gap F 5.2 F 5.9 F 2.8 F 4.2 F 2.6 —Math gender gap M 3.3 M 1.6 M 1.7 M 2.0 n/a n/aGraduation rate 96.0 94.4 93.0 97.9 97.2 —Delayed advancement rate 19.8 23.7 23.2 15.9 13.2 —Overall rating out of 10 5.5 5.3 4.8 5.1 4.7 q
Highland [Public] Comox Gr 12 Enrollment: 127ESL (%): 0.6 Special needs (%): 14.0 French Imm (%): 0.0Actual rating vs predicted based 2016-17 Last 5 Yearson parents’ avg. inc. of $ n/a: n/a Rank: 71/253 112/246Academic Performance 2013 2014 2015 2016 2017 TrendAverage exam mark 69.6 68.0 68.4 68.7 68.5 —Percentage of exams failed 7.9 9.6 9.1 12.5 14.8 —School vs exam mark difference 4.8 5.7 6.9 8.4 7.2 —English gender gap M 0.3 F 3.3 F 5.0 F 5.5 M 0.1 —Math gender gap M 3.2 M 5.6 M 1.8 M 4.9 n/a n/aGraduation rate 93.7 95.4 95.4 98.6 92.0 —Delayed advancement rate 7.7 8.0 24.0 10.4 16.6 —Overall rating out of 10 6.4 6.0 5.7 6.2 6.9 —
Mark R. Isfeld [Public] Courtenay Gr 12 Enrollment: 217ESL (%): 0.0 Special needs (%): 10.6 French Imm (%): 41.9Actual rating vs predicted based 2016-17 Last 5 Yearson parents’ avg. inc. of $ n/a: n/a Rank: 33/253 28/246Academic Performance 2013 2014 2015 2016 2017 TrendAverage exam mark 74.0 72.9 72.6 70.8 71.0 —Percentage of exams failed 3.1 4.1 4.5 6.7 6.7 qSchool vs exam mark difference 2.3 2.9 2.9 4.1 3.9 —English gender gap F 3.0 F 5.0 F 1.2 F 8.2 M 0.2 —Math gender gap F 0.6 F 0.7 M 1.5 F 2.3 n/a n/aGraduation rate 98.7 98.9 99.3 98.9 98.4 —Delayed advancement rate 7.2 3.5 10.4 6.1 19.6 —Overall rating out of 10 8.0 7.9 7.9 7.1 7.6 —
COwICHan VaLLeyBrentwood College [Independent] Mill Bay Gr 12 Enrollment: 145ESL (%): 0.0 Special needs (%): 10.0 French Imm (%): 0.0Actual rating vs predicted based 2016-17 Last 5 Yearson parents’ avg. inc. of $ n/a: n/a Rank: 9/253 8/246Academic Performance 2013 2014 2015 2016 2017 TrendAverage exam mark 80.5 82.0 80.6 77.7 82.8 —Percentage of exams failed 1.3 1.2 0.8 3.2 0.7 —School vs exam mark difference 1.9 1.6 2.4 4.8 3.1 —English gender gap F 0.9 M 0.1 F 3.9 F 5.0 F 4.8 qMath gender gap M 8.1 M 8.0 F 2.0 M 0.6 n/a n/aGraduation rate 100.0 100.0 99.3 100.0 99.3 —Delayed advancement rate 0.0 0.0 3.5 2.7 3.5 —Overall rating out of 10 8.9 9.1 9.2 8.6 9.8 —
Chemainus [Public] Chemainus Gr 12 Enrollment: 45ESL (%): 0.7 Special needs (%): 13.8 French Imm (%): 0.0Actual rating vs predicted based 2016-17 Last 5 Yearson parents’ avg. inc. of $ n/a: n/a Rank: 28/253 103/246Academic Performance 2013 2014 2015 2016 2017 TrendAverage exam mark 69.5 66.9 69.4 66.0 73.7 —Percentage of exams failed 11.3 16.4 6.4 12.9 4.3 —School vs exam mark difference 3.3 4.0 2.3 5.2 2.0 —English gender gap F 2.0 M 0.1 F 5.8 F 5.3 F 3.9 —Math gender gap M 8.3 F 1.3 M 8.1 F 1.6 n/a n/aGraduation rate 97.9 89.8 96.9 95.8 97.6 —Delayed advancement rate 2.5 19.4 11.4 22.0 17.3 —Overall rating out of 10 6.3 5.3 6.6 5.6 7.9 —
Cowichan [Public] Duncan Gr 12 Enrollment: 299ESL (%): 0.8 Special needs (%): 15.5 French Imm (%): 15.9Actual rating vs predicted based 2016-17 Last 5 Yearson parents’ avg. inc. of $ n/a: n/a Rank: 214/253 174/246Academic Performance 2013 2014 2015 2016 2017 TrendAverage exam mark 66.2 65.9 64.9 65.0 62.6 —Percentage of exams failed 13.4 13.2 13.7 14.7 18.3 —School vs exam mark difference 5.6 4.8 7.3 6.9 10.6 —English gender gap F 1.9 F 3.2 F 5.8 F 7.8 F 7.2 qMath gender gap M 3.1 M 3.2 F 1.8 F 2.3 n/a n/aGraduation rate 99.2 96.8 98.4 98.2 97.1 —Delayed advancement rate 9.9 11.9 9.0 9.6 12.5 —Overall rating out of 10 5.7 5.8 5.5 5.3 4.1 q
Frances Kelsey [Public] Mill Bay Gr 12 Enrollment: 159ESL (%): 0.3 Special needs (%): 15.9 French Imm (%): 0.0Actual rating vs predicted based 2016-17 Last 5 Yearson parents’ avg. inc. of $ n/a: n/a Rank: 182/253 188/246Academic Performance 2013 2014 2015 2016 2017 TrendAverage exam mark 69.5 66.5 67.5 66.4 65.3 —Percentage of exams failed 9.5 13.1 11.7 13.8 11.7 —School vs exam mark difference 9.8 12.7 12.6 13.0 14.0 —English gender gap F 6.2 F 7.1 F 5.0 F 7.4 F 4.1 —Math gender gap M 3.9 M 3.3 F 0.4 F 9.0 n/a n/aGraduation rate 99.3 100.0 100.0 99.0 97.9 —Delayed advancement rate 22.9 15.0 17.2 14.7 17.7 —Overall rating out of 10 5.3 4.9 5.4 4.6 5.1 —
Lake Cowichan [Public] Lake Cowichan Gr 12 Enrollment: 39ESL (%): 0.5 Special needs (%): 16.7 French Imm (%): 0.0Actual rating vs predicted based 2016-17 Last 5 Yearson parents’ avg. inc. of $ n/a: n/a Rank: 155/253 127/246Academic Performance 2013 2014 2015 2016 2017 TrendAverage exam mark 68.5 66.4 65.5 64.5 66.5 —Percentage of exams failed 9.2 7.6 6.5 13.9 11.4 —School vs exam mark difference 3.0 2.9 3.7 3.8 6.9 —English gender gap n/a n/a F 3.6 F 15.6 F 7.3 n/aMath gender gap n/a n/a M 2.2 M 1.7 n/a n/aGraduation rate 97.1 100.0 100.0 97.1 100.0 —Delayed advancement rate 36.8 22.2 11.1 13.4 16.8 —Overall rating out of 10 5.7 6.8 6.8 5.2 5.6 —
Queen Margaret’s [Independent] Duncan Gr 12 Enrollment: 24ESL (%): 11.3 Special needs (%): 4.5 French Imm (%): 0.0Actual rating vs predicted based 2016-17 Last 5 Yearson parents’ avg. inc. of $ n/a: n/a Rank: 169/253 38/246Academic Performance 2013 2014 2015 2016 2017 TrendAverage exam mark 79.8 80.2 73.6 72.8 62.0 qPercentage of exams failed 2.7 1.3 6.9 4.2 18.2 qSchool vs exam mark difference 1.7 1.5 4.0 4.4 9.3 qEnglish gender gap n/a n/a n/a n/a n/a n/aMath gender gap n/a n/a n/a n/a n/a n/aGraduation rate 92.3 100.0 100.0 96.8 100.0 —Delayed advancement rate 9.4 2.7 16.4 n/a n/a n/aOverall rating out of 10 8.3 9.4 7.3 7.3 5.3 q
Vancouver Island and the Coast
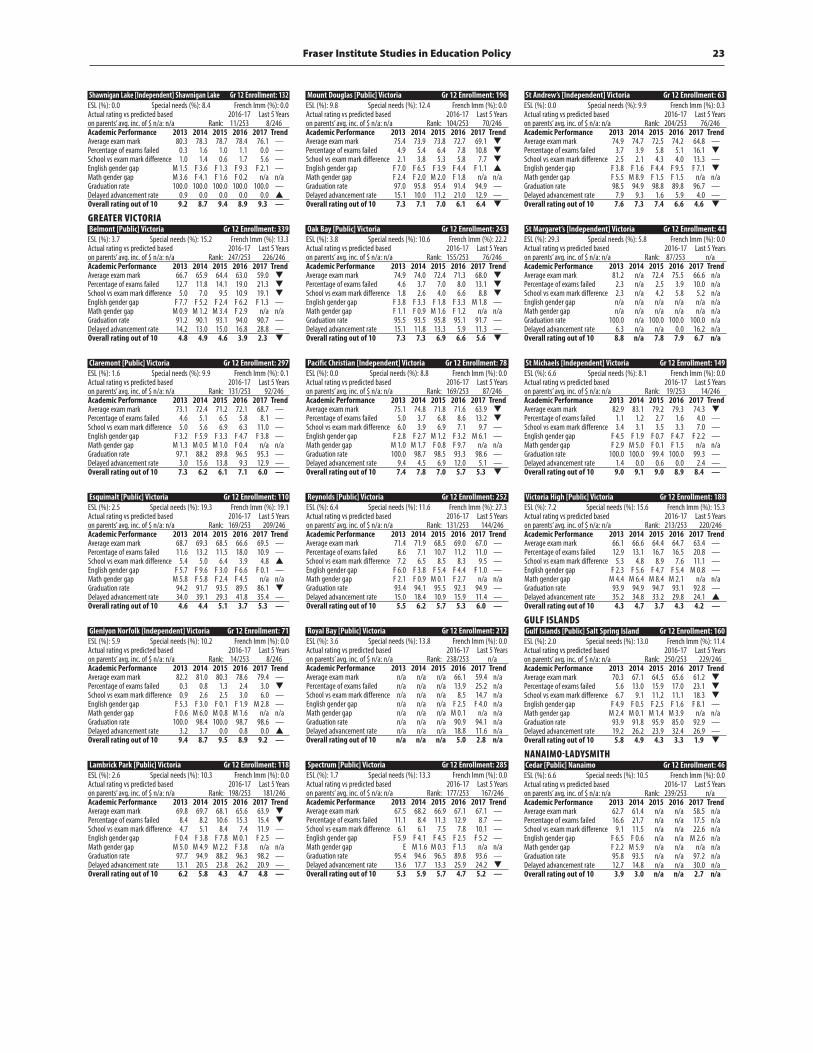
Fraser Institute Studies in Education Policy 23
Shawnigan Lake [Independent] Shawnigan Lake Gr 12 Enrollment: 132ESL (%): 0.0 Special needs (%): 8.4 French Imm (%): 0.0Actual rating vs predicted based 2016-17 Last 5 Yearson parents’ avg. inc. of $ n/a: n/a Rank: 11/253 8/246Academic Performance 2013 2014 2015 2016 2017 TrendAverage exam mark 80.3 78.3 78.7 78.4 76.1 —Percentage of exams failed 0.3 1.6 1.0 1.1 0.0 —School vs exam mark difference 1.0 1.4 0.6 1.7 5.6 —English gender gap M 1.5 F 3.6 F 1.3 F 9.3 F 2.1 —Math gender gap M 3.6 F 4.1 F 1.6 F 0.2 n/a n/aGraduation rate 100.0 100.0 100.0 100.0 100.0 —Delayed advancement rate 0.9 0.0 0.0 0.0 0.0 pOverall rating out of 10 9.2 8.7 9.4 8.9 9.3 —
gReaTeR VICTORIaBelmont [Public] Victoria Gr 12 Enrollment: 339ESL (%): 3.7 Special needs (%): 15.2 French Imm (%): 13.3Actual rating vs predicted based 2016-17 Last 5 Yearson parents’ avg. inc. of $ n/a: n/a Rank: 247/253 226/246Academic Performance 2013 2014 2015 2016 2017 TrendAverage exam mark 66.7 65.9 64.4 63.0 59.0 qPercentage of exams failed 12.7 11.8 14.1 19.0 21.3 qSchool vs exam mark difference 5.0 7.0 9.5 10.9 19.1 qEnglish gender gap F 7.7 F 5.2 F 2.4 F 6.2 F 1.3 —Math gender gap M 0.9 M 1.2 M 3.4 F 2.9 n/a n/aGraduation rate 91.2 90.1 93.1 94.0 90.7 —Delayed advancement rate 14.2 13.0 15.0 16.8 28.8 —Overall rating out of 10 4.8 4.9 4.6 3.9 2.3 q
Claremont [Public] Victoria Gr 12 Enrollment: 297ESL (%): 1.6 Special needs (%): 9.9 French Imm (%): 0.1Actual rating vs predicted based 2016-17 Last 5 Yearson parents’ avg. inc. of $ n/a: n/a Rank: 131/253 92/246Academic Performance 2013 2014 2015 2016 2017 TrendAverage exam mark 73.1 72.4 71.2 72.1 68.7 —Percentage of exams failed 4.6 5.1 6.5 5.8 8.1 —School vs exam mark difference 5.0 5.6 6.9 6.3 11.0 —English gender gap F 3.2 F 5.9 F 3.3 F 4.7 F 3.8 —Math gender gap M 1.3 M 0.5 M 1.0 F 0.4 n/a n/aGraduation rate 97.1 88.2 89.8 96.5 95.3 —Delayed advancement rate 3.0 15.6 13.8 9.3 12.9 —Overall rating out of 10 7.3 6.2 6.1 7.1 6.0 —
Esquimalt [Public] Victoria Gr 12 Enrollment: 110ESL (%): 2.5 Special needs (%): 19.3 French Imm (%): 19.1Actual rating vs predicted based 2016-17 Last 5 Yearson parents’ avg. inc. of $ n/a: n/a Rank: 169/253 209/246Academic Performance 2013 2014 2015 2016 2017 TrendAverage exam mark 68.7 69.3 68.5 66.6 69.5 —Percentage of exams failed 11.6 13.2 11.5 18.0 10.9 —School vs exam mark difference 5.4 5.0 6.4 3.9 4.8 pEnglish gender gap F 5.7 F 9.6 F 3.0 F 6.6 F 0.1 —Math gender gap M 5.8 F 5.8 F 2.4 F 4.5 n/a n/aGraduation rate 94.2 91.7 93.5 89.5 86.1 qDelayed advancement rate 34.0 39.1 29.3 41.8 35.4 —Overall rating out of 10 4.6 4.4 5.1 3.7 5.3 —
Glenlyon Norfolk [Independent] Victoria Gr 12 Enrollment: 71ESL (%): 5.9 Special needs (%): 10.2 French Imm (%): 0.0Actual rating vs predicted based 2016-17 Last 5 Yearson parents’ avg. inc. of $ n/a: n/a Rank: 14/253 8/246Academic Performance 2013 2014 2015 2016 2017 TrendAverage exam mark 82.2 81.0 80.3 78.6 79.4 —Percentage of exams failed 0.3 0.8 1.3 2.4 3.0 qSchool vs exam mark difference 0.9 2.6 2.5 3.0 6.0 —English gender gap F 5.3 F 3.0 F 0.1 F 1.9 M 2.8 —Math gender gap F 0.6 M 6.0 M 0.8 M 1.6 n/a n/aGraduation rate 100.0 98.4 100.0 98.7 98.6 —Delayed advancement rate 3.2 3.7 0.0 0.8 0.0 pOverall rating out of 10 9.4 8.7 9.5 8.9 9.2 —
Lambrick Park [Public] Victoria Gr 12 Enrollment: 118ESL (%): 2.6 Special needs (%): 10.3 French Imm (%): 0.0Actual rating vs predicted based 2016-17 Last 5 Yearson parents’ avg. inc. of $ n/a: n/a Rank: 198/253 181/246Academic Performance 2013 2014 2015 2016 2017 TrendAverage exam mark 69.8 69.7 68.1 65.6 63.9 qPercentage of exams failed 8.4 8.2 10.6 15.3 15.4 qSchool vs exam mark difference 4.7 5.1 8.4 7.4 11.9 —English gender gap F 0.4 F 3.8 F 7.8 M 0.1 F 2.5 —Math gender gap M 5.0 M 4.9 M 2.2 F 3.8 n/a n/aGraduation rate 97.7 94.9 88.2 96.3 98.2 —Delayed advancement rate 13.1 20.5 23.8 26.2 20.9 —Overall rating out of 10 6.2 5.8 4.3 4.7 4.8 —
Mount Douglas [Public] Victoria Gr 12 Enrollment: 196ESL (%): 9.8 Special needs (%): 12.4 French Imm (%): 0.0Actual rating vs predicted based 2016-17 Last 5 Yearson parents’ avg. inc. of $ n/a: n/a Rank: 104/253 70/246Academic Performance 2013 2014 2015 2016 2017 TrendAverage exam mark 75.4 73.9 73.8 72.7 69.1 qPercentage of exams failed 4.9 5.4 6.4 7.8 10.8 qSchool vs exam mark difference 2.1 3.8 5.3 5.8 7.7 qEnglish gender gap F 7.0 F 6.5 F 3.9 F 4.4 F 1.1 pMath gender gap F 2.4 F 2.0 M 2.0 F 1.8 n/a n/aGraduation rate 97.0 95.8 95.4 91.4 94.9 —Delayed advancement rate 15.1 10.0 11.2 21.0 12.9 —Overall rating out of 10 7.3 7.1 7.0 6.1 6.4 q
Oak Bay [Public] Victoria Gr 12 Enrollment: 243ESL (%): 3.8 Special needs (%): 10.6 French Imm (%): 22.2Actual rating vs predicted based 2016-17 Last 5 Yearson parents’ avg. inc. of $ n/a: n/a Rank: 155/253 76/246Academic Performance 2013 2014 2015 2016 2017 TrendAverage exam mark 74.9 74.0 72.4 71.3 68.0 qPercentage of exams failed 4.6 3.7 7.0 8.0 13.1 qSchool vs exam mark difference 1.8 2.6 4.0 6.6 8.8 qEnglish gender gap F 3.8 F 3.3 F 1.8 F 3.3 M 1.8 —Math gender gap F 1.1 F 0.9 M 1.6 F 1.2 n/a n/aGraduation rate 95.5 93.5 95.8 95.1 91.7 —Delayed advancement rate 15.1 11.8 13.3 5.9 11.3 —Overall rating out of 10 7.3 7.3 6.9 6.6 5.6 q
Pacific Christian [Independent] Victoria Gr 12 Enrollment: 78ESL (%): 0.0 Special needs (%): 8.8 French Imm (%): 0.0Actual rating vs predicted based 2016-17 Last 5 Yearson parents’ avg. inc. of $ n/a: n/a Rank: 169/253 87/246Academic Performance 2013 2014 2015 2016 2017 TrendAverage exam mark 75.1 74.8 71.8 71.6 63.9 qPercentage of exams failed 5.0 3.7 6.8 8.6 13.2 qSchool vs exam mark difference 6.0 3.9 6.9 7.1 9.7 —English gender gap F 2.8 F 2.7 M 1.2 F 3.2 M 6.1 —Math gender gap M 1.0 M 1.7 F 0.8 F 9.7 n/a n/aGraduation rate 100.0 98.7 98.5 93.3 98.6 —Delayed advancement rate 9.4 4.5 6.9 12.0 5.1 —Overall rating out of 10 7.4 7.8 7.0 5.7 5.3 q
Reynolds [Public] Victoria Gr 12 Enrollment: 252ESL (%): 6.4 Special needs (%): 11.6 French Imm (%): 27.3Actual rating vs predicted based 2016-17 Last 5 Yearson parents’ avg. inc. of $ n/a: n/a Rank: 131/253 144/246Academic Performance 2013 2014 2015 2016 2017 TrendAverage exam mark 71.4 71.9 68.5 69.0 67.0 —Percentage of exams failed 8.6 7.1 10.7 11.2 11.0 —School vs exam mark difference 7.2 6.5 8.5 8.3 9.5 —English gender gap F 6.0 F 3.8 F 5.4 F 4.4 F 1.0 —Math gender gap F 2.1 F 0.9 M 0.1 F 2.7 n/a n/aGraduation rate 93.4 94.1 95.5 92.3 94.9 —Delayed advancement rate 15.0 18.4 10.9 15.9 11.4 —Overall rating out of 10 5.5 6.2 5.7 5.3 6.0 —
Royal Bay [Public] Victoria Gr 12 Enrollment: 212ESL (%): 3.6 Special needs (%): 13.8 French Imm (%): 0.0Actual rating vs predicted based 2016-17 Last 5 Yearson parents’ avg. inc. of $ n/a: n/a Rank: 238/253 n/aAcademic Performance 2013 2014 2015 2016 2017 TrendAverage exam mark n/a n/a n/a 66.1 59.4 n/aPercentage of exams failed n/a n/a n/a 13.9 25.2 n/aSchool vs exam mark difference n/a n/a n/a 8.5 14.7 n/aEnglish gender gap n/a n/a n/a F 2.5 F 4.0 n/aMath gender gap n/a n/a n/a M 0.1 n/a n/aGraduation rate n/a n/a n/a 90.9 94.1 n/aDelayed advancement rate n/a n/a n/a 18.8 11.6 n/aOverall rating out of 10 n/a n/a n/a 5.0 2.8 n/a
Spectrum [Public] Victoria Gr 12 Enrollment: 285ESL (%): 1.7 Special needs (%): 13.3 French Imm (%): 0.0Actual rating vs predicted based 2016-17 Last 5 Yearson parents’ avg. inc. of $ n/a: n/a Rank: 177/253 167/246Academic Performance 2013 2014 2015 2016 2017 TrendAverage exam mark 67.5 68.2 66.9 67.1 67.1 —Percentage of exams failed 11.1 8.4 11.3 12.9 8.7 —School vs exam mark difference 6.1 6.1 7.5 7.8 10.1 —English gender gap F 5.9 F 4.1 F 4.5 F 2.5 F 5.2 —Math gender gap E M 1.6 M 0.3 F 1.3 n/a n/aGraduation rate 95.4 94.6 96.5 89.8 93.6 —Delayed advancement rate 13.6 17.7 13.3 25.9 24.2 qOverall rating out of 10 5.3 5.9 5.7 4.7 5.2 —
St Andrew’s [Independent] Victoria Gr 12 Enrollment: 63ESL (%): 0.0 Special needs (%): 9.9 French Imm (%): 0.3Actual rating vs predicted based 2016-17 Last 5 Yearson parents’ avg. inc. of $ n/a: n/a Rank: 204/253 76/246Academic Performance 2013 2014 2015 2016 2017 TrendAverage exam mark 74.9 74.7 72.5 74.2 64.8 —Percentage of exams failed 3.7 3.9 5.8 5.1 16.1 qSchool vs exam mark difference 2.5 2.1 4.3 4.0 13.3 —English gender gap F 3.8 F 1.6 F 4.4 F 9.5 F 7.1 qMath gender gap F 5.5 M 8.9 F 1.5 F 1.5 n/a n/aGraduation rate 98.5 94.9 98.8 89.8 96.7 —Delayed advancement rate 7.9 9.3 1.6 5.9 4.0 —Overall rating out of 10 7.6 7.3 7.4 6.6 4.6 q
St Margaret’s [Independent] Victoria Gr 12 Enrollment: 44ESL (%): 29.3 Special needs (%): 5.8 French Imm (%): 0.0Actual rating vs predicted based 2016-17 Last 5 Yearson parents’ avg. inc. of $ n/a: n/a Rank: 87/253 n/aAcademic Performance 2013 2014 2015 2016 2017 TrendAverage exam mark 81.2 n/a 72.4 75.5 66.6 n/aPercentage of exams failed 2.3 n/a 2.5 3.9 10.0 n/aSchool vs exam mark difference 2.3 n/a 4.2 5.8 5.2 n/aEnglish gender gap n/a n/a n/a n/a n/a n/aMath gender gap n/a n/a n/a n/a n/a n/aGraduation rate 100.0 n/a 100.0 100.0 100.0 n/aDelayed advancement rate 6.3 n/a n/a 0.0 16.2 n/aOverall rating out of 10 8.8 n/a 7.8 7.9 6.7 n/a
St Michaels [Independent] Victoria Gr 12 Enrollment: 149ESL (%): 6.6 Special needs (%): 8.1 French Imm (%): 0.0Actual rating vs predicted based 2016-17 Last 5 Yearson parents’ avg. inc. of $ n/a: n/a Rank: 19/253 14/246Academic Performance 2013 2014 2015 2016 2017 TrendAverage exam mark 82.9 83.1 79.2 79.3 74.3 qPercentage of exams failed 1.1 1.2 2.7 1.6 4.0 —School vs exam mark difference 3.4 3.1 3.5 3.3 7.0 —English gender gap F 4.5 F 1.9 F 0.7 F 4.7 F 2.2 —Math gender gap F 2.9 M 5.0 F 0.1 F 1.5 n/a n/aGraduation rate 100.0 100.0 99.4 100.0 99.3 —Delayed advancement rate 1.4 0.0 0.6 0.0 2.4 —Overall rating out of 10 9.0 9.1 9.0 8.9 8.4 —
Victoria High [Public] Victoria Gr 12 Enrollment: 188ESL (%): 7.2 Special needs (%): 15.6 French Imm (%): 15.3Actual rating vs predicted based 2016-17 Last 5 Yearson parents’ avg. inc. of $ n/a: n/a Rank: 213/253 220/246Academic Performance 2013 2014 2015 2016 2017 TrendAverage exam mark 66.1 66.6 64.4 64.7 63.4 —Percentage of exams failed 12.9 13.1 16.7 16.5 20.8 —School vs exam mark difference 5.3 4.8 8.9 7.6 11.1 —English gender gap F 2.3 F 5.6 F 4.7 F 5.4 M 0.8 —Math gender gap M 4.4 M 6.4 M 8.4 M 2.1 n/a n/aGraduation rate 93.9 94.9 94.7 93.1 92.8 —Delayed advancement rate 35.2 34.8 33.2 29.8 24.1 pOverall rating out of 10 4.3 4.7 3.7 4.3 4.2 —
guLf ISLanDSGulf Islands [Public] Salt Spring Island Gr 12 Enrollment: 160ESL (%): 2.0 Special needs (%): 13.0 French Imm (%): 11.4Actual rating vs predicted based 2016-17 Last 5 Yearson parents’ avg. inc. of $ n/a: n/a Rank: 250/253 229/246Academic Performance 2013 2014 2015 2016 2017 TrendAverage exam mark 70.3 67.1 64.5 65.6 61.2 qPercentage of exams failed 5.6 13.0 15.9 17.0 23.1 qSchool vs exam mark difference 6.7 9.1 11.2 11.1 18.3 qEnglish gender gap F 4.9 F 0.5 F 2.5 F 1.6 F 8.1 —Math gender gap M 2.4 M 0.1 M 1.4 M 3.9 n/a n/aGraduation rate 93.9 91.8 95.9 85.0 92.9 —Delayed advancement rate 19.2 26.2 23.9 32.4 26.9 —Overall rating out of 10 5.8 4.9 4.3 3.3 1.9 q
nanaImO-LaDySmITHCedar [Public] Nanaimo Gr 12 Enrollment: 46ESL (%): 6.6 Special needs (%): 10.5 French Imm (%): 0.0Actual rating vs predicted based 2016-17 Last 5 Yearson parents’ avg. inc. of $ n/a: n/a Rank: 239/253 n/aAcademic Performance 2013 2014 2015 2016 2017 TrendAverage exam mark 62.7 61.4 n/a n/a 58.5 n/aPercentage of exams failed 16.6 21.7 n/a n/a 17.5 n/aSchool vs exam mark difference 9.1 11.5 n/a n/a 22.6 n/aEnglish gender gap F 6.5 F 0.6 n/a n/a M 2.6 n/aMath gender gap F 2.2 M 5.9 n/a n/a n/a n/aGraduation rate 95.8 93.5 n/a n/a 97.2 n/aDelayed advancement rate 12.7 14.8 n/a n/a 30.0 n/aOverall rating out of 10 3.9 3.0 n/a n/a 2.7 n/a
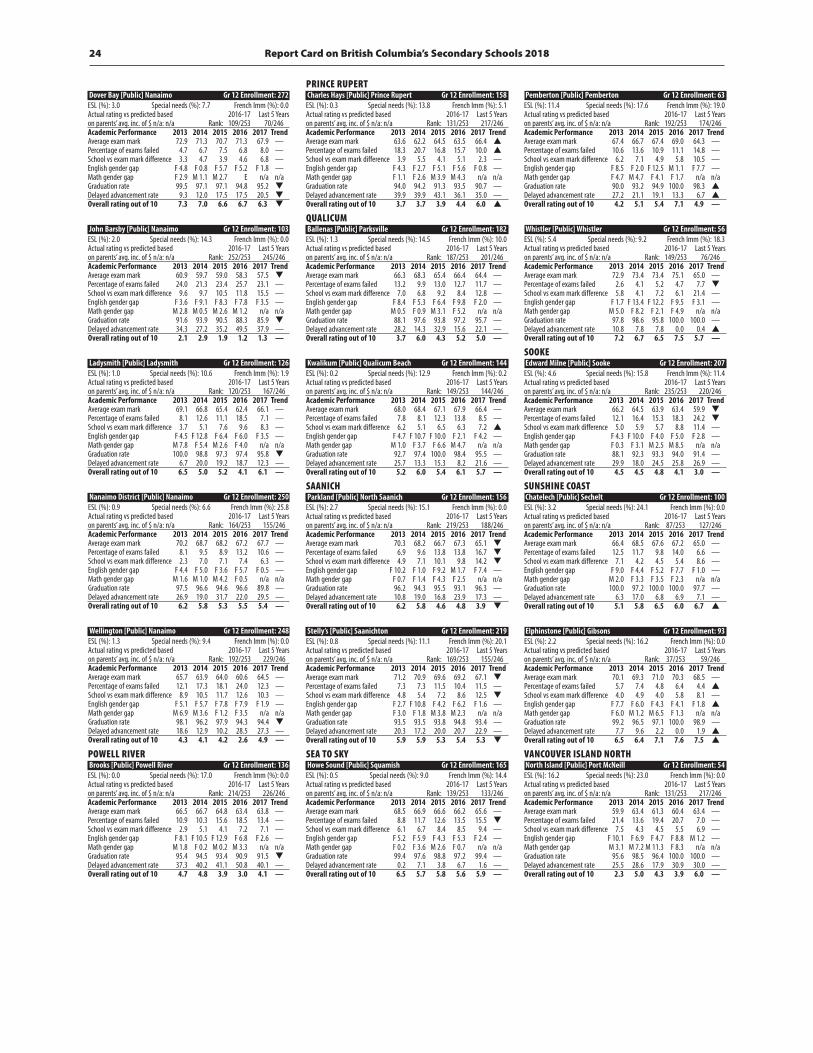
Report Card on British Columbia’s Secondary Schools 201824
Dover Bay [Public] Nanaimo Gr 12 Enrollment: 272ESL (%): 3.0 Special needs (%): 7.7 French Imm (%): 0.0Actual rating vs predicted based 2016-17 Last 5 Yearson parents’ avg. inc. of $ n/a: n/a Rank: 109/253 70/246Academic Performance 2013 2014 2015 2016 2017 TrendAverage exam mark 72.9 71.3 70.7 71.3 67.9 —Percentage of exams failed 4.7 6.7 7.5 6.8 8.0 —School vs exam mark difference 3.3 4.7 3.9 4.6 6.8 —English gender gap F 4.8 F 0.8 F 5.7 F 5.2 F 1.8 —Math gender gap F 2.9 M 1.1 M 2.7 E n/a n/aGraduation rate 99.5 97.1 97.1 94.8 95.2 qDelayed advancement rate 9.3 12.0 17.5 17.5 20.5 qOverall rating out of 10 7.3 7.0 6.6 6.7 6.3 q
John Barsby [Public] Nanaimo Gr 12 Enrollment: 103ESL (%): 2.0 Special needs (%): 14.3 French Imm (%): 0.0Actual rating vs predicted based 2016-17 Last 5 Yearson parents’ avg. inc. of $ n/a: n/a Rank: 252/253 245/246Academic Performance 2013 2014 2015 2016 2017 TrendAverage exam mark 60.9 59.7 59.0 58.3 57.5 qPercentage of exams failed 24.0 21.3 23.4 25.7 23.1 —School vs exam mark difference 9.6 9.7 10.5 11.8 15.5 —English gender gap F 3.6 F 9.1 F 8.3 F 7.8 F 3.5 —Math gender gap M 2.8 M 0.5 M 2.6 M 1.2 n/a n/aGraduation rate 91.6 93.9 90.5 88.3 85.9 qDelayed advancement rate 34.3 27.2 35.2 49.5 37.9 —Overall rating out of 10 2.1 2.9 1.9 1.2 1.3 —
Ladysmith [Public] Ladysmith Gr 12 Enrollment: 126ESL (%): 1.0 Special needs (%): 10.6 French Imm (%): 1.9Actual rating vs predicted based 2016-17 Last 5 Yearson parents’ avg. inc. of $ n/a: n/a Rank: 120/253 167/246Academic Performance 2013 2014 2015 2016 2017 TrendAverage exam mark 69.1 66.8 65.4 62.4 66.1 —Percentage of exams failed 8.1 12.6 11.1 18.5 7.1 —School vs exam mark difference 3.7 5.1 7.6 9.6 8.3 —English gender gap F 4.5 F 12.8 F 6.4 F 6.0 F 3.5 —Math gender gap M 7.8 F 5.4 M 2.6 F 4.0 n/a n/aGraduation rate 100.0 98.8 97.3 97.4 95.8 qDelayed advancement rate 6.7 20.0 19.2 18.7 12.3 —Overall rating out of 10 6.5 5.0 5.2 4.1 6.1 —
Nanaimo District [Public] Nanaimo Gr 12 Enrollment: 250ESL (%): 0.9 Special needs (%): 6.6 French Imm (%): 25.8Actual rating vs predicted based 2016-17 Last 5 Yearson parents’ avg. inc. of $ n/a: n/a Rank: 164/253 155/246Academic Performance 2013 2014 2015 2016 2017 TrendAverage exam mark 70.2 68.7 68.2 67.2 67.7 —Percentage of exams failed 8.1 9.5 8.9 13.2 10.6 —School vs exam mark difference 2.3 7.0 7.1 7.4 6.3 —English gender gap F 4.4 F 5.0 F 3.6 F 5.7 F 0.5 —Math gender gap M 1.6 M 1.0 M 4.2 F 0.5 n/a n/aGraduation rate 97.5 96.6 94.6 96.6 89.8 —Delayed advancement rate 26.9 19.0 31.7 22.0 29.5 —Overall rating out of 10 6.2 5.8 5.3 5.5 5.4 —
Wellington [Public] Nanaimo Gr 12 Enrollment: 248ESL (%): 1.3 Special needs (%): 9.4 French Imm (%): 0.0Actual rating vs predicted based 2016-17 Last 5 Yearson parents’ avg. inc. of $ n/a: n/a Rank: 192/253 229/246Academic Performance 2013 2014 2015 2016 2017 TrendAverage exam mark 65.7 63.9 64.0 60.6 64.5 —Percentage of exams failed 12.1 17.3 18.1 24.0 12.3 —School vs exam mark difference 8.9 10.5 11.7 12.6 10.3 —English gender gap F 5.1 F 5.7 F 7.8 F 7.9 F 1.9 —Math gender gap M 6.9 M 3.6 F 1.2 F 3.5 n/a n/aGraduation rate 98.1 96.2 97.9 94.3 94.4 qDelayed advancement rate 18.6 12.9 10.2 28.5 27.3 —Overall rating out of 10 4.3 4.1 4.2 2.6 4.9 —
pOweLL RIVeRBrooks [Public] Powell River Gr 12 Enrollment: 136ESL (%): 0.0 Special needs (%): 17.0 French Imm (%): 0.0Actual rating vs predicted based 2016-17 Last 5 Yearson parents’ avg. inc. of $ n/a: n/a Rank: 214/253 226/246Academic Performance 2013 2014 2015 2016 2017 TrendAverage exam mark 66.5 66.7 64.8 63.4 63.8 —Percentage of exams failed 10.9 10.3 15.6 18.5 13.4 —School vs exam mark difference 2.9 5.1 4.1 7.2 7.1 —English gender gap F 8.1 F 10.5 F 12.9 F 6.8 F 2.6 —Math gender gap M 1.8 F 0.2 M 0.2 M 3.3 n/a n/aGraduation rate 95.4 94.5 93.4 90.9 91.5 qDelayed advancement rate 37.3 40.2 41.1 50.8 40.1 —Overall rating out of 10 4.7 4.8 3.9 3.0 4.1 —
pRInCe RupeRTCharles Hays [Public] Prince Rupert Gr 12 Enrollment: 158ESL (%): 0.3 Special needs (%): 13.8 French Imm (%): 5.1Actual rating vs predicted based 2016-17 Last 5 Yearson parents’ avg. inc. of $ n/a: n/a Rank: 131/253 217/246Academic Performance 2013 2014 2015 2016 2017 TrendAverage exam mark 63.6 62.2 64.5 63.5 66.4 pPercentage of exams failed 18.3 20.7 16.8 15.7 10.0 pSchool vs exam mark difference 3.9 5.5 4.1 5.1 2.3 —English gender gap F 4.3 F 2.7 F 5.1 F 5.6 F 0.8 —Math gender gap F 1.1 F 2.6 M 3.9 M 4.3 n/a n/aGraduation rate 94.0 94.2 91.3 93.5 90.7 —Delayed advancement rate 39.9 39.9 43.1 36.1 35.0 —Overall rating out of 10 3.7 3.7 3.9 4.4 6.0 p
quaLICumBallenas [Public] Parksville Gr 12 Enrollment: 182ESL (%): 1.3 Special needs (%): 14.5 French Imm (%): 10.0Actual rating vs predicted based 2016-17 Last 5 Yearson parents’ avg. inc. of $ n/a: n/a Rank: 187/253 201/246Academic Performance 2013 2014 2015 2016 2017 TrendAverage exam mark 66.3 68.3 65.4 66.4 64.4 —Percentage of exams failed 13.2 9.9 13.0 12.7 11.7 —School vs exam mark difference 7.0 6.8 9.2 8.4 12.8 —English gender gap F 8.4 F 5.3 F 6.4 F 9.8 F 2.0 —Math gender gap M 0.5 F 0.9 M 3.1 F 5.2 n/a n/aGraduation rate 88.1 97.6 93.8 97.2 95.7 —Delayed advancement rate 28.2 14.3 32.9 15.6 22.1 —Overall rating out of 10 3.7 6.0 4.3 5.2 5.0 —
Kwalikum [Public] Qualicum Beach Gr 12 Enrollment: 144ESL (%): 0.2 Special needs (%): 12.9 French Imm (%): 0.2Actual rating vs predicted based 2016-17 Last 5 Yearson parents’ avg. inc. of $ n/a: n/a Rank: 149/253 144/246Academic Performance 2013 2014 2015 2016 2017 TrendAverage exam mark 68.0 68.4 67.1 67.9 66.4 —Percentage of exams failed 7.8 8.1 12.3 13.8 8.5 —School vs exam mark difference 6.2 5.1 6.5 6.3 7.2 pEnglish gender gap F 4.7 F 10.7 F 10.0 F 2.1 F 4.2 —Math gender gap M 1.0 F 3.7 F 6.6 M 4.7 n/a n/aGraduation rate 92.7 97.4 100.0 98.4 95.5 —Delayed advancement rate 25.7 13.3 15.3 8.2 21.6 —Overall rating out of 10 5.2 6.0 5.4 6.1 5.7 —
SaanICHParkland [Public] North Saanich Gr 12 Enrollment: 156ESL (%): 2.7 Special needs (%): 15.1 French Imm (%): 0.0Actual rating vs predicted based 2016-17 Last 5 Yearson parents’ avg. inc. of $ n/a: n/a Rank: 219/253 188/246Academic Performance 2013 2014 2015 2016 2017 TrendAverage exam mark 70.3 68.2 66.7 67.3 65.1 qPercentage of exams failed 6.9 9.6 13.8 13.8 16.7 qSchool vs exam mark difference 4.9 7.1 10.1 9.8 14.2 qEnglish gender gap F 10.2 F 1.0 F 9.2 M 1.7 F 7.4 —Math gender gap F 0.7 F 1.4 F 4.3 F 2.5 n/a n/aGraduation rate 96.2 94.3 95.5 93.1 96.3 —Delayed advancement rate 10.8 19.0 16.8 23.9 17.3 —Overall rating out of 10 6.2 5.8 4.6 4.8 3.9 q
Stelly’s [Public] Saanichton Gr 12 Enrollment: 219ESL (%): 0.8 Special needs (%): 11.1 French Imm (%): 20.1Actual rating vs predicted based 2016-17 Last 5 Yearson parents’ avg. inc. of $ n/a: n/a Rank: 169/253 155/246Academic Performance 2013 2014 2015 2016 2017 TrendAverage exam mark 71.2 70.9 69.6 69.2 67.1 qPercentage of exams failed 7.3 7.3 11.5 10.4 11.5 —School vs exam mark difference 4.8 5.4 7.2 8.6 12.5 qEnglish gender gap F 2.7 F 10.8 F 4.2 F 6.2 F 1.6 —Math gender gap F 3.0 F 1.8 M 3.8 M 2.3 n/a n/aGraduation rate 93.5 93.5 93.8 94.8 93.4 —Delayed advancement rate 20.3 17.2 20.0 20.7 22.9 —Overall rating out of 10 5.9 5.9 5.3 5.4 5.3 q
Sea TO SkyHowe Sound [Public] Squamish Gr 12 Enrollment: 165ESL (%): 0.5 Special needs (%): 9.0 French Imm (%): 14.4Actual rating vs predicted based 2016-17 Last 5 Yearson parents’ avg. inc. of $ n/a: n/a Rank: 139/253 133/246Academic Performance 2013 2014 2015 2016 2017 TrendAverage exam mark 68.5 66.9 66.6 66.2 65.6 —Percentage of exams failed 8.8 11.7 12.6 13.5 15.5 qSchool vs exam mark difference 6.1 6.7 8.4 8.5 9.4 —English gender gap F 5.2 F 5.9 F 4.3 F 5.3 F 2.4 —Math gender gap F 0.2 F 3.6 M 2.6 F 0.7 n/a n/aGraduation rate 99.4 97.6 98.8 97.2 99.4 —Delayed advancement rate 0.2 7.1 3.8 6.7 1.6 —Overall rating out of 10 6.5 5.7 5.8 5.6 5.9 —
Pemberton [Public] Pemberton Gr 12 Enrollment: 63ESL (%): 11.4 Special needs (%): 17.6 French Imm (%): 19.0Actual rating vs predicted based 2016-17 Last 5 Yearson parents’ avg. inc. of $ n/a: n/a Rank: 192/253 174/246Academic Performance 2013 2014 2015 2016 2017 TrendAverage exam mark 67.4 66.7 67.4 69.0 64.3 —Percentage of exams failed 10.6 13.6 10.9 11.1 14.8 —School vs exam mark difference 6.2 7.1 4.9 5.8 10.5 —English gender gap F 8.5 F 2.0 F 12.5 M 1.1 F 7.7 —Math gender gap F 4.7 M 4.7 F 4.1 F 1.7 n/a n/aGraduation rate 90.0 93.2 94.9 100.0 98.3 pDelayed advancement rate 27.2 21.1 19.1 13.3 6.7 pOverall rating out of 10 4.2 5.1 5.4 7.1 4.9 —
Whistler [Public] Whistler Gr 12 Enrollment: 56ESL (%): 5.4 Special needs (%): 9.2 French Imm (%): 18.3Actual rating vs predicted based 2016-17 Last 5 Yearson parents’ avg. inc. of $ n/a: n/a Rank: 149/253 76/246Academic Performance 2013 2014 2015 2016 2017 TrendAverage exam mark 72.9 73.4 73.4 75.1 65.0 —Percentage of exams failed 2.6 4.1 5.2 4.7 7.7 qSchool vs exam mark difference 5.8 4.1 7.2 6.1 21.4 —English gender gap F 1.7 F 13.4 F 12.2 F 9.5 F 3.1 —Math gender gap M 5.0 F 8.2 F 2.1 F 4.9 n/a n/aGraduation rate 97.8 98.6 95.8 100.0 100.0 —Delayed advancement rate 10.8 7.8 7.8 0.0 0.4 pOverall rating out of 10 7.2 6.7 6.5 7.5 5.7 —
SOOkeEdward Milne [Public] Sooke Gr 12 Enrollment: 207ESL (%): 4.6 Special needs (%): 15.8 French Imm (%): 11.4Actual rating vs predicted based 2016-17 Last 5 Yearson parents’ avg. inc. of $ n/a: n/a Rank: 235/253 220/246Academic Performance 2013 2014 2015 2016 2017 TrendAverage exam mark 66.2 64.5 63.9 63.4 59.9 qPercentage of exams failed 12.1 16.4 15.3 18.3 24.2 qSchool vs exam mark difference 5.0 5.9 5.7 8.8 11.4 —English gender gap F 4.3 F 10.0 F 4.0 F 5.0 F 2.8 —Math gender gap F 0.3 F 3.1 M 2.5 M 8.5 n/a n/aGraduation rate 88.1 92.3 93.3 94.0 91.4 —Delayed advancement rate 29.9 18.0 24.5 25.8 26.9 —Overall rating out of 10 4.5 4.5 4.8 4.1 3.0 —
SunSHIne COaSTChatelech [Public] Sechelt Gr 12 Enrollment: 100ESL (%): 3.2 Special needs (%): 24.1 French Imm (%): 0.0Actual rating vs predicted based 2016-17 Last 5 Yearson parents’ avg. inc. of $ n/a: n/a Rank: 87/253 127/246Academic Performance 2013 2014 2015 2016 2017 TrendAverage exam mark 66.4 68.5 67.6 67.2 65.0 —Percentage of exams failed 12.5 11.7 9.8 14.0 6.6 —School vs exam mark difference 7.1 4.2 4.5 5.4 8.6 —English gender gap F 9.0 F 4.4 F 5.2 F 7.7 F 1.0 —Math gender gap M 2.0 F 3.3 F 3.5 F 2.3 n/a n/aGraduation rate 100.0 97.2 100.0 100.0 97.7 —Delayed advancement rate 6.3 17.0 6.8 6.9 7.1 —Overall rating out of 10 5.1 5.8 6.5 6.0 6.7 p
Elphinstone [Public] Gibsons Gr 12 Enrollment: 93ESL (%): 2.2 Special needs (%): 16.2 French Imm (%): 0.0Actual rating vs predicted based 2016-17 Last 5 Yearson parents’ avg. inc. of $ n/a: n/a Rank: 37/253 59/246Academic Performance 2013 2014 2015 2016 2017 TrendAverage exam mark 70.1 69.3 71.0 70.3 68.5 —Percentage of exams failed 5.7 7.4 4.8 6.4 4.4 pSchool vs exam mark difference 4.0 4.9 4.0 5.8 8.1 —English gender gap F 7.7 F 6.0 F 4.3 F 4.1 F 1.8 pMath gender gap F 6.0 M 1.2 M 6.5 F 1.3 n/a n/aGraduation rate 99.2 96.5 97.1 100.0 98.9 —Delayed advancement rate 7.7 9.6 2.2 0.0 1.9 pOverall rating out of 10 6.5 6.4 7.1 7.6 7.5 p
VanCOuVeR ISLanD nORTHNorth Island [Public] Port McNeill Gr 12 Enrollment: 54ESL (%): 16.2 Special needs (%): 23.0 French Imm (%): 0.0Actual rating vs predicted based 2016-17 Last 5 Yearson parents’ avg. inc. of $ n/a: n/a Rank: 131/253 217/246Academic Performance 2013 2014 2015 2016 2017 TrendAverage exam mark 59.9 63.4 61.3 60.4 63.4 —Percentage of exams failed 21.4 13.6 19.4 20.7 7.0 —School vs exam mark difference 7.5 4.3 4.5 5.5 6.9 —English gender gap F 10.1 F 6.9 F 4.7 F 8.8 M 1.2 —Math gender gap M 3.1 M 7.2 M 11.3 F 8.3 n/a n/aGraduation rate 95.6 98.5 96.4 100.0 100.0 —Delayed advancement rate 25.5 28.6 17.9 30.9 30.0 —Overall rating out of 10 2.3 5.0 4.3 3.9 6.0 —

Fraser Institute Studies in Education Policy 25
Port Hardy [Public] Port Hardy Gr 12 Enrollment: 43ESL (%): 15.9 Special needs (%): 23.9 French Imm (%): 0.0Actual rating vs predicted based 2016-17 Last 5 Yearson parents’ avg. inc. of $ n/a: n/a Rank: 244/253 240/246Academic Performance 2013 2014 2015 2016 2017 TrendAverage exam mark 59.4 61.6 60.2 60.2 59.0 —Percentage of exams failed 23.9 16.5 21.3 23.9 21.9 —School vs exam mark difference 5.7 3.2 4.8 7.7 8.5 —English gender gap M 1.2 n/a F 16.8 n/a F 9.5 n/aMath gender gap F 10.1 n/a F 1.9 n/a n/a n/aGraduation rate 100.0 92.5 81.1 90.5 100.0 —Delayed advancement rate 26.2 12.1 42.4 32.2 39.0 —Overall rating out of 10 3.5 5.0 1.7 2.7 2.5 —

Report Card on British Columbia’s Secondary Schools 201826
aBBOTSfORDAbbotsford Christian [Independent] Abbotsford Gr 12 Enrollment: 79ESL (%): 0.0 Special needs (%): 9.6 French Imm (%): 0.0Actual rating vs predicted based 2016-17 Last 5 Yearson parents’ avg. inc. of $ n/a: n/a Rank: 57/253 46/246Academic Performance 2013 2014 2015 2016 2017 TrendAverage exam mark 73.6 72.8 73.6 72.0 71.9 —Percentage of exams failed 2.8 2.7 6.3 6.1 4.5 —School vs exam mark difference 1.0 2.6 4.1 4.9 7.4 qEnglish gender gap F 6.7 F 7.5 F 8.7 F 9.9 F 8.3 qMath gender gap M 6.1 F 1.8 F 1.4 F 9.4 n/a n/aGraduation rate 100.0 100.0 98.7 96.1 98.6 —Delayed advancement rate 4.3 5.1 4.8 5.4 3.7 —Overall rating out of 10 7.7 7.8 7.3 6.4 7.1 —
Abbotsford Collegiate [Public] Abbotsford Gr 12 Enrollment: 280ESL (%): 2.5 Special needs (%): 13.2 French Imm (%): 0.0Actual rating vs predicted based 2016-17 Last 5 Yearson parents’ avg. inc. of $ n/a: n/a Rank: 169/253 181/246Academic Performance 2013 2014 2015 2016 2017 TrendAverage exam mark 66.4 64.5 65.6 66.1 64.7 —Percentage of exams failed 13.6 13.5 14.1 10.9 12.7 —School vs exam mark difference 5.4 5.9 5.2 5.1 7.3 pEnglish gender gap F 4.1 F 6.4 F 5.0 F 6.5 F 2.2 —Math gender gap F 2.3 F 1.1 M 3.6 F 5.3 n/a n/aGraduation rate 95.3 94.8 95.0 94.6 94.9 —Delayed advancement rate 14.2 13.8 12.6 19.6 18.8 —Overall rating out of 10 4.9 5.1 5.3 5.5 5.3 p
Abbotsford Traditional [Public] Abbotsford Gr 12 Enrollment: 116ESL (%): 1.5 Special needs (%): 3.6 French Imm (%): 0.0Actual rating vs predicted based 2016-17 Last 5 Yearson parents’ avg. inc. of $ n/a: n/a Rank: 93/253 112/246Academic Performance 2013 2014 2015 2016 2017 TrendAverage exam mark 69.2 68.7 69.1 67.7 67.8 —Percentage of exams failed 7.8 6.9 4.5 9.2 6.8 —School vs exam mark difference 7.4 6.9 8.3 10.0 9.0 —English gender gap F 3.0 F 3.2 F 6.9 F 4.0 F 4.6 —Math gender gap M 5.6 F 1.3 M 0.6 F 2.7 n/a n/aGraduation rate 91.9 96.9 97.1 97.3 98.1 pDelayed advancement rate 8.5 4.1 6.5 6.8 6.0 —Overall rating out of 10 5.3 6.5 6.6 6.0 6.6 —
ASIA - Sumas Mountain [Public] Abbotsford Gr 12 Enrollment: 58ESL (%): 1.2 Special needs (%): 19.7 French Imm (%): 0.0Actual rating vs predicted based 2016-17 Last 5 Yearson parents’ avg. inc. of $ n/a: n/a Rank: 139/253 144/246Academic Performance 2013 2014 2015 2016 2017 TrendAverage exam mark 67.5 66.3 67.5 68.1 65.4 —Percentage of exams failed 11.5 11.3 7.9 6.2 8.2 —School vs exam mark difference 5.5 5.7 6.0 5.3 15.0 —English gender gap F 5.8 F 5.0 F 3.6 n/a F 1.3 n/aMath gender gap M 4.8 F 10.0 F 7.6 n/a n/a n/aGraduation rate 97.3 93.6 100.0 100.0 100.0 —Delayed advancement rate 25.9 19.9 14.5 7.4 18.9 —Overall rating out of 10 5.0 4.7 6.2 6.9 5.9 —
MEI [Independent] Abbotsford Gr 12 Enrollment: 136ESL (%): 0.0 Special needs (%): 7.4 French Imm (%): 0.0Actual rating vs predicted based 2016-17 Last 5 Yearson parents’ avg. inc. of $ n/a: n/a Rank: 30/253 28/246Academic Performance 2013 2014 2015 2016 2017 TrendAverage exam mark 74.2 75.0 73.8 74.3 73.2 pPercentage of exams failed 3.1 2.2 4.1 3.6 4.6 —School vs exam mark difference 4.3 4.1 6.2 5.4 7.2 —English gender gap F 7.1 F 2.7 F 7.4 F 3.3 F 6.1 —Math gender gap F 1.1 M 1.5 F 5.6 M 1.2 n/a n/aGraduation rate 99.4 98.5 99.3 98.6 99.2 —Delayed advancement rate 1.5 0.4 2.6 3.1 3.2 —Overall rating out of 10 7.6 8.1 7.3 8.0 7.7 —
Rick Hansen [Public] Abbotsford Gr 12 Enrollment: 163ESL (%): 5.6 Special needs (%): 12.4 French Imm (%): 0.0Actual rating vs predicted based 2016-17 Last 5 Yearson parents’ avg. inc. of $ n/a: n/a Rank: 204/253 174/246Academic Performance 2013 2014 2015 2016 2017 TrendAverage exam mark 70.2 67.5 69.6 64.7 62.8 —Percentage of exams failed 7.7 11.9 6.2 14.9 14.6 —School vs exam mark difference 4.9 8.5 5.7 8.0 12.3 —English gender gap F 4.3 F 2.7 F 5.3 F 5.7 F 5.5 qMath gender gap F 3.1 F 0.9 F 1.3 F 8.7 n/a n/aGraduation rate 93.5 91.0 95.1 96.9 97.2 pDelayed advancement rate 12.9 16.1 14.6 12.4 12.3 —Overall rating out of 10 5.8 4.8 6.3 4.8 4.6 —
Robert Bateman [Public] Abbotsford Gr 12 Enrollment: 236ESL (%): 0.2 Special needs (%): 17.7 French Imm (%): 0.0Actual rating vs predicted based 2016-17 Last 5 Yearson parents’ avg. inc. of $ n/a: n/a Rank: 93/253 133/246Academic Performance 2013 2014 2015 2016 2017 TrendAverage exam mark 68.5 69.6 68.6 67.5 67.9 —Percentage of exams failed 9.2 8.6 9.5 12.3 9.2 —School vs exam mark difference 4.5 3.8 5.9 6.9 5.5 —English gender gap F 8.8 F 5.2 F 7.5 F 1.7 F 0.1 pMath gender gap F 1.0 M 0.8 M 1.7 F 0.1 n/a n/aGraduation rate 93.8 94.9 94.5 93.1 96.2 —Delayed advancement rate 11.8 20.0 19.6 20.1 19.1 —Overall rating out of 10 5.4 6.1 5.7 5.6 6.6 —
St John Brebeuf [Independent] Abbotsford Gr 12 Enrollment: 95ESL (%): 0.0 Special needs (%): 8.6 French Imm (%): 0.0Actual rating vs predicted based 2016-17 Last 5 Yearson parents’ avg. inc. of $ n/a: n/a Rank: 231/253 194/246Academic Performance 2013 2014 2015 2016 2017 TrendAverage exam mark 72.3 71.6 69.6 67.6 63.8 qPercentage of exams failed 6.5 8.5 10.7 16.5 23.7 qSchool vs exam mark difference 9.9 10.9 13.0 14.1 16.5 —English gender gap M 1.1 F 0.1 F 7.0 F 14.7 F 7.8 qMath gender gap M 5.3 M 0.3 F 3.8 M 0.5 n/a n/aGraduation rate 98.5 98.4 95.3 98.6 98.9 —Delayed advancement rate 4.5 4.8 5.5 3.1 4.4 —Overall rating out of 10 6.1 6.4 5.0 4.1 3.5 q
W J Mouat [Public] Abbotsford Gr 12 Enrollment: 348ESL (%): 2.6 Special needs (%): 10.5 French Imm (%): 24.0Actual rating vs predicted based 2016-17 Last 5 Yearson parents’ avg. inc. of $ n/a: n/a Rank: 77/253 92/246Academic Performance 2013 2014 2015 2016 2017 TrendAverage exam mark 70.8 70.2 69.4 68.8 67.1 qPercentage of exams failed 5.5 8.3 8.3 10.7 7.3 —School vs exam mark difference 2.9 3.7 3.5 4.2 4.9 —English gender gap F 2.2 F 5.5 F 7.8 F 3.6 F 2.6 —Math gender gap F 0.5 F 1.0 F 2.6 F 3.6 n/a n/aGraduation rate 97.6 93.8 95.3 93.9 97.8 —Delayed advancement rate 10.2 16.3 12.6 15.7 11.8 —Overall rating out of 10 7.1 6.2 6.2 6.0 6.8 —
Yale [Public] Abbotsford Gr 12 Enrollment: 307ESL (%): 0.7 Special needs (%): 11.9 French Imm (%): 0.0Actual rating vs predicted based 2016-17 Last 5 Yearson parents’ avg. inc. of $ n/a: n/a Rank: 104/253 76/246Academic Performance 2013 2014 2015 2016 2017 TrendAverage exam mark 72.8 70.7 70.8 71.3 68.7 —Percentage of exams failed 3.6 5.3 5.9 7.2 9.0 qSchool vs exam mark difference 6.0 7.4 7.0 7.3 8.6 pEnglish gender gap F 6.4 F 4.2 F 4.7 F 4.7 F 3.0 —Math gender gap M 4.1 M 1.5 F 2.2 M 0.8 n/a n/aGraduation rate 98.6 98.2 96.8 97.6 97.0 —Delayed advancement rate 7.3 9.2 12.3 11.0 13.9 qOverall rating out of 10 6.9 6.7 6.6 6.8 6.4 —
aRROw LakeSNakusp [Public] Nakusp Gr 12 Enrollment: 38ESL (%): 0.0 Special needs (%): 11.8 French Imm (%): 0.0Actual rating vs predicted based 2016-17 Last 5 Yearson parents’ avg. inc. of $ n/a: n/a Rank: 204/253 234/246Academic Performance 2013 2014 2015 2016 2017 TrendAverage exam mark 66.5 65.3 61.2 62.7 66.0 —Percentage of exams failed 9.6 9.1 24.7 16.9 9.4 —School vs exam mark difference 6.8 9.1 13.2 12.4 14.4 —English gender gap n/a n/a F 13.4 n/a F 10.2 n/aMath gender gap n/a n/a F 1.5 n/a n/a n/aGraduation rate 97.4 90.0 89.5 87.0 97.0 —Delayed advancement rate 7.9 6.2 13.7 38.0 13.5 —Overall rating out of 10 5.1 4.6 2.4 2.0 4.6 —
BOunDaRyGrand Forks [Public] Grand Forks Gr 12 Enrollment: 61ESL (%): 0.0 Special needs (%): 13.2 French Imm (%): 0.0Actual rating vs predicted based 2016-17 Last 5 Yearson parents’ avg. inc. of $ n/a: n/a Rank: 57/253 76/246Academic Performance 2013 2014 2015 2016 2017 TrendAverage exam mark 69.2 69.6 68.7 71.8 69.8 pPercentage of exams failed 7.9 6.3 7.1 3.7 3.8 pSchool vs exam mark difference 3.7 4.2 3.2 2.0 4.2 pEnglish gender gap F 4.0 F 6.5 F 7.3 F 11.6 F 8.0 qMath gender gap F 10.7 E F 7.7 F 9.3 n/a n/aGraduation rate 93.2 94.3 98.4 96.6 98.1 pDelayed advancement rate 9.0 5.5 5.4 3.3 6.7 —Overall rating out of 10 5.8 6.7 6.8 7.3 7.1 p
CenTRaL OkanaganAberdeen Hall [Independent] Kelowna Gr 12 Enrollment: 38ESL (%): 0.0 Special needs (%): 6.8 French Imm (%): 0.0Actual rating vs predicted based 2016-17 Last 5 Yearson parents’ avg. inc. of $ n/a: n/a Rank: 65/253 n/aAcademic Performance 2013 2014 2015 2016 2017 TrendAverage exam mark n/a 79.9 75.6 78.8 73.0 n/aPercentage of exams failed n/a 1.8 3.9 2.0 5.3 n/aSchool vs exam mark difference n/a 3.5 7.5 6.0 9.3 n/aEnglish gender gap n/a M 5.6 F 6.7 F 8.7 F 10.8 n/aMath gender gap n/a F 3.2 F 2.1 F 5.7 n/a n/aGraduation rate n/a 100.0 100.0 100.0 100.0 n/aDelayed advancement rate n/a 0.0 0.0 4.0 0.9 n/aOverall rating out of 10 n/a 8.6 7.7 8.1 7.0 n/a
George Elliot [Public] Winfield Gr 12 Enrollment: 135ESL (%): 0.6 Special needs (%): 12.2 French Imm (%): 0.0Actual rating vs predicted based 2016-17 Last 5 Yearson parents’ avg. inc. of $ n/a: n/a Rank: 43/253 76/246Academic Performance 2013 2014 2015 2016 2017 TrendAverage exam mark 69.6 67.0 67.8 67.0 66.7 —Percentage of exams failed 5.9 9.9 7.9 8.0 6.0 —School vs exam mark difference 4.8 5.9 7.6 8.9 6.4 —English gender gap F 8.0 F 6.3 F 0.5 F 4.1 F 1.2 —Math gender gap M 3.4 M 4.3 F 2.9 F 0.5 n/a n/aGraduation rate 99.3 97.0 98.6 99.2 99.2 —Delayed advancement rate 1.9 9.2 1.7 10.1 3.6 —Overall rating out of 10 6.8 5.9 6.8 6.4 7.4 —
Immaculata [Independent] Kelowna Gr 12 Enrollment: 44ESL (%): 2.0 Special needs (%): 12.2 French Imm (%): 0.0Actual rating vs predicted based 2016-17 Last 5 Yearson parents’ avg. inc. of $ n/a: n/a Rank: 43/253 50/246Academic Performance 2013 2014 2015 2016 2017 TrendAverage exam mark 72.3 76.3 73.8 73.4 69.0 —Percentage of exams failed 7.5 4.0 6.7 7.8 9.3 —School vs exam mark difference 7.4 6.3 5.7 6.4 7.6 pEnglish gender gap F 0.9 F 3.3 F 2.2 F 11.7 F 0.7 —Math gender gap M 1.1 M 4.3 M 6.3 F 6.2 n/a n/aGraduation rate 100.0 100.0 100.0 95.0 100.0 —Delayed advancement rate 2.3 2.5 5.3 0.0 0.8 —Overall rating out of 10 7.1 7.8 7.2 6.4 7.4 —
Fraser Valley and Southern British Columbia
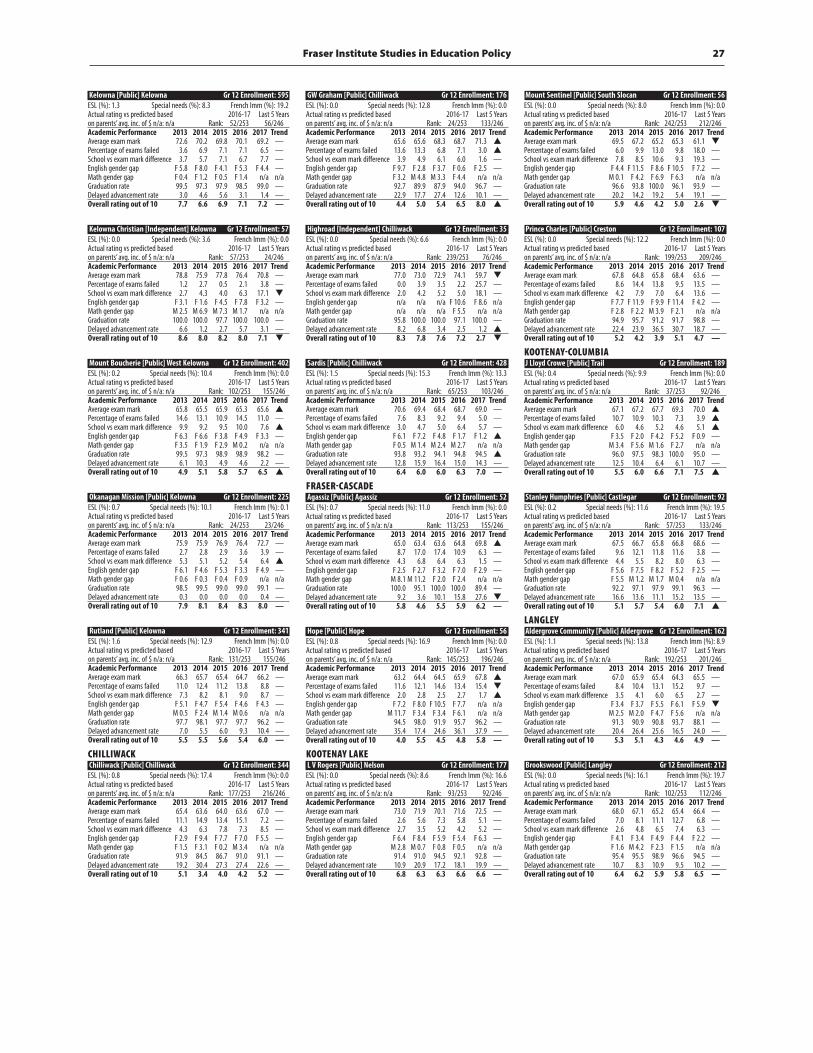
Fraser Institute Studies in Education Policy 27
Kelowna [Public] Kelowna Gr 12 Enrollment: 595ESL (%): 1.3 Special needs (%): 8.3 French Imm (%): 19.2Actual rating vs predicted based 2016-17 Last 5 Yearson parents’ avg. inc. of $ n/a: n/a Rank: 52/253 56/246Academic Performance 2013 2014 2015 2016 2017 TrendAverage exam mark 72.6 70.2 69.8 70.1 69.2 —Percentage of exams failed 3.6 6.9 7.1 7.1 6.5 —School vs exam mark difference 3.7 5.7 7.1 6.7 7.7 —English gender gap F 5.8 F 8.0 F 4.1 F 5.3 F 4.4 —Math gender gap F 0.4 F 1.2 F 0.5 F 1.4 n/a n/aGraduation rate 99.5 97.3 97.9 98.5 99.0 —Delayed advancement rate 3.0 4.6 5.6 3.1 1.4 —Overall rating out of 10 7.7 6.6 6.9 7.1 7.2 —
Kelowna Christian [Independent] Kelowna Gr 12 Enrollment: 57ESL (%): 0.0 Special needs (%): 3.6 French Imm (%): 0.0Actual rating vs predicted based 2016-17 Last 5 Yearson parents’ avg. inc. of $ n/a: n/a Rank: 57/253 24/246Academic Performance 2013 2014 2015 2016 2017 TrendAverage exam mark 78.8 75.9 77.8 76.4 70.8 —Percentage of exams failed 1.2 2.7 0.5 2.1 3.8 —School vs exam mark difference 2.7 4.3 4.0 6.3 17.1 qEnglish gender gap F 3.1 F 1.6 F 4.5 F 7.8 F 3.2 —Math gender gap M 2.5 M 6.9 M 7.3 M 1.7 n/a n/aGraduation rate 100.0 100.0 97.7 100.0 100.0 —Delayed advancement rate 6.6 1.2 2.7 5.7 3.1 —Overall rating out of 10 8.6 8.0 8.2 8.0 7.1 q
Mount Boucherie [Public] West Kelowna Gr 12 Enrollment: 402ESL (%): 0.2 Special needs (%): 10.4 French Imm (%): 0.0Actual rating vs predicted based 2016-17 Last 5 Yearson parents’ avg. inc. of $ n/a: n/a Rank: 102/253 155/246Academic Performance 2013 2014 2015 2016 2017 TrendAverage exam mark 65.8 65.5 65.9 65.3 65.6 pPercentage of exams failed 14.6 13.1 10.9 14.5 11.0 —School vs exam mark difference 9.9 9.2 9.5 10.0 7.6 pEnglish gender gap F 6.3 F 6.6 F 3.8 F 4.9 F 3.3 —Math gender gap F 3.5 F 1.9 F 2.9 M 0.2 n/a n/aGraduation rate 99.5 97.3 98.9 98.9 98.2 —Delayed advancement rate 6.1 10.3 4.9 4.6 2.2 —Overall rating out of 10 4.9 5.1 5.8 5.7 6.5 p
Okanagan Mission [Public] Kelowna Gr 12 Enrollment: 225ESL (%): 0.7 Special needs (%): 10.1 French Imm (%): 0.1Actual rating vs predicted based 2016-17 Last 5 Yearson parents’ avg. inc. of $ n/a: n/a Rank: 24/253 23/246Academic Performance 2013 2014 2015 2016 2017 TrendAverage exam mark 75.9 75.9 76.9 76.4 72.7 —Percentage of exams failed 2.7 2.8 2.9 3.6 3.9 —School vs exam mark difference 5.3 5.1 5.2 5.4 6.4 pEnglish gender gap F 6.1 F 4.6 F 5.3 F 3.3 F 4.9 —Math gender gap F 0.6 F 0.3 F 0.4 F 0.9 n/a n/aGraduation rate 98.5 99.5 99.0 99.0 99.1 —Delayed advancement rate 0.3 0.0 0.0 0.0 0.4 —Overall rating out of 10 7.9 8.1 8.4 8.3 8.0 —
Rutland [Public] Kelowna Gr 12 Enrollment: 341ESL (%): 1.6 Special needs (%): 12.9 French Imm (%): 0.0Actual rating vs predicted based 2016-17 Last 5 Yearson parents’ avg. inc. of $ n/a: n/a Rank: 131/253 155/246Academic Performance 2013 2014 2015 2016 2017 TrendAverage exam mark 66.3 65.7 65.4 64.7 66.2 —Percentage of exams failed 11.0 12.4 11.2 13.8 8.8 —School vs exam mark difference 7.3 8.2 8.1 9.0 8.7 —English gender gap F 5.1 F 4.7 F 5.4 F 4.6 F 4.3 —Math gender gap M 0.5 F 2.4 M 1.4 M 0.6 n/a n/aGraduation rate 97.7 98.1 97.7 97.7 96.2 —Delayed advancement rate 7.0 5.5 6.0 9.3 10.4 —Overall rating out of 10 5.5 5.5 5.6 5.4 6.0 —
CHILLIwaCkChilliwack [Public] Chilliwack Gr 12 Enrollment: 344ESL (%): 0.8 Special needs (%): 17.4 French Imm (%): 0.0Actual rating vs predicted based 2016-17 Last 5 Yearson parents’ avg. inc. of $ n/a: n/a Rank: 177/253 216/246Academic Performance 2013 2014 2015 2016 2017 TrendAverage exam mark 65.4 63.6 64.0 63.6 67.0 —Percentage of exams failed 11.1 14.9 13.4 15.1 7.2 —School vs exam mark difference 4.3 6.3 7.8 7.3 8.5 —English gender gap F 2.9 F 9.4 F 7.7 F 7.0 F 5.5 —Math gender gap F 1.5 F 3.1 F 0.2 M 3.4 n/a n/aGraduation rate 91.9 84.5 86.7 91.0 91.1 —Delayed advancement rate 19.2 30.4 27.3 27.4 22.6 —Overall rating out of 10 5.1 3.4 4.0 4.2 5.2 —
GW Graham [Public] Chilliwack Gr 12 Enrollment: 176ESL (%): 0.0 Special needs (%): 12.8 French Imm (%): 0.0Actual rating vs predicted based 2016-17 Last 5 Yearson parents’ avg. inc. of $ n/a: n/a Rank: 24/253 133/246Academic Performance 2013 2014 2015 2016 2017 TrendAverage exam mark 65.6 65.6 68.3 68.7 71.3 pPercentage of exams failed 13.6 13.3 6.8 7.1 3.0 pSchool vs exam mark difference 3.9 4.9 6.1 6.0 1.6 —English gender gap F 9.7 F 2.8 F 3.7 F 0.6 F 2.5 —Math gender gap F 3.2 M 4.8 M 3.3 F 4.4 n/a n/aGraduation rate 92.7 89.9 87.9 94.0 96.7 —Delayed advancement rate 22.9 17.7 27.4 12.6 10.1 —Overall rating out of 10 4.4 5.0 5.4 6.5 8.0 p
Highroad [Independent] Chilliwack Gr 12 Enrollment: 35ESL (%): 0.0 Special needs (%): 6.6 French Imm (%): 0.0Actual rating vs predicted based 2016-17 Last 5 Yearson parents’ avg. inc. of $ n/a: n/a Rank: 239/253 76/246Academic Performance 2013 2014 2015 2016 2017 TrendAverage exam mark 77.0 73.0 72.9 74.1 59.7 qPercentage of exams failed 0.0 3.9 3.5 2.2 25.7 —School vs exam mark difference 2.0 4.2 5.2 5.0 18.1 —English gender gap n/a n/a n/a F 10.6 F 8.6 n/aMath gender gap n/a n/a n/a F 5.5 n/a n/aGraduation rate 95.8 100.0 100.0 97.1 100.0 —Delayed advancement rate 8.2 6.8 3.4 2.5 1.2 pOverall rating out of 10 8.3 7.8 7.6 7.2 2.7 q
Sardis [Public] Chilliwack Gr 12 Enrollment: 428ESL (%): 1.5 Special needs (%): 15.3 French Imm (%): 13.3Actual rating vs predicted based 2016-17 Last 5 Yearson parents’ avg. inc. of $ n/a: n/a Rank: 65/253 103/246Academic Performance 2013 2014 2015 2016 2017 TrendAverage exam mark 70.6 69.4 68.4 68.7 69.0 —Percentage of exams failed 7.6 8.3 9.2 9.4 5.0 —School vs exam mark difference 3.0 4.7 5.0 6.4 5.7 —English gender gap F 6.1 F 7.2 F 4.8 F 1.7 F 1.2 pMath gender gap F 0.5 M 1.4 M 2.4 M 2.7 n/a n/aGraduation rate 93.8 93.2 94.1 94.8 94.5 pDelayed advancement rate 12.8 15.9 16.4 15.0 14.3 —Overall rating out of 10 6.4 6.0 6.0 6.3 7.0 —
fRaSeR-CaSCaDeAgassiz [Public] Agassiz Gr 12 Enrollment: 52ESL (%): 0.7 Special needs (%): 11.0 French Imm (%): 0.0Actual rating vs predicted based 2016-17 Last 5 Yearson parents’ avg. inc. of $ n/a: n/a Rank: 113/253 155/246Academic Performance 2013 2014 2015 2016 2017 TrendAverage exam mark 65.0 63.4 63.6 64.8 69.8 pPercentage of exams failed 8.7 17.0 17.4 10.9 6.3 —School vs exam mark difference 4.3 6.8 6.4 6.3 1.5 —English gender gap F 2.5 F 2.7 F 3.2 F 7.0 F 2.9 —Math gender gap M 8.1 M 11.2 F 2.0 F 2.4 n/a n/aGraduation rate 100.0 95.1 100.0 100.0 89.4 —Delayed advancement rate 9.2 3.6 10.1 15.8 27.6 qOverall rating out of 10 5.8 4.6 5.5 5.9 6.2 —
Hope [Public] Hope Gr 12 Enrollment: 56ESL (%): 0.8 Special needs (%): 16.9 French Imm (%): 0.0Actual rating vs predicted based 2016-17 Last 5 Yearson parents’ avg. inc. of $ n/a: n/a Rank: 145/253 196/246Academic Performance 2013 2014 2015 2016 2017 TrendAverage exam mark 63.2 64.4 64.5 65.9 67.8 pPercentage of exams failed 11.6 12.1 14.6 13.4 15.4 qSchool vs exam mark difference 2.0 2.8 2.5 2.7 1.7 pEnglish gender gap F 7.2 F 8.0 F 10.5 F 7.7 n/a n/aMath gender gap M 11.7 F 3.4 F 3.4 F 6.1 n/a n/aGraduation rate 94.5 98.0 91.9 95.7 96.2 —Delayed advancement rate 35.4 17.4 24.6 36.1 37.9 —Overall rating out of 10 4.0 5.5 4.5 4.8 5.8 —
kOOTenay LakeL V Rogers [Public] Nelson Gr 12 Enrollment: 177ESL (%): 0.0 Special needs (%): 8.6 French Imm (%): 16.6Actual rating vs predicted based 2016-17 Last 5 Yearson parents’ avg. inc. of $ n/a: n/a Rank: 93/253 92/246Academic Performance 2013 2014 2015 2016 2017 TrendAverage exam mark 73.0 71.9 70.1 71.6 72.5 —Percentage of exams failed 2.6 5.6 7.3 5.8 5.1 —School vs exam mark difference 2.7 3.5 5.2 4.2 5.2 —English gender gap F 6.4 F 8.4 F 5.9 F 5.4 F 6.3 —Math gender gap M 2.8 M 0.7 F 0.8 F 0.5 n/a n/aGraduation rate 91.4 91.0 94.5 92.1 92.8 —Delayed advancement rate 10.9 20.9 17.2 18.1 19.9 —Overall rating out of 10 6.8 6.3 6.3 6.6 6.6 —
Mount Sentinel [Public] South Slocan Gr 12 Enrollment: 56ESL (%): 0.0 Special needs (%): 8.0 French Imm (%): 0.0Actual rating vs predicted based 2016-17 Last 5 Yearson parents’ avg. inc. of $ n/a: n/a Rank: 242/253 212/246Academic Performance 2013 2014 2015 2016 2017 TrendAverage exam mark 69.5 67.2 65.2 65.3 61.1 qPercentage of exams failed 6.0 9.9 13.0 9.8 18.0 —School vs exam mark difference 7.8 8.5 10.6 9.3 19.3 —English gender gap F 4.4 F 11.5 F 8.6 F 10.5 F 7.2 —Math gender gap M 0.1 F 4.2 F 6.9 F 6.3 n/a n/aGraduation rate 96.6 93.8 100.0 96.1 93.9 —Delayed advancement rate 20.2 14.2 19.2 5.4 19.1 —Overall rating out of 10 5.9 4.6 4.2 5.0 2.6 q
Prince Charles [Public] Creston Gr 12 Enrollment: 107ESL (%): 0.0 Special needs (%): 12.2 French Imm (%): 0.0Actual rating vs predicted based 2016-17 Last 5 Yearson parents’ avg. inc. of $ n/a: n/a Rank: 199/253 209/246Academic Performance 2013 2014 2015 2016 2017 TrendAverage exam mark 67.8 64.8 65.8 68.4 63.6 —Percentage of exams failed 8.6 14.4 13.8 9.5 13.5 —School vs exam mark difference 4.2 7.9 7.0 6.4 13.6 —English gender gap F 7.7 F 11.9 F 9.9 F 11.4 F 4.2 —Math gender gap F 2.8 F 2.2 M 3.9 F 2.1 n/a n/aGraduation rate 94.9 95.7 91.2 91.7 98.8 —Delayed advancement rate 22.4 23.9 36.5 30.7 18.7 —Overall rating out of 10 5.2 4.2 3.9 5.1 4.7 —
kOOTenay-COLumBIaJ Lloyd Crowe [Public] Trail Gr 12 Enrollment: 189ESL (%): 0.4 Special needs (%): 9.9 French Imm (%): 0.0Actual rating vs predicted based 2016-17 Last 5 Yearson parents’ avg. inc. of $ n/a: n/a Rank: 37/253 92/246Academic Performance 2013 2014 2015 2016 2017 TrendAverage exam mark 67.1 67.2 67.7 69.3 70.0 pPercentage of exams failed 10.7 10.9 10.3 7.3 3.9 pSchool vs exam mark difference 6.0 4.6 5.2 4.6 5.1 pEnglish gender gap F 3.5 F 2.0 F 4.2 F 5.2 F 0.9 —Math gender gap M 3.4 F 5.6 M 1.6 F 2.7 n/a n/aGraduation rate 96.0 97.5 98.3 100.0 95.0 —Delayed advancement rate 12.5 10.4 6.4 6.1 10.7 —Overall rating out of 10 5.5 6.0 6.6 7.1 7.5 p
Stanley Humphries [Public] Castlegar Gr 12 Enrollment: 92ESL (%): 0.2 Special needs (%): 11.6 French Imm (%): 19.5Actual rating vs predicted based 2016-17 Last 5 Yearson parents’ avg. inc. of $ n/a: n/a Rank: 57/253 133/246Academic Performance 2013 2014 2015 2016 2017 TrendAverage exam mark 67.5 66.7 65.8 66.8 68.6 —Percentage of exams failed 9.6 12.1 11.8 11.6 3.8 —School vs exam mark difference 4.4 5.5 8.2 8.0 6.3 —English gender gap F 5.6 F 7.5 F 8.2 F 5.2 F 2.5 —Math gender gap F 5.5 M 1.2 M 1.7 M 0.4 n/a n/aGraduation rate 92.2 97.1 97.9 99.1 96.3 —Delayed advancement rate 16.6 13.6 11.1 15.2 13.5 —Overall rating out of 10 5.1 5.7 5.4 6.0 7.1 p
LangLeyAldergrove Community [Public] Aldergrove Gr 12 Enrollment: 162ESL (%): 1.1 Special needs (%): 13.8 French Imm (%): 8.9Actual rating vs predicted based 2016-17 Last 5 Yearson parents’ avg. inc. of $ n/a: n/a Rank: 192/253 201/246Academic Performance 2013 2014 2015 2016 2017 TrendAverage exam mark 67.0 65.9 65.4 64.3 65.5 —Percentage of exams failed 8.4 10.4 13.1 15.2 9.7 —School vs exam mark difference 3.5 4.1 6.0 6.5 2.7 —English gender gap F 3.4 F 3.7 F 5.5 F 6.1 F 5.9 qMath gender gap M 2.5 M 2.0 F 4.7 F 5.6 n/a n/aGraduation rate 91.3 90.9 90.8 93.7 88.1 —Delayed advancement rate 20.4 26.4 25.6 16.5 24.0 —Overall rating out of 10 5.3 5.1 4.3 4.6 4.9 —
Brookswood [Public] Langley Gr 12 Enrollment: 212ESL (%): 0.0 Special needs (%): 16.1 French Imm (%): 19.7Actual rating vs predicted based 2016-17 Last 5 Yearson parents’ avg. inc. of $ n/a: n/a Rank: 102/253 112/246Academic Performance 2013 2014 2015 2016 2017 TrendAverage exam mark 68.0 67.1 65.2 65.4 66.4 —Percentage of exams failed 7.0 8.1 11.1 12.7 6.8 —School vs exam mark difference 2.6 4.8 6.5 7.4 6.3 —English gender gap F 4.1 F 3.4 F 4.9 F 4.4 F 2.2 —Math gender gap F 1.6 M 4.2 F 2.3 F 1.5 n/a n/aGraduation rate 95.4 95.5 98.9 96.6 94.5 —Delayed advancement rate 10.7 8.3 10.9 9.5 10.2 —Overall rating out of 10 6.4 6.2 5.9 5.8 6.5 —
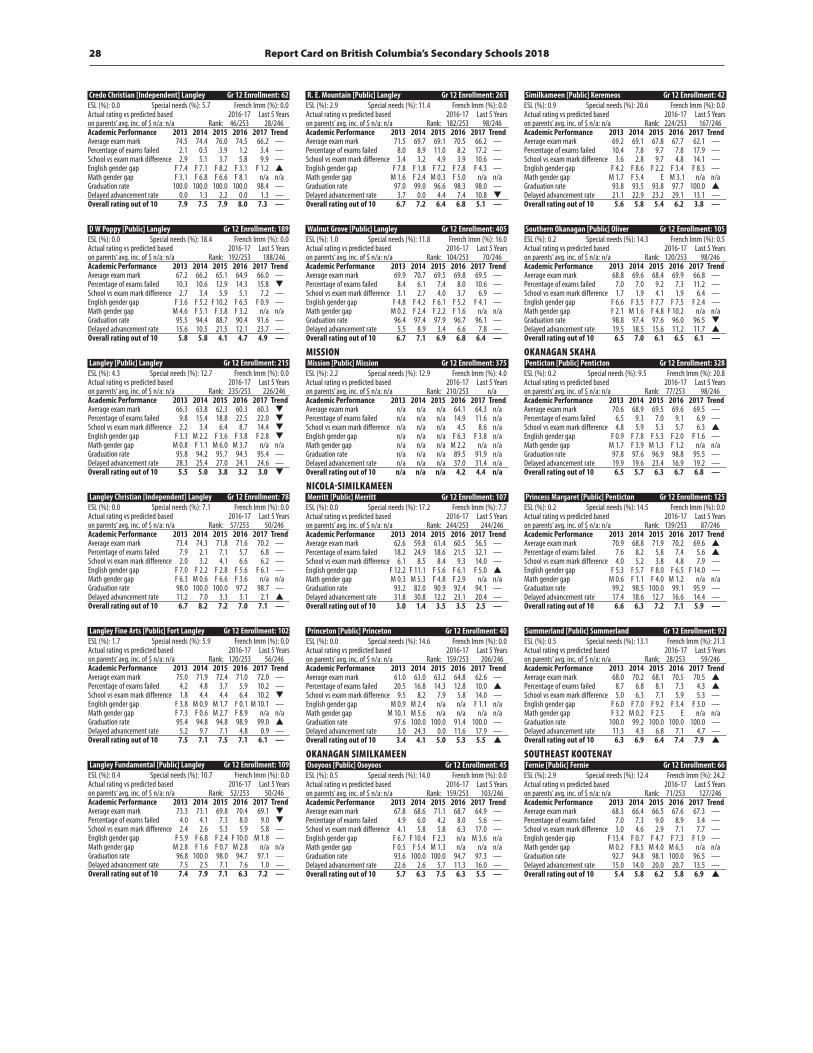
Report Card on British Columbia’s Secondary Schools 201828
Credo Christian [Independent] Langley Gr 12 Enrollment: 62ESL (%): 0.0 Special needs (%): 5.7 French Imm (%): 0.0Actual rating vs predicted based 2016-17 Last 5 Yearson parents’ avg. inc. of $ n/a: n/a Rank: 46/253 28/246Academic Performance 2013 2014 2015 2016 2017 TrendAverage exam mark 74.5 74.4 76.0 74.5 66.2 —Percentage of exams failed 2.1 0.5 3.9 1.2 3.4 —School vs exam mark difference 2.9 5.1 3.7 5.8 9.9 —English gender gap F 7.4 F 7.1 F 8.2 F 3.1 F 1.2 pMath gender gap F 3.1 F 6.8 F 6.6 F 8.1 n/a n/aGraduation rate 100.0 100.0 100.0 100.0 98.4 —Delayed advancement rate 0.0 1.3 2.2 0.0 1.3 —Overall rating out of 10 7.9 7.5 7.9 8.0 7.3 —
D W Poppy [Public] Langley Gr 12 Enrollment: 189ESL (%): 0.0 Special needs (%): 18.4 French Imm (%): 0.0Actual rating vs predicted based 2016-17 Last 5 Yearson parents’ avg. inc. of $ n/a: n/a Rank: 192/253 188/246Academic Performance 2013 2014 2015 2016 2017 TrendAverage exam mark 67.2 66.2 65.1 64.9 66.0 —Percentage of exams failed 10.3 10.6 12.9 14.3 15.8 qSchool vs exam mark difference 2.7 3.4 5.9 5.1 7.2 —English gender gap F 3.6 F 5.2 F 10.2 F 6.5 F 0.9 —Math gender gap M 4.6 F 5.1 F 3.8 F 3.2 n/a n/aGraduation rate 95.5 94.4 88.7 90.4 91.6 —Delayed advancement rate 15.6 10.5 21.5 12.1 23.7 —Overall rating out of 10 5.8 5.8 4.1 4.7 4.9 —
Langley [Public] Langley Gr 12 Enrollment: 215ESL (%): 4.3 Special needs (%): 12.7 French Imm (%): 0.0Actual rating vs predicted based 2016-17 Last 5 Yearson parents’ avg. inc. of $ n/a: n/a Rank: 235/253 226/246Academic Performance 2013 2014 2015 2016 2017 TrendAverage exam mark 66.3 63.8 62.3 60.3 60.3 qPercentage of exams failed 9.8 15.4 18.8 22.5 22.0 qSchool vs exam mark difference 2.2 3.4 6.4 8.7 14.4 qEnglish gender gap F 3.3 M 2.2 F 3.6 F 3.8 F 2.8 qMath gender gap M 0.8 F 1.1 M 6.0 M 3.7 n/a n/aGraduation rate 95.8 94.2 95.7 94.5 95.4 —Delayed advancement rate 28.3 25.4 27.0 24.1 24.6 —Overall rating out of 10 5.5 5.0 3.8 3.2 3.0 q
Langley Christian [Independent] Langley Gr 12 Enrollment: 78ESL (%): 0.0 Special needs (%): 7.1 French Imm (%): 0.0Actual rating vs predicted based 2016-17 Last 5 Yearson parents’ avg. inc. of $ n/a: n/a Rank: 57/253 50/246Academic Performance 2013 2014 2015 2016 2017 TrendAverage exam mark 73.4 74.3 71.8 71.6 70.2 —Percentage of exams failed 7.9 2.1 7.1 5.7 6.8 —School vs exam mark difference 2.0 3.2 4.1 6.6 6.2 —English gender gap F 7.0 F 2.2 F 2.8 F 5.6 F 6.1 —Math gender gap F 6.3 M 0.6 F 6.6 F 3.6 n/a n/aGraduation rate 98.0 100.0 100.0 97.2 98.7 —Delayed advancement rate 11.2 7.0 3.3 3.1 2.1 pOverall rating out of 10 6.7 8.2 7.2 7.0 7.1 —
Langley Fine Arts [Public] Fort Langley Gr 12 Enrollment: 102ESL (%): 1.7 Special needs (%): 5.9 French Imm (%): 0.0Actual rating vs predicted based 2016-17 Last 5 Yearson parents’ avg. inc. of $ n/a: n/a Rank: 120/253 56/246Academic Performance 2013 2014 2015 2016 2017 TrendAverage exam mark 75.0 71.9 72.4 71.0 72.0 —Percentage of exams failed 4.2 4.8 3.7 5.9 10.2 —School vs exam mark difference 1.8 4.4 4.4 6.4 10.2 qEnglish gender gap F 3.8 M 0.9 M 1.7 F 0.1 M 10.1 —Math gender gap F 7.3 F 0.6 M 2.7 F 8.9 n/a n/aGraduation rate 95.4 94.8 94.8 98.9 99.0 pDelayed advancement rate 5.2 9.7 7.1 4.8 0.9 —Overall rating out of 10 7.5 7.1 7.5 7.1 6.1 —
Langley Fundamental [Public] Langley Gr 12 Enrollment: 109ESL (%): 0.4 Special needs (%): 10.7 French Imm (%): 0.0Actual rating vs predicted based 2016-17 Last 5 Yearson parents’ avg. inc. of $ n/a: n/a Rank: 52/253 50/246Academic Performance 2013 2014 2015 2016 2017 TrendAverage exam mark 73.3 73.1 69.8 70.4 69.1 qPercentage of exams failed 4.0 4.1 7.3 8.0 9.0 qSchool vs exam mark difference 2.4 2.6 5.3 5.9 5.8 —English gender gap F 5.9 F 6.8 F 2.4 F 10.0 M 1.8 —Math gender gap M 2.8 F 1.6 F 0.7 M 2.8 n/a n/aGraduation rate 96.8 100.0 98.0 94.7 97.1 —Delayed advancement rate 7.5 2.5 7.1 7.6 1.0 —Overall rating out of 10 7.4 7.9 7.1 6.3 7.2 —
R. E. Mountain [Public] Langley Gr 12 Enrollment: 261ESL (%): 2.9 Special needs (%): 11.4 French Imm (%): 0.0Actual rating vs predicted based 2016-17 Last 5 Yearson parents’ avg. inc. of $ n/a: n/a Rank: 182/253 98/246Academic Performance 2013 2014 2015 2016 2017 TrendAverage exam mark 71.5 69.7 69.1 70.5 66.2 —Percentage of exams failed 8.0 8.9 11.0 8.2 17.2 —School vs exam mark difference 3.4 3.2 4.9 3.9 10.6 —English gender gap F 7.8 F 1.8 F 7.2 F 7.8 F 4.3 —Math gender gap M 1.6 F 2.4 M 0.3 F 5.0 n/a n/aGraduation rate 97.0 99.0 96.6 98.3 98.0 —Delayed advancement rate 3.7 0.0 4.4 7.4 10.8 qOverall rating out of 10 6.7 7.2 6.4 6.8 5.1 —
Walnut Grove [Public] Langley Gr 12 Enrollment: 405ESL (%): 1.0 Special needs (%): 11.8 French Imm (%): 16.0Actual rating vs predicted based 2016-17 Last 5 Yearson parents’ avg. inc. of $ n/a: n/a Rank: 104/253 70/246Academic Performance 2013 2014 2015 2016 2017 TrendAverage exam mark 69.9 70.7 69.5 69.8 69.5 —Percentage of exams failed 8.4 6.1 7.4 8.0 10.6 —School vs exam mark difference 3.1 2.7 4.0 3.7 6.9 —English gender gap F 4.8 F 4.2 F 6.1 F 5.2 F 4.1 —Math gender gap M 0.2 F 2.4 F 2.2 F 1.6 n/a n/aGraduation rate 96.4 97.4 97.9 96.7 96.1 —Delayed advancement rate 5.5 8.9 3.4 6.6 7.8 —Overall rating out of 10 6.7 7.1 6.9 6.8 6.4 —
mISSIOnMission [Public] Mission Gr 12 Enrollment: 375ESL (%): 2.2 Special needs (%): 12.9 French Imm (%): 4.0Actual rating vs predicted based 2016-17 Last 5 Yearson parents’ avg. inc. of $ n/a: n/a Rank: 210/253 n/aAcademic Performance 2013 2014 2015 2016 2017 TrendAverage exam mark n/a n/a n/a 64.1 64.3 n/aPercentage of exams failed n/a n/a n/a 14.9 11.6 n/aSchool vs exam mark difference n/a n/a n/a 4.5 8.6 n/aEnglish gender gap n/a n/a n/a F 6.3 F 3.8 n/aMath gender gap n/a n/a n/a M 2.2 n/a n/aGraduation rate n/a n/a n/a 89.5 91.9 n/aDelayed advancement rate n/a n/a n/a 37.0 31.4 n/aOverall rating out of 10 n/a n/a n/a 4.2 4.4 n/a
nICOLa-SImILkameenMerritt [Public] Merritt Gr 12 Enrollment: 107ESL (%): 0.0 Special needs (%): 17.2 French Imm (%): 7.7Actual rating vs predicted based 2016-17 Last 5 Yearson parents’ avg. inc. of $ n/a: n/a Rank: 244/253 244/246Academic Performance 2013 2014 2015 2016 2017 TrendAverage exam mark 62.6 59.8 61.4 60.5 56.5 —Percentage of exams failed 18.2 24.9 18.6 21.5 32.1 —School vs exam mark difference 6.1 8.5 8.4 9.3 14.0 —English gender gap F 12.2 F 11.1 F 5.6 F 6.1 F 5.0 pMath gender gap M 0.3 M 5.3 F 4.8 F 2.9 n/a n/aGraduation rate 93.2 82.0 90.9 92.4 94.1 —Delayed advancement rate 31.8 30.8 12.2 23.1 20.4 —Overall rating out of 10 3.0 1.4 3.5 3.5 2.5 —
Princeton [Public] Princeton Gr 12 Enrollment: 40ESL (%): 0.0 Special needs (%): 14.6 French Imm (%): 0.0Actual rating vs predicted based 2016-17 Last 5 Yearson parents’ avg. inc. of $ n/a: n/a Rank: 159/253 206/246Academic Performance 2013 2014 2015 2016 2017 TrendAverage exam mark 61.0 63.0 63.2 64.8 62.6 —Percentage of exams failed 20.5 16.8 14.3 12.8 10.0 pSchool vs exam mark difference 9.5 8.2 7.9 5.8 14.0 —English gender gap M 0.9 M 2.4 n/a n/a F 1.1 n/aMath gender gap M 10.1 M 5.6 n/a n/a n/a n/aGraduation rate 97.6 100.0 100.0 91.4 100.0 —Delayed advancement rate 3.0 24.3 0.0 11.6 17.9 —Overall rating out of 10 3.4 4.1 5.0 5.3 5.5 p
Okanagan SImILkameenOsoyoos [Public] Osoyoos Gr 12 Enrollment: 45ESL (%): 0.5 Special needs (%): 14.0 French Imm (%): 0.0Actual rating vs predicted based 2016-17 Last 5 Yearson parents’ avg. inc. of $ n/a: n/a Rank: 159/253 103/246Academic Performance 2013 2014 2015 2016 2017 TrendAverage exam mark 67.8 68.6 71.1 68.7 64.9 —Percentage of exams failed 4.9 6.0 4.2 8.0 5.6 —School vs exam mark difference 4.1 5.8 5.8 6.3 17.0 —English gender gap F 6.7 F 10.4 F 2.3 n/a M 3.6 n/aMath gender gap F 0.5 F 5.4 M 1.3 n/a n/a n/aGraduation rate 93.6 100.0 100.0 94.7 97.3 —Delayed advancement rate 22.6 2.6 5.7 11.3 16.0 —Overall rating out of 10 5.7 6.3 7.5 6.3 5.5 —
Similkameen [Public] Keremeos Gr 12 Enrollment: 42ESL (%): 0.9 Special needs (%): 20.6 French Imm (%): 0.0Actual rating vs predicted based 2016-17 Last 5 Yearson parents’ avg. inc. of $ n/a: n/a Rank: 224/253 167/246Academic Performance 2013 2014 2015 2016 2017 TrendAverage exam mark 69.2 69.1 67.8 67.7 62.1 —Percentage of exams failed 10.4 7.8 9.7 7.8 17.9 —School vs exam mark difference 3.6 2.8 9.7 4.8 14.1 —English gender gap F 4.2 F 8.6 F 2.2 F 3.4 F 8.3 —Math gender gap M 1.7 F 5.4 E M 3.1 n/a n/aGraduation rate 93.8 93.5 93.8 97.7 100.0 pDelayed advancement rate 21.1 22.9 23.2 29.1 13.1 —Overall rating out of 10 5.6 5.8 5.4 6.2 3.8 —
Southern Okanagan [Public] Oliver Gr 12 Enrollment: 105ESL (%): 0.2 Special needs (%): 14.3 French Imm (%): 0.5Actual rating vs predicted based 2016-17 Last 5 Yearson parents’ avg. inc. of $ n/a: n/a Rank: 120/253 98/246Academic Performance 2013 2014 2015 2016 2017 TrendAverage exam mark 68.8 69.6 68.4 69.9 66.8 —Percentage of exams failed 7.0 7.0 9.2 7.3 11.2 —School vs exam mark difference 1.7 1.9 4.1 1.9 6.4 —English gender gap F 6.6 F 3.5 F 7.7 F 7.5 F 2.4 —Math gender gap F 2.1 M 1.6 F 4.8 F 10.2 n/a n/aGraduation rate 98.8 97.4 97.6 96.0 96.5 qDelayed advancement rate 19.5 18.5 15.6 11.2 11.7 pOverall rating out of 10 6.5 7.0 6.1 6.5 6.1 —
Okanagan SkaHaPenticton [Public] Penticton Gr 12 Enrollment: 328ESL (%): 0.2 Special needs (%): 9.5 French Imm (%): 20.8Actual rating vs predicted based 2016-17 Last 5 Yearson parents’ avg. inc. of $ n/a: n/a Rank: 77/253 98/246Academic Performance 2013 2014 2015 2016 2017 TrendAverage exam mark 70.6 68.9 69.5 69.6 69.5 —Percentage of exams failed 6.5 9.3 7.0 9.1 6.9 —School vs exam mark difference 4.8 5.9 5.3 5.7 6.3 pEnglish gender gap F 0.9 F 7.8 F 5.3 F 2.0 F 1.6 —Math gender gap M 1.7 F 3.9 M 1.3 F 1.2 n/a n/aGraduation rate 97.8 97.6 96.9 98.8 95.5 —Delayed advancement rate 19.9 19.6 23.4 16.9 19.2 —Overall rating out of 10 6.5 5.7 6.3 6.7 6.8 —
Princess Margaret [Public] Penticton Gr 12 Enrollment: 125ESL (%): 0.2 Special needs (%): 14.5 French Imm (%): 0.0Actual rating vs predicted based 2016-17 Last 5 Yearson parents’ avg. inc. of $ n/a: n/a Rank: 139/253 87/246Academic Performance 2013 2014 2015 2016 2017 TrendAverage exam mark 70.9 68.8 71.9 70.2 69.6 pPercentage of exams failed 7.6 8.2 5.8 7.4 5.6 pSchool vs exam mark difference 4.0 5.2 3.8 4.8 7.9 —English gender gap F 5.3 F 5.7 F 8.0 F 6.5 F 14.0 —Math gender gap M 0.6 F 1.1 F 4.0 M 1.2 n/a n/aGraduation rate 99.2 98.5 100.0 99.1 95.9 —Delayed advancement rate 17.4 18.6 12.7 16.6 14.4 —Overall rating out of 10 6.6 6.3 7.2 7.1 5.9 —
Summerland [Public] Summerland Gr 12 Enrollment: 92ESL (%): 0.5 Special needs (%): 13.1 French Imm (%): 21.3Actual rating vs predicted based 2016-17 Last 5 Yearson parents’ avg. inc. of $ n/a: n/a Rank: 28/253 59/246Academic Performance 2013 2014 2015 2016 2017 TrendAverage exam mark 68.0 70.2 68.1 70.5 70.5 pPercentage of exams failed 8.7 6.8 8.1 7.3 4.3 pSchool vs exam mark difference 5.0 6.3 7.1 5.9 5.3 —English gender gap F 6.0 F 7.0 F 9.2 F 3.4 F 3.0 —Math gender gap F 3.2 M 0.2 F 2.5 E n/a n/aGraduation rate 100.0 99.2 100.0 100.0 100.0 —Delayed advancement rate 11.3 4.3 6.8 7.1 4.7 —Overall rating out of 10 6.3 6.9 6.4 7.4 7.9 p
SOuTHeaST kOOTenayFernie [Public] Fernie Gr 12 Enrollment: 66ESL (%): 2.9 Special needs (%): 12.4 French Imm (%): 24.2Actual rating vs predicted based 2016-17 Last 5 Yearson parents’ avg. inc. of $ n/a: n/a Rank: 71/253 127/246Academic Performance 2013 2014 2015 2016 2017 TrendAverage exam mark 68.3 66.4 66.5 67.6 67.3 —Percentage of exams failed 7.0 7.3 9.0 8.9 3.4 —School vs exam mark difference 3.0 4.6 2.9 7.1 7.7 —English gender gap F 13.4 F 0.7 F 4.7 F 7.3 F 1.9 —Math gender gap M 0.2 F 8.5 M 4.0 M 6.5 n/a n/aGraduation rate 92.7 94.8 98.1 100.0 96.5 —Delayed advancement rate 15.0 14.0 20.0 20.7 13.5 —Overall rating out of 10 5.4 5.8 6.2 5.8 6.9 p

Fraser Institute Studies in Education Policy 29
Mount Baker [Public] Cranbrook Gr 12 Enrollment: 292ESL (%): 0.2 Special needs (%): 16.4 French Imm (%): 4.9Actual rating vs predicted based 2016-17 Last 5 Yearson parents’ avg. inc. of $ n/a: n/a Rank: 93/253 112/246Academic Performance 2013 2014 2015 2016 2017 TrendAverage exam mark 66.7 66.1 66.9 66.4 66.2 pPercentage of exams failed 10.3 11.3 8.9 10.6 9.6 —School vs exam mark difference 4.2 4.5 4.4 5.1 8.0 —English gender gap F 5.5 F 3.8 F 4.2 F 7.0 F 3.8 —Math gender gap F 2.1 F 1.3 M 1.1 F 0.1 n/a n/aGraduation rate 98.4 95.3 99.2 96.8 99.2 —Delayed advancement rate 17.4 13.6 8.2 16.9 5.1 —Overall rating out of 10 5.8 5.8 6.8 6.1 6.6 —
Sparwood [Public] Sparwood Gr 12 Enrollment: 49ESL (%): 0.8 Special needs (%): 15.3 French Imm (%): 0.0Actual rating vs predicted based 2016-17 Last 5 Yearson parents’ avg. inc. of $ n/a: n/a Rank: 248/253 220/246Academic Performance 2013 2014 2015 2016 2017 TrendAverage exam mark 63.3 61.1 61.6 66.0 57.0 —Percentage of exams failed 13.9 16.8 16.8 9.1 29.7 —School vs exam mark difference 5.9 8.8 8.4 4.4 18.5 —English gender gap n/a F 1.1 F 0.4 F 2.8 F 6.4 n/aMath gender gap n/a M 7.6 F 2.5 M 2.4 n/a n/aGraduation rate 93.2 96.3 97.0 97.4 100.0 pDelayed advancement rate 35.8 16.1 10.3 0.7 4.7 pOverall rating out of 10 3.4 4.0 4.7 6.7 2.1 —
VeRnOnCharles Bloom [Public] Lumby Gr 12 Enrollment: 55ESL (%): 0.0 Special needs (%): 15.7 French Imm (%): 0.0Actual rating vs predicted based 2016-17 Last 5 Yearson parents’ avg. inc. of $ n/a: n/a Rank: 233/253 235/246Academic Performance 2013 2014 2015 2016 2017 TrendAverage exam mark 63.9 62.3 60.4 59.7 60.3 —Percentage of exams failed 12.5 18.8 22.4 24.5 18.4 —School vs exam mark difference 7.0 7.8 5.7 10.1 13.1 —English gender gap F 7.7 F 7.7 M 2.1 F 4.3 M 0.6 pMath gender gap F 1.1 F 1.8 M 2.8 M 3.4 n/a n/aGraduation rate 98.1 83.7 94.9 93.8 91.5 —Delayed advancement rate 8.6 23.2 26.9 21.4 34.5 qOverall rating out of 10 5.1 2.9 3.7 3.2 3.1 —
Clarence Fulton [Public] Vernon Gr 12 Enrollment: 153ESL (%): 0.0 Special needs (%): 10.5 French Imm (%): 0.0Actual rating vs predicted based 2016-17 Last 5 Yearson parents’ avg. inc. of $ n/a: n/a Rank: 164/253 144/246Academic Performance 2013 2014 2015 2016 2017 TrendAverage exam mark 67.0 65.4 65.3 65.0 64.2 —Percentage of exams failed 8.6 11.8 14.0 10.6 11.5 —School vs exam mark difference 6.0 7.3 5.8 6.7 7.6 pEnglish gender gap F 0.4 F 5.6 F 9.2 F 2.7 F 5.9 —Math gender gap M 4.7 M 3.2 F 3.5 F 3.3 n/a n/aGraduation rate 100.0 99.3 98.4 97.3 98.5 —Delayed advancement rate 2.2 2.9 6.4 10.0 14.6 qOverall rating out of 10 6.4 5.7 5.2 5.8 5.4 —
Kalamalka [Public] Vernon Gr 12 Enrollment: 122ESL (%): 0.0 Special needs (%): 11.2 French Imm (%): 0.0Actual rating vs predicted based 2016-17 Last 5 Yearson parents’ avg. inc. of $ n/a: n/a Rank: 65/253 65/246Academic Performance 2013 2014 2015 2016 2017 TrendAverage exam mark 74.1 70.8 71.2 71.2 69.4 —Percentage of exams failed 3.3 8.5 6.8 8.1 7.7 —School vs exam mark difference 2.2 5.8 5.7 5.2 8.9 —English gender gap F 8.5 F 8.3 F 2.9 F 3.1 M 1.2 pMath gender gap F 7.0 F 2.3 M 4.3 F 0.9 n/a n/aGraduation rate 100.0 98.0 96.5 95.1 98.2 —Delayed advancement rate 2.4 7.7 5.0 8.9 9.7 qOverall rating out of 10 7.5 6.4 6.8 6.7 7.0 —
Vernon [Public] Vernon Gr 12 Enrollment: 205ESL (%): 0.7 Special needs (%): 9.0 French Imm (%): 0.0Actual rating vs predicted based 2016-17 Last 5 Yearson parents’ avg. inc. of $ n/a: n/a Rank: 71/253 103/246Academic Performance 2013 2014 2015 2016 2017 TrendAverage exam mark 68.8 68.5 67.5 69.2 69.6 pPercentage of exams failed 9.9 9.8 10.8 8.7 5.3 pSchool vs exam mark difference 5.2 6.8 7.7 5.6 8.0 —English gender gap F 4.7 F 5.2 F 6.6 F 6.5 F 3.8 —Math gender gap M 2.9 M 2.7 F 3.8 F 1.1 n/a n/aGraduation rate 97.8 97.1 98.8 97.8 97.8 —Delayed advancement rate 3.2 5.7 4.3 10.1 15.0 qOverall rating out of 10 6.2 6.0 5.9 6.5 6.9 —
W L Seaton [Public] Vernon Gr 12 Enrollment: 145ESL (%): 1.2 Special needs (%): 8.6 French Imm (%): 45.7Actual rating vs predicted based 2016-17 Last 5 Yearson parents’ avg. inc. of $ n/a: n/a Rank: 177/253 167/246Academic Performance 2013 2014 2015 2016 2017 TrendAverage exam mark 67.1 67.3 66.6 67.1 67.9 —Percentage of exams failed 13.1 12.1 12.8 12.2 11.5 pSchool vs exam mark difference 4.7 6.5 6.9 6.7 6.6 —English gender gap F 5.8 F 5.2 F 7.2 F 5.1 F 7.2 —Math gender gap F 1.5 M 3.0 M 4.5 F 4.3 n/a n/aGraduation rate 98.6 99.2 98.4 96.6 94.8 qDelayed advancement rate 19.5 23.6 16.2 14.0 23.4 —Overall rating out of 10 5.4 5.5 5.2 5.6 5.2 —
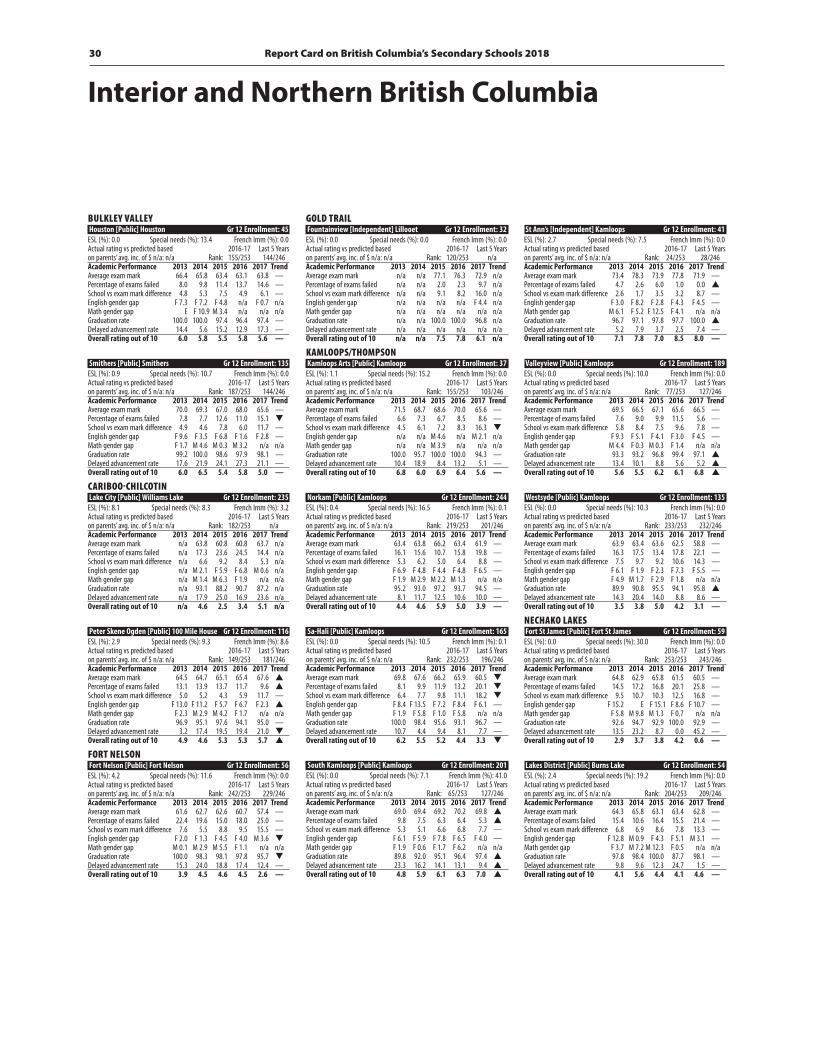
Report Card on British Columbia’s Secondary Schools 201830
BuLkLey VaLLeyHouston [Public] Houston Gr 12 Enrollment: 45ESL (%): 0.0 Special needs (%): 13.4 French Imm (%): 0.0Actual rating vs predicted based 2016-17 Last 5 Yearson parents’ avg. inc. of $ n/a: n/a Rank: 155/253 144/246Academic Performance 2013 2014 2015 2016 2017 TrendAverage exam mark 66.4 65.8 63.4 63.1 63.8 —Percentage of exams failed 8.0 9.8 11.4 13.7 14.6 —School vs exam mark difference 4.8 5.3 7.5 4.9 6.1 —English gender gap F 7.3 F 7.2 F 4.8 n/a F 0.7 n/aMath gender gap E F 10.9 M 3.4 n/a n/a n/aGraduation rate 100.0 100.0 97.4 96.4 97.4 —Delayed advancement rate 14.4 5.6 15.2 12.9 17.3 —Overall rating out of 10 6.0 5.8 5.5 5.8 5.6 —
Smithers [Public] Smithers Gr 12 Enrollment: 135ESL (%): 0.9 Special needs (%): 10.7 French Imm (%): 0.0Actual rating vs predicted based 2016-17 Last 5 Yearson parents’ avg. inc. of $ n/a: n/a Rank: 187/253 144/246Academic Performance 2013 2014 2015 2016 2017 TrendAverage exam mark 70.0 69.3 67.0 68.0 65.6 —Percentage of exams failed 7.8 7.7 12.6 11.0 15.1 qSchool vs exam mark difference 4.9 4.6 7.8 6.0 11.7 —English gender gap F 9.6 F 3.5 F 6.8 F 1.6 F 2.8 —Math gender gap F 1.7 M 4.6 M 0.3 M 3.2 n/a n/aGraduation rate 99.2 100.0 98.6 97.9 98.1 —Delayed advancement rate 17.6 21.9 24.1 27.3 21.1 —Overall rating out of 10 6.0 6.5 5.4 5.8 5.0 —
CaRIBOO-CHILCOTInLake City [Public] Williams Lake Gr 12 Enrollment: 235ESL (%): 8.1 Special needs (%): 8.3 French Imm (%): 3.2Actual rating vs predicted based 2016-17 Last 5 Yearson parents’ avg. inc. of $ n/a: n/a Rank: 182/253 n/aAcademic Performance 2013 2014 2015 2016 2017 TrendAverage exam mark n/a 63.8 60.8 60.8 63.7 n/aPercentage of exams failed n/a 17.3 23.6 24.5 14.4 n/aSchool vs exam mark difference n/a 6.6 9.2 8.4 5.3 n/aEnglish gender gap n/a M 2.1 F 5.9 F 6.8 M 0.6 n/aMath gender gap n/a M 1.4 M 6.3 F 1.9 n/a n/aGraduation rate n/a 93.1 88.2 90.7 87.2 n/aDelayed advancement rate n/a 17.9 25.0 16.9 23.6 n/aOverall rating out of 10 n/a 4.6 2.5 3.4 5.1 n/a
Peter Skene Ogden [Public] 100 Mile House Gr 12 Enrollment: 116ESL (%): 2.9 Special needs (%): 9.3 French Imm (%): 8.6Actual rating vs predicted based 2016-17 Last 5 Yearson parents’ avg. inc. of $ n/a: n/a Rank: 149/253 181/246Academic Performance 2013 2014 2015 2016 2017 TrendAverage exam mark 64.5 64.7 65.1 65.4 67.6 pPercentage of exams failed 13.1 13.9 13.7 11.7 9.6 pSchool vs exam mark difference 5.0 5.2 4.3 5.9 11.7 —English gender gap F 13.0 F 11.2 F 5.7 F 6.7 F 2.3 pMath gender gap F 2.3 M 2.9 M 4.2 F 1.7 n/a n/aGraduation rate 96.9 95.1 97.6 94.1 95.0 —Delayed advancement rate 3.2 17.4 19.5 19.4 21.0 qOverall rating out of 10 4.9 4.6 5.3 5.3 5.7 p
fORT neLSOnFort Nelson [Public] Fort Nelson Gr 12 Enrollment: 56ESL (%): 4.2 Special needs (%): 11.6 French Imm (%): 0.0Actual rating vs predicted based 2016-17 Last 5 Yearson parents’ avg. inc. of $ n/a: n/a Rank: 242/253 229/246Academic Performance 2013 2014 2015 2016 2017 TrendAverage exam mark 61.6 62.7 62.6 60.7 57.4 —Percentage of exams failed 22.4 19.6 15.0 18.0 25.0 —School vs exam mark difference 7.6 5.5 8.8 9.5 15.5 —English gender gap F 2.0 F 1.3 F 4.5 F 4.0 M 3.6 qMath gender gap M 0.1 M 2.9 M 5.5 F 1.1 n/a n/aGraduation rate 100.0 98.3 98.1 97.8 95.7 qDelayed advancement rate 15.3 24.0 18.8 17.4 12.4 —Overall rating out of 10 3.9 4.5 4.6 4.5 2.6 —
gOLD TRaILFountainview [Independent] Lillooet Gr 12 Enrollment: 32ESL (%): 0.0 Special needs (%): 0.0 French Imm (%): 0.0Actual rating vs predicted based 2016-17 Last 5 Yearson parents’ avg. inc. of $ n/a: n/a Rank: 120/253 n/aAcademic Performance 2013 2014 2015 2016 2017 TrendAverage exam mark n/a n/a 77.1 76.3 72.9 n/aPercentage of exams failed n/a n/a 2.0 2.3 9.7 n/aSchool vs exam mark difference n/a n/a 9.1 8.2 16.0 n/aEnglish gender gap n/a n/a n/a n/a F 4.4 n/aMath gender gap n/a n/a n/a n/a n/a n/aGraduation rate n/a n/a 100.0 100.0 96.8 n/aDelayed advancement rate n/a n/a n/a n/a n/a n/aOverall rating out of 10 n/a n/a 7.5 7.8 6.1 n/a
kamLOOpS/THOmpSOnKamloops Arts [Public] Kamloops Gr 12 Enrollment: 37ESL (%): 1.1 Special needs (%): 15.2 French Imm (%): 0.0Actual rating vs predicted based 2016-17 Last 5 Yearson parents’ avg. inc. of $ n/a: n/a Rank: 155/253 103/246Academic Performance 2013 2014 2015 2016 2017 TrendAverage exam mark 71.5 68.7 68.6 70.0 65.6 —Percentage of exams failed 6.6 7.3 6.7 8.5 8.6 —School vs exam mark difference 4.5 6.1 7.2 8.3 16.3 qEnglish gender gap n/a n/a M 4.6 n/a M 2.1 n/aMath gender gap n/a n/a M 3.9 n/a n/a n/aGraduation rate 100.0 95.7 100.0 100.0 94.3 —Delayed advancement rate 10.4 18.9 8.4 13.2 5.1 —Overall rating out of 10 6.8 6.0 6.9 6.4 5.6 —
Norkam [Public] Kamloops Gr 12 Enrollment: 244ESL (%): 0.4 Special needs (%): 16.5 French Imm (%): 0.1Actual rating vs predicted based 2016-17 Last 5 Yearson parents’ avg. inc. of $ n/a: n/a Rank: 219/253 201/246Academic Performance 2013 2014 2015 2016 2017 TrendAverage exam mark 63.4 63.8 66.2 63.4 61.9 —Percentage of exams failed 16.1 15.6 10.7 15.8 19.8 —School vs exam mark difference 5.3 6.2 5.0 6.4 8.8 —English gender gap F 6.9 F 4.8 F 4.4 F 4.8 F 6.5 —Math gender gap F 1.9 M 2.9 M 2.2 M 1.3 n/a n/aGraduation rate 95.2 93.0 97.2 93.7 94.5 —Delayed advancement rate 8.1 11.7 12.5 10.6 10.0 —Overall rating out of 10 4.4 4.6 5.9 5.0 3.9 —
Sa-Hali [Public] Kamloops Gr 12 Enrollment: 165ESL (%): 0.0 Special needs (%): 10.5 French Imm (%): 0.1Actual rating vs predicted based 2016-17 Last 5 Yearson parents’ avg. inc. of $ n/a: n/a Rank: 232/253 196/246Academic Performance 2013 2014 2015 2016 2017 TrendAverage exam mark 69.8 67.6 66.2 65.9 60.5 qPercentage of exams failed 8.1 9.9 11.9 13.2 20.1 qSchool vs exam mark difference 6.4 7.7 9.8 11.1 18.2 qEnglish gender gap F 8.4 F 13.5 F 7.2 F 8.4 F 6.1 —Math gender gap F 1.9 F 5.8 F 1.0 F 5.8 n/a n/aGraduation rate 100.0 98.4 95.6 93.1 96.7 —Delayed advancement rate 10.7 4.4 9.4 8.1 7.7 —Overall rating out of 10 6.2 5.5 5.2 4.4 3.3 q
South Kamloops [Public] Kamloops Gr 12 Enrollment: 201ESL (%): 0.0 Special needs (%): 7.1 French Imm (%): 41.0Actual rating vs predicted based 2016-17 Last 5 Yearson parents’ avg. inc. of $ n/a: n/a Rank: 65/253 127/246Academic Performance 2013 2014 2015 2016 2017 TrendAverage exam mark 69.0 69.4 69.2 70.2 69.8 pPercentage of exams failed 9.8 7.5 6.3 6.4 5.3 pSchool vs exam mark difference 5.3 5.1 6.6 6.8 7.7 —English gender gap F 6.1 F 5.9 F 7.8 F 6.5 F 4.0 —Math gender gap F 1.9 F 0.6 F 1.7 F 6.2 n/a n/aGraduation rate 89.8 92.0 95.1 96.4 97.4 pDelayed advancement rate 23.3 16.2 14.1 13.1 9.4 pOverall rating out of 10 4.8 5.9 6.1 6.3 7.0 p
St Ann’s [Independent] Kamloops Gr 12 Enrollment: 41ESL (%): 2.7 Special needs (%): 7.5 French Imm (%): 0.0Actual rating vs predicted based 2016-17 Last 5 Yearson parents’ avg. inc. of $ n/a: n/a Rank: 24/253 28/246Academic Performance 2013 2014 2015 2016 2017 TrendAverage exam mark 73.4 78.3 73.9 77.8 71.9 —Percentage of exams failed 4.7 2.6 6.0 1.0 0.0 pSchool vs exam mark difference 2.6 1.7 3.5 3.2 8.7 —English gender gap F 3.0 F 8.2 F 2.8 F 4.3 F 4.5 —Math gender gap M 6.1 F 5.2 F 12.5 F 4.1 n/a n/aGraduation rate 96.7 97.1 97.8 97.7 100.0 pDelayed advancement rate 5.2 7.9 3.7 2.5 7.4 —Overall rating out of 10 7.1 7.8 7.0 8.5 8.0 —
Valleyview [Public] Kamloops Gr 12 Enrollment: 189ESL (%): 0.0 Special needs (%): 10.0 French Imm (%): 0.0Actual rating vs predicted based 2016-17 Last 5 Yearson parents’ avg. inc. of $ n/a: n/a Rank: 77/253 127/246Academic Performance 2013 2014 2015 2016 2017 TrendAverage exam mark 69.5 66.5 67.1 65.6 66.5 —Percentage of exams failed 7.6 9.0 9.9 11.5 5.6 —School vs exam mark difference 5.8 8.4 7.5 9.6 7.8 —English gender gap F 9.3 F 5.1 F 4.1 F 3.0 F 4.5 —Math gender gap M 4.4 F 0.3 M 0.3 F 1.4 n/a n/aGraduation rate 93.3 93.2 96.8 99.4 97.1 pDelayed advancement rate 13.4 10.1 8.8 5.6 5.2 pOverall rating out of 10 5.6 5.5 6.2 6.1 6.8 p
Westsyde [Public] Kamloops Gr 12 Enrollment: 135ESL (%): 0.0 Special needs (%): 10.3 French Imm (%): 0.0Actual rating vs predicted based 2016-17 Last 5 Yearson parents’ avg. inc. of $ n/a: n/a Rank: 233/253 232/246Academic Performance 2013 2014 2015 2016 2017 TrendAverage exam mark 63.9 63.4 63.6 62.5 58.8 —Percentage of exams failed 16.3 17.5 13.4 17.8 22.1 —School vs exam mark difference 7.5 9.7 9.2 10.6 14.3 —English gender gap F 6.1 F 1.9 F 2.3 F 7.3 F 5.5 —Math gender gap F 4.9 M 1.7 F 2.9 F 1.8 n/a n/aGraduation rate 89.9 90.8 95.5 94.1 95.8 pDelayed advancement rate 14.3 20.4 14.0 8.8 8.6 —Overall rating out of 10 3.5 3.8 5.0 4.2 3.1 —
neCHakO LakeSFort St James [Public] Fort St James Gr 12 Enrollment: 59ESL (%): 0.0 Special needs (%): 30.0 French Imm (%): 0.0Actual rating vs predicted based 2016-17 Last 5 Yearson parents’ avg. inc. of $ n/a: n/a Rank: 253/253 243/246Academic Performance 2013 2014 2015 2016 2017 TrendAverage exam mark 64.8 62.9 65.8 61.5 60.5 —Percentage of exams failed 14.5 17.2 16.8 20.1 25.8 —School vs exam mark difference 9.5 10.7 10.3 12.5 16.8 —English gender gap F 15.2 E F 15.1 F 8.6 F 10.7 —Math gender gap F 5.8 M 9.8 M 1.3 F 0.7 n/a n/aGraduation rate 92.6 94.7 92.9 100.0 92.9 —Delayed advancement rate 13.5 23.2 8.7 0.0 45.2 —Overall rating out of 10 2.9 3.7 3.8 4.2 0.6 —
Lakes District [Public] Burns Lake Gr 12 Enrollment: 54ESL (%): 2.4 Special needs (%): 19.2 French Imm (%): 0.0Actual rating vs predicted based 2016-17 Last 5 Yearson parents’ avg. inc. of $ n/a: n/a Rank: 204/253 209/246Academic Performance 2013 2014 2015 2016 2017 TrendAverage exam mark 64.3 65.8 63.1 63.4 62.8 —Percentage of exams failed 15.4 10.6 16.4 15.5 21.4 —School vs exam mark difference 6.8 6.9 8.6 7.8 13.3 —English gender gap F 12.8 M 0.9 F 4.3 F 5.1 M 3.1 —Math gender gap F 3.7 M 7.2 M 12.3 F 0.5 n/a n/aGraduation rate 97.8 98.4 100.0 87.7 98.1 —Delayed advancement rate 9.8 9.6 12.3 24.7 1.5 —Overall rating out of 10 4.1 5.6 4.4 4.1 4.6 —
Interior and Northern British Columbia
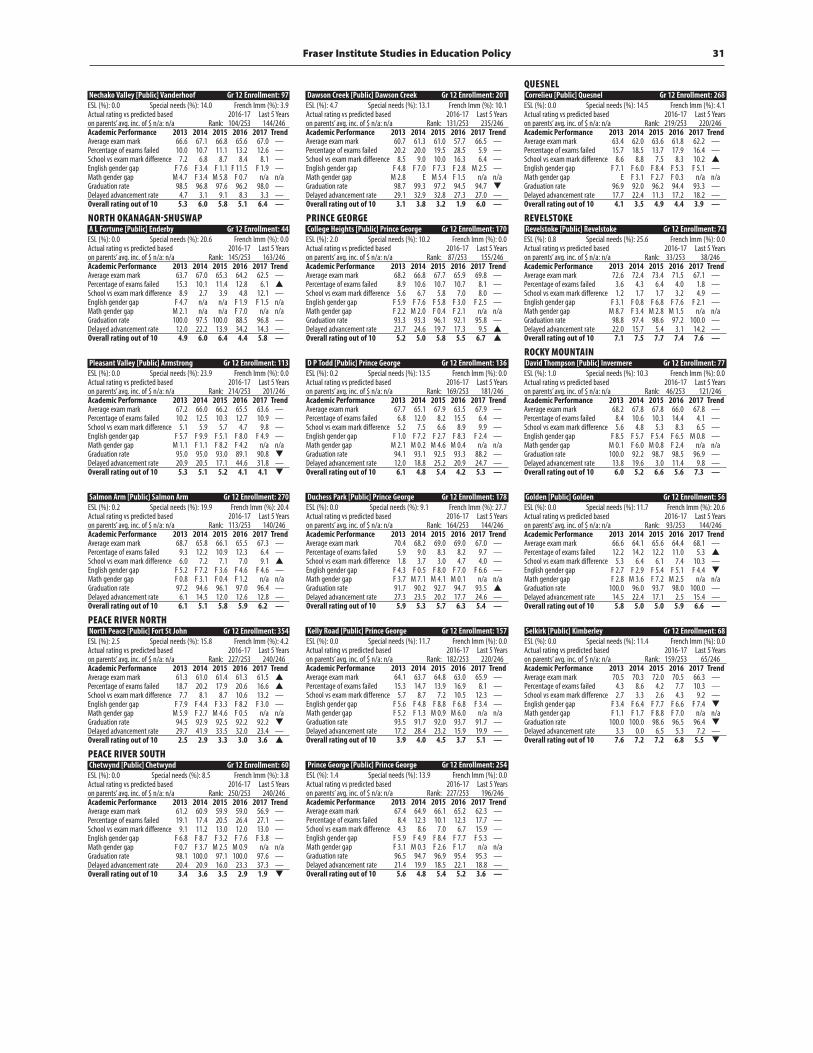
Fraser Institute Studies in Education Policy 31
Nechako Valley [Public] Vanderhoof Gr 12 Enrollment: 97ESL (%): 0.0 Special needs (%): 14.0 French Imm (%): 3.9Actual rating vs predicted based 2016-17 Last 5 Yearson parents’ avg. inc. of $ n/a: n/a Rank: 104/253 144/246Academic Performance 2013 2014 2015 2016 2017 TrendAverage exam mark 66.6 67.1 66.8 65.6 67.0 —Percentage of exams failed 10.0 10.7 11.1 13.2 12.6 —School vs exam mark difference 7.2 6.8 8.7 8.4 8.1 —English gender gap F 7.6 F 3.4 F 1.1 F 11.5 F 1.9 —Math gender gap M 4.7 F 3.4 M 5.8 F 0.7 n/a n/aGraduation rate 98.5 96.8 97.6 96.2 98.0 —Delayed advancement rate 4.7 3.1 9.1 8.3 3.3 —Overall rating out of 10 5.3 6.0 5.8 5.1 6.4 —
nORTH Okanagan-SHuSwapA L Fortune [Public] Enderby Gr 12 Enrollment: 44ESL (%): 0.0 Special needs (%): 20.6 French Imm (%): 0.0Actual rating vs predicted based 2016-17 Last 5 Yearson parents’ avg. inc. of $ n/a: n/a Rank: 145/253 163/246Academic Performance 2013 2014 2015 2016 2017 TrendAverage exam mark 63.7 67.0 65.3 64.2 62.5 —Percentage of exams failed 15.3 10.1 11.4 12.8 6.1 pSchool vs exam mark difference 8.9 2.7 3.9 4.8 12.1 —English gender gap F 4.7 n/a n/a F 1.9 F 1.5 n/aMath gender gap M 2.1 n/a n/a F 7.0 n/a n/aGraduation rate 100.0 97.5 100.0 88.5 96.8 —Delayed advancement rate 12.0 22.2 13.9 34.2 14.3 —Overall rating out of 10 4.9 6.0 6.4 4.4 5.8 —
Pleasant Valley [Public] Armstrong Gr 12 Enrollment: 113ESL (%): 0.0 Special needs (%): 23.9 French Imm (%): 0.0Actual rating vs predicted based 2016-17 Last 5 Yearson parents’ avg. inc. of $ n/a: n/a Rank: 214/253 201/246Academic Performance 2013 2014 2015 2016 2017 TrendAverage exam mark 67.2 66.0 66.2 65.5 63.6 —Percentage of exams failed 10.2 12.5 10.3 12.7 10.9 —School vs exam mark difference 5.1 5.9 5.7 4.7 9.8 —English gender gap F 5.7 F 9.9 F 5.1 F 8.0 F 4.9 —Math gender gap M 1.1 F 1.1 F 8.2 F 4.2 n/a n/aGraduation rate 95.0 95.0 93.0 89.1 90.8 qDelayed advancement rate 20.9 20.5 17.1 44.6 31.8 —Overall rating out of 10 5.3 5.1 5.2 4.1 4.1 q
Salmon Arm [Public] Salmon Arm Gr 12 Enrollment: 270ESL (%): 0.2 Special needs (%): 19.9 French Imm (%): 20.4Actual rating vs predicted based 2016-17 Last 5 Yearson parents’ avg. inc. of $ n/a: n/a Rank: 113/253 140/246Academic Performance 2013 2014 2015 2016 2017 TrendAverage exam mark 68.7 65.8 66.1 65.5 67.3 —Percentage of exams failed 9.3 12.2 10.9 12.3 6.4 —School vs exam mark difference 6.0 7.2 7.1 7.0 9.1 pEnglish gender gap F 5.2 F 7.2 F 3.6 F 4.6 F 4.6 —Math gender gap F 0.8 F 3.1 F 0.4 F 1.2 n/a n/aGraduation rate 97.2 94.6 96.1 97.0 96.4 —Delayed advancement rate 6.1 14.5 12.0 12.6 12.8 —Overall rating out of 10 6.1 5.1 5.8 5.9 6.2 —
peaCe RIVeR nORTHNorth Peace [Public] Fort St John Gr 12 Enrollment: 354ESL (%): 2.5 Special needs (%): 15.8 French Imm (%): 4.2Actual rating vs predicted based 2016-17 Last 5 Yearson parents’ avg. inc. of $ n/a: n/a Rank: 227/253 240/246Academic Performance 2013 2014 2015 2016 2017 TrendAverage exam mark 61.3 61.0 61.4 61.3 61.5 pPercentage of exams failed 18.7 20.2 17.9 20.6 16.6 pSchool vs exam mark difference 7.7 8.1 8.7 10.6 13.2 —English gender gap F 7.9 F 4.4 F 3.3 F 8.2 F 3.0 —Math gender gap M 5.9 F 2.7 M 4.6 F 0.5 n/a n/aGraduation rate 94.5 92.9 92.5 92.2 92.2 qDelayed advancement rate 29.7 41.9 33.5 32.0 23.4 —Overall rating out of 10 2.5 2.9 3.3 3.0 3.6 p
peaCe RIVeR SOuTHChetwynd [Public] Chetwynd Gr 12 Enrollment: 60ESL (%): 0.0 Special needs (%): 8.5 French Imm (%): 3.8Actual rating vs predicted based 2016-17 Last 5 Yearson parents’ avg. inc. of $ n/a: n/a Rank: 250/253 240/246Academic Performance 2013 2014 2015 2016 2017 TrendAverage exam mark 61.2 60.9 59.9 59.0 56.9 —Percentage of exams failed 19.1 17.4 20.5 26.4 27.1 —School vs exam mark difference 9.1 11.2 13.0 12.0 13.0 —English gender gap F 6.8 F 8.7 F 3.2 F 7.6 F 3.8 —Math gender gap F 0.7 F 3.7 M 2.5 M 0.9 n/a n/aGraduation rate 98.1 100.0 97.1 100.0 97.6 —Delayed advancement rate 20.4 20.9 16.0 23.3 37.3 —Overall rating out of 10 3.4 3.6 3.5 2.9 1.9 q
Dawson Creek [Public] Dawson Creek Gr 12 Enrollment: 201ESL (%): 4.7 Special needs (%): 13.1 French Imm (%): 10.1Actual rating vs predicted based 2016-17 Last 5 Yearson parents’ avg. inc. of $ n/a: n/a Rank: 131/253 235/246Academic Performance 2013 2014 2015 2016 2017 TrendAverage exam mark 60.7 61.3 61.0 57.7 66.5 —Percentage of exams failed 20.2 20.0 19.5 28.5 5.9 —School vs exam mark difference 8.5 9.0 10.0 16.3 6.4 —English gender gap F 4.8 F 7.0 F 7.3 F 2.8 M 2.5 —Math gender gap M 2.8 E M 5.4 F 1.5 n/a n/aGraduation rate 98.7 99.3 97.2 94.5 94.7 qDelayed advancement rate 29.1 32.9 32.8 27.3 27.0 —Overall rating out of 10 3.1 3.8 3.2 1.9 6.0 —
pRInCe geORgeCollege Heights [Public] Prince George Gr 12 Enrollment: 170ESL (%): 2.0 Special needs (%): 10.2 French Imm (%): 0.0Actual rating vs predicted based 2016-17 Last 5 Yearson parents’ avg. inc. of $ n/a: n/a Rank: 87/253 155/246Academic Performance 2013 2014 2015 2016 2017 TrendAverage exam mark 68.2 66.8 67.7 65.9 69.8 —Percentage of exams failed 8.9 10.6 10.7 10.7 8.1 —School vs exam mark difference 5.6 6.7 5.8 7.0 8.0 —English gender gap F 5.9 F 7.6 F 5.8 F 3.0 F 2.5 —Math gender gap F 2.2 M 2.0 F 0.4 F 2.1 n/a n/aGraduation rate 93.3 93.3 96.1 92.1 95.8 —Delayed advancement rate 23.7 24.6 19.7 17.3 9.5 pOverall rating out of 10 5.2 5.0 5.8 5.5 6.7 p
D P Todd [Public] Prince George Gr 12 Enrollment: 136ESL (%): 0.2 Special needs (%): 13.5 French Imm (%): 0.0Actual rating vs predicted based 2016-17 Last 5 Yearson parents’ avg. inc. of $ n/a: n/a Rank: 169/253 181/246Academic Performance 2013 2014 2015 2016 2017 TrendAverage exam mark 67.7 65.1 67.9 63.5 67.9 —Percentage of exams failed 6.8 12.0 8.2 15.5 6.4 —School vs exam mark difference 5.2 7.5 6.6 8.9 9.9 —English gender gap F 1.0 F 7.2 F 2.7 F 8.3 F 2.4 —Math gender gap M 2.1 M 0.2 M 4.6 M 0.4 n/a n/aGraduation rate 94.1 93.1 92.5 93.3 88.2 —Delayed advancement rate 12.0 18.8 25.2 20.9 24.7 —Overall rating out of 10 6.1 4.8 5.4 4.2 5.3 —
Duchess Park [Public] Prince George Gr 12 Enrollment: 178ESL (%): 0.0 Special needs (%): 9.1 French Imm (%): 27.7Actual rating vs predicted based 2016-17 Last 5 Yearson parents’ avg. inc. of $ n/a: n/a Rank: 164/253 144/246Academic Performance 2013 2014 2015 2016 2017 TrendAverage exam mark 70.4 68.2 69.0 69.0 67.0 —Percentage of exams failed 5.9 9.0 8.3 8.2 9.7 —School vs exam mark difference 1.8 3.7 3.0 4.7 4.0 —English gender gap F 4.3 F 0.5 F 8.0 F 7.0 F 6.6 —Math gender gap F 3.7 M 7.1 M 4.1 M 0.1 n/a n/aGraduation rate 91.7 90.2 92.7 94.7 93.5 pDelayed advancement rate 27.3 23.5 20.2 17.7 24.6 —Overall rating out of 10 5.9 5.3 5.7 6.3 5.4 —
Kelly Road [Public] Prince George Gr 12 Enrollment: 157ESL (%): 0.0 Special needs (%): 11.7 French Imm (%): 0.0Actual rating vs predicted based 2016-17 Last 5 Yearson parents’ avg. inc. of $ n/a: n/a Rank: 182/253 220/246Academic Performance 2013 2014 2015 2016 2017 TrendAverage exam mark 64.1 63.7 64.8 63.0 65.9 —Percentage of exams failed 15.3 14.7 13.9 16.9 8.1 —School vs exam mark difference 5.7 8.7 7.2 10.5 12.3 —English gender gap F 5.6 F 4.8 F 8.8 F 6.8 F 3.4 —Math gender gap F 5.2 F 1.3 M 0.9 M 6.0 n/a n/aGraduation rate 93.5 91.7 92.0 93.7 91.7 —Delayed advancement rate 17.2 28.4 23.2 15.9 19.9 —Overall rating out of 10 3.9 4.0 4.5 3.7 5.1 —
Prince George [Public] Prince George Gr 12 Enrollment: 254ESL (%): 1.4 Special needs (%): 13.9 French Imm (%): 0.0Actual rating vs predicted based 2016-17 Last 5 Yearson parents’ avg. inc. of $ n/a: n/a Rank: 227/253 196/246Academic Performance 2013 2014 2015 2016 2017 TrendAverage exam mark 67.4 64.9 66.1 65.2 62.3 —Percentage of exams failed 8.4 12.3 10.1 12.3 17.7 —School vs exam mark difference 4.3 8.6 7.0 6.7 15.9 —English gender gap F 5.9 F 4.9 F 8.4 F 7.7 F 5.3 —Math gender gap F 3.1 M 0.3 F 2.6 F 1.7 n/a n/aGraduation rate 96.5 94.7 96.9 95.4 95.3 —Delayed advancement rate 21.4 19.9 18.5 22.1 18.8 —Overall rating out of 10 5.6 4.8 5.4 5.2 3.6 —
queSneLCorrelieu [Public] Quesnel Gr 12 Enrollment: 268ESL (%): 0.0 Special needs (%): 14.5 French Imm (%): 4.1Actual rating vs predicted based 2016-17 Last 5 Yearson parents’ avg. inc. of $ n/a: n/a Rank: 219/253 220/246Academic Performance 2013 2014 2015 2016 2017 TrendAverage exam mark 63.4 62.0 63.6 61.8 62.2 —Percentage of exams failed 15.7 18.5 13.7 17.9 16.4 —School vs exam mark difference 8.6 8.8 7.5 8.3 10.2 pEnglish gender gap F 7.1 F 6.0 F 8.4 F 5.3 F 5.1 —Math gender gap E F 3.1 F 2.7 F 0.3 n/a n/aGraduation rate 96.9 92.0 96.2 94.4 93.3 —Delayed advancement rate 17.7 22.4 11.3 17.2 18.2 —Overall rating out of 10 4.1 3.5 4.9 4.4 3.9 —
ReVeLSTOkeRevelstoke [Public] Revelstoke Gr 12 Enrollment: 74ESL (%): 0.8 Special needs (%): 25.6 French Imm (%): 0.0Actual rating vs predicted based 2016-17 Last 5 Yearson parents’ avg. inc. of $ n/a: n/a Rank: 33/253 38/246Academic Performance 2013 2014 2015 2016 2017 TrendAverage exam mark 72.6 72.4 73.4 71.5 67.1 —Percentage of exams failed 3.6 4.3 6.4 4.0 1.8 —School vs exam mark difference 1.2 1.7 1.7 3.2 4.9 —English gender gap F 3.1 F 0.8 F 6.8 F 7.6 F 2.1 —Math gender gap M 8.7 F 3.4 M 2.8 M 1.5 n/a n/aGraduation rate 98.8 97.4 98.6 97.2 100.0 —Delayed advancement rate 22.0 15.7 5.4 3.1 14.2 —Overall rating out of 10 7.1 7.5 7.7 7.4 7.6 —
ROCky mOunTaInDavid Thompson [Public] Invermere Gr 12 Enrollment: 77ESL (%): 1.0 Special needs (%): 10.3 French Imm (%): 0.0Actual rating vs predicted based 2016-17 Last 5 Yearson parents’ avg. inc. of $ n/a: n/a Rank: 46/253 121/246Academic Performance 2013 2014 2015 2016 2017 TrendAverage exam mark 68.2 67.8 67.8 66.0 67.8 —Percentage of exams failed 8.4 10.6 10.3 14.4 4.1 —School vs exam mark difference 5.6 4.8 5.3 8.3 6.5 —English gender gap F 8.5 F 5.7 F 5.4 F 6.5 M 0.8 —Math gender gap M 0.1 F 6.0 M 0.8 F 2.4 n/a n/aGraduation rate 100.0 92.2 98.7 98.5 96.9 —Delayed advancement rate 13.8 19.6 3.0 11.4 9.8 —Overall rating out of 10 6.0 5.2 6.6 5.6 7.3 —
Golden [Public] Golden Gr 12 Enrollment: 56ESL (%): 0.0 Special needs (%): 11.7 French Imm (%): 20.6Actual rating vs predicted based 2016-17 Last 5 Yearson parents’ avg. inc. of $ n/a: n/a Rank: 93/253 144/246Academic Performance 2013 2014 2015 2016 2017 TrendAverage exam mark 66.6 64.1 65.6 64.4 68.1 —Percentage of exams failed 12.2 14.2 12.2 11.0 5.3 pSchool vs exam mark difference 5.3 6.4 6.1 7.4 10.3 —English gender gap F 2.7 F 2.9 F 5.4 F 5.1 F 4.4 qMath gender gap F 2.8 M 3.6 F 7.2 M 2.5 n/a n/aGraduation rate 100.0 96.0 93.7 98.0 100.0 —Delayed advancement rate 14.5 22.4 17.1 2.5 15.4 —Overall rating out of 10 5.8 5.0 5.0 5.9 6.6 —
Selkirk [Public] Kimberley Gr 12 Enrollment: 68ESL (%): 0.0 Special needs (%): 11.4 French Imm (%): 0.0Actual rating vs predicted based 2016-17 Last 5 Yearson parents’ avg. inc. of $ n/a: n/a Rank: 159/253 65/246Academic Performance 2013 2014 2015 2016 2017 TrendAverage exam mark 70.5 70.3 72.0 70.5 66.3 —Percentage of exams failed 4.3 8.6 4.2 7.7 10.3 —School vs exam mark difference 2.7 3.3 2.6 4.3 9.2 —English gender gap F 3.4 F 6.4 F 7.7 F 6.6 F 7.4 qMath gender gap F 1.1 F 1.7 F 8.8 F 7.0 n/a n/aGraduation rate 100.0 100.0 98.6 96.5 96.4 qDelayed advancement rate 3.3 0.0 6.5 5.3 7.2 —Overall rating out of 10 7.6 7.2 7.2 6.8 5.5 q

32
How does your school stack up?
Important notes to the rankings
In this table, schools are ranked (on the left hand side of the page) in descending order (from 1 to 253) according to their academic performance as measured by the Overall rating out of ten (shown on the right hand side of the table) for the school year 2016/2017. Each school’s five-year average ranking and Overall rating out of ten are also listed. The higher the overall rating (out of 10), the higher the rank awarded to the school. Where schools tied in the overall rating, they were awarded the same rank. Where less than five years of data was available “n/a” appears in the table.
Not all the province’s secondary schools are included in the tables or the ranking. Excluded are schools at which fewer than 10 regular day students were enrolled in grade 12 and schools that did not
generate a sufficiently large set of student data to enable the calculation of an Overall rating out of ten. Also excluded from the ratings and rankings are: centres for adult education and continuing education; schools that cater largely to non-resident foreign stu-dents; and certain alternative schools that do not offer a full program of courses.
The exclusion of a school from the Report Card should in no way be construed as a judgement of the school’s effectiveness..
In order to get the most from the Report Card, readers should consult the complete table of results for each school of interest. By considering several years of results rather than just a school’s rank in the most recent year readers can get a better idea of how the school is likely to perform in the future.
–––Rank––– –Overall rating– Last Last 2016/ 5 2016/ 5 2017 yrs Trend School name City 2017 yrs
–––Rank––– –Overall rating– Last Last 2016/ 5 2016/ 5 2017 yrs Trend School name City 2017 yrs
1 1 — York House Vancouver 10 10 1 2 p Crofton House Vancouver 10 9.9 1 2 p Little Flower Vancouver 10 9.9 1 4 — Southridge Surrey 10 9.8 1 4 p St George’s Vancouver 10 9.8 1 6 p Collingwood West Vancouver 10 9.7 7 6 — West Point Grey Vancouver 9.9 9.7 7 8 — Richmond Christian Richmond 9.9 9.1 9 8 — Brentwood College Mill Bay 9.8 9.1 10 12 — Mulgrave West Vancouver 9.7 9 11 8 — Shawnigan Lake Shawnigan Lake 9.3 9.1 11 12 — St John’s Vancouver 9.3 9 11 21 p Stratford Hall Vancouver 9.3 8.3 14 8 — Glenlyon Norfolk Victoria 9.2 9.1 15 17 p King David Vancouver 9.1 8.5 16 15 — Meadowridge Maple Ridge 8.8 8.7 17 22 — Pacific Academy Surrey 8.7 8.2
18 17 — St Thomas More Burnaby 8.6 8.5 19 14 — St Michaels Victoria 8.4 8.9 19 65 p Seaquam Delta 8.4 6.9 21 16 q Vancouver College Vancouver 8.2 8.6 21 163 — Pitt Meadows Pitt Meadows 8.2 5.5 23 17 — Lord Byng Vancouver 8.1 8.5 24 23 — Okanagan Mission Kelowna 8 8.1 24 27 — Handsworth North Vancouver 8 7.8 24 28 — St Ann’s Kamloops 8 7.7 24 133 p GW Graham Chilliwack 8 5.9 28 59 p Summerland Summerland 7.9 7 28 103 — Chemainus Chemainus 7.9 6.3 30 28 — MEI Abbotsford 7.7 7.7 30 34 — Holy Cross Surrey 7.7 7.6 30 38 — Carver Christian Burnaby 7.7 7.5 33 28 — Mark R. Isfeld Courtenay 7.6 7.7 33 38 — Revelstoke Revelstoke 7.6 7.5

Fraser Institute Studies in Education Policy 33
–––Rank––– –Overall rating– Last Last 2016/ 5 2016/ 5 2017 yrs Trend School name City 2017 yrs
–––Rank––– –Overall rating– Last Last 2016/ 5 2016/ 5 2017 yrs Trend School name City 2017 yrs
33 42 p Sir Winston Churchill Vancouver 7.6 7.4 33 87 — Lord Tweedsmuir Surrey 7.6 6.6 37 24 — St Thomas Aquinas North Vancouver 7.5 8 37 34 — Dr. Charles Best Coquitlam 7.5 7.6 37 34 — Rockridge West Vancouver 7.5 7.6 37 34 — Semiahmoo Surrey 7.5 7.6 37 59 p Elphinstone Gibsons 7.5 7 37 92 p J Lloyd Crowe Trail 7.5 6.5 43 50 — Immaculata Kelowna 7.4 7.2 43 76 — George Elliot Winfield 7.4 6.7 43 121 p Johnston Heights Surrey 7.4 6.1 46 26 — Sentinel West Vancouver 7.3 7.9 46 28 — Credo Christian Langley 7.3 7.7 46 70 — Burnsview Delta 7.3 6.8 46 92 — Delta Delta 7.3 6.5 46 112 p Carihi Campbell River 7.3 6.2 46 121 — David Thompson Invermere 7.3 6.1 52 50 — Langley Fundamental Langley 7.2 7.2 52 50 — New Westminster New Westminster 7.2 7.2 52 56 — Kelowna Kelowna 7.2 7.1 52 76 p R C Palmer Richmond 7.2 6.7 52 87 p Earl Marriott Surrey 7.2 6.6 57 17 — Southpointe Delta 7.1 8.5 57 24 q Kelowna Christian Kelowna 7.1 8 57 42 — Elgin Park Surrey 7.1 7.4 57 46 — Abbotsford Christian Abbotsford 7.1 7.3 57 50 — Langley Christian Langley 7.1 7.2 57 76 p Grand Forks Grand Forks 7.1 6.7 57 112 — Maple Ridge Maple Ridge 7.1 6.2 57 133 p Stanley Humphries Castlegar 7.1 5.9 65 38 q Heritage Woods Port Moody 7 7.5 65 65 — Kalamalka Vernon 7 6.9 65 103 — Sardis Chilliwack 7 6.3 65 127 p South Kamloops Kamloops 7 6 65 144 — Delview Delta 7 5.7 65 n/a n/a Aberdeen Hall Kelowna 7 n/a 71 42 q Richmond Richmond 6.9 7.4 71 50 — Windsor North Vancouver 6.9 7.2 71 103 — Vernon Vernon 6.9 6.3 71 112 — Highland Comox 6.9 6.2 71 127 p Fernie Fernie 6.9 6 71 140 p North Delta Delta 6.9 5.8 77 28 — Archbishop Carney Port Coquitlam 6.8 7.7 77 59 q Fleetwood Park Surrey 6.8 7 77 59 — Kitsilano Vancouver 6.8 7 77 65 — Seycove North Vancouver 6.8 6.9 77 76 — Moscrop Burnaby 6.8 6.7 77 76 — St Patrick’s Vancouver 6.8 6.7 77 92 — W J Mouat Abbotsford 6.8 6.5 77 98 — Penticton Penticton 6.8 6.4 77 112 — Burnaby Mountain Burnaby 6.8 6.2
77 127 p Valleyview Kamloops 6.8 6 87 42 — Robert Alexander McMath Richmond 6.7 7.4 87 92 — Fraser Heights Surrey 6.7 6.5 87 127 p Chatelech Sechelt 6.7 6 87 155 p College Heights Prince George 6.7 5.6 87 167 — Alberni District Port Alberni 6.7 5.4 87 n/a n/a St Margaret’s Victoria 6.7 n/a 93 46 — Point Grey Vancouver 6.6 7.3 93 50 — Hugh McRoberts Richmond 6.6 7.2 93 59 — Notre Dame Vancouver 6.6 7 93 92 — L V Rogers Nelson 6.6 6.5 93 112 — Abbotsford Traditional Abbotsford 6.6 6.2 93 112 — Mount Baker Cranbrook 6.6 6.2 93 121 — Panorama Ridge Surrey 6.6 6.1 93 133 — Robert Bateman Abbotsford 6.6 5.9 93 144 — Golden Golden 6.6 5.7 102 112 — Brookswood Langley 6.5 6.2 102 155 p Mount Boucherie West Kelowna 6.5 5.6 104 70 q Mount Douglas Victoria 6.4 6.8 104 70 — Walnut Grove Langley 6.4 6.8 104 76 — Yale Abbotsford 6.4 6.7 104 87 — North Surrey Surrey 6.4 6.6 104 144 — Nechako Valley Vanderhoof 6.4 5.7 109 59 — J N Burnett Richmond 6.3 7 109 70 q Dover Bay Nanaimo 6.3 6.8 109 103 — Princess Margaret Surrey 6.3 6.3 109 127 p Tamanawis Surrey 6.3 6 113 46 q Steveston-London Richmond 6.2 7.3 113 65 — Eric Hamber Vancouver 6.2 6.9 113 76 — West Vancouver West Vancouver 6.2 6.7 113 140 — Salmon Arm Salmon Arm 6.2 5.8 113 155 — Agassiz Agassiz 6.2 5.6 113 155 — Clayton Heights Surrey 6.2 5.6 113 188 p Frank Hurt Surrey 6.2 5.1 120 28 — University Hill Vancouver 6.1 7.7 120 46 — Prince Of Wales Vancouver 6.1 7.3 120 56 — Langley Fine Arts Fort Langley 6.1 7.1 120 98 — South Delta Delta 6.1 6.4 120 98 — Southern Okanagan Oliver 6.1 6.4 120 103 — Vancouver Technical Vancouver 6.1 6.3 120 133 — Thomas Haney Maple Ridge 6.1 5.9 120 167 — Ladysmith Ladysmith 6.1 5.4 120 188 — Cambie Richmond 6.1 5.1 120 194 — King George Vancouver 6.1 5 120 n/a n/a Fountainview Lillooet 6.1 n/a 131 56 — Magee Vancouver 6 7.1 131 70 q Gleneagle Coquitlam 6 6.8 131 92 — Claremont Victoria 6 6.5 131 144 — Reynolds Victoria 6 5.7 131 155 — Rutland Kelowna 6 5.6 131 217 p Charles Hays Prince Rupert 6 4.3
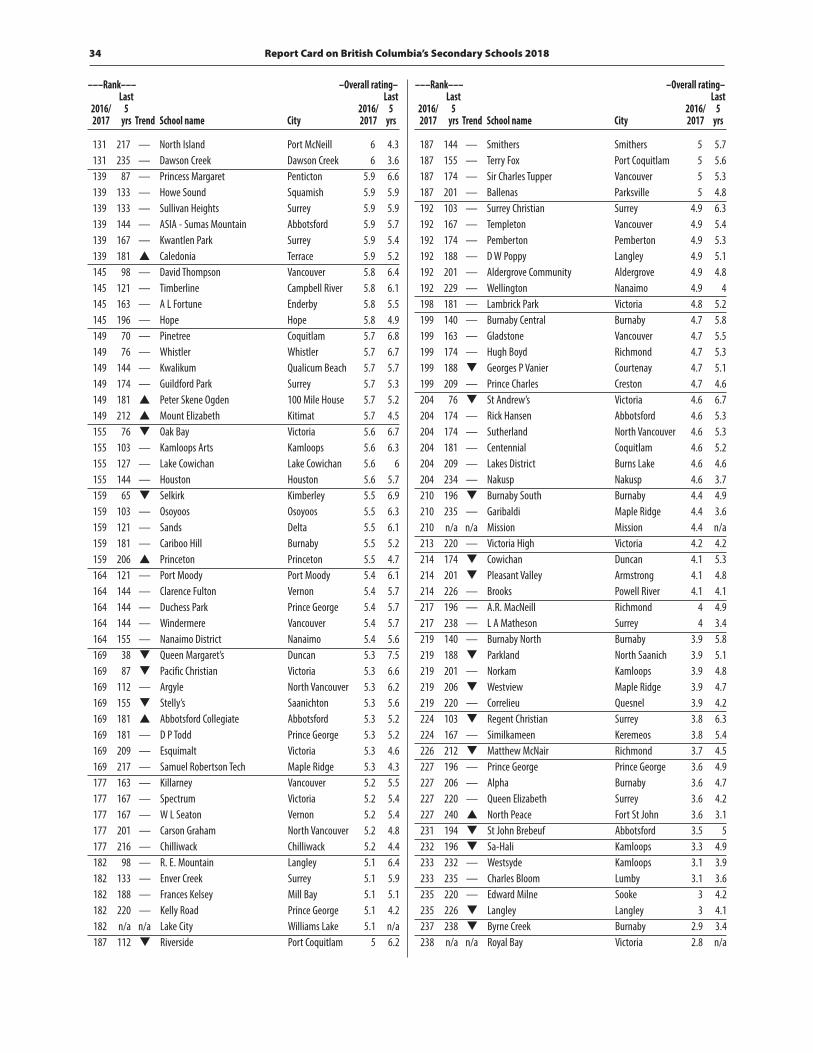
Report Card on British Columbia’s Secondary Schools 201834
–––Rank––– –Overall rating– Last Last 2016/ 5 2016/ 5 2017 yrs Trend School name City 2017 yrs
–––Rank––– –Overall rating– Last Last 2016/ 5 2016/ 5 2017 yrs Trend School name City 2017 yrs
131 217 — North Island Port McNeill 6 4.3 131 235 — Dawson Creek Dawson Creek 6 3.6 139 87 — Princess Margaret Penticton 5.9 6.6 139 133 — Howe Sound Squamish 5.9 5.9 139 133 — Sullivan Heights Surrey 5.9 5.9 139 144 — ASIA - Sumas Mountain Abbotsford 5.9 5.7 139 167 — Kwantlen Park Surrey 5.9 5.4 139 181 p Caledonia Terrace 5.9 5.2 145 98 — David Thompson Vancouver 5.8 6.4 145 121 — Timberline Campbell River 5.8 6.1 145 163 — A L Fortune Enderby 5.8 5.5 145 196 — Hope Hope 5.8 4.9 149 70 — Pinetree Coquitlam 5.7 6.8 149 76 — Whistler Whistler 5.7 6.7 149 144 — Kwalikum Qualicum Beach 5.7 5.7 149 174 — Guildford Park Surrey 5.7 5.3 149 181 p Peter Skene Ogden 100 Mile House 5.7 5.2 149 212 p Mount Elizabeth Kitimat 5.7 4.5 155 76 q Oak Bay Victoria 5.6 6.7 155 103 — Kamloops Arts Kamloops 5.6 6.3 155 127 — Lake Cowichan Lake Cowichan 5.6 6 155 144 — Houston Houston 5.6 5.7 159 65 q Selkirk Kimberley 5.5 6.9 159 103 — Osoyoos Osoyoos 5.5 6.3 159 121 — Sands Delta 5.5 6.1 159 181 — Cariboo Hill Burnaby 5.5 5.2 159 206 p Princeton Princeton 5.5 4.7 164 121 — Port Moody Port Moody 5.4 6.1 164 144 — Clarence Fulton Vernon 5.4 5.7 164 144 — Duchess Park Prince George 5.4 5.7 164 144 — Windermere Vancouver 5.4 5.7 164 155 — Nanaimo District Nanaimo 5.4 5.6 169 38 q Queen Margaret’s Duncan 5.3 7.5 169 87 q Pacific Christian Victoria 5.3 6.6 169 112 — Argyle North Vancouver 5.3 6.2 169 155 q Stelly’s Saanichton 5.3 5.6 169 181 p Abbotsford Collegiate Abbotsford 5.3 5.2 169 181 — D P Todd Prince George 5.3 5.2 169 209 — Esquimalt Victoria 5.3 4.6 169 217 — Samuel Robertson Tech Maple Ridge 5.3 4.3 177 163 — Killarney Vancouver 5.2 5.5 177 167 — Spectrum Victoria 5.2 5.4 177 167 — W L Seaton Vernon 5.2 5.4 177 201 — Carson Graham North Vancouver 5.2 4.8 177 216 — Chilliwack Chilliwack 5.2 4.4 182 98 — R. E. Mountain Langley 5.1 6.4 182 133 — Enver Creek Surrey 5.1 5.9 182 188 — Frances Kelsey Mill Bay 5.1 5.1 182 220 — Kelly Road Prince George 5.1 4.2 182 n/a n/a Lake City Williams Lake 5.1 n/a 187 112 q Riverside Port Coquitlam 5 6.2
187 144 — Smithers Smithers 5 5.7 187 155 — Terry Fox Port Coquitlam 5 5.6 187 174 — Sir Charles Tupper Vancouver 5 5.3 187 201 — Ballenas Parksville 5 4.8 192 103 — Surrey Christian Surrey 4.9 6.3 192 167 — Templeton Vancouver 4.9 5.4 192 174 — Pemberton Pemberton 4.9 5.3 192 188 — D W Poppy Langley 4.9 5.1 192 201 — Aldergrove Community Aldergrove 4.9 4.8 192 229 — Wellington Nanaimo 4.9 4 198 181 — Lambrick Park Victoria 4.8 5.2 199 140 — Burnaby Central Burnaby 4.7 5.8 199 163 — Gladstone Vancouver 4.7 5.5 199 174 — Hugh Boyd Richmond 4.7 5.3 199 188 q Georges P Vanier Courtenay 4.7 5.1 199 209 — Prince Charles Creston 4.7 4.6 204 76 q St Andrew’s Victoria 4.6 6.7 204 174 — Rick Hansen Abbotsford 4.6 5.3 204 174 — Sutherland North Vancouver 4.6 5.3 204 181 — Centennial Coquitlam 4.6 5.2 204 209 — Lakes District Burns Lake 4.6 4.6 204 234 — Nakusp Nakusp 4.6 3.7 210 196 q Burnaby South Burnaby 4.4 4.9 210 235 — Garibaldi Maple Ridge 4.4 3.6 210 n/a n/a Mission Mission 4.4 n/a 213 220 — Victoria High Victoria 4.2 4.2 214 174 q Cowichan Duncan 4.1 5.3 214 201 q Pleasant Valley Armstrong 4.1 4.8 214 226 — Brooks Powell River 4.1 4.1 217 196 — A.R. MacNeill Richmond 4 4.9 217 238 — L A Matheson Surrey 4 3.4 219 140 — Burnaby North Burnaby 3.9 5.8 219 188 q Parkland North Saanich 3.9 5.1 219 201 — Norkam Kamloops 3.9 4.8 219 206 q Westview Maple Ridge 3.9 4.7 219 220 — Correlieu Quesnel 3.9 4.2 224 103 q Regent Christian Surrey 3.8 6.3 224 167 — Similkameen Keremeos 3.8 5.4 226 212 q Matthew McNair Richmond 3.7 4.5 227 196 — Prince George Prince George 3.6 4.9 227 206 — Alpha Burnaby 3.6 4.7 227 220 — Queen Elizabeth Surrey 3.6 4.2 227 240 p North Peace Fort St John 3.6 3.1 231 194 q St John Brebeuf Abbotsford 3.5 5 232 196 q Sa-Hali Kamloops 3.3 4.9 233 232 — Westsyde Kamloops 3.1 3.9 233 235 — Charles Bloom Lumby 3.1 3.6 235 220 — Edward Milne Sooke 3 4.2 235 226 q Langley Langley 3 4.1 237 238 q Byrne Creek Burnaby 2.9 3.4 238 n/a n/a Royal Bay Victoria 2.8 n/a

Fraser Institute Studies in Education Policy 35
–––Rank––– –Overall rating– Last Last 2016/ 5 2016/ 5 2017 yrs Trend School name City 2017 yrs
–––Rank––– –Overall rating– Last Last 2016/ 5 2016/ 5 2017 yrs Trend School name City 2017 yrs
239 76 q Highroad Chilliwack 2.7 6.7 239 212 — John Oliver Vancouver 2.7 4.5 239 n/a n/a Cedar Nanaimo 2.7 n/a 242 212 q Mount Sentinel South Slocan 2.6 4.5 242 229 — Fort Nelson Fort Nelson 2.6 4 244 240 — Port Hardy Port Hardy 2.5 3.1 244 244 — Merritt Merritt 2.5 2.8 246 233 q Britannia Vancouver 2.4 3.8
247 226 q Belmont Victoria 2.3 4.1 248 220 — Sparwood Sparwood 2.1 4.2 249 246 — Hazelton Hazelton 2 1.2 250 229 q Gulf Islands Salt Spring Island 1.9 4 250 240 q Chetwynd Chetwynd 1.9 3.1 252 245 — John Barsby Nanaimo 1.3 1.9 253 243 — Fort St James Fort St James 0.6 3
36
Appendix: Calculating the Overall rating out of 10
The Overall rating out of 10 is intended to answer the question, “In general, how is the school doing, academically compared to other schools in the Report Card?” The following is a simplified description of the procedure used to convert the raw indicator data into the Overall rating out of 10.
1 The School vs exam mark difference for each course and the language arts Gender gap indicators were calculated using the raw data.
2 Course by course, all the results were then converted into standardized or “Z” scores by solving the equation
Z = (X – µ) / σ
where X is the individual school’s result, µ is the mean of the all-schools distribution of results, and σ is the standard deviation of the same all-schools distribution.
3 With the exception of the Gender gap indicator (which uses the results from a single course), the course-by-course standardized data were then aggregated to produce weighted average indicator values. The weighting used was the number of examinations written in each course at the school relative to the total number of examinations written at the school.
4 These weighted average results were then re-standardized.
5 The seven standardized indicator results were then combined to produce a weighted average summary standardized score for the school. The weightings used in this calculation were Average exam mark—25%, Percentage of exams failed—25%, School vs exam mark difference—13%, Language arts gender gap—12%, Graduation rate—12.5%, and Delayed advancement rate—12.5%. For schools for which there were no gender-gap results because only boys or girls were enrolled, the School vs exam mark difference was weighted at 25%. Where no Delayed advancement rate could be calculated, the Graduation rate was weighted at 25%.
6 This summary standardized score was then standardized.
This standardized score was converted into an overall rating between 0 and 10 as follows:
7 The maximum and minimum standardized scores were set at 2.2 and –3.29 respectively. Scores equal to, or greater than 2.2 receive the highest overall rating of 10. This cut-off was chosen because it allows more than one school in a given year to be awarded 10 out of 10. Scores of equal to, or less than, −3.29 receive the lowest overall rating of 0. Schools with scores below −3.29 are likely to be outliers—a statistical term used to denote members of a population that appear to have characteristics substantially different from the rest of the

Fraser Institute Studies in Education Policy 37
population. We chose, therefore, to set the minimum score so as to disregard such extreme differences.
8 The resulting standardized scores were converted into Overall ratings according to the formula:
OR = µ +(σ * StanScore),
where OR is the resulting Overall rating, µ is the average calculated according to the formula:
µ = (ORmin – 10 (Zmin / Zmax)) / (1 – (Zmin / Zmax))
where σ is the standard deviation calculated according to the formula:
σ = (10 – µ) / Zmax,
and StanScore is the standardized score calculated in (6) above and adjusted as required for minimum and maximum values as noted in (7) above. As noted in (7) above, ORmin equals zero, Zmin equals −3.29; and Zmax equals 2.2.
9 Finally, the derived Overall rating is rounded to one decimal place to reflect the significant number of places of the decimal in the original raw data.
Note that the Overall rating out of 10, based as it is on standardized scores, is a relative rating. That is, in order for a school to show improvement in its overall rating, it must improve more than the average. If it improves, but at a rate less than the average, it will show a decline in its rating.

Report Card on British Columbia’s Secondary Schools 201838
Peter CowleyPeter Cowley is the Director of School Performance Studies at the Fraser Institute. He graduated from the University of British Columbia with a B.Comm. in 1974. Shortly thereafter, he began a long career in marketing and general management in several sectors. During his assignments in general management, process improvement was a special focus and interest. In 1994, Mr Cowley independently wrote and published The Parent’s Guide, a popular handbook for parents of British Columbia’s secondary-school students. The Parent’s Guide web site replaced the handbook in 1995. In 1998, Mr Cowley was co-author of the Fraser Institute’s A Secondary Schools Report Card for British Columbia, the first of the Institute’s continuing series of annual reports on school per-formance. This was followed by The 1999 Report Card on British Columbia’s Secondary Schools, Boys, Girls, and Grades: Academic Gender Balance in British Columbia’s Secondary Schools, and The 1999 Report Card on Alberta’s High Schools. Since then, Mr Cowley has co-authored all of the Institute’s annual Report Cards. Annual editions now include Report Cards on elementary and secondary schools in British Columbia, Alberta, and Ontario and on secondary schools in Quebec.
Stephen T. EastonStephen T. Easton is a professor of Economics at Simon Fraser University and a Senior Scholar at the Fraser Institute. He received his A.B. from Oberlin College and his Ph.D. from the University of Chicago. Recent works published by the Fraser Institute include Privatizing Prisons (editor, 1998), The Costs of Crime: Who Pays and How Much? 1998 Update (with Paul Brantingham, 1998), and Rating Global Economic Freedom (editor, 1992). A co-author of A Secondary Schools Report Card for British Columbia (1998), Boys, Girls, and Grades: Academic Gender Balance in British Columbia’s Secondary Schools (1999) and the Report Card on Aboriginal Education in British Columbia (2004), he has continued to co-author the Report Cards of British Columbia, Alberta, New Brunswick and, most recently, Ontario. Other publications about education include “Do We Have a Problem Yet? Women and Men in Higher Education,” in David Laidler (ed.), Renovating the Ivory Tower: Canadian Universities and the Knowledge Economy (Toronto: C.D. Howe Institute, 2002), pp. 60–79; “Plus ça change, plus c’est la même chose” in Stephen B. Lawton, Rodney Reed, and Fons van Wieringen, Restructuring Public Schooling (Berlin: Springer-Verlag, 1997) and Education in Canada: An Analysis of Elementary, Secondary and Vocational Schooling (Vancouver: the Fraser Institute, 1988). His editorials have been carried by the Vancouver Sun, the Globe and Mail, the National Post, the Ottawa Citizen, the Stirling chain and many other newspapers around the country.
About the Authors

Fraser Institute Studies in Education Policy 39
DistributionThese publications are available from <http://www.fraserinstitute.org> in Portable Document Format (PDF) and can be read with Adobe Acrobat® 7 or Adobe Reader®, versions 7 or later. Adobe Reader® X, the most recent version, is available free of charge from Adobe Systems Inc. at <http://get.adobe.com/reader/>. Readers who have trouble viewing or print-ing our PDF files using applications from other man-ufacturers (e.g., Apple’s Preview) should use Reader® or Acrobat®.
Ordering publicationsFor information about ordering the printed publications of the Fraser Institute, please contact the publications coordinator:
Λ via e-mail: [email protected] Λ via telephone: 604.688.0221 ext. 580 or, toll free, 1.800.665.3558 ext. 580
Λ via fax: 604.688.8539.
MediaFor media enquiries, please contact our Communications Department:
Λ via e-mail: [email protected] Λ via telephone: 604.714.4582
In Toronto, contact our media specialist: Λ via telephone at 416.363.6575, ext. 238.
CopyrightCopyright © 2018 by the Fraser Institute. All rights reserved. No part of this publication may be repro-duced in any manner whatsoever without written permission except in the case of brief passages quoted in critical articles and reviews.
ISSN / ISBN Λ 1707–2395 Studies in Education Policy
(English online edition) Λ 1492–1863 Studies in Education Policy
(English print edition)
Date of issue2018
TypsettingNick Murphy
Cover designBill Ray
Images for cover Λ Boys in school ©Steve Stone; iStock Λ Girl solving a math problem on blackboard
©Bart Coenders; iStock Λ Attentive reading ©Grigory Bibikov; iStock Λ Library series ©Willie B. Thomas; iStock Λ 8-year old schoolgirl doing homework
©mamahoohooba; iStock Λ Student working in class ©Bonnie Jacobs; iStock
Publishing information

Report Card on British Columbia’s Secondary Schools 201840
To learn how to support the Fraser Institute, please contact us Λ via post: Development Department, Fraser Institute
Fourth Floor, 1770 Burrard Street Vancouver, British Columbia, V6J 3G7 Canada
Λ via telephone from Canada, toll-free: 1.800.665.3558 ext. 548 Λ via e-mail: [email protected] Λ or visit our webpage: <http://www.fraserinstitute.org/support-us/overview.aspx>.
Supporting the Fraser Institute
Purpose, funding, & independence
The Fraser Institute provides a useful public service. We report objective information about the economic and social effects of current public policies, and we offer evidence-based research and education about policy options that can improve the quality of life.
The Institute is a non-profit organization. Our activities are funded by charitable donations, unrestricted grants, ticket sales, and sponsorships from events, the licensing of products for public distribution, and the sale of publications.
All research is subject to rigorous review by external experts, and is conducted and published separately from the Institute’s Board of Directors and its donors.
The opinions expressed by the authors are those of the individuals themselves, and do not necessarily reflect those of the Institute, its Board of Directors, its donors and supporters, or its staff. This publication in no way implies that the Fraser Institute, its directors, or staff are in favour of, or oppose the passage of, any bill; or that they support or oppose any particular political party or candidate.
As a healthy part of public discussion among fellow citizens who desire to improve the lives of people through better public policy, the Institute welcomes evidence-focused scrutiny of the research we publish, including veri-fication of data sources, replication of analytical methods, and intelligent debate about the practical effects of policy recommendations.
Fraser Institute Studies in Education Policy 41
About the Fraser Institute
Our mission is to improve the quality of life for Canadians, their families and future generations by studying, measuring and broadly communicating the effects of government policies, entrepreneurship and choice on their well-being.
Notre mission consiste à améliorer la qualité de vie des Canadiens et des générations à venir en étudiant, en mesurant et en diffusant les effets des politiques gouvernementales, de l’entrepreneuriat et des choix sur leur bien-être.
Peer review —validating the accuracy of our researchThe Fraser Institute maintains a rigorous peer review process for its research. New research, major research pro-jects, and substantively modified research conducted by the Fraser Institute are reviewed by a minimum of one internal expert and two external experts. Reviewers are expected to have a recognized expertise in the topic area being addressed. Whenever possible, external review is a blind process.
Commentaries and conference papers are reviewed by internal experts. Updates to previously reviewed research or new editions of previously reviewed research are not reviewed unless the update includes substantive or material changes in the methodology.
The review process is overseen by the directors of the Institute’s research departments who are responsible for ensuring all research published by the Institute passes through the appropriate peer review. If a dispute about the recommendations of the reviewers should arise during the Institute’s peer review process, the Institute has an Editorial Advisory Board, a panel of scholars from Canada, the United States, and Europe to whom it can turn for help in resolving the dispute.

Report Card on British Columbia’s Secondary Schools 201842
Editorial Board
* deceased; † Nobel Laureate
Prof. Terry L. Anderson
Prof. Robert Barro
Prof. Jean-Pierre Centi
Prof. John Chant
Prof. Bev Dahlby
Prof. Erwin Diewert
Prof. Stephen Easton
Prof. J.C. Herbert Emery
Prof. Jack L. Granatstein
Prof. Herbert G. Grubel
Prof. James Gwartney
Prof. Ronald W. Jones
Dr. Jerry Jordan
Prof. Ross McKitrick
Prof. Michael Parkin
Prof. Friedrich Schneider
Prof. Lawrence B. Smith
Mr. Vito Tanzi
Prof. Armen Alchian*
Prof. Michael Bliss*
Prof. James M. Buchanan* †
Prof. Friedrich A. Hayek* †
Prof. H.G. Johnson*
Prof. F.G. Pennance*
Prof. George Stigler* †
Sir Alan Walters*
Prof. Edwin G. West*
Members
Past members