Renewables)Ini,a,ve:) Resource)Assessment) - web.stanford.edu · 2 Global)Wind)Resource)Assessment)...
17
NREL is a na*onal laboratory of the U.S. Department of Energy, Office of Energy Efficiency and Renewable Energy, operated by the Alliance for Sustainable Energy, LLC. Renewables Ini,a,ve: Resource Assessment CCIA 2012 Patrick Sullivan 3 August, 2012
Transcript of Renewables)Ini,a,ve:) Resource)Assessment) - web.stanford.edu · 2 Global)Wind)Resource)Assessment)...
NREL is a na*onal laboratory of the U.S. Department of Energy, Office of Energy Efficiency and Renewable Energy, operated by the Alliance for Sustainable Energy, LLC.
Renewables Ini,a,ve: Resource Assessment
CCIA 2012
Patrick Sullivan
3 August, 2012

2
Global Wind Resource Assessment
In 2011, first-‐pass offshore wind resource supply curves
Annual PWh of offshore wind poten,al, by country.

3
2011 Offshore Wind Database
Wind Resource (meters/second)
Distance to Shore (meters)
Bathymetry (meters)
Protected Areas (status)
Shipping Lanes (ship tracks per km2)
Distance
Wind
Bathymetry
Protected Areas
Shipping Lanes
Composite
EEZ • Distance to shoreline • Shoreline specific to EEZ
• NOAA Blended Sea Winds • Monthly wind speed • 30km resolu*on • 0.11 wind sheer used to extrapolate 10m-‐90m
• NOAA ETOPO1 • 1.9km resolu*on
• Protected Planet
• Na*onal Center for Ecological Analysis and Synthesis
— EEZ Country — EEZ Sovereign — Jan-‐w/s-‐10m
— Jan-‐w/s-‐90m
— Feb-‐w/s-‐10m
— Feb-‐w/s-‐90m
— … — Annual Average-‐w/s-‐10m
— Annual Average-‐w/s-‐90m
— Distance to shore
— Bathymetry
— Protected Area (PA) — PA – Name
— PA – Designa*on — PA – Type — -‐PA – IUCN
— PA – Status and Rank — 1. Formally Designated
— 2. Designated — 3. Informally Designated
— 4. Adopted
— 5. Inscribed — 6. Proposed
— 7. Recommended
— 8. Voluntary – Recognized — 9. Voluntary – Unrecognized
— 10. “” — Ship tracks per km2
— 1. 0 – 5 linear km per km2
— …
PostgreSQL Database
41 million records

4
Supply Curve Algorithm Exclusions
# Turbines
Annual Average Windspeed

5
Analysis is underway: GCAM
GCAM added offshore supply curves, has run scenarios to inves*gate its importance.
Reference Policy
Global Electricity
Global Wind Produc*on

6
Analysis is underway: ReMIND
With new offshore wind Without
Business-‐as-‐usual, global primary energy equivalent.

7
Analysis is underway: MESSAGE
MESSAGE onshore is IMAGE (Hoogwijk). Offshore is new, NREL supply curves.

8
Global Wind Resource Assessment
Shortcomings of 2011 analysis 10m wind, escalated to 90m hub-‐height. Monthly average wind speed, no *me-‐series, no distribu*on.
Assumed Weibull-‐k of 2, naively. Some missing months.
Only offshore wind.

9
Global Wind Resource Assessment
For 2012, building supply curves from NCAR’s CFDDA mesoscale reanalysis product:
Modeled, but meshed with observa*ons. Hourly *me-‐series for 21 years: 1985-‐2005. Mul*ple heights AGL, including three between 70 and 150m. 40km spa*al resolu*on. Insola*on too.
10
Raw CFDDA wind data
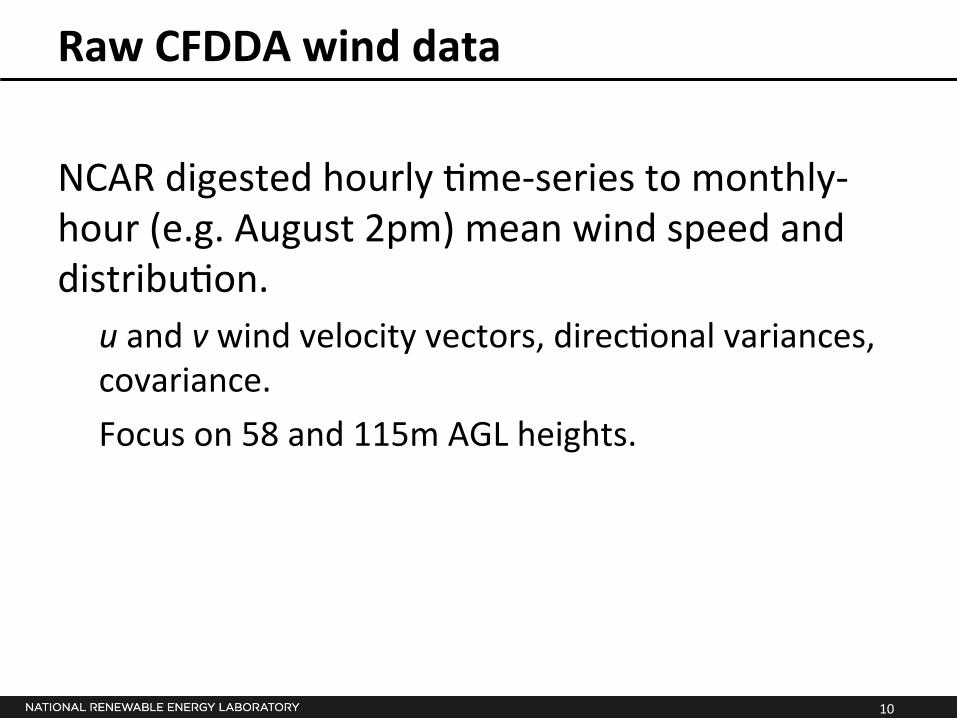
NCAR digested hourly *me-‐series to monthly-‐hour (e.g. August 2pm) mean wind speed and distribu*on.
u and v wind velocity vectors, direc*onal variances, covariance. Focus on 58 and 115m AGL heights.

11
Processing wind speeds
Convert u and v to scalar speed & distribu*on Interpolate between 58 and 115m to 90m hub height. Approximate a Weibull distribu*on based on mean and variance*. Convolve with power curve, adjust for losses, consolidate to annual CF.
115 m AGL
90 m AGL
58 m AGL
0 m AGL
*Justus et al., Methods for Es.ma.ng Wind Speed Frequency Distribu.ons. Journal of Applied Meteorology, 17() 350-‐353, 1978.

12
Geospa,al Assessment
2k
Geospa*al layers have 2k resolu*on compared to the 40k resolu*on of the wind speed dataset.
Each 2km grid cell is assigned the annual average CF for the 40km grid cell in which the 2km grid cell exists. Assume 5MW/km2 turbine spacing.
Excluded
Area
40km CFDDA grid cell
2km grid cell aoributes: • Bathymetry • Distance to Shore • Marine Status (Protected
Planet) • Exclusive Economic Zone
……

13
Processing wind speeds II

14
Processing wind speeds II

15
Onshore wind supply curves
CFDDA again, considering land use (including protected areas) and eleva*on in place of marine protected areas and bathymetry. Tes*ng methods for quan*fying site-‐accessibility: proximity to loads, exis*ng transmission corridors, etc.
o Synthe*c transmission network o Poten*al map
16
Onshore wind: terrain effects
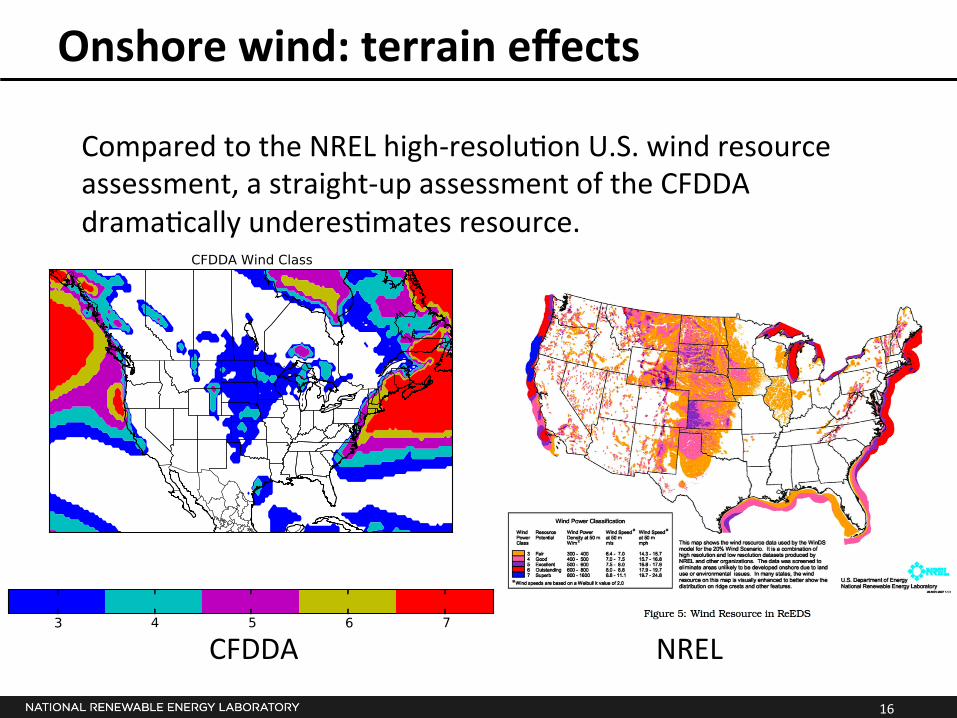
Compared to the NREL high-‐resolu*on U.S. wind resource assessment, a straight-‐up assessment of the CFDDA drama*cally underes*mates resource.
CFDDA NREL