REMEDIAL - US Department of Energy fileformerly utilized med/aec sites remedial action program...
59
FORMERLY UTILIZED MED/AEC SITES REMEDIAL ACTION PROGRAM RADIOLOGICAL SURVEY KENT CHEMICAL LAI3OMTORY UNIVERSITY OF CHICAGO CHICAGO, ILLINOIS September 7 - 13, 1977 Conducted by: Argonne National Laboratory . >IED/AEC Resurvey Group Health Physics Section Occupational Health & Safety Division for the: U.S. Department of Energy under Budget Activity ERDA RK-01-05-02-3 and ANL 73706 C o n t r a c t Number W-31-109-ENG-38.
Transcript of REMEDIAL - US Department of Energy fileformerly utilized med/aec sites remedial action program...
FORMERLY U T I L I Z E D MED/AEC S I T E S
REMEDIAL ACTION PROGRAM
RADIOLOGICAL SURVEY
KENT CHEMICAL LAI3OMTORY U N I V E R S I T Y OF CHICAGO
CHICAGO, I L L I N O I S
September 7 - 1 3 , 1977
Conducted by:
Argonne Na t iona l Labora tory . >IED/AEC Resurvey Group Heal th Phys i c s S e c t i o n Occupat ional Hea l th & S a f e t y D i v i s i o n
f o r the :
U . S . Department of Energy under Budget A c t i v i t y ERDA RK-01-05-02-3 and ANL 73706 Cont rac t Number W-31-109-ENG-38.

The submit ted manuscript has been zu tho r i zed by a c o n t r a c t o r of t h e U. S. Government under c o n t r a c t No. W-31-109-ENG-38. Accordingly, t h e U. S . Governzent r e t a i n s a noriexclusive, r c y a l t y - f r e e l i c e n s e t o p u b l i s h o r reproduce t h e publ i shed form of t h i s c o n t r i b u t i o n , o r a l l ow o t h e r s t o do s o , f o r t h e U. S. Government p u r p ~ s e s .
DRAFT COPY
PREFACE
This is one of a series of reports resulting from a program initiated
in 1974 by the Atomic Energy Commission (AEC) for determination of the
condition of sites formerly utilized by the Manhattan Engineer District
(MED) and the AEC for work involving the handling of radioactive materials.
Since the early 19401s, the control of over 100 sites that were no longer
required for nuclear programs has been returned to private industry or
the public for unrestricted use. A search of MED and AEC records indicated
that for some of these sites, docu~entation was insufficient to determine
whether or not the decontamination work done at the time nuclear activities
ceased is adequate by current guidelines.
I This report contains the results of survsys of the current radio-
logical condition of Kent Laboratory, University of Chicago, Chicago,
Illinois.
Tkis su*Jey was ?erfo~med by t h e foZZming Health Physics personnel of the Occupc2io?zcrZ Health and Safeky Division, Argonne JlationaZ Laboratory, Argonne, I l l<nois: R. A. l.Qnveen, N. 3. ,With, C. Boggs ?<!ayes, P. C. Gray, D. W. ReiZZy.
DRAFT COPY

iii
CONTENTS
Page L i s t o f F i g u r e s . . . . . . . . . . . . . . . . . . . . . . . . . . . . iv
L i s t o f T a b l e s . . . . . . . . . . . . . . . . . . . . . . . . ; . . . I n t r o d u c t i o n . . . . . . . . . . . . . . . . . . . . . . . . . . . . . . . 1
Survey Techniques . . . . . . . . . . . . . . . . . . . . . . . . . . . 2
General . . . . . . . . . . . . . . . . . . . . . . . . . . . . . 2- I n s t r u m e n t a t i o n . . . . . . . . . . . . . . . . . . . . . . . . . 2-3 Smear Surveys . . . . . . . . . . . . . . . . . . . . . . . . . . '3-4
. . . . . . . . . . . . . . . . . . . . . . . . . . . Air Samples 5 S o i l s a m p l e s . . . . . . . . . . . . . . . . . . . . . . . . . . . 5-7
A n a l y s i s o f Survey R e s u l t s . . . . . . . . . . . . . . . . . . . . . . Genera l . . . . . . . . . . . . . . . . . . . . . . . . . . . . . 8 I n s t r m e n t Surveys . . . . . . . . . . . . . . . . . . . . . . . . 8-9 Smear Surveys . . . . . . . . . . . . . . . . . . . . . . . . . . 9 A i r Samples . . . . . . . . . . . . . . . . . . . . . . . . . . . 9-10 S o i l S a z p l e s . . . . . . . . . . . . . . . . . . . . . . . . . . . 10
. . . . . . . . . . . . . . . . . . . . . . . Contaminat ion G u i d e l i n e s 11-12
Hazard E v a l u a t i ~ n . . . . . . . . . . . . . . . . . . . . . . . . . . . . . . . . . . . . . . . . . . . . . . . . . . . . . . . . . . F o o t n o t e s
. . . . . . . . . . . . . . . . . . . . . . . . . . . . . . . F i n d i n g s 18
Appendix 1 . Convers ion F a c t o r s . . . . . . . . . . . . . . . . . . . . Appendix 2 . Radon D e t e r m i n a t i o n C a l c u l a t i o n s - . . . . . . . . . . . . Appendix 3 . S o i l A n a l y s i s P r o c e d u r e f o r T o t a l U r a n i m and
G m a - E m i t t i n g N u c l i d e s . . . . . . . . . . . . . . . . Appendix 4 . U a t u r a l Uranium C a l c u l a t i o n s . . . . . . . . . . . . . . . 42-43
Appendix 5 . P e r t i n e n t R a d i o l o g i c a l B e g u l a t i c n s . S t a n d a r d s a n d G u i d e l i n e s . . . . . . . . . . . . . . . . . . . . .
DRAFT COPY
8'10814
Page
LIST OF FIGURES
Figure
1. Survey Loca t ions
. . . . . . . . . . . . . . . . 1A - Kent Laborat-ory - Basement. 19
. . . . . . . . . . . . . . 1B - Kent Labora tory - F i r s t F l o o r 20
. . . . . . . . . . . . . 1C - Kent Labora tory - Second F loo r . 21 . . . . . . . . . . . . . . . ID - Kent Labora tory - T h i r d F loo r 22
. . . . . . . . . . . . . . . . . 1E - Kent Labora tory - A t t i c 23
. . . . . . . . . . . . . 1F - Kent Labora tory - S o i l Samples. 24
. . . . . . . . 2. S o i l Sampling Procedure and P roces s ing Diagram 25
DRAFT COPY

DRAFT COPY
LIST OF TABLES
Table Page
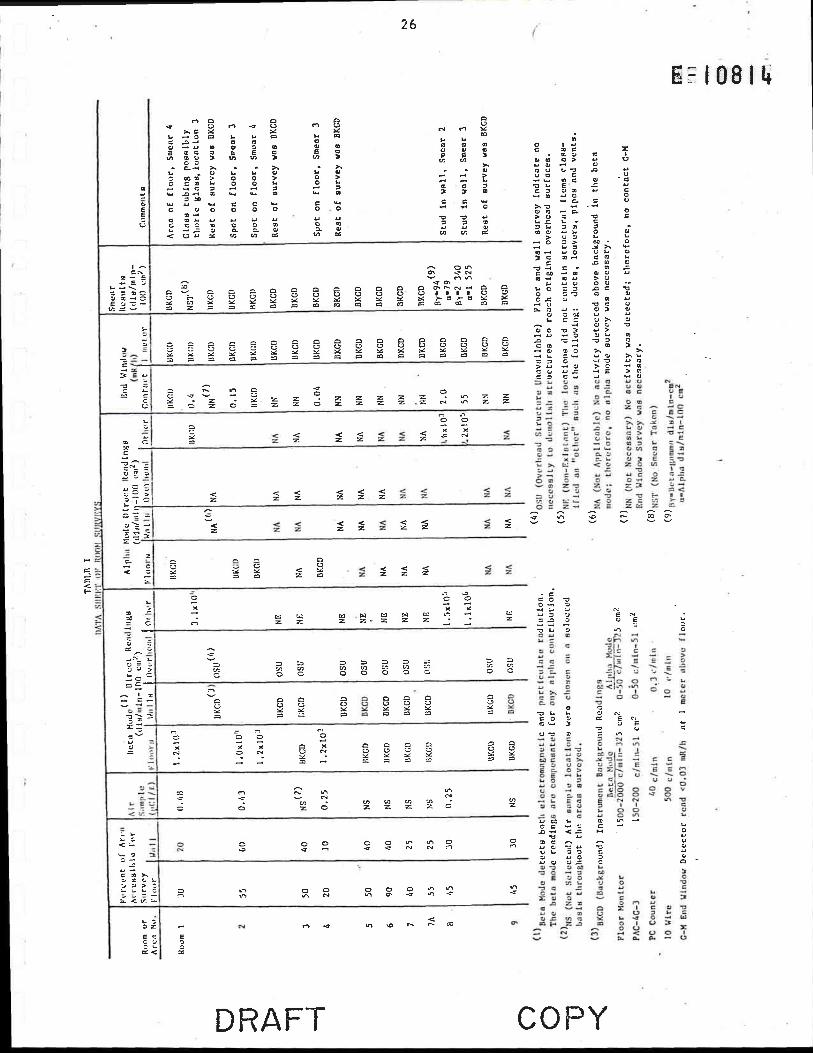
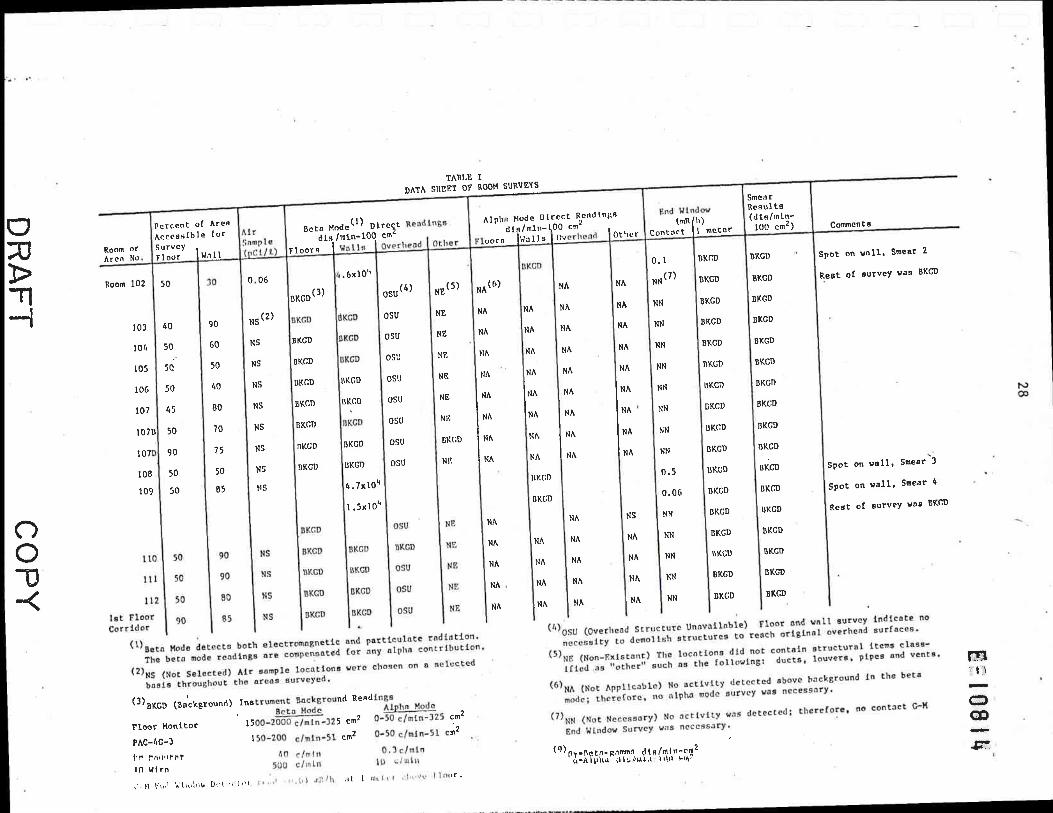
. . . . . . . . . . 1. D a t a Sheets Showing Room.Survey Results. 26-30
. . . . . . . . . . . . . . . 2. Instrumentation Used in Survey 31
. . . . . . . . . . . . . . . 3. Instrument Sackground Readings 32
. . . . . . . . . . . . . 4 . Radon Concentration Determinations 33
6. Ge(Li) Spectrm and Uraqiun Fluorometric Analyses Results. . 35
. . . . . . . . . . . . . . . . 7. B2cbground Soil Sample D a t a . 36

RADIOLOGICAL SURVEY OF KENT LABORATORY,
UNIVERSITY OF CHICAGO, CHICAGO, ILLINOIS
INTRODUCTION
Much of the work in the Manhattan Engineer District/Atomic Energy
Commission ( ~ . E D / A E C ) Era was performed at the University of Chicago. The
Kent Chemical Laboratory was one of the buildings in use at that time.
General radiochemistry and/or physics research was performed at this
facility.
No reports of radiation surveys or decontamination could be found
concerning Kent Laboratory. It was, therefore, felt that a radiation
survey should be undertaken. Thz survey of Kent Laboratory was performed
from September 7 to 13, 1977. The purpose of this survey was to determine
if any detectable contamination renains as a result of the pED/AEC operations.
Kent Laboratory is presently in use as offices, laboratories and classrooms.
DRAFT COPY

SURVEY TECHNIQUES
General
A l l a c c e s s i b l e o r i g i n a l w a l l s were surveyed t o a he igh t of 2 meters
and a l l a c c e s s i b l e f l o o r a r e a s were surveyed (Table 1). I n many a r e a s ,
t h e f l o o r s and w a l l s had been c a r p e t e d o r pa in t ed . Even though t h e s e w e r e
n o t t h e o r i g i n a l s u r f a c e s , t h e s e a r e a s were surveyed s i n c e t h e c a p a b i l i t y '
of d e t e c t i o n was adequate t o d e t e c t a c t i v i t y on t h e o r i g i n a l s t r u c t u r e s
underneath. A r e p r e s e n t a t i v e s e l e c t i v e survey of overheads such a s d u c t s
and bearts was performed i n a r e a s where t h e o r i g i n a l s t r u c t u r e s were
a v a i l a b l e . See Table 1 and F igu res 1 A through 1F f o r l o c a t i o n s of a c c e s s i b l e
a r e a s snrveyed. ( A l l measurements were o r i g i n a l l y t aken us ing t h e Eng l i sh
system. The S I u n i t s a r e t o be n e a r e s t approxine t ion . For example, 2
i nches ere equal t o 5 cm.)
In s t rumen ta t ion
Three types of survey i n s t r m e n t s were used (Table 2 ) . An E b e r l i n e
FM-4G having a d e t e c t i o n a r e a of 325 cm2, u t i l i z i n g t h e Ebe r l ine PAC-4G3
e l e c t r o n i c s , was used t o survey t h e f l o o r s . A PAC-4G-3 wi th a hand-held
d e t e c t o r , 51 cn2 i n s e n s i t i v e a r e a , was used t o survey t h e w a l l s and o t h e r
a c c e s s i b l e a r z a s . Double a luminized mylar (-0.85 mg/cm2) windows .were used
i n bo th d e t e c t o r s . Th i s a l l o w s low energy d e t e c t i o n and, t h e r e f o r e , pro-
v i d e s f o r increased in s t rumen t s e n s i t i v i t y . Both of t h e s e in s t rumen t s
were i n i t i a l l y used i n t h e b e t a mode. I n t h e b e t a mode, t h e d e t e c t o r responds
t o a lpha and b e t a p a r t i c l e s and X and gamna r a y s . When a r e a s were found
which i n d i c a t e d a 5 i g h e r count r a t e t han t h e ins t rument background, t h e
i n s t r w ~ e n t was then switched t o t h e a lpha mode and a reading of t h e a lpha
a c t i v i t y was obta ined . I n t h e a lpha mode, t h e ins t rument only responds t o
p a r t i c l e s w i th h igh s p e c i f i c i o n i z a t i o n such a s a lpha p a r t i c l e s .
DRAFT COPY

e 2 # 8 1 b An End Window Geiger-Mueller (G-M) D e t e c t o r , E b e r l i n e Model 530 w i t
an Eber l ine HP-190 probe, he ld one meter above t h e f l o o r , was used t o de te rmine
gene ra l background r a d i a t i o n l e v e l s th roughout t h e surveyed a r e a . I f a n a r e a
was found t h a t had an e l e v a t e d count r a t e , a c o n t a c t r ead ing was obtained.
The End Window GM'Detec tor w a s c a l i b r a t e d us ing t h e gamma emissions from
a 2 2 6 ~ a c a l i b r a t i o n source . The PAC-4G3 ins t rumen t s were c a l i b r a t e d i n t h e
a lpha mode us ing a f l a t p l a t e i n f i n i t e l y t h i n 2 3 9 ~ u s t a n d a r d and i n t h e b e t a
mode wi th a f l a t p l a t e i n f i n i t e l y t h i n 9 0 ~ r - 9 0 ~ s tanda rd . The ins t ruments
were c a l i b r a t e d t o an agparent 50% geometry.
It n u s t b e r e a l i z e d t h a t t h e numerous i s o t o p e s t h a t could be encountered
w i l l e x h i b i t emiss ion e n e r g i e s d i f f e r i n g from t h a t of 2 3 9 ~ u and 9 0 ~ r - 9 0 ~
u t i l i z e d i n t h e c a l i b r a t i o n . When d e t e c t i n g known n u c l i d e s t h a t emit a lpha
and b e t a e n e r g i e s - d i f f e r i n g from t h a t of t h e s t a n d a r d s , a conver i son f a c t o r
f o r t h a t p a r t i c u l a r r a d i o n u c l i d e w i l l be developed t o de te rmine t h e appropr i -
a t e y i e l d . A l l r ead ings of d i s /min - 100 cm2 a s r e p o r t e d a r e equated t o
2 3 9 ~ ~ and 9 0 ~ r - 9 0 ~ , u n l e s s o the rwi se s t a t e d .
When p o s s i b l e , t h e n u c l i d e s of contaminat ion were i d e n t i f i e d . This was
done by performing a gamma s p e c t r a l a n a l y s i s on a contaminated i tem o r on an
e x t r a c t i o n from a contaminated a r e a . . A Nuclear Data Mul t ichannel Analyzer
Model ND-100, u t i l i z i n g a 7.6 cm x 7.6 c m Sodium I o d i d e Thal l ium a c t i v a t e d
1 [N~I(T~)! c r y s t a l was used f o r de te rmining gamma s p e c t r a l a n a l y s i s . Th i s
i n s t rumen t , a l o n g w i t h a l l o t h e r survey and sampling d e v i c e s , was housed i n
t h e mobile l a b o r a t o r y .
Smear Surveys
Dry smears were taken throughout t h e e n t i r e a r e a of Kent Chemical
Laboratory, U n i v e r s i t y of Chicago, (F igu res 1 A through 1E). A s t anda rd
smear i s performed by apply ing moderate p r e s s u r e by t h e t i p s of t h e
DRAFT COPY

121081$ f i r s t two f i n g e r s t o t h e back of t h e f i l t e r paper . Routine smears were t aken
on o r i g i n a l s t r u c t u r e s and components such a s w a l l s , f l o o r s , p i p e s and v e n t s .
All smears were taken w i t h No. 1 Whatman f i l t e r paper , 4.25 cm i n diameter .
Smears of 930 cn2 were normally taken. I f a n a r e a o r o b j e c t was.found which
had a h ighe r than normal .background, a smear of 100 cm2 was taken . A smear
of 100 cn2 was a l s o t aken i f an a r e a i n d i c a t e d excess ive d i r t loading .
The smears were counted i n groups of t e n us ing a 10-Wire F l a t P l a t e
Gas P r o p o r t i o n a l D e t e c t o r , developed a t ANL, u t i l i z i n g an Ebe r l ine Mini S c a l e r .
PIodel MS-2. A t l e a s t one smear of each group was removed and counted i n t h e
more s e n s i t i v e Nuclear Measurement Corpora t ion 2n I n t e r n a l G a s Flow Propor-
t i o n a l Counter Model 5 (PC-5) u s i n g a m y l a r spun top . (.The mylar spun t o p
i s p lace2 over non-conductive samples t o nega te t h e d i e l e c t r i c e f f e c t when
count ing sauziles on non-conducting media such a s paper . ) T h i s procedure was
used as a more s e n s i t i v e means of coun t ing a s e l e c t i o n of t h e smear samples.
A l l smears of a r e a s o r o b j e c t s w i t h e l e v a t e d d i r e c t r ead ings were counted i n
t h e PC-5. I n a d d i t i o n , any smears i n d i c a t i n g above background l e v e l s i n t h e
10-Wire Assembly, were a l s o counted i n t h e PC-5 Counter. Smears w e r e counted
i n each d e t e c t o r f o r b o t h a lpha and b e t a a c t i v i t y . Appendix 1 prov ides t h e
in s t rumen ta t ion and smear count convers ion f a c t o r s used. A l l contaminat ion
on t h e s p e a r s i s equated t o 9 0 ~ r - 9 0 ~ and 2 3 9 ~ u , u n l e s s o the rwi se s t a t e d .
. Table 1 i n c l u d e s t h e room survey r ead ings wh i l e t h e maps i n F igu res 1A
through 1G i n d i c a t e t h e l o c a t i o n of t h e smears. A number, n , i n d i c a t e s t h e
l o c a t i o n of t h e p a r t i c u l a r smear i n t h e room. A number (@) , i n d i c a t e s a
sinear of an overhead s t r u c t u r e . A number i n a box ( a ) , i n d i c a t e s one o r
more of t h e fo l lowing: a n e l e v a t e d d i r e c t r ead ing , a smear t h a t e x h i b i t s -a
g r e a t e r t han background count .
DRAFT COPY

t3?1081& A i r Samples
A i r samples were c o l l e c t e d using a F i l t e r Queen a i r sampling device.
The F i l t e r Queen Pr incess Plodel i s an a i r sampling device u t i l i z e d f o r t h e
sampling of r a d i o a c t i v e p a r t i c u l a t e ma t t e r i n t h e a i r . This u n i t w a s
designed and const ructed a t Argome Nat ional Laboratory. The c o l l e c t i o n
medium consis ted of a 200 cm2 s h e e t of Hollingsworth-Vose (HV-70-0.23 mm)
f i l t e r paper which c o l l e c t s t h e p a r t i c u l a t e s p resen t i n t h e a i r . A flow
r a t e of 40 cubic meters p e r hour (m3/h) was used. A 10% p o r t i o n , 5 cm i n
diameter , was removed from the f i l t e r media a f t e r c o l l e c t i o n and counted
f o r both alpha and b e t a a c t i v i t y i n t h e NMC PC-5, u t i l i z i n g a mylar spun -
top. The c o l l e c t i o n e f f i c i e n c y a t t h i s f low r a t e f o r 0.3 micron p a r t i c l e s
i s approxinate ly 99.9%. Sampling r e s u l t s were used t o determine radon con-
c e n t r a t i o n s and t h e presence of any long-lived a c t i v i t y . A i r sample calcu-
l a t i o n s a r e presented i n Appendix 2.
S o i l Samples
S o i l cor ings were taken a t s e l e c t e d undisturbed l o c a t i o n s o u t s i d e Kent
Laboratory t o determine t h e depos i t ion , i f any, of i s o t o p e s t h a t could have
been s p i l l e d o r re leased. Fluorometric and gamma-ray s p e c t r a l ana lyses were
conducted on t h e s e s o i l samples.
The cor ings were e f f e c t e d us ing a 1 0 . 1 cm i n diameter by 15.2 cm i n length
r i g h t c i r c u l a r c y l i n d e r , commonly c a l l e d a golf-green hole c u t t e r .
Each core was 30 cm i n l e n g t h and d iv ided i n t o f o u r segments. S t a r t i n g
from t h e su r face , t h r e e s e p a r a t e 5 cm segments a r e c u t , bagged, and marked A,
B, and C, r e s p e c t i v e l y ; t h e f i n a l segment of 15 cm was marked D.
The reason f o r t h e segment& cor ing i s t o determine what, i f any, contami-
n a t i o n migrat ion has occurred, t o reduce t h e d i l u t i o n of lower l e v e l s o i l wi th
DRAFT COPY
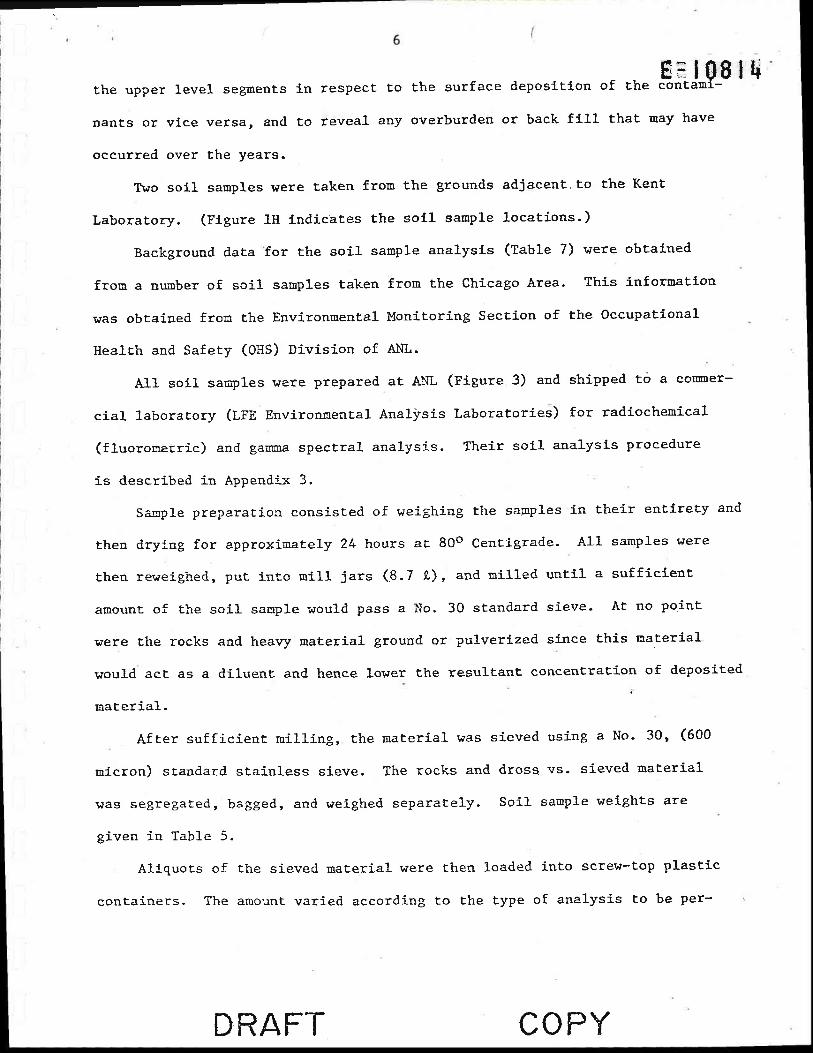
E = I P S I f . i ' t h e upper l e v e l segments i n respec t t o t h e su r face deposi t ion of t h e contam -
nan t s o r v ice versa , and t o r e v e a l any overburden o r back f i l l t h a t may have
occurred over t h e years.
Two s o i l samples were taken from t h e grounds adjacent t o t h e Kent
Laboratory. (Figure 1H i n d i c a t e s t h e s o i l sample loca t ions . )
Background data f o r t h e s o i l sample a n a l y s i s (Table 7) were obta ined
from a number of s o i l samples taken from t h e Chicago Area. This information
was obtained f ron t h e Environmental Monitoring Sect ion of t h e Occupational
Health and Safe ty (OHS) Divis ion of ANL.
A l l s o i l samples were prepared a t ANL (Figure 3) and shipped t o a comer-
c i a 1 labora tory (LFE Environmental Analysis Laborator ies) f o r radiochemical
( f luoroner r i c ) and g a m s p e c t r a l a n a l y s i s . Their s o i l a n a l y s i s procedure
i s described i n Appendix 3.
Sample prepara t ion consis ted of weighing t h e saplples i n t h e i r e n t i r e t y and
then drying f o r approximately 24 hours a t 80° Centigrade. A l l samples were
then reweighed, pu t i n t o m i l l j a r s (8.7 R ) , and n i l l e d u n t i l a s u f f i c i e n t
amount of the s o i l sample would pass a No . 30 s tandard sieve. A t no po in t
were t h e rocks and heavy mate r i a l ground o r pulver ized s ince t h i s m a t e r i a l
would a c t a s a d i l u e n t and hence lower t h e r e s u l t a n t concentra t ion of deposited
mate r i a l .
. A f t e r s u f f i c i e n t m i l l i n g , t h e m a t e r i a l was s ieved using a No. 30, (600
micron) standard s t a i n l e s s s i eve . The rocks and d ross vs. s ieved m a t e r i a l
w a s segregated, bagged, and weighed s e p a r a t e l y . S o i l sample weights a r e
given i n Table 5.
Aliquots of t h e s ieved m a t e r i a l were then loaded i n t o screw-top p l a s t i c
con ta ine r s . The amount va r ied according t o t h e type of a n a l y s i s t o be per-

formed; 100 grams for gamma and radiochemical (fluorometric) analyses and
10 grams for radiochemical (fluorometric) only. Every effort was made
throughout the sample preparation operations to eliminate cross contamination.
Soil samples which were suspected of containing elevated amounts.of radio-
activity were processed in equipment separate from the soil s-amples considered
to contain background~levels. All items of equipment were scrubbed and air
dried prior to the introduction of the next sample.
DRAFT

ANALYSIS OF SURVEY RESnTS
General
A l l d a t a , and diagrams of survey l o c a t i o n s , a r e i n t h e a t tachments .
T h i s s e c t i o n d i s c u s s e s t h e r e s u l t s of t h e survey and t h e f i n d i n g s t h e r e i n .
Instruinent r ead ings and smear r e s u l t s were conver ted t o u n i t s of d i s i n t e g r a -
t i o n s p e r minute p e r one hundred s q u a r e c e n t i m e t e r s (d is /min - 100 cm2 u s i n g
t h e f a c t o r i e s i n Appendix 1. A l l d a t a i s r e p o r t e d i n n e t counts , i.e., t h e
background count r a t e s have been s u b t r a c t e d from t h e g r o s s count r a t e s p r i o r
t o conver t ing f r o n counts p e r minute p e r one hundred s q u a r e c e n t i m e t e r s
(c/min - 100 cm2) t o d is /min - 100 cm2.,. The b e t a mode r ead ings a r e c o r r e c t e d
t o remove any a lpha con t r ibu t ion . The room background l e v e l s v a r i e d somewhat
due t o t h e c o n s t r u c t i o n m a t e r i a l s i n them. Table 3 prov ides a n ave rage back-
ground r ead ing f o r a l l nodes of t h e d i f f e r e n t i n s t rumen t s used.
The a r e a s a c c e s s i b l e f o r survey v a r i e d from a r e a t o a r e a . Areas
a c c e s s i b l e f o r survey a r e p re sen ted i n Table 1. The ave rage pe rcen t of t h e
t o t a l a c c e s s i b l e a r e a s was 55% f o r t h e f l o o r s and 534 f o r t h e w a l l s .
Ins t rument Surveys
Twenty s p o t s of contaminat ion were fousld i n twelve rooms throughout
Kent Laboratory. I n most i n s t a n c e s , t h i s contaminat ion c o n s i s t e a of s m a l l
s p o t s ( l e s s than 300 cn2), found mainly on f l o o r s .and w a l l s . The h i g h e s t
b e t a - g m a containinat ion of 1.1 x - l o 6 d is /min - 103 cm2 and t h e h i g h e s t a lpha
contaminat ion of 2 .2 x l o 5 d is /min - 100 crn2 was found on t w o i r o n s t u d s i n
Room 8. T;?ese s t u d s were used t o hold me ta l rods i n p l ace . Room 8 i s i n
use a s a machine shop and i t appea r s t h a t t h e s e s t u d s have been added s i n c e
t h e MED/AEC e r a . Also, a small sou rce was found t aped t o a box i n Room 11.
It was f e l t t h a t t h e a c t i v i t y found i n b o t h of t h e s e rooms was no t a r e s u l t
DRAFT COPY

of any MED/AEC operations but rather is a result of the present day&g( 08 '1 6 of the building.
The next highest alpha activity of 6.4 x lo3 dis/min - 100 em2 was found
on a vent pipe in the attic. The next highest beta-gamma activity of 8.0 x 10'
dislmin - 100 cm2 was found on a wall in Room 209. This spot on the wall also
yielded the highest End Window reading which was 70 m ~ / h at contact.
Smear Surveys
Results of the smear survey indicated that five smears were contaminated.
These were as follows:
Room 8 - Smear 2 of a wall stud was 94 dislmin - 100 cm2 beta-gamma and 79 dis/min - 100 cm2 alpha. Smear 3 was taken on another wall stud and was 2 340 di-s/rnin -
100 cm2 beta-gamma and 1 525 dis/min - 100 cm2 alpha.
Room 14 -Smear 3 of the floor was 0 dis/min - 100 cm2 beta-gamma and 8 dis/min - 100 cm2 alpha.
Rcom 18-Smear 1 of the floor was background beta-gamma and 18 dis/min - 100 cm2 alpha.
Attic - Smear 8 taken on a vent pipe was 28 dislmin - 100 cm2 beta-gamma and 92 dis/min - 100 cm2 alpha.
No contamination above background levels was detected on any other smear.
Air Samples
The air sampling results are presented in Table 14. The variation of
the data results do not appear to be a result of any MED/AEC operation, but
rather the variation reflects various environinental factors such as wind,
rain, and diurnal variation. Other factors such as the ventilation of the
room can cause the radon concentrations to vary. All radon concentrations
DRAFT COPY

1rlO8ll i determined are below the maximum permissible concentration (PfPC) for an
uncontrolled area as listed in the "Standards of Protection Against Radiation,"
Code of Federal Regulations, Title 10, Part 20, Appendix B (April 30, 1975)
(10 CF'R 20). These concentrations are found to be within the normal expected
levels of radon.
Soil Saiil~les . Results subaitted by LFE Environmental Analysis Laboratories, as listed
in Table 6, are reported in picocuries per gram (pCi/g) for the Germanium
(Lithim) Ge(Li) spectral analysis and in micrograms per gram (pg/g) for [ I the u r a i m fluorometric analysis. The latter concentrations were converted
to pCi/g by means of the example calculation shown in Appendix 4.
The background data is presented in Table 7. The background samples
indicated natural uraxiun concentrations ranging from 0.3 to 2.0.pCi/g.
Results of soil samples taken at Kent Laboratory fall within the range of
the concentrations found in the background samples.

. CONTAMINATION GUIDELINES
Both the ANSI Standard 313.12 for the control of radioactive surface con-
tamination of facilities to be released for uncontrolled use and the NRC Guide-
line for the release of property for unrestricted use, were considered as
guidelines (See Appendix 5).
Since none of the spots of contamination were easily chipped from their
location, the spots could not be identified as to the radionuclide of contami-
nation. It is known though, that plutonium, uranium, and radium were used
in various buildings at the University of Chicago. Both plutonium and radium
are considered Group 1 radionuclides in the ANSI Standard while uranium is
I in Group 3. Since radionuclide identification was impossible and it is
feasible zhat plutonium and radium could have been the radionuclides of
contamination, the lists for Group 1 radionuclides will be used. The NRC
Guidelines for 226~a and 239~u are as follows: the average is 100 dis/min - 100 cm2, the maximum is 300 dis/min - 100 crn2 and the removable is 20 dis/min -
100 cm2. The measurements for the average may not be averaged over more than
one square neter and the maximum level applies to an area of not more than
100 cm2. Also, the average and maximu radiation levels associated with
surface contamination resulting from beta-gamma emitters should not exceed
0.2 mrad/h at 1 cm and 1.0 mrad/h at 1 cm, respectively, measured through not
more than 7 mg/cm2 of total absorber.
The proposed ANSI Standard is more restrictive than the NRC guide when
considering 226~a or 239~u. The allowable limits in the ANSI Standard for
226~a and 239~u is 20 dislnin - 100 cm2 removable and the limits are such that the total (fixed plus removable) activity must be non-detectable and the
instrument utilized for this measurement shall be calibrated to measure at
least 100 pCi of the contaminant uniformly spread over 100 cm2.
DRAFT COPY

- These l e v e l s may be averaged ove r 1 m2 provided t h e maximum a c t i v i t @ ~ n l @ 1- 6 area of 100 cm2 is less than 3 t imes t h e l i m i t v a lue . Other c o n s i d e r a t i o n s
a r e a l s o mentioned f o r t h e purpose of averaging.
The a r e a s of contaminat ion which were found t o b e g r e a t e r than t h e
a c c e p t a b l e s u r f a c e contaminat ion l e v e l s f o r Group 1 r a d i o n u c l i d e s a s g iven
i n t h e proposed ANSI' S tandard N13.12-;are a s fo l lows:
Room 1 - Glass t ub ing ( p o s s i b l y t h o r i c g l a s s ) and s p o t on f l o o r - Loca t ion 3 and Smear Loca t ion 4
-2 - Two s p o t s on f l o o r - Smear Loca t ion 3 and 4
4 - Spot on f l o o r - Smear Loca t ion 3
18 - Spot on f l o o r - Smear Loca t ion 2
1 0 1 - Spot on f l o o r and w a l l s - Snsar Loca t ion 2 , 3, 4 , and 5
102 - Spot on w a l l - Snear Locazion 2
109 - Spo t s on w a l l - Smear Loca t ion 3 and 4
201 - Spot on f l o o r - Smear Loca t ion 3
209 - Spot on w a l l s and f l o o r - Snear Loca t ion 3, 4 , and 5
305 - Spot on f l o o r - Smear Loca t ion 3
A t t i c - Spot on v e n t p i p e i n f l o o r - Smear Loca t ion 8
DRAFT COPY

HAZARD EVALUATION
I n order t o a s s e s s both an e x t e r n a l and i n t e r n a l r ad io log ica l hazard
assoc ia ted with Kent Laboratory, a hypo the t i ca l s i t u a t i o n involving Room 209
w i l l be constructed.
The highest reading of 70 mR/h was obtained when t h e G M End Window
probe w a s placed i n d i r e c t contact wi th t h e spot on t h e wal l . A t t h i s po in t ,
t h e G-M de tec to r i s approximately 3 cm from the contaninated surface . An
e x t e r n a l dose w i l l be determined f o r a person s i t t i n g near t h i s l o c a t i o n f o r
an extended period of t i m e .
Analysis was n o t performed on t h i s spo t , s o t h e radionucl ide of con-
tamination i s not known. It w i l l be a s s m e d , though, t h a t t h e h a l f - l i f e i s
long and t h e dose r a r e w i l l s t a y constant over time.
A poss ib le s i t u a t i o n a r i s i n g could involve the .convers ion of Room 209
t o an o f f i c e and t h e placement of a desk next t o t h e contaminated wal l . A
person s i t t i n g a t t h e desk would probably be no c l o s e r than 50 cm t o t h e
spo t . The dose r a t e a t 50 cm would be determined using the inverse square
law as follows:
X = 0.25 mR/h a t 50 cm.
Assuming a Qua l i ty Factor of 1, t h e dose equivalent r a t e would be:
I f a person occupied t h i s c h a i r f o r 40 h r s pe r week f o r one year the
t o t a l dose equivalent would be
0.25mrem 4 0 h . - . h
50 week = 500 mremhear = 0.5 rem per year
week year
t o the whole body.
DRAFT COPY

J=10811i This calculated dose is equal to the National Council for Radiat n
ProtectioU and Measurements (NCRP) intended limit of 0.5 rem per year for
(2) a non-occupational exposure . To assess the internal radiological hazard, it will be assomed that
the contaminated wall in Room 209 is cut using a concrete saw. The reading
found at this locatibn was 8.0 x 10⁵ dis/min - 100 cm2 beta-gamma (equated to
90~r-90~). Since it was known that radium was used in this facility, the
activity will be equated to Radiu~n-226. Thus, the activity in terms of
Radium-226 is:
This is also equal to:
The worst likely situation which could arise would probably involve the
use of a concrete saw in a dry condition. It will be assumed that one per-
son is operating a concrete saw to cur the wall for an electrical outlet.
A typical saw blade used in cutting the concrete would have a diameter of
35.6 cm and a thickness of 0.40 cm with a 12.7 cm cutting surface. The
wobble of the blade would probably increase the width of the cut to a kerf of
0.48 cm. If the cut was 10 cn - 10 cm, the perimeter would be 40 cm, and the volume of concrete that the blade would displace is as follows:
Thus, 2.4 x lo2 cm3 of concrete could become airborne.
DRAFT COPY

E510814 I f t h e contaminant had n o t p e n e t r a t e d t h e c o n c r e t e , t h e contaminat ion
should be confined t o t h e c o n c r e t e n e a r t h e s u r f a c e . Therefore , i t w i l l be
assumed t h a t t h e contaminat ion i s conf ined t o t h e t o p 0.3'cm of t h e conc re t e
and t h a t t h e t o t a l r a d i o a c t i v i t y p r e s e n t i s 8.47 x 10-I pCi (raJ 1100 cm2.
It w i l l b e assumed, tha t o n l y 20% of t h e c o n c r e t e t h a t i s d i sp l aced ',?A
becomes a i r b o r n e r e s p i r a b l e . Thus, t h e volume of c o n c r e t e t h a t would become
a i r b o r n e r e s p i r a b l e i s t h e fo l lowing:
The density of o r d i n a r y conc re t e is approximate ly 3 g/cm3(4). Thus, t h e .
amount of c o n c r e t e t h z t could become a i r b o r n e r e s p i r a b l e would be c a l c u l a t e d
i n t h e fo l lowing mannzr:
If t h e l e v e l of a c t i v i t y i s 8.47 x 10-I u C i 1100 cm2, then t h e t o t a l ( r a >
a c t i v i t y involved i n t h e c u t t i n g would be:
8.47 x 10-I pCi 1 40 cm 0.48 crn . .20 = 3.25 x p C i
100 cm2 ( r a ) -
T h i s i s t h e amount of a c t i v i t y t h a t i s now i n t h e a i r due t o t h e c u t t i n g .
One can assume t h a t t h e c o n c r e t e i s d r y and t h a t a maximum d u s t burden
w i l l b e c r e a t e d . The TLV f o r Nuisance P a r t i c u l a t e s i s 15 mg of conc re t e d u s t
p e r c u b i c m e t e r o r 1 .5 x g/m3(5) . I f a n a e r o s o l was genera ted which
con ta ined t h i s TLV, t hen t h e c o n c e n t r a t i o n of t h e r a d i o n u c l i d e i n t h e a i r would
then b2:
COPY

It i s doubtful t h a t more than one person would be involved i n R ~ ~ \ o 8 i b opera t ion and t h e job would probably r e q u i r e l e s s than an hour. The Maxi-
mum Permissible Concentration i n t h e a i r (MPCa) for Radium-226 i n an uncon-
t r o l l e d area i s 2 x 10-l2 pCi . Comparing t h e pos tu la ted l e v e l ( r a )
t o t h e E C a , t h e fol lowing r a t i o i s obtained:
I n t h e preceding hypothes is , an ae roso l was generated which i s 1.69 times
t h e M?Ca.
A person involved i n t h i s job f o r 9 one-hour per iod would i n h a l e 1 .2 m3
of air per hour conta in ing t h e fol lowing l e v e l of a c t i v i t y :
The f r z c t i o n reaching t h e organ of r e fe rence , which i n t h i s c a s e is
t h e bone, would be 0 . 0 3 ' ~ ) . The a c t i v i t y reaching t h e bone would be
obtained i n t h e fol lowing ca lcu la t ion :
The Ma*imm Permiss ib le Burden of t h e .bone i n t h e t o t a l body, [ q (K)] , f o r
Radim-226 i s 1 x 10-I u C i (9) ( r a )
. Comparing the t o t a l reazhing t h e bone
t o - t h e Xzximun Permiss ib le Bone Burden, t h e fo l lowing r a t i o is obtained:
Thus, each person would rece ive 1.23 x o r 0.000122 of a bone burden -f ron
this operat ion.
DRAFT COPY

FOOTNOTES
1. A Quality Factor of 1 is used for X or y rays and Beta particles.
2. Basic Radiation Protection Criteria, Report No. 39, National Council
on Radiation Protection and Measurements (NCRP).
3. This conversion factor of 4* dislmin 8-y(ra) is taken f ram Appendix 1. 2 dislmin B - ~ ( ~ ~ s ~ - ~ ~ Y )
4. This value is taken from the Table, "Density of Elements and Common
Material," as given in the Radiological Health Handbook, January, 1970.
5. The Threshold Limit Value is 15 mg/m3 for Nuisance Particulates from
the Occupational Safety and Health Standards Subpart Z - "Toxic and
Hazardous Substances," May 28, 1975,
6 . The Maxinum Permissible Concentration values are given in "Standard
for Protection Against Radiation," Code of Federal Regulations, Title 10,
Part 20, Appendix S (April 30, 1975) (10 CYR 201, for an insoluble
radionuclide in air in an uncontrolled area.
7. "Specifications for Standard Man," as given in the Radiological Health
Handbook, January, 1970.
8. Report of Committee I1 of.Pemissible Dose from Internal Radiation (1959)
International Committee on Radiological Protection (ICRP).
9. This is the maximum permissible bone burden for 226~a as found in the
Report of Committee 11 of Permissible Dose from Internal Radiation (1959)
International Committee on Radiological Protection (ICRP).
DRAFT COPY

FINDINGS
A comprehensive r a d i o l o g i c a l survey was completed a t the Kent Chemical
Laboratory, Univers i ty of Chicago, Chicago, I l l i n o i s . General radiochemistry
and/or physics research was performed a t t h i s f a c i l i t y during t h e MED/AEC
e r a i n t h e 1940's. The bu i ld ing i s now i n use a s l a b o r a t o r i e s , o f f i c e s
and classrooms.
Instrument and smear surveys i n d i c a t e t h a t some contamination is
still present i n t h i s f a c i l i t y . Most of t h e contamination consis ted of
small s p o t s of a c t i v i t y on t h e f l o o r s and wa l l s .
Personnel involved wi th t h i s f a c i l i t y during the MED/AEC r e c a l l t h a t
plutonium, radium, and uranium were used i n Kent Laboratory. Since t h e
a c t i v i t y could no t be i d e n t i f i e d and i t was known t h a t radium and plutonium
w e r e used, t h e acceptable s u r f a c e contamination l i m i t s f o r Radium-226 and
Plutonium-239 a s given i n t h e proposed ANSI Standard N13.12 f o r t h e con t ro l
of r ad ioac t ive su r face contamination of f a c i l i t i e s a r e used a s guidel ines .
I n accordance wi th t h e proposed ANSI Standard of f a c i l i t i e s t o be re leased f o r
uncontrolled use , eleven rooms were found t o be i n excess of t h e al lowable
limits f o r Group 1 nuclides. Smears of these a r e a s i n d i c a t e t h a t t h e contami-
na t ion i s i n some spo t s removable, b u t i n most ins tances , f ixed . .
Radon concentra t ions w e r e determined a t s e l e c t e d sites including a reas
where contamination was found. The a i r sample d a t a i n d i c a t e s normal radon
concentrat ions.
S o i l samples were taken about t h e grounds of Kent Laboratory t o
determine t h e depos i t of any radionucl ides t h a t could have been s p i l l e d
o r re leased. Resul ts of t h e s o i l sample analyses show no e levated readings
above t h e n a t u r a l background l e v e l s found i n t h e s o i l .
DRAFT COPY

COPY DRAFT

DRAFT COPY


DRAFT COPY

FIGURE 1E - ATTIC ANL-HP DWG. NO. 78-29
n SMEAR @ OVERHEAD SMEAR a DIRECT AND/OR SMEAR READING ABOVE BACKGROUND
A AIR SAMPLE
0 FEET ' 50
0 METERS 15

DRAFT COPY

FIGURE 2
SOIL ShMPLING PROCEDURE AND PROCESSING DIAGRhM
GROUND LEVEL
ANL- HP -0WG. 78-2
WEIGHT I DRY WEIGHT B A L L
(WET) 80°C (DRY MILLED .+
WEIGHT \ B A 100s GecLiIGAMMA OF
SPECTRUM 'ANALYSIS PRODUCT C A N D I _
URANIUM FLUOROMETRlC S i EVE 600
15 CM B,C,D 109 URANIUM MICRON
WEIGHT FLUOROMETRIC ONLY ROCKS -
n

- k - - g c -
m -. 0: G g w g g z - g M Y - ...
C 1 e -
C: = = z Z Z Z Z
1 1 .
DRAFT COPY
. C C C v O r l U
4 4 2 u U Y U a n w -,+ - ' 0 b 0 a u m I- c
C 0 w u U C a 0 9 rl L > f C U 4 0 + a n U U h 3 4 c i ) r u 3 L . L.
gs P U V m + U c U U 0 . U u .-( n Ern u i l M E a h U U U W
2: w 0 z u 2 " O U a m d L. w u 2 ; z m a U C C I. O C 4 w 0 -
'0 < C Y m a - " 0 ) '0Y U L . 0 3 w U O Y O u z
. o m wen ' D O - a
E S O 0 m u v e .c S'; P ' a n 5 9 Y U v z V ) O m
o e 2 n -. rn V Y

- - 0 C --' n - < 2
-J 2, II1c - Y 0 7 - "I. 3 3 u " 5 U U v = U r n 3 w 0 0 - 3
u E 2 : - 0 0 - 2;: g Y ." 5: Y O a W = -3. z n r z1
r 9 1 u 0 01 .': U 0 5: A.8
U C 0
c u .d
0 0 C
5 . 0 01 F. L1 o C . 0 - U L - 01 9 0 L. n m
m 2 0 0 > u 0 01 .- n c -J
O m Y" v n 0 u s 2 U X U 0 0 1 " 11 > w m 3 3 9
7. m 3 ' X 1 1 0 X U 4" s ; 5 E 2 ; U O Y U a x o w n c c
a 3 sea o m
- 0 " 3 U G rr
" 2 6 %; 3: $ 5 -- U r n S P u s: z a
d= v Y Y Y C
P 3 E z a
ZP Z B
DRAFT COPY

- u
4 0 = - z
m - a a!* - U k m w a = 2 g: :- a s 'CI el
H 21. 0 Y U 9 u > B * 0
-a 2
h 4 g .
h 2: :4 i z 2P 3 ; U n a = $ 3 03 m =
'" g = - 0 I w e 2 - 2 2 a u 9 L :a g.: Pg I$ u u + C s.. gs - u n B -I% -
W h V w
I m c- 0 4 %
U E U L. r( -2 C :
2 m e -
h E lu e
c = z 3 ; c i C z u u
g-,z S:
w
j 5 A & -E
2 " - c m e , a N
W I C
:Eg 5 D
a 2 0 " j"5 g I I
u 0 0 U o m m fi -- f -
m
- - c m 3 4 c - - c14 4 9
ID N a 4 m u C Y Y
a 5 0 0 8 8 8 6 8 8 8 8 8 u o s e g g g 0 2 2 2 8 - * u - 0 Y..
Z 8t
DRAFT COPY

INSTRUMENTATION USED I N SURVEY
E b e r l i n e F loor Monitor U t i l i z i n g a PAC-4G3
E b e r l i n e F loor Monitor u t i l i z i n g a PAC-4G3
E b e r l i n e PAC-4G3
E b e r l i r e PAC-4G3
TABLE 2
Inven to ry Number
181501
E b e r l i n e 530 w i t h HP 190 Beta-Gaima End Window
Nuclear Xeasurenent Corp . PC-5-2ii I n t e r n a l Gas Flow Cocnter
Argonne Nat iona l Laboratory F i l t e r Queen Ai r Sampler u s ing HV-70 f i l t e r media
Argoane Nat iona l Laboratory 10-Wire F l a t P l a t e Gas P r o p o r t i o n a l De tec to r
DRAFT
Probe Window De tec t ion Area Thickness
COPY

1:
I ' I::
Instrument
Ebe r l ine F loo r Monitor FM-4G us ing PAC-4G-3
E b e r l i n e PAC-4G3
TABLE 3
E b e r l i n e 530 w i t h HP 190 Beta-Gamma End Window
INSTRUMENT BACKGROUND READINGS
Readings* 1 meter above Alpha Mode(c/min) Beta ode (clmin) f l o o r mR/h
Nuclear Measurement Cor- 0 .3 p o r a t i o n PC-5-2~ I n t e r n a l Gas F low Counter
Argonne Na t iona l Labora tory 1 0 10-Wire F l a t P l a t e Gas P r o p o r t i o n a l De tec to r w i t h Ebe r l ine Mini S c a l e r 3s-2
150 - 200 150 - 200 150 - 200 150 - ZOO 150 - 200 150 - 200
*Background r ead ings were i n i t i a l l y taken i n t h e mobi le l a b o r a t o r y and rechecked throughout t h e v a r i o u s a r e a s i n s i d e Kent Labora tory w h i l e surveying.
DRAFT COPY

TABLE 4
RADON CONCENTRATION DETERMINATIONS
Locat i o n
Room 1
Roon 2
Room 4
Room 8
Room 14
Roon 1 8
1st F loo r Cor r ido r
Roon 1 0 1
Roon 102
Room 109
2nd Floor Cor r ido r
Room 201
Roon 209
3rd Floo r Cor r ido r
Roon 305
Fan ROOD
*The 1 0 CFR 20 X?C f o r 2 2 2 ~ n f o r an uncon t ro l l ed a r e a i s
3 X v C i / d which equals 3 p ~ i / R .
Exaciple C a l c u l a t i o n - Room 1 8 :
COPY DRAFT

TABLE 5
SOIL SAMPLE WEIGHTS
Net Weight Dry Weight Sieved Weight ' R o c k s & Dross Sample No. (grams) (grams) (grams) Weight (grams)
KC- 1A
KC-1B
KC-1C
KC-ID
DRAFT COPY

TABLE 6
Ge(L i ) SPECTRUM AND URANIUM FLUOROMETRIC ANALYSES RESULTS
Sample No.
Ge(Li) Spec t r a pCi/g received w t + a (1)
7 ~ s 2 3 2 ~ h Decay 2 2 6 ~ a Decay Chain Chain Uranium
vg/g -+ 0 ('I p c i / g * o (3) -
KL- 3A
KL- 3B
KL-3C
KL-3D
LFE Blank 0.00 2 0.4
(1) One standard d z v i a t i o n due t o count ing s t a t i s t i c s .
(2) Data results f r o a LFE.
(3) conversior? fros Appendix 4.
DRAFT COPY

TABLE 7
BACKGROUND SOIL SAMPLE DATAn
Cesium-137, Thorium, and Uranium in Soil 1976
concentrations in pCi/g
Date Collected ' Location Cesium-137 Thorium-232 Uranium
July 22 Argonne Area 0.3 +_ 0.1 0.21 +_ 0.04 1.3 + 0.1
July 22
July 22
October 18
Argonne Area
Argonne Area
Argonns Area
October 18
October 18
Argonne Area
Argonne Area
Average
Off-Site
June 22 McKinley Woods State Park, IL
June 23 McCormick Woods 0.3 t 0.1 Brookfield, IL
June 23 Bemis Woods Hinsdale, IL
October 12 St. Joseph, M I
October 13 Willow Springs, IL
October 14 Dresden Lock & Dam, IL
Average
*These results are transcribed from "Environmental Monitoring at Argonne National Laboratory Annual Report for 1976" (AN.,-77-13) by N. W. Golchert, T. L. Duffy and J. Sedlet. These measurements are presented in Table 13, on Page 47 of the report.
DRAFT COPY

APPENDIX 1
CONVERSION FACTORS
INSTRUMENTATION
Below are the conversion factors used to obtain the readings in units of disintegrations per minute per 100 cm2 (dis/min - 100 cm2).
I Conversion Factors
Floor Monitor (FM-4G)
Alpha Beta Alpha Beta -
c/min to dis/min for 90sr-9Dy
c/min to dis/min for 2 3 9 ~ ~
c/min to dis/nLn for 226~a + daughters
I1 Deriviation of Conversion Factors
Floor Monitor ( F Y - 4 G )
Window Area: -325 cn2
Conversion to 100 cm2 = .31 times floor monitoring reading
PAC-4G3
Window Area: -51 cn2
Conversion to 100 cm? = 1.96 times PAC reading
27r Internal Gas Flow Counter, PC-5
Geometry: Solid Stainless Steel Spun Top - 0.05 Geometry: Mylar Spun Top - 0.43
Mylar Spun Top Counting (window double aluminized mylar -0.85 mg/cm2) utilizes the well of the PC-5 and is a method developed and used by the Argonne National Laboratory Health Physics Section for negating the dielectric effect in counting samples on non-conducting media.
Using 2n infinitely thin Radiw-226 + daughters standard as a source of radium alpha e~ssions, the source w2s counted in the well of a 27r internal gas flow counter, PC-5, with the source leveled to an apparent 27r geometry.
The alpha c/nin was found to be 20454 or 20454/0.5 = 40909 dis/min.
DRAFT COPY

APPENDIX 1 (contd)
a.
Using t h e PAC-4G-3 and t h e radium s o u r c e t o conve r t coun t s p e r minute (clmin) t o d i s i n t e g r a t i o n s p e r minute ( d i s / m i n ) , t h e count was found t o b e 12000 c / e n a t con tac t , t h e r e f o r e 40909/12000 = 2.0 ( d i s / n i n ) t o (clmin).
- The same source covered wi th 2 l a y e r s of conduct ing paper , each 6.65 mg/cm2 t o negate t h e a lpha emiss ions , was counted f o r composite b e t a and gamma emissions i n t h e PC coun te r . The sou rce was l e v e l e d t o an appa ren t 50% geometry; however, no p rov i s ion was made f o r b a c k s c a t t e r .
The composite beta-gamma count was found t o b e 6836 c/min o r 68361.5 = 13672 dis lmin.
With the PAC-4G3 i n t h e b e t a mode and i n c o n t a c t w i t h t h e covered sou rce .
and on t h e probe, t h e coun t was 10000 c/min. Th i s i n d i c a t e s a conversion - f a c t o r 13672110000 = 1.4 ( d i s / n i n ) t o (c/mZn).
SMEBR COUNT
The conversion f a c t o r s f o r c/min - 100 cm2 t o d is /min - 100 cn2 a r e given below.
I CONVERSION EQUATION (ALP=)
'Imin - tBkgd) = dis lmin Alpha
g bf - s a - waf
A geometry (g) of 0.43 i s s t anda rd f o r a l l f l a t p l a t e counting. . ,
A b a c k s c a t t e r f a c t o r ( b f ) of 1 .0 i s used when de termining a l p h a a c t i v i t y on a f i l t e r media.
The se l f - abso rp t ion ( sa ) was assumed t o be 1 u n l e s s o therwise determined.
I f t h e ene rg i e s of t h e i s o t o p e were known, t h e a p p r o p r i a t e window a i r f a c t o r (waf) was used; i f t h e e n e r g i e s of t h e i s o t o p e s were unknown t h e waf of Plutonium-239 which i s .713, was used.
c lmin - (Beta Bkgd + Alpha clmin) = dis/min Beta
g . bf - s a . waf
A geometry (g) of 0 .43 i s s t anda rd f o r a l l f l a t p l a t e counting.
A b a c k s c a t t e r f a c t o r (bf) of 1.1 i s used when determining b e t a a c t i v i t y on a f i l t e r media.
The se l f - abso rp t ion ( s a ) w a s assumed t o be 1 u n l e s s o the rwi se determined.
I f t h e e n e r g i e s of t h e i s o t o p e s were kno-a , t h e a p p r o p r i a t e window a i r f a c t o r (waf) was used; i f t h e z n e r g i e s of t h e i s o t o p e s were unknown, t h e waf of Strontium-90-Yttrium-90, which i s 0.85 was used.
DRAFT COPY

APPENDIX 2
RADON DETERMINATION CALCULATIONS
Th i s at tachment summarizes t h e b a s i c assumptions and c a l c u l a t i o n methods used f o r samples c o l l e c t e d u s i n g Argonne Na t iona l Laboratory designed a i r sampler wi th HV-70 f i l t e r media.
I. Radon concen t r a t ions Based on RaC1 R e s u l t s
The fo l lowing p o s t u l a t e s a r e assumed i n d r i v i n g t h e radon ( 2 2 2 ~ a ) concen- t r a t i o n s a s based on t h e RaC' a l p h a coun t r e s u l t s .
1. RaA, RaB, RaC, RaC', a r e i n e q u i l i b r i m .
2. Pa-4 i s p r e s e a t on ly i n t h e f i r s t count and n o t t h e 100 minute decay caunt .
3 . That one-half of t h e radon proseny i s n o t adhered t o a i r b o r n e p a r t i - c u l a t e , and t h e r e f o r e , n o t c o l l e c t e d on t h e f i l t e r media.
4 . The geometry f a c t o r (g) i s 0.43 f o r bo th t h e a lpha and b e t a a c t i v i t y .
5. The b a c k s c a t t e r f a c t o r ( b f ) of 1 .0 i s used f o r t h e a lpha a c t i v i t y which i s determined from R a C ' .
6. The sample abso rp t ion f a c t o r (sa) f o r REC' i s 0 .77 .
7. The window a i r f a c t o r (waf) f o r RaC' i s 0.8.
8. RaB and RaC be ing b e t a e m i t t e r s , a r e n o t connted i n t h e a lpha mode.
9. The h a l f - l i f e of t h e radon progeny i s a p p r o x i m t e l y 36 minutes , based on t h e combined RaB and RaC h a l f - l i v e s .
10. No long-l ived a l p h a emitters p r e s s n t as evidenced by t h e f i n a l recount .
11. For a l l p r a c t i c a l purposes, RaC' decays a t t h e r a t e of t h e composite of RaB and RaC which is a p p r o x i m t e l y 35 minutes .
I . Equations Gsed t o Der ive A i r Concen t r a t ions
Where: 3 o = A c t i v i t y p r e s e n t a t t h e end of t h e sampling per iod ( d i s / n i n )
A = A c t i v i t y a t some t ime, a f t e r end of sampling (d is lmin)
t = T i ~ e i n t e r v a l from end of sampling pe r iod t o s t a r t of count ing i n t e r v a l ( m i n )
DRAFT COPY

APPENDIX 2 (contd)
RADON DETERMINATION CALCULATIONS
6 93 =L t
% t = H a l f - l i f e of i s o t o p e o r c o n t r o l l i n g parent . (min)
%
Where: = Concent ra t ion ( d i s / m i n - m3) '
A = A c t i v i t y of f i l t e r media a t end of sampling pe r iod (d i s lmin ) 0
f = Sampling r a t e (m3/min) = (33/h - 1 h/50 n in )
t = Length of sampling t ime (min) S
.693 = - t
% t = H a l f - l i f e of i s o t o p e o r c o n t r o l l i n g pa ren t (n in ) S
, '
I 111. Example C a l c u l a t i o n - Room 18 -
DRAFT COPY

SOIL AXALYSIS PROCEDURE FOR
TOTAL URAN1LJI.I AND Gk'MA-EMITTING NUCLIDES
Summary of Methods
A 6 0 - m i l l i l i t e r volume of t h e rece ived s o i l was c o u ~ t e d i n a p e t r i
d i s h f o r 500 minutes on a Ge(Li) d e t e c t o r over t h e energy range 0 - 1 .5 MeV.
Thi s corresponded t o between 60 t o 100 g of s o i l , depending upon bulk s o i l
dens i ty . P o s i t i v e photopeaks above ins t rument background were converted t o
d i s fmin using e l i n e e f f i c i e n c y cu rve based upon a Na t iona l Bureau o f S tandards
Mul t i s tandard . The n a t u r a l Thori-m-232 and R2diurn-226 decay chains
were c a l c d a t e d us ing t h e 0.910 MeV Actinium-228 and 0.609 MeV Bismuth-214
photopeaks r e s p e c t i v e l y . Cesiun-137 i s r e p o r t e d f o r each s a n p l e as a repre-
s e n t a t i v e g m e n i t t e r . Po ta s s im- tO was observed on a l l s o i l samples, a s
expec ted , but was n o t c a l c u l a t e d o r r epo r t ed .
One gram of th2 s o i l sample was ashed and d i s s o l v e d i n HF-XN03 f o r t h e
t o t a l u rea im a n a l y s i s . A 100-X aliquot of t h e d i s so lved sanp le was fused
w i t h 984 SaF-2% L i F and t h e f luo rescence determined us ing a Ja r r e l l -Ash f luo ro -
meter. A quenching f a c t o r was determined f o r each sample by us ing a n i n t e r n a l
sp ike .

APPENDIX 4
NATURAL URANIUM CALCULATIONS
Rad ioac t ive h a l f - l i v e s of 2 3 4 ~ , 23%J and 2 3 8 ~ a s w e l l a s t h e pe rcen t
abundance f o r each i s o t o p e w e r e ob ta ined as c u r r e n t b e s t v a l u e s ' f r o m the
"Table of I so topes" - 6th E d i t i o n by C. M. Lede re r , J. M. Ho l l ande r and
I. Perlman, 1967. The fo l lowing v a l u e s used a r e :
I s o t o p e
2 3 4 ~ h a l f -1 i f e
3 5 ~ h a l f - l i f e
3 8 ~ h a l f - l i f e
Half -1if e
2.47 x l o5 y e a r s
7.1 x l o 8 y e a r s
4.51 x l o9 y e a r s
% Abundance
0.0057
It should be noted t h a t t h e abundance t o t a l s 100.0013%. S i n c e i t
cannot b2 setermined which v a l u e ( s ) a r e i n e r r o r , t h e c a l c u l a t i o n s a r e
made wich t h e .0013% e r r o r n o t accounted f o r . T h i s e r r o r makes no p r a c t i c a l
d i f f e r e n c e i n t h e r e s u l t s .
SpA = S p e c i f i c A c t i v i t y
Avogadro's Number used = 6.025 x
Avogadrot s Number N = Number of r a d i o a c t i v e atoms p e r u n i t mass = gram a tomic weight
t, = H a l f - l i f e i n y e a r s ( a ) 5
SpA = 0.693,. 6.025 s (2) 5.256 x 10s mln - grain atomic weight + (-1 a
SPA 2 3 4 ~ = . 693 6.025 x = 1.374 x 1 0 l 0 d is /min - 2 . 4 7 x l o 5 - 5.256 x l o 5 . 2 .34 x 102 gram
= 1.374 x l o 4 d is /min - pgraa . 5.70 x 10-5 = .783 d is /min - pgram of n a t u r a l uranium

APPENDIX 4
(con td )
NATURAL URANIUM CALCULATIONS
SpA 2 3 5 ~ = .'693 6.025 x = 4-76 x lo6 dis/min - gram
7.1 x-lo8 5.256 x lo5 2.35 x lo2
= 4.76 dis/min - pgram 7.196 x = 0.34 dislmin - pgram of natural uranium
SpA 2 3 8 ~ = -693 . 6.025 x loz3 = 7.4 x lo5 dis/min - gram
4.51 x lo9 5.256 x lo5 - 2.38 x lo2
= .74 dis/rnin - pgran 9 . 9 2 7 6 x 10-I = .735 disjmin - pgram of natural uranium
Therefore, the activity of 1 pgram of natural uranium is
- - 1.552 dis/min - pgram = .6991 pCi/vgram natural uranium 2.22 dis/min - pCi
Conversion of pg/gn to p~i/g
Example Calculation KC - 1A
0*6991pCi = 3.4 5 0.3 pCi/gram gram Ugram
DRAFT COPY

PERTINENT RADIOLOGICAL REGULATIONS,
STANDARDS AND GUIDELINES


Where p o t e n t i a l l y contaminated s u r f a c e s a r e not a c c e s s i b l e f o r measurement ( as i n some p ipes , d ra ins , and ductwork) p such proper ty s h a l l n o t be re leased Pursuant t o t h i s s tandard , bu t s h a l l be made the s u b j e c t of case-by-case evaluat ion.
Proper ty s h a l l not be re leased f o r uncontrolled use un less measurements show t h e t o t a l and removable contamination l e v e l s t o be no g r e a t e r than the values i n Table 1 o r Table 2. (The va lues i n Table 2 a r e e a s i e r t o apply when t h e contaninants cannot .be ind iv idua l ly i d e n t i f i e d . )
Coatings used t o cover the contamination s h a l l not be considered a so lu t ion t o t h e contamination problem. That is, t h e monitoring techniques s h a l l be s u f f i c i e n t t o determine, and such de te rn ina t ion s h a l l be made, t h a t the t o t a l amount of contamination p resen t on and under any coat ing does not exceed the Table 1 o r Table 2 vzlues before r e l e a s e .
DRAFT COPY

TABLE 1
SURFACE CONTAMINATION LIMITS"
Limit (Activity) Contaminants (dpm/100 crn2t)
Total Nuclides , (Fixed plus (Note 1) Removable Removable) Group Description
1 Xuclides for which the' nonoccupational MPCa (Note 2) is 2 x-10-l3 ci/m3 or less or for which the nonoccupational
HPC, (Xote 4) is 2 x lo-' ci/m3 or less
2 Those nuclides not in Croup 1 for which the nonoccupational MPCa (Note 2) is 1 x 10-l2 ci/n3 or less or for which the nonoccupational tpcW (Note 4 ) is 1 x 1 T 6 ci/n3 or less
Those nuclides not in Croup I or Group 2
Nondetectable (Note 3)
2930 a Sondetectable 6, y
(Note 5)
<:The levels may be averaged over one square neter provided the naximun activity in any area of 139 cm2 is less than three tines the limit value. For purposes of averaging with regard to isolated spots of activity, any square neter of surface shall be considered to be contaninated above the limit L , applicable to 109 cm2 if (1) from measurements of a representative nun5er r, of sections it is detemined that l/n 1, Si 2 5 , where Si is the dprn/l03 ca2 deternined from measurement of section i; or (2) it is deternined that the activity of all isolated spots or particles in any are2 less thzn 109 ca2 exceeds 35.
tDisintegrations per minute per square decimeter.
NOTES : (1) Values presented here are obtained from the Code cf Fe&??al R e ~ d t a t i o n s , Title 10, Part 20, April 39,
1975. The most limiting of all given MPC values (for exazple, soluble versus insoluble) are to be used- In the event of the occurrence of mixtures of radionuclides, the fraction contributed by each constituent of its own limit shall be determined and the sum of the fractions shall be less than 1.
( 2 ) )faximum 2ermissible concentration in air applicable to continuous exposure of members of the public as published by or derived from an authoritative source szch as the Sational Connittee on Radiation Protection and Xeasurements ( N C R P ) , the International Commission on 2adiological Protection ( ICXI ' ) , or the Nuclear Regulatory Comission (1i'P.C). From the Code of Fe2ercl ?epLctins, Title 10, Part 2 0 , Appendix B, Table 2, Column 1.
(3) The instrment utilized for this measuresent shall be calibrated to measure at least 100 pCi of 'any Group-1 contaminants uniformly spread over 199 cc2.
( 4 ) Maximu-, permissible cor.centration in water appliczble to zenbers of the public.
(5) The instrument utilized for this measurement shall be calibrated to measure at least 1 nci of any Group-2 beta or gacaa contaminants uniformly spread over an area equivalent to the sensitive area of the detector. Direct survey for unconditional release should be performed in areas where the background is
103 counts per minute. \%en the survey must be perforned in a Sackground exceeding 100 COcntS per - minute, it may be necessary to use the indirect survey method to provide the additional sensitivity required
DRAFT COPY

TABLE 2
AtTERNATE SURFACE CONTAMINATION LIMITS .
(All Alpha Emi t te r s , except U and Thnat, Considered a s a Group)* n a t
Limit (Act iv i ty ) '
(dprn/100 cm2) t
T o t a l (Fixed p l u s
Contanination C ~ n ~ i n g e n c i e s Removable Removable)
I f t h e contaminant cannot be i d e n t i f i e d ;
o r i f a lpha e m i t t e r s o t h e r than U na t
(Note 1) and Th a r e p r e s e n t ; o r i f n a t
t h e be ta e m i t t e r s comprise 2 2 7 ~ c 22 5R,
If i t is knokn t h a t a l l a lpha e m i t t e r s a r e
geaerated f ron U (Note 1 ) and Th - na t n a t '
an.' i f b e t a e d t t e r s a r e p resen t t h a t ,
z h i i e n o t i d e n t i f i e d , do nor i n c l u d e
227.4c, l Z 5 1 , 2253.2, and 2 2 8 ~ a
I f i t is k ~ ~ o v a t h a t a lpha e m i t t e r s a r e
Nondetectable (Note 2)
2000 a Xondetectable 8. y
(Note 3)
generated only from U ( ~ o t e 1 ) n a t
2 ~ d Th i n equ i l ib r izm wi th i t s Ii2 t
decay produc ts ; and i f t h e b e t a
e d t t e r s , whi le not i d e n t i f i e d , do
not inc lude 2 2 7 ~ c , 1251, 1291; 905r,
2 2 3 k , 22ERa, 1261, 13II, and 1 3 3 *
*The l e v e l s m y be avaraged over one square meter provided t h e naxizua a c t i v i t y i n acy a r e a of 100 cnZ i s l e s s than t h r e e t i n e s t h e l i n i r value. Fo r purposes of averaging k i t h regard t o i s o l a t e d s p o t s of a c t i v i t y , any squzre meter of s u r f a c e s h a l l be considered t o be contaminated above t h e l i n i t L , a p p l i c a b l e t o 100 cm2, i f (1) f r o = neasurements of a r e p r e s e n t a t i v e number r! of s e c t i o n s i t i s determiied thac l / n 1, Si 2 L, where S i i s t h e dpm/100 cn2 determined f r o n measureneat of s e c t i o n i; o r (2) i t i s determined t h a t t h e a c t i v i t y of a l l i s o l a t e d s p o t s o r p a r t i c l e s i n any a r e a l e s s than 100 cm2 exceeds 3L.
+Dis in tegra t ions per d n u t e per square d e c i z e t e r
FOTES: (1) Unit a ~ d decay products .
(2) T i e i z s r r - a e n t u t i l i z e d f o r t h i s cezsurmeii: s h a l l be c a l i b r a i e d t o measure a t l e a s t 103 pCi cf aay Grou2-1 contan inar ; :~ u n i f o d y spread over 100 cm2.
(3 ) The instr;;lext u t i l i z e d f o r t h i s neasurezen t s h a l l be c a l i b r a t e d t o measure a t l e s t 1 nCi of a::; Group-2 be ta o r gama c c ~ : s ~ i n a a t s ur.ifornly spread over an a r e a equivalen: t o t h e s e n s i t i v e a r e a of t h e d e t e c t o r . D i r e c t survey f o r uncondi t iona l r e l e a s e shoul5 be peyformed i n a r e a s where t h e background is 1 100 counts per minute. When t h e s u x e y x u s t be perforned i n a background exceeding 100 coc2ts per minute, i t C ~ Y h e necessary ro use t h e i n d i r e c t survey netnod t o provide t h e a d d i t i o n a l sens i - t i i i t y r e q u i r d .
DRAFT COPY

G U I D E L I N E S F O R DECONT.4MINATION O F F A C I L I T I E S AND EQUIPKENT
P R I O R TO R E L E A S E FOR UNRESTRICTED USE
OR TERMINATION O F LICENSES F O R BY-PRODUCT, SOURCE,
OR S P E C I A L NUCLEAR MATERIAL
U . S . N u c l e a r R e g u l a t o r y C o m i s s i o n D i v i s i o n of F u e l C y c l e a n d Placerial Safety W a s h i n g t o n , D.C. 20555 .
N o v e m b e r 1976
DRAFT COPY

The i n s t r u c t i o n s i n t h i s guide i n conjunct ion wi th Table I s p e c i f y t h e r a d i o a c t i v i t y and r a d i a t i o n exposure r a t e l i m i t s which should b e used 1?10114 i n accomplishing t h e decontamination and survey of su r faces o r premises and equipment p r i o r t o abandonment o r r e l e a s e f o r u n r e s t r i c t e d use . The limits i n Table I do n o t apply t o premises , equipment, o r s c r a p conta in ing induced r a d i o a c t i v i t y for which t h e r a d i o l o g i c a l considera- t i o n s p e r t i n e n t t o t h e i r u s e may be d i f f e r e n t . The r e l e a s e of such f a c i l i t i e s o r i tems from regu la to ry c o n t r o l w i l l be considered on a case-by-case b a s i s .
1. The l i c e n s e e s h a l l make a reasonable e f f o r t t o e l imina te r e s i d u a l contamination.
2 . Radioact iv i ty on equipment o r s u r f a c e s s h a l l n o t be covered by p a i n t , p l a t i n g , o r o t h e r cover ing m a t e r i a l u n l e s s contamination l e v e l s , a s determined by a survey and documented, a r e below t h e limits s p e c i f l e d i n Tahle I' p r f o r t o applying t h e covering. A reasonable e f f o r t must be made t o minimize the contaninat ion p r i o r t o u s e of any- covering.
The r a d i o a c t i v i t y on t h e i n t e r i o r s u r f a c e s of pipes., d r a i n l i n e s , duck work s h a l l be determined i5y making measurements at a l l t r a p s , and o t h e r a p p r o p r i a t e access p o i n t s , provided t h a t contsmination a t these l o c a t i o n s i s l i k e l y t o b e r e p r e s e n t a t i v e of contamination on t h e i n t e r i o r of t h e p i p e s , d r a i n lices, o r duct work, Surfaces of premises, equipment, o r sc ra? which a r e l i k e l y t o be contaminated but a r e of such s i z e , c o n s t r u c t i o n , o r l o c a t i o n a s t o z k e t h e s u r f a c e i n a c c e s s i b l e f o r purposes of Eeasurenent s h a l l 6 e presumed t o be contaminated i n excess of t h e linits.
4 . Upon reques t , t h e Conmission mzy a u t h o r i z e e l i c e n s e e t o r e l i n q u i s h possession or c o n t r o l of presl ises, equipnent , o r scrap having s u r f a c e s contaninated wi th m a t e r i a l s i n excess of t h e l i n i t s s p e c i f i e d . This may include, b u t would not b e l i in i t ed t o , s p e c i a l circumstances such a s r az ing of h u i l d i n g s , t r a n s f e r of p r w s e s t o another o rgan iza t ion continuing work w i t h r a d i o a c t i v e m a t e r i a l s , o r conversion of f a c i l i t i e s t o a long-term s t o r a g e o r s tandby s t a t u s . Such reques t must:
a. Provide d e t a i l e d , s p e c 2 f i c i n f o r n a t i o n desc r ib ing t h e premises, equipment o r s c r a p , r a d i o a c t i v e contaminants, and t h e n a t u r e , e x t e n t , and degree of r e s i d u a l s u r f a c e contaninat lon.
b. Provide a d e r a i l e d h e a l t h and safety a n a l y s i s wfilch r e f l e c t s t h a t t h e r e s i d u a l amounts of =terials- on s u r f a c e a r e a s , toge the r wi th o t h e r c o n s i d e r a t i o ~ l s s u c k a s prospect ive use of the p r e n i s e s , equipment o r s c r a p , a r e u n l i k e l y t o r e s u l t i n a n unreasonable r e s k t o the h e a l t h and s a f e t y of t h e pub l ic .
DRAFT COPY

5. P r i o r t o r e l e a s e of premises f o r u n r e s t r i c t e d use , t h e l i c e n s e e s h a l l make a comprehensive r a d i a t i o n survey which e s t a b l i s h e s t h & z ~ ~ 8 ~ b contamination is w i t h i n t h e l i m i t s s p e c i f i e d i n Table I. A copy of the survey r e p o r t s h a l l b e f i l e d wi th t h e Divis ion of Fuel Cycle and Mater ia l Sa fe ty , USXRC, Washington, D.C. 20555, and a l s o t h e Di rec to r of the Regional O f f i c e of t h e O f f i c e of Inspec t ion and. Enforcement, USNRC, having j u r i s d i c t i o n . The r e p o r t should be f i l e d a t l e a s t 30 days p r i o r t o t h e planned d a t e of abandonment. The survey r e p o r t s h a l l :
a . I d e n t i f y t h e premises.
b. Show t h a t reasonable e f f o r t h a s been made t o e l i m i n a t e r e s i d u a l contamination.
c. Descri'he t h e scope of t h e survey and genera l procedures followed .
d . S t z t e t h e f i n d i n g s of t h e survey i n u n i t s s q e c i f i e d i n t h e i n s t r u c t i o n .
Fol lobizg rcview of the r e p o r t , t h e NRC w i l l consider v i s i t i n g t h e facilities t o confirin t h e survey.
DRAFT COPY

ACCEPTAULE SUR1:ACE CONTAMTNAl'ION LEVELS
b c f b d f REMOVABLE b e f NUCLIDES a AVERAGE MAXIMUM
U-nnt, U-235, U-238, and 5,000 dpm all00 em2 15,800 dpm a/100 cm2 1 ,000 dpm allOD em2 nssucla tcd decay produe t e
Beta-gnmmn m l t t e r s ( n u c l l d c s w i t h decay modce u t l ~ a t than alpho cmirraion o r spontonc-ous fisslun) Except Sr-90 and otljcr nutcd nl~ovo.
15,000 dpr fly/ 100 em2 1 ,000 dprn Ba/100 cm2
% e r e s u r f n e a con tomina t ion by both alpha- and beta-gamma-emlttlng n u c l i d e s e x i s t s , t h e l i m i t s c s t o b l i s l l e d f o r alpha- and beta-gamma-emitting nuclide8 ehctuld apply i n d e p ~ n d c n t l y .
'AS used i n this Table, dpm [disintegratians per minute) means t h e r o t e of emiss ion by radioactive m a t e r i a l a s deterui ined by correcting t h e count6 per minute observed by an n p p r o p r i o t e d e t e c t o r f o r bnckground, e f f i c i e n c y , nnd g e o m e t r i c f a c t o r s a s s o c i a t e d w i t h the instrumencation.
C ~ s n 8 u r c m c n t s n l average aontsminant ahould not be averaged o v e r TIIOI-e tlinn 1 a q u a r e meter . Fo r o b j e c t s of less s u r f a c e o r e n , the avctnge should be derived for each such o b J e c t .

DRAFT COPY