Religare Enterprises Limited · These statements include descriptions regarding the intent, belief...
40
Religare Enterprises Limited Q4 and FY11 Results 25 May 2011
Transcript of Religare Enterprises Limited · These statements include descriptions regarding the intent, belief...

Religare Enterprises LimitedQ4 and FY11 Results
25 May 2011

1
This presentation has been prepared by Religare Enterprises Limited (the “Company”) solely for use at its analyst conference call on May 25, 2011.
The material that follows is a presentation of general background information about the Company’s activities as at the date of the presentation and a summary of the unaudited reviewed financial statements of the Company as at and for the year ended March 31, 2011. It is information given in summary form and does not purport to be complete, is subject to change without notice and cannot be guaranteed. The unaudited financial statements have been prepared on a basis consistent with the audited financial statements of the Company. However, the actual audited financial statements of the Company as at and for the year ended March 31, 2011 may differ from the unaudited financial statements for the same period.
This presentation contains statements that constitute forward-looking statements. These statements include descriptions regarding the intent, belief or current and future expectations of the Company and/or its officers with respect to its consolidated results of operations and financial condition, and events and plans of the Company on a consolidated and/or standalone basis. These statements can be recognized by the use of words such as “expects,” “plans,” “will,” “estimates,” “projects,” or words of similar import. Such forward-looking statements are not guarantees of future performance and involve risks and uncertainties, and actual results may differ significantly from those in the forward-looking statements as a result of various factors and assumptions, not all of which is under the Company’s control. The Company does not undertake to revise forward-looking statements to reflect future events or circumstances.
This presentation is for information purposes only. It is not intended to be relied upon as advice to potential investors, and shall not constitute an offer or invitation, or solicitation of an offer, to subscribe for or purchase any securities. The possession, circulation or distribution of this presentation may be restricted in your jurisdiction. You are required to inform yourself about and observe any restrictions relating to any such restrictions or an investment by you in the securities of the Company or its subsidiaries. This presentation may not be reproduced or redistributed to any other person. The contents of this presentation are subject to change without notice. This document is just a presentation and is not intended to be a “prospectus” (as defined under the Companies Act, 1956). It is clarified that this presentation is not intended to be a document offering for subscription or sale of any securities or inviting offers from the Indian public (including any section thereof) for the subscription to or sale of any securities. This document has not been and will not be reviewed or approved by a regulatory authority in India or by any stock exchange in India.
Any decision to subscribe for or purchase any securities should be made solely on the basis of information contained in a prospectus to be issued in respect of an offering of such securities or the final offering memorandum relating to the securities after seeking appropriate professional advice, and no reliance should be placed on any information other than that contained in a prospectus or the final offering memorandum, as the case may be.
Religare Enterprises Limited is proposing, subject to market conditions and other considerations, a rights offering of its equity shares and has filed a Draft Letter of Offer with the Securities and Exchange Board of India. The Draft Letter of Offer is available on the website of the Securities and Exchange Board of India at www.sebi.gov.in and the respective websites of the lead managers to the Issue at http://www.nomura.com/asia/services/capital_raising/equity.shtml and www.religarecm.com. Investors should note that investment in equity shares involves a high degree of risk and for details relating to the same, see the section entitled “Risk Factors” on page xii of the Draft Letter of Offer.
Disclaimer

Section II : Performance of Key Subsidiaries
Appendix 1: Performance of Other Subsidiaries and JVs
Section I : Q4 and FY11 Highlights
Appendix 2: Subsidiary and JV Balance Sheets
Table of Contents
2
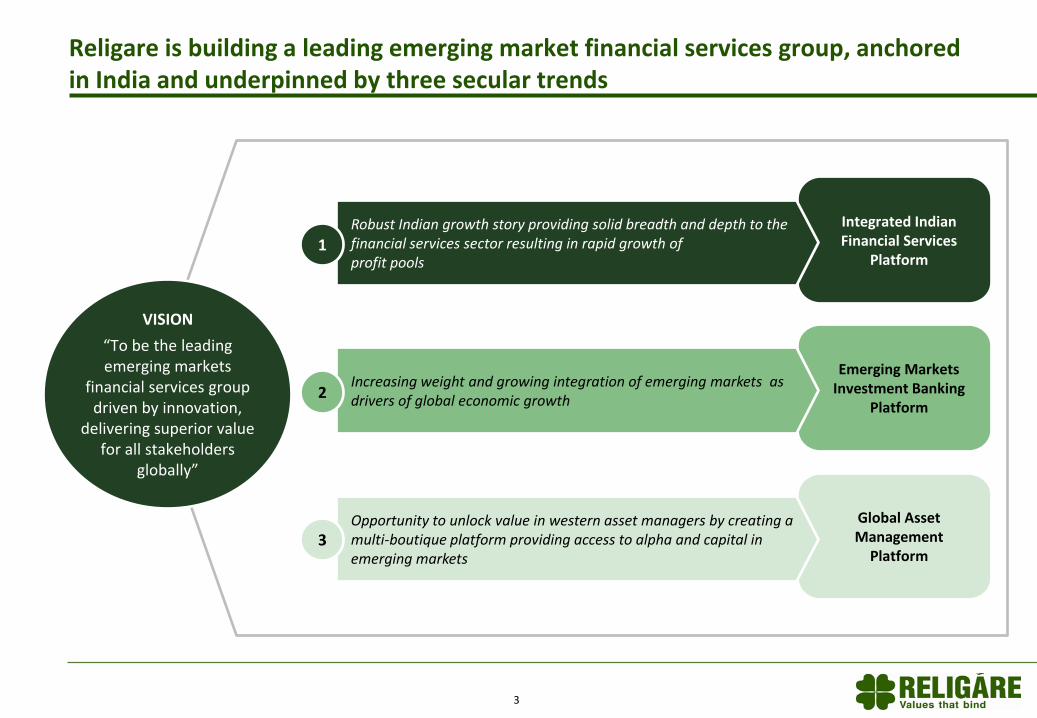
Religare is building a leading emerging market financial services group, anchored in India and underpinned by three secular trends
VISION
“To be the leading emerging markets
financial services group driven by innovation,
delivering superior value for all stakeholders
globally”
Emerging Markets Investment Banking
Platform
Increasing weight and growing integration of emerging markets as drivers of global economic growth
Integrated Indian Financial Services
Platform
Robust Indian growth story providing solid breadth and depth to the financial services sector resulting in rapid growth of profit pools
1
Global Asset Management
Platform
Opportunity to unlock value in western asset managers by creating a multi-boutique platform providing access to alpha and capital in emerging markets
2
3
3

Strategy Implementation Update – 1/2Continue to consolidate our position in India…
* As at Mar 31, 2011
Integrated Indian Financial Services
Platform
Softness in the Indian financial markets continued in Q4FY11 as anticipated – early counter-measures
helped contain the impact in some businesses
• Asset Finance: Loan book grew to `58 bn* – close to the upper end of our target of `50-60 bn for
FY11. Portfolio quality in control: 30-days past due at 0.84% and 90-days past due at 0.25% of book
as of March 31, 2011
• Capital Market Lending: Earnings quality remains stable and book scaled back further to `21.4 bn.*
in light of soft market conditions
• Retail Equity Broking: Continue to focus on cost optimization, improving service delivery and
increasing activation rates to counter pressures from deteriorating market conditions including
falling yields and continuing shift to F&O
• Retail Commodity Broking: Efforts to acquire new clients bearing fruit with number of clients at
approx. 1,40,000. Religare Commodities won 'Best Commodity Broker of the Year' at Bloomberg
UTV's Financial Leadership Awards 2011
• Asset Management: Efforts to increase higher fee products paying off – commenced deploying
funds raised by Japanese asset manager from Japanese retail investors in Feb 2011 for the Indian
mid- and small-cap strategy. Fund closed at US$ 105 mn with participation by over 5,000 investors.
• Wealth Management: Focus on high fee generating clients and diversification of product suite
• Life Insurance: More than doubled branch network to 118 during the year ended March 31, 2011,
with continued emphasis on developing a cost efficient operating model
4

Strategy Implementation Update – 2/2 …and grow international platform
5
Global Asset Management
Platform
Obtained RBI approval during Q4FY11 for acquiring Landmark Partners LLC, USA; transaction has since been completed
Leveraging distribution capabilities: facilitated raising of US$ 105 mn from Japanese retail investors for Indian mid- and small-cap strategy – funds being advised by RAMC
Emerging Markets Investment Banking
Platform
Traction across geographies in Investment Banking and Equity Capital Markets with marquee deals in India, Singapore, UK and USA
India research covers 185 stocks as of 31-Mar-2011, representing more than 75% of the BSE market capitalization; 24 stocks under active coverage internationally
RCML India named ‘Best India Brokerage Research Firm’ at the Starmine Awards, part of Thomson Reuters family of awards. The awards follow an objective methodology, ranking analysts according to their Industry Excess Return, computed from a portfolio simulation that measures each analyst relative to an industry-based benchmark

6
On 26th April, 2011, the Board of Directors have approved issue of equity shares on rights basis to the shareholders of the company for an amount of up to Rs. 8,000 million (with an option to increase the issue size by up to 10%) (“Rights Issue”)
Subsequent to the approval of the proposed issue by the Board, the Offer Committee of the Board approved the Draft Letter of Offer (DLOF) in the context of the aforesaid Rights Issue and the same has been filed with the Securities & Exchange Board of India (“SEBI”) on May 6, 2011
Subject to the approval of the SEBI, the Rights Issue will enable raising of capital as set out in the DLOF
Consequent to the filing of the DLOF, a Promoter Group entity has subscribed to the Rights Issue for an amount of Rs. 4,000 million as advance subscription towards the Rights Issue and the same has been intimated to SEBI and the Stock Exchanges
Please refer to the Letter of Offer to be filed with SEBI for Risk Factors associated with the Rights Issue
Proposed Rights Issue

7
Significant upward shift in short term interest rates has led to increase in cost of funding
Share of retail turnover in Cash equities has steadily declined
Options now account for nearly two-thirds of overall volume
MF Industry closing AUM declined further as investors continued to pull back from the market
36% 33% 31% 29% 24%
3%4%4%4%5% 8%
65%
10%
Q1 FY11
11%
54%
Q2 FY11
57%
Q3 FY11 Q4 FY11
51%
12%
Q4 FY10
44%
15%
Upward shift in short term interest rate yield curve during FY11 has impacted lending business profitability – this was particularly evident in the latter half of the year
Share of Futures & Options in market volumes continues to rise: F&O accounted for 89% of overall market turnover in Q4FY11. Cash equities turnover has declined in relative as well as absolute terms.
MF industry remains challenged as expected: AUM declined further from the earlier quarter
Pressure points remain in the financial markets as anticipated
5,923
6,263
6,573
6,302
6,140
31-Dec-1030-Sep-1030-Jun-1031-Mar-10 31-Mar-11
(` bn) Total AUM
10
8
6
4
2
0
109876543210
31-Mar-1131-Mar-10(%)
(Yrs)
IntradayDelivery FuturesOptions
Source: Clearing Corporation of India Ltd, NSE, BSE, AMFI, Company Analysis
Indian markets were soft in H2FY11 but structural story continues to be strong
58% 56% 59% 55% 52%
Q4 FY11
48%
Q3 FY11
45%
Q2 FY11
41%
Q1 FY11
44%
Q4 FY10
42%
Retail Turnover Institutional Turnover
Total Turnover(` tn)
12 11 12 13 10

8
11,91116,752
29,866
+78%
FY11FY10FY09
1,974
-2,074
FY11
-3,019
FY10
969
FY09
-636-140
(` mn) REL Consol. PAT*REL Consol. PBT*(` mn)REL Consolidated Revenue*
Key Financial Indicators – Q4FY11 and FY11
Investments in new businesses continued through FY11, reflected as accounting losses
(` mn)
560
-797
-247
-1,189
Q2 FY11
-242159
Q1 FY11
-494
Q4 FY10
322
-985
Q4 FY11
-1,298
Q3 FY11
REL Consol. PAT*REL Consol. PBT*
Robust revenue growth – Q4 revenue up 62% QOQ and FY11 revenue up 78% YOY
5,316 4,7546,274
7,177
11,660
+62%
Q4 FY11Q3 FY11Q2 FY11Q1 FY11Q4 FY10
(` mn) REL Consolidated Revenue*
* Includes one-time Capital Gains of Rs. 1,287 mn in Q4FY11 and FY11 from sale of immovable property by a subsidiary

9
Consolidated Income Statement
* Includes one-time Capital Gains of Rs. 1,287 mn in Q4FY11 and FY11 from sale of immovable property by a subsidiary
Y-o-Y Change Q-o-Q Change Y-o-Y Change
(` mn) FY 11 FY10 (%) Q4 FY 11 Q3 FY 11 (%) Q4 FY 10 (%)
Income from Operations 21,924 14,583 50% 6,516 5,823 12% 4,851 34%
Other Operating Income* 4,052 2,169 87% 1,848 761 143% 465 297%
Sale of Bullion 3,890 - nm 3,297 593 456% - nm
Total Income 29,866 16,752 78% 11,660 7,177 62% 5,316 119%
Cost of Bullion Sold 3,890 - nm 3,296 593 455% - nm
Personnel Expenses 9,898 5,191 91% 3,730 2,690 39% 1,829 104%
Operating and Admin Expenses 10,689 7,140 50% 3,522 2,390 47% 2,143 64%
Less: Net Exp. of JV Recoverable -1,409 -1,030 nm -465 -322 nm -357 nm
Total Expenses 23,068 11,301 104% 10,084 5,351 88% 3,615 179%
EBITDA 6,797 5,451 25% 1,577 1,827 -14% 1,701 -7%
Interest and Finance Charges 7,911 2,797 183% 2,552 2,299 11% 945 170%
Depreciation 960 680 41% 213 325 -34% 196 9%
PBT -2,074 1,974 nm -1,189 -797 nm 560 nm
Provision for Tax 874 1,003 -13% 61 169 -64% 241 -75%
Minority Interest -72 -2 nm -49 -18 nm 2 nm
Net Profit -3,019 969 nm -1,298 -985 nm 322 nm

10* Includes Warrants and Share Application Money
Consolidated Balance Sheet(` mn) As at Mar 31, 2011 As at Dec 31, 2010 As at Mar 31, 2010
Owners’ Funds 29,655 30,737 26,126
Share Capital * 1,764 1,764 1,530
Reserves and Surplus 27,891 28,974 24,596
Loan Funds 113,310 104,418 55,720
Secured Loans 64,950 46,857 15,755
Unsecured Loans 48,361 57,561 39,964
Policy Holders’ Fund 1,989 1,396 639
Funds for Discontinued Policies - - -
Minority Interest 2,319 2,138 129
Total Liabilities 147,274 138,689 82,614
Fixed Assets 15,982 16,792 8,885
Gross Block 17,338 18,504 10,475
Less : Depreciation 2,527 2,465 1,642
Net Block 14,811 16,039 8,833
Capital Work-in-Progress (including capital advances) 1,171 754 51
Investments 4,796 4,211 8,730
Deferred Tax Assets (Net) 154 191 14
Net Current Assets 126,342 117,495 64,985
Current Assets, Loans and Advances 150,679 140,951 79,470
Less : Current Liabilities and Provisions 24,337 23,456 14,485
Total Assets 147,274 138,689 82,614
Section II : Performance of Key Subsidiaries
Appendix 1: Performance of Other Subsidiaries and JVs
Section I : Q4 and FY11 Highlights
Appendix 2: Subsidiary and JV Balance Sheets
Table of Contents
11

12
Controlled growth in loan book – 22% CQGR through FY11 Revenue growth QOQ was muted, reflecting flattish overall loan book
Customer base grew 72% YOY in tandem with calibrated expansion of distribution reach
Borrowing program supported by superior ratings
Len
din
gB
roki
ng
Equ
itie
sB
roki
ng
Co
mm
.A
sset
Mgm
t. –
Ind
iaIn
vest
men
t B
anki
ng
Glo
bal
Ass
et
Mgm
t.
15.727.3
22.7 21.4
89.7+22%
31-Mar-11
10.3
58.0
31-Dec-10
88.4
14.9
50.7
30-Sep-10
73.7
6.7
39.7
30-Jun-10
53.7
8.7
29.3
31-Mar-10
40.9
12.8
17.910.1
Corporate LendingAsset FinanceCapital Market Lending(` bn) (` mn)
3,4593,309
2,812
2,0511,606
Q4FY11Q3FY11Q2FY11Q1FY11Q4FY10
Rating Type Rating Rating AgencyAmount
(` mn)
Short term A1+ ICRA 75,000
Long Term Bank Loans LAA- ICRA 48,000
Short term Bank Loans A1+ ICRA 2,000
Long Term LAA- ICRA 20,000
Rated amount for long term bank loans enhanced by ` 18 billion in Q4 FY11 by ICRA
Additionally, received a Long Term rating of CARE AA- from CARE for an amount of ` 2,500 mn and a Tier 2 Subordinate Debt rating of FITCH AA-(ind) from FITCH for an amount of ` 2,500 mn
(No. of Clients)
20,640
31-Dec-10
20,414
1,584
18,830
30-Sep-10
18,680
2,032
16,648
30-Jun-10
14,468
2,074
12,394
31-Mar-10
12,912
2,177
10,735
1,554
31-Mar-11
22,194
Capital Market LendingAsset Finance
Religare FinvestStrong growth in Asset Finance; overall growth muted as other books scaled back
Total Revenue
(` bn) (` bn)
Interest yield improved for LAP as rate increase flowed through; remained in a narrow range for other assets
Religare FinvestFocus on building secured assets portfolio
4.8
5.54.7
3.9
+34%
31-Mar-11
58.0
35.6
15.4
7.0
31-Dec-10
50.7
32.2
12.26.4
30-Sep-10
39.7
24.5
9.6
30-Jun-10
29.3
17.6
6.9
31-Mar-10
17.9
9.2
Loan Against Property
CE/CV
SME Working Capital
85Secured Assets (%) 3.5 3.5
Disbursals# ‘000
17.8%17.9%18.2%18.5%18.7%
14.2%13.5%13.7%13.6%
14.2%
12.0%
Q4FY11Q3 FY11
12.8%
Q2 FY11
12.4%
Q1 FY11
12.1%
Q4 FY10
12.1%
SME Working Capital CE/CVLoan Against Property
13
89 2.5 4.02.9
Asset Finance Book 223% larger than year ago; secured book has grown faster Asset Finance disbursements
Len
din
gB
roki
ng
Equ
itie
sB
roki
ng
Co
mm
.A
sset
Mgm
t. –
Ind
iaIn
vest
men
t B
anki
ng
Glo
bal
Ass
et
Mgm
t.
79 87 89
7.8
12.811.1
14.112.2
Q4FY11Q3 FY11Q2 FY11Q1 FY11Q4 FY10
Amt. Disbursed

Asset Finance portfolio quality continues to remain under control and above benchmark
Scale benefits visible as Asset Finance ‘Opex/ANR ratio’** continues to improve
Continued to scale back Capital Market Lending book in light of soft market conditions
Religare FinvestPortfolio quality in control; scale benefits kicking in
(%)(%)
(` bn)
4.7
9.0
9.5 8.5
31-Mar-11
21.4
12.9
31-Dec-10
22.7
13.2
30-Sep-10
27.3
18.3
30-Jun-10
15.7
11.0
31-Mar-10
10.1
8.1
2.0
31-Mar-09
5.7
5.40.3
RetailWholesale
0.25%0.18%0.22%
0.36%0.43%
0.84%
1.13%
0.72%0.71%
0.88%
Q4 FY11Q3 FY11Q2 FY11Q1 FY11Q4 FY10
30+ DPD*90+ DPD*
1.92%2.20%2.26%
3.29%3.18%
Q4 FY11Q3 FY11Q2 FY11Q1 FY11Q4 FY10
Opex/ANR
*DPD denotes Days Past Due; **ANR denotes Average Net Receivables and the ratio represents annualized rate for respective quarter
14
Len
din
gB
roki
ng
Equ
itie
sB
roki
ng
Co
mm
.A
sset
Mgm
t. –
Ind
iaIn
vest
men
t B
anki
ng
Glo
bal
Ass
et
Mgm
t.

15
Religare FinvestFinancial Performance
RFL Abridged Income Statement
Len
din
gB
roki
ng
Equ
itie
sB
roki
ng
Co
mm
.A
sset
Mgm
t. –
Ind
iaIn
vest
men
t B
anki
ng
Glo
bal
Ass
et
Mgm
t.
YOY ChangeQOQ
ChangeYOY
Change(` mn) FY11 FY10 (%) Q4FY11 Q3FY11 (%) Q4FY10 (%)
Income from Operations 11,034 4,723 134% 3,029 3,160 -4% 1,458 108%
Other Income 597 638 -6% 430 149 188% 148 192%
Total Income 11,631 5,362 117% 3,459 3,309 5% 1,606 115%
Operating Expenses 880 712 24% 296 237 25% 173 71%
Personnel Expenses 1,064 694 53% 289 300 -4% 265 9%
Administrative and Other Expenses 1,365 721 89% 490 345 42% 241 103%
Total Expenses 3,309 2,127 56% 1,074 883 22% 679 58%
EBITDA 8,323 3,235 157% 2,385 2,426 -2% 926 157%
Interest and Finance Charges 6,460 1,773 264% 2,165 2,032 7% 633 242%
Depreciation 100 43 132% 22 29 -25% 18 20%
PBT 1,762 1,419 24% 198 366 -46% 275 -28%
PAT 1,148 1,028 12% 97 242 -60% 197 -51%
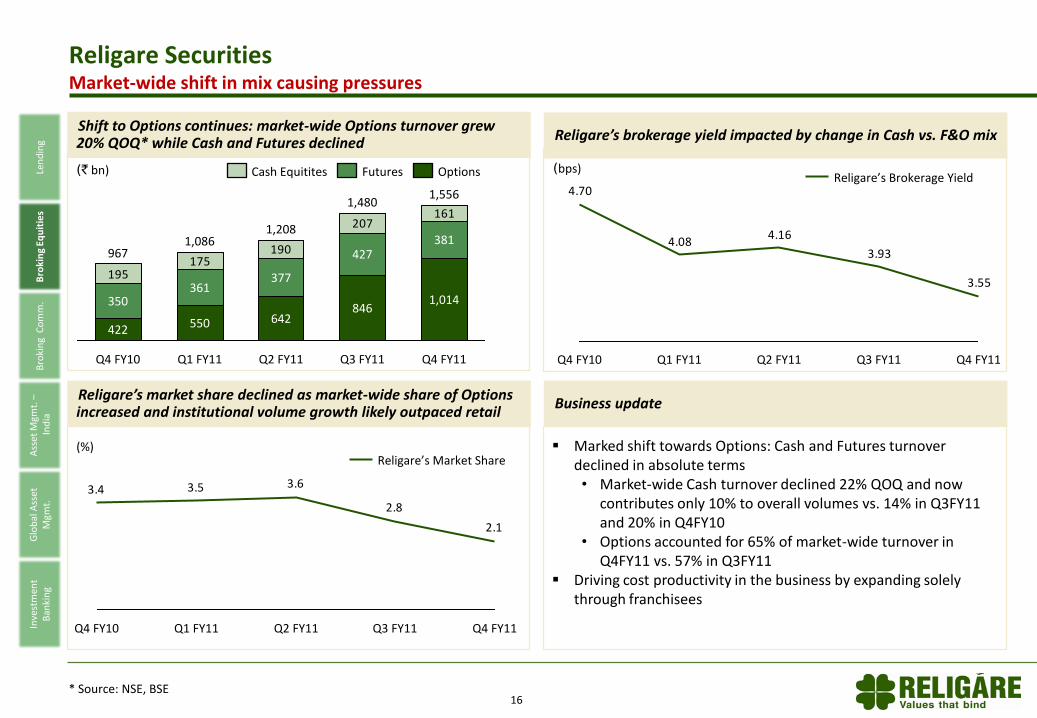
Shift to Options continues: market-wide Options turnover grew 20% QOQ* while Cash and Futures declined Religare’s brokerage yield impacted by change in Cash vs. F&O mix
Religare’s market share declined as market-wide share of Options increased and institutional volume growth likely outpaced retail
Business update
Marked shift towards Options: Cash and Futures turnover declined in absolute terms• Market-wide Cash turnover declined 22% QOQ and now
contributes only 10% to overall volumes vs. 14% in Q3FY11 and 20% in Q4FY10
• Options accounted for 65% of market-wide turnover in Q4FY11 vs. 57% in Q3FY11
Driving cost productivity in the business by expanding solely through franchisees
Religare SecuritiesMarket-wide shift in mix causing pressures
195175
190
207161
1,556
Q4 FY11
1,014
381
Q3 FY11
1,480
846
427
Q2 FY11
1,208
642
377
Q1 FY11
1,086
550
361
Q4 FY10
967
422
350
OptionsFuturesCash Equitites(` bn) (bps)
2.1
2.8
3.63.53.4
Q4 FY11Q3 FY11Q2 FY11Q1 FY11Q4 FY10
Religare’s Market Share(%)
* Source: NSE, BSE
3.55
3.93
4.164.08
4.70
Q4 FY11Q3 FY11Q2 FY11Q1 FY11Q4 FY10
Religare’s Brokerage Yield
16
Len
din
gB
roki
ng
Equ
itie
sB
roki
ng
Co
mm
.A
sset
Mgm
t. –
Ind
iaIn
vest
men
t B
anki
ng
Glo
bal
Ass
et
Mgm
t.

17
Religare SecuritiesExpansion through franchisees – variable cost model
413 409 397 396414
31-Mar-1131-Dec-10
1,926
1,529
30-Sep-10
1,891
1,482
30-Jun-10
1,852
1,439
31-Mar-10
1,747
1,3331,566
1,962
FranchiseesOwn Branches
713738 761 780
687
31-Mar-1131-Dec-1030-Sep-1030-Jun-1031-Mar-10
No. of Clients(000s)
2,828 2,850 2,947 3,198 2,915
30-Jun-10 31-Mar-1131-Dec-1030-Sep-1031-Mar-10
Sales and Dealing Team Size
Expansion of distribution solely through franchisees Steady and sustained growth in client base
Sales and Dealing team
Len
din
gB
roki
ng
Equ
itie
sB
roki
ng
Co
mm
.A
sset
Mgm
t. –
Ind
iaIn
vest
men
t B
anki
ng
Glo
bal
Ass
et
Mgm
t.
(Nos.)
(Nos.)
18
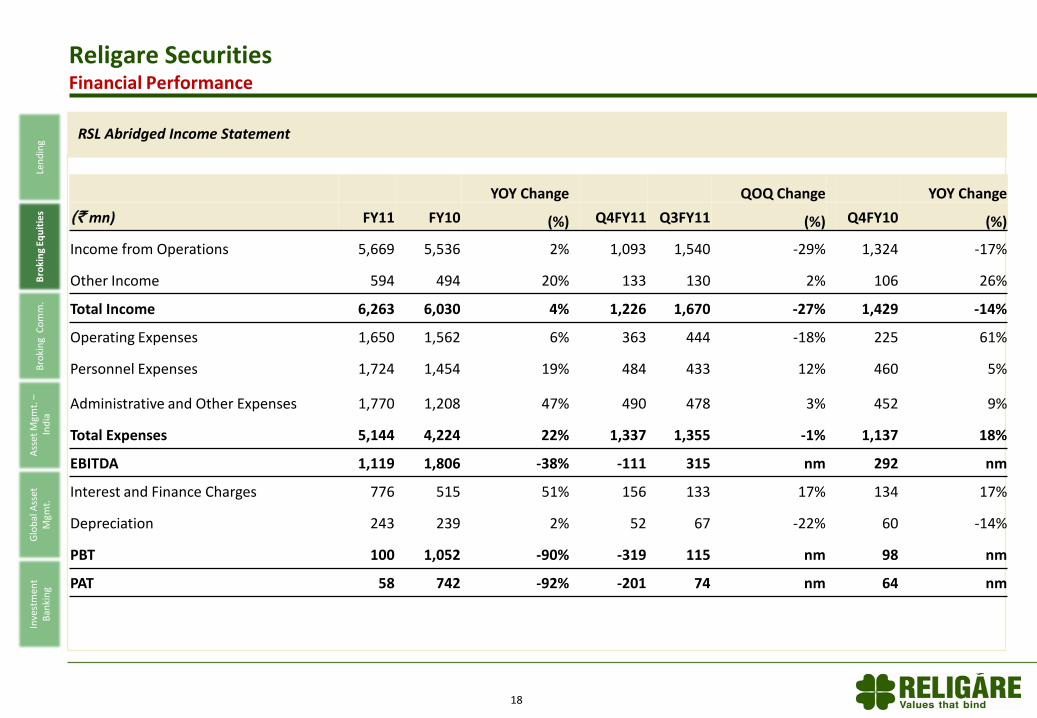
Religare SecuritiesFinancial Performance
RSL Abridged Income Statement
Len
din
gB
roki
ng
Equ
itie
sB
roki
ng
Co
mm
.A
sset
Mgm
t. –
Ind
iaIn
vest
men
t B
anki
ng
Glo
bal
Ass
et
Mgm
t.
YOY Change QOQ Change YOY Change
(` mn) FY11 FY10 (%) Q4FY11 Q3FY11 (%) Q4FY10 (%)
Income from Operations 5,669 5,536 2% 1,093 1,540 -29% 1,324 -17%
Other Income 594 494 20% 133 130 2% 106 26%
Total Income 6,263 6,030 4% 1,226 1,670 -27% 1,429 -14%
Operating Expenses 1,650 1,562 6% 363 444 -18% 225 61%
Personnel Expenses 1,724 1,454 19% 484 433 12% 460 5%
Administrative and Other Expenses 1,770 1,208 47% 490 478 3% 452 9%
Total Expenses 5,144 4,224 22% 1,337 1,355 -1% 1,137 18%
EBITDA 1,119 1,806 -38% -111 315 nm 292 nm
Interest and Finance Charges 776 515 51% 156 133 17% 134 17%
Depreciation 243 239 2% 52 67 -22% 60 -14%
PBT 100 1,052 -90% -319 115 nm 98 nm
PAT 58 742 -92% -201 74 nm 64 nm
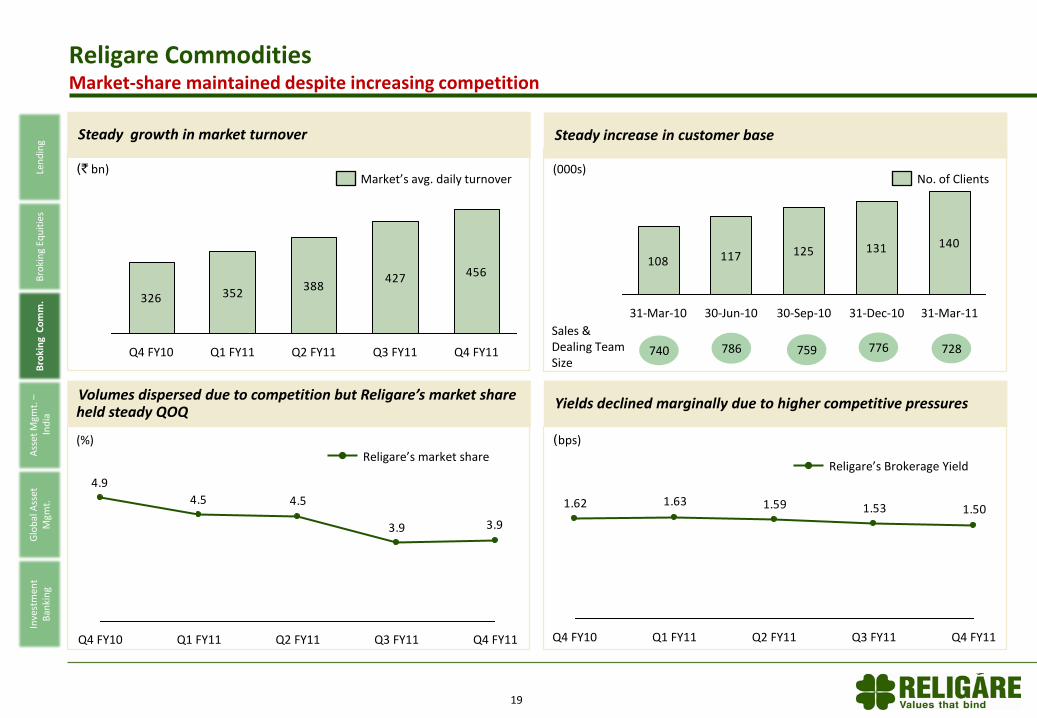
Religare CommoditiesMarket-share maintained despite increasing competition
326 352388
456427
Q4 FY11Q3 FY11Q2 FY11Q1 FY11Q4 FY10
(` bn)Market’s avg. daily turnover
3.93.9
4.54.5
4.9
Q4 FY11Q3 FY11Q2 FY11Q1 FY11Q4 FY10
108 117 125 131 140
31-Mar-1131-Dec-1030-Sep-1030-Jun-1031-Mar-10
740 776
Sales & Dealing TeamSize
(000s)No. of Clients
19
(%)
Religare’s market share
1.501.531.591.631.62
Q4 FY11Q3 FY11Q2 FY11Q1 FY11Q4 FY10
Religare’s Brokerage Yield
(bps)
728
Steady growth in market turnover Steady increase in customer base
Volumes dispersed due to competition but Religare’s market share held steady QOQ
Yields declined marginally due to higher competitive pressures
Len
din
gB
roki
ng
Equ
itie
sB
roki
ng
Co
mm
.A
sset
Mgm
t. –
Ind
iaIn
vest
men
t B
anki
ng
Glo
bal
Ass
et
Mgm
t.
786 759
20
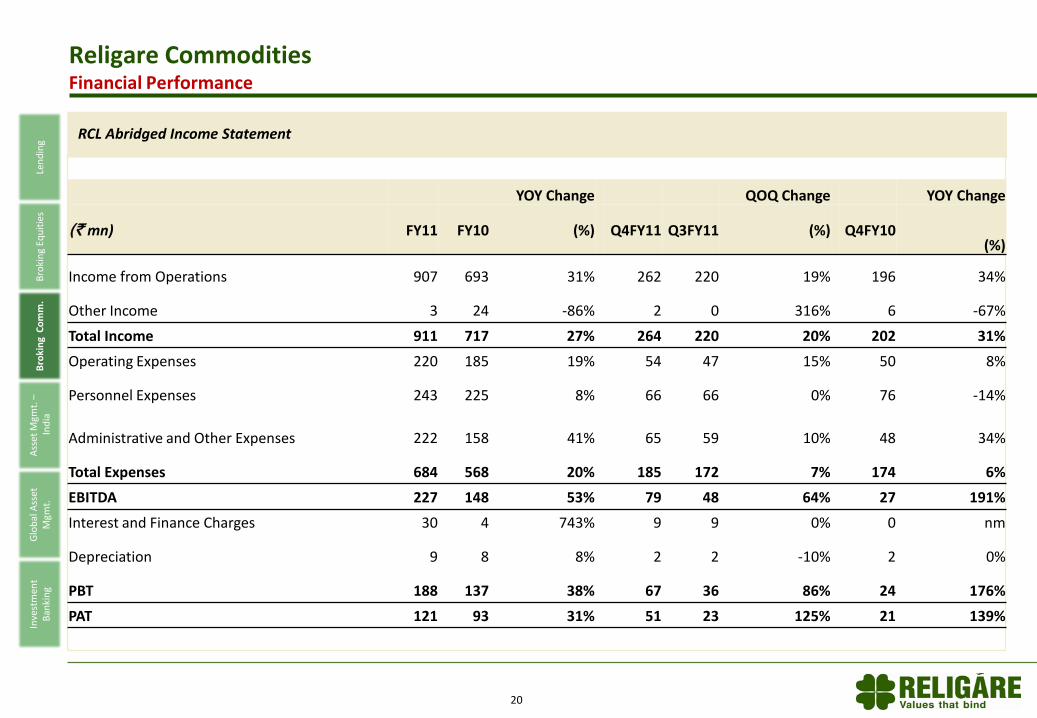
Religare CommoditiesFinancial Performance
RCL Abridged Income Statement
Len
din
gB
roki
ng
Equ
itie
sB
roki
ng
Co
mm
.A
sset
Mgm
t. –
Ind
iaIn
vest
men
t B
anki
ng
Glo
bal
Ass
et
Mgm
t.
YOY Change QOQ Change YOY Change
(` mn) FY11 FY10 (%) Q4FY11 Q3FY11 (%) Q4FY10 (%)
Income from Operations 907 693 31% 262 220 19% 196 34%
Other Income 3 24 -86% 2 0 316% 6 -67%
Total Income 911 717 27% 264 220 20% 202 31%
Operating Expenses 220 185 19% 54 47 15% 50 8%
Personnel Expenses 243 225 8% 66 66 0% 76 -14%
Administrative and Other Expenses 222 158 41% 65 59 10% 48 34%
Total Expenses 684 568 20% 185 172 7% 174 6%
EBITDA 227 148 53% 79 48 64% 27 191%
Interest and Finance Charges 30 4 743% 9 9 0% 0 nm
Depreciation 9 8 8% 2 2 -10% 2 0%
PBT 188 137 38% 67 36 86% 24 176%
PAT 121 93 31% 51 23 125% 21 139%

Religare Mutual Fund moved up one rank to 13th
position in terms of AUM as of 31-Mar-2011 from 14th as at 31-Dec-2010 out of a total of 41 MFs in India.
No. of live folios increased 5% YOY while industry-wide folios declined 2%
Commenced deploying funds raised by Japanese asset manager from Japanese retail investors in Feb 2011 for the Indian mid- and small-cap strategy. Fund closed at US$ 105 mn with participation by over 5,000 investors.
Focus on using existing capabilities for higher profitability products, particularly managing offshore funds and growing PMS AUM; as also on increasing retail debt products
21
Religare AMCContinued focus on growing high fee products
(` bn)
7,474
6,7597,133
6,7547,005
31-Mar-1131-Dec-1030-Sep-1030-Jun-1031-Mar-10
Avg. Industry AUM
31-Mar-1131-Dec-10
93%
7%
30-Sep-10
92%
8%
30-Jun-10
92%
8%
31-Mar-10
92%
8% 6%
94%
Avg. Debt AUMAvg. Equity AUM
(` bn) Avg . AUM
134 109 108 105 117
Industry-wide average AUM increased 4% QOQ in Q4FY11 –growth largely came from fixed income products
Religare AUM grew 11% QOQ; asset composition moved in line with market
Business update
Len
din
gB
roki
ng
Equ
itie
sB
roki
ng
Co
mm
.A
sse
t M
gmt.
–In
dia
Inve
stm
ent
Ban
kin
gG
lob
al A
sset
M
gmt.
Quarter ended
22
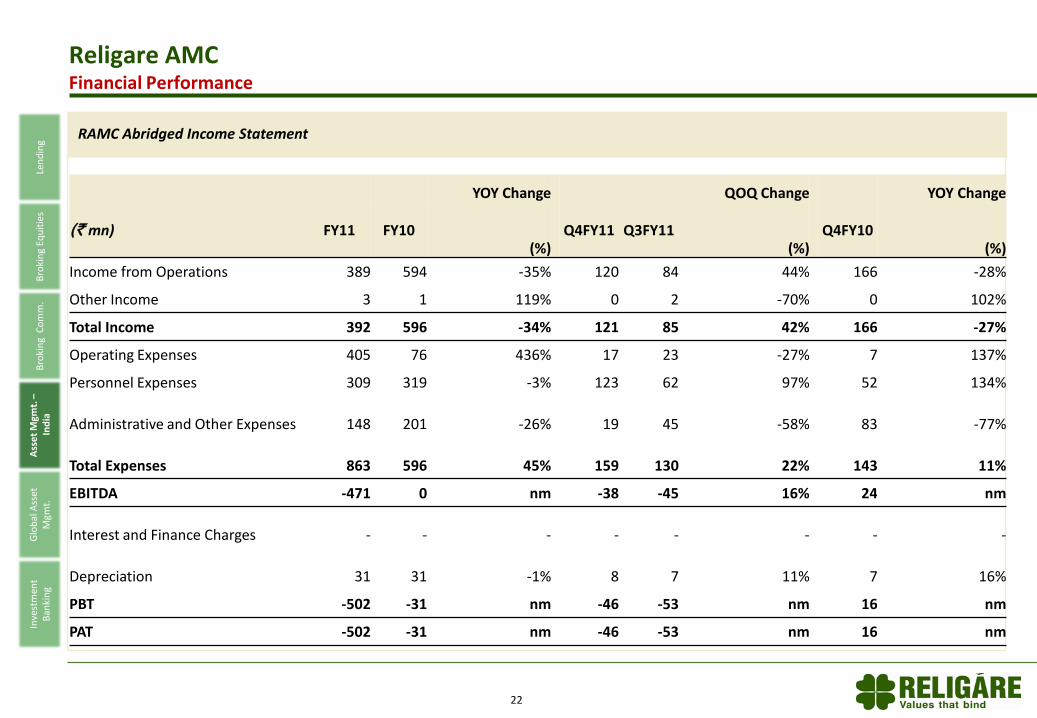
Religare AMCFinancial Performance
Len
din
gB
roki
ng
Equ
itie
sB
roki
ng
Co
mm
.A
sse
t M
gmt.
–In
dia
Inve
stm
ent
Ban
kin
gG
lob
al A
sset
M
gmt.
RAMC Abridged Income Statement
YOY Change QOQ Change YOY Change
(` mn) FY11 FY10 (%)
Q4FY11 Q3FY11 (%)
Q4FY10 (%)
Income from Operations 389 594 -35% 120 84 44% 166 -28%
Other Income 3 1 119% 0 2 -70% 0 102%
Total Income 392 596 -34% 121 85 42% 166 -27%
Operating Expenses 405 76 436% 17 23 -27% 7 137%
Personnel Expenses 309 319 -3% 123 62 97% 52 134%
Administrative and Other Expenses 148 201 -26% 19 45 -58% 83 -77%
Total Expenses 863 596 45% 159 130 22% 143 11%
EBITDA -471 0 nm -38 -45 16% 24 nm
Interest and Finance Charges - - - - - - - -
Depreciation 31 31 -1% 8 7 11% 7 16%
PBT -502 -31 nm -46 -53 nm 16 nm
PAT -502 -31 nm -46 -53 nm 16 nm
23
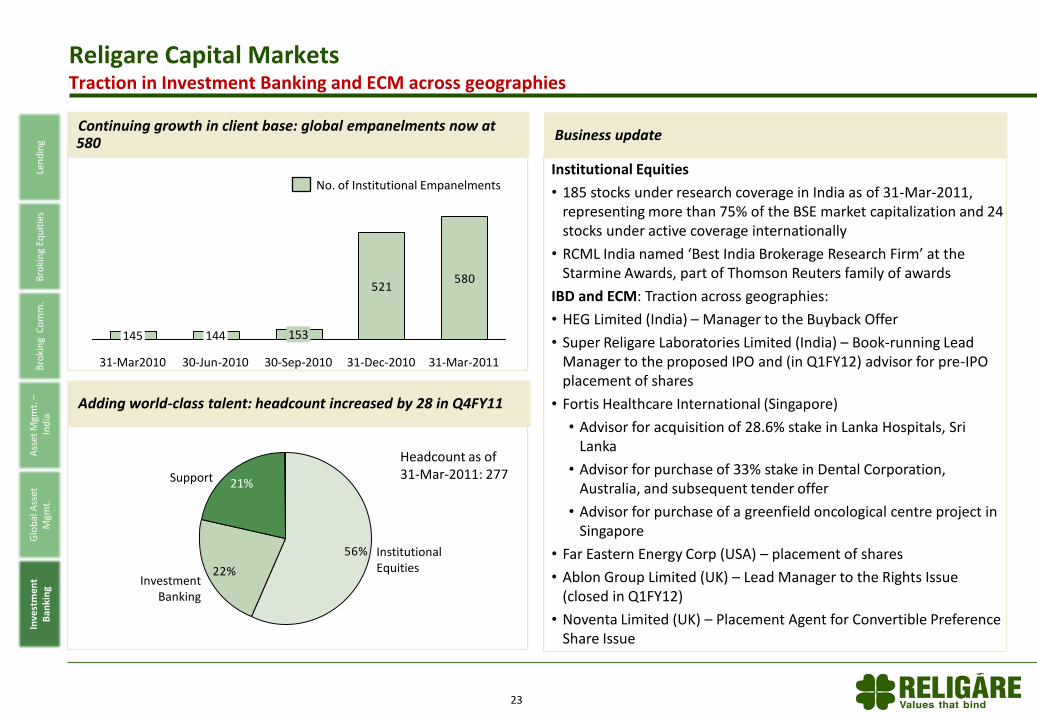
Religare Capital MarketsTraction in Investment Banking and ECM across geographies
580521
31-Mar-201131-Dec-201030-Sep-2010
153
30-Jun-2010
144
31-Mar2010
145
No. of Institutional Empanelments
22%
56%
21%Support
InvestmentBanking
InstitutionalEquities
Headcount as of31-Mar-2011: 277
Len
din
gB
roki
ng
Equ
itie
sB
roki
ng
Co
mm
.A
sset
Mgm
t. –
Ind
iaIn
vest
men
t B
anki
ng
Glo
bal
Ass
et
Mgm
t.
Continuing growth in client base: global empanelments now at 580
Adding world-class talent: headcount increased by 28 in Q4FY11
Institutional Equities
• 185 stocks under research coverage in India as of 31-Mar-2011, representing more than 75% of the BSE market capitalization and 24 stocks under active coverage internationally
• RCML India named ‘Best India Brokerage Research Firm’ at the Starmine Awards, part of Thomson Reuters family of awards
IBD and ECM: Traction across geographies:
• HEG Limited (India) – Manager to the Buyback Offer
• Super Religare Laboratories Limited (India) – Book-running Lead Manager to the proposed IPO and (in Q1FY12) advisor for pre-IPO placement of shares
• Fortis Healthcare International (Singapore)
• Advisor for acquisition of 28.6% stake in Lanka Hospitals, Sri Lanka
• Advisor for purchase of 33% stake in Dental Corporation, Australia, and subsequent tender offer
• Advisor for purchase of a greenfield oncological centre project in Singapore
• Far Eastern Energy Corp (USA) – placement of shares
• Ablon Group Limited (UK) – Lead Manager to the Rights Issue (closed in Q1FY12)
• Noventa Limited (UK) – Placement Agent for Convertible Preference Share Issue
Business update

24
Religare Capital Markets - IndiaFinancial Performance
Len
din
gB
roki
ng
Equ
itie
sB
roki
ng
Co
mm
.A
sset
Mgm
t. –
Ind
iaIn
vest
men
t B
anki
ng
Glo
bal
Ass
et
Mgm
t.
RCML India Abridged Income Statement
YOY Change QOQ Change YOY Change
(` mn) FY11 FY10 (%) Q4FY11 Q3FY11 (%) Q4FY10 (%)
Income from Operations 983 321 206% 122 134 -9% 258 -53%
Other Income 37 285 -87% 3 14 -81% 17 -84%
Total Income 1,020 607 68% 124 148 -16% 275 -55%
Operating Expenses 64 104 -39% 21 15 39% 12 75%
Personnel Expenses 1,066 254 320% 425 306 39% 112 280%
Administrative and Other Expenses 275 167 64% 90 62 46% 58 55%
Total Expenses 1,404 525 167% 536 383 40% 182 195%
EBITDA - 384 82 nm -412 -235 nm 93 nm
Interest and Finance Charges 62 42 49% 34 7 403% 3 978%
Depreciation 15 11 38% 4 4 5% 3 36%
PBT - 461 29 nm -450 -245 nm 87 nm
PAT - 464 24 nm -450 -167 nm 82 nm

25
Religare Capital Markets – OverseasFinancial Performance
Len
din
gB
roki
ng
Equ
itie
sB
roki
ng
Co
mm
.A
sset
Mgm
t. –
Ind
iaIn
vest
men
t B
anki
ng
Glo
bal
Ass
et
Mgm
t.
RCML Overseas Abridged Income Statement
YOY Change QOQ Change YOY Change
(` mn) FY11 FY10 (%) Q4FY11 Q3FY11 (%) Q4FY10 (%)
Income from Operations 1,623 1,723 -6% 726 467 55% 950 -24%
Other Income* 1,521 278 448% 1,399 27 5166% 38 3588%
Total Income 3,144 2,001 57% 2,124 493 330% 987 115%
Operating Expenses 475 166 186% 72 40 78% 57 27%
Personnel Expenses 3,422 880 289% 1,694 932 82% 395 329%
Administrative and Other Expenses 1,419 718 98% 756 315 140% 268 182%
Total Expenses 5,317 1,764 201% 2,521 1,287 96% 720 250%
EBITDA -2,172 236 nm -397 -793 nm 268 nm
Interest and Finance Charges 396 415 -5% 136 88 54% 89 53%
Depreciation 255 33 664% 51 130 -61% 23 124%
PBT -2,823 -212 nm -584 -1,012 nm 156 nm
PAT -2,823 -211 nm -578 -1,018 nm 156 nm
PAT after Minority Interest -2,848 -211 nm -598 -1,022 nm 156 nm
* Includes one-time Capital Gains of Rs. 1,287 mn in Q4FY11 and FY11 from sale of immovable property by a subsidiary
26
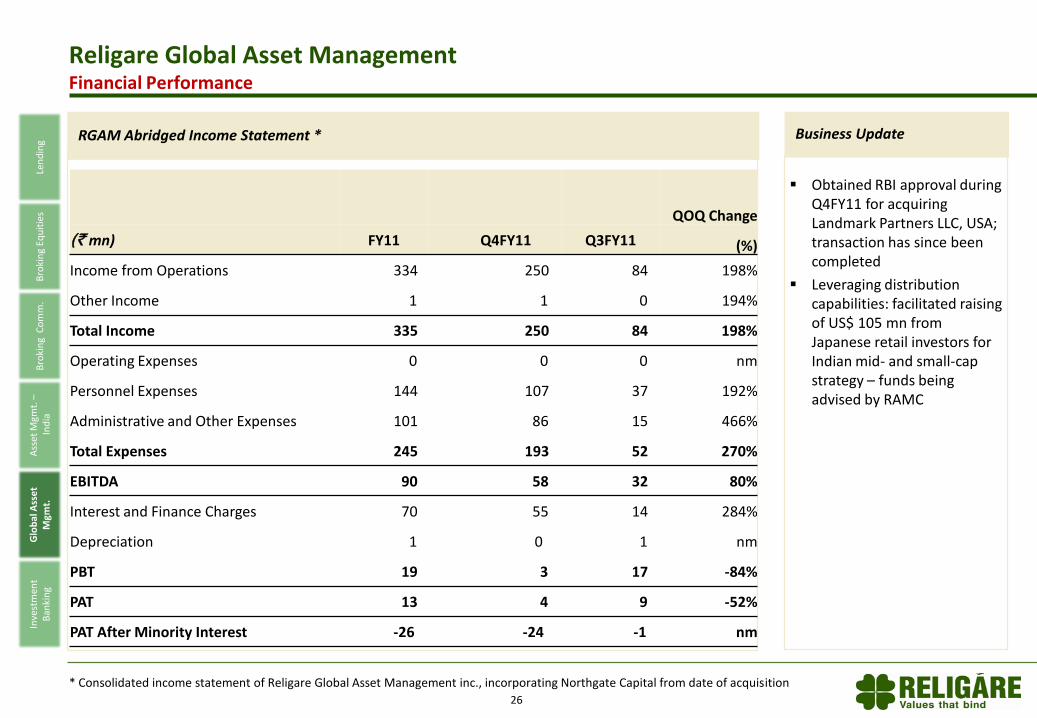
Religare Global Asset ManagementFinancial Performance
* Consolidated income statement of Religare Global Asset Management inc., incorporating Northgate Capital from date of acquisition
Len
din
gB
roki
ng
Equ
itie
sB
roki
ng
Co
mm
.A
sset
Mgm
t. –
Ind
iaIn
vest
men
t B
anki
ng
Glo
bal
Ass
et
Mgm
t.
RGAM Abridged Income Statement *
Obtained RBI approval during Q4FY11 for acquiring Landmark Partners LLC, USA; transaction has since been completed
Leveraging distribution capabilities: facilitated raising of US$ 105 mn from Japanese retail investors for Indian mid- and small-cap strategy – funds being advised by RAMC
Business Update
QOQ Change
(` mn) FY11 Q4FY11 Q3FY11 (%)
Income from Operations 334 250 84 198%
Other Income 1 1 0 194%
Total Income 335 250 84 198%
Operating Expenses 0 0 0 nm
Personnel Expenses 144 107 37 192%
Administrative and Other Expenses 101 86 15 466%
Total Expenses 245 193 52 270%
EBITDA 90 58 32 80%
Interest and Finance Charges 70 55 14 284%
Depreciation 1 0 1 nm
PBT 19 3 17 -84%
PAT 13 4 9 -52%
PAT After Minority Interest -26 -24 -1 nm

Section II : Performance of Key Subsidiaries
Appendix 1: Performance of Other Subsidiaries and JVs
Section I : Q4 and FY11 Highlights
Appendix 2: Subsidiary and JV Balance Sheets
Table of Contents
27
28
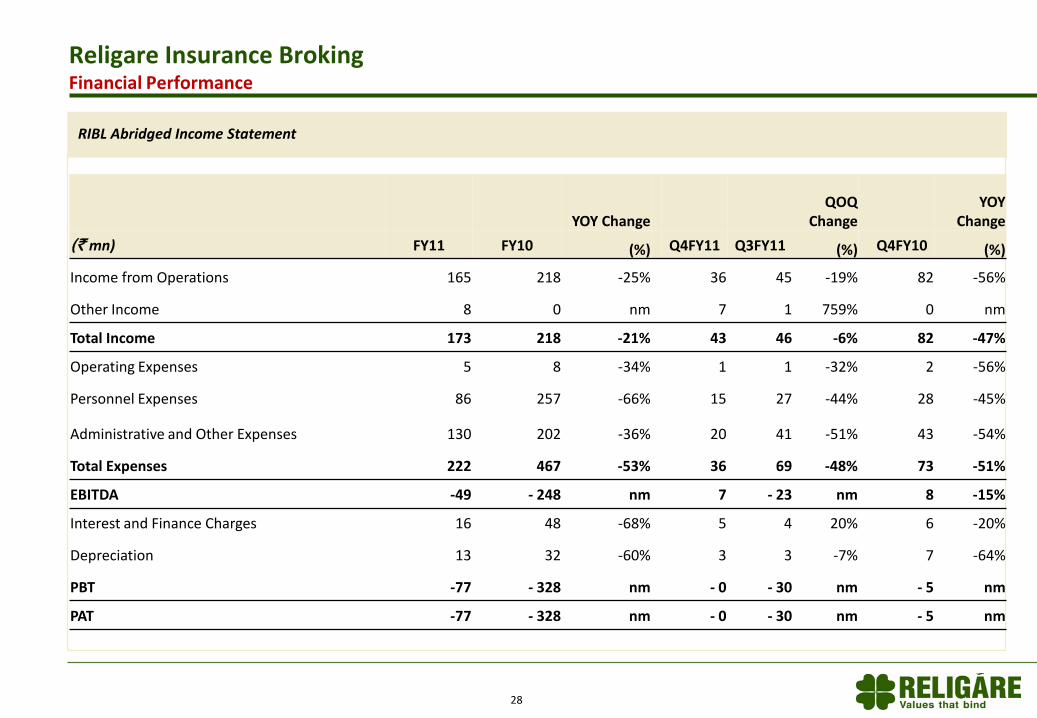
Religare Insurance BrokingFinancial Performance
RIBL Abridged Income Statement
YOY ChangeQOQ
ChangeYOY
Change
(` mn) FY11 FY10 (%) Q4FY11 Q3FY11 (%) Q4FY10 (%)
Income from Operations 165 218 -25% 36 45 -19% 82 -56%
Other Income 8 0 nm 7 1 759% 0 nm
Total Income 173 218 -21% 43 46 -6% 82 -47%
Operating Expenses 5 8 -34% 1 1 -32% 2 -56%
Personnel Expenses 86 257 -66% 15 27 -44% 28 -45%
Administrative and Other Expenses 130 202 -36% 20 41 -51% 43 -54%
Total Expenses 222 467 -53% 36 69 -48% 73 -51%
EBITDA -49 - 248 nm 7 - 23 nm 8 -15%
Interest and Finance Charges 16 48 -68% 5 4 20% 6 -20%
Depreciation 13 32 -60% 3 3 -7% 7 -64%
PBT -77 - 328 nm - 0 - 30 nm - 5 nm
PAT -77 - 328 nm - 0 - 30 nm - 5 nm
29
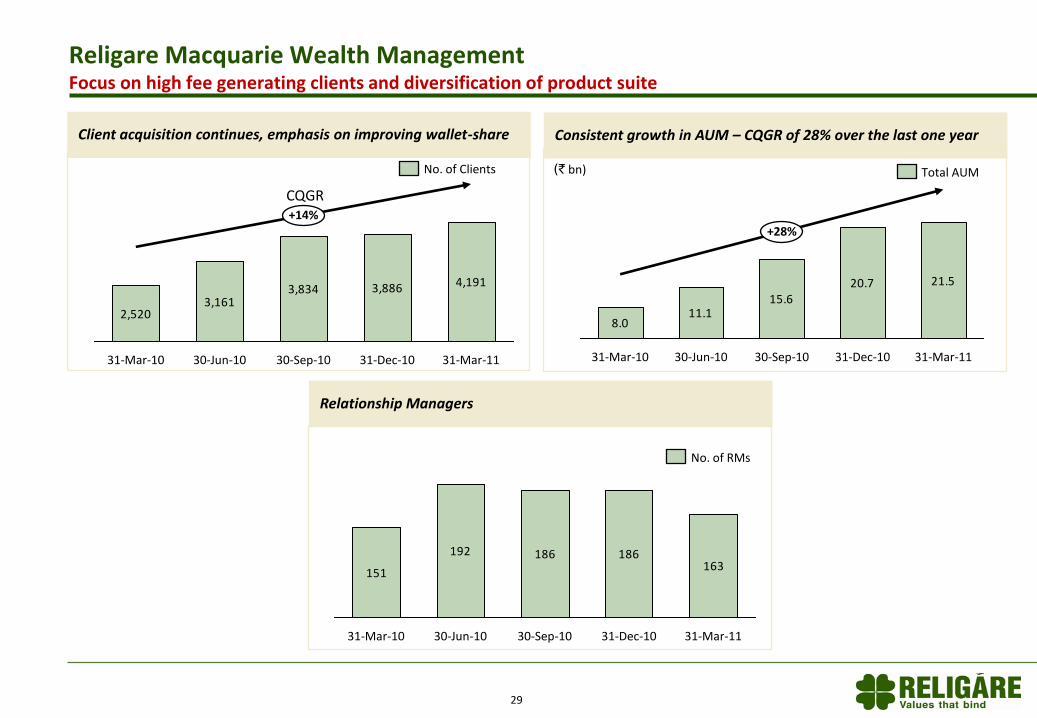
Religare Macquarie Wealth ManagementFocus on high fee generating clients and diversification of product suite
(` bn)
2,5203,161
3,834 3,886 4,191
+14%
31-Mar-1131-Dec-1030-Sep-1030-Jun-1031-Mar-10
8.011.1
15.620.7 21.5
+28%
31-Mar-1131-Dec-1030-Sep-1030-Jun-1031-Mar-10
151
192 186 186163
31-Mar-1131-Dec-1030-Sep-1030-Jun-1031-Mar-10
No. of RMs
No. of Clients Total AUM
Relationship Managers
Client acquisition continues, emphasis on improving wallet-share Consistent growth in AUM – CQGR of 28% over the last one year
CQGR

30
Religare Macquarie Wealth ManagementFinancial Performance
* Financials reflect 100% of the company
RMWM Abridged Income Statement*
YOY ChangeQOQ
ChangeYOY
Change
(` mn) FY11 FY10 (%) Q4FY11 Q3FY11 (%) Q4FY10 (%)
Income from Operations 319 298 7% 88 81 9% 110 -20%
Other Income 5 2 147% 3 1 400% 1 462%
Total Income 324 300 8% 91 81 12% 111 -18%
Operating Expenses 8 2 301% 3 2 43% 0 968%
Personnel Expenses 516 324 59% 107 136 -21% 112 -5%
Administrative and Other Expenses 205 158 30% 60 52 16% 54 12%
Total Expenses 729 483 51% 170 190 -10% 166 2%
EBITDA -405 -183 nm -79 -108 nm -55 nm
Interest and Finance Charges 0 0 15% 0 0 53% 0 nm
Depreciation 21 19 11% 5 5 8% 5 6%
PBT -426 -202 nm -84 -113 nm -60 nm
PAT -426 -202 nm -84 -113 nm -60 nm

31
AEGON Religare Life Insurance Industry stabilizing post regulatory changes
(000s)
(` mn) (` bn)
63 77 95 114151
Q1 FY11Q4 FY10
+25%
Q4 FY11Q3 FY11Q2 FY11
24.7 10.3 18.9 21.7000s ofPolicy Issued
No. of Customers
36%
17%
Agency Distribution
Direct Channel
21%
Religare Businesses26%
Corporate Agents & Brokers
1.1
1.3
1.2
1.3
9.5
8.2
31-Mar-1131-Dec-10
8.2
8.2
0.0
30-Sep-10
8.2
7.0
30-Jun-10
7.0
5.7
31-Mar-10
5.7
4.7
24
188
313
1,866
1,091
588
846
Q3 FY11
528
Q4 FY11
5
Q2 FY11
749
572
153
Q1 FY11
425
32183 20
Q4 FY10
852
731
93 28
First year premiumSingle Renewal Fresh Capital Existing Capital
42.2
Strong growth in customer base Steady increase in customer base
New business premium increased 146% YOY and over 74% QOQ
Building a balanced distribution mix
Share Capital
32
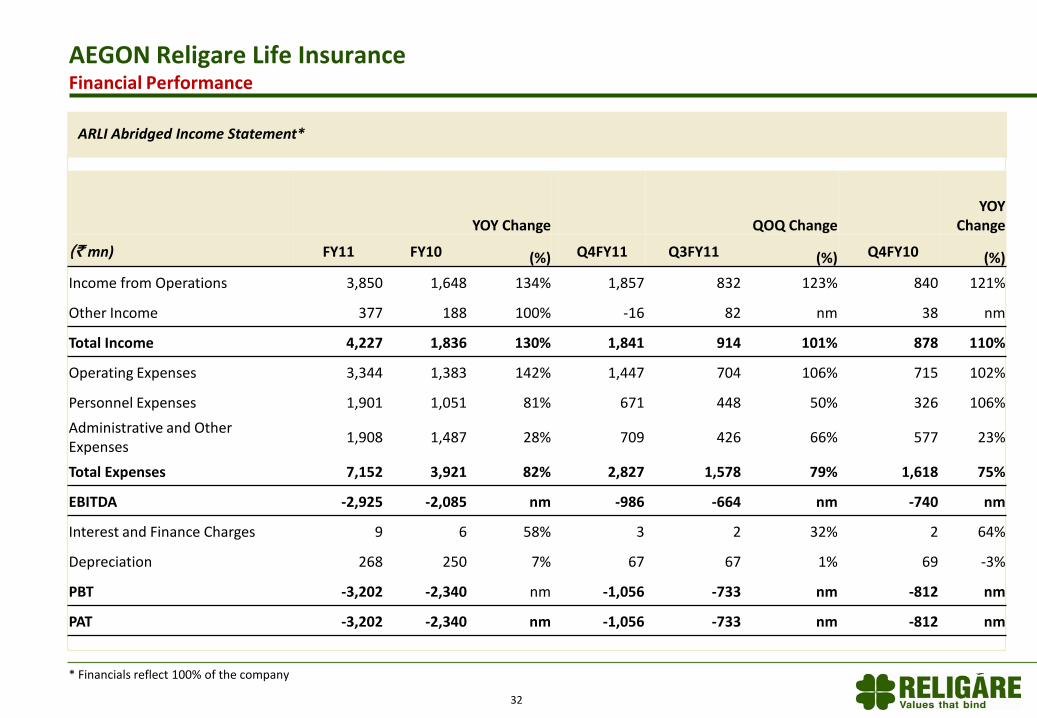
AEGON Religare Life InsuranceFinancial Performance
* Financials reflect 100% of the company
ARLI Abridged Income Statement*
YOY Change QOQ ChangeYOY
Change
(` mn) FY11 FY10 (%) Q4FY11 Q3FY11 (%) Q4FY10 (%)
Income from Operations 3,850 1,648 134% 1,857 832 123% 840 121%
Other Income 377 188 100% -16 82 nm 38 nm
Total Income 4,227 1,836 130% 1,841 914 101% 878 110%
Operating Expenses 3,344 1,383 142% 1,447 704 106% 715 102%
Personnel Expenses 1,901 1,051 81% 671 448 50% 326 106%
Administrative and Other Expenses
1,908 1,487 28% 709 426 66% 577 23%
Total Expenses 7,152 3,921 82% 2,827 1,578 79% 1,618 75%
EBITDA -2,925 -2,085 nm -986 -664 nm -740 nm
Interest and Finance Charges 9 6 58% 3 2 32% 2 64%
Depreciation 268 250 7% 67 67 1% 69 -3%
PBT -3,202 -2,340 nm -1,056 -733 nm -812 nm
PAT -3,202 -2,340 nm -1,056 -733 nm -812 nm

Section II : Performance of Key Subsidiaries
Appendix 1: Performance of Other Subsidiaries and JVs
Section I : Q4 and FY11 Highlights
Appendix 2: Subsidiary and JV Balance Sheets
Table of Contents
33

34
Subsidiary and JV Balance Sheets (1/5)
RFL Abridged Balance Sheet RSL Abridged Balance Sheet
(` mn)As at March 31, 2011
Share Capital 1,733
Reserves and Surplus 14,368
Loan Funds 90,109
Total Liabilities 106,210
Fixed Assets 796
Investments 1,572
Deferred Tax Assets (Net) 82
Net Current Assets 103,761
Total Assets 106,210
(` mn)As at March 31, 2011
Share Capital 395
Reserves and Surplus 3,879
Loan Funds 9,063
Total Liabilities 13,337
Fixed Assets 622
Investments 2,361
Deferred Tax Assets (Net) 59
Net Current Assets 10,295
Total Assets 13,337
35
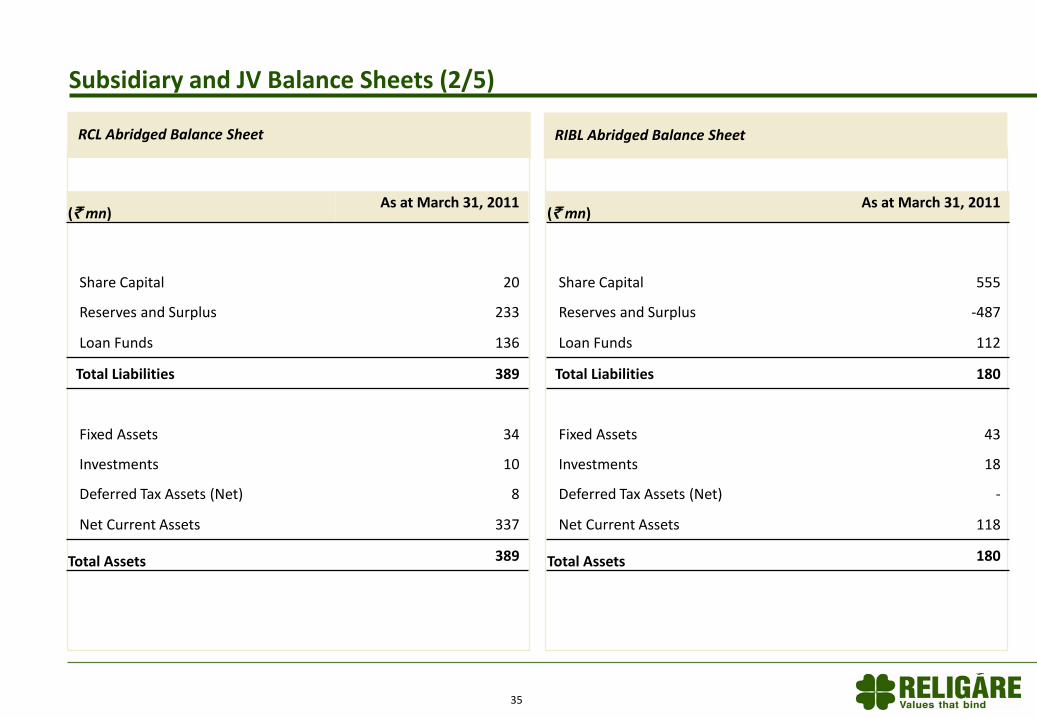
Subsidiary and JV Balance Sheets (2/5)
RCL Abridged Balance Sheet RIBL Abridged Balance Sheet
(` mn)As at March 31, 2011
Share Capital 20
Reserves and Surplus 233
Loan Funds 136
Total Liabilities 389
Fixed Assets 34
Investments 10
Deferred Tax Assets (Net) 8
Net Current Assets 337
Total Assets 389
(` mn)As at March 31, 2011
Share Capital 555
Reserves and Surplus -487
Loan Funds 112
Total Liabilities 180
Fixed Assets 43
Investments 18
Deferred Tax Assets (Net) -
Net Current Assets 118
Total Assets 180

36
(` mn)As at March 31, 2011
Share Capital 1,478
Reserves and Surplus 5,446
Loan Funds 2,429
Total Liabilities 9,353
Fixed Assets 92
Investments 6,627
Deferred Tax Assets (Net) 4
Net Current Assets 2,630
Total Assets 9,353
Subsidiary and JV Balance Sheets (3/5)
RCML India Abridged Balance Sheet RCML Overseas Abridged Balance Sheet
(` mn)As at March 31, 2011
Share Capital 6,596
Reserves and Surplus -3,384
Loan Funds 8,289
Total Liabilities 11,502
Fixed Assets 8,438
Investments 395
Deferred Tax Assets (Net) 0
Net Current Assets 2,668
Total Assets 11,502

37
Subsidiary and JV Balance Sheets (4/5)
(` mn)As at March 31, 2011
Share Capital 603
Reserves and Surplus -344
Loan Funds -
Total Liabilities 259
Fixed Assets 38
Investments 136
Deferred Tax Assets (Net) -
Net Current Assets 85
Total Assets 259
RAMC Abridged Balance Sheet
(` mn)As at March 31, 2011
Share Capital 0.01
Reserves and Surplus 1,024
Loan Funds 3,133
Minority Interest 3
Total Liabilities 4,160
Fixed Assets 3,947
Investments -
Deferred Tax Assets (Net) -3
Net Current Assets 216
Total Assets 4,160
RGAM Abridged Balance Sheet

38
Subsidiary and JV Balance Sheets (5/5)
* Financials reflect 100% of the company
RMWM Abridged Balance Sheet* ARLI Abridged Balance Sheet*
(` mn)As at March 31, 2011
Share Capital 1,150
Reserves and Surplus 200
Loan Funds -
Total Liabilities 1,350
Fixed Assets 70
Investments 181
Deferred Tax Assets (Net) -
Net Current Assets 105
P&L (Dr. Bal.) 994
Total Assets 1,350
(` mn)As at March 31, 2011
Share Capital 9,500
Reserves and Surplus -7,343
Policyholders Funds 4,541
Funds for Discontinued Policies -
Total Liabilities 6,698
Fixed Assets 216
Investments 6,441
Deferred Tax Assets (Net) -
Net Current Assets 41
Total Assets 6,698
39
Thank You