Relationships between Morphology Aspect and Slope Failure ...
5
Relationships between Morphology Aspect and Slope Failure Probability by Using 3D Slope Stability Analysis in Yamasubaru Sub- basin, Miyazaki Prefecture, Japan Hendra Pachri , Yasuhiro Mitani, Hiro Ikemi, and Ryunosuke Nakanishi Graduate School of Engineering, Kyushu University, 744 Motooka, Fukuoka, 819-0395 Japan Abstract. Recently, the assessment of probabilistic slope failure hazard at basin scale is a one part of decision analytical approach to slope failure risk assessment and management. This paper demonstrates the integrating of deterministic and statistical approach to assess the performance of the predicted results based on a factor of safety (FS) of whole slope units. Therefore, the spatial probabilistic modeling of slope failures using a combined Geographic Information System (GIS), 3D slope stability analysis, and Monte Carlo simulation approach is applied in the slope failures-prone area of Yamasubaru sub-basin, Miyazaki Prefecture. As the predicted results have been evaluated by the actual data of slope failure caused by the typhoon 14 in 2005, the validity of this model has shown enough. Therefore, the best value shows a highest of the factual slope failure occurred in SU04 for FS≤1.5, about 93.07 %. Furthermore, the relationships on between of morphology and the probability of slope failure shows a varying of the morphology aspect classes are the causal factors in determining the occurrence and distribution of slope failure predicted. Keywords: Slope Failure, GIS, 3D Slope Stability, Morphology. 1. Introduction In the Mimikawa River Basin, Typhoon No.14 was brought about a severe sediment attributable to mountain slope failures in Miyazaki Prefecture, Japan in September 2005. An awareness of the potential risk from sediment disasters is needed to prediction the occurrence in the basin in future. Therefore, assessment of probabilistic slope failure hazard at basin scale is a one part of decision analytical approach to landslides risk assessment and management. Landslides susceptibility mapping has shown a great deal of importance for suitable urban development [1]. Numerous efforts have been devoted by many researchers to develop landslide susceptibility maps in over the last three decades [2]. These maps describe areas where landslides are likely to occur in the future and classify those areas into different susceptibility zones from very low to very high susceptible zones. The engineering analysis of landslides risk has essentially two components, the probability of occurrence and the resulting consequence. The deterministic approach to slope failure usually requires of a factor of safety, from geometry, shear strength and pore pressure [3].The use of two- or three-dimensional raster- based GIS currently requires the transfer of slope data and hydrologic data from a GIS to external slope stability program. A new GIS grid-based 3D deterministic model has been developed, and only one stratum has been considered for landslide hazard mapping [4]. In order to assess the landslides and potential of debris flow hazard of the mountainous region, the study of historical landslides is critical. Therefore, the study of the mechanisms and properties of past slope failure is a valuable reference for assessing the future slope failure hazard in its adjacent or geotechnical similar area. Here, we demonstrated the implementation of the Frequency Ratio (FR) model with the support of the 3D slope stability tools to assess the factor of safety (FS) of the whole slope units based on sub catchmentand Corresponding author. Tel.: + 81-80-3986-2908; fax: +81-092-802-3396. E-mail address: [email protected]. 2015 2nd International Conference on Geological and Civil Engineering IPCBEE vol. 80 (2015) © (2015) IACSIT Press, Singapore DOI: 10.7763/IPCBEE. 2015. V80. 2 5
Transcript of Relationships between Morphology Aspect and Slope Failure ...

Relationships between Morphology Aspect and Slope Failure
Probability by Using 3D Slope Stability Analysis in Yamasubaru Sub-
basin, Miyazaki Prefecture, Japan
Hendra Pachri , Yasuhiro Mitani, Hiro Ikemi, and Ryunosuke Nakanishi
Graduate School of Engineering, Kyushu University, 744 Motooka, Fukuoka, 819-0395 Japan
Abstract. Recently, the assessment of probabilistic slope failure hazard at basin scale is a one part of
decision analytical approach to slope failure risk assessment and management. This paper demonstrates the
integrating of deterministic and statistical approach to assess the performance of the predicted results based
on a factor of safety (FS) of whole slope units. Therefore, the spatial probabilistic modeling of slope failures
using a combined Geographic Information System (GIS), 3D slope stability analysis, and Monte Carlo
simulation approach is applied in the slope failures-prone area of Yamasubaru sub-basin, Miyazaki
Prefecture. As the predicted results have been evaluated by the actual data of slope failure caused by the
typhoon 14 in 2005, the validity of this model has shown enough. Therefore, the best value shows a highest
of the factual slope failure occurred in SU04 for FS≤1.5, about 93.07 %. Furthermore, the relationships on
between of morphology and the probability of slope failure shows a varying of the morphology aspect classes
are the causal factors in determining the occurrence and distribution of slope failure predicted.
Keywords: Slope Failure, GIS, 3D Slope Stability, Morphology.
1. Introduction
In the Mimikawa River Basin, Typhoon No.14 was brought about a severe sediment attributable to
mountain slope failures in Miyazaki Prefecture, Japan in September 2005. An awareness of the potential risk
from sediment disasters is needed to prediction the occurrence in the basin in future. Therefore, assessment
of probabilistic slope failure hazard at basin scale is a one part of decision analytical approach to landslides
risk assessment and management. Landslides susceptibility mapping has shown a great deal of importance
for suitable urban development [1]. Numerous efforts have been devoted by many researchers to develop
landslide susceptibility maps in over the last three decades [2]. These maps describe areas where landslides
are likely to occur in the future and classify those areas into different susceptibility zones from very low to
very high susceptible zones.
The engineering analysis of landslides risk has essentially two components, the probability of occurrence
and the resulting consequence. The deterministic approach to slope failure usually requires of a factor of
safety, from geometry, shear strength and pore pressure [3].The use of two- or three-dimensional raster-
based GIS currently requires the transfer of slope data and hydrologic data from a GIS to external slope
stability program. A new GIS grid-based 3D deterministic model has been developed, and only one stratum
has been considered for landslide hazard mapping [4]. In order to assess the landslides and potential of debris
flow hazard of the mountainous region, the study of historical landslides is critical. Therefore, the study of
the mechanisms and properties of past slope failure is a valuable reference for assessing the future slope
failure hazard in its adjacent or geotechnical similar area.
Here, we demonstrated the implementation of the Frequency Ratio (FR) model with the support of the
3D slope stability tools to assess the factor of safety (FS) of the whole slope units based on sub catchmentand
Corresponding author. Tel.: + 81-80-3986-2908; fax: +81-092-802-3396.
E-mail address: [email protected].
2015 2nd International Conference on Geological and Civil Engineering
IPCBEE vol. 80 (2015) © (2015) IACSIT Press, Singapore
DOI: 10.7763/IPCBEE. 2015. V80. 2
5

produce a reasonable cohesion, friction angle, and unit weight values. The critical 3D slope stability
simulation gave the results about the relationship on between morphology aspect and geotechnical
parameters. The FS values have become important to explain the susceptibility of landslide. In this analysis
is concern for three parts of FS value ranges, such as FS≤1.0, FS≤1.2, and FS≤1.5. Furthermore, the
observation of relationships between distribution of slope failures in the past and probability of the
occurrence slope failure based on 3D slope stability analysis is carried out to determination the best-fit model
for each geotechnical parameter values. Moreover, the relationships of between on slope stability results and
morphology aspect (slope angle, elevation, and slope angle) have been analyzed to obtained more knowledge
about morphology control in slope failure susceptibility.
Table 1: Geotechnical values on 3D Slope stability simulation.
No ID Geotechnical values Lithology Cohesion
(kN/m2)
Friction angle
(ᴼ)
Unit weight
(kN/m3)
1 SU01 Shale 35 17.5 18
2 SU02 Sandstone 35 15 18
3 SU03 Sandstone 35 22.5 18
4 SU04 Shale 20 17.5 18
2. Data and Methodology
2.1. Slope Failure in Yamasubaru Sub-basin
In this study, slope failures location map is prepared based on of the previous researches conducted on
the area and aerial photographs. In addition, field work has been carried out to map recent landslides. A total
of 923 landslides were mapped in the area. The instability factors were chosen based on the above-mentioned
studies which were carried out on the study area, the bibliographical review and from field investigations.
2.2. Spatial Database Preparation by Using GIS and Remote Sensing
Digital Elevation Model (DEM), which represents the land surface terrain of the surface terrain of the
area, was generated with a 10 m grid from the ASTER GDEM. Using this DEM, the three topographic
parameters, slope gradient map, slope aspect map and elevation map were automatically derived and convert
into ASCII data. From the lithological point of view, nine units were classified from seamless digital
geological maps of Japan (1:200.000) obtained from Geological Survey of Japan, AIST 2005 [5].
Geotechnical data including cohesion, friction angle, and unit weight, were derived from the laboratory test
of previous studies conducted on the area and literature review.
2.3. 3D Slope Stability Analysis
The availability of the geographical information system (GIS) can facilitate the use of a deterministic or
a probabilistic geotechnical approach as part of a methodology on assessment of slope failure hazard.
Regarding the attributing factors, the assessment of slope failure susceptibility is carried out by using the
Slope Failure Analysis System (SFAS) GIS. Based on the model of slope stability analysis and Monte Carlo
simulation, the critical slip surface and minimum 3D safety factor can be obtained for each slope unit [6].
A GIS-based hydrologic analysis and modelling tool, Arc Hydro tool is employed to draw dividing lines
for forming slope units automatically. In this study, the unit size of watershed subdivision is 500, obtained
from digital elevation model (DEM) data. By inputting these parameters into the model of slope stability, the
value of a safety factor or failure can be obtained. Based on Hovland’s (1977) model, the 3D safety factor
can be expressed as following equation:
3
cos tan
sin
J ID
J I
cA W
FW
(1)
6
(a) (b) (c)
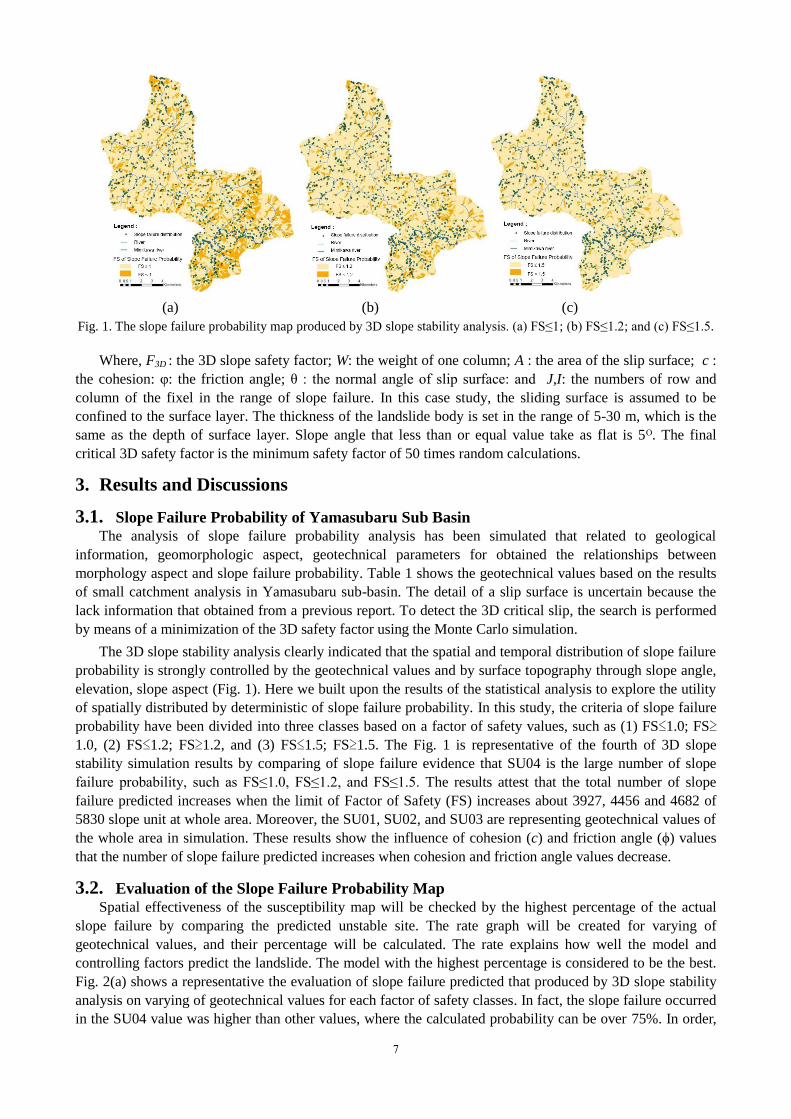
Fig. 1. The slope failure probability map produced by 3D slope stability analysis. (a) FS≤1; (b) FS≤1.2; and (c) FS≤1.5.
Where, F3D
: the 3D slope safety factor; W: the weight of one column; A : the area of the slip surface; c :
the cohesion: φ: the friction angle; θ : the normal angle of slip surface: and J,I: the numbers of row and
column of the fixel in the range of slope failure. In this case study, the sliding surface is assumed to be
confined to the surface layer. The thickness of the landslide body is set in the range of 5-30 m, which is the
same as the depth of surface layer. Slope angle that less than or equal value take as flat is 5ᴼ. The final
critical 3D safety factor is the minimum safety factor of 50 times random calculations.
3. Results and Discussions
3.1. Slope Failure Probability of Yamasubaru Sub Basin
The analysis of slope failure probability analysis has been simulated that related to geological
information, geomorphologic aspect, geotechnical parameters for obtained the relationships between
morphology aspect and slope failure probability. Table 1 shows the geotechnical values based on the results
of small catchment analysis in Yamasubaru sub-basin. The detail of a slip surface is uncertain because the
lack information that obtained from a previous report. To detect the 3D critical slip, the search is performed
by means of a minimization of the 3D safety factor using the Monte Carlo simulation.
The 3D slope stability analysis clearly indicated that the spatial and temporal distribution of slope failure
probability is strongly controlled by the geotechnical values and by surface topography through slope angle,
elevation, slope aspect (Fig. 1). Here we built upon the results of the statistical analysis to explore the utility
of spatially distributed by deterministic of slope failure probability. In this study, the criteria of slope failure
probability have been divided into three classes based on a factor of safety values, such as (1) FS≤1.0; FS≥
1.0, (2) FS≤1.2; FS≥1.2, and (3) FS≤1.5; FS≥1.5. The Fig. 1 is representative of the fourth of 3D slope
stability simulation results by comparing of slope failure evidence that SU04 is the large number of slope
failure probability, such as FS≤1.0, FS≤1.2, and FS≤1.5. The results attest that the total number of slope
failure predicted increases when the limit of Factor of Safety (FS) increases about 3927, 4456 and 4682 of
5830 slope unit at whole area. Moreover, the SU01, SU02, and SU03 are representing geotechnical values of
the whole area in simulation. These results show the influence of cohesion (c) and friction angle (ϕ) values
that the number of slope failure predicted increases when cohesion and friction angle values decrease.
3.2. Evaluation of the Slope Failure Probability Map
Spatial effectiveness of the susceptibility map will be checked by the highest percentage of the actual
slope failure by comparing the predicted unstable site. The rate graph will be created for varying of
geotechnical values, and their percentage will be calculated. The rate explains how well the model and
controlling factors predict the landslide. The model with the highest percentage is considered to be the best.
Fig. 2(a) shows a representative the evaluation of slope failure predicted that produced by 3D slope stability
analysis on varying of geotechnical values for each factor of safety classes. In fact, the slope failure occurred
in the SU04 value was higher than other values, where the calculated probability can be over 75%. In order,
7
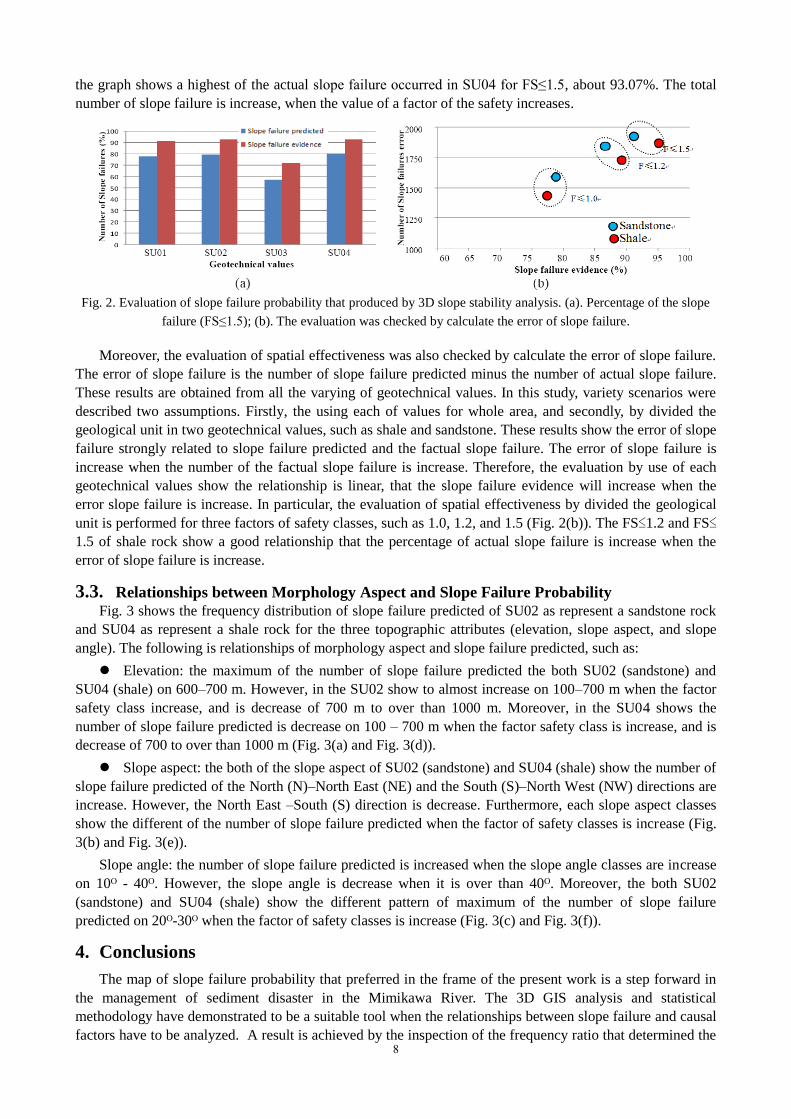
the graph shows a highest of the actual slope failure occurred in SU04 for FS≤1.5, about 93.07%. The total
number of slope failure is increase, when the value of a factor of the safety increases.
Fig. 2. Evaluation of slope failure probability that produced by 3D slope stability analysis. (a). Percentage of the slope
failure (FS≤1.5); (b). The evaluation was checked by calculate the error of slope failure.
Moreover, the evaluation of spatial effectiveness was also checked by calculate the error of slope failure.
The error of slope failure is the number of slope failure predicted minus the number of actual slope failure.
These results are obtained from all the varying of geotechnical values. In this study, variety scenarios were
described two assumptions. Firstly, the using each of values for whole area, and secondly, by divided the
geological unit in two geotechnical values, such as shale and sandstone. These results show the error of slope
failure strongly related to slope failure predicted and the factual slope failure. The error of slope failure is
increase when the number of the factual slope failure is increase. Therefore, the evaluation by use of each
geotechnical values show the relationship is linear, that the slope failure evidence will increase when the
error slope failure is increase. In particular, the evaluation of spatial effectiveness by divided the geological
unit is performed for three factors of safety classes, such as 1.0, 1.2, and 1.5 (Fig. 2(b)). The FS≤1.2 and FS≤
1.5 of shale rock show a good relationship that the percentage of actual slope failure is increase when the
error of slope failure is increase.
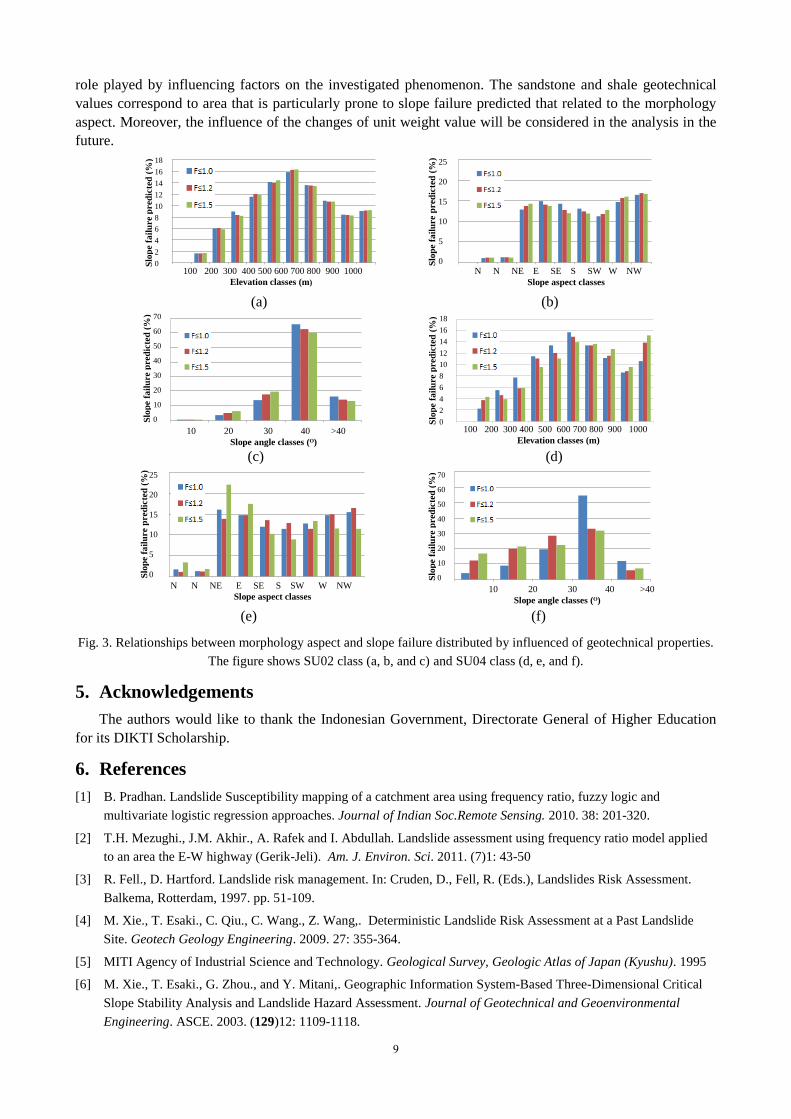
3.3. Relationships between Morphology Aspect and Slope Failure Probability
Fig. 3 shows the frequency distribution of slope failure predicted of SU02 as represent a sandstone rock
and SU04 as represent a shale rock for the three topographic attributes (elevation, slope aspect, and slope
angle). The following is relationships of morphology aspect and slope failure predicted, such as:
Elevation: the maximum of the number of slope failure predicted the both SU02 (sandstone) and
SU04 (shale) on 600–700 m. However, in the SU02 show to almost increase on 100–700 m when the factor
safety class increase, and is decrease of 700 m to over than 1000 m. Moreover, in the SU04 shows the
number of slope failure predicted is decrease on 100 – 700 m when the factor safety class is increase, and is
decrease of 700 to over than 1000 m (Fig. 3(a) and Fig. 3(d)).
Slope aspect: the both of the slope aspect of SU02 (sandstone) and SU04 (shale) show the number of
slope failure predicted of the North (N)–North East (NE) and the South (S)–North West (NW) directions are
increase. However, the North East –South (S) direction is decrease. Furthermore, each slope aspect classes
show the different of the number of slope failure predicted when the factor of safety classes is increase (Fig.
3(b) and Fig. 3(e)).
Slope angle: the number of slope failure predicted is increased when the slope angle classes are increase
on 10ᴼ - 40ᴼ. However, the slope angle is decrease when it is over than 40ᴼ. Moreover, the both SU02
(sandstone) and SU04 (shale) show the different pattern of maximum of the number of slope failure
predicted on 20ᴼ-30ᴼ when the factor of safety classes is increase (Fig. 3(c) and Fig. 3(f)).
4. Conclusions
The map of slope failure probability that preferred in the frame of the present work is a step forward in
the management of sediment disaster in the Mimikawa River. The 3D GIS analysis and statistical
methodology have demonstrated to be a suitable tool when the relationships between slope failure and causal
factors have to be analyzed. A result is achieved by the inspection of the frequency ratio that determined the 8
role played by influencing factors on the investigated phenomenon. The sandstone and shale geotechnical
values correspond to area that is particularly prone to slope failure predicted that related to the morphology
aspect. Moreover, the influence of the changes of unit weight value will be considered in the analysis in the
future.
(a) (b)
(c) (d)
(e) (f)
Fig. 3. Relationships between morphology aspect and slope failure distributed by influenced of geotechnical properties.
The figure shows SU02 class (a, b, and c) and SU04 class (d, e, and f).
5. Acknowledgements
The authors would like to thank the Indonesian Government, Directorate General of Higher Education
for its DIKTI Scholarship.
6. References
[1] B. Pradhan. Landslide Susceptibility mapping of a catchment area using frequency ratio, fuzzy logic and
multivariate logistic regression approaches. Journal of Indian Soc.Remote Sensing. 2010. 38: 201-320.
[2] T.H. Mezughi., J.M. Akhir., A. Rafek and I. Abdullah. Landslide assessment using frequency ratio model applied
to an area the E-W highway (Gerik-Jeli). Am. J. Environ. Sci. 2011. (7)1: 43-50
[3] R. Fell., D. Hartford. Landslide risk management. In: Cruden, D., Fell, R. (Eds.), Landslides Risk Assessment.
Balkema, Rotterdam, 1997. pp. 51-109.
[4] M. Xie., T. Esaki., C. Qiu., C. Wang., Z. Wang,. Deterministic Landslide Risk Assessment at a Past Landslide
Site. Geotech Geology Engineering. 2009. 27: 355-364.
[5] MITI Agency of Industrial Science and Technology. Geological Survey, Geologic Atlas of Japan (Kyushu). 1995
[6] M. Xie., T. Esaki., G. Zhou., and Y. Mitani,. Geographic Information System-Based Three-Dimensional Critical
Slope Stability Analysis and Landslide Hazard Assessment. Journal of Geotechnical and Geoenvironmental
Engineering. ASCE. 2003. (129)12: 1109-1118.
0
2
4
6
8
10
12
14
16
18
1 2 3 4 5 6 7 8 9 10 11
18
16
14
12
10
8
6
4
2
0 100 200 300 400 500 600 700 800 900 1000
Elevation classes (m)
Slo
pe f
ail
ure p
red
icte
d (
%)
0
5
10
15
20
25
1 2 3 4 5 6 7 8 9 10
25
20
15
10
5
0 Slo
pe f
ail
ure p
red
icte
d (
%)
N N NE E SE S SW W NW
Slope aspect classes
0
10
20
30
40
50
60
70
1 2 3 4 5
70
60
50
40
30
20
10
0
10 20 30 40 >40
Slope angle classes (ᴼ)
Slo
pe f
ail
ure p
red
icte
d (
%)
0
2
4
6
8
10
12
14
16
18
1 2 3 4 5 6 7 8 9 10 11100 200 300 400 500 600 700 800 900 1000
Elevation classes (m)
18
16
14
12
10
8
6
4
2
0 Slo
pe f
ail
ure p
red
icte
d (
%)
0
5
10
15
20
25
1 2 3 4 5 6 7 8 9
25
20
15
10
5
0
N N NE E SE S SW W NW
Slope aspect classes
Slo
pe f
ail
ure p
red
icte
d (
%)
0
10
20
30
40
50
60
70
1 2 3 4 5 10 20 30 40 >40
Slope angle classes (ᴼ)
70
60
50
40
30
20
10
0 Slo
pe f
ail
ure p
red
icte
d (
%)
9